Embed Size (px)
Citation preview

International Rectifier
Annual Meeting of Stockholders
November 6, 2012

Statement of Caution Under the Private Securities Litigation Reform Act of 1995
This Investor Presentation contains “forward-looking statements” within the meaning of the Private Securities
Litigation Reform Act of 1995. These statements relate to expectations concerning matters that (a) are not
historical facts, (b) predict or forecast future events or results, or (c) embody assumptions that may prove to have
been inaccurate. These forward-looking statements involve risks, uncertainties and assumptions. When we use
words such as “believe,” “expect,” “anticipate” or similar expressions, we are making forward-looking statements.
Although we believe that the expectations reflected in such forward-looking statements are reasonable, we cannot
give readers any assurance that such expectations will prove correct. The actual results may differ materially from
those anticipated in the forward-looking statements as a result of numerous factors, many of which are beyond our
control. Important factors that could cause actual results to differ materially from our expectations include, but are
not limited to, the factors discussed in the sections entitled “Risk Factors” and entitled “Critical Accounting Policies
and Estimates” within “Management’s Discussion and Analysis of Financial Condition and Results of Operations” in
our filings with the Securities and Exchange Commission, including our most recent reports on Form 10-K and 10-
Q. All forward-looking statements attributable to the Company are expressly qualified in their entirety by the factors
that may cause actual results to differ materially from anticipated results. Readers are cautioned not to place
undue reliance on these forward-looking statements, which reflect our opinion only as of the date hereof. We
undertake no duty or obligation to revise these forward-looking statements. Readers should carefully review the
risk factors described in this document as well as in other documents we file from time to time with the Securities
and Exchange Commission.
2

Our Strategy
1. Leadership in core Power Management technologies
• Benchmark LV- and MV-MOSFET and IGBT process technology
• Digital Power Management
– CHiL controllers + benchmark LV MOSFETs
• Benchmark industrial IGBTs for Variable Speed Motion
• Automotive grade IGBTs for H(EV) drive train technology
• GaN-on-Si – disruptive power switching technology
2. Efficient and flexible manufacturing and supply chain
• Front-end model moving to 50% wafers sourced externally
• Back-end model moving to 70% sourced externally
3. Strategic alignment and partnership with Tier 1 OEMs, ODMs, and Distributors
3

Revolutionary
GaN Technology
Technologies Driving Our Future Growth
Low and mid voltage MOSFETS
Industrial
Consumer & Computing
Power Supplies
• Higher efficiency
• Smaller footprint
• Lower system cost
• Strong IP portfolio
• Engagements with tier
one customers for early
adoption
High Voltage IGBTs and ICs
Motion Control
Appliances
Industrial
Power Modules for
Appliance and Industrial
Digital Power Control
Servers
High Performance Computing
Digital Controllers
Automotive IGBTs
COOliRIGBT™
COOliR2Bridge
™
4

IR LV- and MV- MOSFET Market Leadership
Discrete Standard MOSFET Supplier Market Share Estimates
2011 Rank
Manufacturer
1 International Rectifier 2 Infineon 3 Toshiba 4 Fairchild 5 STMicroelectronics 6 Vishay 7 Renesas 8 Alpha & Omega Semiconductor =9 Fuji Electric =9 ON Semiconductor
Source: IMS Research Jul-12
Top 10 Suppliers of Power MOSFETs, 2011
2011 Company
Rank
1 International Rectifier 2 Toshiba 3 Infineon Technologies 4 Fairchild Semiconductor 5 Renesas Technology 6 Vishay Intertechnology 7 STMicroelectronics 8 On Semiconductor 9 Alpha & Omega
10 NXP
Source: IHS iSuppli August 2012
5

IR Digital Power Strategy: Complete End-to-End DC-DC Solution
6
Industry’s Leading Digital Power (CHiL) Controllers
+ Benchmark Performance MOSFETs/PowIRstages

Initial Target Market – Powering Processors
• Solutions for Graphics
processors (GPU) from
ATI (AMD) and Nvidia.
• Solutions for leading
Server and Desktop
CPU’s from Intel, AMD
Digital Communication • Real time monitoring of
currents, voltages and faults
• Configuration of controllers to
meet system requirements
• Communication between the
system/CPUs and the power
management chips
Digital Control
• Cost effective
• Easy to design and use
• IR has the lowest quiescent
power on par with Analog
Controllers
7

Rapid Adoption of Digital Power Management in Last Two Years
Graphics Cards:
addressable content
about $8
High Performance
Desktops: addressable
content about $8
High Performance
Computing: addressable
content about $1-$2/ board
Servers: up to $40-$50 of
addressable content Communications: up
to $10 of addressable
content
8

Variable Speed Motion Strategy: Digital Power Control, Best-in-
Class IGBTs, and Integrated Intelligent Power Modules
Innovative technologies delivering superior system performance
• Digital Control, IGBTs, IRAM and uIPM modules
Industry-leading products to provide “System in Package” highly integrated solutions, improved
system performance and ease of design
Partnership with established Tier 1 players and aggressive targeting of emerging high growth players
in emerging markets.
Digital and
High Voltage ICs
IGBTs Intelligent Power
Module
(IRAM & MCM)
uIPM
9

10
Power Modules – New Competitive Benchmark
600V
3-Phase
Driver
HVIC
VCC
HIN1
HIN2
HIN3
LIN1LIN2
LIN3
FAULT
ITRIPEN
VB1 VB2 VB3
V+
VSS
U, VS1
V, VS2
W, VS3
RCIN
V-
COM
The Advantage
• Simpler
• Smaller
• No Heat Sink
• Lower Cost
600V
3-Phase
Driver
HVIC
VCC
HIN1
HIN2
HIN3
LIN1LIN2
LIN3
FAULT
ITRIPEN
VB1 VB2 VB3
V+
VSS
U, VS1
V, VS2
W, VS3
RCIN
V-
COM
Micro Inverter for Solar Conversion
Motor Drive variable speed applications
for light loads 20W-250W for example in:
Pumps
Compressors
Fans

Existing system:
91 component count IR’s new system:
31 component count
: Enabling Smaller Size and Lower Cost
11

Automotive Grade High Power COOLiR2 Platform
Optimized for (H)EV Drive Train Applications
…..300V 600V ……..1200V
Wire-bond-less
module
manufacturers COOLiR2DIETM
AU-Bare Die
COOLiR2BridgeTM
COOLiR2ModTM
COOLiR2DriveTM System Integrators
Advanced module
manufacturers with
Si-capabilities
Increasing Integration Level
Target Market Subcontractor&
Development
Partner
12

Disruptive GaN Technology to Revolutionize Power
Management
PFC Power Supplies
*Source: Yole Power GaN Report: November 2010
Power Management Power Switching
Industry
Consumer Electronics and Computing
DC/AC
Inverter
DC/DC
Converter
EV/HEV
Inverter
PV Inverter Motor Control UPS
IT & Consumer Automotive
Possible
Applications*
30V 600V 1200V
GaN Power Electronics
Voltage regulator ICs / Drivers
Discrete transistor & diode Discrete Power transistor & diode / power modules / IPM
13

Prioritize HV GaN Technology in Near Term Fundamental Advantages of HV GaN Over HV MOSFET and IGBT
GaN
IGBT
MOSFET
GaN body diode: Lowest reverse recovery charge (Qrr)
GaN MOSFET
IGBT
GaN switch: Lowest switching loss
6x8mm QFN
• IGBT conduction voltage drop is 0.5 - 0.7V at zero current
• Conduction Voltage drop for GaN device is zero at zero current
• GaN device is inherently more efficient at light load
14
Recent Market Trends and Their Impact on IR
15

Very Challenging Macro Conditions Over Past Six Quarters However, Seeing Potential Signs of Turnaround in US and China
Persistently weak PMI over the past six quarters, especially in China and Europe
• China October PMI climbed to 50.2 from 47.9 last month – the first reading over 50 since July. The private HSBC China PMI rose to 49.5 and is the highest since last February
• European manufacturing October PMI was fell to 45.4 reflecting continued weakness
- German PMI fell 46 from 47.4 last quarter as the manufacturing sector continued to struggle
- France PMI was 43.7 marking the 8th straight month of contraction highlighting a weak French economy
• US October PMI improved to 51.7 from 51.5 last
16
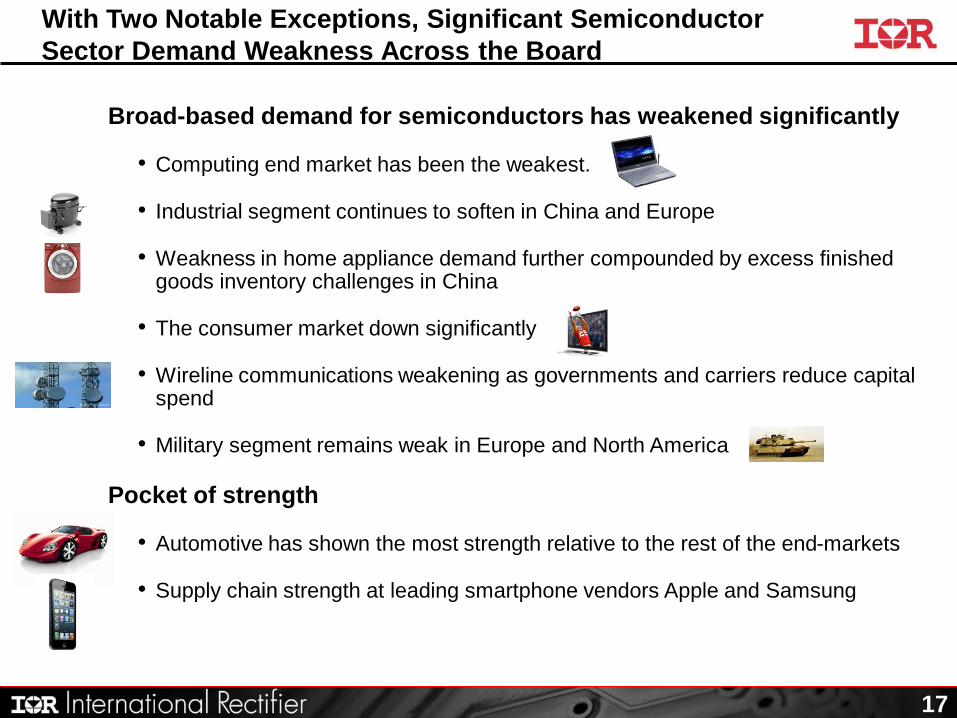
Broad-based demand for semiconductors has weakened significantly
• Computing end market has been the weakest.
• Industrial segment continues to soften in China and Europe
• Weakness in home appliance demand further compounded by excess finished goods inventory challenges in China
• The consumer market down significantly
• Wireline communications weakening as governments and carriers reduce capital spend
• Military segment remains weak in Europe and North America
Pocket of strength
• Automotive has shown the most strength relative to the rest of the end-markets
• Supply chain strength at leading smartphone vendors Apple and Samsung
With Two Notable Exceptions, Significant Semiconductor
Sector Demand Weakness Across the Board
17

IR Quarterly Revenues ($M)
18
IR Business Over Past Six Quarters Has Been Adversely Impacted
$212
$178
$135
$157
$179
$210
$242
$264 $281 $282
$297
$317 $303
$230 $248
$270
$215-$230E
$253

Revenue Decline and Volatility Mainly Driven by
ESP and PMD Business Units …
- 10% +9%
+4%
- 27% - 43%
19

… Due to High Exposure to MOSFETs and IGBTs Market
Segments
CY2012 Market Demand Outlook ($M)
- 40% Drop
in Outlook
for CY2012
- 35% Drop
in Outlook
for CY2012
IR Peak Quarter
Source: iSupply Power Management Market Tracker, CY10Q2 – CY12Q3; IR Analysis
20

IR Path Forward to Recovery and Profitability
21

Fab 3
Fab 2
Fab 11
Fab 10
El Segundo, CA Temecula, CA Newport, Wales
Decommission Planned
Planned production
By mid 2015
Savings $11M/yr
Closure:
End of Mar. 2013
Savings:
$10M/yr
1. Manufacturing Footprint Restructuring
Total Savings: $26M/yr when completed
22
By June 2013
Savings: $5M/yr
Phase 2
Phase 1

2. Operating Expense Reduction
~$40M OPEX Reduction on an Annualized Basis
$86.4M
$80.7M $78.5M (E)
$75M (E) R&D
$35.1M
SG&A
$51.3M
R&D
$33.4M
SG&A
$47.3M
R&D
$32.5M (E)
SG&A
$46M (E)
R&D
$30M (E)
SG&A
$45M (E)
……..……..
June 2012 OPEX includes $1.7M in severance.
23

3. Increased Manufacturing Utilization At High Utilization IR Can Be Profitable at ~$240M/Quarter Run Rate
(all numbers in $M) Mar-10 Sep-12
Revenue ($M) 241.9 252.5
COGs ($M) 154.6 181.9
Gross Profit ($M) 87.3 70.6
- GM% 36.1% 28.0%
SG&A 43.2 47.3
R&D 25.6 33.4
Opertating Income 18.5 -10.1
Utilization (%) 91% 64%
24
Key Assumptions: Sustainable Revenue, ASP stability and Mix Recovery to ~$240M/Quarter
• Revenue Mix Similar to September 2012 Quarter
• 90+% Utilization
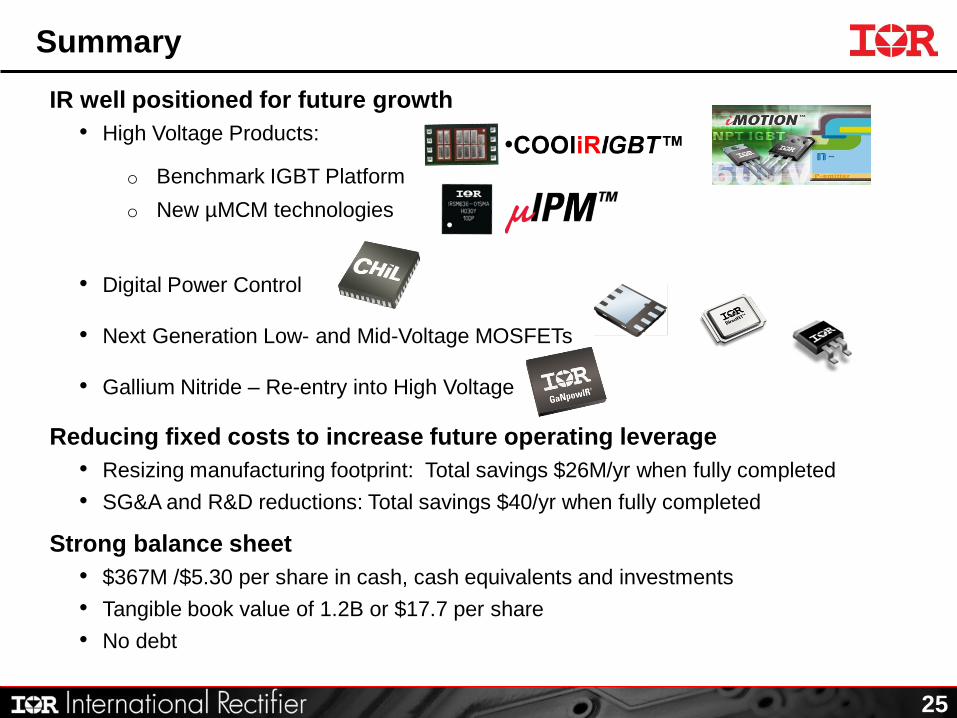
Summary
IR well positioned for future growth
• High Voltage Products:
o Benchmark IGBT Platform
o New µMCM technologies
• Digital Power Control
• Next Generation Low- and Mid-Voltage MOSFETs
• Gallium Nitride – Re-entry into High Voltage
Reducing fixed costs to increase future operating leverage
• Resizing manufacturing footprint: Total savings $26M/yr when fully completed
• SG&A and R&D reductions: Total savings $40/yr when fully completed
Strong balance sheet
• $367M /$5.30 per share in cash, cash equivalents and investments
• Tangible book value of 1.2B or $17.7 per share
• No debt
25