Embed Size (px)
Citation preview
PROPOSED MIXED USE DEVELOPMENT ON LAND OFF THE DOVE WAY, UTTOXETER
TRANSPORT ASSESSMENT
SEPTEMBER 2011
REPORT REF: 20111/JW/08-11/3119 REV A

PROPOSED MIXED USE DEVELOPMENT ON LAND OFF THE DOVE WAY, UTTOXETER
TRANSPORT ASSESSMENT
SEPTEMBER 2011
REPORT REF: 20111/JW/08-11/3119 REV A
CLIENTS: Clowes Developments Ltd
East Staffordshire Borough Council ENGINEER: Mewies Engineering Consultants Ltd
Wellington House Leicester Road Ibstock Leicestershire LE67 6HP
Tel: 01530 264753 Fax: 01530 588116 Email [email protected] Report Prepared By: Report Checked By:
..................................................... ..................................................... James Whitton, BSc(Hons) AMCIHT Tim Rose, BA(Hons) MCIHT Report Approved By: ..................................................... Alexander Bennett, BSc(Hons) MCIHT COPYRIGHT
The contents of this document must not be copied or reproduced in whole or part without the written consent
of Mewies Engineering Consultants Ltd.

Transport Assessment – The Dove Way, Uttoxeter
Report Ref: 20111/JW/08-11/3119 Page 3
REGISTRATION OF AMENDMENTS Revision and Date
Amendment Details Revision Prepared
By
Revision Approved
By
A 23/09/11
Minor amendments to the site layout resulting in a reduction in the B1 commercial land use.
JW
TR

Transport Assessment – The Dove Way, Uttoxeter
Report Ref: 20111/JW/08-11/3119 Rev A Page 4
CONTENTS
1. INTRODUCTION
2. METHODOLOGY
3. SITE DESCRIPTION
4. LOCAL HIGHWAY NETWORK
5. SUSTAINABILITY
6. VEHICULAR IMPACT
7. ACCIDENT DATA
8. ACCESS AND PARKING
9. MITIGATION
10. CONCLUSIONS
APPENDICES
A. SITE LOCATION PLAN
PROPOSED SITE LAYOUT PLAN – MMA DRAWING 769/SK-01
B. STAFFORDSHIRE COUNTY COUNCIL CORRESPONDENCE
HIGHWAYS AGENCY CORRESPONDENCE
C. DRAWING 20111_15_001 - LOCAL HIGHWAY NETWORK
D. BUS TIMETABLES
DRAWING 20111_15_002 – BUS STOP LOCATIONS AND BUS ROUTES PLAN
DRAWING 20111_15_003 – EXISTING PEDESTRIAN FACILITIES AND LOCAL FACILITIES AND
AMENITIES PLAN
DRAWING 20111_15_004 – EXISTING CYCLE FACILITIES
E. TRAFFIC COUNT DATA
F. TRICS DATA
G. TRAVEL TO WORK CENSUS DATA
DEVELOPMENT DISTRIBUTION SUMMARY DIAGRAMS
H. 2011 CURRENT YEAR CAPACITY ASSESSMENTS AND SUMMARY DIAGRAMS
I. 2021 FUTURE YEAR CAPACITY ASSESSMENTS AND SUMMARY DIAGRAMS
J. 2021 + DEVELOPMENT CAPACITY ASSESSMENT DATA AND SUMMARY DIAGRAMS
K. ACCIDENT DATA

Transport Assessment – The Dove Way, Uttoxeter
Report Ref: 20111/JW/08-11/3119 Rev A Page 5
L. PROPOSED ACCESS ROUNDABOUT: ARMSTRONG STOKES AND CLAYTON DRAWING
CON/100/100B/T
M. PROPOSED ACCESS ROUNDABOUT CAPACITY ASSESSMENTS
Transport Assessment – The Dove Way, Uttoxeter
Report Ref: 20111/JW/08-11/3119 Rev A Page 6
1.0 INTRODUCTION
1.1 Mewies Engineering Consultants Ltd (M-EC) has been commissioned by Clowes Developments Ltd
and East Staffordshire Borough Council to undertake a Transport Assessment (TA) for a proposed
mixed use, residential and commercial development on land off The Dove Way, Uttoxeter. A site
location plan and proposed site layout are provided in Appendix A.
1.2 This TA will examine a residential and commercial development split into two parcels of land on
opposite sides of The Dove Way. The residential development comprises 56 dwellings on the
western side of The Dove Way and the commercial development comprises 17,427.5sqm of B1 use
(2,740sqm) and B2 use (14,687.5) on the eastern side of The Dove Way.
1.3 The revised layout in Appendix A has provided a reduced commercial area from that considered in
the initial TA however the larger area has been assumed within this document for robustness. This
TA has therefore assessed the following commercial uses;
• B1 – 3,040sqm
• B2 – 14,687.5sqm
1.4 Discussions have taken place with Staffordshire County Council (SCC) and the Highways Agency
(HA) regarding the scope of this TA and all relevant correspondence is contained within Appendix B.
A Travel Plan (ref: 20111/JW/08-11/3123) has also been produced by M-EC and should be read in
conjunction with this report.
1.5 This TA will evaluate a range of highway factors appertaining to the development and its effect on
the surrounding highway network and in particular the impact the development will have on
surrounding junctions. The site will also be assessed with regards to the distance to local facilities
and amenities and ease of access from the site.
1.6 This TA will examine the situation in the local area in terms of accessibility to sustainable transport
modes and provide specific details on how any significant modifications could be made in order to
improve sustainable movement and safety for vulnerable road users.
1.7 M-EC has completed this report for the benefit of the individuals referred to in paragraph 1.1 and any
relevant statutory authority which may require reference in relation to approvals for the proposed
development. Other third parties should not use or rely upon the contents of this report unless
explicit written approval has been gained from M-EC.
1.8 M-EC accepts no responsibility or liability for:-

Transport Assessment – The Dove Way, Uttoxeter
Report Ref: 20111/JW/08-11/3119 Rev A Page 7
a) The consequence of this documentation being used for any purpose or project other than that
for which it was commissioned.
b) The issue of this document to any third party with whom approval for use has not been agreed.

Transport Assessment – The Dove Way, Uttoxeter
Report Ref: 20111/JW/08-11/3119 Rev A Page 8
2.0 METHODOLOGY
2.1 This TA details the process and procedures followed and the conclusions reached regarding the
impact in terms of transportation issues for a proposed mixed use development at land off The Dove
Way, Uttoxeter.
2.2 This TA demonstrates: -
•••• A detailed assessment of the existing highway network in order to highlight the current
accessibility to the site.
•••• An investigation into the existing public transport routes and their proximity to the site, along
with suggestions towards possible improvements to this network if deemed appropriate.
•••• An investigation into the location and condition of pedestrian and cycle routes close to the site in
order to demonstrate accessibility to the site via sustainable modes.
•••• The availability of local facilities.
•••• Consideration of the likely impact of the development upon the surrounding highway network.
This impact will be assessed through an analysis of impacted junctions.
•••• Consideration of the access to both parcels of land via the construction of a roundabout on
The Dove Way.
•••• A study of personal injury accidents to assess the safety of the local highway network.

Transport Assessment – The Dove Way, Uttoxeter
Report Ref: 20111/JW/08-11/3119 Rev A Page 9
3.0 SITE DESCRIPTION
3.1 The site is located on both the eastern and western boundaries of The Dove Way and is
approximately 1km to the north of Uttoxeter and 18km to the north west of Burton upon Trent. The
closest amenities to the site are located within Uttoxeter with a Post Office, supermarkets, a library,
several banks and other convenience stores.
3.2 The residential site is bound by a sports field and open field to the north, The Dove Way to the east
and further sports fields and an area of residential housing to the south. The western boundary of
the site comprises of a public refuse tip and scrubland backing on to the premises of a building
contractors. The site currently comprises of open scrubland and scattered groups of trees.
3.3 The commercial element of the site is bound to the north by the A50, The Dove Way to the west,
and a sewerage works and open fields to the south and east. The site currently comprises of a
mixture of open fields, hedgerows and unmaintained scrubland.

Transport Assessment – The Dove Way, Uttoxeter
Report Ref: 20111/JW/08-11/3119 Rev A Page 10
4.0 LOCAL HIGHWAY NETWORK
4.1 The local highway network is shown on drawing 20111_15_001 in Appendix C and for the purposes
of this report can be considered to comprise of the following:
•••• The Dove Way
•••• Park Street
•••• A518 Derby Road
•••• A50
The Dove Way
4.2 The Dove Way is approximately 7m wide with a 60mph speed restriction and forms the eastern
boundary of the residential site and part of the western boundary of the proposed commercial site.
The Dove Way features a combined footway/cycleway from the centre of Uttoxeter, north to the
roundabout with Ashbourne Road and the B5030.
Park Street
4.3 Park Street is situated to the west of the residential site and provides links to Ashbourne Road to the
north and High Street, leading to Uttoxeter Town Centre, to the south. Park Street has a 30mph
speed restriction and features street lighting and a footway on both sides of the road.
A518 Derby Road
4.4 Derby Road is situated to the south east of both the residential and commercial developments an
can be accessed by heading south along The Dove Way. Derby Road is a single carriageway road
and features a footway and a varying speed limit. Following Derby Road north provides a direct link
to the A50.
A50
4.5 The A50 is a dual carriageway road with a 70mph speed restriction and located north of the
residential site and forms the northern border of the commercial site. Travelling west the A50
provides links to Stoke on Trent and Newcastle under Lyme while heading east provides access to
Derby. The A50 can be accessed from both sites via the A518 Derby Road to the south and via
Spath roundabout to the north.

Transport Assessment – The Dove Way, Uttoxeter
Report Ref: 20111/JW/08-11/3119 Rev A Page 11
5.0 SUSTAINABILITY
Existing Public Transport Facilities
Bus
5.1 There are a number of existing bus services operating in Uttoxeter. The 1A and 1E services operate
along between Uttoxeter and Burton via Tutbury from Uttoxeter Bus Station to the south of the site at
regular intervals while service number 409 provides links between Uttoxeter and Ashbourne.
Service number 4 links much of the residential area of Uttoxeter with the Tesco superstore located
on Town Meadows Way with service number 32/32A providing links with Cheadle and Hanley. Bus
timetable information is provided in Appendix D and Table 1 below provides a summary of the public
transport services operating within Uttoxeter.
Table 1: Summary of public transport services operating in Uttoxeter
Service Operating Time Frequency Route 1A Monday - Saturday
0550 - 2245 Hourly Uttoxeter – Sudbury – Hatton –
Tutbury – Rolleston – Burton
1E Sunday & Bank Holidays
0825 - 2025
Every 2 hours Uttoxeter – Burton via Tutbury
4 Monday to Saturday 0800 - 1700
Up to every 30 minutes
Tesco – Bus Station – Residential area - Tesco
32/32A Monday to Saturday 0653 - 2310
Approximately every 2 hours
Uttoxeter – Cheadle - Hanley
402 Monday – Saturday 0730 - 1715
Approximately every 2 hours
Uttoxeter – Draycott – Hanbury - Burton
409 Monday - Saturday 0705 - 1725
Approximately every 2 hours
Uttoxeter – Rocester – Denstone – Mayfield - Ashbourne
5.2 The closest bus stops to the residential site are located on Cheadle Road/High Street approximately
500 metres walking distance south west of the proposed development. These are flag stops only
with no timetable information, shelter provision or raised kerbs. For the commercial site, the bus
stops on Cheadle Road/High Street are located approximately 750 metres walking distance from the
site boundary. Drawing 20111_15_002 in Appendix D shows the existing bus stop locations and
bus routes as detailed above.
Rail
5.3 The nearest train station to the site is situated within Uttoxeter; approximately 1.1km to the south of
the site. This station provides a link to major towns and cities including Stoke on Trent, Derby and
Crewe and includes secure cycle storage. Table 2 below provides details on rail services to the
major destinations.

Transport Assessment – The Dove Way, Uttoxeter
Report Ref: 20111/JW/08-11/3119 Rev A Page 12
Table 2: Summary of train services operating from Uttoxeter Train Station
Route Operating time Frequency (Outward journeys)
Travel time
Uttoxeter - Stoke 0705 – 2107 Mon - Sun
Hourly Approximately 26 minutes
Uttoxeter - Derby 0658 – 2212
Mon - Sun Hourly Approximately 25 minutes
Uttoxeter - Crewe 0707 – 2107
Mon - Sun Hourly Approximately 52 minutes
Existing Pedestrian Facilities
5.4 According to the National Travel Survey (Goodman et al, 1998), walking constitutes 29% of all
journeys made in a year, on a national scale. Planning Policy Guidance 13 (PPG13) – Transport,
states that walking is the most important mode of travel at the local level and offers the greatest
potential to replace short car trips, particularly under 2km. The Department of Transport National
Statistics, Personal Travel Fact Sheet No.4 – January 2003 – entitled “Walking in Great Britain”
states that 4 out of 5 (77%) of walking trips were under a mile (1.6km) and only 8% were 2 miles or
above in length.
5.5 Drawing 20111_15_003 in Appendix D identifies the location of key amenities and facilities located
within 2km of the site and walking routes from the site to these facilities. Amenities within Uttoxeter
are located approximately 600 metres walking distance south of the residential site and can be
accessed from a pedestrian link from the site onto Pennycroft Lane and existing footways along
Park Street and High Street. For the commercial development, amenities are situated approximately
900 metres walking distance from the site and are accessed via footways along The Dove Way and
Town Meadows Way (Tesco) or The Dove Way and Dove Bank (Uttoxeter town centre).
5.6 St Mary’s First School is situated 0.5km west of the site on Heath Road which can be accessed via
Park Street, Cheadle Road and Heath Road. Thomas Alleynes High School is located 0.3km south
of the proposed development on Dove Bank which is accessible from Park Street, High Street,
Bradley Street, Back Lane and Dove Bank.
5.7 The nearest large supermarket from the commercial site is Tesco which is situated approximately
1km to the south of the site in Uttoxeter and can be accessed via The Dove Way and Town
Meadows Way. The closest local supermarket is Tesco Express, situated 0.75km from the site
boundary on Holly Road and can be accessed via Park Street, Cheadle Road and Holly Road.
Existing Cycling Facilities
5.8 PPG13 states that cycling has the potential to substitute short car trips, particularly those less than 5
km. The DoT National Statistics, Person Travel Fact Sheet 5A – January 2003 – entitled “Cycling in

Transport Assessment – The Dove Way, Uttoxeter
Report Ref: 20111/JW/08-11/3119 Rev A Page 13
Great Britain,” states that the average length of a cycle stage was 2.4 miles (3.86km) and that 10%
of cycle trips were 5 miles (8km) or over in length.
5.9 A review of the Sustrans website has determined that there is a traffic free cycle route on The Dove
Way and heading west along Old Knotty Way. In Addition, a cycle route is identified east along the
A50 forming national route 54 leading to national route 549 on Derby Road heading east to Sudbury,
Scropton and Hatton.
5.10 Drawing 20111_15_004 in Appendix D shows the existing cycle facilities located within the local
area and also highlights the facilities and amenities located within 5km of the site.
Site Areas Source: Sustrans

Transport Assessment – The Dove Way, Uttoxeter
Report Ref: 20111/JW/08-11/3119 Rev A Page 14
6.0 VEHICULAR IMPACT
Methodology
6.1 An assessment has been undertaken to consider the impact of the proposed development on the
local and strategic highway network following discussion with SCC and the HA. Assessments have
been undertaken at the following locations;
• A50/A518 Derby Road Roundabout
• A50/A518/B5030 Roundabout
• A518 The Dove Way/B5030 Roundabout
• A518 The Dove Way/Derby Road A518 Roundabout
• Town Meadows Way/Dovebank A522 Roundabout
• Derby Road A518/Dovefields Mini Roundabout
Traffic Count Data
6.2 Traffic count data has been obtained for all junctions detailed above along with an ATC count along The
Dove Way to record volume and speeds of vehicles along Dove Way. Independent traffic counts were
undertaken in June 2011 by Road Data Services (RDS) and a copy of the data is provided in Appendix E.
Assessments
6.3 The assessments will consider the operation of the above junctions at a base year (2011) and at a
future base year of 2021 (with and without development).
6.4 To achieve 2021 background traffic flows, the 2011 base flows will be growthed using rates derived
from TEMPRO. TEMPRO provides two datasets, AF08 and AF09 as shown in Tables 3a and 3b. As
dataset AF08 shows far higher projected growth this has been used for robustness.
Table 3a: Growth rates to achieve 2021 future year base flows using dataset NTM AF08
Period AM Peak PM Peak 2011 – 2021 1.1565 1.1631
Table 3b: Growth rates to achieve 2021 future year base flows using dataset NTM AF09
Period AM Peak PM Peak 2011 – 2021 1.1093 1.1157
Committed Development
6.5 The NTM is based on land-use data and therefore should include the allocated sites and future
predicted growth within the East Staffordshire District. The NTM/TEMPRO data detailed above
should therefore account for committed development flows on the local highway network.

Transport Assessment – The Dove Way, Uttoxeter
Report Ref: 20111/JW/08-11/3119 Rev A Page 15
Trip Generation
6.6 The TRICS database has been used to derive the trip rates for the residential development (56
dwellings) and commercial development (B1 = 3,040sqm and B2 = 14,687.5sqm) during the AM
Peak (08.00 – 09.00) and PM Peak (17.00 – 18.00). Table 4 below provides a summary of the trip
rates provided and the TRICS data is attached in Appendix F.
Table 4: Trip Generation rates for the residential and commercial development
Land Use GFA
AM Peak Hour Weekday (08.00 – 09.00)
PM Peak Hour Weekday (17.00 – 18.00)
Arrivals Departures Arrivals Departures Residential (56 dwellings)
0.169 (9 trips)
0.405 (23 trips)
0.379 (21 trips)
0.231 (13 trips)
B1 Use (3,040sqm)
1.774 (54 trips)
0.256 (8 trips)
0.350 (11 trips)
1.228 (37 trips)
B2 Use (14,687.5sqm)
0.780 (115 trips)
0.355 (52 trips)
0.211 (31 trips)
0.661 (97 trips)
Total for Peak 261 trips 210 trips
Trip Distribution
6.7 Following discussions with SCC, ward specific method of travel to work and distance travelled to
work Census data has been obtained in order to determine trip assignment and distribution from the
site. Data has been obtained from the NOMIS website and is attached in Appendix G. The data
shows that the majority (52%) of existing residents work within the East Staffordshire area, i.e
Uttoxeter and Burton on Trent. Approximately 10% of residents work in Stafford and approximately
5% in South Derbyshire and Stoke. The remaining percentages are split between locations further
away such as Leicester, Nottingham and Birmingham.
6.8 Trip Distribution from the residential site has been based on the existing locations determined from
the census data with the commercial trips distributed on a gravity model of surrounding residential
areas. This showed the majority of trips will distribute to/from the East Staffordshire and Burton area
and approximately 10% of trips will distribute to/from Stafford. The remaining trips have been
distributed in all directions towards other residential areas such as Derby, Stoke, Nottingham,
Lichfield and Cannock.
6.9 In relation to trips distributing to/from the A50, it should be noted that two possible routes exist from
the site access on Dove Way. The first is by heading north along The Dove Way to the Spath
roundabout and then south onto the A50. The second is south along The Dove Way and then north
on the A518. As the route south is approximately half the distance of the route north and also
quicker in terms of time taken to travel the route, it has been assumed that the majority of all traffic
travelling eastbound on the A50 will use this route. Development distribution summary diagrams are
provided in Appendix G.

Transport Assessment – The Dove Way, Uttoxeter
Report Ref: 20111/JW/08-11/3119 Rev A Page 16
Current Year Assessment (2011)
6.10 In order to observe the current capacity, queues and delays at the junctions in 2011, Department of
Transport TRL program ARCADY 6 and have been used.
6.11 Table 5 below provides a summary of predicted queues and delays at 2011 current year flows.
Summary diagrams and capacity assessment data can be found in Appendix H.
Table 5: Assessment of 2011 current year flows
Junction/Arm Peak Max RFC (%)
Max Queues (vehs)
Max Delay (sec/vehs)
A50/A518 Derby Road Roundabout
Arm A: A50 East AM 0.329 1 2 PM 0.302 0 2
Arm B: A518 Derby Road AM 0.310 0 2 PM 0.296 0 2
Arm C: A50 West AM 0.596 2 5 PM 0.907 9 12
Arm D: Access Road AM 0.010 0 4 PM 0.004 0 5
A50/A518/B5030 Roundabout
Arm A: A50 East AM 0.600 2 4 PM 0.551 1 4
Arm B: B5030 AM 0.513 1 6 PM 0.543 1 6
Arm C: A50 West AM 0.496 1 4 PM 0.674 2 5
Arm D: A518 AM 0.517 1 4 PM 0.702 2 5
A518 The Dove Way/B5030 Roundabout
Arm A: A518 The Dove Way AM 0.302 0 4 PM 0.316 1 4
Arm B: A518 South AM 0.484 1 4 PM 0.562 2 5
Arm C: B5030 AM 0.499 1 4 PM 0.697 2 5
A518 The Dove Way/Derby Road A518 Roundabout
Arm A: A518 Derby Road AM 0.482 1 5 PM 0.577 1 7
Arm B: A518 South AM 0.588 1 5 PM 0.573 1 5
Arm C: Access Road AM 0.006 0 6 PM 0.004 0 6
Arm D: The Dove Way AM 0.245 0 2 PM 0.259 0 2
A518 Town Meadows Way/Dovebank A522 Roundabout
Arm A: Retail Access AM 0.157 0 5 PM 0.330 1 7
Arm B: Town Meadows Way AM 0.606 2 5

Transport Assessment – The Dove Way, Uttoxeter
Report Ref: 20111/JW/08-11/3119 Rev A Page 17
PM 0.586 1 5 Arm C: Dove Bank AM 0.502 1 8
PM 0.704 2 10 Arm D: A518 AM 0.600 2 5
PM 0.719 3 7
A518 Derby Road/Dovefields Mini Roundabout Arm A: Dove Walk AM 0.101 0 8
PM 0.034 0 7 Arm B: Dovefields AM 0.186 0 8
PM 0.337 1 10 Arm C: A518 Derby Road S AM 0.752 3 14
PM 0.754 3 13 Arm D: A518 Derby Road N AM 0.726 3 12
PM 0.705 2 11
6.12 Table 5 above shows that the A50 West Arm (Arm C) of the A50/A518 roundabout already operates
over capacity at the 2011 current year assessment with a maximum RFC of 0.907 (90.7%) in the PM
peak. All other junctions currently operate within capacity, however, Arms C and D of both the A518
Town Meadows Way/Dovebank A522 and A518 Derby Road/Dovefields Roundabouts show potential
capacity concerns with RFC values of between 0.704 and 0.754 in the PM peak.
Future Year Assessment (2021)
6.13 In order to observe the current capacity, queues and delays at the junctions in 2021, Department of
Transport TRL program ARCADY 6 has been used. Table 6 below provides a summary of predicted
queues and delays at 2021 background flows. Summary diagrams and capacity assessment data
can be found in Appendix I.
Table 6: Assessment of 2021 future year flows
Junction/Arm Peak Max RFC (%)
Max Queues (vehs)
Max Delay (sec/vehs)
A50/A518 Derby Road Roundabout
Arm A: A50 East AM 0.386 1 2 PM 0.354 1 2
Arm B: A518 Derby Road AM 0.371 1 3 PM 0.354 1 2
Arm C: A50 West AM 0.699 2 6 PM 1.067 66 55
Arm D: Access Road AM 0.012 0 5 PM 0.004 0 6
A50/A518/B5030 Roundabout
Arm A: A50 East AM 0.729 3 6 PM 0.672 2 5
Arm B: B5030 AM 0.661 2 8 PM 0.692 2 8
Arm C: A50 West AM 0.601 2 5 PM 0.828 5 8
Arm D: A518 AM 0.628 2 4 PM 0.877 7 10

Transport Assessment – The Dove Way, Uttoxeter
Report Ref: 20111/JW/08-11/3119 Rev A Page 18
A518 The Dove Way/B5030 Roundabout
Arm A: A518 The Dove Way AM 0.366 1 4 PM 0.400 1 5
Arm B: A518 South AM 0.566 1 5 PM 0.663 2 6
Arm C: B5030 AM 0.585 1 4 PM 0.822 4 8
A518 The Dove Way/Derby Road A518 Roundabout
Arm A: A518 Derby Road AM 0.576 1 7 PM 0.696 2 8
Arm B: A518 South AM 0.681 2 5 PM 0.668 2 5
Arm C: Access Road AM 0.007 0 7 PM 0.005 0 7
Arm D: The Dove Way AM 0.294 0 3 PM 0.313 1 3
A518 Town Meadows Way/Dovebank A522 Roundabout
Arm A: Retail Access AM 0.210 0 6 PM 0.468 1 10
Arm B: Town Meadows Way AM 0.714 3 7 PM 0.694 2 6
Arm C: Dove Bank AM 0.645 2 10 PM 0.896 7 20
Arm D: A518 AM 0.710 2 6 PM 0.862 6 10
A518 Derby Road/Dovefields Mini Roundabout
Arm A: Dove Walk AM 0.133 0 10 PM 0.047 0 8
Arm B: Dovefields AM 0.237 0 9 PM 0.438 1 11
Arm C: A518 Derby Road S AM 0.877 6 20 PM 0.884 7 21
Arm D: A518 Derby Road N AM 0.846 5 17 PM 0.828 5 16
6.14 Table 6 above shows that the increased traffic flow at a 2021 future base year scenario has caused Arm C
of the A50/A518 Derby Road Roundabout to be pushed further over capacity with Arm D of the
A50/A518/B5030 Roundabout, Arms C and D of the A518 Town Meadows Way/Dovebank A522
Roundabout and Arm C of the A518 Derby Road/Dovefields mini Roundabout now also operating over
capacity.
2021 plus development flows
6.15 In order to observe the capacity, queues and delays at the junctions at 2021 with the proposed
development, Department of Transport TRL program ARCADY 6 has been used. Table 7 below
provides a summary of predicted queues and delays at a future year scenario of 2021 including
development flows with summary diagrams and capacity assessment data presented in Appendix J.

Transport Assessment – The Dove Way, Uttoxeter
Report Ref: 20111/JW/08-11/3119 Rev A Page 19
Table 7: Assessment of 2021 plus development flows
Junction/Arm Peak Max RFC (%)
Max Queues (vehs)
Max Delay (sec/vehs)
A50/A518 Derby Road Roundabout
Arm A: A50 East AM 0.420 1 2 PM 0.366 1 2
Arm B: A518 Derby Road AM 0.393 1 3 PM 0.394 2 3
Arm C: A50 West AM 0.708 2 6 PM 1.092 83 73
Arm D: Access Road AM 0.013 0 5 PM 0.004 0 7
A50/A518/B5030 Roundabout
Arm A: A50 East AM 0.734 3 6 PM 0.678 2 5
Arm B: B5030 AM 0.668 2 8 PM 0.702 2 8
Arm C: A50 West AM 0.615 2 5 PM 0.834 5 9
Arm D: A518 AM 0.637 2 4 PM 0.893 8 10
A518 The Dove Way/B5030 Roundabout
Arm A: A518 The Dove Way AM 0.382 1 4 PM 0.431 1 5
Arm B: A518 South AM 0.582 1 5 PM 0.671 2 6
Arm C: B5030 AM 0.596 2 4 PM 0.827 5 8
A518 The Dove Way/Derby Road A518 Roundabout
Arm A: A518 Derby Road AM 0.676 2 8 PM 0.750 3 10
Arm B: A518 South AM 0.753 3 7 PM 0.691 2 6
Arm C: Access Road AM 0.009 0 8 PM 0.005 0 7
Arm D: The Dove Way AM 0.338 1 3 PM 0.393 1 3
A518 Town Meadows Way/Dovebank A522 Roundabout
Arm A: Retail Access AM 0.217 0 7 PM 0.499 1 10
Arm B: Town Meadows Way AM 0.763 3 7 PM 0.712 2 7
Arm C: Dove Bank AM 0.685 2 11 PM 0.914 8 22
Arm D: A518 AM 0.732 3 7 PM 0.902 8 13
A518 Derby Road/Dovefields Mini Roundabout
Arm A: Dove Walk AM 0.150 0 11 PM 0.049 0 8
Arm B: Dovefields AM 0.268 0 10

Transport Assessment – The Dove Way, Uttoxeter
Report Ref: 20111/JW/08-11/3119 Rev A Page 20
PM 0.459 1 12 Arm C: A518 Derby Road S AM 0.932 10 26
PM 0.983 16 36 Arm D: A518 Derby Road N AM 0.964 14 30
PM 0.870 6 19
6.16 Table 7 above shows that the development flows marginally exacerbate capacity in the locations
which were already operating over the desired 0.850 (85%) threshold at a base year assessment of
2021. In addition, it is observed that development flows also push Arm D of the A518 Derby
Road/Dovefields Mini Roundabout over capacity with RFC values of 0.964 in the AM peak and 0.870 in
the PM peak up from 0.846 and 0.828 respectively in the 2021 base year assessment.
6.17 The results of the capacity assessments have determined that the predicted increase in traffic flows
in the future year scenario of 2021 will cause capacity issues at a number of locations which are
further exacerbated by the development flows. Consequently measures are required to mitigate the
development impact and reduce RFC values down to the levels exhibited in the 2021 base year
assessment. Proposed highway mitigation measures are outlined in section 9 of this report.
Percentage Impact Analysis
6.18 Table 7 above identified capacity issues at a number of the junctions with the exception of the A518
The Dove Way/B5030 Roundabout and the A518 The Dove Way/Derby Road A518 Roundabout. In
order to consider the development impact in terms of trip generation at the junctions noted over
capacity a percentage impact analysis on each arm has been undertaken and this is detailed in
Table 8 below (note the arms shown in bold, italic, underline are those noted as being over
capacity in Table 7).
Table 8: Percentage impact analysis of development trips on junctions operating over
capacity
Junction/Arm
Peak
2021 Flows
2021 + Development
Flows
Percentage Impact (% increase)
A50/A518 Derby Road Roundabout
Arm A: A50 East AM 1867 1990 6.6 PM 2312 2411 4.3
Arm B: A518 Derby Road AM 1240 1363 9.9 PM 1208 1307 8.2
Arm C: A50 West AM 2036 2036 0 PM 2520 2520 0
Arm D: Access Road AM 9 9 0 PM 10 10 0
A50/A518/B5030 Roundabout
Arm A: A50 East AM 2037 2037 0 PM 2496 2496 0
Arm B: B5030 AM 1178 1178 0 PM 1279 1279 0

Transport Assessment – The Dove Way, Uttoxeter
Report Ref: 20111/JW/08-11/3119 Rev A Page 21
Arm C: A50 West AM 1718 1750 1.9 PM 1838 1866 1.5
Arm D: A518 AM 1705 1737 1.9 PM 2043 2071 1.4
A518 Town Meadows Way/Dovebank A522 Roundabout
Arm A: Retail Access AM 317 317 0 PM 512 512 0
Arm B: Town Meadows Way AM 1832 1940 5.9 PM 2036 2109 3.6
Arm C: Dove Bank AM 698 698 0 PM 976 976 0
Arm D: A518 AM 1893 1983 4.8 PM 2012 2085 3.6
A518 Derby Road/Dovefields Mini Roundabout
Arm A: Dove Walk AM 51 51 0 PM 62 62 0
Arm B: Dovefields AM 268 268 0 PM 268 268 0
Arm C: A518 Derby Road S AM 1149 1272 7.0 PM 1271 1370 7.8
Arm D: A518 Derby Road N AM 1222 1343 9.9 PM 1195 1294 8.3
6.19 Table 8 shows that out of the arms noted as being over capacity in Table 7, the development will
only have a greater than 5% impact on the A518 Derby Road/Dovefields mini roundabout. Whilst a
greater than 5% impact is noted on the other junctions with the exception of the A50/A518/B5030
Roundabout the principle impact occurs on arms operating within capacity.
6.20 Notwithstanding the above the impact of the development will exacerbate capacity at these junctions
and therefore appropriate improvement measures will be considered further in Section 9.

Transport Assessment – The Dove Way, Uttoxeter
Report Ref: 20111/JW/08-11/3119 Rev A Page 22
7.0 ACCIDENT DATA
7.1 Accident data has been obtained from SCC for the Uttoxeter area and for all junctions assessed
within Section 6 of this report. Data has been supplied for the previous 5 years. In total there have
been 83 accidents of which 6 were classified as serious and 2 were fatal. A full set of the Accident
Data can be found in Appendix K and the details of each accident can be found in the tables below.
Table 9: Accidents occurring within Uttoxeter Town Centre
Year Location Conditions Severity Description 2006 High Street Dry/Day Slight Vehicle 1 went through a red light
and collided with a pedestrian 2006 Park Street/Johnson
Road Junction Dry/Day Slight Vehicle 1 lost control entering
junction 2006 Silver Street/Church
Street Junction Dry/Day Slight Vehicle 1 was waiting at junction
when hit from behind by Vehicle 2 2006 Park Street Dry/Day Slight Vehicle 1 slows suddenly and is hit
by following Vehicle 2 2006 Dove Bank Dry/Day Serious Pedestrian steps out in front of
Vehicle 2 causing collision 2007 Silver Street/Church
Street Junction Dry/Day Slight Vehicle 1 waiting at junction when
hit at the rear by Vehicle 2 2007 Silver Street/Church
Street Junction Dry/Dark Slight Vehicle 1 pulls out in front of
Vehicle 2 causing collision 2007 Silver Street/Church
Street Junction Dry/Dark Slight Inattention from driver of vehicle
caused collision with kerb resulting in vehicle overturning
2007 Dove Bank Dry/Day Slight Speeding Vehicle 1 lost control on bend and collided with Vehicle 2
2007 Silver Street/Church Street Junction
Dry/Day Slight Vehicle 1 pulled out in front of Vehicle 2 causing collision. Dazzling sun cited as cause
2008 Smithfield Road Dry/Day Slight Vehicle 1 (moped) brakes suddenly and loses control causing minor injury
2008 Smithfield Road/High Street Junction
Wet/Day Slight Stolen vehicle with inebriated driver loses control on a bend in the road
2008 Silver Street/Back Lane Junction
Wet/Day Slight Vehicles 1 and 2 held up at junction when shunted from the rear by Vehicle 3
2008 Park Street/Croft Grove Junction
Dry/Day Slight Vehicle exiting junction when collided with pedestrian
2009 Park Avenue Dry/Day Slight Vehicle 1 (bus/coach) collided with pedestrian
2009 Park Street Dry/Day Serious Vehicle 1(motorcycle) lost control causing serious injury to rider
2009 Dove Bank/entrance to Thomas Alleyne High
School
Dry/Day Slight Vehicle 1 was turning into the School entrance and collided with a pedal cycle travelling in the opposite direction
2010 Back Lane Dry/Day Slight Vehicle 1 was overtaking static traffic when a pedestrian entered the road causing collision
2010 Park Street Dry/Day Slight Pedal cycle swerved resulting in collision with overtaking Vehicle 2

Transport Assessment – The Dove Way, Uttoxeter
Report Ref: 20111/JW/08-11/3119 Rev A Page 23
7.2 Table 9 above shows 19 accidents for the area over the last 5 years of which 2 were serious in
severity. A total of 5 accidents were recorded in both in 2006 and 2007, which was reduced to 4 in
2008, then 3 in 2009 and 2 in 2010 highlighting the continued safety improvements made on the
road network within Uttoxeter. Consequently it is considered there is no accident problem at this
location.
Table 10: Accidents occurring at or close to the A518 Derby Road/A50 Roundabout
Year Location Conditions Severity Description 2006 Derby Road/A50
Roundabout Dry/Dark Slight Vehicle 1 was waiting at roundabout
when hit from the rear by Vehicle 2 2007 Derby Road/A50
Roundabout Dry/Day Slight Vehicle 1 (mgv) moved lanes as
Vehicle 2 was overtaking causing collision
2007 Derby Road/A50 Roundabout
Wet/Day Slight Driver of vehicle loses control on roundabout and leaves the road
2009 Derby Road/A50 Roundabout
Dry/Day Slight Vehicle 1 held up at roundabout and was shunted at the rear by Vehicle 2
2009 Derby Road/A50 Roundabout
Dry/Day Slight Vehicle 1 negotiating roundabout, gave a misleading signal and collided with Vehicle 2 (mgv)
2009 Derby Road/A50 Roundabout
Dry/Dark Slight Vehicle 1 was leaving the roundabout and was shunted at the rear by Vehicle 2
2010 Derby Road/A50 Roundabout
Dry/Day Slight Vehicle 1 entered roundabout in front of Vehicle 2 (motorcycle) causing collision
7.3 Table 10 above shows 7 recorded accidents for the junction all of which were considered slight in
severity. Given the position of this junction leading to the centre of Uttoxeter and the expected
volume of traffic passing through it, it is considered that the number of accidents recorded is low and
therefore there is no accident issue present at the junction.
Table 11: Accidents occurring at or close to A50/B5030/A518 Ashbourne Road Roundabout and
The Dove Way/Ashbourne Road/B5030 Roundabout
Year Location Conditions Severity Description 2006 Ashbourne Road/A50
Roundabout Dry/Dark Slight Vehicle 1 entered roundabout and
collided with Vehicle 2 (cycle) 2006 Ashbourne Road/A50
Roundabout Wet/Day Slight Vehicle 1 slowing for roundabout
when struck from the rear by Vehicle 2
2006 Ashbourne Road/A50 Roundabout
Dry/Day Slight Vehicle 1 entered roundabout and collided with Vehicle 2 (motorcycle)
2006 Ashbourne Road/A50 Roundabout
Dry/Day Slight Disabled cyclist falls from bike causing slight injury
2006 Ashbourne Road/A50 Roundabout
Dry/Day Slight Vehicle 1 entered roundabout and collided with pedestrian
2006 Ashbourne Road/A50 Roundabout
Dry/Day Slight Inebriated driver of vehicle overshoots roundabout entry and leave the road
2006 Ashbourne Road/A50 Wet/Day Slight Vehicle 1 in the process of

Transport Assessment – The Dove Way, Uttoxeter
Report Ref: 20111/JW/08-11/3119 Rev A Page 24
Roundabout overtaking Vehicle 2 on the approach to roundabout when collision occurred
2007 Ashbourne Road/The Dove Way Roundabout
Dry/Dark Slight Vehicle failed to stop at roundabout and left the road and overturned
2007 Ashbourne Road/A50 Roundabout
Dry/Day Slight Vehicle travelling too quickly on roundabout, skidded and let the carriageway
2007 Ashbourne Road/A50 Roundabout
Dry/Day Slight Vehicle 1 (mgv) was slowing to enter roundabout when hit at the rear by Vehicle 2
2007 Ashbourne Road/A50 Roundabout
Dry/Day Slight Vehicle 1 entered roundabout when was hit at the rear by Vehicle 2
2008 Ashbourne Road/A50 Roundabout
Dry/Day Slight Vehicle 1 was waiting to enter roundabout and was shunted at the rear by Vehicle 2
2008 Ashbourne Road/A50 Roundabout
Wet/Dark Serious Vehicle 1 (mgv) held up at roundabout when shunted at the rear by Vehicle 2
2008 Ashbourne Road/A50 Roundabout
Wet/Day Slight Vehicle 1 leaving roundabout changed lanes and collided with Vehicle 2
2009 Ashbourne Road/The Dove Way Roundabout
Wet/Day Slight Motorcycle loses control on roundabout due to wet road surface
2009 Ashbourne Road/A50 Roundabout
Dry/Day Slight Vehicle 1 negotiating roundabout when struck at the rear by Vehicle 2
2009 Ashbourne Road/A50 Roundabout
Wet/Day Slight Vehicle 1 performed a u-turn in front of Vehicle 2 which failed to anticipate manoeuvre causing collision
2009 Ashbourne Road/A50 Roundabout
Ice/Day Slight Vehicle 1 was entering the roundabout when shunted from the rear by Vehicle 2
2010 Ashbourne Road/A50 Roundabout
Ice/Dark Slight Vehicle 1 was held up at the entry to the roundabout when Vehicle 2 (mgv) failed to stop causing collision
2010 Ashbourne Road/A50 Roundabout
Dry/Day Slight Vehicle 1 was held up at roundabout entry and was shunted from the rear by Vehicle 2
2010 Ashbourne Road/A50 Roundabout
Wet/Day Slight Vehicle 1 (mgv) was slowing at roundabout entry and was shunted from the rear by Vehicle 2
2010 Ashbourne Road/A50 Roundabout
Dry/Dark Slight Driver of vehicle was impaired by alcohol and lost control on the roundabout
2010 Ashbourne Road/A50 Roundabout
Dry/Day Slight Vehicle 1 was waiting at the roundabout entrance and was shunted from the rear by Vehicle 2 (mgv)
2010 Ashbourne Road/A50 Roundabout
Wet/Day Slight Vehicle 1 was waiting at the roundabout entrance and was shunted from the rear by Vehicle 2
7.4 Table 11 above shows a total of 24 accidents occurring since 2005 in the area of the two
roundabouts of which 23 were slight in severity with 1 serious accident. It should be noted that a
significant number of incidents consisted of minor rear end shunts with 10 accidents occurring on a
wet or icy surface. Taking into consideration the location of the roundabout on a major trunk road

Transport Assessment – The Dove Way, Uttoxeter
Report Ref: 20111/JW/08-11/3119 Rev A Page 25
and the subsequent volume of traffic expected to use this route it is considered that an average of
approximately 5 accidents per year is not excessive and there is no existing accident issue at this
location.
Table 12: Accidents occurring at or close to Cheadle Road/New Road/Ashbourne Road Mini
Roundabout
Year Location Conditions Severity Description 2006 New Road/Holly Road
Junction Wet/Dark Slight Vehicle 1 was negotiating
roundabout when Vehicle pulled out causing a collision.
2007 New Road/Holly Road Junction
Dry/Dark Slight Vehicle 1 was negotiating junction as Vehicle 2 entered junction causing collision
2007 Cheadle Road Dry/Day Serious Elderly driver loses control of vehicle causing collision
2007 New Road/Grange Road Junction
Dry/Dark Slight Vehicle 1 slowed to turn right and was shunted by Vehicle 2
2008 New Road/Applewood Close Junction
Dry/Day Slight Vehicle 1 was travelling down road when Vehicle 2 pulled out causing collision
2008 Ashbourne Road/Johnson Road
Junction
Dry/Day Slight Stolen Vehicle 1 overtook static vehicle causing collision with Vehicle 2
2008 Howitt Crescent/Johnson Road
Dry/Day Slight Vehicle 1 reversed on highway causing collision with cyclist entering the road from the pavement
2008 New Road/Holly Road Junction
Dry/Dark Slight Vehicle 1 pulled out from junction in front of Vehicle 2 (moped) causing a collision
2009 Cheadle Road Wet/Day Slight Vehicle 1 was held up in traffic when shunted from the rear by Vehicle 2
2009 New Road Dry/Day Slight Vehicle 1 entered the carriageway in front on Vehicle 2 (motorcycle) causing collision
2010 Cheadle Road/Ashbourne Road
Junction
Ice/Dark Slight Vehicle 1 entered the roundabout and collided with a pedal cycle
7.5 Table 12 above shows there have been a total of 11 accidents for the above junction in the past five
years, one of which was considered serious in severity. Analysis of the accident descriptions shows
that a number of accidents at this location can be attributed to driver error and given that the number
of accidents per year has declined over the 5 year period it is considered that there is no existing
accident problem at this location.
Table 13: Accidents occurring at or close to The Dove Way/Derby Road Roundabout and the
Town Meadows Way/Dove Bank Roundabout
Year Location Conditions Severity Description 2006 Town Meadows
Way/Dove Bank Roundabout
Wet/Dark Slight Vehicle struck Vehicle 2 (cycle) while pulling on to roundabout.
2008 Town Meadows Way/Dove Way
Wet/Dark Serious Vehicle 1 was negotiating roundabout when Vehicle 2

Transport Assessment – The Dove Way, Uttoxeter
Report Ref: 20111/JW/08-11/3119 Rev A Page 26
Roundabout (moped) pulled out causing collision 2008 The Dove Way/Derby
Road Roundabout Dry/Day Slight Vehicles 1 and 2 held up exiting
roundabout when shunted from the rear by Vehicle 3
2009 The Dove Way/Derby Road Roundabout
Dry/Day Slight Vehicle 1 (motorcycle) was waiting to enter roundabout when shunted at the rear from Vehicle 2
2009 400m north of The Dove Way/Derby Road
Roundabout
Dry/Day Fatal Vehicle 1 (motorcycle) was overtaking Vehicles 2 and 3 when it collided with Vehicle 4 travelling in the opposite direction
7.6 Table 13 above shows that there have been 5 accidents at or close to The Dove Way/Derby Road
Roundabout and the Town Meadows Way/Dove Bank Roundabout since 2006 of which 4 were slight
in severity with 1 fatal accident recorded. It is to be noted that the fatal accident involved a head on
collision between an overtaking motorcycle and car and is therefore considered an isolated incident
as opposed to any inherent safety issues at the roundabout. Taking this into consideration it is
considered that there is no significant accident problem in this location.
Table 14: Accidents occurring on the A50
Year Location Conditions Severity Description 2007 A50 - 325m east of
A50/Ashbourne Road Roundabout
Dry/Day Slight Vehicle 1 slowing was hit at the rear by Vehicle 2
2007 A50 – opposite the A522/A50
Dry/Day Slight Vehicle 1 slowing on A50 when hit at the rear by Vehicle 2 and 3
2007 A50 – 150m east of junction with A518
Wet/Day Slight Vehicle (motorcycle) skidded on slippery surface causing accident
2007 A50 – 290m west of junction with B5030
Wet/Day Slight Vehicle 1 changed lanes without signal causing collision with Vehicle 2
2008 A50 – 200m east of junction with Ashbourne
Road
Dry/Day Slight Inebriated driver lost control and car left carriageway and overturned
2009 A50 – 300m west of junction with Ashbourne
Road
Dry/Day Slight Vehicle 1 changed lanes on duel carriageway and collided with Vehicle 2 (mgv)
2009 A50 Dry/Day Slight Vehicle 1 slowed suddenly causing Vehicles 2 and 3 following to collide with Vehicle 1
2010 A50 – 160m east of junction with New Road
Dry/Dark Serious Vehicle 1 swerved to avoid object in the road and collided with Vehicle 2 and 3
7.7 Table 14 above shows that there have been 8 accidents along the A50 since 2006 with 7 of these
considered slight in severity. As the serious collision was caused by a foreign object in the
carriageway this is considered an exceptional circumstance and therefore not the result of any
safety issue with this stretch of the A50. Following analysis of the remaining accidents it is
considered the majority were rear end shunts in traffic caused by driver inattention and consequently
there are no highway safety issues at this location that require mitigation measures.

Transport Assessment – The Dove Way, Uttoxeter
Report Ref: 20111/JW/08-11/3119 Rev A Page 27
Table 15: Accidents on or close to the A522 New Road/A50 Roundabout/slip road
Year Location Conditions Severity Description 2006 A522/A50 Roundabout Wet/Day Slight Vehicle 1 negotiating roundabout
when Vehicle 4 pulls out causing collision. Vehicle 2 and 3 following Vehicle 1 also collide.
2007 New Road/A522 Roundabout
Dry/Day Slight Vehicle 1 was negotiating the roundabout when Vehicle to pulled out causing a collision
2007 New Road/A522 Roundabout
Dry/Day Slight Vehicle 1 was negotiating roundabout when slowed suddenly causing collision with Vehicle 2
2007 New Road/A522 Roundabout
Wet/Dark Fatal Vehicle 1 changed lanes within contraflow and collided with Vehicle 2 (mgv)
2008 New Road/A522 Roundabout
Dry/Day Slight Vehicle 1 was waiting at the roundabout and was struck from the rear by Vehicle 2
2009 New Road/A522 Roundabout Slip Road
Dry/Day Slight Vehicle failed to slow sufficiently on slip road, lost control and left the road
2010 New Road/A522 Roundabout Slip Road
Dry/Day Slight Vehicle 1 was held up on the slip road and was shunted at the rear by Vehicle 2
2010 A50/A522 Slip Road Dry/Dark Slight Vehicle 1 (mgv) was held up and Vehicle 2 (mgv) hit the rear of Vehicle 1
2010 New Road/A522 Roundabout Slip Road
Dry/Day Slight Vehicle 1 was waiting at junction entry and was shunted at the rear by Vehicle 2
7.8 Table 15 above shows that there have been 9 accidents in this location over a five year period, 8 of
which were considered slight in severity with the fatal accident the cause of driver error/inattention
within a temporary contraflow system. Given that the remaining accidents largely consist of minor
rear end shunts as a result of driver error and average at less than 2 per year it is considered there
is no accident problem at this location.

Transport Assessment – The Dove Way, Uttoxeter
Report Ref: 20111/JW/08-11/3119 Rev A Page 28
8.0 ACCESS AND PARKING
Access
8.1 It is proposed to access both the residential and commercial sites via the construction of a
roundabout on The Dove Way. A previous scheme has been produced by Armstrong Stokes and
Clayton which has been submitted to and approved by SCC. Drawing Con/100/100B/T in Appendix
L shows the proposed roundabout to serve the site and this design includes a 3m wide
pedestrian/cycle link on the western side of the carriageway to tie in with the existing
footway/cycleway. Footways will also be provided on both the residential and commercial access
roads to facilitate pedestrian access to both sites.
8.2 In order to observe the capacity, queues and delays at the proposed site access roundabout on The
Dove Way an assessment has been carried out using Department of Transport TRL program
ARCADY 6. Table 16 below provides a summary of predicted queues and delays at a future year
scenario of 2021 including development flows with summary diagrams and capacity assessment
data presented in Appendix M.
Table 16: Assessment of 2021 plus development flows at Access Roundabout
Junction/Arm Peak Max RFC (%)
Max Queues (vehs)
Max Delay (sec/vehs)
Site Access Roundabout
Arm A: Eastern Access AM 0.044 0 2 PM 0.100 0 2
Arm B: A518 South AM 0.352 1 3 PM 0.305 0 3
Arm C: Western Access AM 0.024 0 3 PM 0.013 0 3
Arm D: A518 North AM 0.300 0 3 PM 0.304 0 3
8.3 Table 16 above shows that the proposed access roundabout operates under capacity at a future
year of 2021 plus development flows with all arms displaying values well under the desired 0.850
(85%) threshold with minimal queues and delays.
Parking
8.4 Both the residential and commercial developments will provide vehicle and cycle parking in
accordance with East Staffordshire Borough Council’s Supplementary Planning Guidance: Parking
Standards document. Tables 17 and 18 below highlight the parking standards to be applied to both
the residential and commercial aspects of the development.

Transport Assessment – The Dove Way, Uttoxeter
Report Ref: 20111/JW/08-11/3119 Rev A Page 29
Table 17: ESBC Residential Parking Standards
House Type
Car Parking Standard
Cycle
Parking Within 400m of Uttoxeter Town
Centre
All other areas
C3 Residential
1 bedroom 1.5 spaces per
dwelling (average)
1 space + 1 space per 3 dwellings for visitors
1 secure space per
unit
2/3 bedrooms 2 spaces
4 or more bedrooms
3 spaces
Table 18: ESBC Commercial Parking Standards
Use
Parking provision for building size Use Type Total floorspace per
building type
B1 Offices 4181 m2 0-235m2 – 1 space per 20m2
235m2 – 1 space per 30m2
B2 Non-office &
General industry
9755 m2 0-235m2 – 1 space per 20m2
235m2 – 1000m2 - 1 space per 50m2
1000m2 + 1 space per 80m2
8.5 In order to ensure sufficient parking is provided within the development the above standards will be
applied to ensure the development does not generate on-street parking therefore reducing
congestion and residential accident rates. The number of spaces to be provided for the residential
and commercial developments will be determined once the exact number of dwellings and size of
the commercial units have been confirmed.

Transport Assessment – The Dove Way, Uttoxeter
Report Ref: 20111/JW/08-11/3119 Rev A Page 30
9.0 MITIGATION
9.1 Based on the information provided in this report, this section will list all improvements deemed
necessary in order to help facilitate the development.
Pedestrian Improvements
9.2 Drawing Con/100/100B/T in Appendix L shows proposed pedestrian site access. This drawing
illustrates the 3m wide footway that will be provided on both sides of the commercial and residential
access roads leading into both developments. The footway on the residential access road will link in
with the existing provision along The Dove Way providing a direct link for pedestrians into Uttoxeter
Town Centre. Pedestrian refuges will be provided as part of the construction of the access
roundabout with dropped kerbs and tactile paving facilitating movement across The Dove Way.
9.3 The residential development will provide a footpath connection from the existing footways on The
Dove Way on the eastern site boundary through the site leading to the existing pedestrian link on
Pennycroft Lane and existing footways along Park Street. The link will facilitate pedestrian access
to the bus stops situated on the junction of Cheadle Road/Park Street along with other services and
amenities. An additional pedestrian link will be provided from the commercial development through
to Park Avenue to the west and the existing combined footway and cycleway along the A50 to the
north utilizing the existing pedestrian underpass under The Dove Way.
Public Transport Improvements
9.4 Two bus stops will be provided along The Dove Way to enable access to service 32/32A to be
achieved and therefore improving the quality of public transport links to the proposed site. These
stops would ensure the entire residential site and the majority of the commercial development would
be within the desirable 400m walking distance from a bus stop. These stops will feature shelter
provision, full timetable information and raised kerbs and would play an important role in
encouraging more sustainable travel to and from both parts of the site.
Travel Plan
9.5 A Travel Plan has been produced for the site (Report Ref. 20111/JW/04-11/3123) in order to reduce
dependency on the car by encouraging increased use of sustainable transport modes including
walking, cycling and public transport. The main measures included within the Travel Plan are
detailed below;
• Welcome Packs (including an application for 1 x 3 month free bus passes for each household)
• Public transport improvements
• Sales staff training
• Assignment of a Travel Plan Coordinator
• Promotion of cycling to access local facilities and amenities

Transport Assessment – The Dove Way, Uttoxeter
Report Ref: 20111/JW/08-11/3119 Rev A Page 31
• Promotion of car sharing
• Inclusion of a walking bus scheme for the residential development
• Promotion of local footways to access local services and amenities
Junction improvements
A50/A518 Derby Road Roundabout, A50/A518/B5030 Roundabout and A518 Town Meadows
Way/Dovebank A522 Roundabout
9.6 In order to mitigate the impact of the of the development flows on the roundabout arms operating
over capacity an improvement scheme has been considered and the junctions then re-assessed
using Department of Transport TRL program ARCADY 6 with the results and a descriptions of the
changes made highlighted below.
Table 19: Analysis of improvements at the A50/A518 Derby Road Roundabout
Junction/Arm Peak Max RFC (%) 2021
Max RFC (%) 2021 +
Development
Max RFC (%) with
improvements
A50/A518 Derby Road Roundabout Arm A: A50 East AM 0.386 0.420 0.420
PM 0.354 0.366 0.367 Arm B: A518 Derby Road AM 0.371 0.393 0.393
PM 0.354 0.394 0.394 Arm C: A50 West AM 0.699 0.708 0.678
PM 1.067 1.092 1.047 Arm D: Access Road AM 0.012 0.013 0.013
PM 0.004 0.004 0.005
9.7 Table 19 shows as part of the improvement scheme the entry width of the A50 West (Arm C) has
been widened by 0.5m which mitigates the development impact and brings the RFC value below
that of the 2021 base year assessment in both the AM and PM peak. This change does cause the
RFC of Arm D (Access Road) and Arm A (A50 East) in the PM peak to increase marginally;
however, these arms still operate well within capacity.
Table 20: Analysis of improvements at the A50/A518/B5030 Roundabout
Junction/Arm Peak Max RFC (%) 2021
Max RFC (%) 2021 +
Development
Max RFC (%) with
improvements
A50/A518/B5030 Roundabout Arm A: A50 East AM 0.729 0.734 0.734
PM 0.672 0.678 0.678 Arm B: B5030 AM 0.661 0.668 0.668
PM 0.692 0.702 0.702 Arm C: A50 West AM 0.601 0.615 0.615
PM 0.828 0.834 0.834 Arm D: A518 AM 0.628 0.637 0.618

Transport Assessment – The Dove Way, Uttoxeter
Report Ref: 20111/JW/08-11/3119 Rev A Page 32
PM 0.877 0.893 0.864
9.8 Table 20 highlights capacity results of widening the entry width of Arm D (A518) by 0.5m with the
RFC reduced to below that from the 2021 base assessment in the PM peak. The improvement has
no detriment to the operation of the other arms of the roundabout with the RFC values unaffected
from the 2021 plus development assessment.
Table 21: Analysis of improvements at the A518 Town Meadows Way/Dovebank A522
Roundabout
Junction/Arm Peak Max RFC (%) 2021
Max RFC (%) 2021 +
Development
Max RFC (%) with
improvements
A518 Town Meadows Way/Dovebank A522 Roundabout Arm A: Retail Access AM 0.210 0.217 0.217
PM 0.468 0.499 0.501 Arm B: Town Meadows Way AM 0.714 0.763 0.763
PM 0.694 0.712 0.712 Arm C: Dove Bank AM 0.645 0.685 0.620
PM 0.896 0.914 0.834 Arm D: A518 AM 0.710 0.732 0.680
PM 0.862 0.902 0.838
9.9 For the A518 Town Meadows Way/Dovebank A522 Roundabout and increase of 0.5m on the entry
width of Arms C and D was again used to mitigate the development impact taking RFC values below
those from the 2021 base year assessment in both the AM and PM peaks. Arm B remains
unaffected by the changes with Arm A showing a marginal increase in RFC in the PM peak;
however, this arm operates well within capacity thus no capacity concerns are identified in this
location.
A518 Derby Road/Dovefields Mini Roundabout
9.10 Due to the constrained nature of this junction it is not possible to implement any widening of the
A518 Derby Road arms that are operating over capacity to mitigate the development impact. A
signalisation scheme has been tested to see whether this would mitigate the impact however this did
not work and it is considered a mini-roundabout is the best type of junction for this location.
Therefore no physical works to this junction are possible without the need for third party land. It is
therefore considered a contribution towards other improvements should be provided to offset the
impact at this junction.
Summary
9.11 It is considered the minor widening identified above would be nonsensical and impractical to
implement in reality and therefore it is suggested the most appropriate way forward would be for the
developer to provide an appropriate contribution the Section 106 Agreement which can be put

Transport Assessment – The Dove Way, Uttoxeter
Report Ref: 20111/JW/08-11/3119 Rev A Page 33
towards highways works in the local vicinity and as deemed important by Staffordshire County
Council and the Highways Agency.

Transport Assessment – The Dove Way, Uttoxeter
Report Ref: 20111/JW/08-11/3119 Rev A Page 34
10.0 CONCLUSIONS
10.1 This Transport Assessment has considered the impact of a proposed mixed use development at The
Dove Way, Uttoxeter.
10.2 There are a number of existing bus services operating in Uttoxeter. The 1A and 1E services operate
along between Uttoxeter and Burton via Tutbury from Uttoxeter Bus Station to the south of the site at
regular intervals while service number 409 provides links between Uttoxeter and Ashbourne.
Service number 4 links much of the residential area of Uttoxeter with the Tesco superstore located
on Town Meadows Way with service number 32 providing links with Cheadle and Hanley.
10.3 The closest bus stops to the residential site are located on Cheadle Road/High Street approximately
500 metres walking distance south west of the proposed development. These are flag stops only
with no timetable information, shelter provision or raised kerbs. For the commercial site, the bus
stops on Cheadle Road/High Street are located approximately 750 metres walking distance from the
site boundary.
10.4 There is an existing combined footway and cycleway along the western side of The Dove Way which
provides a direct link to the services and amenities located within Uttoxeter Town Centre. A review
of the Sustrans website has determined that there is a cycle route on The Dove Way and heading
west along Old Knotty Way. This is a section of a traffic free Regional Cycle Network extending
across the suburbs of Uttoxeter. In Addition, a cycle route is identified east along the A50 forming
national route 54 leading to national route 549 on Derby Road heading east to Sudbury, Scropton
and Hatton.
10.5 An assessment has been undertaken at 6 off-site junctions and the site access roundabout to
determine the impact the development has in these locations. Traffic counts were undertaken in
June 2011 and assessments have been undertaken at a current year of 2011, future base year of
2021 and 2021 plus development flows. An assessment has been undertaken at the following off-
site junctions and on-site access roundabout;
• A50/A518 Derby Road Roundabout
• A50/A518/B5030 Roundabout
• A518 The Dove way /B5030 Roundabout
• A518 The Dove way /Derby Road A518 Roundabout
• Town Meadows Way/Dovebank A522 Roundabout
• Derby Road A518/Dovefields mini Roundabout
• Site access

Transport Assessment – The Dove Way, Uttoxeter
Report Ref: 20111/JW/08-11/3119 Rev A Page 35
10.6 The results of the capacity assessments have determined that the development will exacerbate
capacity issues at the following four junctions;
• A50/A518 Derby Road Roundabout
• A50/A518/B5030 Roundabout
• Town Meadows Way/Dovebank A522 Roundabout
• Derby Road A518/Dovefields mini Roundabout
10.7 A number of mitigation measures have been proposed within this report including the following;
• Public Transport Improvements – Two new bus stops will be provided on The Dove Way to
ensure all of the residential and the majority of the commercial development In order for the
entire development to be within 400m walking distance from a bus stop, and therefore within
LCC guidelines, it is proposed that two bus stops should be located on Elmdale Road.
• A Travel Plan (Report Ref. 20111/JW/04-11/3123) has been produced for the site and should
be read in conjunction with this report. The Travel Plan includes a package of measures to
achieve modal shift away from private car travel.
• Pedestrian Improvements – A footway will be provided on the residential and commercial
access roads which will link in with the existing provision along The Dove Way providing a
direct link for pedestrians into Uttoxeter Town Centre. The development will allow a
connection to be made on an existing pedestrian route extending west of the residential site to
provide access to Pennycroft Lane leading to existing footways along Park Street. The link
will also provide access onto existing footways on The Dove Way along with facilitating
pedestrian access to the bus stops situated on the junction of Cheadle Road/Park Street
along with other services and amenities. A further footway link will be provided from the
commercial development to the north through to the existing combined footway/cycleway on
the A50 along with a link to the west through to Park Avenue utilizing the existing pedestrian
underpass under The Dove Way.
• Junction Improvements – An appropriate contribution commensurate to the development
impact will be provided to the highway authority in order to mitigate the development impact at
the offsite junctions.
10.8 All the transportation issues relating to the proposed residential and commercial development at
land off The Dove Way, Uttoxeter, have been discussed and a range of issues have been
considered and addressed. There is no reason in highway or transportation terms why the proposed
mixed use development should not proceed if considered with the recommended contributions and
measures detailed in this document.
APPENDIX A

M-EC Wellington House Leicester Road Ibstock Leicestershire LE67 6HP
SITE LOCATION PLAN Project: The Dove Way, Uttoxeter File Ref: 20111 O.S. Grid Ref: Commercial – 409271, 334536/Residential – 409277, 334168 Postcode: ST14 7BW


APPENDIX B

1
Tim Rose
From: James WhittonSent: 01 April 2011 12:44To: Tim RoseSubject: FW: TRIM: FW: Proposed residential and commercial development at The Dove Way,
Uttoxeter
From: Evenson, Geoff (Place) [mailto:[email protected]]
Sent: 01 April 2011 12:22 To: James Whitton
Cc: Harvey, Kevin
Subject: RE: TRIM: FW: Proposed residential and commercial development at The Dove Way, Uttoxeter
James Further to your email, ideally I would prefer a meeting to discuss the scope of the TA. However I would expect the TA being compiled in accordance with the Dft guidance on Transport Assessments March 2007. In terms of the junctions to be assessed I would expect you include the following;
• site access/s, • Doveway A518/B5030 roundabout, • Doveway A518/Derby Road A518 roundabout, • Town Meadows Way/DovebankA522 Roundabout, • Mini roundabout on the Derby Road A518 jn Dovefield.
How many accesses are being proposed, from what I understand the proposed housing is to be off Pennycroft Lane? If so then I would expect you to also consider the following junctions;
• Park Street/Cheadle Road – High Street Uttoxeter, • PennyCroft lane/Park Street Uttoxeter include Croft Grove which forms a staggered junction, • Park Avenue jn Ashbourne Road, • Ashbourne Road jn Johnson Road, • Johnson Road Jn Park Avenue/Park Street
Whilst I accept that for the residential development the above looks a little excessive but following other developments in that area we had a lot of local residents objecting because of the perceived congestion so to avoid any issues I would like these issues to be addressed straight off. Given the development is close to the trunk road network I would suggest that you liaise with Kevin Harvey at the HA, (0121 678 8505), but I would expect the Ashbourne Road B5030/A50 Roundabout and the Derby Road A518/A50 Roundabout being included as a minimum. Before I comment on the proposed trip rates I will require the full TRICS print outs so I can view the sites included. Finally the travel plan I would expect you to provide a travel plan in accordance with the Dft’s guidance Good Practice Guidelines: Delivering Travel Plans through the planning process April 2009 and the County Councils guidance which can be found of the internet. Hoping the above information is helpful, but if you wish to discuss any of the above or wish to arrange a meeting then please feel free to give me a call on 01785 276604. Regards, Geoff Evenson
From: Chadwick, James (Place) Sent: 23 March 2011 10:19
To: Evenson, Geoff (Place) Subject: TRIM: FW: Proposed residential and commercial development at The Dove Way, Uttoxeter
Geoff

1
Tim Rose
From: Harvey, Kevin [[email protected]]Sent: 12 April 2011 12:37To: James WhittonCc: Richard Cornell; 'Andrew Carnell'; Evenson, Geoff (Place); Chadwick, James (DSD);
McCann, DavidSubject: RE: Proposed mixed use residential and commercial site at The Dove Way, Uttoxeter
James, I'll be dealing with this for a few weeks more but there will be a change in personnel very shortly. I'll advise when I know more. Trip Rates
The supplied site location diagram indicates that the site sits out on the edge of town in what could be considered to be a suburban character area. We note that in some cases, the ‘edge of town centre’ category has been used. We consider sites that fall into this category are not representative of the application site and therefore ‘suburban’ and ‘edge of town’ sites selection should be used.
In all cases, the site selection has been undertaken with too narrow reference to the site size. A wider variation would be acceptable and allow a broader range of sites to be included in the sample.
Some specific points:
Residential - ‘Edge of town centre’ sites should be avoided as these sites are unlikely to be representative of the application site. The range of number of units selected is too narrow to provide an adequate sample size. We would suggest a range of 35 – 140 units. The regional selections are also too restrictive and should be balanced between the need for a reasonable sample size with the need account for regional differences in trip generation. As a starting point, London and Northern Ireland should be omitted. B2 - For the purposes of trip rate selection the ‘Industrial Unit’ land use category has been used. This is acceptable if a single unit, however we would recommend you use the Industrial Estate Cass if more than one B2 class building is included as part of the planning application. B8 - The use of the ‘edge of town centre’ site selection parameter is unacceptable. Other Points
Insofar as SRN junction assessments are concerned, the two A50 Junctions (A518 and B5030) would be fine for the purposes of this exercise. Distribution based around Census data would be fine. A gravity model would be acceptable if our colleagues at SCC are content with this approach. Future year assessment is generally 10 years post application date. I'd reiterate Geoff's points (his email 1st April) on the travel plan. ---------------- I hope you find these comments helpful.

2
Regards, Kevin Kevin Harvey, Planning Manager Highways Agency | The Cube | 199 Wharfside Street | Birmingham | B1 1RN Tel: +44 (0) 121 6788505 Web: http://www.highways.gov.uk GTN: 6189 8505 Safe roads, Reliable journeys, Informed travellers Highways Agency, an Executive Agency of the Department for Transport.
From: James Whitton [mailto:[email protected]]
Sent: 12 April 2011 09:47
To: Harvey, Kevin Subject: Proposed mixed use residential and commercial site at The Dove Way, Uttoxeter
Hello Kevin,
Regarding the information I sent to on the 28th
of March for the mixed use residential and commercial development
at The Dove Way, Uttoxeter; Have you had the opportunity to review the TRICS data I sent? You mentioned in your
last email to me that you were going through a period of team restructuring, therefore would you be able to confirm
if it will continue to be yourself who we deal with regarding this site?
If you have any queries please do not hesitate to contact me
Many Thanks James Whitton M-EC Wellington House Leicester Road Ibstock Leicestershire LE67 6HP t: 01530 264753 f: 01530 588116 e: [email protected] www.m-ec.co.uk
This email was received from the INTERNET and scanned by the Government Secure Intranet anti-virus service supplied by Cable&Wireless Worldwide in partnership with MessageLabs. (CCTM Certificate Number 2009/09/0052.) In case of problems, please call your organisation’s IT Helpdesk. Communications via the GSi may be automatically logged, monitored and/or recorded for legal purposes. The original of this email was scanned for viruses by the Government Secure Intranet virus scanning service supplied by Cable&Wireless Worldwide in partnership with MessageLabs. (CCTM Certificate Number 2009/09/0052.) On leaving the GSi this email was certified virus free. Communications via the GSi may be automatically logged, monitored and/or recorded for legal purposes.

APPENDIX C


APPENDIX D

General Page
How to Use this Timetable Book 2
Guide to Local Bus Operators 3
List of Bus Services 4
Index to Places Served 5 - 6
Market Days 7
Timetables
Bus Services 8 - 57
Rail Services 58 - 59
School Special Services 60 - 61
Public Holidays and Schooldays 62
Hospital / Clinic Information 63
Concessionary Fares 64
Community / Voluntary Transport 65
Staffordshire County Council's Role in Public Transport 66 - 67
Route Maps
Area Map Inside Back Cover
Uttoxeter Town Map Inside Back Cover
Cheadle Town Map Back Cover
Page 1
Cartography & Cover by F.W.T., London N19
Cheadle & Uttoxeter Area Public Transport TimetableDecember 2010 - 16th Edition
Compiled and produced by: Staffordshire County Council, Development Services Directorate, Riverway, Stafford ST16 3TJ
Welcome to the latest edition of the Cheadle &
Uttoxeter Area Public Transport Timetable. This
booklet has been published by Staffordshire County
Council as a comprehensive guide to bus services in
Cheadle, Uttoxeter and the surrounding area. Every
service with an origin or destination in the area is
included, no matter which company runs it. We hope
you will find this booklet useful.
TABLE OF CONTENTS
Great care has been taken in the production of this booklet, and the information in it
is published in good faith. The compilers and publishers can accept no liability for
any loss or inconvenience resulting from any inaccuracies or alterations to services.

Looking up a Timetable Standard Codes and Symbolsused throughout this book
M - Operates on Mondays only
T - Operates on Tuesdays only
W - Operates on Wednesdays only
Th - Operates on Thursdays only
F - Operates on Fridays only
S - Operates on Saturdays only
SDO - Operates on Schooldays only
All times in this book are shown in the 24-hour clock. These codes may be combined :
e.g. TF - Tuesdays and Fridays only
1300 = 1 pm 1900 = 7 pm
1400 = 2 pm 2000 = 8 pm
1500 = 3 pm 2100 = 9 pm e.g. NS - Not Saturdays
1600 = 4 pm 2200 = 10 pm
1700 = 5 pm 2300 = 11 pm
1800 = 6 pm
To check the times of your bus -
If you wish to confirm the times of any service you can phone
traveline 0700-2230 daily (except Christmas Day).
Calls from landlines cost 10p per minute.
Typetalk is also available.
Page 2
Individual services and timetables are liable to change during the
currency of this booklet.
How to Use this Timetable Book
To find the timetable page you want, you need to know the route
number of the service to your destination. The places index on pages
5-6 will help you find the right service. The route maps inside the back
cover also show the route numbers, marked alongside the roads they
use. Once you know the route number, the list of services on page 4
will give you the page number if you need it, although the timetables
are generally in number order.
Other codes and symbols are explained on the pages where
they are used
Where preceded by the letter N the journey is NOT operated on
that day.

NAME AND ADDRESS TELEPHONE
Alton Towers Transport, Human Resources Dept, Alton Towers, Alton, Staffordshire ST10 4DB 07968 552505
Arriva Midlands Ltd, PO Box 613, Leicester LE4 8ZN (0844) 8004411
Bakers Coaches, Coach Travel Centre, Prospect Way, Victoria Business Park, Biddulph ST8 7PL (01782) 522101
Clowes Coaches, Barrowmoor, Longnor, Nr Buxton, Derbyshire SK17 0QP (01298) 83292
Copelands Tours (Stoke on Trent) Ltd, 1005 Uttoxeter Road, Meir, Stoke on Trent ST3 6HE (01782) 334466
D&G Coach & Bus Ltd, Mossfield Road, Adderley Green, Stoke on Trent ST3 5BW (01782) 332337
First Potteries Ltd, Head Office Building, Adderley Green Garage, Dividy Road, Stoke on Trent ST3 0AJ (0870) 8500868
Paragon Travel, The Bus Garage, Spath, Uttoxeter, Staffordshire ST15 5AE (01889) 562131
Phil Smith Travel, 1 Barnwell Close, Stramshall, Uttoxeter, Staffordshire ST14 5AW (01889) 560600
TM Travel, Station Road, Halfway, Sheffield S20 3GZ (0114) 263 3890
Trent Barton, Customer Services, 88A Mansfield Road, Heanor DE75 7BG (01773) 536312
Vals Classic Coaches, Corner Garage, 96-98 Cannock Road, Chase Terrace, Burntwood WS7 1JP (01543) 278008
Wardle Transport, Douglas House, Nevada Lane, Sneyd Industrial Estate, Burslem S76 2BY (01782) 814344
Warrington Coaches Ltd, The Cottage, Ilam, Ashbourne, Staffordshire DE6 2AZ (01335) 350204
Page 3
Guide to Local Bus Operators
If you have a comment regarding the operation of any service please contact the operator concerned in the first instance. The
addresses and phone numbers are as shown above. With regard to services provided under contract, the County Council is most
interested in hearing about any cases of unreliability or other problems. Suggestions, compliments or criticisms in writing are
welcomed as they may help to improve the planning and operation of bus services in Staffordshire.
Suggestions, Compliments and Complaints

Service Principal Operator Route Page
1 / 1A / 1E Arriva Midlands / D&G Coaches Uttoxeter - Tutbury - (Rolleston) - Burton 8
One Trent Barton / Arriva Midlands Mayfield - Ashbourne - Derby 12
4 Arriva Midlands Uttoxeter Town Circular 14
6A / 6B First Potteries Blythe Bridge - Longton - Hanley 15
7 / 7A D&G Coaches Longton - Blythe Bridge - Cheadle - Blythe Bridge - Longton 20
10 / 10A Alton Towers Transport 22
12 Val's Classic Lea Heath - Colton - Rugeley 24
14 / 15 Alton Towers Transport Stoke - Hanley - Cheadle - Alton Towers 25
30 Alton Towers Transport Uttoxeter - Alton Towers 27
32 / 32A First Potteries Uttoxeter - Cheadle - Hanley 28
108 Clowes Coaches Ashbourne - Mayfield - Waterhouses - Leek - Macclesfield 37
108 TM Travel / Bakers Coaches Derby - Ashbourne - Leek - Macclesfield - Stockport 39
123 D&G Coaches Cheadle Town Service 41
184 Phil Smith Travel Weston Coyney - Blythe Bridge - Cheadle - Uttoxeter 42
234 / 235 / 236 Clowes Coaches Cheadle - Ipstones - Leek 43
248 / 411 Paragon Travel Uttoxeter / Sharpley Heath - Church Leigh - Uttoxeter 45
249 D&G Coaches Stone - Fulford - Blythe Bridge - Longton 46
402 Paragon Travel Uttoxeter - Draycott - Burton 48
403 Paragon Travel Abbots Bromley - Newborough - Tatenhill - Burton 50
406 D&G Coaches Uttoxeter Town Service 51
409 Trent Barton Uttoxeter - Rocester - Mayfield - Ashbourne 52
428 Paragon Travel Uttoxeter - Abbots Bromley - Lichfield 54
841 Arriva Midlands Uttoxeter - Hixon - Great Haywood - Stafford 57
Page 4
List of Bus Services
Leek - (Cheadle) - Alton Towers

A FAbbots Bromley 403, 428 Cellarhead 10, 15, 32, 32A Field 411
Adderley Green 14 CHEADLE 7, 7A, 10, 14, 32, 32A Forsbrook 7, 7A, 184
Admaston 12 123, 184, 234, 235, 236 Foston 1, 1A, 1E
Alton 30, 32A Checkley 32 Foxt 235
Alton Towers 10, 10A, 14, 15, 30, 32A Cheddleton 10 Fradswell 411
Anslow 402, 403 Church Leigh 248, 411 Freehay 184
ASHBOURNE One, 108, 409 Clifton 409 Froghall 15, 234, 235, 236
Colton 12 Fulford 7, 7A, 249
B Cookshill 184
Barrow Moor 108 Coton 248, 411 GBeam Hill 1, 1E, 402, 403 Cotton 10, 10A, 14, 15, 32A Great Haywood 841
Blithbury 428 Cresswell 7, 7A, 184, 249 Greendale 10, 14, 32A
Blythe Bridge 6A, 6B, 7, 7A CREWE Rail
14, 184, 249, Rail HBottom House 10A, 108, 234, 235, 236 D Hamstall Ridware 428
Boundary 7, 7A, 184 Dapple Heath 428 Hanbury 402
Bradnop 108, 234, 235, 236 Denstone 30, 32A, 184, 409 Handsacre 428
Brailsford One, 108 DERBY One, 108, Rail HANLEY 6A, 6B, 14, 15, 32, 32A
Bramshall 248, 411, 841 Dilhorne 7, 7A, 184 Hatton 1, 1A, 1E, Rail
Branston 403 Dods Leigh 248 Hilderstone 249
Brookhouses 7, 7A, 184 Dovegate Prison 402 Hill Ridware 428
Bucknall 15, 32, 32A Doveridge 1, 1A, 1E Hixon 841
BURTON-UPON-TRENT 1, 1A, 1E, 402, 403 Draycott-in-the-Clay 402 Hoar Cross 403
Draycott-in-the-Moors 7, 7A, 14, 184, 249 Hollington 184
C Horninglow 1, 1A, 1E, 402, 403
Calton 108 ECauldon 108 Ellastone 409 ICauldon Lowe 108 Ipstones 234, 235, 236
Page 5
Index to Places Served

K TKingsley 10, 15, 32, 32A, 236 Newton 12 Tatenhill 403Kingsley Holt 10, 32, 32A, 234, 235, 236 TEAN 7, 7A, 14, 32, 236Kingsley Moor 10, 15, 32, 32A O The Bents 248Kingstone 428 Oakamoor 10, 14, 32A The Blythe 428Kirk Langley One, 108 Tixall 841
R Tutbury 1, 1A, 1E, Rail
L Rangemore 403Lea Heath 12 Rocester 4, 30, 32A, 184, 409 ULEEK 10, 10A, 108, 234, 235, 236 Rolleston 1A UTTOXETER 1, 1A, 1E, 4, 30, 32LICHFIELD 428 Rough Hay 403 32A, 184, 248, 402, 406Lightwood 123 RUGELEY 12 409, 411, 428, 841, RailLONGTON 6A, 6B, 7, 7A, 14, 249, Rail Rushton Spencer 108 Uttoxeter Rail Station 30, 32ALower Leigh 248, 411 402, 409, Rail
SM Saverley Green 7, 7A, 249 WMACCLESFIELD 108 Sharpley Heath 7, 7A, 248, 249 Waterhouses 108Mackworth One, 108 Spath 32 Werrington 15, 32, 32AMarchington 402 STAFFORD 841 Weston Coyney 14, 184Mayfield One, 108, 409 Stallington 249 Wetley Rocks 10Meir 6A, 6B, 7, 7A, 14, 249 Stockport 108 Whiston 15, 235Meir Heath 249 Stockwell Heath 12 Willslock 428Meir Park 6B STOKE 14, 15, Rail Withington 248, 411Milwich 248, 249, 411 STONE 249Morrilow Heath 411 Stowe-by-Chartley 841Moddershall 249 Stramshall 32
Sudbury 1, 1A, 1E
N Swinscoe 108Needwood 403Netherland Green 402Newborough 402, 403
Page 6
Index to Places Served (Continued)

Page 7
Market Days
Thursday, Saturday
Thursday, Friday, Saturday
Tuesday, Friday, Saturday
Ashbourne
Burton
Leek
Hanley
Daily, except Sunday
CITY / TOWN MARKET DAYS
Derby
Cheadle
Monday to Saturday
Wednesday, Saturday
Farmers, Last Saturday of the Month Uttoxeter
Rugeley
Stoke
Tuesday, Thursday, Friday, Saturday
Wednesday, Friday, Saturday
Wednesday, Saturday

UTTOXETER - TUTBURY - (ROLLESTON) - BURTON 1 / 1A / 1EARRIVA MIDLANDS / D&G COACHES
Tutbury Village is always negotiated in the same direction.
D&G - effective from 5.9.10
ARR - effective from 30.10.10
Page 8
Route 1 and 1E : UTTOXETER Bus Station, Bradley Street, Silver Street, Church Street, Dove Bank, Derby Road, A50, Marston Lane, Sand Lane, High
Street, Alms Road, Chapel Green, Bell Lane, Derby Road, Sudbury, Main Road, Foston, Uttoxeter Road, Dove Valley Island, Uttoxeter Road, Hatton,
Station Road, Bridge Street, Lower High Street, TUTBURY, High Street, Duke Street, Fishpond Lane, Wakefield Avenue, Holts Lane, Redhill Lane, Park
Lane, Castle Street, Duke Street, Burton Street, Burton Road, Lodge Hill, Tutbury Road, Horninglow Road North, Horninglow Road, Horninglow Street,
Bridge Street, BURTON, High Street. (1E operates from Horninglow Road via Derby Street, Borough Road, Station Street, Union Street and New Street).
Roue 1A : As above to Tutbury, Burton Road, Rolleston Lane, Church Road, Burnside, Knowles Hill, Rolleston Road, Athelstan Way, Bitham Lane,
Rolleston Road, Horninglow Road North, Horninglow Road, Horninglow Street, Wetmore Road, Burton, High Street.

UTTOXETER - TUTBURY - BURTON 1
UTTOXETER - TUTBURY - ROLLESTON - BURTON 1AARRIVA MIDLANDS
1A 1A 1A 1A 1A
NS NS S NS S
UTTOXETER, Bus Station......................................0555 0635 0635 0705 0735 0755 0805 0835 05 35 1705 1735 1845 1945 2045 2145 2245
Doveridge, Post Office.............................0602 0642 0642 0712 0742 0802 0812 0842 12 42 1712 1742 1852 1952 2052 2152 2252
Sudbury, Vernon Arms...............................0608 0648 0650 0720 0750 0810 0820 0850 20 50 1720 1750 1858 1958 2058 2158 2258
Foston, Village....................................0611 0651 0653 0723 0753 0813 0823 0853 23 53 1723 1753 1901 2001 2101 2201 2301
Foston, Dove Valley................................0612 0652 0655 0725 0755 0815 0825 0855 25 55 1725 1755 1902 2002 2102 2202 2302
Hatton, Salt Box...................................0618 0658 0658 0728 0758 0818 0828 0858 28 58 1728 1758 1905 2005 2105 2205 2305
TUTBURY, High Street...............................0624 0704 0704 0734 0804 0824 0834 0904 34 04 until 1734 1804 1910 2010 2110 2210 2310
Tutbury, Holts Lane................................0626 0706 0706 0736 0806 0826 0836 0906 36 06 1736 1806 1912 2012 2112 2212 2312
Tutbury, Duke Street...............................0631 0711 0711 0741 0811 0831 0841 0911 41 11 1741 1811 1916 2016 2116 2216 2316
Rolleston, Spread Eagle................................ .... …. 0746 .... 0836 0846 …. 46 .. 1746 .... .... .... .... .... ....
Beam Hill, Beacon..................................0636 0716 0716 .... 0816 …. …. 0916 .. 16 .... 1816 1919 2019 2119 2219 2319
Horninglow, Church.................................0639 0719 0719 0754 0819 0844 0854 0919 54 19 1754 1819 1922 2022 2122 2222 2322
BURTON, High Street......................................0649 0729 0729 0804 0829 0854 0904 0929 04 29 1804 1829 1929 2029 2129 2229 2329
Notes : NS - Not Saturday
S - Saturdays only
Effective from 30.10.10
Page 9
then
Monday to Saturday
past
minutes
these
at
hour
each

BURTON - TUTBURY - UTTOXETER 1
BURTON - ROLLESTON - TUTBURY - UTTOXETER 1AARRIVA MIDLANDS
1A 1A 1A 1A
NS S NS
BURTON, High Street......................................0635 0655 0735 0805 0835 05 35 1705 1735 1735 1805 1835 1935 2035 2135 2235
Horninglow, Church.................................0646 0706 0746 0816 0846 16 46 1716 1743 1746 1813 1843 1943 2043 2143 2243
Rolleston, Spread Eagle................................ 0714 .... 0824 …. 24 .. 1724 …. .... .... .... .... .... .... ....
Beam Hill, Beacon..................................0649 .... 0749 …. 0849 .. 49 .... 1745 1749 1815 1845 1945 2045 2145 2245
Tutbury, Duke Street...............................0654 0719 0754 0829 0854 29 54 1729 1750 1754 1820 1850 1950 2050 2150 2250
Tutbury, Holts Lane................................0656 0721 0756 0831 0856 31 56 1731 1752 1756 1822 1852 1952 2052 2152 2252
TUTBURY, High Street...............................0701 0726 0801 0836 0901 36 01 until 1736 1755 1801 1825 1855 1955 2055 2155 2255
Hatton, Salt Box...................................0706 0731 0806 0841 0906 41 06 1741 1800 1806 1830 1900 2000 2100 2200 2300
Foston, Dove Valley................................0709 0734 0809 0844 0909 44 09 1744 1803 1809 1833 1903 2003 2103 2203 2303
Foston, Hall.......................................0712 0737 0812 0847 0912 47 12 1747 1805 1812 1835 1905 2005 2105 2205 2305
Sudbury, Vernon Arms...............................0715 0740 0815 0850 0915 50 15 1750 1807 1815 1837 1907 2007 2107 2207 2307
Doveridge, Post Office.............................0722 0747 0822 0857 0922 57 22 1757 1814 1822 1844 1914 2014 2114 2214 2314
UTTOXETER, Bus Station......................................0729 0754 0829 0904 0929 04 29 1804 1821 1829 1851 1921 2021 2121 2221 2321
Notes : NS - Not Saturday
S - Saturdays only
Effective from 30.10.10
Page 10
at
these
minutes
past
Monday to Saturday
then
each
hour

UTTOXETER - TUTBURY - BURTON 1ED&G COACHES
UTTOXETER, Bus Station......................................0825 1025 1225 1425 1625 1825 2025 Note : - Near Rail Station
Doveridge, Post Office.............................0832 1032 1232 1432 1632 1832 2032
Sudbury, Vernon Arms...............................0838 1038 1238 1438 1638 1838 2038
Foston, Village....................................0841 1041 1241 1441 1641 1841 2041
Foston, Dove Valley................................0842 1042 1242 1442 1642 1842 2042
Hatton, Salt Box...................................0845 1045 1245 1445 1645 1845 2045
TUTBURY, High Street...............................0850 1050 1250 1450 1650 1850 2050
Tutbury, Holts Lane................................0852 1052 1252 1452 1652 1852 2052
Tutbury, Duke Street...............................0856 1056 1256 1456 1656 1856 2056
Beam Hill, Beacon..................................0859 1059 1259 1459 1659 1859 2059
Horninglow, Church.................................0902 1102 1302 1502 1702 1902 2102
Burton, Rail Station ..........................0907 1107 1307 1507 1707 1907 2107
BURTON, High Street......................................0910 1110 1310 1510 1710 1910 2110
BURTON, High Street......................................0735 0935 1135 1335 1535 1735 1935
Burton, Rail Station ..........................0738 0938 1138 1338 1538 1738 1938
Horninglow, Church.................................0743 0943 1143 1343 1543 1743 1943
Beam Hill, Beacon..................................0745 0945 1145 1345 1545 1745 1945
Tutbury, Duke Street...............................0750 0950 1150 1350 1550 1750 1950
Tutbury, Holts Lane................................0752 0952 1152 1352 1552 1752 1952
TUTBURY, High Street...............................0755 0955 1155 1355 1555 1755 1955
Hatton, Salt Box...................................0800 1000 1200 1400 1600 1800 2000
Foston, Dove Valley................................0803 1003 1203 1403 1603 1803 2003
Foston, Hall.......................................0805 1005 1205 1405 1605 1805 2005
Sudbury, Vernon Arms...............................0807 1007 1207 1407 1607 1807 2007
Doveridge, Post Office.............................0814 1014 1214 1414 1614 1814 2014
UTTOXETER, Bus Station......................................0821 1021 1221 1421 1621 1821 2021Effective from 5.9.10
Page 11
Sunday and Bank Holiday Mondays

MAYFIELD - ASHBOURNE - DERBY OneTRENT BARTON / ARRIVA MIDLANDS
SDO NSD ARR ARR ARR
MAYFIELD, Congree Lane……………………………….... 0721 0846 0926 1026 1115 1215 1315 1415 1515 .... 1615 1715 1810 1828 2203 2338
Mayfield, School……….........................………………….... 0725 0850 0930 1030 1119 1219 1319 1419 1519 .... 1619 1719 1814 1830 2205 2340
ASHBOURNE, Bus Station……….......................………0635 0735 0900 0940 1040 1130 1230 1330 1430 1530 1603 1630 1730 1820 1845 2210 2345
Ashbourne, Hill Top School…………..........…………………….0640 0741 0906 0946 1046 1136 1236 1336 1436 1536 1620 1636 1736 .... 1850 2215 ….
Brailsford, Rose & Crown………………………………………..0650 0753 0918 0958 1058 1148 1248 1348 1448 1548 1635 1648 1747 .... 1905 2230 2357
Kirk Langley, Moor Lane……………………………0655 0759 0923 1003 1103 1153 1253 1353 1453 1553 1640 1653 1752 .... 1910 2235 2400
Mackworth, Radbourne Lane……………………………………0659 0803 0927 1007 1107 1157 1257 1357 1457 1557 1644 1657 1755 .... 1915 2240 0003
DERBY, Bus Station……....................................0710 0825 0940 1020 1120 1210 1310 1410 1510 1610 1657 1710 1805 .... 1925A 2250A 0011A
109
SDO NSD ARR ARR ARR
DERBY, Bus Station……....................................0750 0845 0945 1025 1125 1225 1325 1425 1515 1525 1620 1720 1830 1735B 2120A 2255A
Mackworth, Radbourne Lane……........................0802 0852 0952 1035 1135 1235 1335 1435 1527 1535 1635 1735 1840 …. 2131 2305
Kirk Langley, Moor Lane……………………………0806 0856 0956 1039 1139 1239 1339 1439 1531 1539 1639 1739 1844 …. 2135 2310
Brailsford, Rose & Crown………........................0811 0901 1001 1044 1144 1244 1344 1444 1536 1544 1644 1744 1849 …. 2140 2315
Ashbourne, Hill Top School…….......................0824 0912 1012 1058 1158 1258 1358 1458 1550 1558 1658 1756 1859 …. 2155 2330
ASHBOURNE, Bus Station……...........................0840 0920 1020 1108 1208 1308 1408 1508 1556 1608 1708 1803 1904 1823 2200 2335
Mayfield, Conygree Lane…………........................0846 0926 1026 1115 1215 1315 1415 1515 …. 1615 1715 1810 …. 1825 2203 2338
MAYFIELD, School……………….....................................0850 0930 1030 1119 1219 1319 1419 1519 …. 1619 1719 1814 …. 1828 2205 2340
Notes : A - Continues to / Commences from Derby Rail Station
B - Commences from Rail Station then operates via Allestree, Quarndon, Kedleston, Muggington, Hulland and Bradley
ARR - Operated by Arriva Midlands NSD - Not Schooldays SDO - Schooldays Only ARR - effective from 26.10.09
TRB - effective from 28.3.10
Page 12
Monday to Friday
Route : MAYFIELD, Conygree Lane, Mayfield Avenue, Ashlea Drive, Ashbourne Road, Mayfield Road, Church Street, Dig Street, King Edward Street,
ASHBOURNE Bus Station, Station Street, Derby Road, Springfield Avenue, Old Derby Road, Wyaston Road, Willow Meadow Road, Old Derby Road, Derby
Road, Hill Top, Osmaston Lane End, Painters Lane, Yeldersley, Shirley Bridge, A52, Ednaston, Brailsford, Main Road, Ashbourne Road, Friar Gate, Bridge
Street, Agard Street, Ford Street, St Alkmunds Way, Cathedral Road, Walker Lane, Jury Street, Bold Lane, The Strand, Victoria Street, Albert Street,
Morledge, DERBY, Bus Station.

DERBY - ASHBOURNE - MAYFIELD OneTRENT BARTON / ARRIVA MIDLANDS
ARR ARR ARR
MAYFIELD, Congree Lane……………………………….... 0740 0846 0926 1026 1115 1215 1315 1415 1515 1615 1715 1807 1828 2203 2338
Mayfield, School……….........................………………….... 0743 0850 0930 1030 1119 1219 1319 1419 1519 1619 1719 1811 1830 2205 2340
ASHBOURNE, Bus Station……….......................………0645 0755 0900 0940 1040 1130 1230 1330 1430 1530 1630 1730 1817 1845 2210 2345
Ashbourne, Hill Top School…………..........…………………….0650 0801 0906 0946 1046 1136 1236 1336 1436 1536 1636 1736 .... 1850 2215 ….
Brailsford, Rose & Crown………………………………………..0700 0812 0918 0957 1057 1147 1247 1347 1447 1547 1647 1747 .... 1905 2230 2357
Kirk Langley, Moor Lane……………………………0705 0817 0923 1002 1102 1152 1252 1352 1452 1552 1652 1752 .... 1910 2235 2400
Mackworth, Radbourne Lane……………………………………0709 0820 0927 1005 1105 1155 1255 1355 1455 1555 1655 1755 .... 1915 2240 0003
DERBY, Bus Station……....................................0720 0830 0940 1015 1115 1205 1305 1405 1505 1605 1705 1805 .... 1925A 2250A 0011A
109
ARR ARR ARR
DERBY, Bus Station……....................................0805 0845 0945 1025 1125 1225 1325 1425 1525 1625 1725 1830 1735B 2120A 2255A
Mackworth, Radbourne Lane……........................0812 0852 0952 1032 1132 1232 1332 1432 1532 1632 1732 1840 …. 2131 2305
Kirk Langley, Moor Lane……………………………0816 0856 0956 1036 1136 1236 1336 1436 1536 1636 1736 1844 …. 2135 2310
Brailsford, Rose & Crown………........................0821 0901 1001 1041 1141 1241 1341 1441 1541 1641 1741 1849 …. 2140 2315
Ashbourne, Hill Top School…….......................0832 0912 1012 1052 1152 1252 1352 1452 1552 1652 1752 1859 …. 2155 2330
ASHBOURNE, Bus Station……...........................0840 0920 1020 1108 1208 1308 1408 1508 1608 1708 1800 1904 1823 2200 2335
Mayfield, Conygree Lane…………........................0846 0926 1026 1115 1215 1315 1415 1515 1615 1715 1807 .... 1825 2203 2338
MAYFIELD, School……………….....................................0850 0930 1030 1119 1219 1319 1419 1519 1619 1719 1811 .... 1828 2205 2340
Notes : A - Continues to / Commences from Derby Rail Station
ARR - Operated by Arriva Midlands
B - Commences from Rail Station then operates via Allestree, Quarndon, Kedleston, Muggington, Hulland and Bradley
For Sunday Services between Derby and Mayfield see Service 108 (TM Travel) ARR - effective from 26.10.09
TRB - effective from 28.3.10
Page 13
Saturday

UTTOXETER TOWN Circular
ARRIVA MIDLANDS
NS NS S NS S
Rocester, Garage...................................…. 0735 …. …. …. …. .. .. …. …. …. A …. …. …. …. ….
UTTOXETER, Tesco................................................ …. …. 0800 0830 0900 30 00 1600 1630 1700 …. …. …. …. …. ….
Uttoxeter, Bus Station................................. …. 0735 0805 0835 0905 35 05 1605 1635 1705 1805 1805 1921 2021 2221 2321
Lambert Road / Byrds Lane..........................0712 0742 0742 0812 0842 0912 42 12 until 1612 1642 1712 1812 1812 1928 2028 2228 2328
Carter Street * .................................................0720 0750 0750 0820 0850 0920 50 20 1620 1650 1720 …. 1820 1936 2036 2236 B
Uttoxeter, Bus Station.............................0725 0755 0755 0825 0855 0925 55 25 1625 1655 1725 …. 1825 1941 2041 2241 ….
UTTOXETER, Tesco............................................…. A 0800 0830 0900 0930 00 30 1630 1700 …. …. …. …. …. …. ….
Rocester, Garage...................................…. …. …. …. …. …. .. .. …. …. …. 1825 …. …. …. …. ….
Notes : A - Continues to / from Burton as Service 1
B - Terminates at Pennycroft Road at 2336
NS - Not Saturdays
S - Saturday only
* On Fridays all journeys operate from Stone Road via Smithfield Road to Bradley Street and DO NOT serve Carter Street
Certain journeys are operated under contract to Staffordshire County Council
Effective from 5.9.10
Page 14
Sundays and Bank Holiday Mondays : No Service
Monday to Saturday
4
Route : UTTOXETER Tesco, Town Meadows Way, Bridge Street, Church Street, Silver Street, Bradley Street, UTTOXETER Bus Station, Bradley Street, High
Street, Cheadle Road, Holly Road, Byrds Lane, Lambert Road, Marlborough Way, Kimberley Drive, New Road, Redfern Road, Pennycroft Road, Byrds Lane,
Holly Road, Stone Road, Carter Street, Bridge Street, Church Street, Bradley Street, UTTOXETER Bus Station, Bradley Street, Dove Bank, Town Meadows
Way, UTTOXETER Tesco.
then at
hour
these
minutes
each
past

BLYTHE BRIDGE - LONGTON - HANLEY 6A / 6BFIRST POTTERIES
CDO
6A 6A 6A 6A 6A 6C 6A 6A 6A 6A 6A 6A 6A 6A 6A
BLYTHE BRIDGE, Old Bills Garage.................................0602 0627 0651 0711 0740 0756 0816 0846 0916 46 16 1516 1546 1630 1655
Blythe Bridge, Rail Station ....................................................................0606 0631 0655 0715 0744 0800 0820 0850 0920 50 20 1520 1550 1634 1659
Meir, Broadway.........................................................................0612 0637 0701 0721 0750 0806 0826 0856 0926 56 26 until 1526 1556 1640 1705
Longton, Interchange......................................................................0618 0643 0709 0729 0758 0814A 0834 0904 0934 04 34 1534 1604 1648 1713
HANLEY, Bus Station......................................0631 0656 0725 0745 0822 0845 0858 0924 0952 22 52 1554 1622 1710 1735
6A 6A 6B 6B 6B 6B 6B 6B 6B 6B 6B
BLYTHE BRIDGE, Old Bills Garage.................................1720 1750 1822 1852 1922 1952 2022 2052 2122 2152 2222
Blythe Bridge, Rail Station ....................................................................1724 1754 1825 1855 1925 1955 2025 2055 2125 2155 2225
Meir Park, Tesco.......................................................................…. …. 1830 1900 1930 2000 2030 2100 2130 2200 2230
Meir, Broadway.........................................................................1730 1800 1839 1909 1939 2009 2039 2109 2139 2209 2239
Longton, Interchange......................................................................1738 1808 1845 1915 1945 2015 2045 2115 2145 2215 2245
HANLEY, Bus Station......................................1755 1821 1858 1928 1958 2028 2058 2128 2158 2228 2258
Notes : A - Operates via Sixth Form College, Manorfield Link Road 0831
CDO - College Days only
- Near Rail Station
Effective from 5.9.10
Page 15
then at
Route 6A : BLYTHE BRIDGE, A521 Uttoxeter Road, A50, Commerce Street, The Strand, Longton Interchange, King Street, Victoria Road, Lichfield Street,
HANLEY Bus Station,
these
minutes
past each
hour
Route 6B : BLYTHE BRIDGE, A521 Uttoxeter Road, Lysander Road, Whitestone Road, Grindley Lane, Sandon Road, Meir Broadway, Uttoxeter road,
Commerce Street, The Strand, Longton Interchange, King Street, Victoria Road, Lichfield Street, HANLEY Bus Station,
Monday to Friday
Wheelchair accessible vehicles are normally used on this service

BLYTHE BRIDGE - LONGTON - HANLEY 6A / 6BFIRST POTTERIES
6B 6B 6B 6B 6B 6B 6A 6A 6A 6A 6A 6A 6A 6B
BLYTHE BRIDGE, Old Bills Garage.................................0558 0618 0638 0658 0718 0738 0816 0846 0916 46 16 1716 1746 1822
Blythe Bridge, Rail Station ....................................................................0602 0622 0642 0702 0722 0742 0820 0850 0920 50 20 1720 1750 1825
Meir Park, Tesco.......................................................................0607 0627 0647 0707 0727 0747 …. …. …. .. .. until …. …. 1830
Meir, Broadway.........................................................................0621 0641 0701 0721 0741 0801 0826 0856 0926 56 26 1726 1756 1839
Longton, Interchange......................................................................0629 0649 0709 0729 0749 0809 0834 0904 0934 04 34 1734 1804 1845
HANLEY, Bus Station......................................0647 0707 0727 0747 0807 0827 0852 0922 0952 22 52 1752 1822 1858
6B 6B 6B 6B 6B 6B 6B 6B
BLYTHE BRIDGE, Old Bills Garage.................................1852 1922 1952 2022 2052 2122 2152 2222
Blythe Bridge, Rail Station ....................................................................1855 1925 1955 2025 2055 2125 2155 2225
Meir Park, Tesco.......................................................................1900 1930 2000 2030 2100 2130 2200 2230
Meir, Broadway.........................................................................1909 1939 2009 2039 2109 2139 2209 2239
Longton, Interchange......................................................................1915 1945 2015 2045 2115 2145 2215 2245
HANLEY, Bus Station......................................1928 1958 2028 2058 2128 2158 2228 2258
Note : - Near Rail Station
Effective from 5.9.10
Page 16
past
each
hour
minutes
Saturday
then at
these
Wheelchair accessible vehicles are normally used on this serviceWheelchair accessible vehicles are normally used on this service

HANLEY - LONGTON - BLYTHE BRIDGE 6A / 6BFIRST POTTERIES
6A 6A 6A 6A 6A 6A 6A 6A 6A 6A 6A 6A 6A 6A
HANLEY, Bus Station......................................0700 0732 0804 0830 0905 0940 1010 40 10 1540 1610 1640 1710 1740
Longton, Interchange...........................................................................0715 0749 0821 0847 0922 0957 1024 54 24 1554 1627 1657 1727 1757
Meir, Broadway................................................................................0722 0757 0832 0855 0930 1005 1032 02 32 until 1602 1635 1705 1735 1805
Blythe Bridge, Rail Station ....................................................................0727 0804 0837 0900 0935 1010 1037 07 37 1607 1640 1710 1740 1810
BLYTHE BRIDGE, Old Bills Garage.................................0731 0806 0841 0904 0939 1014 1041 11 41 1611 1644 1714 1744 1814
6A 6A 6B 6B 6B 6B 6B 6B 6B 6B 6B 6B
HANLEY, Bus Station......................................1809 1853 1913 1943 2013 2043 2113 2143 2213 2243 2313 2343
Longton, Interchange...........................................................................1824 1907 1926 1956 2026 2056 2126 2156 2226 2256 2326 2356
Meir, Broadway................................................................................1832 1913 1932 2002 2032 2102 2132 2202 2232 2302 2332 0002
Meir Park, Tesco.......................................................................…. …. 1941 2011 2041 2111 2141 2211 2241 2311 2341 0011
Blythe Bridge, Rail Station ....................................................................1837 1918 1946 2016 2046 2116 2146 2216 2246 2316 2346 0016
BLYTHE BRIDGE, Old Bills Garage.................................1840 1921 1949 2019 2049 2119 2149 2219 2249 2319 2349 0019
Note : - Near Rail Station
Effective from 5.9.10
Page 17
past each
hour
minutes
Monday to Friday
then at
these
Wheelchair accessible vehicles are normally used on this service

HANLEY - LONGTON - BLYTHE BRIDGE 6A / 6BFIRST POTTERIES
6B 6B 6B 6B 6A 6A 6A 6A 6A 6A 6A 6A 6A 6A
HANLEY, Bus Station......................................0619 0639 0659 0730 0810 0830 0905 0940 1010 40 10 1710 1745 1815
Longton, Interchange...........................................................................0631 0651 0711 0744 0824 0844 0919 0954 1024 54 24 1727 1759 1829
Meir, Broadway................................................................................0637 0657 0717 0752 0832 0852 0937 1002 1032 02 32 until 1735 1807 1837
Meir Park, Tesco.......................................................................0646 0706 0726 0805 …. …. …. …. …. .. .. …. …. ….
Blythe Bridge, Rail Station ....................................................................0651 0711 0731 0807 0837 0900 0935 1007 1037 07 37 1740 1812 1842
BLYTHE BRIDGE, Old Bills Garage.................................0655 0715 0735 0811 0841 0904 0939 1011 1041 11 41 1744 1816 1846
6A 6B 6B 6B 6B 6B 6B 6B 6B 6B 6B
HANLEY, Bus Station......................................1853 1913 1943 2013 2043 2113 2143 2213 2243 2313 2343
Longton, Interchange...........................................................................1907 1926 1956 2026 2056 2126 2156 2226 2256 2326 2356
Meir, Broadway................................................................................1913 1932 2002 2032 2102 2132 2202 2232 2302 2332 0002
Meir Park, Tesco.......................................................................…. 1941 2011 2041 2111 2141 2211 2241 2311 2341 0011
Blythe Bridge, Rail Station ....................................................................1918 1946 2016 2046 2116 2146 2216 2246 2316 2346 0016
BLYTHE BRIDGE, Old Bills Garage.................................1921 1949 2019 2049 2119 2149 2219 2249 2319 2349 0019
Note : - Near Rail Station
Effective from 5.9.10
Page 18
minutes
past
each
hour
then at
these
Saturday
Wheelchair accessible vehicles are normally used on this serviceWheelchair accessible vehicles are normally used on this service

BLYTHE BRIDGE - LONGTON - HANLEY 6BFIRST POTTERIES
BLYTHE BRIDGE, Old Bills Garage.................................0930 0950 1010 1030 1050 10 30 50 1750
Blythe Bridge, Rail Station ....................................................................0935 0955 1015 1035 1055 15 35 55 1755
Meir Park, Tesco.......................................................................0938 0958 1018 1038 1058 18 38 58 until 1758
Meir, Broadway..................................................................................0947 1007 1027 1047 1107 27 47 07 1807
Longton, Interchange................................................................................0953 1013 1033 1053 1113 33 53 13 1813
HANLEY, Bus Station......................................1007 1027 1047 1107 1127 47 07 27 1827
HANLEY, Bus Station......................................0930 1010 1030 1050 10 30 50 1650 1710
Longton, Interchange..............................................................................0944 1024 1044 1104 24 44 04 1704 1724
Meir, Broadway..................................................................................0950 1030 1050 1110 30 50 10 until 1710 1730
Meir Park, Tesco.......................................................................0959 1039 1059 1119 39 59 19 1719 1739
Blythe Bridge, Rail Station ....................................................................1002 1042 1102 1122 42 02 22 1722 1742
BLYTHE BRIDGE, Old Bills Garage.................................1007 1047 1107 1127 47 07 27 1727 1747
Note : - Near Rail Station
Blythe Bridge to Meir journeys are operated under contract to Staffordshire County Council
Effective from 5.9.10
Page 19
past
each
hour
Sunday and Bank Holiday Monday
then at
these
minutes
each
hour
then at
these
minutes
past
Wheelchair accessible vehicles are normally used on this service

LONGTON - BLYTHE BRIDGE - CHEADLE - BLYTHE BRIDGE - LONGTON
D&G COACHES
LONGTON, Interchange…………………..…. 0745 0855 1055 1255 1500 1735 1835 Note :
Meir, Broadway…………………………………………. 0751 0901 1101 1301 1506 1741 1841
Blythe Bridge, Duke of Wellington……..…. 0756 0906 1106 1306 1511 1746 1846 A -
Forsbrook, Square………………………………..…. 0758 0908 1108 1308 1513 1748 1848
Dilhorne, Royal Oak……………………………..….. 0803 0913 1113 1313 1518 1753 1853
Boundary, Crossroads……………………………. 0805 0915 1115 1315 1520 1755 1855
Brookhouses, The Huntsman………………. 0807 0917 1117 1317 1522 1757 1857
CHEADLE, High Street………………………..0656 0811 0921 1121 1321 1526 1801 1901
Tean, High Street…………..…………………………..0706 …. 0931 1131 1331 1536 1811 1911
Draycott, Post Office…………………………..0710A …. 0935 1135 1335 …. 1815 1915
Blythe Bridge, Duke of Wellington……..0730 …. 0940 1140 1340 …. 1820 1920
Meir, Broadway………………………………………0735 …. 0945 1145 1345 …. 1825 1925
LONGTON, Interchange………………….0743 …. 0953 1153 1353 …. 1833 1933
This Service is operated under contract to Staffordshire County Council
Effective from 6.9.09
Page 20
7
Operates via Cresswell, Rookery Crescent
0712, Sharpley Heath, Bird in Hand 0715,
Fulford Primary School 0720, Cresswell,
Rookery Crescent 0723
Sundays and Bank Holiday Mondays : No Service
Monday to Saturday
Route : LONGTON Interchange, Baths Road, Times Square, Market Street, Uttoxeter Road, Meir, A50, Grindley Road, Uttoxeter Road, Blythe Bridge, Cheadle
Road, Forsbrook, Dilhorne Road, New Road, Dilhorne, The Common, Boundary, Delphouse Road, The Green, Town End, The Terrace, CHEADLE, High Street,
Cross Street, Chapel Street, Tape Street, Tean Road, Cheadle Road, St. Thomas Road, Tean, High Street, Draycott Road, Draycott-in-the-Moors, Uttoxeter
Road, Blythe Bridge, Uttoxeter Road, Grindley Lane, A50, Meir, Uttoxeter Road, Commerce Street, The Strand, Times Square, Baths Road, LONGTON
Interchange,

LONGTON - BLYTHE BRIDGE - CHEADLE - BLYTHE BRIDGE - LONGTON
D&G COACHES
LONGTON, Interchange…………………..…. …. 0955 1155 1355 …. 1620 Note :
Meir, Broadway…………………………………………. …. 1001 1201 1401 …. 1626
Blythe Bridge, Duke of Wellington……..…. …. 1006 1206 1406 …. 1631A A -
Draycott, Post Office…………………………..…. …. 1011 1211 1411 …. 1651
Tean, High Street…………………………...…………………..…. 0905 1015 1215 1415 1537 1655
CHEADLE, Bank Street………………………..0815 0915 1025 1225 1425 1547 1705
Brookhouses, The Huntsman……………0818 0918 1028 1228 1428 1550 1708
Boundary, Crossroads…………………………0820 0920 1030 1230 1430 1552 1710
Dilhorne, Royal Oak……………………………..0822 0922 1032 1232 1432 1554 1712
Forsbrook, Square………………………………..0827 0927 1037 1237 1437 1559 1717
Blythe Bridge, Duke of Wellington……..0829 0929 1039 1239 1439 1601 1719
Meir, Broadway………………………………………0837 0934 1044 1244 1444 1606 1724
LONGTON, Interchange………………….0848 0943 1053 1253 1453 1615 1733
Effective from 6.9.09
Page 21
Monday to Saturday
7A
Route 7A : Operates as reverse of Service 7 (except in Cheadle where it serves Tean Road, Chapel Street, Bank Street, Watt Place, The Terrace).
Sundays and Bank Holiday Mondays : No Service
Operates via Cresswell, Rookery Crescent 1638, Fulford
Primary School 1641, Sharpley Heath, Bird in Hand 1646,
Cresswell, Rookery Crescent 1649

LEEK - (CHEADLE) - ALTON TOWERS 10 / 10AALTON TOWERS TRANSPORT
SDO
10 10A 10 10 10A 10A
LEEK, Bus Station......................................0750 0915 0929 1335 1635 1850
Leek, Britannia Head Office........................0753 .... 0932 1338 .... ....
Cheddleton, Off Licence............................0758 .... 0937 1343 .... ....
Wetley Rocks, Powys Arms PH........................0801 .... 0940 1346 .... ....
Cellarheads, Crossroads............................0805 .... 0944 1350 .... ....
Kingsley..................................................................................0812 .... .... 1357 .... ....
Kingsley Holt...................................... 0814 .... .... 1359 .... ....
CHEADLE, Miners Rest PH............................0817 .... .... 1402 .... ....
Cheadle, High Street...............................0820 .... .... 1405 .... ....
Bottom House........................................... 0925 .... .... 1645 1900
Cotton, Star Crossroads............................0834 0935 .... 1419 1655 1910
ALTON TOWERS...................................................0845 0940 .... 1430 1700 1915
Note : SDO - Schooldays only
Effective from 1.11.10
Page 22
Monday to Sunday
Route 10A : LEEK Bus Station, Ashbourne Road, Ball Haye Street, Buxton Road, Springfield Road, Ashbourne Road, Ellastone Road, Star Bank, Beelow
Lane, ALTON TOWERS.
Route 10 : LEEK Bus Station, Ashbourne Road, Haywood Street, Brook Street, Cheddleton Road, Leek Road, Cheddleton, Cheadle Road, Wetley Rocks,
Kingsley Road, Kingsley, High Street, Holt Lane, Shawe Park Road, Froghall Road, Leek Road, Tape Street, Chapel Street, Bank Street, CHEADLE, High
Street, Tape Street, Queen Street, Oakamoor Road, Church Bank, Star Bank, Beelow Lane, Farley Lane, ALTON TOWERS.

ALTON TOWERS - (CHEADLE) - LEEK 10 / 10AALTON TOWERS TRANSPORT
NSD SDO
10A 10A 10A 10A 10 10
ALTON TOWERS...................................................0720 0845 1305 1445 1545 1800
Cotton, Star Crossroads............................0725 0850 1310 1450 1550 1805
Bottom House.......................................0735 0900 1320 1500 .... ....
Cheadle, Council Offices............................... .... .... .... 1602 1817
CHEADLE, Miners Rest PH................................ .... .... .... 1605 1820
Kingsley Holt...................................... .... .... .... .... 1608 1823
Kingsley...................................................................................... .... .... .... 1610 1825
Cellarheads, Crossroads................................ .... .... .... 1615 1830
Wetley Rocks, Powys Arms PH............................ .... .... .... 1619 1834
Cheddleton, Off Licence................................ .... .... .... 1622 1837
Leek, Britannia Head Office............................ .... .... .... 1630 1845
LEEK, Bus Station......................................0745 0910 1330 1510 1635 1850
Notes : NSD - Not Schooldays
SDO - Schooldays only
Effective from 1.11.10
Page 23
Monday to Sunday

LEA HEATH - COLTON - RUGELEY
LEA HEATH...................................................1040 1320 RUGELEY, Bus Station......................................1025 1300
Newton.............................................1043 1323 Colton, Dun Cow....................................…. 1305
Admaston...........................................1045 1325 Stockwell Heath........................................ 1310
Stockwell Heath....................................1050 …. Admaston...........................................1035 1315
Colton, Dun Cow....................................1055 …. Newton.............................................1037 1317
RUGELEY, Bus Station......................................1100 1335 LEA HEATH...................................................1040 1320
This Service is operated under contract to Staffordshire County Council
Effective from 6.9.09
Page 24
Saturdays, Sundays and Bank Holidays : No Service
12VAL'S CLASSIC COACHES
Route : LEA HEATH, Lea Lane, B5013, Moor Lane, Sherracop Lane, Colton, High Street, Bellamour Way, Colton Road, Station Road, Anson Street, Elmore
Lane, RUGELEY Bus Station.
Monday to Friday

STOKE - HANLEY - CHEADLE - ALTON TOWERS 14 / 15ALTON TOWERS TRANSPORT
14 14 15 14 15 15
STOKE, Rail Station ................................0520A 0735 1015 1325 1710 1905 Notes : A - Commences Stoke, Church Street 0515
Hanley, Bus Station................................0525 0740 1020 1330 1715 1910 SDO - Schooldays only
Adderley Green, Dividy Road........................0532 0747 .... 1337 .... .... - Near Rail Station
Longton, Police Station............................0540 0755 .... 1345 .... ....
Weston Coyney......................................0544 0759 .... 1349 .... ....
Meir, Co-op Store..................................0547 0802 .... 1352 .... ....
Blythe Bridge, Duke of Wellington..................0552 0807 .... 1357 .... ....
Tean, Cross Keys PH................................0600 0815 .... 1405 .... ....
CHEADLE, High Street...............................0607 0822 .... 1412 .... ....
Oakamoor........................................... 0614 0829 .... 1419 .... ....
Werrington, Post Office................................ .... 1032 .... 1727 1920
Cellarhead…………………………………………………………...... .... 1035 .... 1730 1922
Kingsley............................................................................. .... 1042 .... 1737 1929
Froghall, Station.................................. .... .... 1045 .... 1740 1932
ALTON TOWERS...................................................0625 0840 1059 1430 1754 1945
Effective from 1.11.10
Page 25
Monday to Sunday
Route 14 : STOKE, Station Road, College Road, Cleveland Road, Regent Road, Bethesda Street, Potteries Way, Lichfield Street, HANLEY Bus Station,
Birch Terrace, Charles Street, Old Hall Street, Bucknall New Road, Bucknall Road, Dividy Road, Anchor Road, Sutherland Road, Weston Coyney Road,
Weston Road, Meir, Uttoxeter Road, Draycott Road, Tean, New Road, Cheadle Road, Tean Road, Chapel Street, Bank Street, CHEADLE, High Street, Tape
Street, Queen Street, Oakamoor Road, Church Bank, Star Bank, Beelow Lane, Farley Lane, ALTON TOWERS.
Route 15 : Operates as above to Bucknall Road then Werrington Road, Ash Bank Road, Cellarhead Road, Kingsley Road, A52, Kingsley High Street,
Dovedale Road, Froghall Road, Whiston Road, Ellaston Road, Star Bank, Beelow Lane, Farley Lane, ALTON TOWERS.

ALTON TOWERS - CHEADLE - HANLEY - STOKE 14 / 15ALTON TOWERS TRANSPORT
SDO NSD
15 15 15 15 15 14 14 14
ALTON TOWERS...................................................0425 0640 .... 0920 1225 1545 1800 0015A Notes :
Froghall, Station.................................. 0439 0654 .... 0934 1239 .... .... .... A - Sets down only after Alton Towers
Kingsley.........................................................................0442 0657 .... 0937 1242 .... .... .... B - Continues to Stoke, Church Street 0135
Cellarhead…………………………………………………………..0449 0704 0944 0944 1249 .... .... .... NSD - Not Schooldays
Werrington, Post Office............................0452 0707 0947 0947 1252 .... .... .... SDO - Schooldays only
Oakamoor........................................... .... .... .... .... .... 1556 1810 0026 - Near Rail Station
CHEADLE, High Street................................... .... .... .... .... 1608 1820 0038
Tean, Cross Keys PH.................................... .... .... .... .... 1615 1825 0045
Blythe Bridge, Duke of Wellington...................... .... .... .... .... 1623 1833 0053
Meir, Co-op Store.................................. .... .... .... .... .... 1628 1836 0058
Weston Coyney.......................................... .... .... .... .... 1631 1838 0101
Longton, Police Station................................ .... .... .... .... 1635 1841 0105
Adderley Green, Dividy Road............................ .... .... .... .... 1643 1848 0113
Hanley, Bus Station................................0505 0720 1000 1000 1305 1650 1855 0120
Stoke, Rail Station ...........................0510 0725 1005 1005 1315 1700 1905 0130B
Effective from 1.11.10
Page 26
Monday to Sunday

UTTOXETER - ALTON TOWERS
ALTON TOWERS TRANSPORT
NSu
UTTOXETER, Rail Station ................................0808 0908 1008 1400 1616 1826 Notes : NSu - Not Sundays
Uttoxeter, Bus Station.............................…. …. …. 1402 1618 1828 - Near Rail Station
Rocester, Garage...................................0816 0916 1016 1410 1626 1836
Denstone...........................................0819 0919 1019 1413 1629 1839
Alton, Village.....................................0824 0924 1024 1418 1634 1844
ALTON TOWERS............................................0829 0929 1029 1423 1639 1849
NSu
ALTON TOWERS............................................0735 0835 0935 1330 1550 1800
Alton, Village.....................................0740 0840 0940 1335 1555 1805
Denstone...........................................0745 0845 0945 1340 1600 1810
Rocester, Garage...................................0748 0848 0948 1343 1603 1813
Uttoxeter, Bus Station………………………………..0756 0856 0956 …. …. ….
Uttoxeter, Tesco...................................0758 0858 0958 1351 1611 1821
UTTOXETER, Rail Station ................................0800 0900 1000 1353 1613 1823
Effective from 1.11.10
Page 27
30
Route : UTTOXETER Rail Station, Station Road, Brookside Road, Town Meadows Way, Dove Bank, Uttoxeter Bus Station, Silver Street, Bradley Street,
High Street, Cheadle Road, Ashbourne Road, B5030, Rocester, High Street, Ashbourne Road, B5030 (returns The Dove Way, Dove Bank, Silver Street,
Bus Station), B5031, College Road, Denstone, Alton Road, Denstone Lane, Uttoxeter Road, Lime Kiln Lane, Smithy Bank, New Road, Farley Lane, ALTON
TOWERS.
Monday to Sunday

UTTOXETER - CHEADLE - HANLEY 32 / 32AFIRST POTTERIES
Effective from 3.9.10
Page 28
Route 32 : UTTOXETER, Bus Station, Bradley Street, High Street, Cheadle Road, Ashbourne Road (returns B5030, The Dove Way, Dove Bank, Bradley
Street), Spath, Stramshall, St Michael's Road, A522, Beamhurst, Fole, Checkley, Lower Tean, Upper Tean, High Street, New Road, Cheadle Road, Teanford,
Tean Road, Chapel Street, Bank Street, CHEADLE, High Street, Leek Road, Froghall Road, Shawe Park Road, Kingsley Holt, Holt Lane, Kingsley, High Street,
The Green, A52, Cellarhead, Werrington, Ash Bank Road, Werrington Road, Bucknall Road, Bucknall New Road, Old Hall Street, Lichfield Street, HANLEY Bus
Station.
Service 32A When Alton Towers Theme Park is open all journeys operate via Alton Towers service road.
Route 32A : UTTOXETER, Bus Station, Bradley Street, Silver Street, Dove Bank, Town Meadows Way, Tesco, Town Meadow Way, Uttoxeter Rail Station,
Bridge Street, Church Street, Silver Street, UTTOXETER Bus Station, Bradley Street, High Street, Cheadle Road, Ashbourne Road, B5030 (returns B5030,
Dove Way, Town Meadows Way, Uttoxeter Rail Station, Bridge Street, Chuch Street, Silver Street, Bradley Street), Rocester, High Street, Ashbourne Road,
B5031, Denstone, Denstone Lane, Uttoxeter Road, Lime Kiln Lane, Alton, Smithy Bank, New Road, Farley Lane, Beelow Lane, Star Bank, Oakamoor, Church
Bank, Oakamoor Road, Queen Street, Tape Street, Chapel Street, Bank Street, CHEADLE, High Street then as service 32 to HANLEY Bus Station.
Wheelchair accessible vehicles are normally used on this service

UTTOXETER - CHEADLE - HANLEY 32 / 32AFIRST POTTERIES
32A 32A 32A
NS NS S
UTTOXETER, Bus Station.......................................... .... .... .... .... .... .... .... .... .... .... .... 0903 .... .... .... .... .... 1103
Uttoxeter, Tesco....................................... .... .... .... .... .... .... .... .... .... .... .... 0908 .... .... .... .... .... 1108
Uttoxeter, Rail Station .......................... .... .... .... .... .... .... .... .... .... .... .... 0912 .... .... .... .... .... 1112
UTTOXETER, Bus Station................................. .... .... .... .... 0653 0724 0744 .... .... 0849 .... 0915 0949 .... .... 1049 .... 1115
Rocester, Garage....................................... .... .... .... .... 0703 .... .... .... .... .... .... 0925 .... .... .... .... .... 1125
Denstone, The Tavern................................... .... .... .... .... 0706 .... .... .... .... .... .... 0928 .... .... .... .... .... 1128
Alton, Smithy Bank..................................... .... .... .... .... 0710 .... .... .... .... .... .... 0934 .... .... .... .... .... 1134
Alton Towers, Farley Gates............................. .... .... .... .... 0714 .... .... .... .... .... .... 0938 .... .... .... .... .... 1138
Cotton, Star Crossroads................................ .... .... .... .... 0717 .... .... .... .... .... .... 0941 .... .... .... .... .... 1141
Oakamoor, Churnet Bridge............................... .... .... .... .... 0721 .... .... .... .... .... .... 0945 .... .... .... .... .... 1145
Greendale.......................................... .... .... .... .... .... 0726 .... .... .... .... .... .... 0950 .... .... .... .... .... 1150
Stramshall, Hare & Hounds.............................. .... .... .... .... .... 0730 0750 .... .... 0855 .... .... 0955 .... .... 1055 .... ....
Checkley, Church....................................... .... .... .... .... .... 0739 0759 .... .... 0904 .... .... 1004 .... .... 1104 .... ....
Tean, High Street...................................... .... 0636 0658 .... .... 0743 0803 .... .... 0908 .... .... 1008 .... .... 1108 .... ....
CHEADLE, High Street...............................0547 0616 0644 0708 0713 0733 0753 0813 0833 0858 0918 0938 0958 1018 1038 1058 1118 1138 1158
Kingsley, Royal Oak................................0556 0625 0653 0718 0723 0743 0803 0823 0843 0910 0930 0950 1010 1030 1050 1110 1130 1150 1210
Werrington, Post Office............................0605 0634 0704 0729 0734 0754 0814 0834 0854 0921 0941 1001 1021 1041 1101 1121 1141 1201 1221
HANLEY, Bus Station......................................0616 0645 0720 0745 0750 0810 0830 0850 0910 0937 0957 1017 1037 1057 1117 1137 1157 1217 1237
Notes : NS - Not Saturday
S - Saturday only
- Near Rail Station
Uttoxeter to Cheadle journeys on service 32A are operated under contract to Staffordshire County Council
Effective from 3.9.10
Page 29
Monday to Saturday
Wheelchair accessible vehicles are normally used on this service

UTTOXETER - CHEADLE - HANLEY 32 / 32AFIRST POTTERIES
32A 32A 32A 32A
NS S NS S NS
UTTOXETER, Bus Station.......................................... .... .... .... .... 1303 .... .... .... .... .... .... .... 1503 .... .... .... 1703 .... ....
Uttoxeter, Tesco....................................... .... .... .... .... 1308 .... .... .... .... .... .... .... 1508 .... .... .... 1708 .... ....
Uttoxeter, Rail Station .......................... .... .... .... .... 1312 .... .... .... .... .... .... .... 1512 .... .... .... 1712 .... ....
UTTOXETER, Bus Station.............................1149 .... .... 1249 .... 1315 1349 .... .... 1449 1449 .... .... 1515 1554 .... 1654 1715 …. 1754
Rocester, Garage....................................... .... .... .... .... 1325 .... .... .... .... .... .... .... 1525 .... .... .... 1725 .... ....
Denstone, The Tavern................................... .... .... .... .... 1328 .... .... .... .... .... .... .... 1528 .... .... .... 1728 .... ....
Alton, Smithy Bank..................................... .... .... .... .... 1334 .... .... .... .... .... .... .... 1534 .... .... .... 1734 .... ....
Alton Towers, Farley Gates............................. .... .... .... .... 1338 .... .... .... .... .... .... .... 1538 .... .... .... 1738 1738 ....
Cotton, Star Crossroads................................ .... .... .... .... 1341 .... .... .... .... .... .... .... 1541 .... .... .... 1741 1741 ....
Oakamoor, Churnet Bridge............................... .... .... .... .... 1345 .... .... .... .... .... .... .... 1545 .... .... .... 1745 1745 ....
Greendale.......................................... .... .... .... .... .... 1350 .... .... .... .... .... .... .... 1550 .... .... .... 1750 1750 ....
Stramshall, Hare & Hounds..........................1155 .... .... 1255 .... .... 1355 .... .... 1455 1455 .... .... .... 1600 .... 1700 .... …. 1800
Checkley, Church...................................1204 .... .... 1304 .... .... 1404 .... .... 1504 1504 .... .... .... 1609 .... 1709 .... …. 1809
Tean, High Street..................................1208 .... .... 1308 .... .... 1408 .... .... 1508 1508 .... .... .... 1613 1653 1713 .... …. 1813
CHEADLE, High Street...............................1218 1238 1258 1318 1338 1358 1418 1438 1458 1518 1518 1543 1543 1558 1633 1703 1733 1758 1758 1823
Kingsley, Royal Oak................................1230 1250 1310 1330 1350 1410 1430 1450 1510 1528 1530 1553 1555 1610 1645 1715 1745 1810 1810 1833
Werrington, Post Office............................1241 1301 1321 1341 1401 1421 1441 1501 1521 1539 1541 1604 1606 1621 1656 1726 1756 1821 1821 1844
HANLEY, Bus Station......................................1257 1317 1337 1357 1417 1437 1457 1517 1537 1557 1557 1622 1622 1637 1712 1739 1812 1837 1837 1900
Notes : NS - Not Saturday
S - Saturday only
- Near Rail Station
Uttoxeter to Cheadle journeys on service 32A are operated under contract to Staffordshire County Council
Effective from 3.9.10
Page 30
Monday to Saturday
Wheelchair accessible vehicles are normally used on this service

UTTOXETER - CHEADLE - HANLEY 32 / 32AFIRST POTTERIES
32A 32A 32A 32A SCR SCR 32A
S NS S NS S NS
UTTOXETER, Bus Station.......................................... 1809 1809 .... .... .... 1954 1954 .... .... …. .... Uttoxeter, Tesco....................................... 1813 1813 .... .... .... 1958 1958 .... .... …. ....
Uttoxeter, Rail Station .......................... 1815 1815 .... .... .... 2000 2000 .... .... …. ....
UTTOXETER, Bus Station.............................1754 1820 1820 1852 1857 1952 2005 2005 .... .... …. 2310
Rocester, Garage....................................... 1830 1830 .... .... .... 2015 2015 .... .... …. 2322
Denstone, The Tavern................................... 1833 1833 .... .... .... 2018 2018 .... .... …. 2325
Alton, Smithy Bank..................................... 1839 1839 .... .... .... 2024 2024 .... .... …. 2330
Alton Towers, Farley Gates............................. 1843 1843 .... .... .... 2028 2028 .... .... …. 2334
Cotton, Star Crossroads................................ 1846 1846 .... .... .... 2031 2031 .... .... …. 2337
Oakamoor, Churnet Bridge............................... 1850 1850 .... .... .... 2035 2035 .... .... …. 2341
Greendale.......................................... .... 1855 1855 .... .... .... 2040 2040 .... .... …. 2346
Stramshall, Hare & Hounds..........................1800 .... .... 1857 1903 1957 .... .... .... .... …. ....
Checkley, Church...................................1809 .... .... 1906 1912 2006 .... .... .... .... …. ....
Tean, High Street..................................1813 .... .... 1910 1916 2010 .... .... 2110 2139 2311 ....
CHEADLE, High Street...............................1823 1903 1903 1920 1926 2020 2048 2048 2120 2147 2321 2354
Kingsley, Royal Oak.................................... 1913 1915 1930 .... 2030 2057 .... 2130 .... 2331 ....
Werrington, Post Office................................ 1924 1926 1941 .... 2041 2106 .... 2141 .... …. ....
HANLEY, Bus Station.......................................... 1940 1942 1952 .... 2052 2117 .... 2157 .... …. ....
Notes : NS - Not Saturday
S - Saturday only
SCR - Operated by Scraggs (2110 journey operated by First Potteries on Saturdays)
- Near Rail Station
Uttoxeter to Cheadle journeys on service 32A are operated under contract to Staffordshire County Council
Effective from 3.9.10
Page 31
Monday to Saturday
Wheelchair accessible vehicles are normally used on this service

HANLEY - CHEADLE - UTTOXETER 32 / 32AFIRST POTTERIES
32A 32A 32A 32A 32A
NS S NS S NS S NS NS S S NS
HANLEY, Bus Station.......................................... .... 0645 0647 0706 0725 0724 0741 0749 0813 0821 0844 0904 0924 0924 0944 1004 1024 1044
Werrington, Post Office................................ .... 0658 0657 0719 0738 0737 0754 0802 0826 0834 0857 0917 0937 0937 0957 1017 1037 1057
Kingsley, Royal Oak.................................... .... 0708 0707 0729 0746 0747 0804 0812 0842 0844 0907 0927 0947 0947 1007 1027 1047 1107
CHEADLE, High Street...............................0626 0638 0717 0717 0740 0755 0758 0813 0823 0853 0853 0918 0938 0958 1000 1018 1038 1058 1118
Tean, High Street..................................0634 .... 0725 0725 .... .... 0806 0821 .... .... …. 0926 .... .... .... 1026 .... .... 1126
Checkley, Church...................................0637 .... 0728 0728 .... .... 0809 0824 .... .... …. 0929 .... .... .... 1029 .... .... 1129
Stramshall, Hare & Hounds..........................0646 .... 0737 0737 .... .... 0818 0833 .... .... …. 0938 .... .... .... 1038 .... .... 1138
Greendale.......................................... .... 0646 .... .... 0748 0803 .... …. .... .... …. .... .... 1006 1006 .... .... .... ....
Oakamoor, Churnet Bridge............................... 0650 .... .... 0752 0807 .... …. .... .... …. .... .... 1010 1009 .... .... .... ....
Cotton, Star Crossroads................................ 0654 .... .... 0756 0811 .... …. .... .... …. .... .... 1014 1013 .... .... .... ....
Alton Towers, Farley Gates............................. 0658 .... .... 0800 0815 .... …. .... .... …. .... .... 1018 1017 .... .... .... ....
Alton, Smithy Bank..................................... 0704 .... .... 0806 0821 .... …. .... .... …. .... .... 1024 1022 .... .... .... ....
Denstone, The Tavern................................... 0710 .... .... 0812 0827 .... …. .... .... …. .... .... 1030 1028 .... .... .... ....
Rocester, The Garage................................... 0713 .... .... 0815 0830 .... …. .... .... …. .... .... 1033 1031 .... .... .... ....
Uttoxeter, Tesco....................................... 0719 .... .... 0821 0836 .... …. .... .... …. .... .... 1039 1040 .... .... .... ....
Uttoxeter, Rail Station .......................... .... .... .... 0823 0838 .... …. .... .... …. .... .... 1041 1043 .... .... .... ....
UTTOXETER, Bus Station......................................0653 0724 0744 0744 0829 0844 0825 0840 .... .... …. 0945 .... 1047 1049 1045 .... .... 1145
Notes : NS - Not Saturday
S - Saturday only
- Near Rail Station
Cheadle to Uttoxeter journeys on service 32A are operated under contract to Staffordshire County Council
Effective from 3.9.10
Page 32
Monday to Saturday
Wheelchair accessible vehicles are normally used on this service

HANLEY - CHEADLE - UTTOXETER 32 / 32AFIRST POTTERIES
32A 32A 32A 32A 32A 32A
S NS S NS
HANLEY, Bus Station......................................1104 1124 1124 1144 1204 1224 1244 1304 1324 1324 1344 1404 1424 1444 1509 1529 1549 1609 1629
Werrington, Post Office............................1117 1137 1137 1157 1217 1237 1257 1317 1337 1337 1357 1417 1437 1457 1522 1542 1602 1622 1642
Kingsley, Royal Oak................................1127 1147 1147 1207 1227 1247 1307 1327 1347 1347 1407 1427 1447 1507 1532 1552 1612 1632 1652
CHEADLE, High Street...............................1138 1158 1200 1218 1238 1258 1318 1338 1358 1400 1418 1438 1458 1518 1543 1603 1623 1643 1703
Tean, High Street...................................... .... .... 1226 .... .... 1326 .... .... .... 1426 .... .... 1526 .... .... 1631 1651 ....
Checkley, Church....................................... .... .... 1229 .... .... 1329 .... .... .... 1429 .... .... 1529 .... .... 1634 .... ....
Stramshall, Hare & Hounds.............................. .... .... 1238 .... .... 1338 .... .... .... 1438 .... .... 1538 .... .... 1643 .... ....
Greendale.......................................... .... 1206 1208 .... .... .... .... .... 1406 1408 .... .... .... .... .... 1611 .... .... 1711
Oakamoor, Churnet Bridge............................... 1210 1212 .... .... .... .... .... 1410 1412 .... .... .... .... .... 1615 .... .... 1715
Cotton, Star Crossroads................................ 1214 1216 .... .... .... .... .... 1414 1416 .... .... .... .... .... 1619 .... .... 1719
Alton Towers, Farley Gates............................. 1218 1220 .... .... .... .... .... 1418 1420 .... .... .... .... .... 1623 .... .... 1723
Alton, Smithy Bank..................................... 1224 1226 .... .... .... .... .... 1424 1426 .... .... .... .... .... 1629 .... .... 1729
Denstone, The Tavern................................... 1230 1232 .... .... .... .... .... 1430 1432 .... .... .... .... .... 1635 .... .... 1735
Rocester, The Garage................................... 1233 1235 .... .... .... .... .... 1433 1435 .... .... .... .... .... 1638 .... .... 1738
Uttoxeter, Tesco....................................... 1239 1241 .... .... .... .... .... 1439 1441 .... .... .... .... .... 1644 .... .... 1744
Uttoxeter, Rail Station .......................... 1241 1243 .... .... .... .... .... 1441 1443 .... .... .... .... .... 1646 .... .... 1746
UTTOXETER, Bus Station.......................................... 1247 1249 1245 .... .... 1345 .... 1447 1449 1445 .... .... 1545 .... 1652 1650 .... 1752
Notes : NS - Not Saturday
S - Saturday Only
- Near Rail Station
Cheadle to Uttoxeter journeys on service 32A are operated under contract to Staffordshire County Council
Effective from 3.9.10
Page 33
Monday to Saturday
Wheelchair accessible vehicles are normally used on this service
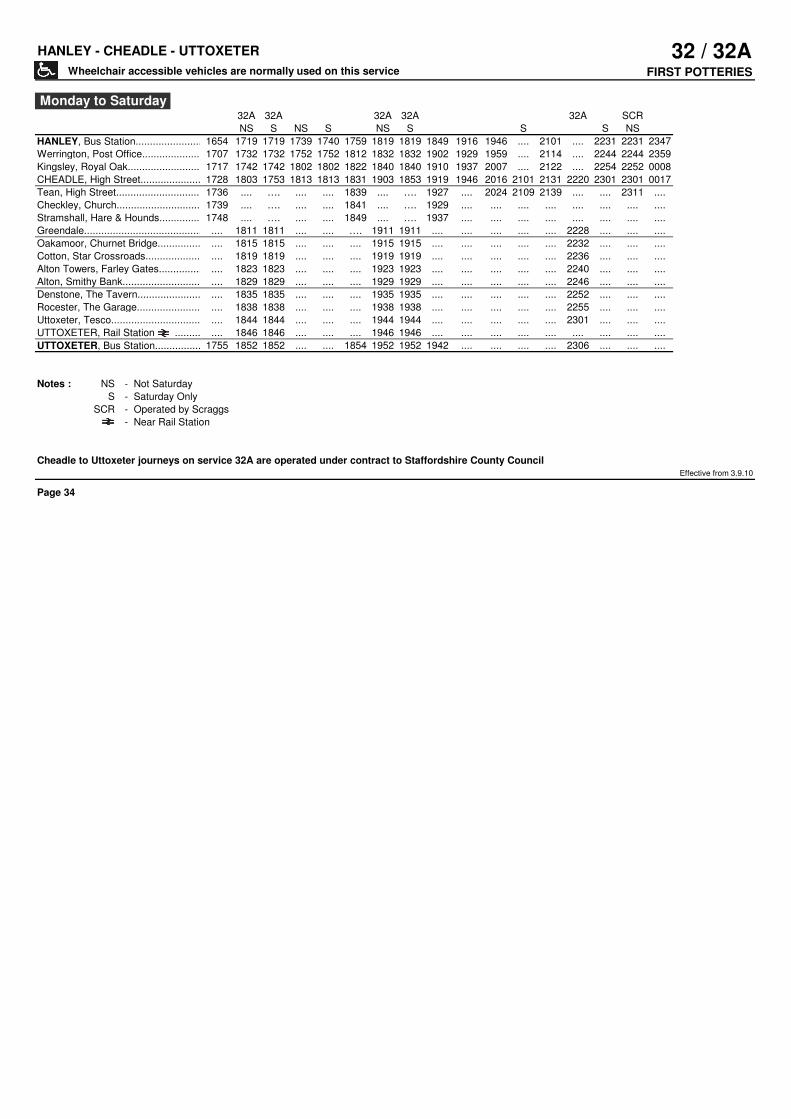
HANLEY - CHEADLE - UTTOXETER 32 / 32AFIRST POTTERIES
32A 32A 32A 32A 32A SCR
NS S NS S NS S S S NS
HANLEY, Bus Station......................................1654 1719 1719 1739 1740 1759 1819 1819 1849 1916 1946 .... 2101 .... 2231 2231 2347
Werrington, Post Office............................1707 1732 1732 1752 1752 1812 1832 1832 1902 1929 1959 .... 2114 .... 2244 2244 2359
Kingsley, Royal Oak................................1717 1742 1742 1802 1802 1822 1840 1840 1910 1937 2007 .... 2122 .... 2254 2252 0008
CHEADLE, High Street...............................1728 1803 1753 1813 1813 1831 1903 1853 1919 1946 2016 2101 2131 2220 2301 2301 0017
Tean, High Street..................................1736 .... …. .... .... 1839 .... …. 1927 .... 2024 2109 2139 .... .... 2311 ....
Checkley, Church...................................1739 .... …. .... .... 1841 .... …. 1929 .... .... .... .... .... .... .... ....
Stramshall, Hare & Hounds..........................1748 .... …. .... .... 1849 .... …. 1937 .... .... .... .... .... .... .... ....
Greendale.......................................... .... 1811 1811 .... .... …. 1911 1911 .... .... .... .... .... 2228 .... .... ....
Oakamoor, Churnet Bridge............................... 1815 1815 .... .... .... 1915 1915 .... .... .... .... .... 2232 .... .... ....
Cotton, Star Crossroads................................ 1819 1819 .... .... .... 1919 1919 .... .... .... .... .... 2236 .... .... ....
Alton Towers, Farley Gates............................. 1823 1823 .... .... .... 1923 1923 .... .... .... .... .... 2240 .... .... ....
Alton, Smithy Bank..................................... 1829 1829 .... .... .... 1929 1929 .... .... .... .... .... 2246 .... .... ....
Denstone, The Tavern................................... 1835 1835 .... .... .... 1935 1935 .... .... .... .... .... 2252 .... .... ....
Rocester, The Garage................................... 1838 1838 .... .... .... 1938 1938 .... .... .... .... .... 2255 .... .... ....
Uttoxeter, Tesco....................................... 1844 1844 .... .... .... 1944 1944 .... .... .... .... .... 2301 .... .... ....
UTTOXETER, Rail Station ......................... 1846 1846 .... .... .... 1946 1946 .... .... .... .... .... .... .... .... ....
UTTOXETER, Bus Station......................................1755 1852 1852 .... .... 1854 1952 1952 1942 .... .... .... .... 2306 .... .... ....
Notes : NS - Not Saturday
S - Saturday Only
SCR - Operated by Scraggs
- Near Rail Station
Cheadle to Uttoxeter journeys on service 32A are operated under contract to Staffordshire County Council
Effective from 3.9.10
Page 34
Monday to Saturday
Wheelchair accessible vehicles are normally used on this service

UTTOXETER - CHEADLE - HANLEY 32 / 32AFIRST POTTERIES
32A 32A 32A 32A 32A
UTTOXETER, Bus Station.......................................... .... 1053 .... 1253 .... 1453 .... 1653 ....
Uttoxeter, Tesco....................................... .... 1058 .... 1258 .... 1458 .... 1658 ....
Uttoxeter, Rail Station .......................... .... .... .... .... .... 1500 .... 1700 ....
UTTOXETER, Bus Station.............................0903 .... 1103 .... 1303 .... 1503 .... 1703 1855A
Rocester, Garage...................................0916 .... 1116 .... 1316 .... 1516 .... 1716 ....
Denstone, The Tavern...............................0919 .... 1119 .... 1319 .... 1519 .... 1719 ....
Alton, Smithy Bank.................................0923 .... 1123 .... 1323 .... 1523 .... 1723 ....
Alton Towers, Farley Gates.........................0927 .... 1127 .... 1327 .... 1527 .... 1727 ....
Cotton, Star Crossroads............................0930 .... 1130 .... 1330 .... 1530 .... 1730 ....
Oakamoor, Churnet Bridge...........................0934 .... 1134 .... 1334 .... 1534 .... 1734 ....
Greendale.......................................... 0939 .... 1139 .... 1339 .... 1539 .... 1739 ....
CHEADLE, High Street...............................0956 1056 1156 1256 1356 1456 1556 1656 1756 1921
Kingsley, Royal Oak................................1005 1105 1205 1305 1405 1505 1605 1705 1805 1930
Werrington, Post Office............................1014 1114 1214 1314 1414 1514 1614 1714 1814 1939
HANLEY, Bus Station......................................1025 1125 1225 1325 1425 1525 1625 1725 1825 1950
Notes : A - Operates via Stramshall, Hare & Hounds 1900, Checkley Church 1909 and Tean High Street 1913
- Near Rail Station
Uttoxeter to Cheadle journeys on service 32A are operated under contract to Staffordshire County Council
Effective from 3.9.10
Page 35
Sunday and Bank Holiday Monday
Wheelchair accessible vehicles are normally used on this service

HANLEY - CHEADLE - UTTOXETER 32 / 32AFIRST POTTERIES
32A 32A 32A 32A 32A
HANLEY, Bus Station.......................................... 0926 1126 1226 1326 1426 1526 1626 1736 2046
Werrington, Post Office................................ 0939 1139 1239 1339 1439 1539 1639 1749 2059
Kingsley, Royal Oak.................................... 0947 1147 1247 1347 1447 1547 1647 1757 2107
CHEADLE, High Street...............................0840A 1001 1201 1256 1401 1456 1601 1656 1806 2116
Greendale.......................................... .... 1007 1207 .... 1407 .... 1607 .... 1812 ....
Oakamoor, Churnet Bridge............................... 1010 1210 .... 1410 .... 1610 .... 1815 ....
Cotton, Star Crossroads................................ 1014 1214 .... 1414 .... 1614 .... 1819 ....
Alton Towers, Farley Gates............................. 1018 1218 .... 1418 .... 1618 .... 1823 ....
Alton, Smithy Bank..................................... 1023 1223 .... 1423 .... 1623 .... 1828 ....
Denstone, The Tavern................................... 1029 1229 .... 1429 .... 1629 .... 1834 ....
Rocester, The Garage................................... 1032 1232 .... 1432 .... 1632 .... 1837 ....
Uttoxeter, Tesco....................................... 1041 1241 .... 1441 .... 1641 .... 1846 ....
Uttoxeter, Rail Station .......................... .... .... .... 1443 .... 1643 .... 1848 ....
UTTOXETER, Bus Station......................................0902 1049 1249 .... 1449 .... 1649 .... 1854 ....
Notes : A - Operates via Tean High Street 0846, Checkley Church 0849 and Stramshall, Hare & Hounds 0857
- Near Rail Station
Cheadle to Uttoxeter journeys on service 32A are operated under contract to Staffordshire County Council
Effective from 3.9.10
Page 36
Sunday and Bank Holiday Monday
Wheelchair accessible vehicles are normally used on this service
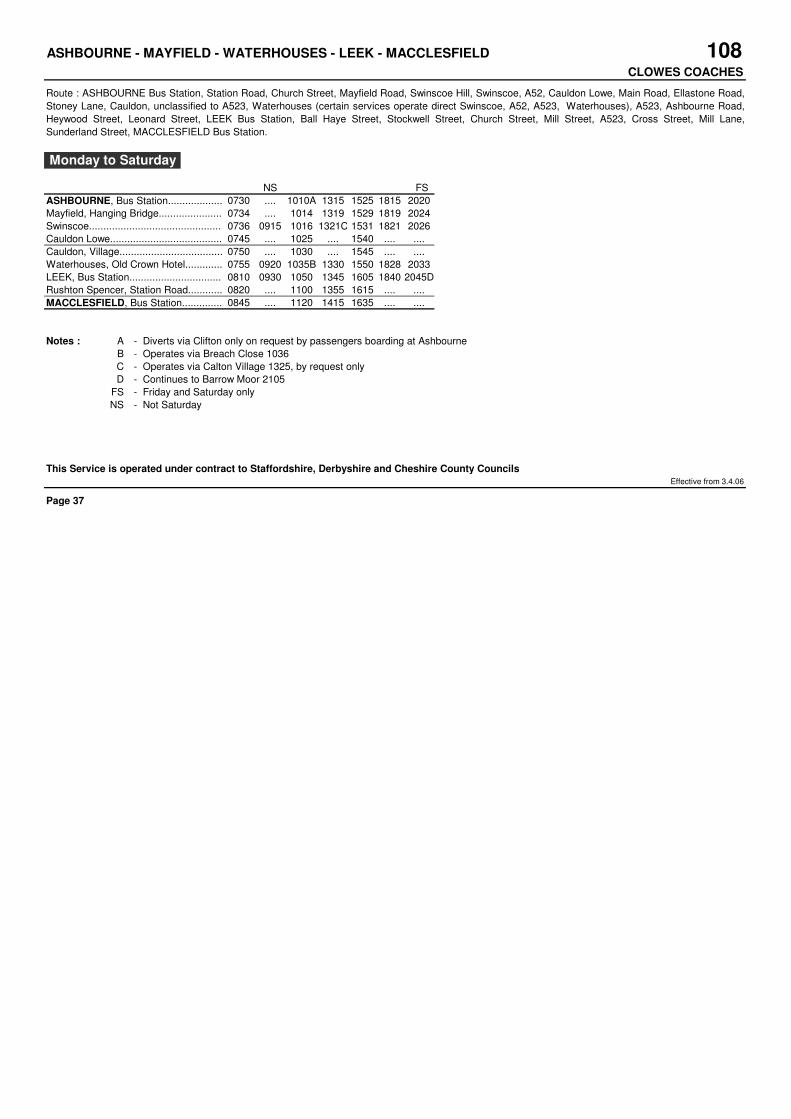
ASHBOURNE - MAYFIELD - WATERHOUSES - LEEK - MACCLESFIELD
CLOWES COACHES
NS FS
ASHBOURNE, Bus Station......................................0730 .... 1010A 1315 1525 1815 2020
Mayfield, Hanging Bridge...........................0734 .... 1014 1319 1529 1819 2024
Swinscoe...............................................................................0736 0915 1016 1321C 1531 1821 2026
Cauldon Lowe...........................................................................0745 .... 1025 .... 1540 .... ....
Cauldon, Village...........................................................................0750 .... 1030 .... 1545 .... ....
Waterhouses, Old Crown Hotel.......................0755 0920 1035B 1330 1550 1828 2033
LEEK, Bus Station..................................0810 0930 1050 1345 1605 1840 2045D
Rushton Spencer, Station Road......................0820 .... 1100 1355 1615 .... ....
MACCLESFIELD, Bus Station......................................0845 .... 1120 1415 1635 .... ....
Notes : A - Diverts via Clifton only on request by passengers boarding at Ashbourne
B - Operates via Breach Close 1036
C - Operates via Calton Village 1325, by request only
D - Continues to Barrow Moor 2105
FS - Friday and Saturday only
NS - Not Saturday
This Service is operated under contract to Staffordshire, Derbyshire and Cheshire County Councils
Effective from 3.4.06
Page 37
108
Monday to Saturday
Route : ASHBOURNE Bus Station, Station Road, Church Street, Mayfield Road, Swinscoe Hill, Swinscoe, A52, Cauldon Lowe, Main Road, Ellastone Road,
Stoney Lane, Cauldon, unclassified to A523, Waterhouses (certain services operate direct Swinscoe, A52, A523, Waterhouses), A523, Ashbourne Road,
Heywood Street, Leonard Street, LEEK Bus Station, Ball Haye Street, Stockwell Street, Church Street, Mill Street, A523, Cross Street, Mill Lane,
Sunderland Street, MACCLESFIELD Bus Station.

MACCLESFIELD - LEEK - WATERHOUSES - MAYFIELD - ASHBOURNE
CLOWES COACHES
NS FS
MACCLESFIELD, Bus Station.......................................... .... 0910 1205 1415 1635 1920
Rushton Spencer, Station Road.......................... .... 0925 1220 1430 1650 1935
LEEK, Bus Station..................................0705A .... 0940 1235E 1445 1705 1950
Waterhouses, Old Crown Hotel.......................0717 0910B 0952C 1247 1457 1717 2002
Cauldon, Village............................................................................... .... .... 1252 1500 1720 ....
Cauldon Lowe............................................................................... .... .... 1257 1504 1724 ....
Swinscoe...............................................................................0720 0915 1000 1300 1509 1728 2005
Mayfield, Hanging Bridge...........................0726 .... 1005D 1311 1516 1736 2011
ASHBOURNE, Bus Station......................................0730 .... 1010 1315 1520 1740 2015
Notes : A - Commences from Barrow Moor 0645
B - Commences from Leek Hospital 0900
C - Operates via Calton Village 0956
D - Operates via Clifton 1007
E - Operates via Breach Close 1245
FS - Friday and Saturday only
NS - Not Saturday
This Service is operated under contract to Staffordshire, Derbyshire and Cheshire County Councils
Effecitve from 3.4.06
Page 38
108
Monday to Saturday

DERBY - ASHBOURNE - LEEK - MACCLESFIELD - STOCKPORT
TM TRAVEL / BAKERS COACHES
TMT BAK TMT BAK TMT BAK
DERBY, Rail Station ..............................0955 .... 1255 .... 1555 .... Notes : BAK - Operated by Bakers Coaches
Derby, Bus Station................................. 1000 .... 1300 .... 1600 .... TMT - Operated by TM Travel
Mackworth, Mundy Arms..............................1010 .... 1310 .... 1610 .... - Near Rail Station
Kirk Langley, Post Office..........................1013 .... 1313 .... 1613 ....
Brailsford, Rose & Crown...........................1016 .... 1316 .... 1616 ....
Ashbourne, Hilltop................................. 1025 .... 1325 .... 1625 ....
ASHBOURNE, Bus Station.............................1035 .... 1335 .... 1635 ....
Waterhouses, Old Crown Hotel.......................1050 .... 1350 .... 1650 ....
LEEK, Bus Station..................................1105 1110 1405 1410 1705 1710
Rushton Spencer, Station Road.......................... 1120 .... 1420 .... 1720
Bosley Lakeside, Post Office........................... 1125 .... 1425 .... 1725
Oakgrove, Fools Nook................................... 1133 .... 1433 .... 1733
Lyme Green, London Avenue.............................. 1137 .... 1437 .... 1737
MACCLESFIELD, Bus Station.............................. 1142 .... 1442 .... 1742
Poynton, Church.................................... .... 1214 .... 1514 .... 1814
STOCKPORT, Bus Station........................................... 1235 .... 1535 .... 1835
This Service is operated under contract to Staffordshire, Derbyshire and Cheshire County Councils BAK - effective from 7.9.08
TMT - effective from 23.3.08
Page 39
Route : DERBY Rail Station, Railway Terrace, Derby Bus Station, Morledge, Albert Street, Victoria Street, Wardwick, Friar Gate, Ashbourne Road, Derby
Road, Compton Street, ASHBOURNE Bus Station, A52, Mayfield Road, Swinscoe Hill, A523, Waterhouses, Ashbourne Road, Haywood Street, Leonard
Street, LEEK Bus Station, Ashbourne Road, Ball Haye Street, Stockwell Street, Church Street, Mill Street, Macclesfield Road, Rushton Spencer, A523,
London Road, Cross Street, Mill Lane, Mill Street, MACCLESFIELD Bus Station, Mill Street, Silk Road, Beech Lane, Manchester Road, Tytherington Lane,
Bollington Road, Henshall Road, Wellington Road, Palmerston Street, Shrigley Road, Pedley Hill, Wood Lane South, Wood Lane West, Waterloo Road,
Park Lane, Macclesfield Road, A6, Wellington Road South, STOCKPORT Bus Station.
108
Sunday and Bank Holiday Monday

STOCKPORT - MACCLESFIELD - LEEK - ASHBOURNE - DERBY
TM TRAVEL / BAKERS COACHES
BAK TMT BAK TMT BAK TMT
STOCKPORT, Bus Station.......................................0940 .... 1240 .... 1540 .... Notes : BAK - Operated by Bakers Coaches
Hazel Grove, Rising Sun............................0953 .... 1253 .... 1553 .... TMT - Operated by TM Travel
MACCLESFIELD, Bus Station..........................1035 .... 1335 .... 1635 .... - Near Rail Station
Lyme Green, London Avenue..........................1038 .... 1338 .... 1638 ....
Oakgrove, Fools Nook...............................1042 .... 1342 .... 1642 ....
Bosley Lakeside, Post Office.......................1045 .... 1345 .... 1645 ....
Rushton Spencer, Station Road......................1050 .... 1350 .... 1650 ....
LEEK, Bus Station..................................1105 1110 1405 1410 1705 1710
Waterhouses, Old Crown Hotel........................... 1125 .... 1425 .... 1725
ASHBOURNE, Bus Station................................. 1150 .... 1450 .... 1745
Ashbourne, Hilltop................................. .... 1153 .... 1453 .... 1748
Brailsford, Rose & Crown............................... 1202 .... 1502 .... 1757
Kirk Langley, Post Office.......................... .... 1205 .... 1505 .... 1800
Mackworth, Mundy Arms.................................. 1208 .... 1508 .... 1803
Derby, Bus Station................................. .... 1218 .... 1518 .... 1813
DERBY, Rail Station .................................. 1220 .... 1520 .... 1815
This Service is operated under contract to Staffordshire, Derbyshire and Cheshire County Councils BAK - effective from 7.9.08
TMT - effective from 23.3.08
Page 40
Sunday and Bank Holiday Monday
108

CHEADLE TOWN SERVICE
D&G COACHES
CHEADLE, Derwent Drive....................................0927 1027 1127 1227 1327
Moorcroft Close....................................0932 1032 1132 1232 1332
Attlee Road........................................0935 1035 1135 1235 1335
CHEADLE, High Street...............................0940 1040 1140 1240 1340
Windermere Way.....................................0948 1048 1148 1248 1348
Weaver Close.......................................0952 1052 1152 1252 1352
CHEADLE, High Street...............................1000 1100 1200 1300 1400
Well Street, Morrisons.........................…………1002 1102 1202 1302 1402
Lightwood, Thorley Drive...........................1008 1108 1208 1308 1408
Well Street, Morrisons.............................1013 1113 1213 1313 1413
Cheadle, High Street...............................1015 1115 1215 1315 1415
Mill Road………………………………………………………..1018 1118 1218 1318 1418
CHEADLE, Derwent Drive....................................1025 1125 1225 1325 1425
This Service is operated under contract to Staffordshire County Council
Effective from 2.11.09
Page 41
123
Monday to Saturday
Route : CHEADLE, Derwent Drive (Southbound), Manifold Drive, Rakeway Road, Park Avenue, Tean Road, Wedgwood Road, Moorcroft Close, Wedgwood
Road, Tean Road, Attlee Road, Station Road, Tean Road, Chapel Street, Bank Street, HIGH STREET, Tape Street, Queen Street, Silverstone Avenue,
Oulton Road, Goodwood Avenue, Shelsley Road, Silverstone Avenue, Oakamoor Road, Rudyard Way, Ullswater Drive, Windermere Way, Ness Grove,
Froghall Road, Thorpe Rise, Weaver Close, Thorpe Rise, Froghall Road, Churchill Road, Harborne Road, Leek Road, Butlers Hill, Tape Street, Chapel Street,
Bank Street, HIGH STREET, Cross Street, Chapel Street, Well Street, Ashbourne Road, Kingfisher Crescent, Hawfinch Road, Ashbourne Road, Thorley Drive
(Eastbound), Ashbourne Road, Well Street, Chapel Street, Bank Street, HIGH STREET, Cross Street, Chapel Street, Tean Road, Mill Road, Rakeway Road,
Manifold Drive, CHEADLE, Derwent Drive (Southbound).
Sundays and Bank Holiday Mondays : No Service

WESTON COYNEY - BLYTHE BRIDGE - CHEADLE - UTTOXETER
PHIL SMITH TRAVEL
WESTON COYNEY, Post Office......................................0923 UTTOXETER, Bus Station......................................1300
Cookshill, Auctioneers Arms.........................................................................0926 Denstone, The Tavern.........................................................................1312
Blythe Bridge, Creda Roundabout.......................................................................0930 Hollington, Church.........................................................................1325
Cresswell, Rookery Crescent.........................................................................0935 Freehay, Crossroads.........................................................................1335
Draycott-in-the-Moors, New Plough.....................................................................0938 CHEADLE, High Street.........................................................................1345
Blythe Bridge, Duke of Wellington.....................................................................0940A Boundary, Crossroads.........................................................................1350A
Boundary, Crossroads.........................................................................0945 Blythe Bridge, Duke of Wellington.....................................................................1355
CHEADLE, High Street.........................................................................0950 Draycott-in-the-Moors, New Plough.....................................................................1357
Freehay, Crossroads.........................................................................0955 Cresswell, Rookery Crescent.........................................................................1400
Hollington, Church...........................................................................1005 Blythe Bridge, Creda Roundabout.......................................................................1405
Denstone, The Tavern.........................................................................1018 Cookshill, Auctioneers Arms.........................................................................1409
UTTOXETER, Bus Station......................................1030 WESTON COYNEY, Post Office......................................1412
Note : A - Diverts to Dilhorne, Royal Oak by prior arrangement only on (01889) 560600
This Service is operated under contract to Staffordshire County Council
Effective from 10.9.08
Page 42
184
Route : WESTON COYNEY, Caverswall Road, Cookshill, School Lane, Caverswall Lane, Catchems Corner, Uttoxeter Road, Grindley Lane, A50 Uttoxeter
Road, Draycott-in-the-Moors, Cresswell Lane, Cresswell(turn), Cresswell Lane, Draycott-in-the-Moors, Uttoxeter Road, Blythe Bridge, A521, Cheadle Road,
Forsbrook, Cheadle Road, Town End, CHEADLE, High Street, Tape Street, Tean Road, Park Avenue, Rakeway Road, unclassified to Freehay, Winnothdale,
Hollington, Denstone, B5030, Ashbourne Road, Cheadle Road, High Street, Bradley Street, UTTOXETER, Bus Station.
Wednesday only
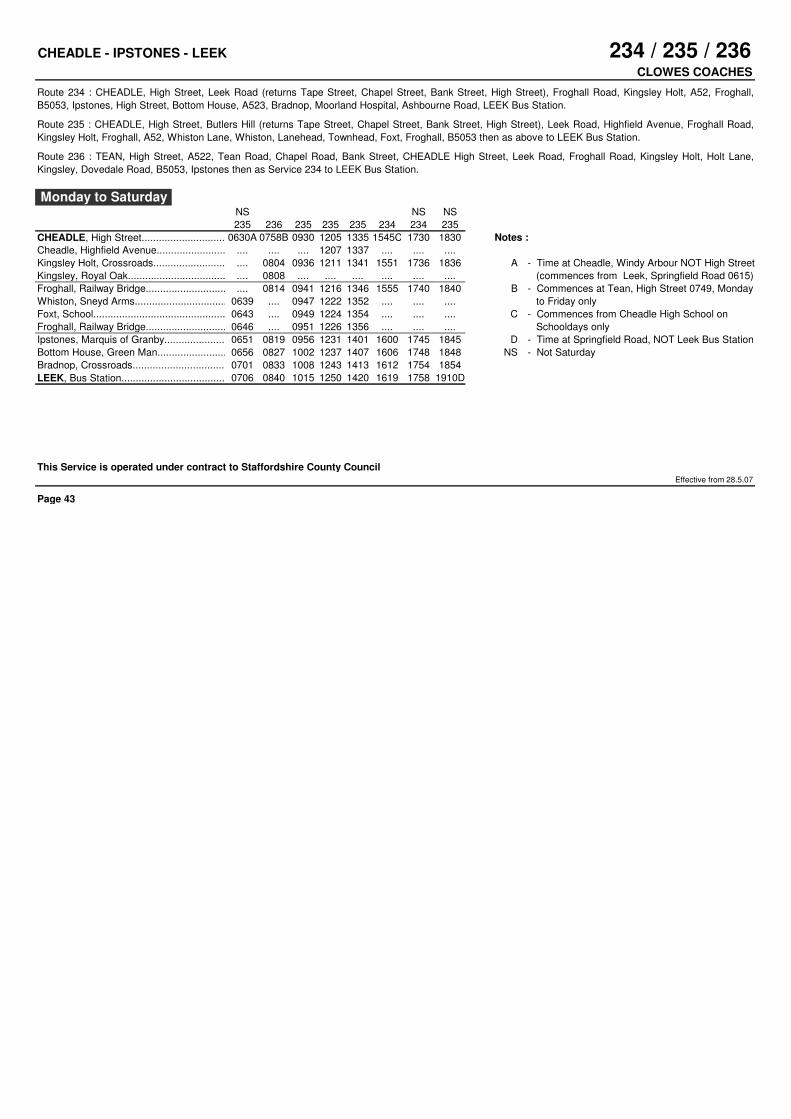
CHEADLE - IPSTONES - LEEK
CLOWES COACHES
NS NS NS
235 236 235 235 235 234 234 235
CHEADLE, High Street......................................0630A 0758B 0930 1205 1335 1545C 1730 1830 Notes :
Cheadle, Highfield Avenue.......................... .... .... .... 1207 1337 .... .... ....
Kingsley Holt, Crossroads.......................... .... 0804 0936 1211 1341 1551 1736 1836 A - Time at Cheadle, Windy Arbour NOT High Street
Kingsley, Royal Oak............................................................................. 0808 .... .... .... .... .... .... (commences from Leek, Springfield Road 0615)
Froghall, Railway Bridge............................................................................ 0814 0941 1216 1346 1555 1740 1840 B - Commences at Tean, High Street 0749, Monday
Whiston, Sneyd Arms................................ 0639 .... 0947 1222 1352 .... .... .... to Friday only
Foxt, School............................................................................0643 .... 0949 1224 1354 .... .... .... C - Commences from Cheadle High School on
Froghall, Railway Bridge........................................................................0646 .... 0951 1226 1356 .... .... .... Schooldays only
Ipstones, Marquis of Granby........................0651 0819 0956 1231 1401 1600 1745 1845 D - Time at Springfield Road, NOT Leek Bus Station
Bottom House, Green Man............................0656 0827 1002 1237 1407 1606 1748 1848 NS - Not Saturday
Bradnop, Crossroads........................................................................0701 0833 1008 1243 1413 1612 1754 1854
LEEK, Bus Station......................................0706 0840 1015 1250 1420 1619 1758 1910D
This Service is operated under contract to Staffordshire County Council Effective from 28.5.07
Page 43
234 / 235 / 236
Monday to Saturday
Route 234 : CHEADLE, High Street, Leek Road (returns Tape Street, Chapel Street, Bank Street, High Street), Froghall Road, Kingsley Holt, A52, Froghall,
B5053, Ipstones, High Street, Bottom House, A523, Bradnop, Moorland Hospital, Ashbourne Road, LEEK Bus Station.
Route 236 : TEAN, High Street, A522, Tean Road, Chapel Road, Bank Street, CHEADLE High Street, Leek Road, Froghall Road, Kingsley Holt, Holt Lane,
Kingsley, Dovedale Road, B5053, Ipstones then as Service 234 to LEEK Bus Station.
Route 235 : CHEADLE, High Street, Butlers Hill (returns Tape Street, Chapel Street, Bank Street, High Street), Leek Road, Highfield Avenue, Froghall Road,
Kingsley Holt, Froghall, A52, Whiston Lane, Whiston, Lanehead, Townhead, Foxt, Froghall, B5053 then as above to LEEK Bus Station.

LEEK - IPSTONES - CHEADLE
CLOWES COACHES
NS S NS NS
236 236 235 235 234 235 236 235
LEEK, Bus Station......................................0715 0730B 0844 1125 1305 1420 1640 1759 Notes :
Bradnop, Crossroads..........................................................................0719 0734 0849 1130 1310 1425 1645 1804
Bottom House, Green Man............................0724 0740 0855 1136 1316 1431 1651 1810 A - Continues to Tean, High Street 0747
Ipstones, Marquis of Granby........................0727 0745 0858 1139 1321 1434 1656 1813 B - Time at Springfield Road, NOT Leek Bus Station
Froghall, Railway Bridge..........................................................................0730 0750 0902 1143 1326 1438 1701 1820 C - Continues to Tean, High Street 1720
Foxt, School................................................................................ .... 0907 1148 .... 1443 .... R NS - Not Saturday
Whiston, Sneyd Arms................................ .... .... 0912 1153 .... 1448 .... R R - Serves these stops by request only
Froghall, Railway Bridge.............................................................................. .... 0915 1156 .... 1451 .... .... S - Saturday only
Kingsley, Royal Oak.............................................................................. .... .... .... .... .... 1706 ....
Kingsley Holt, Crossroads.......................... 0732 0754 0917 1158 1328 1453 1710 1825
Cheadle, Highfield Avenue.......................... .... .... 0919 1200 .... .... .... ....
CHEADLE, High Street......................................0738A 0758 0922 1203 1333 1458 1715C 1830
This Service is operated under contract to Staffordshire County Council
Effective from 28.5.07
Page 44
Sundays and Bank Holidays : No Service
Monday to Saturday
234 / 235 / 236

SHARPLEY HEATH - CHURCH LEIGH - UTTOXETER PARAGON TRAVEL
UTTOXETER - CHURCH LEIGH Circular PARAGON TRAVEL
W S W S
411 248 411 248
UTTOXETER, Bus Station.........................................................................................0900 .... UTTOXETER, Bus Station.........................................................................................1235 1305
Bramshall, Stores.....................................................................................0905 .... Uttoxeter, Byrds Lane.................................................................................1240 1308
Field.................................................................................................0915 .... Bramshall, Robin Hood.................................................................................1245 1312
Fradswell...........................................................................................0920 .... Withington…………........................................................................................1252 1319
Sharpley Heath, Bird-in-Hand..................................... .... 0955 The Bents…………….................................................................................... 1321
Milwich, The Allways..................................................................................0932 1000 Church Leigh, Post Office.............................................................................1257 1324
Dods Leigh............................................................................................... 1010 Lower Leigh...........................................................................................1300 1327
Morrilow Heath........................................................................................0940 .... Morrilow Heath........................................................................................1305 ....
Lower Leigh...........................................................................................0945 1013 Dods Leigh............................................................................................... 1330
Church Leigh, Post Office.............................................................................0948 1016 Milwich, The Allways..................................................................................1313 1338
The Bents............................................................................................... 1019 Sharpley Heath, Bird-in-Hand............................................................................................ 1351
Withington...........................................................................................0953 1021 Fradswell……...........................................................................................1325 ....
Bramshall, Robin Hood.................................................................................1000 1030 Field.................................................................................................1330 ....
Uttoxeter, Byrds Lane.................................................................................1003 1033 Bramshall, Stores.....................................................................................1340 ....
UTTOXETER, Bus Station.........................................................................................1010 1040 UTTOXETER, Bus Station.........................................................................................1345 ....
Notes : S - Saturday only W - Wednesday only
Service operated under contract to Staffordshire County Council
Effective from 5.9.10
Page 45
248
Wednesday and Saturday only
411Route 248 : SHARPLEY HEATH, Garshall Green, Milwich, The Allways, B5027, Coton, Dods Leigh, Lower Leigh, Church Leigh, The Bents, Withington,
Bramshall, Bramshall Road, Byrds Lane, Holly Road, Cross Road, Heath Road, Cheadle Road, High Street, Bradley Street, UTTOXETER Bus Station.
Route 411 : UTTOXETER Bus Station, Bradley Street, Smithfield Road, Stone Road, Bramshall Road, Bramshall, Bearsbrook, Fradswell, Coton, Uttoxeter
Road, Milwich, The Allways, Garshall Green, Stone Heath, Morrilow Heath, Lower Leigh, Church Leigh, Withington then as above to UTTOXETER Bus
Station.

STONE - FULFORD - BLYTHE BRIDGE - LONGTON 249D&G COACHES
STONE, Granville Square..................................... 1035 1250 1440 Additional Journeys : Schooldays only
Stone, Christchurch Way............................ .... .... 1251 ....
Milwich, The Allways......................................................... .... 1301 ....
Hilderstone, Sandon Road........................... .... .... 1305 ....
Moddershall............................................................................ .... .... 1447
Sharpley Heath, Bird-in-Hand........................... .... 1308 ....
Fulford Road / Moss Lane...........................0856 1046 1311 1451
Fulford, Primary School..............................................0858 1048 1313 1453
Cresswell, Rookery Crescent........................0902 1052 1317 1457
Draycott-in-the-Moors, Church......................0904 1054 1319 1459
BLYTHE BRIDGE, Duke of Wellington..................0909 1059 1324 1504
Stallington Village......................................................0914 1104 1329 ....
Meir Heath, Golborn Avenue.........................0918 1108 1333 ....
Meir, Broadway.................................................................0924 1114 1339 ....
LONGTON, Interchange......................................0932 1122 1347 ....
This Service is operated under contract to Staffordshire County Council
Effective from 6.9.09
Page 46
Monday to Saturday
Routes via Milwich and Hilderstone operate STONE, Granville Square, Radford Street, Christchurch Way, Lichfield Street, Lichfield Road, Uttoxeter Road,
Milwich, Uttoxeter Road, Sandon Road, Hilderstone, Cresswell Road, Moss Lane, Fulford Road then as above to Longton.
Routes via Moddershall operate STONE, Granville Square, Radford Street, Longton Road, Fulford Road, Moddershall, Moddershall Oaks, Knenhall Lane,
Hilderstone Road, Fulford Road, Saverley Green Road then as above.
Route : STONE, Granville Square, Radford Street, Longton Road, Fulford, Fulford Road, Saverley Green Road, Sandon Road, Cresswell Lane, Uttoxeter
Road, Draycott-in-the-Moors, Uttoxeter Road, BLYTHE BRIDGE, Stallington Road, Stallington Village, Hilderstone Road, Meir Heath, Golborn Avenue,
Birkholme Drive, Grange Road, Sandon Road, Meir, A50, Uttoxeter Road, Commerce Street, The Strand, Baths Road, LONGTON Interchange.
Blythe Bridge, High School 1510, Caverswall 1520, Catchems Corner 1525, Meir
Heath, Windmill 1535, Stallington 1540
Adderley 0745, Caverswall 0755, Catchems Corner 0800, Meir Heath, Windmill
0810, Stallington 0815, Blythe Bridge, Duke of Wellington 0822, Catchems Corner
0828, Caverswall 0835

LONGTON - BLYTHE BRIDGE - FULFORD - STONE 249D&G COACHES
LONGTON, Interchange......................................0935 1125 1350
Meir, Broadway..................................................................................0941 1131 1356
Meir Heath, Golborn Avenue.........................0947 1137 1402
Stallington Village.........................................................0951 1141 1406
BLYTHE BRIDGE, Duke of Wellington..................0956 1146 1411
Draycott, Church................................................................1001 1151 1416
Cresswell, Rookery Crescent........................1003 1153 1418
Fulford, Primary School....................................................1007 1157 1422
Fulford Road / Moss Lane...........................1009 1159 1424
Sharpley Heath, Bird-in-Hand.......................1012 .... ....
Moddershall............................................................................ 1204 ....
Hilderstone, Sandon Road...........................1015 .... ....
Milwich, The Allways............................................................1020 .... ....
Stone, Crown Street..........................................................1033 .... ....
Stone Granville Square....................................................1035 .... ....
STONE, Christchurch Way..................................... 1211 1434
This Service is operated under contract to Staffordshire County Council
Effective from 6.9.09
Page 47
Sundays and Bank Holiday Mondays : No Service
Monday to Saturday

UTTOXETER - DRAYCOTT - BURTON
PARAGON TRAVEL
UTTOXETER, Bus Station......................................0730 0830 1000 1204 1404 1536 1721
Uttoxeter, Tesco.....................................................................0732 0832 1002 1206 1406 1538 1723
Uttoxeter, Rail Station ....................................................................0733 0833 1003 1209 1407A 1539 1725
Netherland Green.....................................................................0738 0838 1008 1214 1417 1544 1730
Marchington, Bulls Head.....................................................................0743 0843 1013 1219 1422 1549 1735
Draycott-in-the-Clay, Fountain.....................................................................0748 0848 1018 1224 1427 1556 1740
Dovegate, Prison.....................................................................0753 0853 1023 1229 1432 1601 1745
Draycott-in-the-Clay, Fountain.....................................................................0758 0858 1028 1234 1437 1606 1750
Newborough, Church.....................................................................0804 0904 1034 1239 1443 1612 1756
Hanbury, Bus Shelter.....................................................................0811 0911 1041 1246 1450 1619 1803
Anslow, School........................................................................0821 0921 1051 1257 1501 1628 1810
Beam Hill, The Beacon.....................................................................0825 0925 1055 1301 1505 1632 1816
Queens Hospital, Burton…………………………………………….0829 0929 1059 1305 1509 1636 1820
Burton, Rail Station .....................................................................0836 0936 1106 1312 1516 1643 1827
BURTON, New Street.......................................0842 0939 1110 1316 1520 1645 1830
Notes : A - Operates via Old Knotty Way, Kingfisher Way George Elliott Close and Leighton Road
- Near Rail Station
Service operated under contract to Staffordshire County Council
Effective from 6.9.10
Page 48
402
Monday to Saturday
Route : UTTOXETER Bus Station, Bradley Street, Silver Street, Dove Bank, Town Meadows Way, Tesco Store, Town Meadows Way, Brookside Road
(returns Bridge Street, Church Street, Bradley Street, Bus Station, Bradley Street, Dove Bank, Town Meadows Way, Tesco), Uttoxeter Rail Station, Brookside
Road, Bridge Street, Highwood Road, B5017, Netherland Green, Marchington, Bag Lane, Jack's Lane, Stubby Lane, Draycott-in-the-Clay, A515, Moreton
Lane, Dovegate Prison, Moreton Lane, Draycott Cliff, Holly Bush Road, Newborough, Duffield Lane, Concrete Road, Hanbury Woodend, Knightsfield Road,
Wood Lane, Hanbury, Anslow Road, Woodend, Blackbrook, Anslow Gate, Anslow, Main Road, Beamhill Road, Tutbury Road, Calais Road, Belvedere Road,
Queens Hospital Grounds, Calais Road, Tutbury Road, Horninglow Road North, Horninglow Road, Derby Street, Byrkley Street, Waterloo Street, Borough
Road, Station Street, Union Street, BURTON, New Street.

BURTON - DRAYCOTT - UTTOXETER
PARAGON TRAVEL
BURTON, New Street.......................................0720 0845 1050 1250 1420 1605 1745
Burton, Rail Station .....................................................................0723 0848 1054 1254 1424 1609 1749
Queens Hospital, Burton………………………………………0730 0855 1101 1301 1431 1616 1755
Beam Hill, The Beacon.....................................................................0734 0859 1105 1305 1435 1620 1759
Anslow, School.........................................................................0740 0905 1111 1311 1441 1626 1805
Hanbury, Bus Shelter.....................................................................0749 0914 1120 1320 1450 1635 1814
Newborough, Church.....................................................................0756 0921 1127 1327 1457 1642 1821
Draycott-in-the-Clay, Fountain.....................................................................0802 0927 1133 1333 1506 1651 1830
Dovegate, Prison.....................................................................0807 0932 1138 1338 1511 1656 1835
Draycott-in-the-Clay, Fountain.....................................................................0812 0939 1143 1343 1516 1701 1840
Marchington, Bulls Head.....................................................................0817 0944 1148 1348 1521 1706 1845
Netherland Green.....................................................................0822 0949A 1153 1353 1526 1711 1850
Uttoxeter, Rail Station .....................................................................0827 …. 1158 1358 1531 1716 1855
Uttoxeter Bus Station.....................................................................…. 0956 1200 1400 1533 1718 1857
UTTOXETER, Tesco............................................0829 0958 1202 1402 1535 1720 1859
Notes : A - Operates via George Elliott Close 0953, Kingfisher Way, Westlands Road and Stafford Road
- Near Rail Station
Service operated under contract to Staffordshire County Council
Effective from 6.9.10
Page 49
Monday to Saturday
Sundays and Bank Holiday Mondays : No Service
402

ABBOTS BROMLEY - NEWBOROUGH - TATENHILL - BURTON
PARAGON TRAVEL
ABBOTS BROMLEY, Goose Lane.......................................1025 BURTON, New Street.......................................1415
Hoar Cross, Meynell Ingram Arms....................1033 Anslow, School..............................................................................1430
Newborough, Church................................. 1037 Rough Hay, The Acorn...............................1433
Needwood, New Inn................................................................................1044 Tatenhill, Crossroads..............................................................................1437
Rangemore, School..............................................................................1047 Rangemore, School..............................................................................1441
Tatenhill, Crossroads..............................................................................1051 Needwood, New Inn..............................................................................1444
Branston, Bridge Inn..............................................................................1055 Newborough, Church................................. 1451
Bean Covert, Merlin Crescent.......................1100 Hoar Cross, Meynall Ingram Arms....................1455
Morrisons, Roundabout..............................1102 ABBOTS BROMLEY, Goose Lane.......................................1500
BURTON, New Street.......................................1110
BURTON, Bargates......................................................1135
Service operated under contract to Staffordshire County Council
Effective from 5.9.10
Page 50
403
Tuesday, Thursday and Friday only
Route : ABBOTS BROMLEY, Goose Lane, Bagots Street, High Street, Ashbrook Lane, Blunt's Hollow, Hoar Cross, Yoxall Road, Newborough, B5234,
Needwood, Rangemore Hill, Tatenhill Lane, Tatenhill Common, Tatenhill, Branston Road, Wellington Road, Branston, Main Street, Clays Lane, Harwood
Avenue, Merlin Crescent, Clewley Road, Harwood Avenue, Clays Lane, Morrisons, Clays Lane, Main Street, Lichfield Street, BURTON, New Street.
Returns BURTON, High Street, New Street, Union Street, Borough Road, Derby Street, Horninglow Road, Horninglow Road North, Tutbury Road, Beamhill
Road, Anslow, Main Street, Hopley Road, Rough Hay, Postern Road, Tatenhill, Main Street, Tatenhill Lane then reverse of above.

UTTOXETER TOWN Service
D&G COACHES
UTTOXETER, Bus Station......................................…. 0915 0945 1015 1045 1115 1145 1215 1315 1345 1415 1445
Three Tuns.........................................…. 0919 0949 1019 1049 1119 1149 1219 1319 1349 1419 1449
Byrds Lane.........................................0851 0921 0951 1021 1051 1121 1151 1221 1321 1351 1421 1451
Grange Road……….....................................0858 0928 0958 1028 1058 1128 1158 1228 1328 1358 1428 1458
Three Tuns.........................................0902 0932 1002 1032 1102 1132 1202 1232 1332 1402 1432 1502
UTTOXETER, Bus Station......................................0906 0936 1006 1036 1106 1136 1206 1236 1336 1406 1436 1506
Effective from 5.9.10
Page 51
Sundays and Bank Holiday Mondays : No Service
Monday to Friday
406
Route : UTTOXETER Bus Station, Bradley Street, High Street, Cheadle Road, Holly Road, Byrds Lane, Lambert Road, Marlborough Way, Kimberley Drive,
Davies Drive (southern section), Bentley Road, New Road, Grange Road, Redfern Road, Pennycroft Road, Byrds Lane, Holly Road, Cheadle Road, High
Street, Bradley Street, UTTOXETER Bus Station.

UTTOXETER - ROCESTER - MAYFIELD - ASHBOURNE
TRENT BARTON
UTTOXETER, Bus Station......................................0705 0835 0955 1155 1355 1525 1725
Rocester, Garage...................................0715 0845 1005 1205 1405 1535 1735
Denstone, Hawthorn Close...........................0719 0849 1009 1209 1409 1539 1739
Ellastone, Duncombe Arms...........................0724 0854 1014 1214 1414 1544 1744
Mayfield, Garage...................................0730 0900 1020 1220 1420 1550 1750
ASHBOURNE, Bus Station......................................0736 0906 1026 1226 1426 1556 1756
Service operated under contract to Staffordshire County Council
Effective from 25.10.10
Page 52
409
Monday to Saturday
Route : UTTOXETER, Bus Station, Bradley Street, High Street, A522 Cheadle Road, Ashbourne Road, B5030, Rocester, High Street, Ashbourne Road,
B5031, College Road, Denstone, Alton Road, B5032, Quixhill Lane, Quixhill Bank, B5032 Ellastone, Mayfield, Ashbourne Road, A52 Mayfield Road,
Ashbourne By-Pass, A515 Clifton Road, Ashbourne, Station Street, Compton Street, King Edward Street, ASHBOURNE, Bus Station.

ASHBOURNE - MAYFIELD - ROCESTER - UTTOXETER
TRENT BARTON
ASHBOURNE, Bus Station......................................0740 0915 1115 1315 1435 1635 1805
Mayfield, Garage...................................0746 0921 1121 1321 1441 1641 1811
Ellastone, Duncombe Arms...........................0752 0927 1127 1327 1447 1647 1817
Denstone, College Road End.........................0757 0932 1132 1332 1452 1652 1822
Rocester, Garage...................................0801 0936 1136 1336 1456 1656 1826
UTTOXETER, Bus Station......................................0811 0946 1146 1346 1506 1706 1836
Service operated under contract to Staffordshire County Council
Effective from 25.10.10
Page 53
Sundays and Bank Holiday Mondays : No Service
409
Monday to Saturday

UTTOXETER - ABBOTS BROMLEY - LICHFIELD
PARAGON TRAVEL
Service operated under contract to Staffordshire County Council
Effective from 6.9.10
Page 54
428
Journeys via Hamstall Ridware operate as above Blithbury, then divert Blithbury Road, Hamstall Ridware, Lichfield Road, Pipe Ridware, Pipe Lane, Hill
Ridware then continue as above.
Route : UTTOXETER Bus Station, Bradley Street, Silver Street, Dove Bank, Town Meadows Way, Tesco, Town Meadows Way, Bridge Street, Highwood
Road, Kingfisher Way, Leighton Road, George Elliott Close, Leighton Road, Kingfisher Way, Westlands Road, Stafford Road, B5013, Watery Lane, Loxley
Green, Kingstone, The Meadows, Stonier Drive, Church Lane, Blythebridge Bank, The Blythe, Booth Lane, Dapple Heath (certain services operate direct
along B5013 to Dapple Heath), Bagots Bromley, Uttoxeter Road, ABBOTS BROMLEY, Bagot Street, High Street, Lichfield Road, B5014, Blithbury, Hill
Ridware, Uttoxeter Road, Ridware Road, Handsacre, Uttoxeter Road, Lichfield Road, New Road, Shropshire Brook Road, Lichfield Road, A515, Stafford
Road, Eastern Avenue, Curborough Road, Weston Road, Beacon Street, Anson Avenue, Dimble Lane, Dimbles Hill, Curborough Road, St Chad's Road,
Stowe Road, George Lane, Tamworth Street, Birmingham Road, LICHFIELD Bus Station.
Journeys omitting Kingfisher Way and George Elliott Close in Uttoxeter operate as above to Bridge Street, then Old Knotty Way, Stafford Road then as
above to Lichfield
Sundays and Bank Holidays : No Service

UTTOXETER - ABBOTS BROMLEY - LICHFIELD
PARAGON TRAVEL
NSD SDO
UTTOXETER, Bus Station......................................0745 0745 0835 1035 1235 1520 1710
Uttoxeter, Tesco.......................................................................................... .... 0837 1037 1237 1522 1712
Uttoxeter, George Elliott Close.................... .... .... 0841 1041 1241 1526 1716
Uttoxeter, Kingfisher Way.......................... .... .... 0843 1043 1243 1528 1718
Uttoxeter, Westlands Road.......................... .... .... 0845 1045 1245 1530 1720R
Willslock, Red Cow....................................................................................0753 0753 0848 1048 1248 1533 ....
Kingstone, School......................................................................................... .... 0852 1052 1252 1537 ....
The Blythe, Inn........................................................................................... .... 0855 1055 1255 1540 ....
Dapple Heath.............................................................................................. .... 0859 1059 1259 1544 ....
Abbots Bromley, Butter Cross.......................0800 0800 0905 1105 1305B 1550 ....
Blithbury, Bull & Spectacles....................... 0807 0807 0912 1112 1312 1557 ....
Hamstall Ridware.......................................................................................... .... 0918 1118 .... .... ....
Hill Ridware..........................................................................................0811 0811 0926 1126 1316 1601 ....
Handsacre, Tuppenhurst Lane........................0814 0814 0929 1129 1319 1604 ....
Handsacre, Shropshire Brook Road...................0817 0817 0932 1132 1322 1607 ....
Lichfield, Eastern Avenue.......................... 0827 0827A 0942 1142 1332 1617 ....
Lichfield, Morrisons Store..............................................…. …. 0947 1147 1337 1622 ....
Lichfield, Dimbles Hill...............................................................................0834 0836 0949 1149 1339 1624 ....
Lichfield, Netherstowe School......................0835 0837 0950 1150 1340 1625 ....
LICHFIELD, Bus Station......................................0840 0842 0955 1155 1345 1630 ....
Notes : A - Operates via Friary School 0828
B - Operates via Swan Lane by request only
NSD - Not Schooldays
R - Continues to Abbots Bromley by request of passengers already on the bus only
SDO - Schooldays only
Effective from 6.9.10
Page 55
Monday to Saturday
428

LICHFIELD - ABBOTS BROMLEY - UTTOXETER
PARAGON TRAVEL
SDO SDO NSD
LICHFIELD, Bus Station.......................................... 0920 1040 1250 1525 1527 1730
Lichfield, Netherstowe School...................... .... 0925 1045 1255 1530 1532 1735
Lichfield, Dimbles Hill.................................................................................. 0926 1046 1256 1531 1533 1736
Lichfield, Morrisons Store............................................................................…. 0928 1048 1258 1533A 1535 1738
Lichfield, Eastern Avenue.......................... .... 0933 1053 1303 1540 1540 1743
Handsacre, Shropshire Brook Road....................... 0941 1101 1311 1548 1548 1751
Handsacre, Tuppenhurst Lane............................ 0946 1106 1316 1553 1553 1756
Hill Ridware.................................................................................. 0949 1109 1319 1556 1556 1759
Hamstall Ridware.................................................................................. .... .... 1327 1604 1604 1807
Blithbury, Bull & Spectacles....................... .... 0953 1113 1333 1610 1610 1813
Abbots Bromley, Butter Cross.......................0805 1000 1120 1340 1617 1617 1820
Dapple Heath..............................................................................0811 1006 1126 1346 R R ....
The Blythe, Inn..............................................................................0815 1010 1130 1350 R R ....
Kingstone, School..............................................................................0818 1013 1133 1353 R R ....
Willslock, Red Cow.................................................................................0822 1017 1137 1357 1624 1624 1827
Uttoxeter, Westlands Road.......................... .... 1020 1140 1400 .... .... ....
Uttoxeter, Kingfisher Way.......................... .... 1022 1142 1402 .... .... ....
Uttoxeter, George Elliott Close.................... .... 1024 1144 1404 .... .... ....
Uttoxeter, Tesco…………………………………………………………………. 1028R 1148R 1408R …. …. ….
UTTOXETER, Bus Station.......................................0830 1030 1150 1410 1632 1632 1835
Notes : A - Operates via Friary School 1539
NSD - Not Schooldays
R - Serves by request of passengers already on the bus only
SDO - Schooldays only
Effective from 6.9.10
Page 56
Monday to Saturday
428

UTTOXETER - HIXON - GREAT HAYWOOD - STAFFORD 841 ARRIVA MIDLANDS
NS NS S
UTTOXETER, Bus Station......................................…. 0717 0747 …. …. 1047 …. 1247 …. 1447 …. 1647 …. 1847 …. ….
Bramshall, Stores.............................................................…. 0725 0755 …. …. 1055 …. 1255 …. 1455 …. 1655 …. 1855 …. ….
Hixon, Bank House.............................................................0710 0740 0810 0910 1010 1110 1210 1310 1410 1510 1610 1710 1810 1910 2110 2310
Tixall, Church................................................................0725 0755 0825 0925 1025 1125 1225 1325 1425 1525 1625 1725 1825 1925 2125 2325
STAFFORD, Pitcher Bank......................................0740 0815 0840 0940 1040 1140 1240 1340 1440 1540 1640 1740 1835 1940 2135 2335
NS
STAFFORD, Pitcher Bank......................................0630 0850 0950 1050 1150 1250 1350 1450 1550 1650 1750 1850 2040 2240
Tixall, Church................................................................0640 0905 1005 1105 1205 1305 1405 1505 1605 1705 1805 1905 2050 2250
Pasturefields.............................................................…. 0919 …. 1119 …. 1319 …. 1519 …. 1719 …. 1919 2104 2304
Hixon, Bank House.............................................................0655 0922 1020 1122 1220 1322 1420 1522 1620 1722 1820 1922 2107 2307
Bramshall, Stores.............................................................0709 …. 1034 …. 1234 …. 1434 …. 1634 …. 1834 …. …. ….
UTTOXETER, Bus Station......................................0715 …. 1045 …. 1245 …. 1445 …. 1645 …. 1845 …. …. ….
Certain journeys are operated under contract to Staffordshire County Council
Effective from 4.7.10
Page 57
Sundays and Bank Holidays: No Service
Route : UTTOXETER, Bus Station, Bradley Street, High Street, Cheadle Road, Cross Road, Holly Road, Byrds Lane, Bramshall Road, B5027, Loxley Lane,
A518, Station Road, Stowe-by-Chartley, Meadow Glade, Back Lane, High Street, Smithy Lane, Church Lane, A51, Colwich, Little Haywood, Main Road, The
Square, Great Haywood, Mill Lane, Tixall, Tixall Road, Weston Road, Lammascote Road, South Walls, Cope Street, Eastgate Street, STAFFORD, Pitcher
Bank.
Services terminating at Hixon operate as normal to A51 then New Road, Church Road, Back Lane, High Street.
Monday to Saturday

Crewe - Blythe Bridge - Uttoxeter - Derby
Telephone Enquiries : Open :
08457 48 49 50 24 hours daily for times and fares
Traveline 0871 200 22 33 0700 - 2230 daily (except Christmas Day)
East Midlands Trains 08457 12 56 78 0800 - 2000 daily for ticket sales
Addresses for enquiries, comments and complaints :
Passenger Focus East Midlands Trains
Freepost (RRRE-ETTC-LEET) Customer Relations
PO Box 4257 Freepost (RSAK-GETK-BSJX)
Manchester Nottingham
M60 3AR NG2 3DQ
Tel : 0300 1232350 Tel : 08457 125678
www.passengerfocus.org.uk [email protected]
[email protected] www.eastmidlandstrains.co.uk
Page 58
RAIL SERVICES

CREWE - BLYTHE BRIDGE - UTTOXETER - DERBY
EAST MIDLANDS TRAINS
Timetable valid from 12 December 2010 until 21 May 2011
NS S NS S
CREWE...................................................0607 0658 0707 0807 0907 1007 1107 1207 1307 1407 1507 1607 1707 1807 1907 2045 2045
Stoke.............................................................................0633 0724 0733 0833 0933 1033 1133 1233 1333 1433 1533 1633 1733 1833 1933 2118 2119
Longton.............................................................................0639 0730 0739 0839 0939 1039 1140 1239 1339 1439 1539 1639 1739 1839 1939 2124 2125
Blythe Bridge...................................... 0645 0737 0745 0845 0945 1045 1146 1245 1345 1445 1545 1645 1745 1845 1945 2129 2131
UTTOXETER..........................................0658 0749 0758 0858 0958 1058 1158 1258 1358 1458 1558 1658 1758 1858 1958 2142 2144
Tutbury and Hatton.................................0707 0758 0807 0907 1007 1107 1207 1307 1407 1507 1607 1707 1807 1907 2007 2151 2153
DERBY...................................................0724 0816 0822 0924 1024 1124 1224 1324 1424 1524 1624 1724 1824 1924 2024 2210 2210
S NS NS S
DERBY...................................................0640 0640 0740 0840 0940 1040 1140 1240 1340 1440 1540 1640 1740 1740 1840 1940 2040
Tutbury and Hatton.................................0656 0654 0756 0856 0956 1056 1156 1256 1356 1456 1556 1656 1756 1757 1856 1956 2056
UTTOXETER..........................................0707 0705 0807 0907 1007 1107 1207 1307 1407 1507 1607 1707 1807 1807 1907 2007 2107
Blythe Bridge...................................... 0721 0719 0821 0921 1021 1121 1221 1321 1421 1521 1621 1721 1821 1821 1921 2021 2121
Longton.............................................................................0727 0725 0827 0927 1027 1127 1227 1327 1427 1527 1627 1727 1827 1827 1927 2027 2127
Stoke.............................................................................0734 0733 0834 0934 1034 1134 1234 1334 1434 1534 1634 1734 1834 1834 1934 2034 2134
CREWE...................................................0759 0759 0859 0959 1059 1159 1259 1359 1459 1559 1659 1759 1859 1859 1959 2059 2159
Notes : NS - Not Saturday
S - Saturday only
Page 59
on 08457 484950 for further information.
RAIL
Monday to Saturday
Passengers are advised that there are services on Sundays
Due to engineering works these may change at short notice
and passengers should telephone National Rail Enquiries
Sunday Timetables
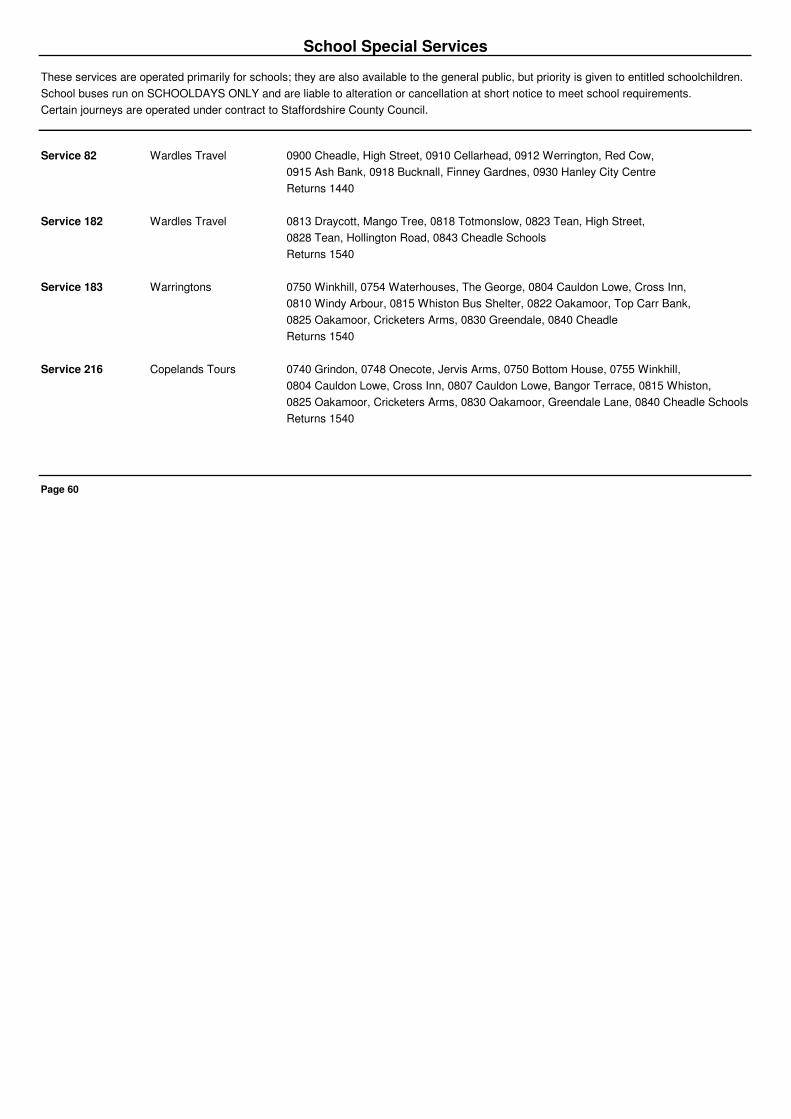
These services are operated primarily for schools; they are also available to the general public, but priority is given to entitled schoolchildren.
School buses run on SCHOOLDAYS ONLY and are liable to alteration or cancellation at short notice to meet school requirements.
Certain journeys are operated under contract to Staffordshire County Council.
Service 82 Wardles Travel 0900 Cheadle, High Street, 0910 Cellarhead, 0912 Werrington, Red Cow,
0915 Ash Bank, 0918 Bucknall, Finney Gardnes, 0930 Hanley City Centre
Returns 1440
Service 182 Wardles Travel 0813 Draycott, Mango Tree, 0818 Totmonslow, 0823 Tean, High Street,
0828 Tean, Hollington Road, 0843 Cheadle Schools
Returns 1540
Service 183 Warringtons 0750 Winkhill, 0754 Waterhouses, The George, 0804 Cauldon Lowe, Cross Inn,
0810 Windy Arbour, 0815 Whiston Bus Shelter, 0822 Oakamoor, Top Carr Bank,
0825 Oakamoor, Cricketers Arms, 0830 Greendale, 0840 Cheadle
Returns 1540
Service 216 Copelands Tours 0740 Grindon, 0748 Onecote, Jervis Arms, 0750 Bottom House, 0755 Winkhill,
0804 Cauldon Lowe, Cross Inn, 0807 Cauldon Lowe, Bangor Terrace, 0815 Whiston,
0825 Oakamoor, Cricketers Arms, 0830 Oakamoor, Greendale Lane, 0840 Cheadle Schools
Returns 1540
Page 60
School Special Services

Service 267 Paragon Travel 0800 Waterhouses, Calton turn, 0810 Mayfield, The Avenue, 0819 Mayfield, Rose & Crown,
0820 Calwich Bank, 0823 Ellastone, Duncombe Arms, 0827 Doveleys Garden Centre,
0829 Rocester, Barrow Hill, 0845 Thomas Alleyne's High School, Uttoxeter
Returns 1540
Service 297 JST International 0812 Mayfield, Old Bank, 0820 Mayfield, Rose & Crown, 0823 Calwich Bank,
0825 Ellastone, Duncombe Arms, 0827 Ellastone, Dove Lane,
0832 Rocester, Barrow Hill, 0835 Ryecroft Middle School, Rocester
Returns 1550
Service 309 D&G Coaches 0805 Ashbourne Road / Northfield Avenue, Rocester, 0815 Stramshall Church,
0825 Uttoxeter Bus Station, 0832 St Mary's School, 0837 Windsor Park School
Returns from Uttoxeter Bus Station 1525
Page 61
School Special Services (continued)

On Bank Holiday Mondays, most bus services will run to the SUNDAY timetable.
Some operators may also run Saturday services on Good Friday and between Christmas and New Year.
For full details of special arrangements, please contact the appropriate bus operator (see page 3).
Buses shown in the timetable as running on "Schooldays only" will normally run on Mondays to Fridays during the following periods.
Please note that individual journeys may be cancelled without notice if not required by the school served.
Buses serving schools or colleges in other areas may observe different dates.
Page 62
1 November to 17 December
Services on Public Holidays
Buses do not normally run on Christmas Day, Boxing Day or New Years Day. On Christmas Eve and New Years Eve many bus services
finish earlier than usual.
Schooldays in Staffordshire 2010 / 2011
26 April to 27 May
6 June to 27 July
28 February to 8 April
4 January 2011 to 18 February 2011

Cheadle Hospital Heath House Clinic
Royal Walk, Cheadle ST10 1NS Cheadle Road, Uttoxeter ST14 7BY
Tel : (01538) 487500 Tel : (01889) 562555
Buses : Any service to Cheadle town centre Buses : 4, 32, 32A, 406 or 409
(3 minutes walk from High Street) all pass the clinic
Staffordshire General Hospital Cheadle Health Centre
Weston Road, Stafford, Staffordshire ST16 3RS Well Street, Cheadle ST10 1EY
Tel : (01785) 257731 Tel : (1538) 487570
Buses : 841 from Uttoxeter Buses : 123 passes the Health Centre,
7/7A, 32 and 236 operate along nearby Tean Road
University Hospital of North Staffordshire Queens Hospital
Princes Road, Hartshill, Stoke on Trent ST4 7LN Belvedere Road, Burton upon Trent DE13 0RB
Tel : (01782) 715444 Tel : (01283) 566333
Buses : 6A, 6B, 32, 32A to Hanley Buses : 1, 1A or 402 to Burton
changing to 24 or 41 changing to 3, 3A, 21E or 813
Leek Moorlands Hospital London Road Community Hospital
Ashbourne Road, Leek ST13 5BQ London Road, Derby DE1 2QY
Tel : (01538) 487234 Tel : (01332) 347141
Buses : 108, 234, 235 or 236 Buses : 1, 1A or 402 to Burton, changing to V1, V2, V3 or X38 to Derby
(a further change will be needed in Derby City centre)
Page 63
Hospital / Clinic Information

Staffordshire County Council Stafford Borough Council Staffordshire Moorlands District Council
Integrated Transport and Planning Unit Law and Administration Moorlands House
Development Services Directorate Civic Centre, Riverside Stockwell Street
Riverway, Stafford Stafford Leek
ST16 3TJ ST16 3AQ ST13 6HQ
Tel : (01785) 276741 Tel : (01785) 619000 Tel : (1538) 483483
Residents of South Derbyshire should contact:
East Staffordshire Borough Council South Derbyshire District Council
Town Hall Civic Offices, Civic Way
King Edward Place Swadlincote
Burton upon Trent Derbyshire
DE14 2EB DE11 0AH
Tel : (01283) 505919 Tel : (01283) 221000
Page 64
Concessionary Fares
Staffordshire County Council administers the Staffordshire and Stoke on Trent Concessionary Travel Scheme on behalf of the City of Stoke
on Trent and 6 Staffordshire Districts, including Staffordshire Moorlands and Stafford Borough Councils. The scheme provides free bus travel
throughout Staffordshire and Stoke on Trent for people aged 60+ or with a disability. Details of the scheme can be obtained from the County
Council, but for bus pass issue please contact the Borough Council:
A separate scheme is administered by East Staffordshire Borough
Council and residents of East Staffordshire should contact the
Borough Council offices for further information.

East Staffordshire Mobility Link Abbots Bromley Community Transport Staffordshire Moorlands CVS
Elm Lodge 8 Alms Houses Bank House
37 Stapenhill Road Baggots Street 20 St Edward Street
Burton upon Trent Abbots Bromley Leek
DE15 9AE WS15 3BZ ST13 5DS
Tel : Burton - (01283) 512705 Tel : (01283) 840538 Tel : (01538) 371544
(0900 - 1630) (0800 - 2100 Monday to Friday) (1000 - 1500 Monday, Friday)
Tel : Uttoxeter - (01899) 568021
(0900 - 1200)
Ashbourne Community Transport Southern Derbyshire Dales Volunteer Centre Car Scheme
Trent Bus Garage Ashbourne Business Centre
King Edward Street Dig Street
Ashbourne Community Transport Ashbourne
Derbyshire Derbyshire
DE6 1BW DE6 1GF
Tel : (01335) 300670 Tel : (01335) 344700
(0815 - 1645 Monday to Friday) (1000 - 1300 Monday to Friday)
Page 65
Community / Voluntary Transport
Passengers unable to use the bus and rail services in this book may benefit from the voluntary and community transport schemes provided
within the Cheadle and Uttoxeter area. These services are particularly beneficial to those elderly or mobility impaired passengers who
experience difficulty travelling by bus. Fares are similar to those charged on local buses and the services receive a grant from Staffordshire
County Council. Further information is available from :

* Provides socially necessary local bus services
* Publishes comprehensive timetable books
* Supports Voluntary Car Schemes and Community Minibus Schemes for those who find
difficulty in gaining access to public transport
* Helps fund the provision of new bus shelters, together with District and Parish Councils
* Jointly funds new high quality accessible bus routes
* Supports the development of rail services
* Manages Staffordshire and Stoke on Trent Concessionary Travel Scheme
Page 66
Staffordshire County Council
Integrated Transport and Planning Unit

Integrated Transport and Planning Unit
Development Services Directorate
Staffordshire County Council
Riverway
Stafford ST16 3TJ
Telephone: (01785) 276739 or 276748
Fax: (01785) 276788
E-mail: [email protected]
Please enclose a self addressed envelope and say which area you need a timetable for
www.staffordshire.gov.uk/transport/publictransport/buses
Page 67
Current timetable booklets for all areas are also
available on the County Council website :
If you wish to receive a full set of 12 timetable booklets send a cheque or postal order to the
value of £5.00, made payable to 'Staffordshire County Council'
Timetables for Other Areas of Staffordshire
Free booklets containing details of bus services in adjoining areas of Staffordshire are available from
Local Libraries, Tourist Information Centres and District Council Offices in Staffordshire, or by post
from :


APPENDIX E

Uttoxeter - Manual Traffic Survey, Wednesday 8th June 2011Produced by Road Data Services Ltd.
Junction: (1) B5030 / The Dove Way / A518
Approach: B5030
TIME P/CYCLE M/CYCLE CAR LGV OGV1 OGV2 BUS TOTAL P/CYCLE M/CYCLE CAR LGV OGV1 OGV2 BUS TOTAL0730 - 0745 0 0 13 2 0 1 0 16 0 0 97 21 3 9 0 1300745 - 0800 0 0 15 3 0 0 0 18 0 1 112 27 0 2 0 142Hourly Total 0 0 28 5 0 1 0 34 0 1 209 48 3 11 0 2720800 - 0815 0 1 24 3 2 1 0 31 0 2 106 27 0 3 0 1380815 - 0830 0 0 32 6 0 1 0 39 0 1 117 31 1 8 1 1590830 - 0845 0 0 30 3 1 2 1 37 0 4 118 35 2 6 2 1670845 - 0900 0 1 29 1 3 1 0 35 0 5 107 24 1 4 1 142Hourly Total 0 2 115 13 6 5 1 142 0 12 448 117 4 21 4 6060900 - 0915 0 0 35 1 1 0 0 37 0 1 125 27 1 8 0 1620915 - 0930 0 0 31 3 0 1 0 35 0 0 112 19 0 11 1 143Hourly Total 0 0 66 4 1 1 0 72 0 1 237 46 1 19 1 305
Session Total 0 2 209 22 7 7 1 248 0 14 894 211 8 51 5 1183
1630 - 1645 0 0 41 4 0 2 0 47 0 1 129 22 1 2 0 1551645 - 1700 0 0 36 3 0 1 0 40 0 0 185 19 0 1 0 205Hourly Total 0 0 77 7 0 3 0 87 0 1 314 41 1 3 0 3601700 - 1715 0 0 34 3 0 0 0 37 0 2 186 19 0 3 1 2111715 - 1730 0 1 31 5 0 1 0 38 0 3 210 21 0 4 0 2381730 - 1745 1 2 37 5 0 0 0 45 0 2 195 22 1 6 0 2261745 - 1800 0 1 41 6 0 0 0 48 0 1 186 17 0 9 0 213Hourly Total 1 4 143 19 0 1 0 168 0 8 777 79 1 22 1 8881800 - 1815 0 1 29 3 0 0 0 33 0 0 167 14 1 7 1 1901815 - 1830 0 0 23 1 0 1 0 25 0 0 157 11 0 7 0 175Hourly Total 0 1 52 4 0 1 0 58 0 0 324 25 1 14 1 365
Session Total 1 5 272 30 0 5 0 313 0 9 1415 145 3 39 2 1613
Left to The Dove Way Ahead to A518

Uttoxeter - Manual Traffic Survey, Wednesday 8th June 2011Produced by Road Data Services Ltd.
Junction: (1) B5030 / The Dove Way / A518
Approach: The Dove Way
TIME P/CYCLE M/CYCLE CAR LGV OGV1 OGV2 BUS TOTAL P/CYCLE M/CYCLE CAR LGV OGV1 OGV2 BUS TOTAL0730 - 0745 0 0 22 3 0 2 0 27 0 0 18 3 0 0 1 220745 - 0800 0 0 20 6 0 3 1 30 0 0 44 6 0 0 0 50Hourly Total 0 0 42 9 0 5 1 57 0 0 62 9 0 0 1 720800 - 0815 0 0 38 5 1 4 2 50 0 0 42 4 0 0 0 460815 - 0830 0 0 34 6 0 4 1 45 0 0 39 1 0 0 0 400830 - 0845 0 1 49 7 2 3 1 63 0 0 41 1 0 1 0 430845 - 0900 0 0 38 7 0 5 1 51 0 2 33 2 0 0 0 37Hourly Total 0 1 159 25 3 16 5 209 0 2 155 8 0 1 0 1660900 - 0915 0 0 41 4 0 3 1 49 0 0 17 3 0 0 0 200915 - 0930 0 0 39 3 0 2 0 44 0 0 13 4 0 0 0 17Hourly Total 0 0 80 7 0 5 1 93 0 0 30 7 0 0 0 37
Session Total 0 1 281 41 3 26 7 359 0 2 247 24 0 1 1 275
1630 - 1645 0 0 38 3 0 2 1 44 0 0 40 4 0 1 0 451645 - 1700 0 0 39 6 0 3 0 48 0 1 43 6 0 1 0 51Hourly Total 0 0 77 9 0 5 1 92 0 1 83 10 0 2 0 961700 - 1715 0 1 32 5 0 2 0 40 0 0 49 7 1 1 0 581715 - 1730 0 0 31 3 0 1 0 35 0 0 35 4 0 2 0 411730 - 1745 0 0 43 4 0 1 2 50 0 0 38 4 0 2 0 441745 - 1800 0 0 23 1 0 1 1 26 0 1 40 4 0 1 0 46Hourly Total 0 1 129 13 0 5 3 151 0 1 162 19 1 6 0 1891800 - 1815 0 0 21 2 0 1 0 24 0 0 55 3 0 1 0 591815 - 1830 0 0 19 1 0 0 0 20 0 0 51 2 0 0 0 53Hourly Total 0 0 40 3 0 1 0 44 0 0 106 5 0 1 0 112
Session Total 0 1 246 25 0 11 4 287 0 2 351 34 1 9 0 397
Left to A518 Right to B5030

Uttoxeter - Manual Traffic Survey, Wednesday 8th June 2011Produced by Road Data Services Ltd.
Junction: (1) B5030 / The Dove Way / A518
Approach: A518
TIME P/CYCLE M/CYCLE CAR LGV OGV1 OGV2 BUS TOTAL P/CYCLE M/CYCLE CAR LGV OGV1 OGV2 BUS TOTAL0730 - 0745 0 0 67 9 0 6 0 82 0 0 29 5 0 3 0 370745 - 0800 0 1 71 12 0 5 0 89 0 1 44 1 0 5 0 51Hourly Total 0 1 138 21 0 11 0 171 0 1 73 6 0 8 0 880800 - 0815 0 1 62 7 2 9 0 81 0 0 50 8 0 3 1 620815 - 0830 0 0 67 13 0 7 0 87 0 0 54 2 0 1 0 570830 - 0845 0 0 91 12 0 10 0 113 0 1 47 5 0 2 0 550845 - 0900 0 0 83 9 0 9 0 101 0 1 60 8 0 2 0 71Hourly Total 0 1 303 41 2 35 0 382 0 2 211 23 0 8 1 2450900 - 0915 0 0 95 10 0 7 0 112 0 1 53 4 0 3 0 610915 - 0930 0 0 88 11 0 7 0 106 0 0 41 4 0 1 0 46Hourly Total 0 0 183 21 0 14 0 218 0 1 94 8 0 4 0 107
Session Total 0 2 624 83 2 60 0 771 0 4 378 37 0 20 1 440
1630 - 1645 0 2 93 2 0 0 2 99 0 0 32 7 0 3 0 421645 - 1700 0 0 117 0 0 5 0 122 0 1 40 8 1 2 0 52Hourly Total 0 2 210 2 0 5 2 221 0 1 72 15 1 5 0 941700 - 1715 0 0 125 4 0 7 0 136 0 2 37 9 1 1 0 501715 - 1730 0 1 109 6 0 5 0 121 0 0 48 9 0 2 0 591730 - 1745 0 1 103 9 0 7 0 120 0 0 48 6 0 2 0 561745 - 1800 0 2 107 4 0 11 0 124 0 0 46 7 0 1 0 54Hourly Total 0 4 444 23 0 30 0 501 0 2 179 31 1 6 0 2191800 - 1815 0 0 112 5 0 6 0 123 0 0 30 4 0 2 0 361815 - 1830 0 0 96 5 0 7 0 108 0 1 25 4 0 0 0 30Hourly Total 0 0 208 10 0 13 0 231 0 1 55 8 0 2 0 66
Session Total 0 6 862 35 0 48 2 953 0 4 306 54 2 13 0 379
Ahead to B5030 Right to The Dove Way

Uttoxeter - Manual Traffic Survey, Wednesday 8th June 2011
Produced by Road Data Services Ltd.
Junction: (2) A518 / A50 / Ashbourne Road
Approach: A518
TIME P/CYCLE M/CYCLE CAR LGV OGV1 OGV2 BUS TOTAL P/CYCLE M/CYCLE CAR LGV OGV1 OGV2 BUS TOTAL P/CYCLE M/CYCLE CAR LGV OGV1 OGV2 BUS TOTAL0730 - 0745 0 0 50 9 1 6 0 66 0 0 29 9 2 7 0 47 0 0 44 7 0 0 0 510745 - 0800 0 0 43 9 0 0 0 52 0 0 34 16 0 3 1 54 0 0 54 7 1 0 0 62
Hourly Total 0 0 93 18 1 6 0 118 0 0 63 25 2 10 1 101 0 0 98 14 1 0 0 1130800 - 0815 0 0 56 8 0 2 0 66 0 1 41 12 0 5 0 59 0 2 60 14 0 1 0 770815 - 0830 0 0 53 9 0 3 0 65 0 1 44 21 1 9 2 78 0 0 63 8 0 1 0 720830 - 0845 0 2 67 12 0 5 0 86 0 0 45 17 1 3 4 70 0 4 48 12 1 0 0 650845 - 0900 0 1 64 7 0 3 0 75 0 3 47 19 2 2 3 76 0 1 40 5 1 2 0 49
Hourly Total 0 3 240 36 0 13 0 292 0 5 177 69 4 19 9 283 0 7 211 39 2 4 0 2630900 - 0915 0 0 71 8 0 5 0 84 0 0 55 13 1 6 1 76 0 1 41 11 0 0 0 530915 - 0930 0 0 53 7 0 9 0 69 0 0 59 8 0 5 1 73 0 0 36 6 0 0 0 42
Hourly Total 0 0 124 15 0 14 0 153 0 0 114 21 1 11 2 149 0 1 77 17 0 0 0 95
Session Total 0 3 457 69 1 33 0 563 0 5 354 115 7 40 12 533 0 8 386 70 3 4 0 471
1630 - 1645 0 1 104 17 1 4 0 127 0 0 43 3 0 0 0 46 0 0 27 6 0 1 0 341645 - 1700 0 0 130 18 0 5 0 153 0 0 66 2 0 0 0 68 0 0 30 2 0 0 0 32
Hourly Total 0 1 234 35 1 9 0 280 0 0 109 5 0 0 0 114 0 0 57 8 0 1 0 661700 - 1715 0 0 116 15 0 3 0 134 0 0 51 7 0 0 2 60 0 1 43 6 0 1 0 511715 - 1730 0 0 156 11 0 5 0 172 0 1 50 4 0 0 0 55 0 3 45 6 0 0 0 541730 - 1745 0 1 137 11 0 4 1 154 0 1 65 8 0 2 0 76 0 1 34 5 0 0 0 401745 - 1800 0 0 114 9 0 5 0 128 0 0 47 3 0 4 0 54 0 0 50 6 1 2 0 59
Hourly Total 0 1 523 46 0 17 1 588 0 2 213 22 0 6 2 245 0 5 172 23 1 3 0 2041800 - 1815 0 0 94 8 1 3 0 106 0 0 48 2 0 4 2 56 0 1 40 8 0 0 0 491815 - 1830 0 0 89 6 0 4 0 99 0 0 59 0 0 3 1 63 0 0 32 5 0 0 0 37
Hourly Total 0 0 183 14 1 7 0 205 0 0 107 2 0 7 3 119 0 1 72 13 0 0 0 86
Session Total 0 2 940 95 2 33 1 1073 0 2 429 29 0 13 5 478 0 6 301 44 1 4 0 356
Left to A50 (East) Ahead to Ashbourne Road Right to A50 (West)

Uttoxeter - Manual Traffic Survey, Wednesday 8th June 2011
Produced by Road Data Services Ltd.
Junction: (2) A518 / A50 / Ashbourne Road
Approach: A50 (East)
TIME P/CYCLE M/CYCLE CAR LGV OGV1 OGV2 BUS TOTAL P/CYCLE M/CYCLE CAR LGV OGV1 OGV2 BUS TOTAL P/CYCLE M/CYCLE CAR LGV OGV1 OGV2 BUS TOTAL0730 - 0745 0 0 21 4 0 4 0 29 0 0 44 3 0 6 0 53 0 0 59 6 0 6 0 710745 - 0800 0 0 22 1 0 1 0 24 0 2 37 9 0 6 0 54 0 1 65 8 0 4 0 78
Hourly Total 0 0 43 5 0 5 0 53 0 2 81 12 0 12 0 107 0 1 124 14 0 10 0 1490800 - 0815 0 0 27 3 0 2 0 32 0 0 60 9 0 12 0 81 0 2 67 5 1 8 0 830815 - 0830 0 0 38 4 0 1 0 43 0 5 74 12 0 14 0 105 0 0 76 6 0 7 0 890830 - 0845 0 0 46 4 0 2 0 52 0 1 76 13 0 13 0 103 0 0 76 8 0 7 0 910845 - 0900 0 0 38 5 0 0 0 43 0 4 50 11 0 11 0 76 0 1 85 7 0 8 0 101
Hourly Total 0 0 149 16 0 5 0 170 0 10 260 45 0 50 0 365 0 3 304 26 1 30 0 3640900 - 0915 0 1 41 6 0 0 0 48 0 2 52 7 0 9 0 70 0 0 85 6 0 10 0 1010915 - 0930 0 0 29 5 0 2 0 36 0 2 59 12 0 5 0 78 0 0 90 9 0 9 0 108
Hourly Total 0 1 70 11 0 2 0 84 0 4 111 19 0 14 0 148 0 0 175 15 0 19 0 209
Session Total 0 1 262 32 0 12 0 307 0 16 452 76 0 76 0 620 0 4 603 55 1 59 0 722
1630 - 1645 0 1 37 3 0 2 0 43 0 0 68 8 0 3 0 79 0 2 62 5 0 0 0 691645 - 1700 0 0 43 10 0 1 0 54 0 0 84 5 0 2 0 91 0 0 77 5 0 5 0 87
Hourly Total 0 1 80 13 0 3 0 97 0 0 152 13 0 5 0 170 0 2 139 10 0 5 0 1561700 - 1715 0 0 40 7 0 0 0 47 0 2 69 9 0 7 0 87 0 0 77 5 0 5 0 871715 - 1730 0 0 33 7 0 0 0 40 0 0 82 9 0 6 0 97 0 0 53 6 0 6 0 651730 - 1745 0 1 34 5 0 2 0 42 0 1 70 6 1 2 0 80 0 1 70 8 0 8 0 871745 - 1800 0 0 37 4 0 1 0 42 0 1 66 8 0 8 0 83 0 0 72 4 0 8 0 84
Hourly Total 0 1 144 23 0 3 0 171 0 4 287 32 1 23 0 347 0 1 272 23 0 27 0 3231800 - 1815 0 0 26 4 0 0 0 30 0 1 65 6 0 6 0 78 0 1 81 4 0 6 0 921815 - 1830 0 0 29 2 0 0 0 31 0 0 59 5 0 4 0 68 0 0 58 5 0 8 0 71
Hourly Total 0 0 55 6 0 0 0 61 0 1 124 11 0 10 0 146 0 1 139 9 0 14 0 163
Session Total 0 2 279 42 0 6 0 329 0 5 563 56 1 38 0 663 0 4 550 42 0 46 0 642
Left to Ashbourne Road Ahead to A50 (West) Right to A518

Uttoxeter - Manual Traffic Survey, Wednesday 8th June 2011
Produced by Road Data Services Ltd.
Junction: (2) A518 / A50 / Ashbourne Road
Approach: Ashbourne Road
TIME P/CYCLE M/CYCLE CAR LGV OGV1 OGV2 BUS TOTAL P/CYCLE M/CYCLE CAR LGV OGV1 OGV2 BUS TOTAL P/CYCLE M/CYCLE CAR LGV OGV1 OGV2 BUS TOTAL0730 - 0745 0 0 34 3 0 1 0 38 0 0 13 5 0 1 0 19 0 0 35 0 0 0 1 360745 - 0800 0 0 36 7 0 0 0 43 0 1 19 2 0 0 0 22 0 0 33 2 0 0 0 35
Hourly Total 0 0 70 10 0 1 0 81 0 1 32 7 0 1 0 41 0 0 68 2 0 0 1 710800 - 0815 0 0 42 7 0 3 2 54 0 0 16 7 0 2 0 25 0 0 30 2 0 0 0 320815 - 0830 0 0 37 5 0 2 1 45 0 0 21 6 0 1 0 28 0 0 47 1 0 0 0 480830 - 0845 0 0 41 3 0 0 1 45 0 0 27 7 0 1 0 35 0 0 33 3 0 1 0 370845 - 0900 0 0 25 0 0 0 0 25 0 0 27 3 0 3 0 33 0 1 32 4 0 0 0 37
Hourly Total 0 0 145 15 0 5 4 169 0 0 91 23 0 7 0 121 0 1 142 10 0 1 0 1540900 - 0915 0 1 26 2 0 1 0 30 0 0 28 4 0 1 0 33 0 0 37 4 0 1 0 420915 - 0930 0 0 19 1 0 0 0 20 0 0 16 2 0 0 0 18 0 0 33 1 0 0 0 34
Hourly Total 0 1 45 3 0 1 0 50 0 0 44 6 0 1 0 51 0 0 70 5 0 1 0 76
Session Total 0 1 260 28 0 7 4 300 0 1 167 36 0 9 0 213 0 1 280 17 0 2 1 301
1630 - 1645 0 0 23 2 0 0 0 25 0 1 27 1 0 0 2 31 0 0 46 2 0 0 0 481645 - 1700 0 0 25 3 0 1 0 29 0 0 33 0 0 2 0 35 0 0 32 2 0 0 0 34
Hourly Total 0 0 48 5 0 1 0 54 0 1 60 1 0 2 2 66 0 0 78 4 0 0 0 821700 - 1715 0 1 27 4 0 0 0 32 0 0 38 5 0 1 0 44 0 0 43 2 0 1 0 461715 - 1730 0 0 32 1 0 0 0 33 0 1 48 2 0 1 0 52 0 1 44 4 0 0 0 491730 - 1745 0 0 34 2 0 0 1 37 0 1 45 3 0 0 0 49 0 0 48 2 0 2 0 521745 - 1800 0 0 20 0 0 1 0 21 0 2 44 4 0 4 0 54 0 0 35 3 0 0 0 38
Hourly Total 0 1 113 7 0 1 1 123 0 4 175 14 0 6 0 199 0 1 170 11 0 3 0 1851800 - 1815 0 0 19 3 1 0 0 23 0 0 34 4 0 1 0 39 0 1 42 1 0 0 0 441815 - 1830 0 0 20 1 0 0 0 21 0 0 32 2 0 0 0 34 0 0 13 0 0 0 0 13
Hourly Total 0 0 39 4 1 0 0 44 0 0 66 6 0 1 0 73 0 1 55 1 0 0 0 57
Session Total 0 1 200 16 1 2 1 221 0 5 301 21 0 9 2 338 0 2 303 16 0 3 0 324
Left to A50 (West) Ahead to A518 Right to A50 (East)

Uttoxeter - Manual Traffic Survey, Wednesday 8th June 2011
Produced by Road Data Services Ltd.
Junction: (2) A518 / A50 / Ashbourne Road
Approach: A50 (West)
TIME P/CYCLE M/CYCLE CAR LGV OGV1 OGV2 BUS TOTAL P/CYCLE M/CYCLE CAR LGV OGV1 OGV2 BUS TOTAL P/CYCLE M/CYCLE CAR LGV OGV1 OGV2 BUS TOTAL0730 - 0745 0 0 26 3 0 3 0 32 0 0 45 5 1 2 3 56 0 0 19 1 0 0 0 200745 - 0800 0 0 27 2 0 4 0 33 0 2 50 13 0 3 1 69 0 0 23 2 0 0 0 25
Hourly Total 0 0 53 5 0 7 0 65 0 2 95 18 1 5 4 125 0 0 42 3 0 0 0 450800 - 0815 0 0 31 2 1 1 0 35 0 1 73 14 0 3 0 91 0 0 26 6 0 0 0 320815 - 0830 0 0 30 5 0 1 0 36 0 3 72 12 0 0 0 87 0 0 21 4 0 1 0 260830 - 0845 0 0 32 4 0 2 0 38 0 1 106 17 3 7 0 134 0 1 32 1 0 1 0 350845 - 0900 0 0 36 5 0 1 0 42 0 0 93 9 0 2 0 104 0 0 28 1 0 0 0 29
Hourly Total 0 0 129 16 1 5 0 151 0 5 344 52 3 12 0 416 0 1 107 12 0 2 0 1220900 - 0915 0 0 29 4 0 0 0 33 0 1 82 10 0 2 0 95 0 0 22 3 2 1 1 290915 - 0930 0 0 26 4 0 0 0 30 0 1 86 7 0 0 0 94 0 0 31 5 0 0 0 36
Hourly Total 0 0 55 8 0 0 0 63 0 2 168 17 0 2 0 189 0 0 53 8 2 1 1 65
Session Total 0 0 237 29 1 12 0 279 0 9 607 87 4 19 4 730 0 1 202 23 2 3 1 232
1630 - 1645 0 0 39 2 1 3 0 45 0 0 115 8 0 4 2 129 0 0 35 2 0 0 0 371645 - 1700 0 0 50 4 0 1 0 55 0 1 116 11 0 9 0 137 0 1 31 2 0 1 0 35
Hourly Total 0 0 89 6 1 4 0 100 0 1 231 19 0 13 2 266 0 1 66 4 0 1 0 721700 - 1715 0 0 53 4 0 1 0 58 0 0 106 16 0 5 0 127 0 0 32 6 0 0 0 381715 - 1730 0 0 50 6 0 0 0 56 0 1 93 15 0 2 0 111 0 0 47 3 0 1 0 511730 - 1745 0 1 42 3 0 0 0 46 0 1 120 17 0 2 0 140 0 0 39 3 0 0 0 421745 - 1800 0 0 33 4 0 1 0 38 0 0 136 15 0 2 0 153 0 1 44 1 0 0 0 46
Hourly Total 0 1 178 17 0 2 0 198 0 2 455 63 0 11 0 531 0 1 162 13 0 1 0 1771800 - 1815 0 0 37 3 0 1 0 41 0 0 111 8 0 2 0 121 0 0 30 4 0 2 0 361815 - 1830 0 0 30 2 0 0 0 32 0 0 83 7 0 1 0 91 0 0 32 1 0 0 0 33
Hourly Total 0 0 67 5 0 1 0 73 0 0 194 15 0 3 0 212 0 0 62 5 0 2 0 69
Session Total 0 1 334 28 1 7 0 371 0 3 880 97 0 27 2 1009 0 2 290 22 0 4 0 318
Left to A518 Ahead to A50 (East) Right to Ashbourne Road

Uttoxeter - Manual Traffic Survey, Wednesday 8th June 2011
Produced by Road Data Services Ltd.
Junction: (3) A50 / Derby Road
Approach: Northern Arm (Private Road)
TIME P/CYCLE M/CYCLE CAR LGV OGV1 OGV2 BUS TOTAL P/CYCLE M/CYCLE CAR LGV OGV1 OGV2 BUS TOTAL P/CYCLE M/CYCLE CAR LGV OGV1 OGV2 BUS TOTAL0730 - 0745 0 0 1 0 0 0 0 1 0 0 0 0 0 0 0 0 0 0 1 0 0 0 0 10745 - 0800 0 0 0 0 0 0 0 0 0 0 0 0 0 0 0 0 0 0 0 0 0 0 0 0
Hourly Total 0 0 1 0 0 0 0 1 0 0 0 0 0 0 0 0 0 0 1 0 0 0 0 10800 - 0815 0 0 2 0 0 0 0 2 0 0 0 0 0 0 0 0 0 0 1 1 0 0 0 20815 - 0830 0 0 0 0 0 0 0 0 0 0 0 0 0 0 0 0 0 0 0 0 0 0 0 00830 - 0845 0 0 1 0 0 0 0 1 0 0 0 0 0 0 0 0 0 0 2 0 0 0 0 20845 - 0900 0 0 0 0 0 0 0 0 0 0 0 0 0 0 0 0 0 0 0 0 0 0 0 0
Hourly Total 0 0 3 0 0 0 0 3 0 0 0 0 0 0 0 0 0 0 3 1 0 0 0 40900 - 0915 0 0 0 0 0 0 0 0 0 0 0 0 0 0 0 0 0 0 1 0 0 0 0 10915 - 0930 0 0 1 0 0 0 0 1 0 0 0 0 0 0 0 0 0 0 0 0 0 0 0 0
Hourly Total 0 0 1 0 0 0 0 1 0 0 0 0 0 0 0 0 0 0 1 0 0 0 0 1
Session Total 0 0 5 0 0 0 0 5 0 0 0 0 0 0 0 0 0 0 5 1 0 0 0 6
1630 - 1645 0 0 0 0 0 0 0 0 0 0 0 0 0 0 0 0 0 0 1 0 0 0 0 11645 - 1700 0 0 0 0 0 0 0 0 0 0 0 0 0 0 0 0 0 0 0 0 0 0 0 0
Hourly Total 0 0 0 0 0 0 0 0 0 0 0 0 0 0 0 0 0 0 1 0 0 0 0 11700 - 1715 0 0 0 0 0 0 0 0 0 0 0 0 0 0 0 0 0 0 0 1 0 0 0 11715 - 1730 0 0 0 0 0 0 0 0 0 0 0 0 0 0 0 0 0 0 0 0 0 0 0 01730 - 1745 0 0 1 0 0 0 0 1 0 0 0 0 0 0 0 0 0 0 0 0 0 0 0 01745 - 1800 0 0 0 0 0 0 0 0 0 0 0 0 0 0 0 0 0 0 0 0 0 0 0 0
Hourly Total 0 0 1 0 0 0 0 1 0 0 0 0 0 0 0 0 0 0 0 1 0 0 0 11800 - 1815 0 0 0 0 0 0 0 0 0 0 0 0 0 0 0 0 0 0 1 0 0 0 0 11815 - 1830 0 0 0 0 0 0 0 0 0 0 0 0 0 0 0 0 0 0 0 0 0 0 0 0
Hourly Total 0 0 0 0 0 0 0 0 0 0 0 0 0 0 0 0 0 0 1 0 0 0 0 1
Session Total 0 0 1 0 0 0 0 1 0 0 0 0 0 0 0 0 0 0 2 1 0 0 0 3
Left to A50 (East) Ahead to Derby Road Right to A50 (West)

Uttoxeter - Manual Traffic Survey, Wednesday 8th June 2011
Produced by Road Data Services Ltd.
Junction: (3) A50 / Derby Road
Approach: A50 (East)
TIME P/CYCLE M/CYCLE CAR LGV OGV1 OGV2 BUS TOTAL P/CYCLE M/CYCLE CAR LGV OGV1 OGV2 BUS TOTAL P/CYCLE M/CYCLE CAR LGV OGV1 OGV2 BUS TOTAL0730 - 0745 0 0 27 6 1 3 1 38 0 0 90 7 1 10 0 108 0 0 0 0 0 0 0 00745 - 0800 0 0 24 4 1 3 2 34 0 2 85 15 0 8 0 110 0 0 0 0 0 0 0 0
Hourly Total 0 0 51 10 2 6 3 72 0 2 175 22 1 18 0 218 0 0 0 0 0 0 0 00800 - 0815 0 0 39 11 0 6 1 57 0 0 96 11 0 14 0 121 0 0 0 0 0 0 0 00815 - 0830 0 0 37 5 0 9 1 52 0 3 123 14 1 19 0 160 0 0 0 0 0 0 0 00830 - 0845 0 0 51 5 1 4 1 62 0 3 132 17 0 17 0 169 0 0 0 0 0 0 0 00845 - 0900 0 0 53 6 0 4 0 63 0 4 114 15 0 11 0 144 0 0 1 0 0 0 0 1
Hourly Total 0 0 180 27 1 23 3 234 0 10 465 57 1 61 0 594 0 0 1 0 0 0 0 10900 - 0915 0 0 31 4 0 3 0 38 0 2 105 12 0 15 0 134 0 0 0 0 0 0 0 00915 - 0930 0 0 20 2 0 3 0 25 0 4 105 19 0 12 0 140 0 0 0 0 0 0 0 0
Hourly Total 0 0 51 6 0 6 0 63 0 6 210 31 0 27 0 274 0 0 0 0 0 0 0 0
Session Total 0 0 282 43 3 35 6 369 0 18 850 110 2 106 0 1086 0 0 1 0 0 0 0 1
1630 - 1645 0 1 39 3 0 3 1 47 0 3 114 11 0 4 0 132 0 0 1 0 0 0 0 11645 - 1700 0 0 46 5 0 5 1 57 0 0 130 13 0 5 0 148 0 0 0 0 0 0 0 0
Hourly Total 0 1 85 8 0 8 2 104 0 3 244 24 0 9 0 280 0 0 1 0 0 0 0 11700 - 1715 0 0 47 4 2 8 1 62 0 0 115 13 0 9 0 137 0 0 1 0 0 0 0 11715 - 1730 0 0 47 5 0 6 1 59 0 1 103 16 0 8 0 128 0 0 0 0 0 0 0 01730 - 1745 0 0 42 5 1 2 0 50 0 0 112 9 0 9 0 130 0 0 0 0 0 0 0 01745 - 1800 0 0 49 4 2 1 0 56 0 1 115 10 0 16 0 142 0 0 0 0 0 0 0 0
Hourly Total 0 0 185 18 5 17 2 227 0 2 445 48 0 42 0 537 0 0 1 0 0 0 0 11800 - 1815 0 0 59 2 1 1 2 65 0 1 118 11 0 10 0 140 0 0 0 0 0 0 0 01815 - 1830 0 0 30 2 0 0 0 32 0 0 95 7 0 9 0 111 0 0 0 0 0 0 0 0
Hourly Total 0 0 89 4 1 1 2 97 0 1 213 18 0 19 0 251 0 0 0 0 0 0 0 0
Session Total 0 1 359 30 6 26 6 428 0 6 902 90 0 70 0 1068 0 0 2 0 0 0 0 2
Left to Derby Road Ahead to A50 (West) Right to Northern Arm

Uttoxeter - Manual Traffic Survey, Wednesday 8th June 2011
Produced by Road Data Services Ltd.
Junction: (3) A50 / Derby Road
Approach: Derby Road
TIME P/CYCLE M/CYCLE CAR LGV OGV1 OGV2 BUS TOTAL P/CYCLE M/CYCLE CAR LGV OGV1 OGV2 BUS TOTAL P/CYCLE M/CYCLE CAR LGV OGV1 OGV2 BUS TOTAL0730 - 0745 0 0 33 5 0 5 0 43 0 0 0 0 0 0 0 0 0 0 46 12 2 0 0 600745 - 0800 0 0 40 4 0 5 0 49 0 0 0 0 0 0 0 0 0 0 47 12 0 0 1 60
Hourly Total 0 0 73 9 0 10 0 92 0 0 0 0 0 0 0 0 0 0 93 24 2 0 1 1200800 - 0815 0 2 58 6 0 7 1 74 0 0 0 0 0 0 0 0 0 0 38 16 2 1 0 570815 - 0830 0 0 64 7 0 2 0 73 0 0 0 0 0 0 0 0 0 0 44 11 1 3 1 600830 - 0845 0 0 61 8 0 5 0 74 0 0 0 0 0 0 0 0 0 0 46 7 1 1 3 580845 - 0900 0 1 64 8 0 8 0 81 0 0 0 0 0 0 0 0 0 0 44 9 1 0 0 54
Hourly Total 0 3 247 29 0 22 1 302 0 0 0 0 0 0 0 0 0 0 172 43 5 5 4 2290900 - 0915 0 0 73 6 0 4 0 83 0 0 1 0 0 0 0 1 0 0 39 5 3 8 0 550915 - 0930 0 0 67 8 0 3 0 78 0 0 0 0 0 0 0 0 0 1 24 6 1 0 0 32
Hourly Total 0 0 140 14 0 7 0 161 0 0 1 0 0 0 0 1 0 1 63 11 4 8 0 87
Session Total 0 3 460 52 0 39 1 555 0 0 1 0 0 0 0 1 0 1 328 78 11 13 5 436
1630 - 1645 0 0 52 5 0 1 0 58 0 0 0 0 0 0 0 0 0 2 29 6 1 2 2 421645 - 1700 0 0 72 7 0 2 0 81 0 0 0 0 0 0 0 0 0 0 36 3 2 2 2 45
Hourly Total 0 0 124 12 0 3 0 139 0 0 0 0 0 0 0 0 0 2 65 9 3 4 4 871700 - 1715 0 1 73 6 0 4 0 84 0 0 1 0 0 0 0 1 0 0 42 5 2 0 0 491715 - 1730 0 0 70 5 0 4 0 79 0 0 0 0 0 0 0 0 0 0 40 4 0 1 0 451730 - 1745 0 2 62 7 1 3 0 75 0 0 1 0 0 0 0 1 0 0 47 5 0 2 1 551745 - 1800 0 2 60 7 0 3 0 72 0 0 0 0 0 0 0 0 0 0 47 3 1 3 1 55
Hourly Total 0 5 265 25 1 14 0 310 0 0 2 0 0 0 0 2 0 0 176 17 3 6 2 2041800 - 1815 0 0 50 5 0 1 0 56 0 0 0 0 0 0 0 0 0 0 31 3 0 2 1 371815 - 1830 0 0 56 5 0 2 0 63 0 0 0 0 0 0 0 0 0 0 22 2 0 1 0 25
Hourly Total 0 0 106 10 0 3 0 119 0 0 0 0 0 0 0 0 0 0 53 5 0 3 1 62
Session Total 0 5 495 47 1 20 0 568 0 0 2 0 0 0 0 2 0 2 294 31 6 13 7 353
Left to A50 (West) Ahead to Northern Arm Right to A50 (East)
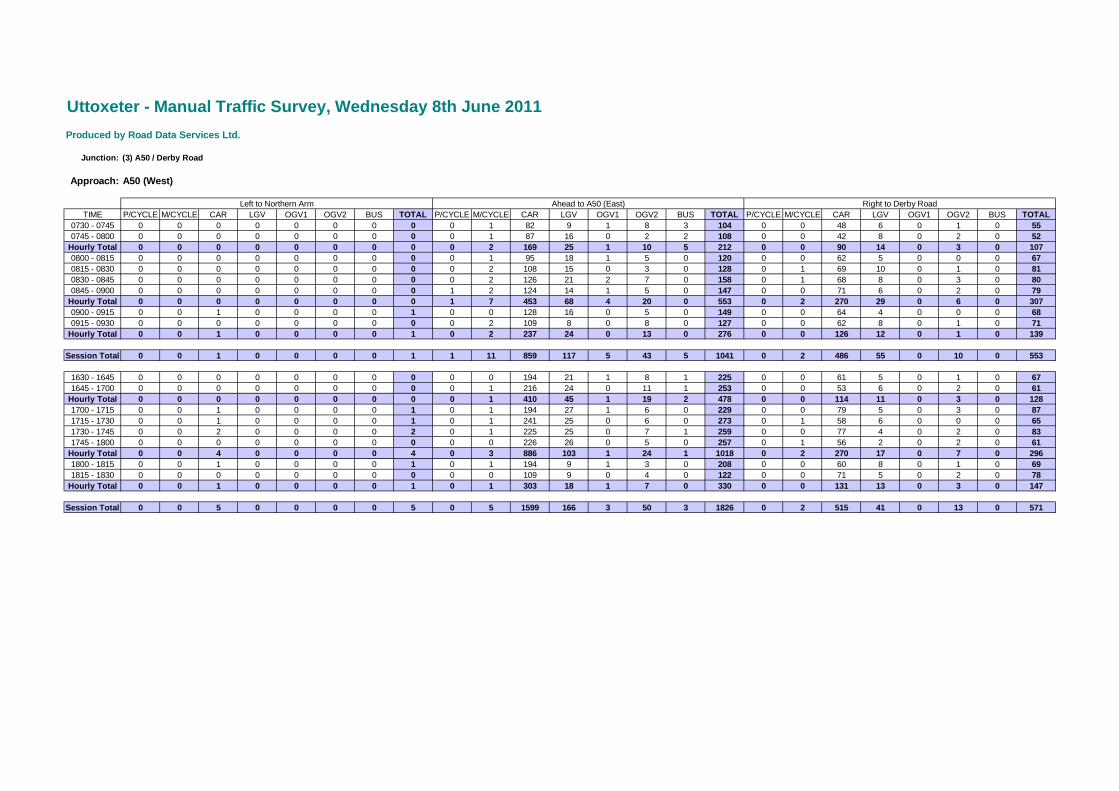
Uttoxeter - Manual Traffic Survey, Wednesday 8th June 2011
Produced by Road Data Services Ltd.
Junction: (3) A50 / Derby Road
Approach: A50 (West)
TIME P/CYCLE M/CYCLE CAR LGV OGV1 OGV2 BUS TOTAL P/CYCLE M/CYCLE CAR LGV OGV1 OGV2 BUS TOTAL P/CYCLE M/CYCLE CAR LGV OGV1 OGV2 BUS TOTAL0730 - 0745 0 0 0 0 0 0 0 0 0 1 82 9 1 8 3 104 0 0 48 6 0 1 0 550745 - 0800 0 0 0 0 0 0 0 0 0 1 87 16 0 2 2 108 0 0 42 8 0 2 0 52
Hourly Total 0 0 0 0 0 0 0 0 0 2 169 25 1 10 5 212 0 0 90 14 0 3 0 1070800 - 0815 0 0 0 0 0 0 0 0 0 1 95 18 1 5 0 120 0 0 62 5 0 0 0 670815 - 0830 0 0 0 0 0 0 0 0 0 2 108 15 0 3 0 128 0 1 69 10 0 1 0 810830 - 0845 0 0 0 0 0 0 0 0 0 2 126 21 2 7 0 158 0 1 68 8 0 3 0 800845 - 0900 0 0 0 0 0 0 0 0 1 2 124 14 1 5 0 147 0 0 71 6 0 2 0 79
Hourly Total 0 0 0 0 0 0 0 0 1 7 453 68 4 20 0 553 0 2 270 29 0 6 0 3070900 - 0915 0 0 1 0 0 0 0 1 0 0 128 16 0 5 0 149 0 0 64 4 0 0 0 680915 - 0930 0 0 0 0 0 0 0 0 0 2 109 8 0 8 0 127 0 0 62 8 0 1 0 71
Hourly Total 0 0 1 0 0 0 0 1 0 2 237 24 0 13 0 276 0 0 126 12 0 1 0 139
Session Total 0 0 1 0 0 0 0 1 1 11 859 117 5 43 5 1041 0 2 486 55 0 10 0 553
1630 - 1645 0 0 0 0 0 0 0 0 0 0 194 21 1 8 1 225 0 0 61 5 0 1 0 671645 - 1700 0 0 0 0 0 0 0 0 0 1 216 24 0 11 1 253 0 0 53 6 0 2 0 61
Hourly Total 0 0 0 0 0 0 0 0 0 1 410 45 1 19 2 478 0 0 114 11 0 3 0 1281700 - 1715 0 0 1 0 0 0 0 1 0 1 194 27 1 6 0 229 0 0 79 5 0 3 0 871715 - 1730 0 0 1 0 0 0 0 1 0 1 241 25 0 6 0 273 0 1 58 6 0 0 0 651730 - 1745 0 0 2 0 0 0 0 2 0 1 225 25 0 7 1 259 0 0 77 4 0 2 0 831745 - 1800 0 0 0 0 0 0 0 0 0 0 226 26 0 5 0 257 0 1 56 2 0 2 0 61
Hourly Total 0 0 4 0 0 0 0 4 0 3 886 103 1 24 1 1018 0 2 270 17 0 7 0 2961800 - 1815 0 0 1 0 0 0 0 1 0 1 194 9 1 3 0 208 0 0 60 8 0 1 0 691815 - 1830 0 0 0 0 0 0 0 0 0 0 109 9 0 4 0 122 0 0 71 5 0 2 0 78
Hourly Total 0 0 1 0 0 0 0 1 0 1 303 18 1 7 0 330 0 0 131 13 0 3 0 147
Session Total 0 0 5 0 0 0 0 5 0 5 1599 166 3 50 3 1826 0 2 515 41 0 13 0 571
Left to Northern Arm Ahead to A50 (East) Right to Derby Road

Uttoxeter - Manual Traffic Survey, Wednesday 8th June 2011
Produced by Road Data Services Ltd.
Junction: (4) A518 / Dove Walk / Dove Fields
Approach: A518 (North)
TIME P/CYCLE M/CYCLE CAR LGV OGV1 OGV2 BUS TOTAL P/CYCLE M/CYCLE CAR LGV OGV1 OGV2 BUS TOTAL P/CYCLE M/CYCLE CAR LGV OGV1 OGV2 BUS TOTAL0730 - 0745 0 0 0 0 0 0 0 0 0 0 11 3 0 1 0 15 0 0 68 9 1 3 1 820745 - 0800 0 0 0 0 0 0 0 0 0 0 14 1 0 0 0 15 0 0 54 11 0 4 2 71
Hourly Total 0 0 0 0 0 0 0 0 0 0 25 4 0 1 0 30 0 0 77 20 1 7 3 1080800 - 0815 0 0 0 0 0 0 0 0 0 0 15 3 0 2 0 20 0 1 84 15 1 5 1 1070815 - 0830 0 0 0 0 0 0 0 0 0 0 14 1 0 0 0 15 0 0 92 12 0 9 1 1140830 - 0845 0 0 1 0 0 0 0 1 0 1 24 1 0 2 0 28 0 1 90 13 1 5 1 1110845 - 0900 0 0 0 0 0 0 0 0 0 0 13 0 0 1 0 14 0 0 106 12 0 6 0 124
Hourly Total 0 0 1 0 0 0 0 1 0 1 66 5 0 5 0 77 0 2 372 52 2 25 3 4560900 - 0915 0 0 0 0 0 0 0 0 0 0 8 0 0 1 0 9 0 1 87 9 0 2 0 990915 - 0930 0 0 0 0 0 0 0 0 0 0 11 2 0 0 0 13 0 0 68 8 0 3 0 79
Hourly Total 0 0 0 0 0 0 0 0 0 0 19 2 0 1 0 22 0 1 155 17 0 5 0 178
Session Total 0 0 1 0 0 0 0 1 0 1 110 11 0 7 0 129 0 3 604 89 3 37 6 742
1630 - 1645 0 0 7 0 0 0 0 7 0 0 8 1 0 1 0 10 0 0 86 7 0 3 1 971645 - 1700 0 0 1 0 0 0 0 1 0 0 9 0 0 0 0 9 0 0 88 11 0 7 1 107
Hourly Total 0 0 8 0 0 0 0 8 0 0 17 1 0 1 0 19 0 0 174 18 0 10 2 2041700 - 1715 0 0 8 0 0 0 0 8 0 0 10 0 1 0 0 11 0 0 102 7 1 11 0 1211715 - 1730 0 0 0 0 0 0 0 0 0 0 8 0 0 0 0 8 0 0 96 12 0 6 1 1151730 - 1745 0 0 2 0 0 0 0 2 0 0 4 0 0 1 0 5 0 0 111 8 1 3 1 1241745 - 1800 0 0 1 0 0 0 0 1 0 0 4 1 0 0 0 5 1 2 104 6 2 3 0 118
Hourly Total 0 0 11 0 0 0 0 11 0 0 26 1 1 1 0 29 1 2 413 33 4 23 2 4781800 - 1815 0 0 2 0 0 0 0 2 0 0 4 0 0 0 0 4 1 0 105 10 0 2 2 1201815 - 1830 0 0 1 0 0 0 0 1 0 0 4 0 0 0 0 4 1 0 92 7 1 2 0 103
Hourly Total 0 0 3 0 0 0 0 3 0 0 8 0 0 0 0 8 2 0 197 17 1 4 2 223
Session Total 0 0 22 0 0 0 0 22 0 0 51 2 1 2 0 56 3 2 784 68 5 37 6 905
Left to Dove Walk Left to Dove Fields Ahead to A518 (South)

Uttoxeter - Manual Traffic Survey, Wednesday 8th June 2011
Produced by Road Data Services Ltd.
Junction: (4) A518 / Dove Walk / Dove Fields
Approach: Dove Walk
TIME P/CYCLE M/CYCLE CAR LGV OGV1 OGV2 BUS TOTAL P/CYCLE M/CYCLE CAR LGV OGV1 OGV2 BUS TOTAL P/CYCLE M/CYCLE CAR LGV OGV1 OGV2 BUS TOTAL0730 - 0745 0 0 1 0 0 0 0 1 0 0 0 0 0 0 0 0 0 0 5 0 0 0 0 50745 - 0800 0 0 0 0 0 0 0 0 0 0 2 0 0 0 0 2 0 0 2 0 0 0 0 2
Hourly Total 0 0 1 0 0 0 0 1 0 0 2 0 0 0 0 2 0 0 7 0 0 0 0 70800 - 0815 0 0 3 0 0 0 0 3 0 0 2 0 0 0 0 2 0 0 5 0 0 0 0 50815 - 0830 0 0 0 0 0 0 0 0 0 0 1 0 0 0 0 1 0 0 7 0 0 0 0 70830 - 0845 0 0 1 0 0 0 0 1 0 0 3 0 0 0 0 3 0 0 7 0 0 0 0 70845 - 0900 0 0 0 0 0 0 0 0 0 0 2 0 0 0 0 2 0 0 8 0 0 0 0 8
Hourly Total 0 0 4 0 0 0 0 4 0 0 8 0 0 0 0 8 0 0 27 0 0 0 0 270900 - 0915 0 0 1 0 0 0 0 1 0 0 1 0 0 0 0 1 0 0 4 1 0 0 0 50915 - 0930 0 0 0 0 0 0 0 0 0 0 5 0 0 0 0 5 0 0 1 0 0 0 0 1
Hourly Total 0 0 1 0 0 0 0 1 0 0 6 0 0 0 0 6 0 0 5 1 0 0 0 6
Session Total 0 0 6 0 0 0 0 6 0 0 16 0 0 0 0 16 0 0 39 1 0 0 0 40
1630 - 1645 0 0 0 0 0 0 0 0 0 0 1 0 0 0 0 1 0 0 2 1 0 0 0 31645 - 1700 0 0 0 0 0 0 0 0 0 0 2 0 0 0 0 2 0 0 2 0 0 0 0 2
Hourly Total 0 0 0 0 0 0 0 0 0 0 3 0 0 0 0 3 0 0 4 1 0 0 0 51700 - 1715 0 0 2 0 0 0 0 2 0 0 1 0 0 0 0 1 0 0 3 0 0 0 0 31715 - 1730 0 0 1 0 0 0 0 1 0 0 0 0 0 0 0 0 0 0 1 0 0 0 0 11730 - 1745 0 0 1 0 0 0 0 1 0 0 1 0 0 0 0 1 0 0 1 0 0 0 0 11745 - 1800 0 0 1 0 0 0 0 1 0 0 2 0 0 0 0 2 0 0 0 0 0 0 0 0
Hourly Total 0 0 5 0 0 0 0 5 0 0 4 0 0 0 0 4 0 0 5 0 0 0 0 51800 - 1815 0 0 1 0 0 0 0 1 0 0 0 0 0 0 0 0 0 0 1 0 0 0 0 11815 - 1830 0 0 0 0 0 0 0 0 0 0 1 0 0 0 0 1 0 0 0 0 0 0 0 0
Hourly Total 0 0 1 0 0 0 0 1 0 0 1 0 0 0 0 1 0 0 1 0 0 0 0 1
Session Total 0 0 6 0 0 0 0 6 0 0 8 0 0 0 0 8 0 0 10 1 0 0 0 11
Left to Dove Fields Left to A518 (South) Right to A518 (North)

Uttoxeter - Manual Traffic Survey, Wednesday 8th June 2011
Produced by Road Data Services Ltd.
Junction: (4) A518 / Dove Walk / Dove Fields
Approach: Dove Fields
TIME P/CYCLE M/CYCLE CAR LGV OGV1 OGV2 BUS TOTAL P/CYCLE M/CYCLE CAR LGV OGV1 OGV2 BUS TOTAL P/CYCLE M/CYCLE CAR LGV OGV1 OGV2 BUS TOTAL0730 - 0745 0 0 4 1 0 1 0 6 0 0 1 3 0 0 0 4 0 0 0 0 0 0 0 00745 - 0800 0 0 6 0 0 0 0 6 0 0 2 1 0 1 0 4 0 0 0 0 0 0 0 0
Hourly Total 0 0 10 1 0 1 0 12 0 0 3 4 0 1 0 8 0 0 0 0 0 0 0 00800 - 0815 0 0 5 0 1 0 0 6 0 0 8 2 0 3 0 13 0 0 0 0 0 0 0 00815 - 0830 0 0 6 0 0 0 0 6 0 0 9 3 0 2 0 14 0 0 0 0 0 0 0 00830 - 0845 0 0 5 0 0 2 0 7 0 0 10 2 0 0 0 12 0 0 0 0 0 0 0 00845 - 0900 0 0 1 0 0 1 0 2 0 0 17 1 0 1 0 19 0 0 2 0 0 0 0 2
Hourly Total 0 0 17 0 1 3 0 21 0 0 44 8 0 6 0 58 0 0 2 0 0 0 0 20900 - 0915 0 0 6 1 0 1 0 8 0 0 17 1 0 4 0 22 0 0 0 0 0 0 0 00915 - 0930 0 0 4 0 0 0 0 4 0 0 19 0 0 0 0 19 0 0 1 0 0 0 0 1
Hourly Total 0 0 10 1 0 1 0 12 0 0 36 1 0 4 0 41 0 0 1 0 0 0 0 1
Session Total 0 0 37 2 1 5 0 45 0 0 83 13 0 11 0 107 0 0 3 0 0 0 0 3
1630 - 1645 0 0 17 2 0 1 0 20 0 0 16 0 0 0 0 16 0 0 0 0 0 0 0 01645 - 1700 0 0 15 1 0 0 0 16 0 0 16 0 0 0 0 16 0 0 2 0 0 0 0 2
Hourly Total 0 0 32 3 0 1 0 36 0 0 32 0 0 0 0 32 0 0 2 0 0 0 0 21700 - 1715 0 1 15 1 0 0 0 17 0 0 12 0 0 1 0 13 0 0 1 0 0 0 0 11715 - 1730 0 0 21 1 0 0 0 22 0 0 14 0 0 0 0 14 0 0 0 0 0 0 0 01730 - 1745 0 0 23 2 0 0 0 25 0 2 13 1 0 0 0 16 0 0 0 0 0 0 0 01745 - 1800 0 0 25 0 0 0 0 25 0 0 14 0 0 0 0 14 0 0 1 0 0 0 0 1
Hourly Total 0 1 84 4 0 0 0 89 0 2 53 1 0 1 0 57 0 0 2 0 0 0 0 21800 - 1815 0 1 15 1 0 0 0 17 0 0 14 0 0 0 0 14 0 0 0 0 0 0 0 01815 - 1830 0 0 15 0 0 0 0 15 0 0 11 0 0 0 0 11 0 0 1 0 0 0 0 1
Hourly Total 0 1 30 1 0 0 0 32 0 0 25 0 0 0 0 25 0 0 1 0 0 0 0 1
Session Total 0 2 146 8 0 1 0 157 0 2 110 1 0 1 0 114 0 0 5 0 0 0 0 5
Left to A518 (South) Right to A518 (North) Right to Dove Walk

Uttoxeter - Manual Traffic Survey, Wednesday 8th June 2011
Produced by Road Data Services Ltd.
Junction: (4) A518 / Dove Walk / Dove Fields
Approach: A518 (South)
TIME P/CYCLE M/CYCLE CAR LGV OGV1 OGV2 BUS TOTAL P/CYCLE M/CYCLE CAR LGV OGV1 OGV2 BUS TOTAL P/CYCLE M/CYCLE CAR LGV OGV1 OGV2 BUS TOTAL0730 - 0745 0 0 75 14 1 5 0 95 0 0 2 0 0 0 0 2 0 0 17 1 0 0 0 180745 - 0800 1 0 83 15 1 3 1 104 0 0 1 0 0 0 0 1 0 0 15 2 0 0 0 17
Hourly Total 1 0 158 29 2 8 1 199 0 0 3 0 0 0 0 3 0 0 32 3 0 0 0 350800 - 0815 0 0 77 19 1 4 1 102 0 0 2 0 0 0 0 2 0 0 22 2 0 0 0 240815 - 0830 0 0 99 15 1 4 1 120 0 0 0 0 0 0 0 0 0 0 18 0 0 0 0 180830 - 0845 0 0 85 12 0 7 3 107 0 0 0 0 0 0 0 0 0 0 15 2 0 1 0 180845 - 0900 0 0 83 17 2 6 0 108 0 0 1 0 0 0 0 1 0 0 9 1 0 0 0 10
Hourly Total 0 0 344 63 4 21 5 437 0 0 3 0 0 0 0 3 0 0 64 5 0 1 0 700900 - 0915 0 0 87 9 3 9 0 108 0 0 1 1 0 0 0 2 0 0 9 1 0 0 0 100915 - 0930 0 1 72 14 1 3 0 91 0 0 0 0 0 0 0 0 0 0 11 2 0 0 0 13
Hourly Total 0 1 159 23 4 12 0 199 0 0 1 1 0 0 0 2 0 0 20 3 0 0 0 23
Session Total 1 1 661 115 10 41 6 835 0 0 7 1 0 0 0 8 0 0 116 11 0 1 0 128
1630 - 1645 0 1 65 9 1 3 2 81 0 0 2 0 0 0 0 2 0 0 9 1 0 0 0 101645 - 1700 1 2 82 10 3 4 2 104 0 0 9 0 0 0 0 9 0 0 7 1 0 0 0 8
Hourly Total 1 3 147 19 4 7 4 185 0 0 11 0 0 0 0 11 0 0 16 2 0 0 0 181700 - 1715 0 0 89 11 1 3 0 104 0 0 6 0 0 0 0 6 0 0 7 1 0 1 0 91715 - 1730 0 1 97 10 0 4 0 112 0 0 10 0 0 0 0 10 0 0 10 1 0 0 0 111730 - 1745 0 1 91 11 1 6 1 111 0 0 8 0 0 0 0 8 0 0 12 2 0 0 0 141745 - 1800 1 0 100 11 1 6 1 120 0 0 2 0 0 0 0 2 0 0 13 1 0 0 0 14
Hourly Total 1 2 377 43 3 19 2 447 0 0 26 0 0 0 0 26 0 0 42 5 0 1 0 481800 - 1815 0 0 65 9 0 3 1 78 0 0 2 0 0 0 0 2 0 0 10 1 1 0 0 121815 - 1830 0 0 67 5 0 3 0 75 0 0 1 0 0 0 0 1 0 0 8 0 0 0 0 8
Hourly Total 0 0 132 14 0 6 1 153 0 0 3 0 0 0 0 3 0 0 18 1 1 0 0 20
Session Total 2 5 656 76 7 32 7 785 0 0 40 0 0 0 0 40 0 0 76 8 1 1 0 86
Ahead to A518 (North) Right to Dove Walk Right to Dove Fields

Uttoxeter - Manual Traffic Survey, Wednesday 8th June 2011
Produced by Road Data Services Ltd.
Junction: (5) The Dove Way / A518 / Roebuck Close
Approach: The Dove Way
TIME P/CYCLE M/CYCLE CAR LGV OGV1 OGV2 BUS TOTAL P/CYCLE M/CYCLE CAR LGV OGV1 OGV2 BUS TOTAL P/CYCLE M/CYCLE CAR LGV OGV1 OGV2 BUS TOTAL0730 - 0745 0 0 3 1 0 0 0 4 0 0 40 5 0 3 0 48 0 0 0 0 0 0 0 00745 - 0800 0 0 6 2 0 0 0 8 0 1 55 3 0 5 0 64 0 0 1 0 0 0 0 1
Hourly Total 0 0 9 3 0 0 0 12 0 1 95 8 0 8 0 112 0 0 1 0 0 0 0 10800 - 0815 0 0 1 1 1 0 0 3 0 0 69 10 0 4 1 84 0 0 1 0 0 0 0 10815 - 0830 0 0 5 1 0 0 0 6 0 0 73 8 1 2 0 84 0 0 0 0 0 0 0 00830 - 0845 0 0 5 0 0 0 1 6 0 1 73 7 1 3 0 85 0 0 0 0 0 0 0 00845 - 0900 0 0 0 2 1 0 0 3 0 2 85 6 2 4 0 99 0 0 0 0 0 0 0 0
Hourly Total 0 0 11 4 2 0 1 18 0 3 300 31 4 13 1 352 0 0 1 0 0 0 0 10900 - 0915 0 0 0 0 1 0 0 1 0 1 88 5 1 3 0 98 0 0 0 0 0 0 0 00915 - 0930 0 0 2 0 0 0 0 2 0 0 73 6 0 2 0 81 0 0 0 0 0 0 0 0
Hourly Total 0 0 2 0 1 0 0 3 0 1 161 11 1 5 0 179 0 0 0 0 0 0 0 0
Session Total 0 0 22 7 3 0 1 33 0 5 556 50 5 26 1 643 0 0 2 0 0 0 0 2
1630 - 1645 0 0 4 0 0 0 0 4 0 1 65 9 0 5 0 80 0 0 0 0 0 0 0 01645 - 1700 0 0 4 3 1 0 0 8 0 0 68 10 0 2 0 80 0 0 0 0 0 0 0 0
Hourly Total 0 0 8 3 1 0 0 12 0 1 133 19 0 7 0 160 0 0 0 0 0 0 0 01700 - 1715 0 0 4 1 0 0 0 5 0 2 69 13 1 2 1 88 0 0 0 0 0 0 0 01715 - 1730 0 0 5 0 0 0 0 5 0 1 74 14 0 3 0 92 0 0 0 0 0 0 0 01730 - 1745 0 0 2 1 0 0 0 3 0 3 81 10 0 1 0 95 0 0 1 0 0 0 0 11745 - 1800 1 0 0 0 0 0 0 1 0 0 86 12 0 2 0 100 0 0 0 0 0 0 0 0
Hourly Total 1 0 11 2 0 0 0 14 0 6 310 49 1 8 1 375 0 0 1 0 0 0 0 11800 - 1815 0 0 5 0 0 0 0 5 0 1 55 12 1 2 0 71 0 0 0 0 0 0 0 01815 - 1830 0 0 2 0 0 0 0 2 0 1 45 4 0 2 0 52 0 0 0 0 0 0 0 0
Hourly Total 0 0 7 0 0 0 0 7 0 2 100 16 1 4 0 123 0 0 0 0 0 0 0 0
Session Total 1 0 26 5 1 0 0 33 0 9 543 84 2 19 1 658 0 0 1 0 0 0 0 1
Left to A518 (East) Ahead to A518 (South) Right to Roebuck Close

Uttoxeter - Manual Traffic Survey, Wednesday 8th June 2011
Produced by Road Data Services Ltd.
Junction: (5) The Dove Way / A518 / Roebuck Close
Approach: A518 (East)
TIME P/CYCLE M/CYCLE CAR LGV OGV1 OGV2 BUS TOTAL P/CYCLE M/CYCLE CAR LGV OGV1 OGV2 BUS TOTAL P/CYCLE M/CYCLE CAR LGV OGV1 OGV2 BUS TOTAL0730 - 0745 0 0 67 10 0 4 1 82 0 0 0 0 0 0 0 0 0 0 5 0 0 0 0 50745 - 0800 0 0 59 10 0 4 2 75 0 0 0 0 0 0 0 0 0 0 4 2 1 0 0 7
Hourly Total 0 0 126 20 0 8 3 157 0 0 0 0 0 0 0 0 0 0 9 2 1 0 0 120800 - 0815 0 1 83 12 1 5 1 103 0 0 0 0 0 0 0 0 0 0 7 2 1 0 0 100815 - 0830 0 0 97 9 0 9 1 116 0 0 1 0 0 0 0 1 0 0 1 4 0 0 0 50830 - 0845 0 1 94 10 1 7 1 114 0 0 0 0 0 0 0 0 0 0 5 2 0 0 0 70845 - 0900 0 0 102 11 0 7 0 120 0 0 0 0 0 0 0 0 0 0 3 0 0 0 0 3
Hourly Total 0 2 376 42 2 28 3 453 0 0 1 0 0 0 0 1 0 0 16 8 1 0 0 250900 - 0915 1 0 85 8 0 3 0 97 0 0 0 0 0 0 0 0 0 1 3 3 0 0 0 70915 - 0930 0 0 74 6 0 3 0 83 0 0 0 0 0 0 0 0 0 0 2 0 0 0 0 2
Hourly Total 1 0 159 14 0 6 0 180 0 0 0 0 0 0 0 0 0 1 5 3 0 0 0 9
Session Total 1 2 661 76 2 42 6 790 0 0 1 0 0 0 0 1 0 1 30 13 2 0 0 46
1630 - 1645 0 0 101 8 0 4 1 114 0 0 0 0 0 0 0 0 0 0 4 2 0 0 0 61645 - 1700 0 1 102 11 0 7 1 122 0 0 0 0 0 0 0 0 0 0 1 1 0 0 0 2
Hourly Total 0 1 203 19 0 11 2 236 0 0 0 0 0 0 0 0 0 0 5 3 0 0 0 81700 - 1715 0 0 110 7 1 10 0 128 0 0 0 0 0 0 0 0 0 0 6 2 0 0 0 81715 - 1730 0 0 111 10 0 7 0 128 0 0 0 0 0 0 0 0 0 0 7 1 0 0 1 91730 - 1745 1 0 132 9 1 3 1 147 0 0 1 0 0 0 0 1 0 0 2 0 0 0 0 21745 - 1800 1 0 129 7 1 3 0 141 0 0 0 0 0 0 0 0 0 2 0 0 0 0 0 2
Hourly Total 2 0 482 33 3 23 1 544 0 0 1 0 0 0 0 1 0 2 15 3 0 0 1 211800 - 1815 0 1 132 10 0 2 2 147 0 0 0 0 0 0 0 0 0 0 0 0 0 0 0 01815 - 1830 2 0 105 9 2 2 0 120 0 0 2 0 0 0 0 2 0 0 0 0 0 0 0 0
Hourly Total 2 1 237 19 2 4 2 267 0 0 2 0 0 0 0 2 0 0 0 0 0 0 0 0
Session Total 4 2 922 71 5 38 5 1047 0 0 3 0 0 0 0 3 0 2 20 6 0 0 1 29
Left to A518 (South) Ahead to Roebuck Close Right to The Dove Way

Uttoxeter - Manual Traffic Survey, Wednesday 8th June 2011
Produced by Road Data Services Ltd.
Junction: (5) The Dove Way / A518 / Roebuck Close
Approach: A518 (South)
TIME P/CYCLE M/CYCLE CAR LGV OGV1 OGV2 BUS TOTAL P/CYCLE M/CYCLE CAR LGV OGV1 OGV2 BUS TOTAL P/CYCLE M/CYCLE CAR LGV OGV1 OGV2 BUS TOTAL0730 - 0745 0 0 0 0 0 0 0 0 0 0 33 5 0 1 1 40 0 0 91 12 1 5 0 1090745 - 0800 0 0 0 0 0 0 0 0 0 0 63 10 0 3 1 77 1 0 95 15 1 3 1 116
Hourly Total 0 0 0 0 0 0 0 0 0 0 96 15 0 4 2 117 1 0 186 27 2 8 1 2250800 - 0815 0 0 0 0 0 0 0 0 0 0 69 7 0 3 2 81 0 0 97 21 0 3 1 1220815 - 0830 0 0 0 0 0 0 0 0 0 0 74 4 0 5 1 84 0 0 107 13 1 5 1 1270830 - 0845 0 0 0 0 0 0 0 0 0 1 83 5 1 4 2 96 1 0 95 13 0 7 2 1180845 - 0900 0 0 0 0 0 0 0 0 0 1 66 10 1 5 0 83 0 0 94 18 1 6 0 119
Hourly Total 0 0 0 0 0 0 0 0 0 2 292 26 2 17 5 344 1 0 393 65 2 21 4 4860900 - 0915 0 0 0 0 0 0 0 0 0 0 51 4 0 3 1 59 0 0 92 13 2 9 0 1160915 - 0930 0 0 0 0 0 0 0 0 0 0 50 7 0 2 0 59 0 1 82 15 1 3 0 102
Hourly Total 0 0 0 0 0 0 0 0 0 0 101 11 0 5 1 118 0 1 174 28 3 12 0 218
Session Total 0 0 0 0 0 0 0 0 0 2 489 52 2 26 8 579 2 1 753 120 7 41 5 929
1630 - 1645 0 0 2 0 0 0 0 2 0 1 74 5 1 2 0 83 0 1 72 10 1 3 2 891645 - 1700 0 0 0 0 0 0 0 0 0 0 81 11 0 4 0 96 1 2 93 9 2 4 2 113
Hourly Total 0 0 2 0 0 0 0 2 0 1 155 16 1 6 0 179 1 3 165 19 3 7 4 2021700 - 1715 0 0 1 0 0 0 0 1 0 0 70 9 0 1 1 81 0 0 99 11 1 4 0 1151715 - 1730 0 0 1 0 0 0 0 1 0 0 60 6 1 3 0 70 0 2 112 11 0 4 0 1291730 - 1745 0 0 0 0 0 0 0 0 0 0 74 8 0 3 1 86 0 0 105 12 1 6 1 1251745 - 1800 0 0 0 0 0 0 0 0 0 0 65 6 1 2 1 75 0 0 108 11 1 7 1 128
Hourly Total 0 0 2 0 0 0 0 2 0 0 269 29 2 9 3 312 0 2 424 45 3 21 2 4971800 - 1815 0 0 0 0 0 0 0 0 0 0 80 5 0 3 1 89 0 0 71 10 0 2 1 841815 - 1830 0 0 1 0 0 0 0 1 0 0 76 3 0 2 0 81 0 0 73 6 1 3 0 83
Hourly Total 0 0 1 0 0 0 0 1 0 0 156 8 0 5 1 170 0 0 144 16 1 5 1 167
Session Total 0 0 5 0 0 0 0 5 0 1 580 53 3 20 4 661 1 5 733 80 7 33 7 866
Left to Roebuck Close Ahead to The Dove Way Right to A518 (East)

Uttoxeter - Manual Traffic Survey, Wednesday 8th June 2011
Produced by Road Data Services Ltd.
Junction: (5) The Dove Way / A518 / Roebuck Close
Approach: Roebuck Close
TIME P/CYCLE M/CYCLE CAR LGV OGV1 OGV2 BUS TOTAL P/CYCLE M/CYCLE CAR LGV OGV1 OGV2 BUS TOTAL P/CYCLE M/CYCLE CAR LGV OGV1 OGV2 BUS TOTAL0730 - 0745 0 0 0 0 0 0 0 0 0 0 0 1 0 0 0 1 0 0 0 0 0 0 0 00745 - 0800 0 0 0 0 0 0 0 0 0 0 0 0 0 0 0 0 0 0 1 0 0 0 0 1
Hourly Total 0 0 0 0 0 0 0 0 0 0 0 1 0 0 0 1 0 0 1 0 0 0 0 10800 - 0815 0 0 0 0 0 0 0 0 0 0 1 0 0 0 0 1 0 0 0 0 0 0 0 00815 - 0830 0 0 0 0 0 0 0 0 0 0 1 0 0 0 0 1 0 0 1 0 0 0 0 10830 - 0845 0 0 0 0 0 0 0 0 0 0 0 0 0 0 0 0 0 0 0 0 0 0 0 00845 - 0900 0 0 0 0 0 0 0 0 0 0 0 0 0 0 0 0 0 0 0 0 0 0 0 0
Hourly Total 0 0 0 0 0 0 0 0 0 0 2 0 0 0 0 2 0 0 1 0 0 0 0 10900 - 0915 0 0 0 0 0 0 0 0 0 0 0 0 0 0 0 0 0 0 1 0 0 0 0 10915 - 0930 0 0 1 0 0 0 0 1 0 0 0 0 0 0 0 0 0 0 0 0 0 0 0 0
Hourly Total 0 0 1 0 0 0 0 1 0 0 0 0 0 0 0 0 0 0 1 0 0 0 0 1
Session Total 0 0 1 0 0 0 0 1 0 0 2 1 0 0 0 3 0 0 3 0 0 0 0 3
1630 - 1645 0 0 0 0 0 0 0 0 0 0 1 0 0 0 0 1 0 0 1 0 0 0 0 11645 - 1700 0 0 0 0 0 0 0 0 0 0 0 0 0 0 0 0 0 0 2 0 0 0 0 2
Hourly Total 0 0 0 0 0 0 0 0 0 0 1 0 0 0 0 1 0 0 3 0 0 0 0 31700 - 1715 0 0 0 0 0 0 0 0 0 0 0 0 0 0 0 0 0 0 0 0 0 0 0 01715 - 1730 0 0 0 0 0 0 0 0 0 0 0 0 0 0 0 0 0 0 0 0 0 0 0 01730 - 1745 0 0 0 0 0 0 0 0 0 0 0 0 0 0 0 0 0 0 0 0 0 0 0 01745 - 1800 0 0 0 0 0 0 0 0 0 0 0 0 0 0 0 0 0 0 0 0 0 0 0 0
Hourly Total 0 0 0 0 0 0 0 0 0 0 0 0 0 0 0 0 0 0 0 0 0 0 0 01800 - 1815 0 0 0 0 0 0 0 0 0 0 1 0 0 0 0 1 0 0 1 0 0 0 0 11815 - 1830 0 0 1 0 0 0 0 1 0 0 1 0 0 0 0 1 0 0 2 0 0 0 0 2
Hourly Total 0 0 1 0 0 0 0 1 0 0 2 0 0 0 0 2 0 0 3 0 0 0 0 3
Session Total 0 0 1 0 0 0 0 1 0 0 3 0 0 0 0 3 0 0 6 0 0 0 0 6
Left to The Dove Way Ahead to A518 (East) Right to A518 (South)

Uttoxeter - Manual Traffic Survey, Wednesday 8th June 2011
Produced by Road Data Services Ltd.
Junction: (6) A518 / Retail Park / Dove Bank
Approach: A518 (North)
TIME P/CYCLE M/CYCLE CAR LGV OGV1 OGV2 BUS TOTAL P/CYCLE M/CYCLE CAR LGV OGV1 OGV2 BUS TOTAL P/CYCLE M/CYCLE CAR LGV OGV1 OGV2 BUS TOTAL0730 - 0745 0 0 1 0 0 0 0 1 0 0 94 13 0 7 1 115 0 0 12 2 0 0 0 140745 - 0800 0 0 9 0 0 0 0 9 0 1 89 6 0 9 2 107 0 0 17 7 0 0 0 24
Hourly Total 0 0 10 0 0 0 0 10 0 1 183 19 0 16 3 222 0 0 29 9 0 0 0 380800 - 0815 0 0 10 2 0 0 0 12 0 0 117 13 1 8 0 139 0 1 25 7 0 1 2 360815 - 0830 0 0 8 1 0 0 0 9 0 0 120 9 1 11 0 141 0 0 43 7 0 0 1 510830 - 0845 0 0 8 0 0 0 0 8 0 2 120 13 2 10 1 148 0 0 39 4 0 0 0 430845 - 0900 0 0 7 0 0 0 0 7 0 2 143 13 2 11 0 171 0 0 37 4 0 0 0 41
Hourly Total 0 0 33 3 0 0 0 36 0 4 500 48 6 40 1 599 0 1 144 22 0 1 3 1710900 - 0915 0 0 20 3 0 0 0 23 1 1 113 6 1 6 0 128 0 0 41 4 0 0 0 450915 - 0930 0 0 11 2 0 0 0 13 0 0 98 8 0 5 0 111 0 0 38 2 0 0 0 40
Hourly Total 0 0 31 5 0 0 0 36 1 1 211 14 1 11 0 239 0 0 79 6 0 0 0 85
Session Total 0 0 74 8 0 0 0 82 1 6 894 81 7 67 4 1060 0 1 252 37 0 1 3 294
1630 - 1645 0 0 13 1 0 0 0 14 0 1 116 14 0 8 1 140 0 0 38 2 0 1 0 411645 - 1700 0 0 15 2 0 0 0 17 0 1 125 12 0 8 1 147 0 0 32 7 0 1 0 40
Hourly Total 0 0 28 3 0 0 0 31 0 2 241 26 0 16 2 287 0 0 70 9 0 2 0 811700 - 1715 0 0 18 1 0 0 0 19 0 1 126 15 2 11 0 155 0 1 35 4 0 1 1 421715 - 1730 0 0 17 0 0 0 0 17 0 0 133 18 0 10 0 161 0 1 35 6 0 0 0 421730 - 1745 0 0 12 0 0 0 0 12 1 2 161 17 1 4 1 187 0 1 40 2 0 0 0 431745 - 1800 0 0 10 3 0 0 0 13 1 0 179 14 1 5 0 200 0 0 26 2 0 0 0 28
Hourly Total 0 0 57 4 0 0 0 61 2 3 599 64 4 30 1 703 0 3 136 14 0 1 1 1551800 - 1815 0 0 10 3 0 0 0 13 0 0 159 17 1 4 2 183 0 2 19 2 0 0 0 231815 - 1830 0 0 6 1 0 0 0 7 2 0 129 11 2 4 0 148 0 1 17 1 0 0 0 19
Hourly Total 0 0 16 4 0 0 0 20 2 0 288 28 3 8 2 331 0 3 36 3 0 0 0 42
Session Total 0 0 101 11 0 0 0 112 4 5 1128 118 7 54 5 1321 0 6 242 26 0 3 1 278
Left to Retail Park Ahead to A518 (South) Right to Dove Bank

Uttoxeter - Manual Traffic Survey, Wednesday 8th June 2011
Produced by Road Data Services Ltd.
Junction: (6) A518 / Retail Park / Dove Bank
Approach: Retail Park
TIME P/CYCLE M/CYCLE CAR LGV OGV1 OGV2 BUS TOTAL P/CYCLE M/CYCLE CAR LGV OGV1 OGV2 BUS TOTAL P/CYCLE M/CYCLE CAR LGV OGV1 OGV2 BUS TOTAL0730 - 0745 0 0 0 1 0 0 0 1 0 0 0 0 0 0 0 0 0 0 2 0 0 0 0 20745 - 0800 0 0 3 0 0 0 0 3 0 0 0 0 0 0 0 0 0 0 7 0 0 0 0 7
Hourly Total 0 0 3 1 0 0 0 4 0 0 0 0 0 0 0 0 0 0 9 0 0 0 0 90800 - 0815 0 0 3 0 0 0 0 3 0 0 1 0 0 0 0 1 0 0 5 2 0 0 0 70815 - 0830 0 0 5 0 0 0 0 5 0 0 1 0 0 0 0 1 0 0 12 0 0 0 0 120830 - 0845 0 0 19 0 0 0 0 19 0 0 3 1 0 0 0 4 0 0 12 1 0 0 0 130845 - 0900 0 0 9 1 0 0 0 10 0 0 4 0 0 0 0 4 0 0 19 0 0 0 0 19
Hourly Total 0 0 36 1 0 0 0 37 0 0 9 1 0 0 0 10 0 0 48 3 0 0 0 510900 - 0915 0 0 12 1 0 0 0 13 0 0 7 0 0 0 0 7 0 0 20 3 0 0 0 230915 - 0930 0 0 7 0 0 0 0 7 0 0 6 0 0 0 0 6 0 0 9 2 0 0 0 11
Hourly Total 0 0 19 1 0 0 0 20 0 0 13 0 0 0 0 13 0 0 29 5 0 0 0 34
Session Total 0 0 58 3 0 0 0 61 0 0 22 1 0 0 0 23 0 0 86 8 0 0 0 94
1630 - 1645 0 0 18 0 0 0 0 18 0 0 12 1 0 0 0 13 0 0 27 0 0 0 0 271645 - 1700 0 0 19 0 0 0 0 19 0 0 9 0 0 0 0 9 0 0 22 1 0 0 0 23
Hourly Total 0 0 37 0 0 0 0 37 0 0 21 1 0 0 0 22 0 0 49 1 0 0 0 501700 - 1715 0 0 15 1 0 0 0 16 0 0 10 0 0 0 0 10 0 0 19 3 0 0 0 221715 - 1730 0 0 22 0 0 0 0 22 0 0 5 0 0 0 0 5 0 0 17 1 0 0 0 181730 - 1745 0 0 20 0 0 0 0 20 0 0 6 0 0 0 0 6 0 0 15 1 0 0 0 161745 - 1800 0 0 20 1 0 0 0 21 0 0 7 0 0 0 0 7 0 0 17 1 0 0 0 18
Hourly Total 0 0 77 2 0 0 0 79 0 0 28 0 0 0 0 28 0 0 68 6 0 0 0 741800 - 1815 0 0 22 0 0 0 0 22 0 0 9 2 0 0 0 11 0 0 21 1 0 0 0 221815 - 1830 0 0 21 0 0 0 0 21 0 0 7 1 0 0 0 8 0 0 18 0 0 0 0 18
Hourly Total 0 0 43 0 0 0 0 43 0 0 16 3 0 0 0 19 0 0 39 1 0 0 0 40
Session Total 0 0 157 2 0 0 0 159 0 0 65 4 0 0 0 69 0 0 156 8 0 0 0 164
Left to A518 (South) Ahead to Dove Bank Right to A518 (North)

Uttoxeter - Manual Traffic Survey, Wednesday 8th June 2011
Produced by Road Data Services Ltd.
Junction: (6) A518 / Retail Park / Dove Bank
Approach: A518 (South)
TIME P/CYCLE M/CYCLE CAR LGV OGV1 OGV2 BUS TOTAL P/CYCLE M/CYCLE CAR LGV OGV1 OGV2 BUS TOTAL P/CYCLE M/CYCLE CAR LGV OGV1 OGV2 BUS TOTAL0730 - 0745 0 0 5 0 0 0 0 5 0 0 108 14 1 5 1 129 0 0 2 1 0 0 0 30745 - 0800 0 0 7 0 0 0 0 7 1 0 134 23 1 4 2 165 0 0 4 4 0 0 0 8
Hourly Total 0 0 12 0 0 0 0 12 1 0 242 37 2 9 3 294 0 0 6 5 0 0 0 110800 - 0815 0 0 19 1 0 0 0 20 0 0 138 24 0 4 3 169 0 0 14 3 0 0 0 170815 - 0830 0 0 21 1 0 0 0 22 0 0 144 15 1 10 2 172 0 0 18 3 0 0 0 210830 - 0845 0 0 22 4 0 0 0 26 1 1 131 14 1 11 4 163 0 0 20 1 0 0 0 210845 - 0900 0 0 15 4 0 0 0 19 0 1 113 24 2 11 0 151 0 0 15 0 0 0 0 15
Hourly Total 0 0 77 10 0 0 0 87 1 2 526 77 4 36 9 655 0 0 67 7 0 0 0 740900 - 0915 0 0 15 1 0 0 0 16 0 0 93 11 2 10 1 117 0 0 17 0 0 0 0 170915 - 0930 0 0 11 0 0 0 0 11 0 1 107 19 1 5 0 133 0 0 13 0 0 0 0 13
Hourly Total 0 0 26 1 0 0 0 27 0 1 200 30 3 15 1 250 0 0 30 0 0 0 0 30
Session Total 0 0 115 11 0 0 0 126 2 3 968 144 9 60 13 1199 0 0 103 12 0 0 0 115
1630 - 1645 0 0 25 1 0 0 0 26 0 2 64 12 2 5 2 87 0 0 20 0 0 0 0 201645 - 1700 0 0 31 3 0 0 1 35 1 2 97 12 2 8 2 124 0 0 16 0 0 0 0 16
Hourly Total 0 0 56 4 0 0 1 61 1 4 161 24 4 13 4 211 0 0 36 0 0 0 0 361700 - 1715 0 0 36 1 0 0 0 37 0 0 101 10 1 5 1 118 0 0 19 2 0 0 0 211715 - 1730 0 0 32 4 0 0 0 36 0 2 109 7 1 7 0 126 0 0 23 3 0 0 0 261730 - 1745 0 0 41 6 0 0 1 48 0 0 115 14 1 9 2 141 0 0 21 3 0 0 0 241745 - 1800 0 0 31 3 0 0 0 34 0 0 122 9 2 9 2 144 0 0 23 1 0 0 0 24
Hourly Total 0 0 140 14 0 0 1 155 0 2 447 40 5 30 5 529 0 0 86 9 0 0 0 951800 - 1815 0 0 28 4 0 0 0 32 0 0 96 13 0 5 2 116 0 0 18 1 0 0 0 191815 - 1830 0 0 30 0 0 0 0 30 0 0 111 9 1 5 0 126 0 0 8 0 0 0 0 8
Hourly Total 0 0 58 4 0 0 0 62 0 0 207 22 1 10 2 242 0 0 26 1 0 0 0 27
Session Total 0 0 254 22 0 0 2 278 1 6 815 86 10 53 11 982 0 0 148 10 0 0 0 158
Left to Dove Bank Ahead to A518 (North) Right to Retail Park

Uttoxeter - Manual Traffic Survey, Wednesday 8th June 2011
Produced by Road Data Services Ltd.
Junction: (6) A518 / Retail Park / Dove Bank
Approach: Dove Bank
TIME P/CYCLE M/CYCLE CAR LGV OGV1 OGV2 BUS TOTAL P/CYCLE M/CYCLE CAR LGV OGV1 OGV2 BUS TOTAL P/CYCLE M/CYCLE CAR LGV OGV1 OGV2 BUS TOTAL0730 - 0745 0 0 14 3 0 1 0 18 0 0 3 2 0 0 0 5 0 1 18 3 0 1 0 230745 - 0800 0 0 17 2 0 2 0 21 0 0 1 2 0 0 0 3 0 0 18 3 0 0 0 21
Hourly Total 0 0 31 5 0 3 0 39 0 0 4 4 0 0 0 8 0 1 36 6 0 1 0 440800 - 0815 0 0 23 2 0 2 0 27 0 0 10 1 0 0 0 11 0 0 30 4 0 0 2 360815 - 0830 0 0 25 2 0 0 0 27 0 0 16 0 0 0 0 16 0 0 26 4 0 0 2 320830 - 0845 0 0 35 3 0 0 0 38 0 1 17 3 0 0 0 21 0 1 32 6 0 0 0 390845 - 0900 0 0 28 4 0 0 0 32 0 0 15 2 0 0 0 17 0 0 34 5 0 0 0 39
Hourly Total 0 0 111 11 0 2 0 124 0 1 58 6 0 0 0 65 0 1 122 19 0 0 4 1460900 - 0915 0 0 30 3 0 2 0 35 0 0 15 2 0 0 0 17 0 0 43 5 0 1 2 510915 - 0930 0 0 16 1 0 0 0 17 0 0 9 0 0 0 0 9 0 0 42 6 0 0 1 49
Hourly Total 0 0 46 4 0 2 0 52 0 0 24 2 0 0 0 26 0 0 85 11 0 1 3 100
Session Total 0 0 188 20 0 7 0 215 0 1 86 12 0 0 0 99 0 2 243 36 0 2 7 290
1630 - 1645 0 0 57 3 0 0 0 60 0 0 23 0 0 0 0 23 0 0 35 6 0 1 1 431645 - 1700 0 0 55 7 0 0 0 62 0 0 20 1 0 0 0 21 0 0 35 5 0 1 0 41
Hourly Total 0 0 112 10 0 0 0 122 0 0 43 1 0 0 0 44 0 0 70 11 0 2 1 841700 - 1715 0 0 50 7 0 0 0 57 0 0 31 3 0 0 0 34 0 0 39 5 0 1 1 461715 - 1730 0 0 47 9 0 0 0 56 0 0 33 0 0 0 0 33 0 0 34 9 0 1 1 451730 - 1745 0 0 49 5 0 0 0 54 0 2 23 0 0 0 0 25 0 0 51 3 0 1 2 571745 - 1800 0 0 34 7 0 0 0 41 0 0 11 0 0 0 0 11 0 0 41 1 0 0 0 42
Hourly Total 0 0 180 28 0 0 0 208 0 2 98 3 0 0 0 103 0 0 165 18 0 3 4 1901800 - 1815 0 0 34 1 0 0 0 35 0 0 12 2 0 0 0 14 0 1 43 4 1 0 0 491815 - 1830 0 0 21 0 0 0 0 21 0 0 11 1 0 0 0 12 0 0 30 3 0 0 0 33
Hourly Total 0 0 55 1 0 0 0 56 0 0 23 3 0 0 0 26 0 1 73 7 1 0 0 82
Session Total 0 0 347 39 0 0 0 386 0 2 164 7 0 0 0 173 0 1 308 36 1 5 5 356
Left to A518 (North) Ahead to Retail Park Right to A518 (South)

APPENDIX F

TRICS 2011(b)v6.8.1 270611 B14.55 (C) 2011 JMP Consultants Ltd on behalf of the TRICS Consortium Wednesday 06/07/11
Page 1
M-EC Wellington House Ibstock Licence No: 350901
TRIP RATE CALCULATION SELECTION PARAMETERS:
Land Use : 03 - RESIDENTIAL
Category : A - HOUSES PRIVATELY OWNED
VEHICLES
Selected regions and areas:
02 SOUTH EAST
BD BEDFORDSHIRE 2 days
03 SOUTH WEST
CW CORNWALL 1 days
DC DORSET 1 days
WL WILTSHIRE 1 days
04 EAST ANGLIA
SF SUFFOLK 2 days
06 WEST MIDLANDS
SH SHROPSHIRE 1 days
WM WEST MIDLANDS 2 days
WO WORCESTERSHIRE 2 days
07 YORKSHIRE & NORTH LINCOLNSHIRE
NY NORTH YORKSHIRE 2 days
08 NORTH WEST
CH CHESHIRE 1 days
LC LANCASHIRE 1 days
09 NORTH
CB CUMBRIA 3 days
Filtering Stage 2 selection:
Parameter: Number of dwellings
Range: 40 to 138 (units: )
Public Transport Provision:
Selection by: Include all surveys
Date Range: 01/01/03 to 21/06/09
Selected survey days:
Monday 5 days
Tuesday 6 days
Wednesday 2 days
Thursday 3 days
Friday 3 days
Selected survey types:
Manual count 19 days
Directional ATC Count 0 days
Selected Locations:
Suburban Area (PPS6 Out of Centre) 10
Edge of Town 9
Selected Location Sub Categories:
Residential Zone 13
Out of Town 1
No Sub Category 5
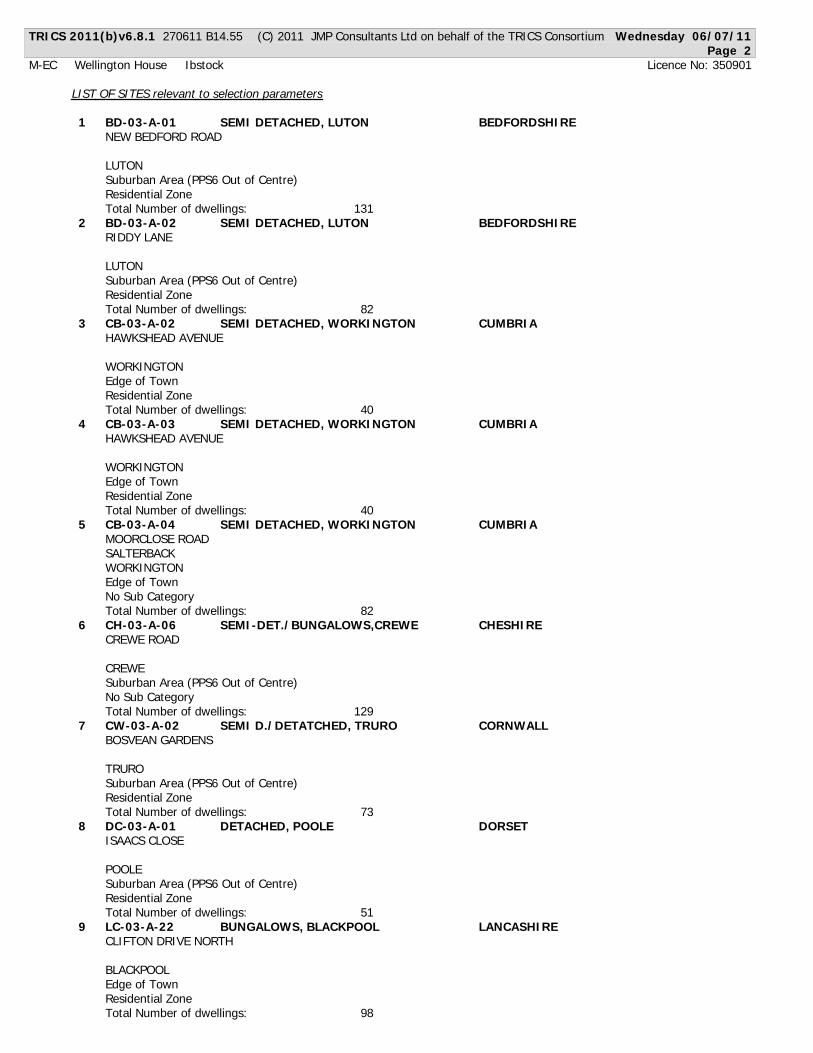
TRICS 2011(b)v6.8.1 270611 B14.55 (C) 2011 JMP Consultants Ltd on behalf of the TRICS Consortium Wednesday 06/07/11
Page 2
M-EC Wellington House Ibstock Licence No: 350901
LIST OF SITES relevant to selection parameters
1 BD-03-A-01 SEMI DETACHED, LUTON BEDFORDSHIRE
NEW BEDFORD ROAD
LUTON
Suburban Area (PPS6 Out of Centre)
Residential Zone
Total Number of dwellings: 1 3 1
2 BD-03-A-02 SEMI DETACHED, LUTON BEDFORDSHIRE
RIDDY LANE
LUTON
Suburban Area (PPS6 Out of Centre)
Residential Zone
Total Number of dwellings: 8 2
3 CB-03-A-02 SEMI DETACHED, WORKINGTON CUMBRIA
HAWKSHEAD AVENUE
WORKINGTON
Edge of Town
Residential Zone
Total Number of dwellings: 4 0
4 CB-03-A-03 SEMI DETACHED, WORKINGTON CUMBRIA
HAWKSHEAD AVENUE
WORKINGTON
Edge of Town
Residential Zone
Total Number of dwellings: 4 0
5 CB-03-A-04 SEMI DETACHED, WORKINGTON CUMBRIA
MOORCLOSE ROAD
SALTERBACK
WORKINGTON
Edge of Town
No Sub Category
Total Number of dwellings: 8 2
6 CH-03-A-06 SEMI-DET./BUNGALOWS,CREWE CHESHIRE
CREWE ROAD
CREWE
Suburban Area (PPS6 Out of Centre)
No Sub Category
Total Number of dwellings: 1 2 9
7 CW-03-A-02 SEMI D./DETATCHED, TRURO CORNWALL
BOSVEAN GARDENS
TRURO
Suburban Area (PPS6 Out of Centre)
Residential Zone
Total Number of dwellings: 7 3
8 DC-03-A-01 DETACHED, POOLE DORSET
ISAACS CLOSE
POOLE
Suburban Area (PPS6 Out of Centre)
Residential Zone
Total Number of dwellings: 5 1
9 LC-03-A-22 BUNGALOWS, BLACKPOOL LANCASHIRE
CLIFTON DRIVE NORTH
BLACKPOOL
Edge of Town
Residential Zone
Total Number of dwellings: 9 8

TRICS 2011(b)v6.8.1 270611 B14.55 (C) 2011 JMP Consultants Ltd on behalf of the TRICS Consortium Wednesday 06/07/11
Page 3
M-EC Wellington House Ibstock Licence No: 350901
LIST OF SITES relevant to selection parameters (Cont.)
10 NY-03-A-01 MIXED HOUSES,NORTHALLERTON NORTH YORKSHIRE
GRAMMAR SCHOOL LANE
NORTHALLERTON
Suburban Area (PPS6 Out of Centre)
Residential Zone
Total Number of dwellings: 5 2
11 NY-03-A-05 HOUSES AND FLATS, RIPON NORTH YORKSHIRE
BOROUGHBRIDGE ROAD
RIPON
Edge of Town
No Sub Category
Total Number of dwellings: 7 1
12 SF-03-A-01 SEMI DETACHED, IPSWICH SUFFOLK
A1156 FELIXSTOWE ROAD
RACECOURSE
IPSWICH
Suburban Area (PPS6 Out of Centre)
Residential Zone
Total Number of dwellings: 7 7
13 SF-03-A-03 MIXED HOUSES, BURY ST EDMDS SUFFOLK
BARTON HILL
FORNHAM ST MARTIN
BURY ST EDMUNDS
Edge of Town
Out of Town
Total Number of dwellings: 1 0 1
14 SH-03-A-04 TERRACED, SHREWSBURY SHROPSHIRE
ST MICHAEL'S STREET
SHREWSBURY
Suburban Area (PPS6 Out of Centre)
No Sub Category
Total Number of dwellings: 1 0 8
15 WL-03-A-01 SEMI D./TERRACED W. BASSETT WILTSHIRE
MAPLE DRIVE
WOOTTON BASSETT
Edge of Town
Residential Zone
Total Number of dwellings: 9 9
16 WM-03-A-01 TERRACED, COVENTRY WEST MIDLANDS
FOLESHILL ROAD
FOLESHILL
COVENTRY
Suburban Area (PPS6 Out of Centre)
Residential Zone
Total Number of dwellings: 7 9
17 WM-03-A-03 MIXED HOUSING, COVENTRY WEST MIDLANDS
BASELEY WAY
ROWLEYS GREEN
COVENTRY
Edge of Town
Residential Zone
Total Number of dwellings: 8 4
18 WO-03-A-02 SEMI DETACHED, REDDITCH WORCESTERSHIRE
MEADOWHILL ROAD
REDDITCH
Edge of Town
No Sub Category
Total Number of dwellings: 4 8

TRICS 2011(b)v6.8.1 270611 B14.55 (C) 2011 JMP Consultants Ltd on behalf of the TRICS Consortium Wednesday 06/07/11
Page 4
M-EC Wellington House Ibstock Licence No: 350901
LIST OF SITES relevant to selection parameters (Cont.)
19 WO-03-A-03 DETACHED, KIDDERMINSTER WORCESTERSHIRE
BLAKEBROOK
BLAKEBROOK
KIDDERMINSTER
Suburban Area (PPS6 Out of Centre)
Residential Zone
Total Number of dwellings: 1 3 8

TRICS 2011(b)v6.8.1 270611 B14.55 (C) 2011 JMP Consultants Ltd on behalf of the TRICS Consortium Wednesday 06/07/11
Page 5
M-EC Wellington House Ibstock Licence No: 350901
TRIP RATE for Land Use 03 - RESIDENTIAL/A - HOUSES PRIVATELY OWNED
VEHICLES
Calculation factor: 1 DWELLS
BOLD print indicates peak (busiest) period
ARRIVALS DEPARTURES TOTALS
No. Ave. Trip No. Ave. Trip No. Ave. Trip
Time Range Days DWELLS Rate Days DWELLS Rate Days DWELLS Rate
0 0 0.000 0 0 0.000 0 0 0.00000:00 - 01:00
0 0 0.000 0 0 0.000 0 0 0.00001:00 - 02:00
0 0 0.000 0 0 0.000 0 0 0.00002:00 - 03:00
0 0 0.000 0 0 0.000 0 0 0.00003:00 - 04:00
0 0 0.000 0 0 0.000 0 0 0.00004:00 - 05:00
0 0 0.000 0 0 0.000 0 0 0.00005:00 - 06:00
0 0 0.000 0 0 0.000 0 0 0.00006:00 - 07:00
19 83 0.068 19 83 0.293 19 83 0.36107:00 - 08:00
19 83 0.169 19 83 0.405 19 83 0.57408:00 - 09:00
19 83 0.201 19 83 0.248 19 83 0.44909:00 - 10:00
19 83 0.172 19 83 0.207 19 83 0.37910:00 - 11:00
19 83 0.201 19 83 0.195 19 83 0.39611:00 - 12:00
19 83 0.225 19 83 0.186 19 83 0.41112:00 - 13:00
19 83 0.204 19 83 0.200 19 83 0.40413:00 - 14:00
19 83 0.205 19 83 0.208 19 83 0.41314:00 - 15:00
19 83 0.301 19 83 0.241 19 83 0.54215:00 - 16:00
19 83 0.354 19 83 0.207 19 83 0.56116:00 - 17:00
19 83 0.379 19 83 0.231 19 83 0.61017:00 - 18:00
19 83 0.296 19 83 0.217 19 83 0.51318:00 - 19:00
0 0 0.000 0 0 0.000 0 0 0.00019:00 - 20:00
0 0 0.000 0 0 0.000 0 0 0.00020:00 - 21:00
0 0 0.000 0 0 0.000 0 0 0.00021:00 - 22:00
0 0 0.000 0 0 0.000 0 0 0.00022:00 - 23:00
0 0 0.000 0 0 0.000 0 0 0.00023:00 - 24:00
Total Rates: 2.775 2.838 5.613
Parameter summary
Trip rate parameter range selected: 40 - 138 (units: )
Survey date date range: 01/01/03 - 21/06/09
Number of weekdays (Monday-Friday): 19
Number of Saturdays: 0
Number of Sundays: 0
Surveys manually removed from selection: 0

TRICS 2011(b)v6.8.1 270611 B14.55 (C) 2011 JMP Consultants Ltd on behalf of the TRICS Consortium Thursday 30/06/11
Page 1
M-EC Wellington House Ibstock Licence No: 350901
TRIP RATE CALCULATION SELECTION PARAMETERS:
Land Use : 02 - EMPLOYMENT
Category : A - OFFICE
VEHICLES
Selected regions and areas:
03 SOUTH WEST
CW CORNWALL 1 days
09 NORTH
DH DURHAM 1 days
TV TEES VALLEY 1 days
Filtering Stage 2 selection:
Parameter: Gross floor area
Range: 3372 to 4850 (units: sqm)
Public Transport Provision:
Selection by: Include all surveys
Date Range: 01/01/03 to 05/11/10
Selected survey days:
Monday 1 days
Friday 2 days
Selected survey types:
Manual count 3 days
Directional ATC Count 0 days
Selected Locations:
Edge of Town Centre 1
Suburban Area (PPS6 Out of Centre) 1
Edge of Town 1
Selected Location Sub Categories:
Commercial Zone 1
Residential Zone 1
Built-Up Zone 1

TRICS 2011(b)v6.8.1 270611 B14.55 (C) 2011 JMP Consultants Ltd on behalf of the TRICS Consortium Thursday 30/06/11
Page 2
M-EC Wellington House Ibstock Licence No: 350901
LIST OF SITES relevant to selection parameters
1 CW-02-A-02 INLAND REVENUE, ST AUSTELL CORNWALL
TRINITY STREET
ST AUSTELL
Edge of Town Centre
Built-Up Zone
Total Gross floor area: 4 8 5 0 sqm
2 DH-02-A-01 RPMI OFFICES, DARLINGTON DURHAM
BRINKBURN ROAD
DARLINGTON
Suburban Area (PPS6 Out of Centre)
Residential Zone
Total Gross floor area: 3 3 7 2 sqm
3 TV-02-A-02 BUILDING SOCIETY, DARLINGTON TEES VALLEY
LINGFIELD WAY
MORTON PARK
DARLINGTON
Edge of Town
Commercial Zone
Total Gross floor area: 3 5 0 0 sqm

TRICS 2011(b)v6.8.1 270611 B14.55 (C) 2011 JMP Consultants Ltd on behalf of the TRICS Consortium Thursday 30/06/11
Page 3
M-EC Wellington House Ibstock Licence No: 350901
TRIP RATE for Land Use 02 - EMPLOYMENT/A - OFFICE
VEHICLES
Calculation factor: 100 sqm
BOLD print indicates peak (busiest) period
ARRIVALS DEPARTURES TOTALS
No. Ave. Trip No. Ave. Trip No. Ave. Trip
Time Range Days GFA Rate Days GFA Rate Days GFA Rate
0 0 0.000 0 0 0.000 0 0 0.00000:00 - 00:30
0 0 0.000 0 0 0.000 0 0 0.00000:30 - 01:00
0 0 0.000 0 0 0.000 0 0 0.00001:00 - 01:30
0 0 0.000 0 0 0.000 0 0 0.00001:30 - 02:00
0 0 0.000 0 0 0.000 0 0 0.00002:00 - 02:30
0 0 0.000 0 0 0.000 0 0 0.00002:30 - 03:00
0 0 0.000 0 0 0.000 0 0 0.00003:00 - 03:30
0 0 0.000 0 0 0.000 0 0 0.00003:30 - 04:00
0 0 0.000 0 0 0.000 0 0 0.00004:00 - 04:30
0 0 0.000 0 0 0.000 0 0 0.00004:30 - 05:00
0 0 0.000 0 0 0.000 0 0 0.00005:00 - 05:30
0 0 0.000 0 0 0.000 0 0 0.00005:30 - 06:00
0 0 0.000 0 0 0.000 0 0 0.00006:00 - 06:30
0 0 0.000 0 0 0.000 0 0 0.00006:30 - 07:00
3 3907 0.290 3 3907 0.060 3 3907 0.35007:00 - 07:30
3 3907 0.537 3 3907 0.060 3 3907 0.59707:30 - 08:00
3 3907 0.853 3 3907 0.162 3 3907 1.01508:00 - 08:30
3 3907 0.921 3 3907 0.094 3 3907 1.01508:30 - 09:00
3 3907 0.469 3 3907 0.154 3 3907 0.62309:00 - 09:30
3 3907 0.171 3 3907 0.094 3 3907 0.26509:30 - 10:00
3 3907 0.085 3 3907 0.051 3 3907 0.13610:00 - 10:30
3 3907 0.085 3 3907 0.077 3 3907 0.16210:30 - 11:00
3 3907 0.213 3 3907 0.136 3 3907 0.34911:00 - 11:30
3 3907 0.145 3 3907 0.094 3 3907 0.23911:30 - 12:00
3 3907 0.136 3 3907 0.435 3 3907 0.57112:00 - 12:30
3 3907 0.239 3 3907 0.290 3 3907 0.52912:30 - 13:00
3 3907 0.299 3 3907 0.435 3 3907 0.73413:00 - 13:30
3 3907 0.247 3 3907 0.239 3 3907 0.48613:30 - 14:00
3 3907 0.179 3 3907 0.222 3 3907 0.40114:00 - 14:30
3 3907 0.102 3 3907 0.179 3 3907 0.28114:30 - 15:00
3 3907 0.068 3 3907 0.205 3 3907 0.27315:00 - 15:30
3 3907 0.273 3 3907 0.205 3 3907 0.47815:30 - 16:00
3 3907 0.102 3 3907 0.529 3 3907 0.63116:00 - 16:30
3 3907 0.196 3 3907 0.512 3 3907 0.70816:30 - 17:00
3 3907 0.239 3 3907 0.921 3 3907 1.16017:00 - 17:30
3 3907 0.111 3 3907 0.307 3 3907 0.41817:30 - 18:00
3 3907 0.043 3 3907 0.154 3 3907 0.19718:00 - 18:30
3 3907 0.009 3 3907 0.162 3 3907 0.17118:30 - 19:00
0 0 0.000 0 0 0.000 0 0 0.00019:00 - 19:30
0 0 0.000 0 0 0.000 0 0 0.00019:30 - 20:00
0 0 0.000 0 0 0.000 0 0 0.00020:00 - 20:30
0 0 0.000 0 0 0.000 0 0 0.00020:30 - 21:00
0 0 0.000 0 0 0.000 0 0 0.00021:00 - 21:30
0 0 0.000 0 0 0.000 0 0 0.00021:30 - 22:00
0 0 0.000 0 0 0.000 0 0 0.00022:00 - 22:30
0 0 0.000 0 0 0.000 0 0 0.00022:30 - 23:00
0 0 0.000 0 0 0.000 0 0 0.00023:00 - 23:30
0 0 0.000 0 0 0.000 0 0 0.00023:30 - 24:00
Total Rates: 6.012 5.777 1 1.789

TRICS 2011(b)v6.8.1 270611 B14.55 (C) 2011 JMP Consultants Ltd on behalf of the TRICS Consortium Thursday 30/06/11
Page 4
M-EC Wellington House Ibstock Licence No: 350901
Parameter summary
Trip rate parameter range selected: 3372 - 4850 (units: sqm)
Survey date date range: 01/01/03 - 05/11/10
Number of weekdays (Monday-Friday): 3
Number of Saturdays: 0
Number of Sundays: 0
Surveys manually removed from selection: 1

TRICS 2011(b)v6.8.1 270611 B14.55 (C) 2011 JMP Consultants Ltd on behalf of the TRICS Consortium Wednesday 06/07/11
Page 1
M-EC Wellington House Ibstock Licence No: 350901
TRIP RATE CALCULATION SELECTION PARAMETERS:
Land Use : 02 - EMPLOYMENT
Category : D - INDUSTRIAL ESTATE
VEHICLES
Selected regions and areas:
03 SOUTH WEST
BR BRISTOL CITY 2 days
CW CORNWALL 1 days
WL WILTSHIRE 1 days
04 EAST ANGLIA
SF SUFFOLK 1 days
05 EAST MIDLANDS
LN LINCOLNSHIRE 1 days
09 NORTH
CB CUMBRIA 1 days
NB NORTHUMBERLAND 1 days
Filtering Stage 2 selection:
Parameter: Gross floor area
Range: 5347 to 17500 (units: sqm)
Public Transport Provision:
Selection by: Include all surveys
Date Range: 01/01/03 to 16/12/09
Selected survey days:
Monday 2 days
Tuesday 2 days
Thursday 3 days
Friday 1 days
Selected survey types:
Manual count 8 days
Directional ATC Count 0 days
Selected Locations:
Suburban Area (PPS6 Out of Centre) 4
Edge of Town 4
Selected Location Sub Categories:
Industrial Zone 6
Residential Zone 1
No Sub Category 1

TRICS 2011(b)v6.8.1 270611 B14.55 (C) 2011 JMP Consultants Ltd on behalf of the TRICS Consortium Wednesday 06/07/11
Page 2
M-EC Wellington House Ibstock Licence No: 350901
LIST OF SITES relevant to selection parameters
1 BR-02-D-02 INDUSTRIAL ESTATE, BRISTOL BRISTOL CITY
NOVERS HILL
BEDMINSTER
BRISTOL
Suburban Area (PPS6 Out of Centre)
Industrial Zone
Total Gross floor area: 6 0 0 0 sqm
2 BR-02-D-03 INDUSTRIAL ESTATE, BRISTOL BRISTOL CITY
CROFTS END ROAD
SPEEDWELL
BRISTOL
Suburban Area (PPS6 Out of Centre)
Industrial Zone
Total Gross floor area: 6 0 0 0 sqm
3 CB-02-D-03 INDUSTRIAL ESTATE, BRAMPTON CUMBRIA
CARLISLE ROAD
BRAMPTON
Edge of Town
No Sub Category
Total Gross floor area: 1 3 7 0 0 sqm
4 CW-02-D-02 INDUSTRIAL ESTATE, CAMBORNE CORNWALL
DRUIDS ROAD
CAMBORNE
Edge of Town
Industrial Zone
Total Gross floor area: 6 5 1 5 sqm
5 LN-02-D-01 INDUSTRIAL ESTATE, GRANTHAM LINCOLNSHIRE
BELTON LANE
GRANTHAM
Suburban Area (PPS6 Out of Centre)
Residential Zone
Total Gross floor area: 5 3 4 7 sqm
6 NB-02-D-01 INDUSTRIAL ESTATE, HEXHAM NORTHUMBERLAND
A695
HEXHAM
Edge of Town
Industrial Zone
Total Gross floor area: 1 0 5 2 5 sqm
7 SF-02-D-01 INDUSTRIAL ESTATE, IPSWICH SUFFOLK
RAPIER STREET
STOKE
IPSWICH
Suburban Area (PPS6 Out of Centre)
Industrial Zone
Total Gross floor area: 1 7 5 0 0 sqm
8 WL-02-D-01 IND. ESTATE, WOOTTON BASSETT WILTSHIRE
MARLBOROUGH ROAD
WOOTTON BASSETT
Edge of Town
Industrial Zone
Total Gross floor area: 7 0 5 0 sqm

TRICS 2011(b)v6.8.1 270611 B14.55 (C) 2011 JMP Consultants Ltd on behalf of the TRICS Consortium Wednesday 06/07/11
Page 3
M-EC Wellington House Ibstock Licence No: 350901
TRIP RATE for Land Use 02 - EMPLOYMENT/D - INDUSTRIAL ESTATE
VEHICLES
Calculation factor: 100 sqm
BOLD print indicates peak (busiest) period
ARRIVALS DEPARTURES TOTALS
No. Ave. Trip No. Ave. Trip No. Ave. Trip
Time Range Days GFA Rate Days GFA Rate Days GFA Rate
0 0 0.000 0 0 0.000 0 0 0.00000:00 - 00:30
0 0 0.000 0 0 0.000 0 0 0.00000:30 - 01:00
0 0 0.000 0 0 0.000 0 0 0.00001:00 - 01:30
0 0 0.000 0 0 0.000 0 0 0.00001:30 - 02:00
0 0 0.000 0 0 0.000 0 0 0.00002:00 - 02:30
0 0 0.000 0 0 0.000 0 0 0.00002:30 - 03:00
0 0 0.000 0 0 0.000 0 0 0.00003:00 - 03:30
0 0 0.000 0 0 0.000 0 0 0.00003:30 - 04:00
0 0 0.000 0 0 0.000 0 0 0.00004:00 - 04:30
0 0 0.000 0 0 0.000 0 0 0.00004:30 - 05:00
0 0 0.000 0 0 0.000 0 0 0.00005:00 - 05:30
0 0 0.000 0 0 0.000 0 0 0.00005:30 - 06:00
0 0 0.000 0 0 0.000 0 0 0.00006:00 - 06:30
0 0 0.000 0 0 0.000 0 0 0.00006:30 - 07:00
8 9080 0.114 8 9080 0.095 8 9080 0.20907:00 - 07:30
8 9080 0.322 8 9080 0.146 8 9080 0.46807:30 - 08:00
8 9080 0.403 8 9080 0.165 8 9080 0.56808:00 - 08:30
8 9080 0.377 8 9080 0.190 8 9080 0.56708:30 - 09:00
8 9080 0.260 8 9080 0.198 8 9080 0.45809:00 - 09:30
8 9080 0.211 8 9080 0.207 8 9080 0.41809:30 - 10:00
8 9080 0.263 8 9080 0.249 8 9080 0.51210:00 - 10:30
8 9080 0.257 8 9080 0.266 8 9080 0.52310:30 - 11:00
8 9080 0.290 8 9080 0.289 8 9080 0.57911:00 - 11:30
8 9080 0.273 8 9080 0.277 8 9080 0.55011:30 - 12:00
8 9080 0.245 8 9080 0.326 8 9080 0.57112:00 - 12:30
8 9080 0.244 8 9080 0.263 8 9080 0.50712:30 - 13:00
8 9080 0.268 8 9080 0.270 8 9080 0.53813:00 - 13:30
8 9080 0.304 8 9080 0.255 8 9080 0.55913:30 - 14:00
8 9080 0.253 8 9080 0.256 8 9080 0.50914:00 - 14:30
8 9080 0.222 8 9080 0.246 8 9080 0.46814:30 - 15:00
8 9080 0.222 8 9080 0.244 8 9080 0.46615:00 - 15:30
8 9080 0.231 8 9080 0.229 8 9080 0.46015:30 - 16:00
8 9080 0.222 8 9080 0.306 8 9080 0.52816:00 - 16:30
8 9080 0.195 8 9080 0.284 8 9080 0.47916:30 - 17:00
8 9080 0.131 8 9080 0.427 8 9080 0.55817:00 - 17:30
8 9080 0.080 8 9080 0.234 8 9080 0.31417:30 - 18:00
8 9080 0.051 8 9080 0.105 8 9080 0.15618:00 - 18:30
8 9080 0.023 8 9080 0.045 8 9080 0.06818:30 - 19:00
0 0 0.000 0 0 0.000 0 0 0.00019:00 - 19:30
0 0 0.000 0 0 0.000 0 0 0.00019:30 - 20:00
0 0 0.000 0 0 0.000 0 0 0.00020:00 - 20:30
0 0 0.000 0 0 0.000 0 0 0.00020:30 - 21:00
0 0 0.000 0 0 0.000 0 0 0.00021:00 - 21:30
0 0 0.000 0 0 0.000 0 0 0.00021:30 - 22:00
0 0 0.000 0 0 0.000 0 0 0.00022:00 - 22:30
0 0 0.000 0 0 0.000 0 0 0.00022:30 - 23:00
0 0 0.000 0 0 0.000 0 0 0.00023:00 - 23:30
0 0 0.000 0 0 0.000 0 0 0.00023:30 - 24:00
Total Rates: 5.461 5.572 1 1.033

TRICS 2011(b)v6.8.1 270611 B14.55 (C) 2011 JMP Consultants Ltd on behalf of the TRICS Consortium Wednesday 06/07/11
Page 4
M-EC Wellington House Ibstock Licence No: 350901
Parameter summary
Trip rate parameter range selected: 5347 - 17500 (units: sqm)
Survey date date range: 01/01/03 - 16/12/09
Number of weekdays (Monday-Friday): 8
Number of Saturdays: 0
Number of Sundays: 0
Surveys manually removed from selection: 0

APPENDIX G

2001 census - UK travel flows (ward)ONS Crown Copyright Reserved [from Nomis on 6 July 2011]
area of residence 41UCGU : Town (2003 CAS ward)
date 2001
area of workplace : local
authority: district / unitary
T203:1 (Total :
All people )
T203:25 (Car -
driver : All people
Column Total 2,948 1,800 % to Each Destination
East Staffordshire 1,967 942 52.3
Stafford 179 173 9.6
Staffordshire Moorlands 152 128 7.1
Stoke-on-Trent 116 104 5.8
South Derbyshire 75 66 3.7
Derby 61 52 2.9
Cannock Chase 54 51 2.8
Derbyshire Dales 63 51 2.8
Lichfield 49 40 2.2
Newcastle-under-Lyme 37 31 1.7
Birmingham 30 24 1.3
Nottingham 27 24 1.3
Cheshire East 16 16 0.9
North West Leicestershire 17 14 0.8
Coventry 9 9 0.5
Tamworth 12 9 0.5
Sandwell 6 6 0.3
South Staffordshire 6 6 0.3
Wolverhampton 6 6 0.3
Amber Valley 3 3 0.2
Ashfield 3 3 0.2
Blaby 3 3 0.2
Broxtowe 6 3 0.2
Cardiff 3 3 0.2
Daventry 3 3 0.2
Elmbridge 3 3 0.2
Luton 3 3 0.2
Manchester 6 3 0.2
Mansfield 3 3 0.2
Northampton 3 3 0.2
Rotherham 3 3 0.2
Stratford-on-Avon 3 3 0.2
Telford and Wrekin 6 3 0.2
Walsall 3 3 0.2
Warwick 3 3 0.2


APPENDIX H


-------------------------------------------------------------------------------- TRL TRL VIEWER 3.0 AC t:\M-EC Job Book\20111\capacity assessments\2011 A50-B518 rdbt AM.vao - Page 1 -------------------------------------------------------------------------------- ___________________ A R C A D Y 6 ___________________ ASSESSMENT OF ROUNDABOUT CAPACITY AND DELAY Analysis Program: Release 2.0 (MAR 2005) (c) Copyright TRL Limited, 2004 Adapted from ARCADY/3 which is Crown Copyright by permission of the controller of HMSO ______________________________________________________ For sales and distribution information, program advice and maintenance, contact: TRL Limited Tel: +44 (0) 1344 770018 Crowthorne House Fax: +44 (0) 1344 770864 Nine Mile Ride Email: [email protected] Wokingham, Berks. Web: www.trlsoftware.co.uk RG40 3GA,UK --------------------------------------------------------------------------------- THE USER OF THIS COMPUTER PROGRAM FOR THE SOLUTION OF AN ENGINEERING PROBLEM IS IN NO WAY RELIEVED OF THEIR RESPONSIBILITY FOR THE CORRECTNESS OF THE SOLUTION --------------------------------------------------------------------------------- Run with file:- "t:\M-EC Job Book\20111\capacity assessments\2011 A50-B518 rdbt AM.vai"(drive-on-the-left ) at 13:17:14 on Tuesday, 5 July 2011
FILE PROPERTIES *************** RUN TITLE: The Dove Way LOCATION: DATE: 05/07/2011 CLIENT: ENUMERATOR: trose [TIMROSE] JOB NUMBER: 20111 STATUS: DESCRIPTION:
INPUT DATA ********** ARM A - A50 East ARM B - A518 ARM C - A50 West ARM D - Access Road
GEOMETRIC DATA -------------- ----------------------------------------------------------------------------------------------------------------------- I ARM I V (M) I E (M) I L (M) I R (M) I D (M) I PHI (DEG) I SLOPE I INTERCEPT (PCU/MIN) I ----------------------------------------------------------------------------------------------------------------------- I ARM A I 10.00 I 12.00 I 20.00 I 25.00 I 78.00 I 48.0 I 0.704 I 55.088 I I ARM B I 5.50 I 10.00 I 30.00 I 30.00 I 78.00 I 46.0 I 0.585 I 41.438 I I ARM C I 5.00 I 7.00 I 20.00 I 30.00 I 78.00 I 49.0 I 0.492 I 31.269 I I ARM D I 4.00 I 5.00 I 15.00 I 30.00 I 78.00 I 38.0 I 0.437 I 24.083 I ----------------------------------------------------------------------------------------------------------------------- V = approach half-width L = effective flare length D = inscribed circle diameter E = entry width R = entry radius PHI = entry angle
TRAFFIC DEMAND DATA ------------------- (Only sets included in the current run are shown)
----------------------- I ARM I FLOW SCALE(%) I ----------------------- I A I 100 I I B I 100 I I C I 100 I I D I 100 I -----------------------
TIME PERIOD BEGINS 07.45 AND ENDS 09.15
LENGTH OF TIME PERIOD - 90 MINUTES. LENGTH OF TIME SEGMENT - 15 MINUTES.

-------------------------------------------------------------------------------- TRL TRL VIEWER 3.0 AC t:\M-EC Job Book\20111\capacity assessments\2011 A50-B518 rdbt AM.vao - Page 2 -------------------------------------------------------------------------------- DEMAND FLOW PROFILES ARE SYNTHESISED FROM TURNING COUNT DATA DEMAND SET TITLE: The Dove Way ----------------------------------------------------------------------------- I I NUMBER OF MINUTES FROM START WHEN I RATE OF FLOW (VEH/MIN) I I ARM I FLOW STARTS I TOP OF PEAK I FLOW STOPS I BEFORE I AT TOP I AFTER I I I TO RISE I IS REACHED IFALLING I PEAK I OF PEAK I PEAK I ----------------------------------------------------------------------------- I ARM A I 15.00 I 45.00 I 75.00 I 10.36 I 15.54 I 10.36 I I ARM B I 15.00 I 45.00 I 75.00 I 6.64 I 9.96 I 6.64 I I ARM C I 15.00 I 45.00 I 75.00 I 10.75 I 16.13 I 10.75 I I ARM D I 15.00 I 45.00 I 75.00 I 0.09 I 0.13 I 0.09 I ----------------------------------------------------------------------------- DEMAND SET TITLE: The Dove Way
-------------------------------------------------------------------- I I TURNING PROPORTIONS I I I TURNING COUNTS (VEH/HR) I I I (PERCENTAGE OF H.V.S) I I ----------------------------------------------- I TIME I FROM/TO I ARM A I ARM B I ARM C I ARM D I -------------------------------------------------------------------- I 07.45 - 09.15 I I I I I I I I ARM A I 0.000 I 0.282 I 0.717 I 0.001 I I I I 0.0 I 234.0 I 594.0 I 1.0 I I I I ( 10.0)I ( 10.0)I ( 10.0)I ( 10.0)I I I I I I I I I I ARM B I 0.431 I 0.000 I 0.569 I 0.000 I I I I 229.0 I 0.0 I 302.0 I 0.0 I I I I ( 10.0)I ( 10.0)I ( 10.0)I ( 10.0)I I I I I I I I I I ARM C I 0.643 I 0.357 I 0.000 I 0.000 I I I I 553.0 I 307.0 I 0.0 I 0.0 I I I I ( 10.0)I ( 10.0)I ( 10.0)I ( 10.0)I I I I I I I I I I ARM D I 0.429 I 0.000 I 0.571 I 0.000 I I I I 3.0 I 0.0 I 4.0 I 0.0 I I I I ( 10.0)I ( 10.0)I ( 10.0)I ( 10.0)I I I I I I I I --------------------------------------------------------------------
QUEUE AND DELAY INFORMATION FOR EACH 15 MIN TIME SEGMENT --------------------------------------------------------
------------------------------------------------------------------------------------------------------------------ I TIME DEMAND CAPACITY DEMAND/ PEDESTRIAN START END DELAY GEOMETRIC DELAY AVERAGE DELAY I I (VEH/MIN) (VEH/MIN) CAPACITY FLOW QUEUE QUEUE (VEH.MIN/ (VEH.MIN/ PER ARRIVING I I (RFC) (PEDS/MIN) (VEHS) (VEHS) TIME SEGMENT) TIME SEGMENT) VEHICLE (MIN) I I 07.45-08.00 I I ARM A 10.36 47.36 0.219 0.0 0.3 4.1 0.03 I I ARM B 6.64 33.30 0.199 0.0 0.2 3.7 0.04 I I ARM C 10.75 27.01 0.398 0.0 0.7 9.6 0.06 I I ARM D 0.09 15.97 0.005 0.0 0.0 0.1 0.06 I I I ------------------------------------------------------------------------------------------------------------------
------------------------------------------------------------------------------------------------------------------ I TIME DEMAND CAPACITY DEMAND/ PEDESTRIAN START END DELAY GEOMETRIC DELAY AVERAGE DELAY I I (VEH/MIN) (VEH/MIN) CAPACITY FLOW QUEUE QUEUE (VEH.MIN/ (VEH.MIN/ PER ARRIVING I I (RFC) (PEDS/MIN) (VEHS) (VEHS) TIME SEGMENT) TIME SEGMENT) VEHICLE (MIN) I I 08.00-08.15 I I ARM A 12.37 46.82 0.264 0.3 0.4 5.3 0.03 I I ARM B 7.93 32.44 0.244 0.2 0.3 4.8 0.04 I I ARM C 12.84 26.74 0.480 0.7 0.9 13.4 0.07 I I ARM D 0.10 14.80 0.007 0.0 0.0 0.1 0.07 I I I ------------------------------------------------------------------------------------------------------------------
------------------------------------------------------------------------------------------------------------------ I TIME DEMAND CAPACITY DEMAND/ PEDESTRIAN START END DELAY GEOMETRIC DELAY AVERAGE DELAY I I (VEH/MIN) (VEH/MIN) CAPACITY FLOW QUEUE QUEUE (VEH.MIN/ (VEH.MIN/ PER ARRIVING I I (RFC) (PEDS/MIN) (VEHS) (VEHS) TIME SEGMENT) TIME SEGMENT) VEHICLE (MIN) I I 08.15-08.30 I I ARM A 15.15 46.09 0.329 0.4 0.5 7.2 0.03 I I ARM B 9.71 31.27 0.310 0.3 0.4 6.6 0.05 I I ARM C 15.72 26.36 0.596 0.9 1.5 21.1 0.09 I I ARM D 0.13 13.21 0.010 0.0 0.0 0.1 0.08 I I I ------------------------------------------------------------------------------------------------------------------
------------------------------------------------------------------------------------------------------------------ I TIME DEMAND CAPACITY DEMAND/ PEDESTRIAN START END DELAY GEOMETRIC DELAY AVERAGE DELAY I I (VEH/MIN) (VEH/MIN) CAPACITY FLOW QUEUE QUEUE (VEH.MIN/ (VEH.MIN/ PER ARRIVING I I (RFC) (PEDS/MIN) (VEHS) (VEHS) TIME SEGMENT) TIME SEGMENT) VEHICLE (MIN) I I 08.30-08.45 I I ARM A 15.15 46.08 0.329 0.5 0.5 7.3 0.03 I I ARM B 9.71 31.26 0.310 0.4 0.4 6.7 0.05 I I ARM C 15.72 26.36 0.596 1.5 1.5 21.9 0.09 I I ARM D 0.13 13.20 0.010 0.0 0.0 0.1 0.08 I I I ------------------------------------------------------------------------------------------------------------------

-------------------------------------------------------------------------------- TRL TRL VIEWER 3.0 AC t:\M-EC Job Book\20111\capacity assessments\2011 A50-B518 rdbt AM.vao - Page 3 -------------------------------------------------------------------------------- ------------------------------------------------------------------------------------------------------------------ I TIME DEMAND CAPACITY DEMAND/ PEDESTRIAN START END DELAY GEOMETRIC DELAY AVERAGE DELAY I I (VEH/MIN) (VEH/MIN) CAPACITY FLOW QUEUE QUEUE (VEH.MIN/ (VEH.MIN/ PER ARRIVING I I (RFC) (PEDS/MIN) (VEHS) (VEHS) TIME SEGMENT) TIME SEGMENT) VEHICLE (MIN) I I 08.45-09.00 I I ARM A 12.37 46.80 0.264 0.5 0.4 5.5 0.03 I I ARM B 7.93 32.44 0.244 0.4 0.3 4.9 0.04 I I ARM C 12.84 26.73 0.480 1.5 0.9 14.4 0.07 I I ARM D 0.10 14.78 0.007 0.0 0.0 0.1 0.07 I I I ------------------------------------------------------------------------------------------------------------------
------------------------------------------------------------------------------------------------------------------ I TIME DEMAND CAPACITY DEMAND/ PEDESTRIAN START END DELAY GEOMETRIC DELAY AVERAGE DELAY I I (VEH/MIN) (VEH/MIN) CAPACITY FLOW QUEUE QUEUE (VEH.MIN/ (VEH.MIN/ PER ARRIVING I I (RFC) (PEDS/MIN) (VEHS) (VEHS) TIME SEGMENT) TIME SEGMENT) VEHICLE (MIN) I I 09.00-09.15 I I ARM A 10.36 47.34 0.219 0.4 0.3 4.3 0.03 I I ARM B 6.64 33.29 0.199 0.3 0.2 3.8 0.04 I I ARM C 10.75 27.01 0.398 0.9 0.7 10.2 0.06 I I ARM D 0.09 15.94 0.005 0.0 0.0 0.1 0.06 I I I ------------------------------------------------------------------------------------------------------------------
QUEUE AT ARM A -------------- TIME SEGMENT NO. OF ENDING VEHICLES IN QUEUE 08.00 0.3 08.15 0.4 08.30 0.5 08.45 0.5 09.00 0.4 09.15 0.3
QUEUE AT ARM B -------------- TIME SEGMENT NO. OF ENDING VEHICLES IN QUEUE 08.00 0.2 08.15 0.3 08.30 0.4 08.45 0.4 09.00 0.3 09.15 0.2
QUEUE AT ARM C -------------- TIME SEGMENT NO. OF ENDING VEHICLES IN QUEUE 08.00 0.7 * 08.15 0.9 * 08.30 1.5 * 08.45 1.5 * 09.00 0.9 * 09.15 0.7 *
QUEUE AT ARM D -------------- TIME SEGMENT NO. OF ENDING VEHICLES IN QUEUE 08.00 0.0 08.15 0.0 08.30 0.0 08.45 0.0 09.00 0.0 09.15 0.0

-------------------------------------------------------------------------------- TRL TRL VIEWER 3.0 AC t:\M-EC Job Book\20111\capacity assessments\2011 A50-B518 rdbt AM.vao - Page 4 -------------------------------------------------------------------------------- QUEUEING DELAY INFORMATION OVER WHOLE PERIOD -------------------------------------------- ---------------------------------------------------------------------------- I ARM I TOTAL DEMAND I * QUEUEING * I * INCLUSIVE QUEUEING * I I I I * DELAY * I * DELAY * I I I------------------------------------------------------------------I I I (VEH) (VEH/H) I (MIN) (MIN/VEH) I (MIN) (MIN/VEH) I ---------------------------------------------------------------------------- I A I 1136.7 I 757.8 I 33.8 I 0.03 I 33.8 I 0.03 I I B I 728.1 I 485.4 I 30.5 I 0.04 I 30.5 I 0.04 I I C I 1179.2 I 786.2 I 90.6 I 0.08 I 90.6 I 0.08 I I D I 9.6 I 6.4 I 0.7 I 0.07 I 0.7 I 0.07 I ---------------------------------------------------------------------------- I ALL I 3053.7 I 2035.8 I 155.5 I 0.05 I 155.5 I 0.05 I ---------------------------------------------------------------------------- * DELAY IS THAT OCCURRING ONLY WITHIN THE TIME PERIOD. * INCLUSIVE DELAY INCLUDES DELAY SUFFERED BY VEHICLES WHICH ARE STILL QUEUEING AFTER THE END OF THE TIME PERIOD. * THESE WILL ONLY BE SIGNIFICANTLY DIFFERENT IF THERE IS A LARGE QUEUE REMAINING AT THE END OF THE TIME PERIOD. END OF JOB ============================================= end of file ===============================================
[Printed at 13:17:20 on 05/07/2011]

-------------------------------------------------------------------------------- TRL TRL VIEWER 3.0 AC t:\M-EC Job Book\20111\capacity assessments\2011 A50-B518 rdbt PM.vao - Page 1 -------------------------------------------------------------------------------- ___________________ A R C A D Y 6 ___________________ ASSESSMENT OF ROUNDABOUT CAPACITY AND DELAY Analysis Program: Release 2.0 (MAR 2005) (c) Copyright TRL Limited, 2004 Adapted from ARCADY/3 which is Crown Copyright by permission of the controller of HMSO ______________________________________________________ For sales and distribution information, program advice and maintenance, contact: TRL Limited Tel: +44 (0) 1344 770018 Crowthorne House Fax: +44 (0) 1344 770864 Nine Mile Ride Email: [email protected] Wokingham, Berks. Web: www.trlsoftware.co.uk RG40 3GA,UK --------------------------------------------------------------------------------- THE USER OF THIS COMPUTER PROGRAM FOR THE SOLUTION OF AN ENGINEERING PROBLEM IS IN NO WAY RELIEVED OF THEIR RESPONSIBILITY FOR THE CORRECTNESS OF THE SOLUTION --------------------------------------------------------------------------------- Run with file:- "t:\M-EC Job Book\20111\capacity assessments\2011 A50-B518 rdbt PM.vai"(drive-on-the-left ) at 13:23:45 on Tuesday, 5 July 2011
FILE PROPERTIES *************** RUN TITLE: The Dove Way LOCATION: DATE: 05/07/2011 CLIENT: ENUMERATOR: trose [TIMROSE] JOB NUMBER: 20111 STATUS: DESCRIPTION:
INPUT DATA ********** ARM A - A50 East ARM B - A518 ARM C - A50 West ARM D - Access Road
GEOMETRIC DATA -------------- ----------------------------------------------------------------------------------------------------------------------- I ARM I V (M) I E (M) I L (M) I R (M) I D (M) I PHI (DEG) I SLOPE I INTERCEPT (PCU/MIN) I ----------------------------------------------------------------------------------------------------------------------- I ARM A I 10.00 I 12.00 I 20.00 I 25.00 I 78.00 I 48.0 I 0.704 I 55.088 I I ARM B I 5.50 I 10.00 I 30.00 I 30.00 I 78.00 I 46.0 I 0.585 I 41.438 I I ARM C I 5.00 I 7.00 I 20.00 I 30.00 I 78.00 I 49.0 I 0.492 I 31.269 I I ARM D I 4.00 I 5.00 I 15.00 I 30.00 I 78.00 I 38.0 I 0.437 I 24.083 I ----------------------------------------------------------------------------------------------------------------------- V = approach half-width L = effective flare length D = inscribed circle diameter E = entry width R = entry radius PHI = entry angle
TRAFFIC DEMAND DATA ------------------- (Only sets included in the current run are shown)
----------------------- I ARM I FLOW SCALE(%) I ----------------------- I A I 100 I I B I 100 I I C I 100 I I D I 100 I -----------------------
TIME PERIOD BEGINS 16.45 AND ENDS 18.15
LENGTH OF TIME PERIOD - 90 MINUTES. LENGTH OF TIME SEGMENT - 15 MINUTES.

-------------------------------------------------------------------------------- TRL TRL VIEWER 3.0 AC t:\M-EC Job Book\20111\capacity assessments\2011 A50-B518 rdbt PM.vao - Page 2 -------------------------------------------------------------------------------- DEMAND FLOW PROFILES ARE SYNTHESISED FROM TURNING COUNT DATA DEMAND SET TITLE: The Dove Way ----------------------------------------------------------------------------- I I NUMBER OF MINUTES FROM START WHEN I RATE OF FLOW (VEH/MIN) I I ARM I FLOW STARTS I TOP OF PEAK I FLOW STOPS I BEFORE I AT TOP I AFTER I I I TO RISE I IS REACHED IFALLING I PEAK I OF PEAK I PEAK I ----------------------------------------------------------------------------- I ARM A I 15.00 I 45.00 I 75.00 I 9.56 I 14.34 I 9.56 I I ARM B I 15.00 I 45.00 I 75.00 I 6.45 I 9.67 I 6.45 I I ARM C I 15.00 I 45.00 I 75.00 I 16.48 I 24.71 I 16.48 I I ARM D I 15.00 I 45.00 I 75.00 I 0.03 I 0.04 I 0.03 I ----------------------------------------------------------------------------- DEMAND SET TITLE: The Dove Way
-------------------------------------------------------------------- I I TURNING PROPORTIONS I I I TURNING COUNTS (VEH/HR) I I I (PERCENTAGE OF H.V.S) I I ----------------------------------------------- I TIME I FROM/TO I ARM A I ARM B I ARM C I ARM D I -------------------------------------------------------------------- I 16.45 - 18.15 I I I I I I I I ARM A I 0.000 I 0.297 I 0.702 I 0.001 I I I I 0.0 I 227.0 I 537.0 I 1.0 I I I I ( 10.0)I ( 10.0)I ( 10.0)I ( 10.0)I I I I I I I I I I ARM B I 0.395 I 0.000 I 0.601 I 0.004 I I I I 204.0 I 0.0 I 310.0 I 2.0 I I I I ( 10.0)I ( 10.0)I ( 10.0)I ( 10.0)I I I I I I I I I I ARM C I 0.772 I 0.225 I 0.000 I 0.003 I I I I 1018.0 I 296.0 I 0.0 I 4.0 I I I I ( 10.0)I ( 10.0)I ( 10.0)I ( 10.0)I I I I I I I I I I ARM D I 0.500 I 0.000 I 0.500 I 0.000 I I I I 1.0 I 0.0 I 1.0 I 0.0 I I I I ( 10.0)I ( 10.0)I ( 10.0)I ( 10.0)I I I I I I I I --------------------------------------------------------------------
QUEUE AND DELAY INFORMATION FOR EACH 15 MIN TIME SEGMENT --------------------------------------------------------
------------------------------------------------------------------------------------------------------------------ I TIME DEMAND CAPACITY DEMAND/ PEDESTRIAN START END DELAY GEOMETRIC DELAY AVERAGE DELAY I I (VEH/MIN) (VEH/MIN) CAPACITY FLOW QUEUE QUEUE (VEH.MIN/ (VEH.MIN/ PER ARRIVING I I (RFC) (PEDS/MIN) (VEHS) (VEHS) TIME SEGMENT) TIME SEGMENT) VEHICLE (MIN) I I 16.45-17.00 I I ARM A 9.56 47.48 0.201 0.0 0.3 3.7 0.03 I I ARM B 6.45 33.74 0.191 0.0 0.2 3.5 0.04 I I ARM C 16.48 27.16 0.607 0.0 1.5 21.7 0.09 I I ARM D 0.03 13.65 0.002 0.0 0.0 0.0 0.07 I I I ------------------------------------------------------------------------------------------------------------------
------------------------------------------------------------------------------------------------------------------ I TIME DEMAND CAPACITY DEMAND/ PEDESTRIAN START END DELAY GEOMETRIC DELAY AVERAGE DELAY I I (VEH/MIN) (VEH/MIN) CAPACITY FLOW QUEUE QUEUE (VEH.MIN/ (VEH.MIN/ PER ARRIVING I I (RFC) (PEDS/MIN) (VEHS) (VEHS) TIME SEGMENT) TIME SEGMENT) VEHICLE (MIN) I I 17.00-17.15 I I ARM A 11.42 46.97 0.243 0.3 0.3 4.8 0.03 I I ARM B 7.70 32.97 0.234 0.2 0.3 4.5 0.04 I I ARM C 19.67 26.91 0.731 1.5 2.6 37.2 0.14 I I ARM D 0.03 12.03 0.002 0.0 0.0 0.0 0.08 I I I ------------------------------------------------------------------------------------------------------------------
------------------------------------------------------------------------------------------------------------------ I TIME DEMAND CAPACITY DEMAND/ PEDESTRIAN START END DELAY GEOMETRIC DELAY AVERAGE DELAY I I (VEH/MIN) (VEH/MIN) CAPACITY FLOW QUEUE QUEUE (VEH.MIN/ (VEH.MIN/ PER ARRIVING I I (RFC) (PEDS/MIN) (VEHS) (VEHS) TIME SEGMENT) TIME SEGMENT) VEHICLE (MIN) I I 17.15-17.30 I I ARM A 13.98 46.32 0.302 0.3 0.4 6.4 0.03 I I ARM B 9.43 31.91 0.296 0.3 0.4 6.2 0.04 I I ARM C 24.09 26.56 0.907 2.6 7.9 98.4 0.32 I I ARM D 0.04 9.93 0.004 0.0 0.0 0.1 0.10 I I I ------------------------------------------------------------------------------------------------------------------
------------------------------------------------------------------------------------------------------------------ I TIME DEMAND CAPACITY DEMAND/ PEDESTRIAN START END DELAY GEOMETRIC DELAY AVERAGE DELAY I I (VEH/MIN) (VEH/MIN) CAPACITY FLOW QUEUE QUEUE (VEH.MIN/ (VEH.MIN/ PER ARRIVING I I (RFC) (PEDS/MIN) (VEHS) (VEHS) TIME SEGMENT) TIME SEGMENT) VEHICLE (MIN) I I 17.30-17.45 I I ARM A 13.98 46.27 0.302 0.4 0.4 6.5 0.03 I I ARM B 9.43 31.91 0.296 0.4 0.4 6.3 0.04 I I ARM C 24.09 26.56 0.907 7.9 8.6 125.2 0.38 I I ARM D 0.04 9.79 0.004 0.0 0.0 0.1 0.10 I I I ------------------------------------------------------------------------------------------------------------------

-------------------------------------------------------------------------------- TRL TRL VIEWER 3.0 AC t:\M-EC Job Book\20111\capacity assessments\2011 A50-B518 rdbt PM.vao - Page 3 -------------------------------------------------------------------------------- ------------------------------------------------------------------------------------------------------------------ I TIME DEMAND CAPACITY DEMAND/ PEDESTRIAN START END DELAY GEOMETRIC DELAY AVERAGE DELAY I I (VEH/MIN) (VEH/MIN) CAPACITY FLOW QUEUE QUEUE (VEH.MIN/ (VEH.MIN/ PER ARRIVING I I (RFC) (PEDS/MIN) (VEHS) (VEHS) TIME SEGMENT) TIME SEGMENT) VEHICLE (MIN) I I 17.45-18.00 I I ARM A 11.42 46.90 0.243 0.4 0.3 4.9 0.03 I I ARM B 7.70 32.96 0.234 0.4 0.3 4.6 0.04 I I ARM C 19.67 26.90 0.731 8.6 2.8 48.2 0.15 I I ARM D 0.03 11.83 0.003 0.0 0.0 0.0 0.08 I I I ------------------------------------------------------------------------------------------------------------------
------------------------------------------------------------------------------------------------------------------ I TIME DEMAND CAPACITY DEMAND/ PEDESTRIAN START END DELAY GEOMETRIC DELAY AVERAGE DELAY I I (VEH/MIN) (VEH/MIN) CAPACITY FLOW QUEUE QUEUE (VEH.MIN/ (VEH.MIN/ PER ARRIVING I I (RFC) (PEDS/MIN) (VEHS) (VEHS) TIME SEGMENT) TIME SEGMENT) VEHICLE (MIN) I I 18.00-18.15 I I ARM A 9.56 47.45 0.202 0.3 0.3 3.8 0.03 I I ARM B 6.45 33.73 0.191 0.3 0.2 3.6 0.04 I I ARM C 16.48 27.15 0.607 2.8 1.6 24.5 0.10 I I ARM D 0.03 13.57 0.002 0.0 0.0 0.0 0.07 I I I ------------------------------------------------------------------------------------------------------------------
QUEUE AT ARM A -------------- TIME SEGMENT NO. OF ENDING VEHICLES IN QUEUE 17.00 0.3 17.15 0.3 17.30 0.4 17.45 0.4 18.00 0.3 18.15 0.3
QUEUE AT ARM B -------------- TIME SEGMENT NO. OF ENDING VEHICLES IN QUEUE 17.00 0.2 17.15 0.3 17.30 0.4 17.45 0.4 18.00 0.3 18.15 0.2
QUEUE AT ARM C -------------- TIME SEGMENT NO. OF ENDING VEHICLES IN QUEUE 17.00 1.5 ** 17.15 2.6 *** 17.30 7.9 ******** 17.45 8.6 ********* 18.00 2.8 *** 18.15 1.6 **
QUEUE AT ARM D -------------- TIME SEGMENT NO. OF ENDING VEHICLES IN QUEUE 17.00 0.0 17.15 0.0 17.30 0.0 17.45 0.0 18.00 0.0 18.15 0.0

-------------------------------------------------------------------------------- TRL TRL VIEWER 3.0 AC t:\M-EC Job Book\20111\capacity assessments\2011 A50-B518 rdbt PM.vao - Page 4 -------------------------------------------------------------------------------- QUEUEING DELAY INFORMATION OVER WHOLE PERIOD -------------------------------------------- ---------------------------------------------------------------------------- I ARM I TOTAL DEMAND I * QUEUEING * I * INCLUSIVE QUEUEING * I I I I * DELAY * I * DELAY * I I I------------------------------------------------------------------I I I (VEH) (VEH/H) I (MIN) (MIN/VEH) I (MIN) (MIN/VEH) I ---------------------------------------------------------------------------- I A I 1049.0 I 699.3 I 30.1 I 0.03 I 30.1 I 0.03 I I B I 707.5 I 471.7 I 28.7 I 0.04 I 28.7 I 0.04 I I C I 1807.3 I 1204.8 I 355.2 I 0.20 I 355.2 I 0.20 I I D I 2.7 I 1.8 I 0.2 I 0.09 I 0.2 I 0.09 I ---------------------------------------------------------------------------- I ALL I 3566.5 I 2377.7 I 414.2 I 0.12 I 414.2 I 0.12 I ---------------------------------------------------------------------------- * DELAY IS THAT OCCURRING ONLY WITHIN THE TIME PERIOD. * INCLUSIVE DELAY INCLUDES DELAY SUFFERED BY VEHICLES WHICH ARE STILL QUEUEING AFTER THE END OF THE TIME PERIOD. * THESE WILL ONLY BE SIGNIFICANTLY DIFFERENT IF THERE IS A LARGE QUEUE REMAINING AT THE END OF THE TIME PERIOD. END OF JOB ============================================= end of file ===============================================
[Printed at 13:23:51 on 05/07/2011]

-------------------------------------------------------------------------------- TRL TRL VIEWER 3.0 AC t:\M-EC Job Book\20111\capacity assessments\2011 A50-B5030 rdbt AM.vao - Page 1 -------------------------------------------------------------------------------- ___________________ A R C A D Y 6 ___________________ ASSESSMENT OF ROUNDABOUT CAPACITY AND DELAY Analysis Program: Release 2.0 (MAR 2005) (c) Copyright TRL Limited, 2004 Adapted from ARCADY/3 which is Crown Copyright by permission of the controller of HMSO ______________________________________________________ For sales and distribution information, program advice and maintenance, contact: TRL Limited Tel: +44 (0) 1344 770018 Crowthorne House Fax: +44 (0) 1344 770864 Nine Mile Ride Email: [email protected] Wokingham, Berks. Web: www.trlsoftware.co.uk RG40 3GA,UK --------------------------------------------------------------------------------- THE USER OF THIS COMPUTER PROGRAM FOR THE SOLUTION OF AN ENGINEERING PROBLEM IS IN NO WAY RELIEVED OF THEIR RESPONSIBILITY FOR THE CORRECTNESS OF THE SOLUTION --------------------------------------------------------------------------------- Run with file:- "t:\M-EC Job Book\20111\capacity assessments\2011 A50-B5030 rdbt AM.vai"(drive-on-the-left ) at 12:10:29 on Tuesday, 5 July 2011
FILE PROPERTIES *************** RUN TITLE: The Dove Way LOCATION: DATE: 04/07/2011 CLIENT: ENUMERATOR: trose [TIMROSE] JOB NUMBER: 20111 STATUS: DESCRIPTION:
INPUT DATA ********** ARM A - A50 East ARM B - B5030 ARM C - A50 West ARM D - A518
GEOMETRIC DATA -------------- ----------------------------------------------------------------------------------------------------------------------- I ARM I V (M) I E (M) I L (M) I R (M) I D (M) I PHI (DEG) I SLOPE I INTERCEPT (PCU/MIN) I ----------------------------------------------------------------------------------------------------------------------- I ARM A I 8.00 I 8.00 I 14.00 I 70.00 I 56.00 I 47.0 I 0.692 I 39.428 I I ARM B I 5.00 I 6.00 I 24.00 I 30.00 I 56.00 I 42.0 I 0.579 I 28.953 I I ARM C I 7.00 I 8.00 I 11.00 I 30.00 I 56.00 I 57.0 I 0.643 I 36.223 I I ARM D I 7.00 I 10.00 I 25.00 I 20.00 I 56.00 I 54.0 I 0.709 I 42.441 I ----------------------------------------------------------------------------------------------------------------------- V = approach half-width L = effective flare length D = inscribed circle diameter E = entry width R = entry radius PHI = entry angle
TRAFFIC DEMAND DATA ------------------- (Only sets included in the current run are shown)
----------------------- I ARM I FLOW SCALE(%) I ----------------------- I A I 100 I I B I 100 I I C I 100 I I D I 100 I -----------------------
TIME PERIOD BEGINS 07.45 AND ENDS 09.15
LENGTH OF TIME PERIOD - 90 MINUTES. LENGTH OF TIME SEGMENT - 15 MINUTES.

-------------------------------------------------------------------------------- TRL TRL VIEWER 3.0 AC t:\M-EC Job Book\20111\capacity assessments\2011 A50-B5030 rdbt AM.vao - Page 2 -------------------------------------------------------------------------------- DEMAND FLOW PROFILES ARE SYNTHESISED FROM TURNING COUNT DATA DEMAND SET TITLE: The Dove Way ----------------------------------------------------------------------------- I I NUMBER OF MINUTES FROM START WHEN I RATE OF FLOW (VEH/MIN) I I ARM I FLOW STARTS I TOP OF PEAK I FLOW STOPS I BEFORE I AT TOP I AFTER I I I TO RISE I IS REACHED IFALLING I PEAK I OF PEAK I PEAK I ----------------------------------------------------------------------------- I ARM A I 15.00 I 45.00 I 75.00 I 11.24 I 16.86 I 11.24 I I ARM B I 15.00 I 45.00 I 75.00 I 5.55 I 8.33 I 5.55 I I ARM C I 15.00 I 45.00 I 75.00 I 8.61 I 12.92 I 8.61 I I ARM D I 15.00 I 45.00 I 75.00 I 10.48 I 15.71 I 10.48 I ----------------------------------------------------------------------------- DEMAND SET TITLE: The Dove Way
-------------------------------------------------------------------- I I TURNING PROPORTIONS I I I TURNING COUNTS (VEH/HR) I I I (PERCENTAGE OF H.V.S) I I ----------------------------------------------- I TIME I FROM/TO I ARM A I ARM B I ARM C I ARM D I -------------------------------------------------------------------- I 07.45 - 09.15 I I I I I I I I ARM A I 0.000 I 0.189 I 0.406 I 0.405 I I I I 0.0 I 170.0 I 365.0 I 364.0 I I I I ( 10.0)I ( 10.0)I ( 10.0)I ( 10.0)I I I I I I I I I I ARM B I 0.347 I 0.000 I 0.381 I 0.273 I I I I 154.0 I 0.0 I 169.0 I 121.0 I I I I ( 10.0)I ( 10.0)I ( 10.0)I ( 10.0)I I I I I I I I I I ARM C I 0.604 I 0.177 I 0.000 I 0.219 I I I I 416.0 I 122.0 I 0.0 I 151.0 I I I I ( 10.0)I ( 10.0)I ( 10.0)I ( 10.0)I I I I I I I I I I ARM D I 0.348 I 0.338 I 0.314 I 0.000 I I I I 292.0 I 283.0 I 263.0 I 0.0 I I I I ( 10.0)I ( 10.0)I ( 10.0)I ( 10.0)I I I I I I I I --------------------------------------------------------------------
QUEUE AND DELAY INFORMATION FOR EACH 15 MIN TIME SEGMENT --------------------------------------------------------
------------------------------------------------------------------------------------------------------------------ I TIME DEMAND CAPACITY DEMAND/ PEDESTRIAN START END DELAY GEOMETRIC DELAY AVERAGE DELAY I I (VEH/MIN) (VEH/MIN) CAPACITY FLOW QUEUE QUEUE (VEH.MIN/ (VEH.MIN/ PER ARRIVING I I (RFC) (PEDS/MIN) (VEHS) (VEHS) TIME SEGMENT) TIME SEGMENT) VEHICLE (MIN) I I 07.45-08.00 I I ARM A 11.24 30.08 0.374 0.0 0.6 8.7 0.05 I I ARM B 5.55 19.17 0.290 0.0 0.4 5.9 0.07 I I ARM C 8.61 27.81 0.310 0.0 0.4 6.6 0.05 I I ARM D 10.48 32.47 0.323 0.0 0.5 7.0 0.05 I I I ------------------------------------------------------------------------------------------------------------------
------------------------------------------------------------------------------------------------------------------ I TIME DEMAND CAPACITY DEMAND/ PEDESTRIAN START END DELAY GEOMETRIC DELAY AVERAGE DELAY I I (VEH/MIN) (VEH/MIN) CAPACITY FLOW QUEUE QUEUE (VEH.MIN/ (VEH.MIN/ PER ARRIVING I I (RFC) (PEDS/MIN) (VEHS) (VEHS) TIME SEGMENT) TIME SEGMENT) VEHICLE (MIN) I I 08.00-08.15 I I ARM A 13.42 28.95 0.464 0.6 0.9 12.6 0.06 I I ARM B 6.63 17.76 0.373 0.4 0.6 8.6 0.09 I I ARM C 10.28 26.81 0.384 0.4 0.6 9.1 0.06 I I ARM D 12.51 31.27 0.400 0.5 0.7 9.8 0.05 I I I ------------------------------------------------------------------------------------------------------------------
------------------------------------------------------------------------------------------------------------------ I TIME DEMAND CAPACITY DEMAND/ PEDESTRIAN START END DELAY GEOMETRIC DELAY AVERAGE DELAY I I (VEH/MIN) (VEH/MIN) CAPACITY FLOW QUEUE QUEUE (VEH.MIN/ (VEH.MIN/ PER ARRIVING I I (RFC) (PEDS/MIN) (VEHS) (VEHS) TIME SEGMENT) TIME SEGMENT) VEHICLE (MIN) I I 08.15-08.30 I I ARM A 16.43 27.40 0.600 0.9 1.5 21.3 0.09 I I ARM B 8.12 15.85 0.512 0.6 1.0 14.9 0.13 I I ARM C 12.60 25.44 0.495 0.6 1.0 14.2 0.08 I I ARM D 15.32 29.64 0.517 0.7 1.1 15.5 0.07 I I I ------------------------------------------------------------------------------------------------------------------
------------------------------------------------------------------------------------------------------------------ I TIME DEMAND CAPACITY DEMAND/ PEDESTRIAN START END DELAY GEOMETRIC DELAY AVERAGE DELAY I I (VEH/MIN) (VEH/MIN) CAPACITY FLOW QUEUE QUEUE (VEH.MIN/ (VEH.MIN/ PER ARRIVING I I (RFC) (PEDS/MIN) (VEHS) (VEHS) TIME SEGMENT) TIME SEGMENT) VEHICLE (MIN) I I 08.30-08.45 I I ARM A 16.43 27.39 0.600 1.5 1.5 22.3 0.09 I I ARM B 8.12 15.82 0.513 1.0 1.0 15.6 0.13 I I ARM C 12.60 25.42 0.496 1.0 1.0 14.6 0.08 I I ARM D 15.32 29.62 0.517 1.1 1.1 16.0 0.07 I I I ------------------------------------------------------------------------------------------------------------------

-------------------------------------------------------------------------------- TRL TRL VIEWER 3.0 AC t:\M-EC Job Book\20111\capacity assessments\2011 A50-B5030 rdbt AM.vao - Page 3 -------------------------------------------------------------------------------- ------------------------------------------------------------------------------------------------------------------ I TIME DEMAND CAPACITY DEMAND/ PEDESTRIAN START END DELAY GEOMETRIC DELAY AVERAGE DELAY I I (VEH/MIN) (VEH/MIN) CAPACITY FLOW QUEUE QUEUE (VEH.MIN/ (VEH.MIN/ PER ARRIVING I I (RFC) (PEDS/MIN) (VEHS) (VEHS) TIME SEGMENT) TIME SEGMENT) VEHICLE (MIN) I I 08.45-09.00 I I ARM A 13.42 28.93 0.464 1.5 0.9 13.4 0.06 I I ARM B 6.63 17.73 0.374 1.0 0.6 9.3 0.09 I I ARM C 10.28 26.77 0.384 1.0 0.6 9.6 0.06 I I ARM D 12.51 31.24 0.400 1.1 0.7 10.3 0.05 I I I ------------------------------------------------------------------------------------------------------------------
------------------------------------------------------------------------------------------------------------------ I TIME DEMAND CAPACITY DEMAND/ PEDESTRIAN START END DELAY GEOMETRIC DELAY AVERAGE DELAY I I (VEH/MIN) (VEH/MIN) CAPACITY FLOW QUEUE QUEUE (VEH.MIN/ (VEH.MIN/ PER ARRIVING I I (RFC) (PEDS/MIN) (VEHS) (VEHS) TIME SEGMENT) TIME SEGMENT) VEHICLE (MIN) I I 09.00-09.15 I I ARM A 11.24 30.06 0.374 0.9 0.6 9.2 0.05 I I ARM B 5.55 19.13 0.290 0.6 0.4 6.3 0.07 I I ARM C 8.61 27.78 0.310 0.6 0.5 6.9 0.05 I I ARM D 10.48 32.44 0.323 0.7 0.5 7.3 0.05 I I I ------------------------------------------------------------------------------------------------------------------
QUEUE AT ARM A -------------- TIME SEGMENT NO. OF ENDING VEHICLES IN QUEUE 08.00 0.6 * 08.15 0.9 * 08.30 1.5 * 08.45 1.5 * 09.00 0.9 * 09.15 0.6 *
QUEUE AT ARM B -------------- TIME SEGMENT NO. OF ENDING VEHICLES IN QUEUE 08.00 0.4 08.15 0.6 * 08.30 1.0 * 08.45 1.0 * 09.00 0.6 * 09.15 0.4
QUEUE AT ARM C -------------- TIME SEGMENT NO. OF ENDING VEHICLES IN QUEUE 08.00 0.4 08.15 0.6 * 08.30 1.0 * 08.45 1.0 * 09.00 0.6 * 09.15 0.5
QUEUE AT ARM D -------------- TIME SEGMENT NO. OF ENDING VEHICLES IN QUEUE 08.00 0.5 08.15 0.7 * 08.30 1.1 * 08.45 1.1 * 09.00 0.7 * 09.15 0.5

-------------------------------------------------------------------------------- TRL TRL VIEWER 3.0 AC t:\M-EC Job Book\20111\capacity assessments\2011 A50-B5030 rdbt AM.vao - Page 4 -------------------------------------------------------------------------------- QUEUEING DELAY INFORMATION OVER WHOLE PERIOD -------------------------------------------- ---------------------------------------------------------------------------- I ARM I TOTAL DEMAND I * QUEUEING * I * INCLUSIVE QUEUEING * I I I I * DELAY * I * DELAY * I I I------------------------------------------------------------------I I I (VEH) (VEH/H) I (MIN) (MIN/VEH) I (MIN) (MIN/VEH) I ---------------------------------------------------------------------------- I A I 1232.7 I 821.8 I 87.5 I 0.07 I 87.5 I 0.07 I I B I 608.8 I 405.9 I 60.6 I 0.10 I 60.6 I 0.10 I I C I 944.8 I 629.8 I 61.0 I 0.06 I 61.0 I 0.06 I I D I 1149.1 I 766.0 I 65.8 I 0.06 I 65.8 I 0.06 I ---------------------------------------------------------------------------- I ALL I 3935.4 I 2623.6 I 274.8 I 0.07 I 274.8 I 0.07 I ---------------------------------------------------------------------------- * DELAY IS THAT OCCURRING ONLY WITHIN THE TIME PERIOD. * INCLUSIVE DELAY INCLUDES DELAY SUFFERED BY VEHICLES WHICH ARE STILL QUEUEING AFTER THE END OF THE TIME PERIOD. * THESE WILL ONLY BE SIGNIFICANTLY DIFFERENT IF THERE IS A LARGE QUEUE REMAINING AT THE END OF THE TIME PERIOD. END OF JOB ============================================= end of file ===============================================
[Printed at 12:10:36 on 05/07/2011]

-------------------------------------------------------------------------------- TRL TRL VIEWER 3.0 AC t:\M-EC Job Book\20111\capacity assessments\2011 A50-B5030 rdbt PM.vao - Page 1 -------------------------------------------------------------------------------- ___________________ A R C A D Y 6 ___________________ ASSESSMENT OF ROUNDABOUT CAPACITY AND DELAY Analysis Program: Release 2.0 (MAR 2005) (c) Copyright TRL Limited, 2004 Adapted from ARCADY/3 which is Crown Copyright by permission of the controller of HMSO ______________________________________________________ For sales and distribution information, program advice and maintenance, contact: TRL Limited Tel: +44 (0) 1344 770018 Crowthorne House Fax: +44 (0) 1344 770864 Nine Mile Ride Email: [email protected] Wokingham, Berks. Web: www.trlsoftware.co.uk RG40 3GA,UK --------------------------------------------------------------------------------- THE USER OF THIS COMPUTER PROGRAM FOR THE SOLUTION OF AN ENGINEERING PROBLEM IS IN NO WAY RELIEVED OF THEIR RESPONSIBILITY FOR THE CORRECTNESS OF THE SOLUTION --------------------------------------------------------------------------------- Run with file:- "t:\M-EC Job Book\20111\capacity assessments\2011 A50-B5030 rdbt PM.vai"(drive-on-the-left ) at 12:17:01 on Tuesday, 5 July 2011
FILE PROPERTIES *************** RUN TITLE: The Dove Way LOCATION: DATE: 04/07/2011 CLIENT: ENUMERATOR: trose [TIMROSE] JOB NUMBER: 20111 STATUS: DESCRIPTION:
INPUT DATA ********** ARM A - A50 East ARM B - B5030 ARM C - A50 West ARM D - A518
GEOMETRIC DATA -------------- ----------------------------------------------------------------------------------------------------------------------- I ARM I V (M) I E (M) I L (M) I R (M) I D (M) I PHI (DEG) I SLOPE I INTERCEPT (PCU/MIN) I ----------------------------------------------------------------------------------------------------------------------- I ARM A I 8.00 I 8.00 I 14.00 I 70.00 I 56.00 I 47.0 I 0.692 I 39.428 I I ARM B I 5.00 I 6.00 I 24.00 I 30.00 I 56.00 I 42.0 I 0.579 I 28.953 I I ARM C I 7.00 I 8.00 I 11.00 I 30.00 I 56.00 I 57.0 I 0.643 I 36.223 I I ARM D I 7.00 I 10.00 I 25.00 I 20.00 I 56.00 I 54.0 I 0.709 I 42.441 I ----------------------------------------------------------------------------------------------------------------------- V = approach half-width L = effective flare length D = inscribed circle diameter E = entry width R = entry radius PHI = entry angle
TRAFFIC DEMAND DATA ------------------- (Only sets included in the current run are shown)
----------------------- I ARM I FLOW SCALE(%) I ----------------------- I A I 100 I I B I 100 I I C I 100 I I D I 100 I -----------------------
TIME PERIOD BEGINS 16.45 AND ENDS 18.15
LENGTH OF TIME PERIOD - 90 MINUTES. LENGTH OF TIME SEGMENT - 15 MINUTES.

-------------------------------------------------------------------------------- TRL TRL VIEWER 3.0 AC t:\M-EC Job Book\20111\capacity assessments\2011 A50-B5030 rdbt PM.vao - Page 2 -------------------------------------------------------------------------------- DEMAND FLOW PROFILES ARE SYNTHESISED FROM TURNING COUNT DATA DEMAND SET TITLE: The Dove Way ----------------------------------------------------------------------------- I I NUMBER OF MINUTES FROM START WHEN I RATE OF FLOW (VEH/MIN) I I ARM I FLOW STARTS I TOP OF PEAK I FLOW STOPS I BEFORE I AT TOP I AFTER I I I TO RISE I IS REACHED IFALLING I PEAK I OF PEAK I PEAK I ----------------------------------------------------------------------------- I ARM A I 15.00 I 45.00 I 75.00 I 10.51 I 15.77 I 10.51 I I ARM B I 15.00 I 45.00 I 75.00 I 6.34 I 9.51 I 6.34 I I ARM C I 15.00 I 45.00 I 75.00 I 11.34 I 17.01 I 11.34 I I ARM D I 15.00 I 45.00 I 75.00 I 12.96 I 19.44 I 12.96 I ----------------------------------------------------------------------------- DEMAND SET TITLE: The Dove Way
-------------------------------------------------------------------- I I TURNING PROPORTIONS I I I TURNING COUNTS (VEH/HR) I I I (PERCENTAGE OF H.V.S) I I ----------------------------------------------- I TIME I FROM/TO I ARM A I ARM B I ARM C I ARM D I -------------------------------------------------------------------- I 16.45 - 18.15 I I I I I I I I ARM A I 0.000 I 0.203 I 0.413 I 0.384 I I I I 0.0 I 171.0 I 347.0 I 323.0 I I I I ( 10.0)I ( 10.0)I ( 10.0)I ( 10.0)I I I I I I I I I I ARM B I 0.365 I 0.000 I 0.243 I 0.393 I I I I 185.0 I 0.0 I 123.0 I 199.0 I I I I ( 10.0)I ( 10.0)I ( 10.0)I ( 10.0)I I I I I I I I I I ARM C I 0.587 I 0.195 I 0.000 I 0.218 I I I I 532.0 I 177.0 I 0.0 I 198.0 I I I I ( 10.0)I ( 10.0)I ( 10.0)I ( 10.0)I I I I I I I I I I ARM D I 0.567 I 0.236 I 0.197 I 0.000 I I I I 588.0 I 245.0 I 204.0 I 0.0 I I I I ( 10.0)I ( 10.0)I ( 10.0)I ( 10.0)I I I I I I I I --------------------------------------------------------------------
QUEUE AND DELAY INFORMATION FOR EACH 15 MIN TIME SEGMENT --------------------------------------------------------
------------------------------------------------------------------------------------------------------------------ I TIME DEMAND CAPACITY DEMAND/ PEDESTRIAN START END DELAY GEOMETRIC DELAY AVERAGE DELAY I I (VEH/MIN) (VEH/MIN) CAPACITY FLOW QUEUE QUEUE (VEH.MIN/ (VEH.MIN/ PER ARRIVING I I (RFC) (PEDS/MIN) (VEHS) (VEHS) TIME SEGMENT) TIME SEGMENT) VEHICLE (MIN) I I 16.45-17.00 I I ARM A 10.51 30.45 0.345 0.0 0.5 7.7 0.05 I I ARM B 6.34 20.02 0.317 0.0 0.5 6.7 0.07 I I ARM C 11.34 27.27 0.416 0.0 0.7 10.3 0.06 I I ARM D 12.96 30.70 0.422 0.0 0.7 10.6 0.06 I I I ------------------------------------------------------------------------------------------------------------------
------------------------------------------------------------------------------------------------------------------ I TIME DEMAND CAPACITY DEMAND/ PEDESTRIAN START END DELAY GEOMETRIC DELAY AVERAGE DELAY I I (VEH/MIN) (VEH/MIN) CAPACITY FLOW QUEUE QUEUE (VEH.MIN/ (VEH.MIN/ PER ARRIVING I I (RFC) (PEDS/MIN) (VEHS) (VEHS) TIME SEGMENT) TIME SEGMENT) VEHICLE (MIN) I I 17.00-17.15 I I ARM A 12.55 29.39 0.427 0.5 0.7 10.9 0.06 I I ARM B 7.57 18.78 0.403 0.5 0.7 9.8 0.09 I I ARM C 13.54 26.15 0.518 0.7 1.1 15.5 0.08 I I ARM D 15.48 29.14 0.531 0.7 1.1 16.4 0.07 I I I ------------------------------------------------------------------------------------------------------------------
------------------------------------------------------------------------------------------------------------------ I TIME DEMAND CAPACITY DEMAND/ PEDESTRIAN START END DELAY GEOMETRIC DELAY AVERAGE DELAY I I (VEH/MIN) (VEH/MIN) CAPACITY FLOW QUEUE QUEUE (VEH.MIN/ (VEH.MIN/ PER ARRIVING I I (RFC) (PEDS/MIN) (VEHS) (VEHS) TIME SEGMENT) TIME SEGMENT) VEHICLE (MIN) I I 17.15-17.30 I I ARM A 15.37 27.95 0.550 0.7 1.2 17.6 0.08 I I ARM B 9.27 17.10 0.542 0.7 1.2 16.7 0.13 I I ARM C 16.58 24.64 0.673 1.1 2.0 28.6 0.12 I I ARM D 18.96 27.04 0.701 1.1 2.3 32.3 0.12 I I I ------------------------------------------------------------------------------------------------------------------
------------------------------------------------------------------------------------------------------------------ I TIME DEMAND CAPACITY DEMAND/ PEDESTRIAN START END DELAY GEOMETRIC DELAY AVERAGE DELAY I I (VEH/MIN) (VEH/MIN) CAPACITY FLOW QUEUE QUEUE (VEH.MIN/ (VEH.MIN/ PER ARRIVING I I (RFC) (PEDS/MIN) (VEHS) (VEHS) TIME SEGMENT) TIME SEGMENT) VEHICLE (MIN) I I 17.30-17.45 I I ARM A 15.37 27.92 0.551 1.2 1.2 18.2 0.08 I I ARM B 9.27 17.07 0.543 1.2 1.2 17.6 0.13 I I ARM C 16.58 24.62 0.674 2.0 2.0 30.4 0.12 I I ARM D 18.96 27.00 0.702 2.3 2.3 34.6 0.12 I I I ------------------------------------------------------------------------------------------------------------------

-------------------------------------------------------------------------------- TRL TRL VIEWER 3.0 AC t:\M-EC Job Book\20111\capacity assessments\2011 A50-B5030 rdbt PM.vao - Page 3 -------------------------------------------------------------------------------- ------------------------------------------------------------------------------------------------------------------ I TIME DEMAND CAPACITY DEMAND/ PEDESTRIAN START END DELAY GEOMETRIC DELAY AVERAGE DELAY I I (VEH/MIN) (VEH/MIN) CAPACITY FLOW QUEUE QUEUE (VEH.MIN/ (VEH.MIN/ PER ARRIVING I I (RFC) (PEDS/MIN) (VEHS) (VEHS) TIME SEGMENT) TIME SEGMENT) VEHICLE (MIN) I I 17.45-18.00 I I ARM A 12.55 29.34 0.428 1.2 0.8 11.6 0.06 I I ARM B 7.57 18.75 0.404 1.2 0.7 10.6 0.09 I I ARM C 13.54 26.12 0.518 2.0 1.1 16.9 0.08 I I ARM D 15.48 29.08 0.532 2.3 1.1 17.8 0.07 I I I ------------------------------------------------------------------------------------------------------------------
------------------------------------------------------------------------------------------------------------------ I TIME DEMAND CAPACITY DEMAND/ PEDESTRIAN START END DELAY GEOMETRIC DELAY AVERAGE DELAY I I (VEH/MIN) (VEH/MIN) CAPACITY FLOW QUEUE QUEUE (VEH.MIN/ (VEH.MIN/ PER ARRIVING I I (RFC) (PEDS/MIN) (VEHS) (VEHS) TIME SEGMENT) TIME SEGMENT) VEHICLE (MIN) I I 18.00-18.15 I I ARM A 10.51 30.41 0.346 0.8 0.5 8.1 0.05 I I ARM B 6.34 19.99 0.317 0.7 0.5 7.2 0.07 I I ARM C 11.34 27.24 0.416 1.1 0.7 11.0 0.06 I I ARM D 12.96 30.64 0.423 1.1 0.7 11.3 0.06 I I I ------------------------------------------------------------------------------------------------------------------
QUEUE AT ARM A -------------- TIME SEGMENT NO. OF ENDING VEHICLES IN QUEUE 17.00 0.5 * 17.15 0.7 * 17.30 1.2 * 17.45 1.2 * 18.00 0.8 * 18.15 0.5 *
QUEUE AT ARM B -------------- TIME SEGMENT NO. OF ENDING VEHICLES IN QUEUE 17.00 0.5 17.15 0.7 * 17.30 1.2 * 17.45 1.2 * 18.00 0.7 * 18.15 0.5
QUEUE AT ARM C -------------- TIME SEGMENT NO. OF ENDING VEHICLES IN QUEUE 17.00 0.7 * 17.15 1.1 * 17.30 2.0 ** 17.45 2.0 ** 18.00 1.1 * 18.15 0.7 *
QUEUE AT ARM D -------------- TIME SEGMENT NO. OF ENDING VEHICLES IN QUEUE 17.00 0.7 * 17.15 1.1 * 17.30 2.3 ** 17.45 2.3 ** 18.00 1.1 * 18.15 0.7 *

-------------------------------------------------------------------------------- TRL TRL VIEWER 3.0 AC t:\M-EC Job Book\20111\capacity assessments\2011 A50-B5030 rdbt PM.vao - Page 4 -------------------------------------------------------------------------------- QUEUEING DELAY INFORMATION OVER WHOLE PERIOD -------------------------------------------- ---------------------------------------------------------------------------- I ARM I TOTAL DEMAND I * QUEUEING * I * INCLUSIVE QUEUEING * I I I I * DELAY * I * DELAY * I I I------------------------------------------------------------------I I I (VEH) (VEH/H) I (MIN) (MIN/VEH) I (MIN) (MIN/VEH) I ---------------------------------------------------------------------------- I A I 1153.2 I 768.8 I 74.1 I 0.06 I 74.1 I 0.06 I I B I 695.2 I 463.5 I 68.5 I 0.10 I 68.5 I 0.10 I I C I 1243.7 I 829.1 I 112.7 I 0.09 I 112.7 I 0.09 I I D I 1421.9 I 948.0 I 123.1 I 0.09 I 123.1 I 0.09 I ---------------------------------------------------------------------------- I ALL I 4514.0 I 3009.4 I 378.3 I 0.08 I 378.4 I 0.08 I ---------------------------------------------------------------------------- * DELAY IS THAT OCCURRING ONLY WITHIN THE TIME PERIOD. * INCLUSIVE DELAY INCLUDES DELAY SUFFERED BY VEHICLES WHICH ARE STILL QUEUEING AFTER THE END OF THE TIME PERIOD. * THESE WILL ONLY BE SIGNIFICANTLY DIFFERENT IF THERE IS A LARGE QUEUE REMAINING AT THE END OF THE TIME PERIOD. END OF JOB ============================================= end of file ===============================================
[Printed at 12:17:07 on 05/07/2011]

-------------------------------------------------------------------------------- TRL TRL VIEWER 3.0 AC t:\M-EC Job Book\20111\capacity assessments\2011 A518-B5030 Spath rdbt AM.vao - Page 1 -------------------------------------------------------------------------------- ___________________ A R C A D Y 6 ___________________ ASSESSMENT OF ROUNDABOUT CAPACITY AND DELAY Analysis Program: Release 2.0 (MAR 2005) (c) Copyright TRL Limited, 2004 Adapted from ARCADY/3 which is Crown Copyright by permission of the controller of HMSO ______________________________________________________ For sales and distribution information, program advice and maintenance, contact: TRL Limited Tel: +44 (0) 1344 770018 Crowthorne House Fax: +44 (0) 1344 770864 Nine Mile Ride Email: [email protected] Wokingham, Berks. Web: www.trlsoftware.co.uk RG40 3GA,UK --------------------------------------------------------------------------------- THE USER OF THIS COMPUTER PROGRAM FOR THE SOLUTION OF AN ENGINEERING PROBLEM IS IN NO WAY RELIEVED OF THEIR RESPONSIBILITY FOR THE CORRECTNESS OF THE SOLUTION --------------------------------------------------------------------------------- Run with file:- "t:\M-EC Job Book\20111\capacity assessments\2011 A518-B5030 Spath rdbt AM.vai"(drive-on-the-left ) at 11:59:07 on Tuesday, 5 July 2011
FILE PROPERTIES *************** RUN TITLE: A518/B5030 Spath Rdbt LOCATION: DATE: 04/07/2011 CLIENT: ENUMERATOR: trose [TIMROSE] JOB NUMBER: 20111 STATUS: DESCRIPTION:
INPUT DATA ********** ARM A - A518 The Dove Way ARM B - A518 ARM C - B5030
GEOMETRIC DATA -------------- ----------------------------------------------------------------------------------------------------------------------- I ARM I V (M) I E (M) I L (M) I R (M) I D (M) I PHI (DEG) I SLOPE I INTERCEPT (PCU/MIN) I ----------------------------------------------------------------------------------------------------------------------- I ARM A I 4.00 I 8.00 I 30.00 I 35.00 I 58.00 I 54.0 I 0.593 I 32.218 I I ARM B I 5.00 I 6.00 I 15.00 I 45.00 I 58.00 I 53.0 I 0.549 I 27.864 I I ARM C I 4.50 I 8.00 I 30.00 I 40.00 I 58.00 I 57.0 I 0.600 I 33.131 I ----------------------------------------------------------------------------------------------------------------------- V = approach half-width L = effective flare length D = inscribed circle diameter E = entry width R = entry radius PHI = entry angle
TRAFFIC DEMAND DATA ------------------- (Only sets included in the current run are shown)
----------------------- I ARM I FLOW SCALE(%) I ----------------------- I A I 100 I I B I 100 I I C I 100 I -----------------------
TIME PERIOD BEGINS 07.45 AND ENDS 09.15
LENGTH OF TIME PERIOD - 90 MINUTES. LENGTH OF TIME SEGMENT - 15 MINUTES.

-------------------------------------------------------------------------------- TRL TRL VIEWER 3.0 AC t:\M-EC Job Book\20111\capacity assessments\2011 A518-B5030 Spath rdbt AM.vao - Page 2 -------------------------------------------------------------------------------- DEMAND FLOW PROFILES ARE SYNTHESISED FROM TURNING COUNT DATA DEMAND SET TITLE: A518/B5030 Spath Rdbt ----------------------------------------------------------------------------- I I NUMBER OF MINUTES FROM START WHEN I RATE OF FLOW (VEH/MIN) I I ARM I FLOW STARTS I TOP OF PEAK I FLOW STOPS I BEFORE I AT TOP I AFTER I I I TO RISE I IS REACHED IFALLING I PEAK I OF PEAK I PEAK I ----------------------------------------------------------------------------- I ARM A I 15.00 I 45.00 I 75.00 I 4.69 I 7.03 I 4.69 I I ARM B I 15.00 I 45.00 I 75.00 I 7.84 I 11.76 I 7.84 I I ARM C I 15.00 I 45.00 I 75.00 I 9.35 I 14.03 I 9.35 I ----------------------------------------------------------------------------- DEMAND SET TITLE: A518/B5030 Spath Rdbt
----------------------------------------------------------- I I TURNING PROPORTIONS I I I TURNING COUNTS (VEH/HR) I I I (PERCENTAGE OF H.V.S) I I -------------------------------------- I TIME I FROM/TO I ARM A I ARM B I ARM C I ----------------------------------------------------------- I 07.45 - 09.15 I I I I I I I ARM A I 0.000 I 0.557 I 0.443 I I I I 0.0 I 209.0 I 166.0 I I I I ( 10.0)I ( 10.0)I ( 10.0)I I I I I I I I I ARM B I 0.391 I 0.000 I 0.609 I I I I 245.0 I 0.0 I 382.0 I I I I ( 10.0)I ( 10.0)I ( 10.0)I I I I I I I I I ARM C I 0.190 I 0.810 I 0.000 I I I I 142.0 I 606.0 I 0.0 I I I I ( 10.0)I ( 10.0)I ( 10.0)I I I I I I I -----------------------------------------------------------
QUEUE AND DELAY INFORMATION FOR EACH 15 MIN TIME SEGMENT --------------------------------------------------------
------------------------------------------------------------------------------------------------------------------ I TIME DEMAND CAPACITY DEMAND/ PEDESTRIAN START END DELAY GEOMETRIC DELAY AVERAGE DELAY I I (VEH/MIN) (VEH/MIN) CAPACITY FLOW QUEUE QUEUE (VEH.MIN/ (VEH.MIN/ PER ARRIVING I I (RFC) (PEDS/MIN) (VEHS) (VEHS) TIME SEGMENT) TIME SEGMENT) VEHICLE (MIN) I I 07.45-08.00 I I ARM A 4.69 24.82 0.189 0.0 0.2 3.4 0.05 I I ARM B 7.84 24.20 0.324 0.0 0.5 7.0 0.06 I I ARM C 9.35 28.29 0.331 0.0 0.5 7.2 0.05 I I I ------------------------------------------------------------------------------------------------------------------
------------------------------------------------------------------------------------------------------------------ I TIME DEMAND CAPACITY DEMAND/ PEDESTRIAN START END DELAY GEOMETRIC DELAY AVERAGE DELAY I I (VEH/MIN) (VEH/MIN) CAPACITY FLOW QUEUE QUEUE (VEH.MIN/ (VEH.MIN/ PER ARRIVING I I (RFC) (PEDS/MIN) (VEHS) (VEHS) TIME SEGMENT) TIME SEGMENT) VEHICLE (MIN) I I 08.00-08.15 I I ARM A 5.60 23.93 0.234 0.2 0.3 4.5 0.05 I I ARM B 9.36 23.97 0.390 0.5 0.6 9.4 0.07 I I ARM C 11.16 27.93 0.400 0.5 0.7 9.7 0.06 I I I ------------------------------------------------------------------------------------------------------------------
------------------------------------------------------------------------------------------------------------------ I TIME DEMAND CAPACITY DEMAND/ PEDESTRIAN START END DELAY GEOMETRIC DELAY AVERAGE DELAY I I (VEH/MIN) (VEH/MIN) CAPACITY FLOW QUEUE QUEUE (VEH.MIN/ (VEH.MIN/ PER ARRIVING I I (RFC) (PEDS/MIN) (VEHS) (VEHS) TIME SEGMENT) TIME SEGMENT) VEHICLE (MIN) I I 08.15-08.30 I I ARM A 6.86 22.73 0.302 0.3 0.4 6.3 0.06 I I ARM B 11.46 23.67 0.484 0.6 0.9 13.6 0.08 I I ARM C 13.67 27.43 0.498 0.7 1.0 14.4 0.07 I I I ------------------------------------------------------------------------------------------------------------------
------------------------------------------------------------------------------------------------------------------ I TIME DEMAND CAPACITY DEMAND/ PEDESTRIAN START END DELAY GEOMETRIC DELAY AVERAGE DELAY I I (VEH/MIN) (VEH/MIN) CAPACITY FLOW QUEUE QUEUE (VEH.MIN/ (VEH.MIN/ PER ARRIVING I I (RFC) (PEDS/MIN) (VEHS) (VEHS) TIME SEGMENT) TIME SEGMENT) VEHICLE (MIN) I I 08.30-08.45 I I ARM A 6.86 22.72 0.302 0.4 0.4 6.5 0.06 I I ARM B 11.46 23.66 0.484 0.9 0.9 14.0 0.08 I I ARM C 13.67 27.43 0.499 1.0 1.0 14.8 0.07 I I I ------------------------------------------------------------------------------------------------------------------
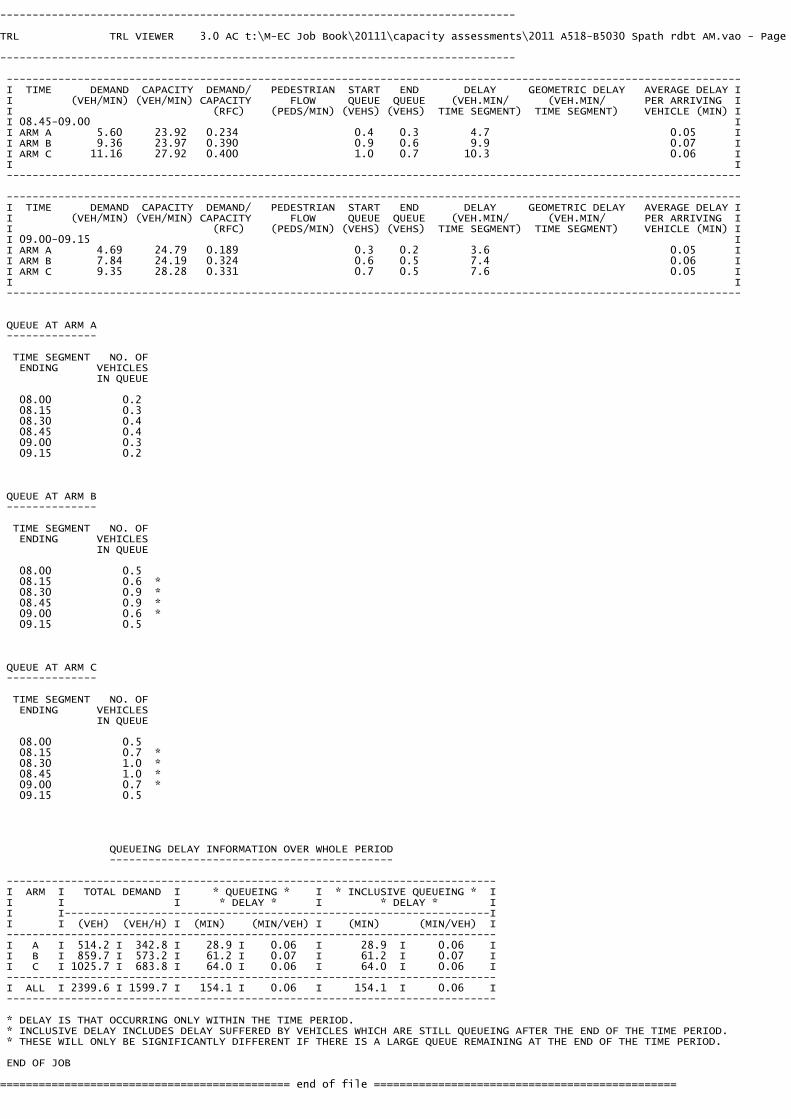
-------------------------------------------------------------------------------- TRL TRL VIEWER 3.0 AC t:\M-EC Job Book\20111\capacity assessments\2011 A518-B5030 Spath rdbt AM.vao - Page 3 -------------------------------------------------------------------------------- ------------------------------------------------------------------------------------------------------------------ I TIME DEMAND CAPACITY DEMAND/ PEDESTRIAN START END DELAY GEOMETRIC DELAY AVERAGE DELAY I I (VEH/MIN) (VEH/MIN) CAPACITY FLOW QUEUE QUEUE (VEH.MIN/ (VEH.MIN/ PER ARRIVING I I (RFC) (PEDS/MIN) (VEHS) (VEHS) TIME SEGMENT) TIME SEGMENT) VEHICLE (MIN) I I 08.45-09.00 I I ARM A 5.60 23.92 0.234 0.4 0.3 4.7 0.05 I I ARM B 9.36 23.97 0.390 0.9 0.6 9.9 0.07 I I ARM C 11.16 27.92 0.400 1.0 0.7 10.3 0.06 I I I ------------------------------------------------------------------------------------------------------------------
------------------------------------------------------------------------------------------------------------------ I TIME DEMAND CAPACITY DEMAND/ PEDESTRIAN START END DELAY GEOMETRIC DELAY AVERAGE DELAY I I (VEH/MIN) (VEH/MIN) CAPACITY FLOW QUEUE QUEUE (VEH.MIN/ (VEH.MIN/ PER ARRIVING I I (RFC) (PEDS/MIN) (VEHS) (VEHS) TIME SEGMENT) TIME SEGMENT) VEHICLE (MIN) I I 09.00-09.15 I I ARM A 4.69 24.79 0.189 0.3 0.2 3.6 0.05 I I ARM B 7.84 24.19 0.324 0.6 0.5 7.4 0.06 I I ARM C 9.35 28.28 0.331 0.7 0.5 7.6 0.05 I I I ------------------------------------------------------------------------------------------------------------------
QUEUE AT ARM A -------------- TIME SEGMENT NO. OF ENDING VEHICLES IN QUEUE 08.00 0.2 08.15 0.3 08.30 0.4 08.45 0.4 09.00 0.3 09.15 0.2
QUEUE AT ARM B -------------- TIME SEGMENT NO. OF ENDING VEHICLES IN QUEUE 08.00 0.5 08.15 0.6 * 08.30 0.9 * 08.45 0.9 * 09.00 0.6 * 09.15 0.5
QUEUE AT ARM C -------------- TIME SEGMENT NO. OF ENDING VEHICLES IN QUEUE 08.00 0.5 08.15 0.7 * 08.30 1.0 * 08.45 1.0 * 09.00 0.7 * 09.15 0.5
QUEUEING DELAY INFORMATION OVER WHOLE PERIOD -------------------------------------------- ---------------------------------------------------------------------------- I ARM I TOTAL DEMAND I * QUEUEING * I * INCLUSIVE QUEUEING * I I I I * DELAY * I * DELAY * I I I------------------------------------------------------------------I I I (VEH) (VEH/H) I (MIN) (MIN/VEH) I (MIN) (MIN/VEH) I ---------------------------------------------------------------------------- I A I 514.2 I 342.8 I 28.9 I 0.06 I 28.9 I 0.06 I I B I 859.7 I 573.2 I 61.2 I 0.07 I 61.2 I 0.07 I I C I 1025.7 I 683.8 I 64.0 I 0.06 I 64.0 I 0.06 I ---------------------------------------------------------------------------- I ALL I 2399.6 I 1599.7 I 154.1 I 0.06 I 154.1 I 0.06 I ---------------------------------------------------------------------------- * DELAY IS THAT OCCURRING ONLY WITHIN THE TIME PERIOD. * INCLUSIVE DELAY INCLUDES DELAY SUFFERED BY VEHICLES WHICH ARE STILL QUEUEING AFTER THE END OF THE TIME PERIOD. * THESE WILL ONLY BE SIGNIFICANTLY DIFFERENT IF THERE IS A LARGE QUEUE REMAINING AT THE END OF THE TIME PERIOD. END OF JOB ============================================= end of file ===============================================

[Printed at 11:59:14 on 05/07/2011]

-------------------------------------------------------------------------------- TRL TRL VIEWER 3.0 AC t:\M-EC Job Book\20111\capacity assessments\2011 A518-B5030 Spath rdbt PM.vao - Page 1 -------------------------------------------------------------------------------- ___________________ A R C A D Y 6 ___________________ ASSESSMENT OF ROUNDABOUT CAPACITY AND DELAY Analysis Program: Release 2.0 (MAR 2005) (c) Copyright TRL Limited, 2004 Adapted from ARCADY/3 which is Crown Copyright by permission of the controller of HMSO ______________________________________________________ For sales and distribution information, program advice and maintenance, contact: TRL Limited Tel: +44 (0) 1344 770018 Crowthorne House Fax: +44 (0) 1344 770864 Nine Mile Ride Email: [email protected] Wokingham, Berks. Web: www.trlsoftware.co.uk RG40 3GA,UK --------------------------------------------------------------------------------- THE USER OF THIS COMPUTER PROGRAM FOR THE SOLUTION OF AN ENGINEERING PROBLEM IS IN NO WAY RELIEVED OF THEIR RESPONSIBILITY FOR THE CORRECTNESS OF THE SOLUTION --------------------------------------------------------------------------------- Run with file:- "t:\M-EC Job Book\20111\capacity assessments\2011 A518-B5030 Spath rdbt PM.vai"(drive-on-the-left ) at 12:04:04 on Tuesday, 5 July 2011
FILE PROPERTIES *************** RUN TITLE: A518/B5030 Spath Rdbt LOCATION: DATE: 04/07/2011 CLIENT: ENUMERATOR: trose [TIMROSE] JOB NUMBER: 20111 STATUS: DESCRIPTION:
INPUT DATA ********** ARM A - A518 The Dove Way ARM B - A518 ARM C - B5030
GEOMETRIC DATA -------------- ----------------------------------------------------------------------------------------------------------------------- I ARM I V (M) I E (M) I L (M) I R (M) I D (M) I PHI (DEG) I SLOPE I INTERCEPT (PCU/MIN) I ----------------------------------------------------------------------------------------------------------------------- I ARM A I 4.00 I 8.00 I 30.00 I 35.00 I 58.00 I 54.0 I 0.593 I 32.218 I I ARM B I 5.00 I 6.00 I 15.00 I 45.00 I 58.00 I 53.0 I 0.549 I 27.864 I I ARM C I 4.50 I 8.00 I 30.00 I 40.00 I 58.00 I 57.0 I 0.600 I 33.131 I ----------------------------------------------------------------------------------------------------------------------- V = approach half-width L = effective flare length D = inscribed circle diameter E = entry width R = entry radius PHI = entry angle
TRAFFIC DEMAND DATA ------------------- (Only sets included in the current run are shown)
----------------------- I ARM I FLOW SCALE(%) I ----------------------- I A I 100 I I B I 100 I I C I 100 I -----------------------
TIME PERIOD BEGINS 16.45 AND ENDS 18.15
LENGTH OF TIME PERIOD - 90 MINUTES. LENGTH OF TIME SEGMENT - 15 MINUTES.

-------------------------------------------------------------------------------- TRL TRL VIEWER 3.0 AC t:\M-EC Job Book\20111\capacity assessments\2011 A518-B5030 Spath rdbt PM.vao - Page 2 -------------------------------------------------------------------------------- DEMAND FLOW PROFILES ARE SYNTHESISED FROM TURNING COUNT DATA DEMAND SET TITLE: A518/B5030 Spath Rdbt ----------------------------------------------------------------------------- I I NUMBER OF MINUTES FROM START WHEN I RATE OF FLOW (VEH/MIN) I I ARM I FLOW STARTS I TOP OF PEAK I FLOW STOPS I BEFORE I AT TOP I AFTER I I I TO RISE I IS REACHED IFALLING I PEAK I OF PEAK I PEAK I ----------------------------------------------------------------------------- I ARM A I 15.00 I 45.00 I 75.00 I 4.25 I 6.38 I 4.25 I I ARM B I 15.00 I 45.00 I 75.00 I 9.00 I 13.50 I 9.00 I I ARM C I 15.00 I 45.00 I 75.00 I 13.20 I 19.80 I 13.20 I ----------------------------------------------------------------------------- DEMAND SET TITLE: A518/B5030 Spath Rdbt
----------------------------------------------------------- I I TURNING PROPORTIONS I I I TURNING COUNTS (VEH/HR) I I I (PERCENTAGE OF H.V.S) I I -------------------------------------- I TIME I FROM/TO I ARM A I ARM B I ARM C I ----------------------------------------------------------- I 16.45 - 18.15 I I I I I I I ARM A I 0.000 I 0.444 I 0.556 I I I I 0.0 I 151.0 I 189.0 I I I I ( 10.0)I ( 10.0)I ( 10.0)I I I I I I I I I ARM B I 0.304 I 0.000 I 0.696 I I I I 219.0 I 0.0 I 501.0 I I I I ( 10.0)I ( 10.0)I ( 10.0)I I I I I I I I I ARM C I 0.159 I 0.841 I 0.000 I I I I 168.0 I 888.0 I 0.0 I I I I ( 10.0)I ( 10.0)I ( 10.0)I I I I I I I -----------------------------------------------------------
QUEUE AND DELAY INFORMATION FOR EACH 15 MIN TIME SEGMENT --------------------------------------------------------
------------------------------------------------------------------------------------------------------------------ I TIME DEMAND CAPACITY DEMAND/ PEDESTRIAN START END DELAY GEOMETRIC DELAY AVERAGE DELAY I I (VEH/MIN) (VEH/MIN) CAPACITY FLOW QUEUE QUEUE (VEH.MIN/ (VEH.MIN/ PER ARRIVING I I (RFC) (PEDS/MIN) (VEHS) (VEHS) TIME SEGMENT) TIME SEGMENT) VEHICLE (MIN) I I 16.45-17.00 I I ARM A 4.25 22.74 0.187 0.0 0.2 3.4 0.05 I I ARM B 9.00 24.04 0.374 0.0 0.6 8.7 0.07 I I ARM C 13.20 28.48 0.463 0.0 0.9 12.5 0.06 I I I ------------------------------------------------------------------------------------------------------------------
------------------------------------------------------------------------------------------------------------------ I TIME DEMAND CAPACITY DEMAND/ PEDESTRIAN START END DELAY GEOMETRIC DELAY AVERAGE DELAY I I (VEH/MIN) (VEH/MIN) CAPACITY FLOW QUEUE QUEUE (VEH.MIN/ (VEH.MIN/ PER ARRIVING I I (RFC) (PEDS/MIN) (VEHS) (VEHS) TIME SEGMENT) TIME SEGMENT) VEHICLE (MIN) I I 17.00-17.15 I I ARM A 5.07 21.45 0.237 0.2 0.3 4.6 0.06 I I ARM B 10.75 23.78 0.452 0.6 0.8 12.0 0.08 I I ARM C 15.76 28.16 0.560 0.9 1.3 18.3 0.08 I I I ------------------------------------------------------------------------------------------------------------------
------------------------------------------------------------------------------------------------------------------ I TIME DEMAND CAPACITY DEMAND/ PEDESTRIAN START END DELAY GEOMETRIC DELAY AVERAGE DELAY I I (VEH/MIN) (VEH/MIN) CAPACITY FLOW QUEUE QUEUE (VEH.MIN/ (VEH.MIN/ PER ARRIVING I I (RFC) (PEDS/MIN) (VEHS) (VEHS) TIME SEGMENT) TIME SEGMENT) VEHICLE (MIN) I I 17.15-17.30 I I ARM A 6.22 19.70 0.315 0.3 0.5 6.7 0.07 I I ARM B 13.16 23.44 0.562 0.8 1.3 18.3 0.10 I I ARM C 19.30 27.72 0.696 1.3 2.2 31.9 0.12 I I I ------------------------------------------------------------------------------------------------------------------
------------------------------------------------------------------------------------------------------------------ I TIME DEMAND CAPACITY DEMAND/ PEDESTRIAN START END DELAY GEOMETRIC DELAY AVERAGE DELAY I I (VEH/MIN) (VEH/MIN) CAPACITY FLOW QUEUE QUEUE (VEH.MIN/ (VEH.MIN/ PER ARRIVING I I (RFC) (PEDS/MIN) (VEHS) (VEHS) TIME SEGMENT) TIME SEGMENT) VEHICLE (MIN) I I 17.30-17.45 I I ARM A 6.22 19.67 0.316 0.5 0.5 6.9 0.07 I I ARM B 13.16 23.43 0.562 1.3 1.3 19.0 0.10 I I ARM C 19.30 27.71 0.697 2.2 2.3 33.8 0.12 I I I ------------------------------------------------------------------------------------------------------------------

-------------------------------------------------------------------------------- TRL TRL VIEWER 3.0 AC t:\M-EC Job Book\20111\capacity assessments\2011 A518-B5030 Spath rdbt PM.vao - Page 3 -------------------------------------------------------------------------------- ------------------------------------------------------------------------------------------------------------------ I TIME DEMAND CAPACITY DEMAND/ PEDESTRIAN START END DELAY GEOMETRIC DELAY AVERAGE DELAY I I (VEH/MIN) (VEH/MIN) CAPACITY FLOW QUEUE QUEUE (VEH.MIN/ (VEH.MIN/ PER ARRIVING I I (RFC) (PEDS/MIN) (VEHS) (VEHS) TIME SEGMENT) TIME SEGMENT) VEHICLE (MIN) I I 17.45-18.00 I I ARM A 5.07 21.40 0.237 0.5 0.3 4.8 0.06 I I ARM B 10.75 23.78 0.452 1.3 0.8 12.8 0.08 I I ARM C 15.76 28.15 0.560 2.3 1.3 20.0 0.08 I I I ------------------------------------------------------------------------------------------------------------------
------------------------------------------------------------------------------------------------------------------ I TIME DEMAND CAPACITY DEMAND/ PEDESTRIAN START END DELAY GEOMETRIC DELAY AVERAGE DELAY I I (VEH/MIN) (VEH/MIN) CAPACITY FLOW QUEUE QUEUE (VEH.MIN/ (VEH.MIN/ PER ARRIVING I I (RFC) (PEDS/MIN) (VEHS) (VEHS) TIME SEGMENT) TIME SEGMENT) VEHICLE (MIN) I I 18.00-18.15 I I ARM A 4.25 22.70 0.187 0.3 0.2 3.5 0.05 I I ARM B 9.00 24.03 0.375 0.8 0.6 9.2 0.07 I I ARM C 13.20 28.47 0.464 1.3 0.9 13.4 0.07 I I I ------------------------------------------------------------------------------------------------------------------
QUEUE AT ARM A -------------- TIME SEGMENT NO. OF ENDING VEHICLES IN QUEUE 17.00 0.2 17.15 0.3 17.30 0.5 17.45 0.5 18.00 0.3 18.15 0.2
QUEUE AT ARM B -------------- TIME SEGMENT NO. OF ENDING VEHICLES IN QUEUE 17.00 0.6 * 17.15 0.8 * 17.30 1.3 * 17.45 1.3 * 18.00 0.8 * 18.15 0.6 *
QUEUE AT ARM C -------------- TIME SEGMENT NO. OF ENDING VEHICLES IN QUEUE 17.00 0.9 * 17.15 1.3 * 17.30 2.2 ** 17.45 2.3 ** 18.00 1.3 * 18.15 0.9 *
QUEUEING DELAY INFORMATION OVER WHOLE PERIOD -------------------------------------------- ---------------------------------------------------------------------------- I ARM I TOTAL DEMAND I * QUEUEING * I * INCLUSIVE QUEUEING * I I I I * DELAY * I * DELAY * I I I------------------------------------------------------------------I I I (VEH) (VEH/H) I (MIN) (MIN/VEH) I (MIN) (MIN/VEH) I ---------------------------------------------------------------------------- I A I 466.2 I 310.8 I 29.8 I 0.06 I 29.8 I 0.06 I I B I 987.3 I 658.2 I 80.0 I 0.08 I 80.1 I 0.08 I I C I 1448.0 I 965.3 I 129.9 I 0.09 I 129.9 I 0.09 I ---------------------------------------------------------------------------- I ALL I 2901.5 I 1934.3 I 239.7 I 0.08 I 239.8 I 0.08 I ---------------------------------------------------------------------------- * DELAY IS THAT OCCURRING ONLY WITHIN THE TIME PERIOD. * INCLUSIVE DELAY INCLUDES DELAY SUFFERED BY VEHICLES WHICH ARE STILL QUEUEING AFTER THE END OF THE TIME PERIOD. * THESE WILL ONLY BE SIGNIFICANTLY DIFFERENT IF THERE IS A LARGE QUEUE REMAINING AT THE END OF THE TIME PERIOD. END OF JOB ============================================= end of file ===============================================

[Printed at 12:04:10 on 05/07/2011]

-------------------------------------------------------------------------------- TRL TRL VIEWER 3.0 AC t:\M-EC Job Book\20111\capacity assessments\2011 Derby Rd-Dove Walk Mini rdbt AM.vao - Page 1 -------------------------------------------------------------------------------- ___________________ A R C A D Y 6 ___________________ ASSESSMENT OF ROUNDABOUT CAPACITY AND DELAY Analysis Program: Release 2.0 (MAR 2005) (c) Copyright TRL Limited, 2004 Adapted from ARCADY/3 which is Crown Copyright by permission of the controller of HMSO ______________________________________________________ For sales and distribution information, program advice and maintenance, contact: TRL Limited Tel: +44 (0) 1344 770018 Crowthorne House Fax: +44 (0) 1344 770864 Nine Mile Ride Email: [email protected] Wokingham, Berks. Web: www.trlsoftware.co.uk RG40 3GA,UK --------------------------------------------------------------------------------- THE USER OF THIS COMPUTER PROGRAM FOR THE SOLUTION OF AN ENGINEERING PROBLEM IS IN NO WAY RELIEVED OF THEIR RESPONSIBILITY FOR THE CORRECTNESS OF THE SOLUTION --------------------------------------------------------------------------------- Run with file:- "t:\M-EC Job Book\20111\capacity assessments\2011 Derby Rd-Dove Walk Mini rdbt AM.vai"(drive-on-the-left ) at 11:25:23 on Tuesday, 5 July 2011
FILE PROPERTIES *************** RUN TITLE: The Dove Way LOCATION: DATE: 05/07/2011 CLIENT: ENUMERATOR: trose [TIMROSE] JOB NUMBER: 20111 STATUS: DESCRIPTION:
INPUT DATA ********** ARM A - Dove Walk ARM B - Dove Fields ARM C - Derby Rd SW ARM D - Derby Rd NE
MINI-ROUNDABOUT GEOMETRIC DATA ------------------------------ LIGHTING CONDITIONS : NORMAL ROAD SURFACE CONDITION: NORMAL ---------------------------------------------------------------------------------------------------------------------- I ARM I V (m) I E (m) I Lm(M) I Vm(M) I A (M) I K (M) I G (%) I SLOPE I INTERCEPT I I I I I I I I I I I (PCU/MIN) I ---------------------------------------------------------------------------------------------------------------------- I ARM A I 2.00 I 4.00 I 10.00 I 2.00 I 8.00 I 2.50 I 0.00 I 0.515 I 14.021 I I ARM B I 4.00 I 5.00 I 5.00 I 4.00 I 11.50 I 3.50 I 0.00 I 0.585 I 14.549 I I ARM C I 2.50 I 3.50 I 15.00 I 2.50 I 16.50 I 13.00 I 0.00 I 0.538 I 14.583 I I ARM D I 3.50 I 4.40 I 2.00 I 3.50 I 10.00 I 2.50 I 0.00 I 0.548 I 15.607 I ---------------------------------------------------------------------------------------------------------------------- V = approach half-width Lm = effective flare length A = distance between arms E = entry width Vm = minimum approach half-width K = entry corner kerb line G = gradient over 50m
TRAFFIC DEMAND DATA ------------------- (Only sets included in the current run are shown)
----------------------- I ARM I FLOW SCALE(%) I ----------------------- I A I 100 I I B I 100 I I C I 100 I I D I 100 I -----------------------

-------------------------------------------------------------------------------- TRL TRL VIEWER 3.0 AC t:\M-EC Job Book\20111\capacity assessments\2011 Derby Rd-Dove Walk Mini rdbt AM.vao - Page 2 -------------------------------------------------------------------------------- TIME PERIOD BEGINS 07.45 AND ENDS 09.15
LENGTH OF TIME PERIOD - 90 MINUTES. LENGTH OF TIME SEGMENT - 15 MINUTES.
DEMAND FLOW PROFILES ARE SYNTHESISED FROM TURNING COUNT DATA DEMAND SET TITLE: The Dove Way ----------------------------------------------------------------------------- I I NUMBER OF MINUTES FROM START WHEN I RATE OF FLOW (VEH/MIN) I I ARM I FLOW STARTS I TOP OF PEAK I FLOW STOPS I BEFORE I AT TOP I AFTER I I I TO RISE I IS REACHED IFALLING I PEAK I OF PEAK I PEAK I ----------------------------------------------------------------------------- I ARM A I 15.00 I 45.00 I 75.00 I 0.49 I 0.73 I 0.49 I I ARM B I 15.00 I 45.00 I 75.00 I 1.01 I 1.52 I 1.01 I I ARM C I 15.00 I 45.00 I 75.00 I 6.38 I 9.56 I 6.38 I I ARM D I 15.00 I 45.00 I 75.00 I 6.68 I 10.01 I 6.68 I ----------------------------------------------------------------------------- DEMAND SET TITLE: The Dove Way
-------------------------------------------------------------------- I I TURNING PROPORTIONS I I I TURNING COUNTS (VEH/HR) I I I (PERCENTAGE OF H.V.S) I I ----------------------------------------------- I TIME I FROM/TO I ARM A I ARM B I ARM C I ARM D I -------------------------------------------------------------------- I 07.45 - 09.15 I I I I I I I I ARM A I 0.000 I 0.103 I 0.205 I 0.692 I I I I 0.0 I 4.0 I 8.0 I 27.0 I I I I ( 10.0)I ( 10.0)I ( 10.0)I ( 10.0)I I I I I I I I I I ARM B I 0.025 I 0.000 I 0.259 I 0.716 I I I I 2.0 I 0.0 I 21.0 I 58.0 I I I I ( 10.0)I ( 10.0)I ( 10.0)I ( 10.0)I I I I I I I I I I ARM C I 0.006 I 0.137 I 0.000 I 0.857 I I I I 3.0 I 70.0 I 0.0 I 437.0 I I I I ( 10.0)I ( 10.0)I ( 10.0)I ( 10.0)I I I I I I I I I I ARM D I 0.002 I 0.144 I 0.854 I 0.000 I I I I 1.0 I 77.0 I 456.0 I 0.0 I I I I ( 10.0)I ( 10.0)I ( 10.0)I ( 10.0)I I I I I I I I --------------------------------------------------------------------
QUEUE AND DELAY INFORMATION FOR EACH 15 MIN TIME SEGMENT --------------------------------------------------------
------------------------------------------------------------------------------------------------------------------ I TIME DEMAND CAPACITY DEMAND/ CROSSING START END DELAY AVERAGE DELAY I I (VEH/MIN) (VEH/MIN) CAPACITY USE QUEUE QUEUE (VEH.MIN/ PER ARRIVING I I (RFC) PER MIN (VEHS) (VEHS) TIME SEGMENT) VEHICLE (MIN) I I 07.45-08.00 I I ARM A 0.49 8.90 0.055 0.0 0.1 0.8 0.12 I I ARM B 1.01 9.67 0.105 0.0 0.1 1.7 0.12 I I ARM C 6.38 12.68 0.503 0.0 1.0 14.0 0.16 I I ARM D 6.68 13.68 0.488 0.0 0.9 13.3 0.14 I I I ------------------------------------------------------------------------------------------------------------------
------------------------------------------------------------------------------------------------------------------ I TIME DEMAND CAPACITY DEMAND/ CROSSING START END DELAY AVERAGE DELAY I I (VEH/MIN) (VEH/MIN) CAPACITY USE QUEUE QUEUE (VEH.MIN/ PER ARRIVING I I (RFC) PER MIN (VEHS) (VEHS) TIME SEGMENT) VEHICLE (MIN) I I 08.00-08.15 I I ARM A 0.58 8.13 0.072 0.1 0.1 1.1 0.13 I I ARM B 1.21 8.96 0.135 0.1 0.2 2.3 0.13 I I ARM C 7.61 12.56 0.606 1.0 1.5 21.2 0.20 I I ARM D 7.97 13.58 0.587 0.9 1.4 19.8 0.18 I I I ------------------------------------------------------------------------------------------------------------------
------------------------------------------------------------------------------------------------------------------ I TIME DEMAND CAPACITY DEMAND/ CROSSING START END DELAY AVERAGE DELAY I I (VEH/MIN) (VEH/MIN) CAPACITY USE QUEUE QUEUE (VEH.MIN/ PER ARRIVING I I (RFC) PER MIN (VEHS) (VEHS) TIME SEGMENT) VEHICLE (MIN) I I 08.15-08.30 I I ARM A 0.71 7.11 0.100 0.1 0.1 1.6 0.16 I I ARM B 1.48 8.02 0.185 0.2 0.2 3.3 0.15 I I ARM C 9.32 12.40 0.752 1.5 2.8 38.1 0.31 I I ARM D 9.76 13.44 0.726 1.4 2.5 34.4 0.26 I I I ------------------------------------------------------------------------------------------------------------------

-------------------------------------------------------------------------------- TRL TRL VIEWER 3.0 AC t:\M-EC Job Book\20111\capacity assessments\2011 Derby Rd-Dove Walk Mini rdbt AM.vao - Page 3 -------------------------------------------------------------------------------- ------------------------------------------------------------------------------------------------------------------ I TIME DEMAND CAPACITY DEMAND/ CROSSING START END DELAY AVERAGE DELAY I I (VEH/MIN) (VEH/MIN) CAPACITY USE QUEUE QUEUE (VEH.MIN/ PER ARRIVING I I (RFC) PER MIN (VEHS) (VEHS) TIME SEGMENT) VEHICLE (MIN) I I 08.30-08.45 I I ARM A 0.71 7.07 0.101 0.1 0.1 1.7 0.16 I I ARM B 1.48 7.98 0.186 0.2 0.2 3.4 0.15 I I ARM C 9.32 12.40 0.752 2.8 2.9 43.0 0.32 I I ARM D 9.76 13.44 0.726 2.5 2.6 38.2 0.27 I I I ------------------------------------------------------------------------------------------------------------------
------------------------------------------------------------------------------------------------------------------ I TIME DEMAND CAPACITY DEMAND/ CROSSING START END DELAY AVERAGE DELAY I I (VEH/MIN) (VEH/MIN) CAPACITY USE QUEUE QUEUE (VEH.MIN/ PER ARRIVING I I (RFC) PER MIN (VEHS) (VEHS) TIME SEGMENT) VEHICLE (MIN) I I 08.45-09.00 I I ARM A 0.58 8.07 0.072 0.1 0.1 1.2 0.13 I I ARM B 1.21 8.90 0.136 0.2 0.2 2.4 0.13 I I ARM C 7.61 12.56 0.606 2.9 1.6 25.5 0.21 I I ARM D 7.97 13.57 0.587 2.6 1.5 23.3 0.18 I I I ------------------------------------------------------------------------------------------------------------------
------------------------------------------------------------------------------------------------------------------ I TIME DEMAND CAPACITY DEMAND/ CROSSING START END DELAY AVERAGE DELAY I I (VEH/MIN) (VEH/MIN) CAPACITY USE QUEUE QUEUE (VEH.MIN/ PER ARRIVING I I (RFC) PER MIN (VEHS) (VEHS) TIME SEGMENT) VEHICLE (MIN) I I 09.00-09.15 I I ARM A 0.49 8.84 0.055 0.1 0.1 0.9 0.12 I I ARM B 1.01 9.62 0.105 0.2 0.1 1.8 0.12 I I ARM C 6.38 12.67 0.503 1.6 1.0 16.2 0.16 I I ARM D 6.68 13.67 0.488 1.5 1.0 15.2 0.14 I I I ------------------------------------------------------------------------------------------------------------------
QUEUE AT ARM A -------------- TIME SEGMENT NO. OF ENDING VEHICLES IN QUEUE 08.00 0.1 08.15 0.1 08.30 0.1 08.45 0.1 09.00 0.1 09.15 0.1
QUEUE AT ARM B -------------- TIME SEGMENT NO. OF ENDING VEHICLES IN QUEUE 08.00 0.1 08.15 0.2 08.30 0.2 08.45 0.2 09.00 0.2 09.15 0.1
QUEUE AT ARM C -------------- TIME SEGMENT NO. OF ENDING VEHICLES IN QUEUE 08.00 1.0 * 08.15 1.5 * 08.30 2.8 *** 08.45 2.9 *** 09.00 1.6 ** 09.15 1.0 *
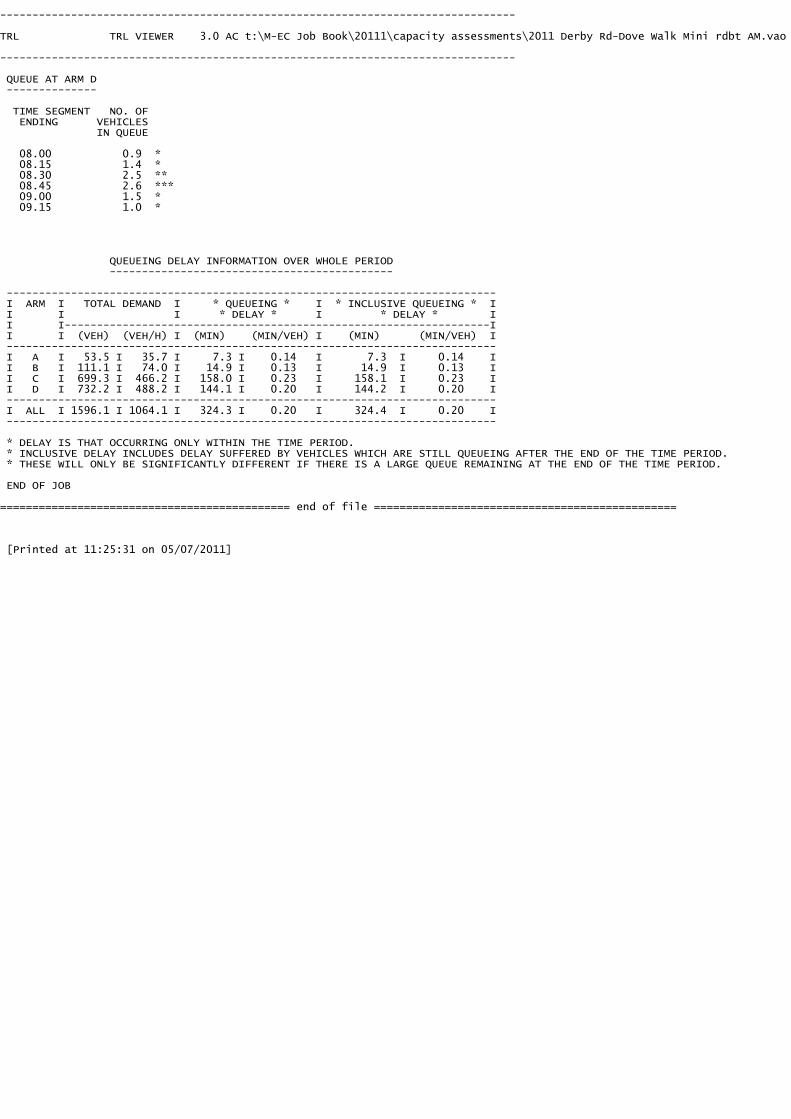
-------------------------------------------------------------------------------- TRL TRL VIEWER 3.0 AC t:\M-EC Job Book\20111\capacity assessments\2011 Derby Rd-Dove Walk Mini rdbt AM.vao - Page 4 -------------------------------------------------------------------------------- QUEUE AT ARM D -------------- TIME SEGMENT NO. OF ENDING VEHICLES IN QUEUE 08.00 0.9 * 08.15 1.4 * 08.30 2.5 ** 08.45 2.6 *** 09.00 1.5 * 09.15 1.0 *
QUEUEING DELAY INFORMATION OVER WHOLE PERIOD -------------------------------------------- ---------------------------------------------------------------------------- I ARM I TOTAL DEMAND I * QUEUEING * I * INCLUSIVE QUEUEING * I I I I * DELAY * I * DELAY * I I I------------------------------------------------------------------I I I (VEH) (VEH/H) I (MIN) (MIN/VEH) I (MIN) (MIN/VEH) I ---------------------------------------------------------------------------- I A I 53.5 I 35.7 I 7.3 I 0.14 I 7.3 I 0.14 I I B I 111.1 I 74.0 I 14.9 I 0.13 I 14.9 I 0.13 I I C I 699.3 I 466.2 I 158.0 I 0.23 I 158.1 I 0.23 I I D I 732.2 I 488.2 I 144.1 I 0.20 I 144.2 I 0.20 I ---------------------------------------------------------------------------- I ALL I 1596.1 I 1064.1 I 324.3 I 0.20 I 324.4 I 0.20 I ---------------------------------------------------------------------------- * DELAY IS THAT OCCURRING ONLY WITHIN THE TIME PERIOD. * INCLUSIVE DELAY INCLUDES DELAY SUFFERED BY VEHICLES WHICH ARE STILL QUEUEING AFTER THE END OF THE TIME PERIOD. * THESE WILL ONLY BE SIGNIFICANTLY DIFFERENT IF THERE IS A LARGE QUEUE REMAINING AT THE END OF THE TIME PERIOD. END OF JOB ============================================= end of file ===============================================
[Printed at 11:25:31 on 05/07/2011]

-------------------------------------------------------------------------------- TRL TRL VIEWER 3.0 AC t:\M-EC Job Book\20111\capacity assessments\2011 Derby Rd-Dove Walk Mini rdbt PM.vao - Page 1 -------------------------------------------------------------------------------- ___________________ A R C A D Y 6 ___________________ ASSESSMENT OF ROUNDABOUT CAPACITY AND DELAY Analysis Program: Release 2.0 (MAR 2005) (c) Copyright TRL Limited, 2004 Adapted from ARCADY/3 which is Crown Copyright by permission of the controller of HMSO ______________________________________________________ For sales and distribution information, program advice and maintenance, contact: TRL Limited Tel: +44 (0) 1344 770018 Crowthorne House Fax: +44 (0) 1344 770864 Nine Mile Ride Email: [email protected] Wokingham, Berks. Web: www.trlsoftware.co.uk RG40 3GA,UK --------------------------------------------------------------------------------- THE USER OF THIS COMPUTER PROGRAM FOR THE SOLUTION OF AN ENGINEERING PROBLEM IS IN NO WAY RELIEVED OF THEIR RESPONSIBILITY FOR THE CORRECTNESS OF THE SOLUTION --------------------------------------------------------------------------------- Run with file:- "t:\M-EC Job Book\20111\capacity assessments\2011 Derby Rd-Dove Walk Mini rdbt PM.vai"(drive-on-the-left ) at 11:28:50 on Tuesday, 5 July 2011
FILE PROPERTIES *************** RUN TITLE: The Dove Way LOCATION: DATE: 05/07/2011 CLIENT: ENUMERATOR: trose [TIMROSE] JOB NUMBER: 20111 STATUS: DESCRIPTION:
INPUT DATA ********** ARM A - Dove Walk ARM B - Dove Fields ARM C - Derby Rd SW ARM D - Derby Rd NE
MINI-ROUNDABOUT GEOMETRIC DATA ------------------------------ LIGHTING CONDITIONS : NORMAL ROAD SURFACE CONDITION: NORMAL ---------------------------------------------------------------------------------------------------------------------- I ARM I V (m) I E (m) I Lm(M) I Vm(M) I A (M) I K (M) I G (%) I SLOPE I INTERCEPT I I I I I I I I I I I (PCU/MIN) I ---------------------------------------------------------------------------------------------------------------------- I ARM A I 2.00 I 4.00 I 10.00 I 2.00 I 8.00 I 2.50 I 0.00 I 0.515 I 14.021 I I ARM B I 4.00 I 5.00 I 5.00 I 4.00 I 11.50 I 3.50 I 0.00 I 0.585 I 14.549 I I ARM C I 2.50 I 3.50 I 15.00 I 2.50 I 16.50 I 13.00 I 0.00 I 0.538 I 14.583 I I ARM D I 3.50 I 4.40 I 2.00 I 3.50 I 10.00 I 2.50 I 0.00 I 0.548 I 15.607 I ---------------------------------------------------------------------------------------------------------------------- V = approach half-width Lm = effective flare length A = distance between arms E = entry width Vm = minimum approach half-width K = entry corner kerb line G = gradient over 50m
TRAFFIC DEMAND DATA ------------------- (Only sets included in the current run are shown)
----------------------- I ARM I FLOW SCALE(%) I ----------------------- I A I 100 I I B I 100 I I C I 100 I I D I 100 I -----------------------
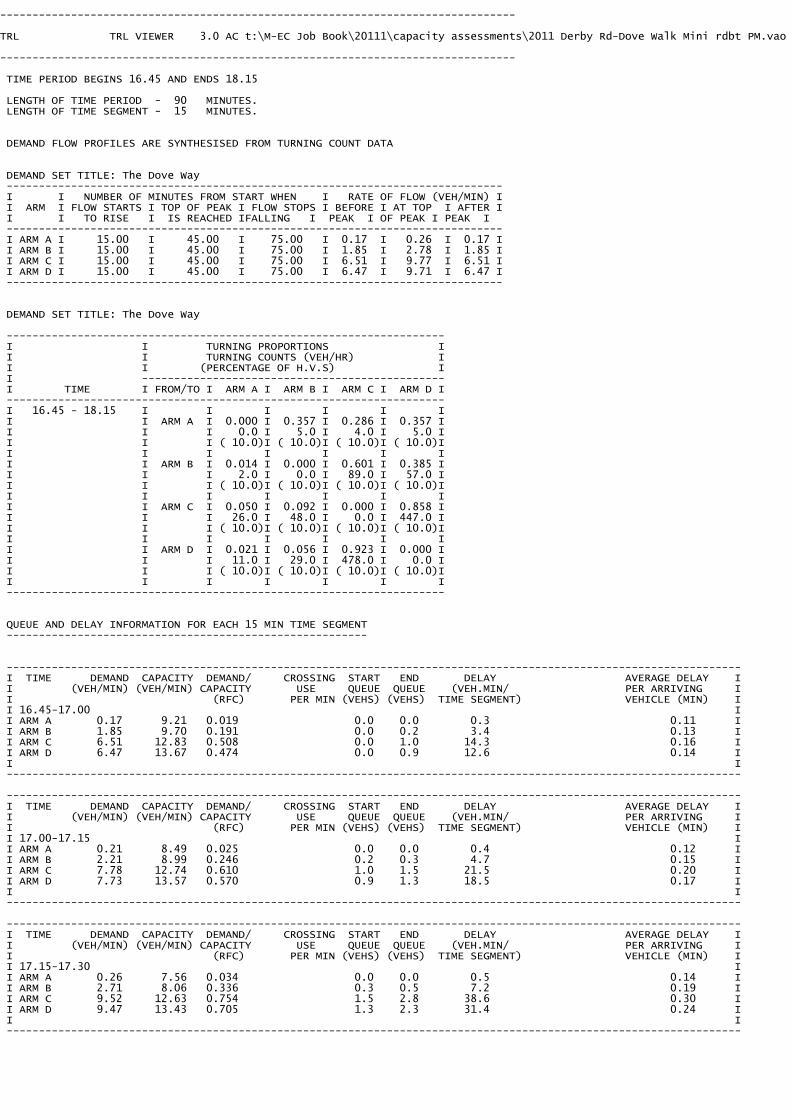
-------------------------------------------------------------------------------- TRL TRL VIEWER 3.0 AC t:\M-EC Job Book\20111\capacity assessments\2011 Derby Rd-Dove Walk Mini rdbt PM.vao - Page 2 -------------------------------------------------------------------------------- TIME PERIOD BEGINS 16.45 AND ENDS 18.15
LENGTH OF TIME PERIOD - 90 MINUTES. LENGTH OF TIME SEGMENT - 15 MINUTES.
DEMAND FLOW PROFILES ARE SYNTHESISED FROM TURNING COUNT DATA DEMAND SET TITLE: The Dove Way ----------------------------------------------------------------------------- I I NUMBER OF MINUTES FROM START WHEN I RATE OF FLOW (VEH/MIN) I I ARM I FLOW STARTS I TOP OF PEAK I FLOW STOPS I BEFORE I AT TOP I AFTER I I I TO RISE I IS REACHED IFALLING I PEAK I OF PEAK I PEAK I ----------------------------------------------------------------------------- I ARM A I 15.00 I 45.00 I 75.00 I 0.17 I 0.26 I 0.17 I I ARM B I 15.00 I 45.00 I 75.00 I 1.85 I 2.78 I 1.85 I I ARM C I 15.00 I 45.00 I 75.00 I 6.51 I 9.77 I 6.51 I I ARM D I 15.00 I 45.00 I 75.00 I 6.47 I 9.71 I 6.47 I ----------------------------------------------------------------------------- DEMAND SET TITLE: The Dove Way
-------------------------------------------------------------------- I I TURNING PROPORTIONS I I I TURNING COUNTS (VEH/HR) I I I (PERCENTAGE OF H.V.S) I I ----------------------------------------------- I TIME I FROM/TO I ARM A I ARM B I ARM C I ARM D I -------------------------------------------------------------------- I 16.45 - 18.15 I I I I I I I I ARM A I 0.000 I 0.357 I 0.286 I 0.357 I I I I 0.0 I 5.0 I 4.0 I 5.0 I I I I ( 10.0)I ( 10.0)I ( 10.0)I ( 10.0)I I I I I I I I I I ARM B I 0.014 I 0.000 I 0.601 I 0.385 I I I I 2.0 I 0.0 I 89.0 I 57.0 I I I I ( 10.0)I ( 10.0)I ( 10.0)I ( 10.0)I I I I I I I I I I ARM C I 0.050 I 0.092 I 0.000 I 0.858 I I I I 26.0 I 48.0 I 0.0 I 447.0 I I I I ( 10.0)I ( 10.0)I ( 10.0)I ( 10.0)I I I I I I I I I I ARM D I 0.021 I 0.056 I 0.923 I 0.000 I I I I 11.0 I 29.0 I 478.0 I 0.0 I I I I ( 10.0)I ( 10.0)I ( 10.0)I ( 10.0)I I I I I I I I --------------------------------------------------------------------
QUEUE AND DELAY INFORMATION FOR EACH 15 MIN TIME SEGMENT --------------------------------------------------------
------------------------------------------------------------------------------------------------------------------ I TIME DEMAND CAPACITY DEMAND/ CROSSING START END DELAY AVERAGE DELAY I I (VEH/MIN) (VEH/MIN) CAPACITY USE QUEUE QUEUE (VEH.MIN/ PER ARRIVING I I (RFC) PER MIN (VEHS) (VEHS) TIME SEGMENT) VEHICLE (MIN) I I 16.45-17.00 I I ARM A 0.17 9.21 0.019 0.0 0.0 0.3 0.11 I I ARM B 1.85 9.70 0.191 0.0 0.2 3.4 0.13 I I ARM C 6.51 12.83 0.508 0.0 1.0 14.3 0.16 I I ARM D 6.47 13.67 0.474 0.0 0.9 12.6 0.14 I I I ------------------------------------------------------------------------------------------------------------------
------------------------------------------------------------------------------------------------------------------ I TIME DEMAND CAPACITY DEMAND/ CROSSING START END DELAY AVERAGE DELAY I I (VEH/MIN) (VEH/MIN) CAPACITY USE QUEUE QUEUE (VEH.MIN/ PER ARRIVING I I (RFC) PER MIN (VEHS) (VEHS) TIME SEGMENT) VEHICLE (MIN) I I 17.00-17.15 I I ARM A 0.21 8.49 0.025 0.0 0.0 0.4 0.12 I I ARM B 2.21 8.99 0.246 0.2 0.3 4.7 0.15 I I ARM C 7.78 12.74 0.610 1.0 1.5 21.5 0.20 I I ARM D 7.73 13.57 0.570 0.9 1.3 18.5 0.17 I I I ------------------------------------------------------------------------------------------------------------------
------------------------------------------------------------------------------------------------------------------ I TIME DEMAND CAPACITY DEMAND/ CROSSING START END DELAY AVERAGE DELAY I I (VEH/MIN) (VEH/MIN) CAPACITY USE QUEUE QUEUE (VEH.MIN/ PER ARRIVING I I (RFC) PER MIN (VEHS) (VEHS) TIME SEGMENT) VEHICLE (MIN) I I 17.15-17.30 I I ARM A 0.26 7.56 0.034 0.0 0.0 0.5 0.14 I I ARM B 2.71 8.06 0.336 0.3 0.5 7.2 0.19 I I ARM C 9.52 12.63 0.754 1.5 2.8 38.6 0.30 I I ARM D 9.47 13.43 0.705 1.3 2.3 31.4 0.24 I I I ------------------------------------------------------------------------------------------------------------------

-------------------------------------------------------------------------------- TRL TRL VIEWER 3.0 AC t:\M-EC Job Book\20111\capacity assessments\2011 Derby Rd-Dove Walk Mini rdbt PM.vao - Page 3 -------------------------------------------------------------------------------- ------------------------------------------------------------------------------------------------------------------ I TIME DEMAND CAPACITY DEMAND/ CROSSING START END DELAY AVERAGE DELAY I I (VEH/MIN) (VEH/MIN) CAPACITY USE QUEUE QUEUE (VEH.MIN/ PER ARRIVING I I (RFC) PER MIN (VEHS) (VEHS) TIME SEGMENT) VEHICLE (MIN) I I 17.30-17.45 I I ARM A 0.26 7.52 0.034 0.0 0.0 0.5 0.14 I I ARM B 2.71 8.02 0.337 0.5 0.5 7.5 0.19 I I ARM C 9.52 12.63 0.754 2.8 2.9 43.6 0.32 I I ARM D 9.47 13.43 0.705 2.3 2.3 34.6 0.25 I I I ------------------------------------------------------------------------------------------------------------------
------------------------------------------------------------------------------------------------------------------ I TIME DEMAND CAPACITY DEMAND/ CROSSING START END DELAY AVERAGE DELAY I I (VEH/MIN) (VEH/MIN) CAPACITY USE QUEUE QUEUE (VEH.MIN/ PER ARRIVING I I (RFC) PER MIN (VEHS) (VEHS) TIME SEGMENT) VEHICLE (MIN) I I 17.45-18.00 I I ARM A 0.21 8.44 0.025 0.0 0.0 0.4 0.12 I I ARM B 2.21 8.94 0.247 0.5 0.3 5.2 0.15 I I ARM C 7.78 12.74 0.610 2.9 1.6 26.0 0.21 I I ARM D 7.73 13.56 0.570 2.3 1.4 21.6 0.18 I I I ------------------------------------------------------------------------------------------------------------------
------------------------------------------------------------------------------------------------------------------ I TIME DEMAND CAPACITY DEMAND/ CROSSING START END DELAY AVERAGE DELAY I I (VEH/MIN) (VEH/MIN) CAPACITY USE QUEUE QUEUE (VEH.MIN/ PER ARRIVING I I (RFC) PER MIN (VEHS) (VEHS) TIME SEGMENT) VEHICLE (MIN) I I 18.00-18.15 I I ARM A 0.17 9.16 0.019 0.0 0.0 0.3 0.11 I I ARM B 1.85 9.65 0.192 0.3 0.2 3.7 0.13 I I ARM C 6.51 12.83 0.508 1.6 1.1 16.5 0.16 I I ARM D 6.47 13.67 0.474 1.4 0.9 14.3 0.14 I I I ------------------------------------------------------------------------------------------------------------------
QUEUE AT ARM A -------------- TIME SEGMENT NO. OF ENDING VEHICLES IN QUEUE 17.00 0.0 17.15 0.0 17.30 0.0 17.45 0.0 18.00 0.0 18.15 0.0
QUEUE AT ARM B -------------- TIME SEGMENT NO. OF ENDING VEHICLES IN QUEUE 17.00 0.2 17.15 0.3 17.30 0.5 17.45 0.5 * 18.00 0.3 18.15 0.2
QUEUE AT ARM C -------------- TIME SEGMENT NO. OF ENDING VEHICLES IN QUEUE 17.00 1.0 * 17.15 1.5 ** 17.30 2.8 *** 17.45 2.9 *** 18.00 1.6 ** 18.15 1.1 *

-------------------------------------------------------------------------------- TRL TRL VIEWER 3.0 AC t:\M-EC Job Book\20111\capacity assessments\2011 Derby Rd-Dove Walk Mini rdbt PM.vao - Page 4 -------------------------------------------------------------------------------- QUEUE AT ARM D -------------- TIME SEGMENT NO. OF ENDING VEHICLES IN QUEUE 17.00 0.9 * 17.15 1.3 * 17.30 2.3 ** 17.45 2.3 ** 18.00 1.4 * 18.15 0.9 *
QUEUEING DELAY INFORMATION OVER WHOLE PERIOD -------------------------------------------- ---------------------------------------------------------------------------- I ARM I TOTAL DEMAND I * QUEUEING * I * INCLUSIVE QUEUEING * I I I I * DELAY * I * DELAY * I I I------------------------------------------------------------------I I I (VEH) (VEH/H) I (MIN) (MIN/VEH) I (MIN) (MIN/VEH) I ---------------------------------------------------------------------------- I A I 19.2 I 12.8 I 2.4 I 0.12 I 2.4 I 0.12 I I B I 202.9 I 135.3 I 31.6 I 0.16 I 31.6 I 0.16 I I C I 714.4 I 476.3 I 160.5 I 0.22 I 160.5 I 0.22 I I D I 710.3 I 473.5 I 133.0 I 0.19 I 133.0 I 0.19 I ---------------------------------------------------------------------------- I ALL I 1646.8 I 1097.9 I 327.5 I 0.20 I 327.5 I 0.20 I ---------------------------------------------------------------------------- * DELAY IS THAT OCCURRING ONLY WITHIN THE TIME PERIOD. * INCLUSIVE DELAY INCLUDES DELAY SUFFERED BY VEHICLES WHICH ARE STILL QUEUEING AFTER THE END OF THE TIME PERIOD. * THESE WILL ONLY BE SIGNIFICANTLY DIFFERENT IF THERE IS A LARGE QUEUE REMAINING AT THE END OF THE TIME PERIOD. END OF JOB ============================================= end of file ===============================================
[Printed at 11:28:56 on 05/07/2011]

-------------------------------------------------------------------------------- TRL TRL VIEWER 3.0 AC t:\M-EC Job Book\20111\capacity assessments\2011 Dove Bank-Town Meadows rdbt AM.vao - Page 1 -------------------------------------------------------------------------------- ___________________ A R C A D Y 6 ___________________ ASSESSMENT OF ROUNDABOUT CAPACITY AND DELAY Analysis Program: Release 2.0 (MAR 2005) (c) Copyright TRL Limited, 2004 Adapted from ARCADY/3 which is Crown Copyright by permission of the controller of HMSO ______________________________________________________ For sales and distribution information, program advice and maintenance, contact: TRL Limited Tel: +44 (0) 1344 770018 Crowthorne House Fax: +44 (0) 1344 770864 Nine Mile Ride Email: [email protected] Wokingham, Berks. Web: www.trlsoftware.co.uk RG40 3GA,UK --------------------------------------------------------------------------------- THE USER OF THIS COMPUTER PROGRAM FOR THE SOLUTION OF AN ENGINEERING PROBLEM IS IN NO WAY RELIEVED OF THEIR RESPONSIBILITY FOR THE CORRECTNESS OF THE SOLUTION --------------------------------------------------------------------------------- Run with file:- "t:\M-EC Job Book\20111\capacity assessments\2011 Dove Bank-Town Meadows rdbt AM.vai"(drive-on-the-left ) at 14:00:28 on Tuesday, 5 July 2011
FILE PROPERTIES *************** RUN TITLE: The Dove Way LOCATION: DATE: 05/07/2011 CLIENT: ENUMERATOR: trose [TIMROSE] JOB NUMBER: 20111 STATUS: DESCRIPTION:
INPUT DATA ********** ARM A - Retail Access ARM B - Town Meadows Way ARM C - Dove Bank ARM D - A518
GEOMETRIC DATA -------------- ----------------------------------------------------------------------------------------------------------------------- I ARM I V (M) I E (M) I L (M) I R (M) I D (M) I PHI (DEG) I SLOPE I INTERCEPT (PCU/MIN) I ----------------------------------------------------------------------------------------------------------------------- I ARM A I 4.00 I 5.00 I 5.00 I 20.00 I 40.00 I 30.0 I 0.581 I 23.279 I I ARM B I 5.00 I 7.00 I 23.00 I 25.00 I 40.00 I 60.0 I 0.634 I 30.025 I I ARM C I 3.00 I 5.00 I 30.00 I 45.00 I 40.00 I 56.0 I 0.547 I 21.994 I I ARM D I 7.00 I 7.00 I 0.00 I 15.00 I 40.00 I 64.0 I 0.628 I 30.603 I ----------------------------------------------------------------------------------------------------------------------- V = approach half-width L = effective flare length D = inscribed circle diameter E = entry width R = entry radius PHI = entry angle
TRAFFIC DEMAND DATA ------------------- (Only sets included in the current run are shown)
----------------------- I ARM I FLOW SCALE(%) I ----------------------- I A I 100 I I B I 100 I I C I 100 I I D I 100 I -----------------------
TIME PERIOD BEGINS 07.45 AND ENDS 09.15
LENGTH OF TIME PERIOD - 90 MINUTES. LENGTH OF TIME SEGMENT - 15 MINUTES.

-------------------------------------------------------------------------------- TRL TRL VIEWER 3.0 AC t:\M-EC Job Book\20111\capacity assessments\2011 Dove Bank-Town Meadows rdbt AM.vao - Page 2 -------------------------------------------------------------------------------- DEMAND FLOW PROFILES ARE SYNTHESISED FROM TURNING COUNT DATA DEMAND SET TITLE: The Dove Way ----------------------------------------------------------------------------- I I NUMBER OF MINUTES FROM START WHEN I RATE OF FLOW (VEH/MIN) I I ARM I FLOW STARTS I TOP OF PEAK I FLOW STOPS I BEFORE I AT TOP I AFTER I I I TO RISE I IS REACHED IFALLING I PEAK I OF PEAK I PEAK I ----------------------------------------------------------------------------- I ARM A I 15.00 I 45.00 I 75.00 I 1.23 I 1.84 I 1.23 I I ARM B I 15.00 I 45.00 I 75.00 I 10.20 I 15.30 I 10.20 I I ARM C I 15.00 I 45.00 I 75.00 I 4.19 I 6.28 I 4.19 I I ARM D I 15.00 I 45.00 I 75.00 I 10.07 I 15.11 I 10.07 I ----------------------------------------------------------------------------- DEMAND SET TITLE: The Dove Way
-------------------------------------------------------------------- I I TURNING PROPORTIONS I I I TURNING COUNTS (VEH/HR) I I I (PERCENTAGE OF H.V.S) I I ----------------------------------------------- I TIME I FROM/TO I ARM A I ARM B I ARM C I ARM D I -------------------------------------------------------------------- I 07.45 - 09.15 I I I I I I I I ARM A I 0.000 I 0.378 I 0.102 I 0.520 I I I I 0.0 I 37.0 I 10.0 I 51.0 I I I I ( 10.0)I ( 10.0)I ( 10.0)I ( 10.0)I I I I I I I I I I ARM B I 0.091 I 0.000 I 0.107 I 0.803 I I I I 74.0 I 0.0 I 87.0 I 655.0 I I I I ( 10.0)I ( 10.0)I ( 10.0)I ( 10.0)I I I I I I I I I I ARM C I 0.194 I 0.436 I 0.000 I 0.370 I I I I 65.0 I 146.0 I 0.0 I 124.0 I I I I ( 10.0)I ( 10.0)I ( 10.0)I ( 10.0)I I I I I I I I I I ARM D I 0.045 I 0.743 I 0.212 I 0.000 I I I I 36.0 I 599.0 I 171.0 I 0.0 I I I I ( 10.0)I ( 10.0)I ( 10.0)I ( 10.0)I I I I I I I I --------------------------------------------------------------------
QUEUE AND DELAY INFORMATION FOR EACH 15 MIN TIME SEGMENT --------------------------------------------------------
------------------------------------------------------------------------------------------------------------------ I TIME DEMAND CAPACITY DEMAND/ PEDESTRIAN START END DELAY GEOMETRIC DELAY AVERAGE DELAY I I (VEH/MIN) (VEH/MIN) CAPACITY FLOW QUEUE QUEUE (VEH.MIN/ (VEH.MIN/ PER ARRIVING I I (RFC) (PEDS/MIN) (VEHS) (VEHS) TIME SEGMENT) TIME SEGMENT) VEHICLE (MIN) I I 07.45-08.00 I I ARM A 1.23 14.54 0.084 0.0 0.1 1.3 0.08 I I ARM B 10.20 25.47 0.401 0.0 0.7 9.7 0.07 I I ARM C 4.19 14.69 0.285 0.0 0.4 5.7 0.09 I I ARM D 10.07 25.60 0.394 0.0 0.6 9.4 0.06 I I I ------------------------------------------------------------------------------------------------------------------
------------------------------------------------------------------------------------------------------------------ I TIME DEMAND CAPACITY DEMAND/ PEDESTRIAN START END DELAY GEOMETRIC DELAY AVERAGE DELAY I I (VEH/MIN) (VEH/MIN) CAPACITY FLOW QUEUE QUEUE (VEH.MIN/ (VEH.MIN/ PER ARRIVING I I (RFC) (PEDS/MIN) (VEHS) (VEHS) TIME SEGMENT) TIME SEGMENT) VEHICLE (MIN) I I 08.00-08.15 I I ARM A 1.46 13.23 0.111 0.1 0.1 1.8 0.08 I I ARM B 12.18 25.10 0.485 0.7 0.9 13.7 0.08 I I ARM C 5.00 13.64 0.367 0.4 0.6 8.3 0.12 I I ARM D 12.03 25.15 0.478 0.6 0.9 13.3 0.08 I I I ------------------------------------------------------------------------------------------------------------------
------------------------------------------------------------------------------------------------------------------ I TIME DEMAND CAPACITY DEMAND/ PEDESTRIAN START END DELAY GEOMETRIC DELAY AVERAGE DELAY I I (VEH/MIN) (VEH/MIN) CAPACITY FLOW QUEUE QUEUE (VEH.MIN/ (VEH.MIN/ PER ARRIVING I I (RFC) (PEDS/MIN) (VEHS) (VEHS) TIME SEGMENT) TIME SEGMENT) VEHICLE (MIN) I I 08.15-08.30 I I ARM A 1.79 11.46 0.156 0.1 0.2 2.7 0.10 I I ARM B 14.92 24.61 0.606 0.9 1.5 21.8 0.10 I I ARM C 6.12 12.22 0.501 0.6 1.0 14.1 0.16 I I ARM D 14.73 24.56 0.600 0.9 1.5 21.3 0.10 I I I ------------------------------------------------------------------------------------------------------------------
------------------------------------------------------------------------------------------------------------------ I TIME DEMAND CAPACITY DEMAND/ PEDESTRIAN START END DELAY GEOMETRIC DELAY AVERAGE DELAY I I (VEH/MIN) (VEH/MIN) CAPACITY FLOW QUEUE QUEUE (VEH.MIN/ (VEH.MIN/ PER ARRIVING I I (RFC) (PEDS/MIN) (VEHS) (VEHS) TIME SEGMENT) TIME SEGMENT) VEHICLE (MIN) I I 08.30-08.45 I I ARM A 1.79 11.43 0.157 0.2 0.2 2.8 0.10 I I ARM B 14.92 24.61 0.606 1.5 1.5 22.8 0.10 I I ARM C 6.12 12.20 0.502 1.0 1.0 14.9 0.16 I I ARM D 14.73 24.55 0.600 1.5 1.5 22.3 0.10 I I I ------------------------------------------------------------------------------------------------------------------
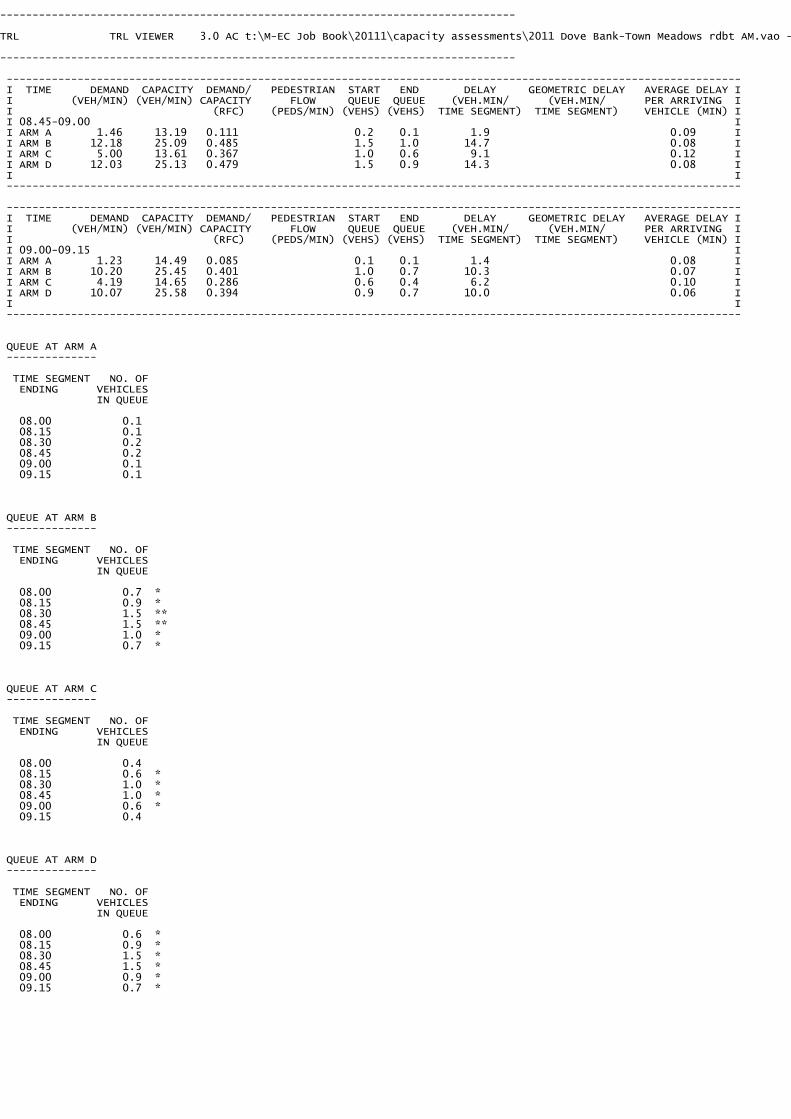
-------------------------------------------------------------------------------- TRL TRL VIEWER 3.0 AC t:\M-EC Job Book\20111\capacity assessments\2011 Dove Bank-Town Meadows rdbt AM.vao - Page 3 -------------------------------------------------------------------------------- ------------------------------------------------------------------------------------------------------------------ I TIME DEMAND CAPACITY DEMAND/ PEDESTRIAN START END DELAY GEOMETRIC DELAY AVERAGE DELAY I I (VEH/MIN) (VEH/MIN) CAPACITY FLOW QUEUE QUEUE (VEH.MIN/ (VEH.MIN/ PER ARRIVING I I (RFC) (PEDS/MIN) (VEHS) (VEHS) TIME SEGMENT) TIME SEGMENT) VEHICLE (MIN) I I 08.45-09.00 I I ARM A 1.46 13.19 0.111 0.2 0.1 1.9 0.09 I I ARM B 12.18 25.09 0.485 1.5 1.0 14.7 0.08 I I ARM C 5.00 13.61 0.367 1.0 0.6 9.1 0.12 I I ARM D 12.03 25.13 0.479 1.5 0.9 14.3 0.08 I I I ------------------------------------------------------------------------------------------------------------------
------------------------------------------------------------------------------------------------------------------ I TIME DEMAND CAPACITY DEMAND/ PEDESTRIAN START END DELAY GEOMETRIC DELAY AVERAGE DELAY I I (VEH/MIN) (VEH/MIN) CAPACITY FLOW QUEUE QUEUE (VEH.MIN/ (VEH.MIN/ PER ARRIVING I I (RFC) (PEDS/MIN) (VEHS) (VEHS) TIME SEGMENT) TIME SEGMENT) VEHICLE (MIN) I I 09.00-09.15 I I ARM A 1.23 14.49 0.085 0.1 0.1 1.4 0.08 I I ARM B 10.20 25.45 0.401 1.0 0.7 10.3 0.07 I I ARM C 4.19 14.65 0.286 0.6 0.4 6.2 0.10 I I ARM D 10.07 25.58 0.394 0.9 0.7 10.0 0.06 I I I ------------------------------------------------------------------------------------------------------------------
QUEUE AT ARM A -------------- TIME SEGMENT NO. OF ENDING VEHICLES IN QUEUE 08.00 0.1 08.15 0.1 08.30 0.2 08.45 0.2 09.00 0.1 09.15 0.1
QUEUE AT ARM B -------------- TIME SEGMENT NO. OF ENDING VEHICLES IN QUEUE 08.00 0.7 * 08.15 0.9 * 08.30 1.5 ** 08.45 1.5 ** 09.00 1.0 * 09.15 0.7 *
QUEUE AT ARM C -------------- TIME SEGMENT NO. OF ENDING VEHICLES IN QUEUE 08.00 0.4 08.15 0.6 * 08.30 1.0 * 08.45 1.0 * 09.00 0.6 * 09.15 0.4
QUEUE AT ARM D -------------- TIME SEGMENT NO. OF ENDING VEHICLES IN QUEUE 08.00 0.6 * 08.15 0.9 * 08.30 1.5 * 08.45 1.5 * 09.00 0.9 * 09.15 0.7 *

-------------------------------------------------------------------------------- TRL TRL VIEWER 3.0 AC t:\M-EC Job Book\20111\capacity assessments\2011 Dove Bank-Town Meadows rdbt AM.vao - Page 4 -------------------------------------------------------------------------------- QUEUEING DELAY INFORMATION OVER WHOLE PERIOD -------------------------------------------- ---------------------------------------------------------------------------- I ARM I TOTAL DEMAND I * QUEUEING * I * INCLUSIVE QUEUEING * I I I I * DELAY * I * DELAY * I I I------------------------------------------------------------------I I I (VEH) (VEH/H) I (MIN) (MIN/VEH) I (MIN) (MIN/VEH) I ---------------------------------------------------------------------------- I A I 134.4 I 89.6 I 12.0 I 0.09 I 12.0 I 0.09 I I B I 1118.9 I 745.9 I 93.0 I 0.08 I 93.0 I 0.08 I I C I 459.4 I 306.2 I 58.4 I 0.13 I 58.4 I 0.13 I I D I 1105.2 I 736.8 I 90.6 I 0.08 I 90.6 I 0.08 I ---------------------------------------------------------------------------- I ALL I 2817.8 I 1878.6 I 254.0 I 0.09 I 254.0 I 0.09 I ---------------------------------------------------------------------------- * DELAY IS THAT OCCURRING ONLY WITHIN THE TIME PERIOD. * INCLUSIVE DELAY INCLUDES DELAY SUFFERED BY VEHICLES WHICH ARE STILL QUEUEING AFTER THE END OF THE TIME PERIOD. * THESE WILL ONLY BE SIGNIFICANTLY DIFFERENT IF THERE IS A LARGE QUEUE REMAINING AT THE END OF THE TIME PERIOD. END OF JOB ============================================= end of file ===============================================
[Printed at 14:00:33 on 05/07/2011]

-------------------------------------------------------------------------------- TRL TRL VIEWER 3.0 AC t:\M-EC Job Book\20111\capacity assessments\2011 Dove Bank-Town Meadows rdbt PM.vao - Page 1 -------------------------------------------------------------------------------- ___________________ A R C A D Y 6 ___________________ ASSESSMENT OF ROUNDABOUT CAPACITY AND DELAY Analysis Program: Release 2.0 (MAR 2005) (c) Copyright TRL Limited, 2004 Adapted from ARCADY/3 which is Crown Copyright by permission of the controller of HMSO ______________________________________________________ For sales and distribution information, program advice and maintenance, contact: TRL Limited Tel: +44 (0) 1344 770018 Crowthorne House Fax: +44 (0) 1344 770864 Nine Mile Ride Email: [email protected] Wokingham, Berks. Web: www.trlsoftware.co.uk RG40 3GA,UK --------------------------------------------------------------------------------- THE USER OF THIS COMPUTER PROGRAM FOR THE SOLUTION OF AN ENGINEERING PROBLEM IS IN NO WAY RELIEVED OF THEIR RESPONSIBILITY FOR THE CORRECTNESS OF THE SOLUTION --------------------------------------------------------------------------------- Run with file:- "t:\M-EC Job Book\20111\capacity assessments\2011 Dove Bank-Town Meadows rdbt PM.vai"(drive-on-the-left ) at 14:10:47 on Tuesday, 5 July 2011
FILE PROPERTIES *************** RUN TITLE: The Dove Way LOCATION: DATE: 05/07/2011 CLIENT: ENUMERATOR: trose [TIMROSE] JOB NUMBER: 20111 STATUS: DESCRIPTION:
INPUT DATA ********** ARM A - Retail Access ARM B - Town Meadows Way ARM C - Dove Bank ARM D - A518
GEOMETRIC DATA -------------- ----------------------------------------------------------------------------------------------------------------------- I ARM I V (M) I E (M) I L (M) I R (M) I D (M) I PHI (DEG) I SLOPE I INTERCEPT (PCU/MIN) I ----------------------------------------------------------------------------------------------------------------------- I ARM A I 4.00 I 5.00 I 5.00 I 20.00 I 40.00 I 30.0 I 0.581 I 23.279 I I ARM B I 5.00 I 7.00 I 23.00 I 25.00 I 40.00 I 60.0 I 0.634 I 30.025 I I ARM C I 3.00 I 5.00 I 30.00 I 45.00 I 40.00 I 56.0 I 0.547 I 21.994 I I ARM D I 7.00 I 7.00 I 0.00 I 15.00 I 40.00 I 64.0 I 0.628 I 30.603 I ----------------------------------------------------------------------------------------------------------------------- V = approach half-width L = effective flare length D = inscribed circle diameter E = entry width R = entry radius PHI = entry angle
TRAFFIC DEMAND DATA ------------------- (Only sets included in the current run are shown)
----------------------- I ARM I FLOW SCALE(%) I ----------------------- I A I 100 I I B I 100 I I C I 100 I I D I 100 I -----------------------
TIME PERIOD BEGINS 16.45 AND ENDS 18.15
LENGTH OF TIME PERIOD - 90 MINUTES. LENGTH OF TIME SEGMENT - 15 MINUTES.

-------------------------------------------------------------------------------- TRL TRL VIEWER 3.0 AC t:\M-EC Job Book\20111\capacity assessments\2011 Dove Bank-Town Meadows rdbt PM.vao - Page 2 -------------------------------------------------------------------------------- DEMAND FLOW PROFILES ARE SYNTHESISED FROM TURNING COUNT DATA DEMAND SET TITLE: The Dove Way ----------------------------------------------------------------------------- I I NUMBER OF MINUTES FROM START WHEN I RATE OF FLOW (VEH/MIN) I I ARM I FLOW STARTS I TOP OF PEAK I FLOW STOPS I BEFORE I AT TOP I AFTER I I I TO RISE I IS REACHED IFALLING I PEAK I OF PEAK I PEAK I ----------------------------------------------------------------------------- I ARM A I 15.00 I 45.00 I 75.00 I 2.26 I 3.39 I 2.26 I I ARM B I 15.00 I 45.00 I 75.00 I 9.74 I 14.61 I 9.74 I I ARM C I 15.00 I 45.00 I 75.00 I 6.26 I 9.39 I 6.26 I I ARM D I 15.00 I 45.00 I 75.00 I 11.49 I 17.23 I 11.49 I ----------------------------------------------------------------------------- DEMAND SET TITLE: The Dove Way
-------------------------------------------------------------------- I I TURNING PROPORTIONS I I I TURNING COUNTS (VEH/HR) I I I (PERCENTAGE OF H.V.S) I I ----------------------------------------------- I TIME I FROM/TO I ARM A I ARM B I ARM C I ARM D I -------------------------------------------------------------------- I 16.45 - 18.15 I I I I I I I I ARM A I 0.000 I 0.436 I 0.155 I 0.409 I I I I 0.0 I 79.0 I 28.0 I 74.0 I I I I ( 10.0)I ( 10.0)I ( 10.0)I ( 10.0)I I I I I I I I I I ARM B I 0.122 I 0.000 I 0.199 I 0.679 I I I I 95.0 I 0.0 I 155.0 I 529.0 I I I I ( 10.0)I ( 10.0)I ( 10.0)I ( 10.0)I I I I I I I I I I ARM C I 0.206 I 0.379 I 0.000 I 0.415 I I I I 103.0 I 190.0 I 0.0 I 208.0 I I I I ( 10.0)I ( 10.0)I ( 10.0)I ( 10.0)I I I I I I I I I I ARM D I 0.066 I 0.765 I 0.169 I 0.000 I I I I 61.0 I 703.0 I 155.0 I 0.0 I I I I ( 10.0)I ( 10.0)I ( 10.0)I ( 10.0)I I I I I I I I --------------------------------------------------------------------
QUEUE AND DELAY INFORMATION FOR EACH 15 MIN TIME SEGMENT --------------------------------------------------------
------------------------------------------------------------------------------------------------------------------ I TIME DEMAND CAPACITY DEMAND/ PEDESTRIAN START END DELAY GEOMETRIC DELAY AVERAGE DELAY I I (VEH/MIN) (VEH/MIN) CAPACITY FLOW QUEUE QUEUE (VEH.MIN/ (VEH.MIN/ PER ARRIVING I I (RFC) (PEDS/MIN) (VEHS) (VEHS) TIME SEGMENT) TIME SEGMENT) VEHICLE (MIN) I I 16.45-17.00 I I ARM A 2.26 13.59 0.167 0.0 0.2 2.9 0.09 I I ARM B 9.74 25.27 0.385 0.0 0.6 9.1 0.06 I I ARM C 6.26 15.24 0.411 0.0 0.7 9.9 0.11 I I ARM D 11.49 24.79 0.463 0.0 0.9 12.4 0.07 I I I ------------------------------------------------------------------------------------------------------------------
------------------------------------------------------------------------------------------------------------------ I TIME DEMAND CAPACITY DEMAND/ PEDESTRIAN START END DELAY GEOMETRIC DELAY AVERAGE DELAY I I (VEH/MIN) (VEH/MIN) CAPACITY FLOW QUEUE QUEUE (VEH.MIN/ (VEH.MIN/ PER ARRIVING I I (RFC) (PEDS/MIN) (VEHS) (VEHS) TIME SEGMENT) TIME SEGMENT) VEHICLE (MIN) I I 17.00-17.15 I I ARM A 2.70 12.09 0.223 0.2 0.3 4.2 0.11 I I ARM B 11.63 24.87 0.468 0.6 0.9 12.7 0.08 I I ARM C 7.48 14.31 0.523 0.7 1.1 15.4 0.15 I I ARM D 13.72 24.19 0.567 0.9 1.3 18.7 0.09 I I I ------------------------------------------------------------------------------------------------------------------
------------------------------------------------------------------------------------------------------------------ I TIME DEMAND CAPACITY DEMAND/ PEDESTRIAN START END DELAY GEOMETRIC DELAY AVERAGE DELAY I I (VEH/MIN) (VEH/MIN) CAPACITY FLOW QUEUE QUEUE (VEH.MIN/ (VEH.MIN/ PER ARRIVING I I (RFC) (PEDS/MIN) (VEHS) (VEHS) TIME SEGMENT) TIME SEGMENT) VEHICLE (MIN) I I 17.15-17.30 I I ARM A 3.31 10.09 0.328 0.3 0.5 7.0 0.15 I I ARM B 14.24 24.33 0.585 0.9 1.4 20.1 0.10 I I ARM C 9.16 13.03 0.703 1.1 2.2 30.8 0.25 I I ARM D 16.80 23.40 0.718 1.3 2.5 34.6 0.15 I I I ------------------------------------------------------------------------------------------------------------------
------------------------------------------------------------------------------------------------------------------ I TIME DEMAND CAPACITY DEMAND/ PEDESTRIAN START END DELAY GEOMETRIC DELAY AVERAGE DELAY I I (VEH/MIN) (VEH/MIN) CAPACITY FLOW QUEUE QUEUE (VEH.MIN/ (VEH.MIN/ PER ARRIVING I I (RFC) (PEDS/MIN) (VEHS) (VEHS) TIME SEGMENT) TIME SEGMENT) VEHICLE (MIN) I I 17.30-17.45 I I ARM A 3.31 10.03 0.330 0.5 0.5 7.3 0.15 I I ARM B 14.24 24.32 0.586 1.4 1.4 21.0 0.10 I I ARM C 9.16 13.02 0.704 2.2 2.3 34.2 0.26 I I ARM D 16.80 23.37 0.719 2.5 2.5 37.4 0.15 I I I ------------------------------------------------------------------------------------------------------------------

-------------------------------------------------------------------------------- TRL TRL VIEWER 3.0 AC t:\M-EC Job Book\20111\capacity assessments\2011 Dove Bank-Town Meadows rdbt PM.vao - Page 3 -------------------------------------------------------------------------------- ------------------------------------------------------------------------------------------------------------------ I TIME DEMAND CAPACITY DEMAND/ PEDESTRIAN START END DELAY GEOMETRIC DELAY AVERAGE DELAY I I (VEH/MIN) (VEH/MIN) CAPACITY FLOW QUEUE QUEUE (VEH.MIN/ (VEH.MIN/ PER ARRIVING I I (RFC) (PEDS/MIN) (VEHS) (VEHS) TIME SEGMENT) TIME SEGMENT) VEHICLE (MIN) I I 17.45-18.00 I I ARM A 2.70 12.01 0.225 0.5 0.3 4.5 0.11 I I ARM B 11.63 24.85 0.468 1.4 0.9 13.7 0.08 I I ARM C 7.48 14.28 0.524 2.3 1.1 17.8 0.15 I I ARM D 13.72 24.15 0.568 2.5 1.3 20.9 0.10 I I I ------------------------------------------------------------------------------------------------------------------
------------------------------------------------------------------------------------------------------------------ I TIME DEMAND CAPACITY DEMAND/ PEDESTRIAN START END DELAY GEOMETRIC DELAY AVERAGE DELAY I I (VEH/MIN) (VEH/MIN) CAPACITY FLOW QUEUE QUEUE (VEH.MIN/ (VEH.MIN/ PER ARRIVING I I (RFC) (PEDS/MIN) (VEHS) (VEHS) TIME SEGMENT) TIME SEGMENT) VEHICLE (MIN) I I 18.00-18.15 I I ARM A 2.26 13.52 0.167 0.3 0.2 3.1 0.09 I I ARM B 9.74 25.25 0.386 0.9 0.6 9.7 0.06 I I ARM C 6.26 15.21 0.412 1.1 0.7 11.0 0.11 I I ARM D 11.49 24.76 0.464 1.3 0.9 13.5 0.08 I I I ------------------------------------------------------------------------------------------------------------------
QUEUE AT ARM A -------------- TIME SEGMENT NO. OF ENDING VEHICLES IN QUEUE 17.00 0.2 17.15 0.3 17.30 0.5 17.45 0.5 18.00 0.3 18.15 0.2
QUEUE AT ARM B -------------- TIME SEGMENT NO. OF ENDING VEHICLES IN QUEUE 17.00 0.6 * 17.15 0.9 * 17.30 1.4 * 17.45 1.4 * 18.00 0.9 * 18.15 0.6 *
QUEUE AT ARM C -------------- TIME SEGMENT NO. OF ENDING VEHICLES IN QUEUE 17.00 0.7 * 17.15 1.1 * 17.30 2.2 ** 17.45 2.3 ** 18.00 1.1 * 18.15 0.7 *
QUEUE AT ARM D -------------- TIME SEGMENT NO. OF ENDING VEHICLES IN QUEUE 17.00 0.9 * 17.15 1.3 * 17.30 2.5 ** 17.45 2.5 *** 18.00 1.3 * 18.15 0.9 *

-------------------------------------------------------------------------------- TRL TRL VIEWER 3.0 AC t:\M-EC Job Book\20111\capacity assessments\2011 Dove Bank-Town Meadows rdbt PM.vao - Page 4 -------------------------------------------------------------------------------- QUEUEING DELAY INFORMATION OVER WHOLE PERIOD -------------------------------------------- ---------------------------------------------------------------------------- I ARM I TOTAL DEMAND I * QUEUEING * I * INCLUSIVE QUEUEING * I I I I * DELAY * I * DELAY * I I I------------------------------------------------------------------I I I (VEH) (VEH/H) I (MIN) (MIN/VEH) I (MIN) (MIN/VEH) I ---------------------------------------------------------------------------- I A I 248.2 I 165.5 I 28.9 I 0.12 I 28.9 I 0.12 I I B I 1068.2 I 712.1 I 86.3 I 0.08 I 86.3 I 0.08 I I C I 687.0 I 458.0 I 119.2 I 0.17 I 119.2 I 0.17 I I D I 1260.1 I 840.1 I 137.5 I 0.11 I 137.5 I 0.11 I ---------------------------------------------------------------------------- I ALL I 3263.5 I 2175.7 I 371.9 I 0.11 I 371.9 I 0.11 I ---------------------------------------------------------------------------- * DELAY IS THAT OCCURRING ONLY WITHIN THE TIME PERIOD. * INCLUSIVE DELAY INCLUDES DELAY SUFFERED BY VEHICLES WHICH ARE STILL QUEUEING AFTER THE END OF THE TIME PERIOD. * THESE WILL ONLY BE SIGNIFICANTLY DIFFERENT IF THERE IS A LARGE QUEUE REMAINING AT THE END OF THE TIME PERIOD. END OF JOB ============================================= end of file ===============================================
[Printed at 14:10:52 on 05/07/2011]

-------------------------------------------------------------------------------- TRL TRL VIEWER 3.0 AC t:\M-EC Job Book\20111\capacity assessments\2011 Dove Way-Derby Rd rdbt AM.vao - Page 1 -------------------------------------------------------------------------------- ___________________ A R C A D Y 6 ___________________ ASSESSMENT OF ROUNDABOUT CAPACITY AND DELAY Analysis Program: Release 2.0 (MAR 2005) (c) Copyright TRL Limited, 2004 Adapted from ARCADY/3 which is Crown Copyright by permission of the controller of HMSO ______________________________________________________ For sales and distribution information, program advice and maintenance, contact: TRL Limited Tel: +44 (0) 1344 770018 Crowthorne House Fax: +44 (0) 1344 770864 Nine Mile Ride Email: [email protected] Wokingham, Berks. Web: www.trlsoftware.co.uk RG40 3GA,UK --------------------------------------------------------------------------------- THE USER OF THIS COMPUTER PROGRAM FOR THE SOLUTION OF AN ENGINEERING PROBLEM IS IN NO WAY RELIEVED OF THEIR RESPONSIBILITY FOR THE CORRECTNESS OF THE SOLUTION --------------------------------------------------------------------------------- Run with file:- "t:\M-EC Job Book\20111\capacity assessments\2011 Dove Way-Derby Rd rdbt AM.vai"(drive-on-the-left ) at 13:46:31 on Tuesday, 5 July 2011
FILE PROPERTIES *************** RUN TITLE: The Dove Way LOCATION: DATE: 05/07/2011 CLIENT: ENUMERATOR: trose [TIMROSE] JOB NUMBER: 20111 STATUS: DESCRIPTION:
INPUT DATA ********** ARM A - A518 Derby Road ARM B - A518 South ARM C - Access Road ARM D - The Dove Way
GEOMETRIC DATA -------------- ----------------------------------------------------------------------------------------------------------------------- I ARM I V (M) I E (M) I L (M) I R (M) I D (M) I PHI (DEG) I SLOPE I INTERCEPT (PCU/MIN) I ----------------------------------------------------------------------------------------------------------------------- I ARM A I 3.00 I 7.00 I 15.00 I 30.00 I 38.00 I 57.0 I 0.571 I 24.033 I I ARM B I 3.50 I 7.00 I 0.00 I 10.00 I 38.00 I 70.0 I 0.594 I 28.715 I I ARM C I 2.50 I 5.00 I 10.00 I 25.00 I 38.00 I 40.0 I 0.528 I 19.149 I I ARM D I 5.50 I 10.00 I 20.00 I 25.00 I 38.00 I 56.0 I 0.735 I 37.690 I ----------------------------------------------------------------------------------------------------------------------- V = approach half-width L = effective flare length D = inscribed circle diameter E = entry width R = entry radius PHI = entry angle
TRAFFIC DEMAND DATA ------------------- (Only sets included in the current run are shown)
----------------------- I ARM I FLOW SCALE(%) I ----------------------- I A I 100 I I B I 100 I I C I 100 I I D I 100 I -----------------------
TIME PERIOD BEGINS 07.45 AND ENDS 09.15
LENGTH OF TIME PERIOD - 90 MINUTES. LENGTH OF TIME SEGMENT - 15 MINUTES.

-------------------------------------------------------------------------------- TRL TRL VIEWER 3.0 AC t:\M-EC Job Book\20111\capacity assessments\2011 Dove Way-Derby Rd rdbt AM.vao - Page 2 -------------------------------------------------------------------------------- DEMAND FLOW PROFILES ARE SYNTHESISED FROM TURNING COUNT DATA DEMAND SET TITLE: The Dove Way ----------------------------------------------------------------------------- I I NUMBER OF MINUTES FROM START WHEN I RATE OF FLOW (VEH/MIN) I I ARM I FLOW STARTS I TOP OF PEAK I FLOW STOPS I BEFORE I AT TOP I AFTER I I I TO RISE I IS REACHED IFALLING I PEAK I OF PEAK I PEAK I ----------------------------------------------------------------------------- I ARM A I 15.00 I 45.00 I 75.00 I 5.99 I 8.98 I 5.99 I I ARM B I 15.00 I 45.00 I 75.00 I 10.38 I 15.56 I 10.38 I I ARM C I 15.00 I 45.00 I 75.00 I 0.04 I 0.06 I 0.04 I I ARM D I 15.00 I 45.00 I 75.00 I 4.64 I 6.96 I 4.64 I ----------------------------------------------------------------------------- DEMAND SET TITLE: The Dove Way
-------------------------------------------------------------------- I I TURNING PROPORTIONS I I I TURNING COUNTS (VEH/HR) I I I (PERCENTAGE OF H.V.S) I I ----------------------------------------------- I TIME I FROM/TO I ARM A I ARM B I ARM C I ARM D I -------------------------------------------------------------------- I 07.45 - 09.15 I I I I I I I I ARM A I 0.000 I 0.946 I 0.002 I 0.052 I I I I 0.0 I 453.0 I 1.0 I 25.0 I I I I ( 10.0)I ( 10.0)I ( 10.0)I ( 10.0)I I I I I I I I I I ARM B I 0.586 I 0.000 I 0.000 I 0.414 I I I I 486.0 I 0.0 I 0.0 I 344.0 I I I I ( 10.0)I ( 10.0)I ( 10.0)I ( 10.0)I I I I I I I I I I ARM C I 0.667 I 0.333 I 0.000 I 0.000 I I I I 2.0 I 1.0 I 0.0 I 0.0 I I I I ( 10.0)I ( 10.0)I ( 10.0)I ( 10.0)I I I I I I I I I I ARM D I 0.049 I 0.949 I 0.003 I 0.000 I I I I 18.0 I 352.0 I 1.0 I 0.0 I I I I ( 10.0)I ( 10.0)I ( 10.0)I ( 10.0)I I I I I I I I --------------------------------------------------------------------
QUEUE AND DELAY INFORMATION FOR EACH 15 MIN TIME SEGMENT --------------------------------------------------------
------------------------------------------------------------------------------------------------------------------ I TIME DEMAND CAPACITY DEMAND/ PEDESTRIAN START END DELAY GEOMETRIC DELAY AVERAGE DELAY I I (VEH/MIN) (VEH/MIN) CAPACITY FLOW QUEUE QUEUE (VEH.MIN/ (VEH.MIN/ PER ARRIVING I I (RFC) (PEDS/MIN) (VEHS) (VEHS) TIME SEGMENT) TIME SEGMENT) VEHICLE (MIN) I I 07.45-08.00 I I ARM A 5.99 19.33 0.310 0.0 0.4 6.5 0.07 I I ARM B 10.38 25.90 0.401 0.0 0.7 9.7 0.06 I I ARM C 0.04 11.79 0.003 0.0 0.0 0.0 0.09 I I ARM D 4.64 29.79 0.156 0.0 0.2 2.7 0.04 I I I ------------------------------------------------------------------------------------------------------------------
------------------------------------------------------------------------------------------------------------------ I TIME DEMAND CAPACITY DEMAND/ PEDESTRIAN START END DELAY GEOMETRIC DELAY AVERAGE DELAY I I (VEH/MIN) (VEH/MIN) CAPACITY FLOW QUEUE QUEUE (VEH.MIN/ (VEH.MIN/ PER ARRIVING I I (RFC) (PEDS/MIN) (VEHS) (VEHS) TIME SEGMENT) TIME SEGMENT) VEHICLE (MIN) I I 08.00-08.15 I I ARM A 7.15 18.83 0.380 0.4 0.6 8.9 0.09 I I ARM B 12.39 25.87 0.479 0.7 0.9 13.3 0.07 I I ARM C 0.04 10.68 0.004 0.0 0.0 0.1 0.09 I I ARM D 5.54 28.91 0.192 0.2 0.2 3.5 0.04 I I I ------------------------------------------------------------------------------------------------------------------
------------------------------------------------------------------------------------------------------------------ I TIME DEMAND CAPACITY DEMAND/ PEDESTRIAN START END DELAY GEOMETRIC DELAY AVERAGE DELAY I I (VEH/MIN) (VEH/MIN) CAPACITY FLOW QUEUE QUEUE (VEH.MIN/ (VEH.MIN/ PER ARRIVING I I (RFC) (PEDS/MIN) (VEHS) (VEHS) TIME SEGMENT) TIME SEGMENT) VEHICLE (MIN) I I 08.15-08.30 I I ARM A 8.76 18.16 0.482 0.6 0.9 13.3 0.11 I I ARM B 15.17 25.81 0.588 0.9 1.4 20.4 0.09 I I ARM C 0.05 9.18 0.006 0.0 0.0 0.1 0.11 I I ARM D 6.78 27.71 0.245 0.2 0.3 4.8 0.05 I I I ------------------------------------------------------------------------------------------------------------------
------------------------------------------------------------------------------------------------------------------ I TIME DEMAND CAPACITY DEMAND/ PEDESTRIAN START END DELAY GEOMETRIC DELAY AVERAGE DELAY I I (VEH/MIN) (VEH/MIN) CAPACITY FLOW QUEUE QUEUE (VEH.MIN/ (VEH.MIN/ PER ARRIVING I I (RFC) (PEDS/MIN) (VEHS) (VEHS) TIME SEGMENT) TIME SEGMENT) VEHICLE (MIN) I I 08.30-08.45 I I ARM A 8.76 18.15 0.482 0.9 0.9 13.8 0.11 I I ARM B 15.17 25.81 0.588 1.4 1.4 21.2 0.09 I I ARM C 0.05 9.16 0.006 0.0 0.0 0.1 0.11 I I ARM D 6.78 27.70 0.245 0.3 0.3 4.8 0.05 I I I ------------------------------------------------------------------------------------------------------------------

-------------------------------------------------------------------------------- TRL TRL VIEWER 3.0 AC t:\M-EC Job Book\20111\capacity assessments\2011 Dove Way-Derby Rd rdbt AM.vao - Page 3 -------------------------------------------------------------------------------- ------------------------------------------------------------------------------------------------------------------ I TIME DEMAND CAPACITY DEMAND/ PEDESTRIAN START END DELAY GEOMETRIC DELAY AVERAGE DELAY I I (VEH/MIN) (VEH/MIN) CAPACITY FLOW QUEUE QUEUE (VEH.MIN/ (VEH.MIN/ PER ARRIVING I I (RFC) (PEDS/MIN) (VEHS) (VEHS) TIME SEGMENT) TIME SEGMENT) VEHICLE (MIN) I I 08.45-09.00 I I ARM A 7.15 18.83 0.380 0.9 0.6 9.5 0.09 I I ARM B 12.39 25.86 0.479 1.4 0.9 14.3 0.07 I I ARM C 0.04 10.65 0.004 0.0 0.0 0.1 0.09 I I ARM D 5.54 28.89 0.192 0.3 0.2 3.6 0.04 I I I ------------------------------------------------------------------------------------------------------------------
------------------------------------------------------------------------------------------------------------------ I TIME DEMAND CAPACITY DEMAND/ PEDESTRIAN START END DELAY GEOMETRIC DELAY AVERAGE DELAY I I (VEH/MIN) (VEH/MIN) CAPACITY FLOW QUEUE QUEUE (VEH.MIN/ (VEH.MIN/ PER ARRIVING I I (RFC) (PEDS/MIN) (VEHS) (VEHS) TIME SEGMENT) TIME SEGMENT) VEHICLE (MIN) I I 09.00-09.15 I I ARM A 5.99 19.32 0.310 0.6 0.5 6.9 0.08 I I ARM B 10.38 25.90 0.401 0.9 0.7 10.3 0.06 I I ARM C 0.04 11.76 0.003 0.0 0.0 0.0 0.09 I I ARM D 4.64 29.77 0.156 0.2 0.2 2.8 0.04 I I I ------------------------------------------------------------------------------------------------------------------
QUEUE AT ARM A -------------- TIME SEGMENT NO. OF ENDING VEHICLES IN QUEUE 08.00 0.4 08.15 0.6 * 08.30 0.9 * 08.45 0.9 * 09.00 0.6 * 09.15 0.5
QUEUE AT ARM B -------------- TIME SEGMENT NO. OF ENDING VEHICLES IN QUEUE 08.00 0.7 * 08.15 0.9 * 08.30 1.4 * 08.45 1.4 * 09.00 0.9 * 09.15 0.7 *
QUEUE AT ARM C -------------- TIME SEGMENT NO. OF ENDING VEHICLES IN QUEUE 08.00 0.0 08.15 0.0 08.30 0.0 08.45 0.0 09.00 0.0 09.15 0.0
QUEUE AT ARM D -------------- TIME SEGMENT NO. OF ENDING VEHICLES IN QUEUE 08.00 0.2 08.15 0.2 08.30 0.3 08.45 0.3 09.00 0.2 09.15 0.2

-------------------------------------------------------------------------------- TRL TRL VIEWER 3.0 AC t:\M-EC Job Book\20111\capacity assessments\2011 Dove Way-Derby Rd rdbt AM.vao - Page 4 -------------------------------------------------------------------------------- QUEUEING DELAY INFORMATION OVER WHOLE PERIOD -------------------------------------------- ---------------------------------------------------------------------------- I ARM I TOTAL DEMAND I * QUEUEING * I * INCLUSIVE QUEUEING * I I I I * DELAY * I * DELAY * I I I------------------------------------------------------------------I I I (VEH) (VEH/H) I (MIN) (MIN/VEH) I (MIN) (MIN/VEH) I ---------------------------------------------------------------------------- I A I 656.8 I 437.9 I 59.0 I 0.09 I 59.0 I 0.09 I I B I 1138.1 I 758.7 I 89.2 I 0.08 I 89.2 I 0.08 I I C I 4.1 I 2.7 I 0.4 I 0.10 I 0.4 I 0.10 I I D I 508.7 I 339.1 I 22.3 I 0.04 I 22.3 I 0.04 I ---------------------------------------------------------------------------- I ALL I 2307.7 I 1538.5 I 170.9 I 0.07 I 170.9 I 0.07 I ---------------------------------------------------------------------------- * DELAY IS THAT OCCURRING ONLY WITHIN THE TIME PERIOD. * INCLUSIVE DELAY INCLUDES DELAY SUFFERED BY VEHICLES WHICH ARE STILL QUEUEING AFTER THE END OF THE TIME PERIOD. * THESE WILL ONLY BE SIGNIFICANTLY DIFFERENT IF THERE IS A LARGE QUEUE REMAINING AT THE END OF THE TIME PERIOD. END OF JOB ============================================= end of file ===============================================
[Printed at 13:46:38 on 05/07/2011]

-------------------------------------------------------------------------------- TRL TRL VIEWER 3.0 AC t:\M-EC Job Book\20111\capacity assessments\2011 Dove Way-Derby Rd rdbt PM.vao - Page 1 -------------------------------------------------------------------------------- ___________________ A R C A D Y 6 ___________________ ASSESSMENT OF ROUNDABOUT CAPACITY AND DELAY Analysis Program: Release 2.0 (MAR 2005) (c) Copyright TRL Limited, 2004 Adapted from ARCADY/3 which is Crown Copyright by permission of the controller of HMSO ______________________________________________________ For sales and distribution information, program advice and maintenance, contact: TRL Limited Tel: +44 (0) 1344 770018 Crowthorne House Fax: +44 (0) 1344 770864 Nine Mile Ride Email: [email protected] Wokingham, Berks. Web: www.trlsoftware.co.uk RG40 3GA,UK --------------------------------------------------------------------------------- THE USER OF THIS COMPUTER PROGRAM FOR THE SOLUTION OF AN ENGINEERING PROBLEM IS IN NO WAY RELIEVED OF THEIR RESPONSIBILITY FOR THE CORRECTNESS OF THE SOLUTION --------------------------------------------------------------------------------- Run with file:- "t:\M-EC Job Book\20111\capacity assessments\2011 Dove Way-Derby Rd rdbt PM.vai"(drive-on-the-left ) at 13:51:31 on Tuesday, 5 July 2011
FILE PROPERTIES *************** RUN TITLE: The Dove Way LOCATION: DATE: 05/07/2011 CLIENT: ENUMERATOR: trose [TIMROSE] JOB NUMBER: 20111 STATUS: DESCRIPTION:
INPUT DATA ********** ARM A - A518 Derby Road ARM B - A518 South ARM C - Access Road ARM D - The Dove Way
GEOMETRIC DATA -------------- ----------------------------------------------------------------------------------------------------------------------- I ARM I V (M) I E (M) I L (M) I R (M) I D (M) I PHI (DEG) I SLOPE I INTERCEPT (PCU/MIN) I ----------------------------------------------------------------------------------------------------------------------- I ARM A I 3.00 I 7.00 I 15.00 I 30.00 I 38.00 I 57.0 I 0.571 I 24.033 I I ARM B I 3.50 I 7.00 I 0.00 I 10.00 I 38.00 I 70.0 I 0.594 I 28.715 I I ARM C I 2.50 I 5.00 I 10.00 I 25.00 I 38.00 I 40.0 I 0.528 I 19.149 I I ARM D I 5.50 I 10.00 I 20.00 I 25.00 I 38.00 I 56.0 I 0.735 I 37.690 I ----------------------------------------------------------------------------------------------------------------------- V = approach half-width L = effective flare length D = inscribed circle diameter E = entry width R = entry radius PHI = entry angle
TRAFFIC DEMAND DATA ------------------- (Only sets included in the current run are shown)
----------------------- I ARM I FLOW SCALE(%) I ----------------------- I A I 100 I I B I 100 I I C I 100 I I D I 100 I -----------------------
TIME PERIOD BEGINS 16.45 AND ENDS 18.15
LENGTH OF TIME PERIOD - 90 MINUTES. LENGTH OF TIME SEGMENT - 15 MINUTES.

-------------------------------------------------------------------------------- TRL TRL VIEWER 3.0 AC t:\M-EC Job Book\20111\capacity assessments\2011 Dove Way-Derby Rd rdbt PM.vao - Page 2 -------------------------------------------------------------------------------- DEMAND FLOW PROFILES ARE SYNTHESISED FROM TURNING COUNT DATA DEMAND SET TITLE: The Dove Way ----------------------------------------------------------------------------- I I NUMBER OF MINUTES FROM START WHEN I RATE OF FLOW (VEH/MIN) I I ARM I FLOW STARTS I TOP OF PEAK I FLOW STOPS I BEFORE I AT TOP I AFTER I I I TO RISE I IS REACHED IFALLING I PEAK I OF PEAK I PEAK I ----------------------------------------------------------------------------- I ARM A I 15.00 I 45.00 I 75.00 I 7.07 I 10.61 I 7.07 I I ARM B I 15.00 I 45.00 I 75.00 I 10.14 I 15.21 I 10.14 I I ARM C I 15.00 I 45.00 I 75.00 I 0.03 I 0.04 I 0.03 I I ARM D I 15.00 I 45.00 I 75.00 I 4.88 I 7.31 I 4.88 I ----------------------------------------------------------------------------- DEMAND SET TITLE: The Dove Way
-------------------------------------------------------------------- I I TURNING PROPORTIONS I I I TURNING COUNTS (VEH/HR) I I I (PERCENTAGE OF H.V.S) I I ----------------------------------------------- I TIME I FROM/TO I ARM A I ARM B I ARM C I ARM D I -------------------------------------------------------------------- I 16.45 - 18.15 I I I I I I I I ARM A I 0.000 I 0.961 I 0.002 I 0.037 I I I I 0.0 I 544.0 I 1.0 I 21.0 I I I I ( 10.0)I ( 10.0)I ( 10.0)I ( 10.0)I I I I I I I I I I ARM B I 0.613 I 0.000 I 0.002 I 0.385 I I I I 497.0 I 0.0 I 2.0 I 312.0 I I I I ( 10.0)I ( 10.0)I ( 10.0)I ( 10.0)I I I I I I I I I I ARM C I 1.000 I 0.000 I 0.000 I 0.000 I I I I 2.0 I 0.0 I 0.0 I 0.0 I I I I ( 10.0)I ( 10.0)I ( 10.0)I ( 10.0)I I I I I I I I I I ARM D I 0.036 I 0.962 I 0.003 I 0.000 I I I I 14.0 I 375.0 I 1.0 I 0.0 I I I I ( 10.0)I ( 10.0)I ( 10.0)I ( 10.0)I I I I I I I I --------------------------------------------------------------------
QUEUE AND DELAY INFORMATION FOR EACH 15 MIN TIME SEGMENT --------------------------------------------------------
------------------------------------------------------------------------------------------------------------------ I TIME DEMAND CAPACITY DEMAND/ PEDESTRIAN START END DELAY GEOMETRIC DELAY AVERAGE DELAY I I (VEH/MIN) (VEH/MIN) CAPACITY FLOW QUEUE QUEUE (VEH.MIN/ (VEH.MIN/ PER ARRIVING I I (RFC) (PEDS/MIN) (VEHS) (VEHS) TIME SEGMENT) TIME SEGMENT) VEHICLE (MIN) I I 16.45-17.00 I I ARM A 7.07 19.17 0.369 0.0 0.6 8.4 0.08 I I ARM B 10.14 25.93 0.391 0.0 0.6 9.3 0.06 I I ARM C 0.03 11.95 0.002 0.0 0.0 0.0 0.08 I I ARM D 4.88 29.70 0.164 0.0 0.2 2.9 0.04 I I I ------------------------------------------------------------------------------------------------------------------
------------------------------------------------------------------------------------------------------------------ I TIME DEMAND CAPACITY DEMAND/ PEDESTRIAN START END DELAY GEOMETRIC DELAY AVERAGE DELAY I I (VEH/MIN) (VEH/MIN) CAPACITY FLOW QUEUE QUEUE (VEH.MIN/ (VEH.MIN/ PER ARRIVING I I (RFC) (PEDS/MIN) (VEHS) (VEHS) TIME SEGMENT) TIME SEGMENT) VEHICLE (MIN) I I 17.00-17.15 I I ARM A 8.45 18.65 0.453 0.6 0.8 11.9 0.10 I I ARM B 12.11 25.90 0.467 0.6 0.9 12.8 0.07 I I ARM C 0.03 10.88 0.003 0.0 0.0 0.0 0.09 I I ARM D 5.82 28.80 0.202 0.2 0.3 3.7 0.04 I I I ------------------------------------------------------------------------------------------------------------------
------------------------------------------------------------------------------------------------------------------ I TIME DEMAND CAPACITY DEMAND/ PEDESTRIAN START END DELAY GEOMETRIC DELAY AVERAGE DELAY I I (VEH/MIN) (VEH/MIN) CAPACITY FLOW QUEUE QUEUE (VEH.MIN/ (VEH.MIN/ PER ARRIVING I I (RFC) (PEDS/MIN) (VEHS) (VEHS) TIME SEGMENT) TIME SEGMENT) VEHICLE (MIN) I I 17.15-17.30 I I ARM A 10.35 17.93 0.577 0.8 1.3 19.2 0.13 I I ARM B 14.83 25.86 0.573 0.9 1.3 19.2 0.09 I I ARM C 0.04 9.42 0.004 0.0 0.0 0.1 0.11 I I ARM D 7.13 27.58 0.259 0.3 0.3 5.1 0.05 I I I ------------------------------------------------------------------------------------------------------------------
------------------------------------------------------------------------------------------------------------------ I TIME DEMAND CAPACITY DEMAND/ PEDESTRIAN START END DELAY GEOMETRIC DELAY AVERAGE DELAY I I (VEH/MIN) (VEH/MIN) CAPACITY FLOW QUEUE QUEUE (VEH.MIN/ (VEH.MIN/ PER ARRIVING I I (RFC) (PEDS/MIN) (VEHS) (VEHS) TIME SEGMENT) TIME SEGMENT) VEHICLE (MIN) I I 17.30-17.45 I I ARM A 10.35 17.93 0.577 1.3 1.4 20.2 0.13 I I ARM B 14.83 25.85 0.573 1.3 1.3 20.0 0.09 I I ARM C 0.04 9.40 0.004 0.0 0.0 0.1 0.11 I I ARM D 7.13 27.56 0.259 0.3 0.3 5.2 0.05 I I I ------------------------------------------------------------------------------------------------------------------

-------------------------------------------------------------------------------- TRL TRL VIEWER 3.0 AC t:\M-EC Job Book\20111\capacity assessments\2011 Dove Way-Derby Rd rdbt PM.vao - Page 3 -------------------------------------------------------------------------------- ------------------------------------------------------------------------------------------------------------------ I TIME DEMAND CAPACITY DEMAND/ PEDESTRIAN START END DELAY GEOMETRIC DELAY AVERAGE DELAY I I (VEH/MIN) (VEH/MIN) CAPACITY FLOW QUEUE QUEUE (VEH.MIN/ (VEH.MIN/ PER ARRIVING I I (RFC) (PEDS/MIN) (VEHS) (VEHS) TIME SEGMENT) TIME SEGMENT) VEHICLE (MIN) I I 17.45-18.00 I I ARM A 8.45 18.64 0.453 1.4 0.8 13.0 0.10 I I ARM B 12.11 25.90 0.467 1.3 0.9 13.6 0.07 I I ARM C 0.03 10.85 0.003 0.0 0.0 0.0 0.09 I I ARM D 5.82 28.78 0.202 0.3 0.3 3.9 0.04 I I I ------------------------------------------------------------------------------------------------------------------
------------------------------------------------------------------------------------------------------------------ I TIME DEMAND CAPACITY DEMAND/ PEDESTRIAN START END DELAY GEOMETRIC DELAY AVERAGE DELAY I I (VEH/MIN) (VEH/MIN) CAPACITY FLOW QUEUE QUEUE (VEH.MIN/ (VEH.MIN/ PER ARRIVING I I (RFC) (PEDS/MIN) (VEHS) (VEHS) TIME SEGMENT) TIME SEGMENT) VEHICLE (MIN) I I 18.00-18.15 I I ARM A 7.07 19.16 0.369 0.8 0.6 9.1 0.08 I I ARM B 10.14 25.93 0.391 0.9 0.6 9.9 0.06 I I ARM C 0.03 11.92 0.002 0.0 0.0 0.0 0.08 I I ARM D 4.88 29.67 0.164 0.3 0.2 3.0 0.04 I I I ------------------------------------------------------------------------------------------------------------------
QUEUE AT ARM A -------------- TIME SEGMENT NO. OF ENDING VEHICLES IN QUEUE 17.00 0.6 * 17.15 0.8 * 17.30 1.3 * 17.45 1.4 * 18.00 0.8 * 18.15 0.6 *
QUEUE AT ARM B -------------- TIME SEGMENT NO. OF ENDING VEHICLES IN QUEUE 17.00 0.6 * 17.15 0.9 * 17.30 1.3 * 17.45 1.3 * 18.00 0.9 * 18.15 0.6 *
QUEUE AT ARM C -------------- TIME SEGMENT NO. OF ENDING VEHICLES IN QUEUE 17.00 0.0 17.15 0.0 17.30 0.0 17.45 0.0 18.00 0.0 18.15 0.0
QUEUE AT ARM D -------------- TIME SEGMENT NO. OF ENDING VEHICLES IN QUEUE 17.00 0.2 17.15 0.3 17.30 0.3 17.45 0.3 18.00 0.3 18.15 0.2

-------------------------------------------------------------------------------- TRL TRL VIEWER 3.0 AC t:\M-EC Job Book\20111\capacity assessments\2011 Dove Way-Derby Rd rdbt PM.vao - Page 4 -------------------------------------------------------------------------------- QUEUEING DELAY INFORMATION OVER WHOLE PERIOD -------------------------------------------- ---------------------------------------------------------------------------- I ARM I TOTAL DEMAND I * QUEUEING * I * INCLUSIVE QUEUEING * I I I I * DELAY * I * DELAY * I I I------------------------------------------------------------------I I I (VEH) (VEH/H) I (MIN) (MIN/VEH) I (MIN) (MIN/VEH) I ---------------------------------------------------------------------------- I A I 776.1 I 517.4 I 81.9 I 0.11 I 81.9 I 0.11 I I B I 1112.1 I 741.4 I 84.8 I 0.08 I 84.8 I 0.08 I I C I 2.7 I 1.8 I 0.3 I 0.10 I 0.3 I 0.10 I I D I 534.8 I 356.5 I 23.8 I 0.04 I 23.8 I 0.04 I ---------------------------------------------------------------------------- I ALL I 2425.7 I 1617.1 I 190.8 I 0.08 I 190.8 I 0.08 I ---------------------------------------------------------------------------- * DELAY IS THAT OCCURRING ONLY WITHIN THE TIME PERIOD. * INCLUSIVE DELAY INCLUDES DELAY SUFFERED BY VEHICLES WHICH ARE STILL QUEUEING AFTER THE END OF THE TIME PERIOD. * THESE WILL ONLY BE SIGNIFICANTLY DIFFERENT IF THERE IS A LARGE QUEUE REMAINING AT THE END OF THE TIME PERIOD. END OF JOB ============================================= end of file ===============================================
[Printed at 13:51:39 on 05/07/2011]

APPENDIX I


-------------------------------------------------------------------------------- TRL TRL VIEWER 3.0 AC t:\M-EC Job Book\20111\capacity assessments\2021 A50-B518 rdbt AM.vao - Page 1 -------------------------------------------------------------------------------- ___________________ A R C A D Y 6 ___________________ ASSESSMENT OF ROUNDABOUT CAPACITY AND DELAY Analysis Program: Release 2.0 (MAR 2005) (c) Copyright TRL Limited, 2004 Adapted from ARCADY/3 which is Crown Copyright by permission of the controller of HMSO ______________________________________________________ For sales and distribution information, program advice and maintenance, contact: TRL Limited Tel: +44 (0) 1344 770018 Crowthorne House Fax: +44 (0) 1344 770864 Nine Mile Ride Email: [email protected] Wokingham, Berks. Web: www.trlsoftware.co.uk RG40 3GA,UK --------------------------------------------------------------------------------- THE USER OF THIS COMPUTER PROGRAM FOR THE SOLUTION OF AN ENGINEERING PROBLEM IS IN NO WAY RELIEVED OF THEIR RESPONSIBILITY FOR THE CORRECTNESS OF THE SOLUTION --------------------------------------------------------------------------------- Run with file:- "t:\M-EC Job Book\20111\capacity assessments\2021 A50-B518 rdbt AM.vai"(drive-on-the-left ) at 13:18:49 on Tuesday, 5 July 2011
FILE PROPERTIES *************** RUN TITLE: The Dove Way LOCATION: DATE: 05/07/2011 CLIENT: ENUMERATOR: trose [TIMROSE] JOB NUMBER: 20111 STATUS: DESCRIPTION:
INPUT DATA ********** ARM A - A50 East ARM B - A518 ARM C - A50 West ARM D - Access Road
GEOMETRIC DATA -------------- ----------------------------------------------------------------------------------------------------------------------- I ARM I V (M) I E (M) I L (M) I R (M) I D (M) I PHI (DEG) I SLOPE I INTERCEPT (PCU/MIN) I ----------------------------------------------------------------------------------------------------------------------- I ARM A I 10.00 I 12.00 I 20.00 I 25.00 I 78.00 I 48.0 I 0.704 I 55.088 I I ARM B I 5.50 I 10.00 I 30.00 I 30.00 I 78.00 I 46.0 I 0.585 I 41.438 I I ARM C I 5.00 I 7.00 I 20.00 I 30.00 I 78.00 I 49.0 I 0.492 I 31.269 I I ARM D I 4.00 I 5.00 I 15.00 I 30.00 I 78.00 I 38.0 I 0.437 I 24.083 I ----------------------------------------------------------------------------------------------------------------------- V = approach half-width L = effective flare length D = inscribed circle diameter E = entry width R = entry radius PHI = entry angle
TRAFFIC DEMAND DATA ------------------- (Only sets included in the current run are shown)
----------------------- I ARM I FLOW SCALE(%) I ----------------------- I A I 100 I I B I 100 I I C I 100 I I D I 100 I -----------------------
TIME PERIOD BEGINS 07.45 AND ENDS 09.15
LENGTH OF TIME PERIOD - 90 MINUTES. LENGTH OF TIME SEGMENT - 15 MINUTES.

-------------------------------------------------------------------------------- TRL TRL VIEWER 3.0 AC t:\M-EC Job Book\20111\capacity assessments\2021 A50-B518 rdbt AM.vao - Page 2 -------------------------------------------------------------------------------- DEMAND FLOW PROFILES ARE SYNTHESISED FROM TURNING COUNT DATA DEMAND SET TITLE: The Dove Way ----------------------------------------------------------------------------- I I NUMBER OF MINUTES FROM START WHEN I RATE OF FLOW (VEH/MIN) I I ARM I FLOW STARTS I TOP OF PEAK I FLOW STOPS I BEFORE I AT TOP I AFTER I I I TO RISE I IS REACHED IFALLING I PEAK I OF PEAK I PEAK I ----------------------------------------------------------------------------- I ARM A I 15.00 I 45.00 I 75.00 I 11.99 I 17.98 I 11.99 I I ARM B I 15.00 I 45.00 I 75.00 I 7.68 I 11.51 I 7.68 I I ARM C I 15.00 I 45.00 I 75.00 I 12.44 I 18.66 I 12.44 I I ARM D I 15.00 I 45.00 I 75.00 I 0.10 I 0.15 I 0.10 I ----------------------------------------------------------------------------- DEMAND SET TITLE: The Dove Way
-------------------------------------------------------------------- I I TURNING PROPORTIONS I I I TURNING COUNTS (VEH/HR) I I I (PERCENTAGE OF H.V.S) I I ----------------------------------------------- I TIME I FROM/TO I ARM A I ARM B I ARM C I ARM D I -------------------------------------------------------------------- I 07.45 - 09.15 I I I I I I I I ARM A I 0.000 I 0.283 I 0.716 I 0.001 I I I I 0.0 I 271.0 I 687.0 I 1.0 I I I I ( 10.0)I ( 10.0)I ( 10.0)I ( 10.0)I I I I I I I I I I ARM B I 0.432 I 0.000 I 0.568 I 0.000 I I I I 265.0 I 0.0 I 349.0 I 0.0 I I I I ( 10.0)I ( 10.0)I ( 10.0)I ( 10.0)I I I I I I I I I I ARM C I 0.643 I 0.357 I 0.000 I 0.000 I I I I 640.0 I 355.0 I 0.0 I 0.0 I I I I ( 10.0)I ( 10.0)I ( 10.0)I ( 10.0)I I I I I I I I I I ARM D I 0.375 I 0.000 I 0.625 I 0.000 I I I I 3.0 I 0.0 I 5.0 I 0.0 I I I I ( 10.0)I ( 10.0)I ( 10.0)I ( 10.0)I I I I I I I I --------------------------------------------------------------------
QUEUE AND DELAY INFORMATION FOR EACH 15 MIN TIME SEGMENT --------------------------------------------------------
------------------------------------------------------------------------------------------------------------------ I TIME DEMAND CAPACITY DEMAND/ PEDESTRIAN START END DELAY GEOMETRIC DELAY AVERAGE DELAY I I (VEH/MIN) (VEH/MIN) CAPACITY FLOW QUEUE QUEUE (VEH.MIN/ (VEH.MIN/ PER ARRIVING I I (RFC) (PEDS/MIN) (VEHS) (VEHS) TIME SEGMENT) TIME SEGMENT) VEHICLE (MIN) I I 07.45-08.00 I I ARM A 11.99 46.93 0.255 0.0 0.3 5.1 0.03 I I ARM B 7.68 32.61 0.235 0.0 0.3 4.5 0.04 I I ARM C 12.44 26.79 0.464 0.0 0.9 12.5 0.07 I I ARM D 0.10 15.04 0.007 0.0 0.0 0.1 0.07 I I I ------------------------------------------------------------------------------------------------------------------
------------------------------------------------------------------------------------------------------------------ I TIME DEMAND CAPACITY DEMAND/ PEDESTRIAN START END DELAY GEOMETRIC DELAY AVERAGE DELAY I I (VEH/MIN) (VEH/MIN) CAPACITY FLOW QUEUE QUEUE (VEH.MIN/ (VEH.MIN/ PER ARRIVING I I (RFC) (PEDS/MIN) (VEHS) (VEHS) TIME SEGMENT) TIME SEGMENT) VEHICLE (MIN) I I 08.00-08.15 I I ARM A 14.31 46.31 0.309 0.3 0.4 6.6 0.03 I I ARM B 9.16 31.62 0.290 0.3 0.4 6.0 0.04 I I ARM C 14.85 26.47 0.561 0.9 1.3 18.4 0.09 I I ARM D 0.12 13.69 0.009 0.0 0.0 0.1 0.07 I I I ------------------------------------------------------------------------------------------------------------------
------------------------------------------------------------------------------------------------------------------ I TIME DEMAND CAPACITY DEMAND/ PEDESTRIAN START END DELAY GEOMETRIC DELAY AVERAGE DELAY I I (VEH/MIN) (VEH/MIN) CAPACITY FLOW QUEUE QUEUE (VEH.MIN/ (VEH.MIN/ PER ARRIVING I I (RFC) (PEDS/MIN) (VEHS) (VEHS) TIME SEGMENT) TIME SEGMENT) VEHICLE (MIN) I I 08.15-08.30 I I ARM A 17.53 45.47 0.386 0.4 0.6 9.3 0.04 I I ARM B 11.22 30.26 0.371 0.4 0.6 8.6 0.05 I I ARM C 18.19 26.03 0.699 1.3 2.3 32.1 0.13 I I ARM D 0.15 11.86 0.012 0.0 0.0 0.2 0.09 I I I ------------------------------------------------------------------------------------------------------------------
------------------------------------------------------------------------------------------------------------------ I TIME DEMAND CAPACITY DEMAND/ PEDESTRIAN START END DELAY GEOMETRIC DELAY AVERAGE DELAY I I (VEH/MIN) (VEH/MIN) CAPACITY FLOW QUEUE QUEUE (VEH.MIN/ (VEH.MIN/ PER ARRIVING I I (RFC) (PEDS/MIN) (VEHS) (VEHS) TIME SEGMENT) TIME SEGMENT) VEHICLE (MIN) I I 08.30-08.45 I I ARM A 17.53 45.45 0.386 0.6 0.6 9.4 0.04 I I ARM B 11.22 30.26 0.371 0.6 0.6 8.8 0.05 I I ARM C 18.19 26.03 0.699 2.3 2.3 34.1 0.13 I I ARM D 0.15 11.83 0.012 0.0 0.0 0.2 0.09 I I I ------------------------------------------------------------------------------------------------------------------

-------------------------------------------------------------------------------- TRL TRL VIEWER 3.0 AC t:\M-EC Job Book\20111\capacity assessments\2021 A50-B518 rdbt AM.vao - Page 3 -------------------------------------------------------------------------------- ------------------------------------------------------------------------------------------------------------------ I TIME DEMAND CAPACITY DEMAND/ PEDESTRIAN START END DELAY GEOMETRIC DELAY AVERAGE DELAY I I (VEH/MIN) (VEH/MIN) CAPACITY FLOW QUEUE QUEUE (VEH.MIN/ (VEH.MIN/ PER ARRIVING I I (RFC) (PEDS/MIN) (VEHS) (VEHS) TIME SEGMENT) TIME SEGMENT) VEHICLE (MIN) I I 08.45-09.00 I I ARM A 14.31 46.28 0.309 0.6 0.4 6.8 0.03 I I ARM B 9.16 31.61 0.290 0.6 0.4 6.2 0.04 I I ARM C 14.85 26.47 0.561 2.3 1.3 20.2 0.09 I I ARM D 0.12 13.65 0.009 0.0 0.0 0.1 0.07 I I I ------------------------------------------------------------------------------------------------------------------
------------------------------------------------------------------------------------------------------------------ I TIME DEMAND CAPACITY DEMAND/ PEDESTRIAN START END DELAY GEOMETRIC DELAY AVERAGE DELAY I I (VEH/MIN) (VEH/MIN) CAPACITY FLOW QUEUE QUEUE (VEH.MIN/ (VEH.MIN/ PER ARRIVING I I (RFC) (PEDS/MIN) (VEHS) (VEHS) TIME SEGMENT) TIME SEGMENT) VEHICLE (MIN) I I 09.00-09.15 I I ARM A 11.99 46.91 0.256 0.4 0.3 5.2 0.03 I I ARM B 7.68 32.60 0.235 0.4 0.3 4.7 0.04 I I ARM C 12.44 26.79 0.464 1.3 0.9 13.5 0.07 I I ARM D 0.10 15.00 0.007 0.0 0.0 0.1 0.07 I I I ------------------------------------------------------------------------------------------------------------------
QUEUE AT ARM A -------------- TIME SEGMENT NO. OF ENDING VEHICLES IN QUEUE 08.00 0.3 08.15 0.4 08.30 0.6 * 08.45 0.6 * 09.00 0.4 09.15 0.3
QUEUE AT ARM B -------------- TIME SEGMENT NO. OF ENDING VEHICLES IN QUEUE 08.00 0.3 08.15 0.4 08.30 0.6 * 08.45 0.6 * 09.00 0.4 09.15 0.3
QUEUE AT ARM C -------------- TIME SEGMENT NO. OF ENDING VEHICLES IN QUEUE 08.00 0.9 * 08.15 1.3 * 08.30 2.3 ** 08.45 2.3 ** 09.00 1.3 * 09.15 0.9 *
QUEUE AT ARM D -------------- TIME SEGMENT NO. OF ENDING VEHICLES IN QUEUE 08.00 0.0 08.15 0.0 08.30 0.0 08.45 0.0 09.00 0.0 09.15 0.0

-------------------------------------------------------------------------------- TRL TRL VIEWER 3.0 AC t:\M-EC Job Book\20111\capacity assessments\2021 A50-B518 rdbt AM.vao - Page 4 -------------------------------------------------------------------------------- QUEUEING DELAY INFORMATION OVER WHOLE PERIOD -------------------------------------------- ---------------------------------------------------------------------------- I ARM I TOTAL DEMAND I * QUEUEING * I * INCLUSIVE QUEUEING * I I I I * DELAY * I * DELAY * I I I------------------------------------------------------------------I I I (VEH) (VEH/H) I (MIN) (MIN/VEH) I (MIN) (MIN/VEH) I ---------------------------------------------------------------------------- I A I 1315.0 I 876.7 I 42.4 I 0.03 I 42.4 I 0.03 I I B I 841.9 I 561.3 I 38.9 I 0.05 I 38.9 I 0.05 I I C I 1364.4 I 909.6 I 130.6 I 0.10 I 130.7 I 0.10 I I D I 11.0 I 7.3 I 0.8 I 0.08 I 0.8 I 0.08 I ---------------------------------------------------------------------------- I ALL I 3532.2 I 2354.8 I 212.8 I 0.06 I 212.8 I 0.06 I ---------------------------------------------------------------------------- * DELAY IS THAT OCCURRING ONLY WITHIN THE TIME PERIOD. * INCLUSIVE DELAY INCLUDES DELAY SUFFERED BY VEHICLES WHICH ARE STILL QUEUEING AFTER THE END OF THE TIME PERIOD. * THESE WILL ONLY BE SIGNIFICANTLY DIFFERENT IF THERE IS A LARGE QUEUE REMAINING AT THE END OF THE TIME PERIOD. END OF JOB ============================================= end of file ===============================================
[Printed at 13:18:58 on 05/07/2011]

-------------------------------------------------------------------------------- TRL TRL VIEWER 3.0 AC t:\M-EC Job Book\20111\capacity assessments\2021 A50-B518 rdbt PM.vao - Page 1 -------------------------------------------------------------------------------- ___________________ A R C A D Y 6 ___________________ ASSESSMENT OF ROUNDABOUT CAPACITY AND DELAY Analysis Program: Release 2.0 (MAR 2005) (c) Copyright TRL Limited, 2004 Adapted from ARCADY/3 which is Crown Copyright by permission of the controller of HMSO ______________________________________________________ For sales and distribution information, program advice and maintenance, contact: TRL Limited Tel: +44 (0) 1344 770018 Crowthorne House Fax: +44 (0) 1344 770864 Nine Mile Ride Email: [email protected] Wokingham, Berks. Web: www.trlsoftware.co.uk RG40 3GA,UK --------------------------------------------------------------------------------- THE USER OF THIS COMPUTER PROGRAM FOR THE SOLUTION OF AN ENGINEERING PROBLEM IS IN NO WAY RELIEVED OF THEIR RESPONSIBILITY FOR THE CORRECTNESS OF THE SOLUTION --------------------------------------------------------------------------------- Run with file:- "t:\M-EC Job Book\20111\capacity assessments\2021 A50-B518 rdbt PM.vai"(drive-on-the-left ) at 13:34:21 on Tuesday, 5 July 2011
FILE PROPERTIES *************** RUN TITLE: The Dove Way LOCATION: DATE: 05/07/2011 CLIENT: ENUMERATOR: trose [TIMROSE] JOB NUMBER: 20111 STATUS: DESCRIPTION:
INPUT DATA ********** ARM A - A50 East ARM B - A518 ARM C - A50 West ARM D - Access Road
GEOMETRIC DATA -------------- ----------------------------------------------------------------------------------------------------------------------- I ARM I V (M) I E (M) I L (M) I R (M) I D (M) I PHI (DEG) I SLOPE I INTERCEPT (PCU/MIN) I ----------------------------------------------------------------------------------------------------------------------- I ARM A I 10.00 I 12.00 I 20.00 I 25.00 I 78.00 I 48.0 I 0.704 I 55.088 I I ARM B I 5.50 I 10.00 I 30.00 I 30.00 I 78.00 I 46.0 I 0.585 I 41.438 I I ARM C I 5.00 I 7.00 I 20.00 I 30.00 I 78.00 I 49.0 I 0.492 I 31.269 I I ARM D I 4.00 I 5.00 I 15.00 I 30.00 I 78.00 I 38.0 I 0.437 I 24.083 I ----------------------------------------------------------------------------------------------------------------------- V = approach half-width L = effective flare length D = inscribed circle diameter E = entry width R = entry radius PHI = entry angle
TRAFFIC DEMAND DATA ------------------- (Only sets included in the current run are shown)
----------------------- I ARM I FLOW SCALE(%) I ----------------------- I A I 100 I I B I 100 I I C I 100 I I D I 100 I -----------------------
TIME PERIOD BEGINS 16.45 AND ENDS 18.15
LENGTH OF TIME PERIOD - 90 MINUTES. LENGTH OF TIME SEGMENT - 15 MINUTES.
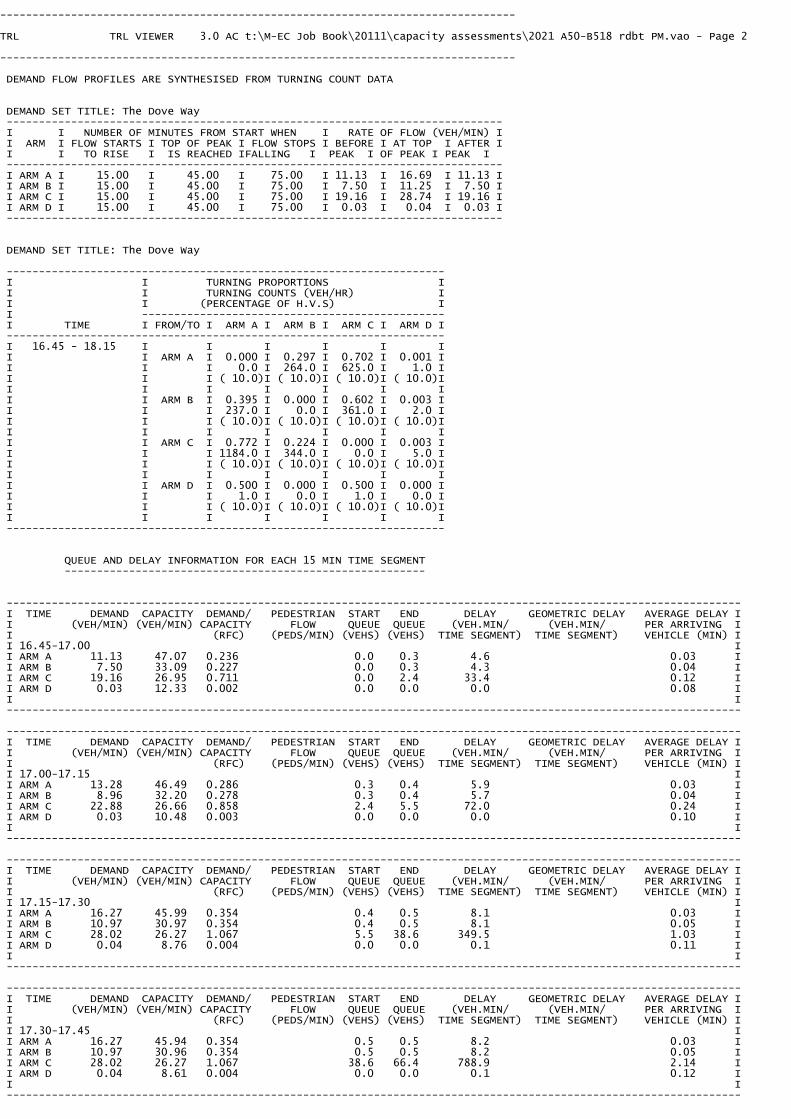
-------------------------------------------------------------------------------- TRL TRL VIEWER 3.0 AC t:\M-EC Job Book\20111\capacity assessments\2021 A50-B518 rdbt PM.vao - Page 2 -------------------------------------------------------------------------------- DEMAND FLOW PROFILES ARE SYNTHESISED FROM TURNING COUNT DATA DEMAND SET TITLE: The Dove Way ----------------------------------------------------------------------------- I I NUMBER OF MINUTES FROM START WHEN I RATE OF FLOW (VEH/MIN) I I ARM I FLOW STARTS I TOP OF PEAK I FLOW STOPS I BEFORE I AT TOP I AFTER I I I TO RISE I IS REACHED IFALLING I PEAK I OF PEAK I PEAK I ----------------------------------------------------------------------------- I ARM A I 15.00 I 45.00 I 75.00 I 11.13 I 16.69 I 11.13 I I ARM B I 15.00 I 45.00 I 75.00 I 7.50 I 11.25 I 7.50 I I ARM C I 15.00 I 45.00 I 75.00 I 19.16 I 28.74 I 19.16 I I ARM D I 15.00 I 45.00 I 75.00 I 0.03 I 0.04 I 0.03 I ----------------------------------------------------------------------------- DEMAND SET TITLE: The Dove Way
-------------------------------------------------------------------- I I TURNING PROPORTIONS I I I TURNING COUNTS (VEH/HR) I I I (PERCENTAGE OF H.V.S) I I ----------------------------------------------- I TIME I FROM/TO I ARM A I ARM B I ARM C I ARM D I -------------------------------------------------------------------- I 16.45 - 18.15 I I I I I I I I ARM A I 0.000 I 0.297 I 0.702 I 0.001 I I I I 0.0 I 264.0 I 625.0 I 1.0 I I I I ( 10.0)I ( 10.0)I ( 10.0)I ( 10.0)I I I I I I I I I I ARM B I 0.395 I 0.000 I 0.602 I 0.003 I I I I 237.0 I 0.0 I 361.0 I 2.0 I I I I ( 10.0)I ( 10.0)I ( 10.0)I ( 10.0)I I I I I I I I I I ARM C I 0.772 I 0.224 I 0.000 I 0.003 I I I I 1184.0 I 344.0 I 0.0 I 5.0 I I I I ( 10.0)I ( 10.0)I ( 10.0)I ( 10.0)I I I I I I I I I I ARM D I 0.500 I 0.000 I 0.500 I 0.000 I I I I 1.0 I 0.0 I 1.0 I 0.0 I I I I ( 10.0)I ( 10.0)I ( 10.0)I ( 10.0)I I I I I I I I --------------------------------------------------------------------
QUEUE AND DELAY INFORMATION FOR EACH 15 MIN TIME SEGMENT --------------------------------------------------------
------------------------------------------------------------------------------------------------------------------ I TIME DEMAND CAPACITY DEMAND/ PEDESTRIAN START END DELAY GEOMETRIC DELAY AVERAGE DELAY I I (VEH/MIN) (VEH/MIN) CAPACITY FLOW QUEUE QUEUE (VEH.MIN/ (VEH.MIN/ PER ARRIVING I I (RFC) (PEDS/MIN) (VEHS) (VEHS) TIME SEGMENT) TIME SEGMENT) VEHICLE (MIN) I I 16.45-17.00 I I ARM A 11.13 47.07 0.236 0.0 0.3 4.6 0.03 I I ARM B 7.50 33.09 0.227 0.0 0.3 4.3 0.04 I I ARM C 19.16 26.95 0.711 0.0 2.4 33.4 0.12 I I ARM D 0.03 12.33 0.002 0.0 0.0 0.0 0.08 I I I ------------------------------------------------------------------------------------------------------------------
------------------------------------------------------------------------------------------------------------------ I TIME DEMAND CAPACITY DEMAND/ PEDESTRIAN START END DELAY GEOMETRIC DELAY AVERAGE DELAY I I (VEH/MIN) (VEH/MIN) CAPACITY FLOW QUEUE QUEUE (VEH.MIN/ (VEH.MIN/ PER ARRIVING I I (RFC) (PEDS/MIN) (VEHS) (VEHS) TIME SEGMENT) TIME SEGMENT) VEHICLE (MIN) I I 17.00-17.15 I I ARM A 13.28 46.49 0.286 0.3 0.4 5.9 0.03 I I ARM B 8.96 32.20 0.278 0.3 0.4 5.7 0.04 I I ARM C 22.88 26.66 0.858 2.4 5.5 72.0 0.24 I I ARM D 0.03 10.48 0.003 0.0 0.0 0.0 0.10 I I I ------------------------------------------------------------------------------------------------------------------
------------------------------------------------------------------------------------------------------------------ I TIME DEMAND CAPACITY DEMAND/ PEDESTRIAN START END DELAY GEOMETRIC DELAY AVERAGE DELAY I I (VEH/MIN) (VEH/MIN) CAPACITY FLOW QUEUE QUEUE (VEH.MIN/ (VEH.MIN/ PER ARRIVING I I (RFC) (PEDS/MIN) (VEHS) (VEHS) TIME SEGMENT) TIME SEGMENT) VEHICLE (MIN) I I 17.15-17.30 I I ARM A 16.27 45.99 0.354 0.4 0.5 8.1 0.03 I I ARM B 10.97 30.97 0.354 0.4 0.5 8.1 0.05 I I ARM C 28.02 26.27 1.067 5.5 38.6 349.5 1.03 I I ARM D 0.04 8.76 0.004 0.0 0.0 0.1 0.11 I I I ------------------------------------------------------------------------------------------------------------------
------------------------------------------------------------------------------------------------------------------ I TIME DEMAND CAPACITY DEMAND/ PEDESTRIAN START END DELAY GEOMETRIC DELAY AVERAGE DELAY I I (VEH/MIN) (VEH/MIN) CAPACITY FLOW QUEUE QUEUE (VEH.MIN/ (VEH.MIN/ PER ARRIVING I I (RFC) (PEDS/MIN) (VEHS) (VEHS) TIME SEGMENT) TIME SEGMENT) VEHICLE (MIN) I I 17.30-17.45 I I ARM A 16.27 45.94 0.354 0.5 0.5 8.2 0.03 I I ARM B 10.97 30.96 0.354 0.5 0.5 8.2 0.05 I I ARM C 28.02 26.27 1.067 38.6 66.4 788.9 2.14 I I ARM D 0.04 8.61 0.004 0.0 0.0 0.1 0.12 I I I ------------------------------------------------------------------------------------------------------------------

-------------------------------------------------------------------------------- TRL TRL VIEWER 3.0 AC t:\M-EC Job Book\20111\capacity assessments\2021 A50-B518 rdbt PM.vao - Page 3 -------------------------------------------------------------------------------- ------------------------------------------------------------------------------------------------------------------ I TIME DEMAND CAPACITY DEMAND/ PEDESTRIAN START END DELAY GEOMETRIC DELAY AVERAGE DELAY I I (VEH/MIN) (VEH/MIN) CAPACITY FLOW QUEUE QUEUE (VEH.MIN/ (VEH.MIN/ PER ARRIVING I I (RFC) (PEDS/MIN) (VEHS) (VEHS) TIME SEGMENT) TIME SEGMENT) VEHICLE (MIN) I I 17.45-18.00 I I ARM A 13.28 45.92 0.289 0.5 0.4 6.2 0.03 I I ARM B 8.96 32.19 0.278 0.5 0.4 5.9 0.04 I I ARM C 22.88 26.66 0.858 66.4 15.7 615.6 1.63 I I ARM D 0.03 8.91 0.003 0.0 0.0 0.1 0.11 I I I ------------------------------------------------------------------------------------------------------------------
------------------------------------------------------------------------------------------------------------------ I TIME DEMAND CAPACITY DEMAND/ PEDESTRIAN START END DELAY GEOMETRIC DELAY AVERAGE DELAY I I (VEH/MIN) (VEH/MIN) CAPACITY FLOW QUEUE QUEUE (VEH.MIN/ (VEH.MIN/ PER ARRIVING I I (RFC) (PEDS/MIN) (VEHS) (VEHS) TIME SEGMENT) TIME SEGMENT) VEHICLE (MIN) I I 18.00-18.15 I I ARM A 11.13 46.91 0.237 0.4 0.3 4.7 0.03 I I ARM B 7.50 33.08 0.227 0.4 0.3 4.5 0.04 I I ARM C 19.16 26.95 0.711 15.7 2.5 53.9 0.16 I I ARM D 0.03 11.87 0.002 0.0 0.0 0.0 0.08 I I I ------------------------------------------------------------------------------------------------------------------
QUEUE AT ARM A -------------- TIME SEGMENT NO. OF ENDING VEHICLES IN QUEUE 17.00 0.3 17.15 0.4 17.30 0.5 * 17.45 0.5 * 18.00 0.4 18.15 0.3
QUEUE AT ARM B -------------- TIME SEGMENT NO. OF ENDING VEHICLES IN QUEUE 17.00 0.3 17.15 0.4 17.30 0.5 * 17.45 0.5 * 18.00 0.4 18.15 0.3
QUEUE AT ARM C -------------- TIME SEGMENT NO. OF ENDING VEHICLES IN QUEUE 17.00 2.4 ** 17.15 5.5 ***** 17.30 38.6 *************************************** 17.45 66.4 ****************************************************************** 18.00 15.7 **************** 18.15 2.5 ***
QUEUE AT ARM D -------------- TIME SEGMENT NO. OF ENDING VEHICLES IN QUEUE 17.00 0.0 17.15 0.0 17.30 0.0 17.45 0.0 18.00 0.0 18.15 0.0

-------------------------------------------------------------------------------- TRL TRL VIEWER 3.0 AC t:\M-EC Job Book\20111\capacity assessments\2021 A50-B518 rdbt PM.vao - Page 4 -------------------------------------------------------------------------------- QUEUEING DELAY INFORMATION OVER WHOLE PERIOD -------------------------------------------- ---------------------------------------------------------------------------- I ARM I TOTAL DEMAND I * QUEUEING * I * INCLUSIVE QUEUEING * I I I I * DELAY * I * DELAY * I I I------------------------------------------------------------------I I I (VEH) (VEH/H) I (MIN) (MIN/VEH) I (MIN) (MIN/VEH) I ---------------------------------------------------------------------------- I A I 1220.4 I 813.6 I 37.7 I 0.03 I 37.7 I 0.03 I I B I 822.7 I 548.5 I 36.6 I 0.04 I 36.6 I 0.04 I I C I 2102.1 I 1401.4 I 1913.3 I 0.91 I 1913.4 I 0.91 I I D I 2.7 I 1.8 I 0.3 I 0.10 I 0.3 I 0.10 I ---------------------------------------------------------------------------- I ALL I 4147.9 I 2765.3 I 1987.9 I 0.48 I 1988.0 I 0.48 I ---------------------------------------------------------------------------- * DELAY IS THAT OCCURRING ONLY WITHIN THE TIME PERIOD. * INCLUSIVE DELAY INCLUDES DELAY SUFFERED BY VEHICLES WHICH ARE STILL QUEUEING AFTER THE END OF THE TIME PERIOD. * THESE WILL ONLY BE SIGNIFICANTLY DIFFERENT IF THERE IS A LARGE QUEUE REMAINING AT THE END OF THE TIME PERIOD. END OF JOB ============================================= end of file ===============================================
[Printed at 13:34:29 on 05/07/2011]

-------------------------------------------------------------------------------- TRL TRL VIEWER 3.0 AC t:\M-EC Job Book\20111\capacity assessments\2021 A50-B5030 rdbt AM.vao - Page 1 -------------------------------------------------------------------------------- ___________________ A R C A D Y 6 ___________________ ASSESSMENT OF ROUNDABOUT CAPACITY AND DELAY Analysis Program: Release 2.0 (MAR 2005) (c) Copyright TRL Limited, 2004 Adapted from ARCADY/3 which is Crown Copyright by permission of the controller of HMSO ______________________________________________________ For sales and distribution information, program advice and maintenance, contact: TRL Limited Tel: +44 (0) 1344 770018 Crowthorne House Fax: +44 (0) 1344 770864 Nine Mile Ride Email: [email protected] Wokingham, Berks. Web: www.trlsoftware.co.uk RG40 3GA,UK --------------------------------------------------------------------------------- THE USER OF THIS COMPUTER PROGRAM FOR THE SOLUTION OF AN ENGINEERING PROBLEM IS IN NO WAY RELIEVED OF THEIR RESPONSIBILITY FOR THE CORRECTNESS OF THE SOLUTION --------------------------------------------------------------------------------- Run with file:- "t:\M-EC Job Book\20111\capacity assessments\2021 A50-B5030 rdbt AM.vai"(drive-on-the-left ) at 12:13:14 on Tuesday, 5 July 2011
FILE PROPERTIES *************** RUN TITLE: The Dove Way LOCATION: DATE: 04/07/2011 CLIENT: ENUMERATOR: trose [TIMROSE] JOB NUMBER: 20111 STATUS: DESCRIPTION:
INPUT DATA ********** ARM A - A50 East ARM B - B5030 ARM C - A50 West ARM D - A518
GEOMETRIC DATA -------------- ----------------------------------------------------------------------------------------------------------------------- I ARM I V (M) I E (M) I L (M) I R (M) I D (M) I PHI (DEG) I SLOPE I INTERCEPT (PCU/MIN) I ----------------------------------------------------------------------------------------------------------------------- I ARM A I 8.00 I 8.00 I 14.00 I 70.00 I 56.00 I 47.0 I 0.692 I 39.428 I I ARM B I 5.00 I 6.00 I 24.00 I 30.00 I 56.00 I 42.0 I 0.579 I 28.953 I I ARM C I 7.00 I 8.00 I 11.00 I 30.00 I 56.00 I 57.0 I 0.643 I 36.223 I I ARM D I 7.00 I 10.00 I 25.00 I 20.00 I 56.00 I 54.0 I 0.709 I 42.441 I ----------------------------------------------------------------------------------------------------------------------- V = approach half-width L = effective flare length D = inscribed circle diameter E = entry width R = entry radius PHI = entry angle
TRAFFIC DEMAND DATA ------------------- (Only sets included in the current run are shown)
----------------------- I ARM I FLOW SCALE(%) I ----------------------- I A I 100 I I B I 100 I I C I 100 I I D I 100 I -----------------------
TIME PERIOD BEGINS 07.45 AND ENDS 09.15
LENGTH OF TIME PERIOD - 90 MINUTES. LENGTH OF TIME SEGMENT - 15 MINUTES.

-------------------------------------------------------------------------------- TRL TRL VIEWER 3.0 AC t:\M-EC Job Book\20111\capacity assessments\2021 A50-B5030 rdbt AM.vao - Page 2 -------------------------------------------------------------------------------- DEMAND FLOW PROFILES ARE SYNTHESISED FROM TURNING COUNT DATA DEMAND SET TITLE: The Dove Way ----------------------------------------------------------------------------- I I NUMBER OF MINUTES FROM START WHEN I RATE OF FLOW (VEH/MIN) I I ARM I FLOW STARTS I TOP OF PEAK I FLOW STOPS I BEFORE I AT TOP I AFTER I I I TO RISE I IS REACHED IFALLING I PEAK I OF PEAK I PEAK I ----------------------------------------------------------------------------- I ARM A I 15.00 I 45.00 I 75.00 I 13.00 I 19.50 I 13.00 I I ARM B I 15.00 I 45.00 I 75.00 I 6.41 I 9.62 I 6.41 I I ARM C I 15.00 I 45.00 I 75.00 I 9.96 I 14.94 I 9.96 I I ARM D I 15.00 I 45.00 I 75.00 I 12.11 I 18.17 I 12.11 I ----------------------------------------------------------------------------- DEMAND SET TITLE: The Dove Way
-------------------------------------------------------------------- I I TURNING PROPORTIONS I I I TURNING COUNTS (VEH/HR) I I I (PERCENTAGE OF H.V.S) I I ----------------------------------------------- I TIME I FROM/TO I ARM A I ARM B I ARM C I ARM D I -------------------------------------------------------------------- I 07.45 - 09.15 I I I I I I I I ARM A I 0.000 I 0.189 I 0.406 I 0.405 I I I I 0.0 I 197.0 I 422.0 I 421.0 I I I I ( 10.0)I ( 10.0)I ( 10.0)I ( 10.0)I I I I I I I I I I ARM B I 0.347 I 0.000 I 0.380 I 0.273 I I I I 178.0 I 0.0 I 195.0 I 140.0 I I I I ( 10.0)I ( 10.0)I ( 10.0)I ( 10.0)I I I I I I I I I I ARM C I 0.604 I 0.177 I 0.000 I 0.220 I I I I 481.0 I 141.0 I 0.0 I 175.0 I I I I ( 10.0)I ( 10.0)I ( 10.0)I ( 10.0)I I I I I I I I I I ARM D I 0.349 I 0.337 I 0.314 I 0.000 I I I I 338.0 I 327.0 I 304.0 I 0.0 I I I I ( 10.0)I ( 10.0)I ( 10.0)I ( 10.0)I I I I I I I I --------------------------------------------------------------------
QUEUE AND DELAY INFORMATION FOR EACH 15 MIN TIME SEGMENT --------------------------------------------------------
------------------------------------------------------------------------------------------------------------------ I TIME DEMAND CAPACITY DEMAND/ PEDESTRIAN START END DELAY GEOMETRIC DELAY AVERAGE DELAY I I (VEH/MIN) (VEH/MIN) CAPACITY FLOW QUEUE QUEUE (VEH.MIN/ (VEH.MIN/ PER ARRIVING I I (RFC) (PEDS/MIN) (VEHS) (VEHS) TIME SEGMENT) TIME SEGMENT) VEHICLE (MIN) I I 07.45-08.00 I I ARM A 13.00 29.19 0.445 0.0 0.8 11.6 0.06 I I ARM B 6.41 18.05 0.355 0.0 0.5 7.9 0.09 I I ARM C 9.96 27.02 0.369 0.0 0.6 8.5 0.06 I I ARM D 12.11 31.53 0.384 0.0 0.6 9.1 0.05 I I I ------------------------------------------------------------------------------------------------------------------
------------------------------------------------------------------------------------------------------------------ I TIME DEMAND CAPACITY DEMAND/ PEDESTRIAN START END DELAY GEOMETRIC DELAY AVERAGE DELAY I I (VEH/MIN) (VEH/MIN) CAPACITY FLOW QUEUE QUEUE (VEH.MIN/ (VEH.MIN/ PER ARRIVING I I (RFC) (PEDS/MIN) (VEHS) (VEHS) TIME SEGMENT) TIME SEGMENT) VEHICLE (MIN) I I 08.00-08.15 I I ARM A 15.52 27.88 0.557 0.8 1.2 18.1 0.08 I I ARM B 7.66 16.43 0.466 0.5 0.9 12.5 0.11 I I ARM C 11.90 25.85 0.460 0.6 0.8 12.4 0.07 I I ARM D 14.46 30.13 0.480 0.6 0.9 13.4 0.06 I I I ------------------------------------------------------------------------------------------------------------------
------------------------------------------------------------------------------------------------------------------ I TIME DEMAND CAPACITY DEMAND/ PEDESTRIAN START END DELAY GEOMETRIC DELAY AVERAGE DELAY I I (VEH/MIN) (VEH/MIN) CAPACITY FLOW QUEUE QUEUE (VEH.MIN/ (VEH.MIN/ PER ARRIVING I I (RFC) (PEDS/MIN) (VEHS) (VEHS) TIME SEGMENT) TIME SEGMENT) VEHICLE (MIN) I I 08.15-08.30 I I ARM A 19.01 26.10 0.728 1.2 2.6 36.5 0.14 I I ARM B 9.38 14.24 0.659 0.9 1.9 25.9 0.20 I I ARM C 14.57 24.29 0.600 0.8 1.5 21.2 0.10 I I ARM D 17.71 28.26 0.627 0.9 1.7 23.8 0.09 I I I ------------------------------------------------------------------------------------------------------------------
------------------------------------------------------------------------------------------------------------------ I TIME DEMAND CAPACITY DEMAND/ PEDESTRIAN START END DELAY GEOMETRIC DELAY AVERAGE DELAY I I (VEH/MIN) (VEH/MIN) CAPACITY FLOW QUEUE QUEUE (VEH.MIN/ (VEH.MIN/ PER ARRIVING I I (RFC) (PEDS/MIN) (VEHS) (VEHS) TIME SEGMENT) TIME SEGMENT) VEHICLE (MIN) I I 08.30-08.45 I I ARM A 19.01 26.07 0.729 2.6 2.6 39.4 0.14 I I ARM B 9.38 14.19 0.661 1.9 1.9 28.3 0.21 I I ARM C 14.57 24.24 0.601 1.5 1.5 22.3 0.10 I I ARM D 17.71 28.22 0.628 1.7 1.7 25.0 0.10 I I I ------------------------------------------------------------------------------------------------------------------

-------------------------------------------------------------------------------- TRL TRL VIEWER 3.0 AC t:\M-EC Job Book\20111\capacity assessments\2021 A50-B5030 rdbt AM.vao - Page 3 -------------------------------------------------------------------------------- ------------------------------------------------------------------------------------------------------------------ I TIME DEMAND CAPACITY DEMAND/ PEDESTRIAN START END DELAY GEOMETRIC DELAY AVERAGE DELAY I I (VEH/MIN) (VEH/MIN) CAPACITY FLOW QUEUE QUEUE (VEH.MIN/ (VEH.MIN/ PER ARRIVING I I (RFC) (PEDS/MIN) (VEHS) (VEHS) TIME SEGMENT) TIME SEGMENT) VEHICLE (MIN) I I 08.45-09.00 I I ARM A 15.52 27.84 0.558 2.6 1.3 19.9 0.08 I I ARM B 7.66 16.36 0.468 1.9 0.9 14.0 0.12 I I ARM C 11.90 25.79 0.461 1.5 0.9 13.3 0.07 I I ARM D 14.46 30.08 0.481 1.7 0.9 14.4 0.06 I I I ------------------------------------------------------------------------------------------------------------------
------------------------------------------------------------------------------------------------------------------ I TIME DEMAND CAPACITY DEMAND/ PEDESTRIAN START END DELAY GEOMETRIC DELAY AVERAGE DELAY I I (VEH/MIN) (VEH/MIN) CAPACITY FLOW QUEUE QUEUE (VEH.MIN/ (VEH.MIN/ PER ARRIVING I I (RFC) (PEDS/MIN) (VEHS) (VEHS) TIME SEGMENT) TIME SEGMENT) VEHICLE (MIN) I I 09.00-09.15 I I ARM A 13.00 29.15 0.446 1.3 0.8 12.5 0.06 I I ARM B 6.41 18.00 0.356 0.9 0.6 8.6 0.09 I I ARM C 9.96 26.97 0.369 0.9 0.6 9.0 0.06 I I ARM D 12.11 31.48 0.385 0.9 0.6 9.6 0.05 I I I ------------------------------------------------------------------------------------------------------------------
QUEUE AT ARM A -------------- TIME SEGMENT NO. OF ENDING VEHICLES IN QUEUE 08.00 0.8 * 08.15 1.2 * 08.30 2.6 *** 08.45 2.6 *** 09.00 1.3 * 09.15 0.8 *
QUEUE AT ARM B -------------- TIME SEGMENT NO. OF ENDING VEHICLES IN QUEUE 08.00 0.5 * 08.15 0.9 * 08.30 1.9 ** 08.45 1.9 ** 09.00 0.9 * 09.15 0.6 *
QUEUE AT ARM C -------------- TIME SEGMENT NO. OF ENDING VEHICLES IN QUEUE 08.00 0.6 * 08.15 0.8 * 08.30 1.5 * 08.45 1.5 * 09.00 0.9 * 09.15 0.6 *
QUEUE AT ARM D -------------- TIME SEGMENT NO. OF ENDING VEHICLES IN QUEUE 08.00 0.6 * 08.15 0.9 * 08.30 1.7 ** 08.45 1.7 ** 09.00 0.9 * 09.15 0.6 *

-------------------------------------------------------------------------------- TRL TRL VIEWER 3.0 AC t:\M-EC Job Book\20111\capacity assessments\2021 A50-B5030 rdbt AM.vao - Page 4 -------------------------------------------------------------------------------- QUEUEING DELAY INFORMATION OVER WHOLE PERIOD -------------------------------------------- ---------------------------------------------------------------------------- I ARM I TOTAL DEMAND I * QUEUEING * I * INCLUSIVE QUEUEING * I I I I * DELAY * I * DELAY * I I I------------------------------------------------------------------I I I (VEH) (VEH/H) I (MIN) (MIN/VEH) I (MIN) (MIN/VEH) I ---------------------------------------------------------------------------- I A I 1426.1 I 950.7 I 137.9 I 0.10 I 137.9 I 0.10 I I B I 703.4 I 469.0 I 97.3 I 0.14 I 97.3 I 0.14 I I C I 1092.9 I 728.6 I 86.8 I 0.08 I 86.8 I 0.08 I I D I 1328.7 I 885.8 I 95.3 I 0.07 I 95.3 I 0.07 I ---------------------------------------------------------------------------- I ALL I 4551.0 I 3034.0 I 417.3 I 0.09 I 417.3 I 0.09 I ---------------------------------------------------------------------------- * DELAY IS THAT OCCURRING ONLY WITHIN THE TIME PERIOD. * INCLUSIVE DELAY INCLUDES DELAY SUFFERED BY VEHICLES WHICH ARE STILL QUEUEING AFTER THE END OF THE TIME PERIOD. * THESE WILL ONLY BE SIGNIFICANTLY DIFFERENT IF THERE IS A LARGE QUEUE REMAINING AT THE END OF THE TIME PERIOD. END OF JOB ============================================= end of file ===============================================
[Printed at 12:13:23 on 05/07/2011]

-------------------------------------------------------------------------------- TRL TRL VIEWER 3.0 AC t:\M-EC Job Book\20111\capacity assessments\2021 A50-B5030 rdbt PM.vao - Page 1 -------------------------------------------------------------------------------- ___________________ A R C A D Y 6 ___________________ ASSESSMENT OF ROUNDABOUT CAPACITY AND DELAY Analysis Program: Release 2.0 (MAR 2005) (c) Copyright TRL Limited, 2004 Adapted from ARCADY/3 which is Crown Copyright by permission of the controller of HMSO ______________________________________________________ For sales and distribution information, program advice and maintenance, contact: TRL Limited Tel: +44 (0) 1344 770018 Crowthorne House Fax: +44 (0) 1344 770864 Nine Mile Ride Email: [email protected] Wokingham, Berks. Web: www.trlsoftware.co.uk RG40 3GA,UK --------------------------------------------------------------------------------- THE USER OF THIS COMPUTER PROGRAM FOR THE SOLUTION OF AN ENGINEERING PROBLEM IS IN NO WAY RELIEVED OF THEIR RESPONSIBILITY FOR THE CORRECTNESS OF THE SOLUTION --------------------------------------------------------------------------------- Run with file:- "t:\M-EC Job Book\20111\capacity assessments\2021 A50-B5030 rdbt PM.vai"(drive-on-the-left ) at 12:19:06 on Tuesday, 5 July 2011
FILE PROPERTIES *************** RUN TITLE: The Dove Way LOCATION: DATE: 04/07/2011 CLIENT: ENUMERATOR: trose [TIMROSE] JOB NUMBER: 20111 STATUS: DESCRIPTION:
INPUT DATA ********** ARM A - A50 East ARM B - B5030 ARM C - A50 West ARM D - A518
GEOMETRIC DATA -------------- ----------------------------------------------------------------------------------------------------------------------- I ARM I V (M) I E (M) I L (M) I R (M) I D (M) I PHI (DEG) I SLOPE I INTERCEPT (PCU/MIN) I ----------------------------------------------------------------------------------------------------------------------- I ARM A I 8.00 I 8.00 I 14.00 I 70.00 I 56.00 I 47.0 I 0.692 I 39.428 I I ARM B I 5.00 I 6.00 I 24.00 I 30.00 I 56.00 I 42.0 I 0.579 I 28.953 I I ARM C I 7.00 I 8.00 I 11.00 I 30.00 I 56.00 I 57.0 I 0.643 I 36.223 I I ARM D I 7.00 I 10.00 I 25.00 I 20.00 I 56.00 I 54.0 I 0.709 I 42.441 I ----------------------------------------------------------------------------------------------------------------------- V = approach half-width L = effective flare length D = inscribed circle diameter E = entry width R = entry radius PHI = entry angle
TRAFFIC DEMAND DATA ------------------- (Only sets included in the current run are shown)
----------------------- I ARM I FLOW SCALE(%) I ----------------------- I A I 100 I I B I 100 I I C I 100 I I D I 100 I -----------------------
TIME PERIOD BEGINS 16.45 AND ENDS 18.15
LENGTH OF TIME PERIOD - 90 MINUTES. LENGTH OF TIME SEGMENT - 15 MINUTES.
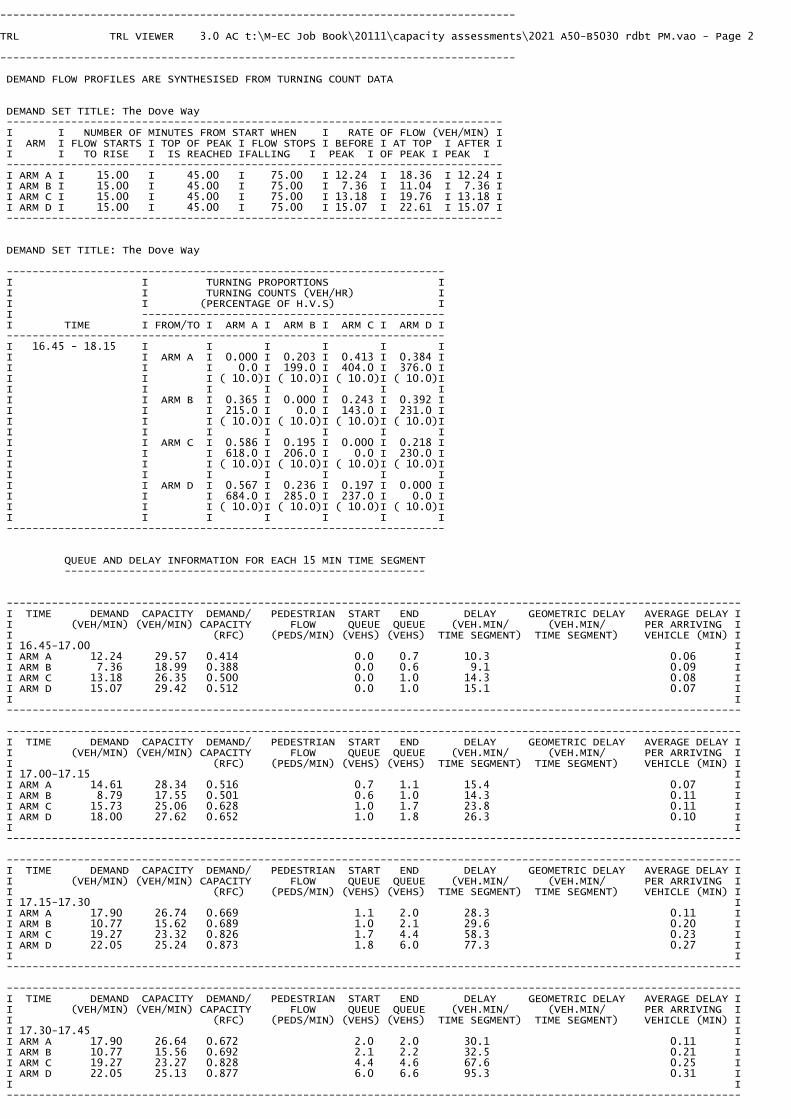
-------------------------------------------------------------------------------- TRL TRL VIEWER 3.0 AC t:\M-EC Job Book\20111\capacity assessments\2021 A50-B5030 rdbt PM.vao - Page 2 -------------------------------------------------------------------------------- DEMAND FLOW PROFILES ARE SYNTHESISED FROM TURNING COUNT DATA DEMAND SET TITLE: The Dove Way ----------------------------------------------------------------------------- I I NUMBER OF MINUTES FROM START WHEN I RATE OF FLOW (VEH/MIN) I I ARM I FLOW STARTS I TOP OF PEAK I FLOW STOPS I BEFORE I AT TOP I AFTER I I I TO RISE I IS REACHED IFALLING I PEAK I OF PEAK I PEAK I ----------------------------------------------------------------------------- I ARM A I 15.00 I 45.00 I 75.00 I 12.24 I 18.36 I 12.24 I I ARM B I 15.00 I 45.00 I 75.00 I 7.36 I 11.04 I 7.36 I I ARM C I 15.00 I 45.00 I 75.00 I 13.18 I 19.76 I 13.18 I I ARM D I 15.00 I 45.00 I 75.00 I 15.07 I 22.61 I 15.07 I ----------------------------------------------------------------------------- DEMAND SET TITLE: The Dove Way
-------------------------------------------------------------------- I I TURNING PROPORTIONS I I I TURNING COUNTS (VEH/HR) I I I (PERCENTAGE OF H.V.S) I I ----------------------------------------------- I TIME I FROM/TO I ARM A I ARM B I ARM C I ARM D I -------------------------------------------------------------------- I 16.45 - 18.15 I I I I I I I I ARM A I 0.000 I 0.203 I 0.413 I 0.384 I I I I 0.0 I 199.0 I 404.0 I 376.0 I I I I ( 10.0)I ( 10.0)I ( 10.0)I ( 10.0)I I I I I I I I I I ARM B I 0.365 I 0.000 I 0.243 I 0.392 I I I I 215.0 I 0.0 I 143.0 I 231.0 I I I I ( 10.0)I ( 10.0)I ( 10.0)I ( 10.0)I I I I I I I I I I ARM C I 0.586 I 0.195 I 0.000 I 0.218 I I I I 618.0 I 206.0 I 0.0 I 230.0 I I I I ( 10.0)I ( 10.0)I ( 10.0)I ( 10.0)I I I I I I I I I I ARM D I 0.567 I 0.236 I 0.197 I 0.000 I I I I 684.0 I 285.0 I 237.0 I 0.0 I I I I ( 10.0)I ( 10.0)I ( 10.0)I ( 10.0)I I I I I I I I --------------------------------------------------------------------
QUEUE AND DELAY INFORMATION FOR EACH 15 MIN TIME SEGMENT --------------------------------------------------------
------------------------------------------------------------------------------------------------------------------ I TIME DEMAND CAPACITY DEMAND/ PEDESTRIAN START END DELAY GEOMETRIC DELAY AVERAGE DELAY I I (VEH/MIN) (VEH/MIN) CAPACITY FLOW QUEUE QUEUE (VEH.MIN/ (VEH.MIN/ PER ARRIVING I I (RFC) (PEDS/MIN) (VEHS) (VEHS) TIME SEGMENT) TIME SEGMENT) VEHICLE (MIN) I I 16.45-17.00 I I ARM A 12.24 29.57 0.414 0.0 0.7 10.3 0.06 I I ARM B 7.36 18.99 0.388 0.0 0.6 9.1 0.09 I I ARM C 13.18 26.35 0.500 0.0 1.0 14.3 0.08 I I ARM D 15.07 29.42 0.512 0.0 1.0 15.1 0.07 I I I ------------------------------------------------------------------------------------------------------------------
------------------------------------------------------------------------------------------------------------------ I TIME DEMAND CAPACITY DEMAND/ PEDESTRIAN START END DELAY GEOMETRIC DELAY AVERAGE DELAY I I (VEH/MIN) (VEH/MIN) CAPACITY FLOW QUEUE QUEUE (VEH.MIN/ (VEH.MIN/ PER ARRIVING I I (RFC) (PEDS/MIN) (VEHS) (VEHS) TIME SEGMENT) TIME SEGMENT) VEHICLE (MIN) I I 17.00-17.15 I I ARM A 14.61 28.34 0.516 0.7 1.1 15.4 0.07 I I ARM B 8.79 17.55 0.501 0.6 1.0 14.3 0.11 I I ARM C 15.73 25.06 0.628 1.0 1.7 23.8 0.11 I I ARM D 18.00 27.62 0.652 1.0 1.8 26.3 0.10 I I I ------------------------------------------------------------------------------------------------------------------
------------------------------------------------------------------------------------------------------------------ I TIME DEMAND CAPACITY DEMAND/ PEDESTRIAN START END DELAY GEOMETRIC DELAY AVERAGE DELAY I I (VEH/MIN) (VEH/MIN) CAPACITY FLOW QUEUE QUEUE (VEH.MIN/ (VEH.MIN/ PER ARRIVING I I (RFC) (PEDS/MIN) (VEHS) (VEHS) TIME SEGMENT) TIME SEGMENT) VEHICLE (MIN) I I 17.15-17.30 I I ARM A 17.90 26.74 0.669 1.1 2.0 28.3 0.11 I I ARM B 10.77 15.62 0.689 1.0 2.1 29.6 0.20 I I ARM C 19.27 23.32 0.826 1.7 4.4 58.3 0.23 I I ARM D 22.05 25.24 0.873 1.8 6.0 77.3 0.27 I I I ------------------------------------------------------------------------------------------------------------------
------------------------------------------------------------------------------------------------------------------ I TIME DEMAND CAPACITY DEMAND/ PEDESTRIAN START END DELAY GEOMETRIC DELAY AVERAGE DELAY I I (VEH/MIN) (VEH/MIN) CAPACITY FLOW QUEUE QUEUE (VEH.MIN/ (VEH.MIN/ PER ARRIVING I I (RFC) (PEDS/MIN) (VEHS) (VEHS) TIME SEGMENT) TIME SEGMENT) VEHICLE (MIN) I I 17.30-17.45 I I ARM A 17.90 26.64 0.672 2.0 2.0 30.1 0.11 I I ARM B 10.77 15.56 0.692 2.1 2.2 32.5 0.21 I I ARM C 19.27 23.27 0.828 4.4 4.6 67.6 0.25 I I ARM D 22.05 25.13 0.877 6.0 6.6 95.3 0.31 I I I ------------------------------------------------------------------------------------------------------------------

-------------------------------------------------------------------------------- TRL TRL VIEWER 3.0 AC t:\M-EC Job Book\20111\capacity assessments\2021 A50-B5030 rdbt PM.vao - Page 3 -------------------------------------------------------------------------------- ------------------------------------------------------------------------------------------------------------------ I TIME DEMAND CAPACITY DEMAND/ PEDESTRIAN START END DELAY GEOMETRIC DELAY AVERAGE DELAY I I (VEH/MIN) (VEH/MIN) CAPACITY FLOW QUEUE QUEUE (VEH.MIN/ (VEH.MIN/ PER ARRIVING I I (RFC) (PEDS/MIN) (VEHS) (VEHS) TIME SEGMENT) TIME SEGMENT) VEHICLE (MIN) I I 17.45-18.00 I I ARM A 14.61 28.20 0.518 2.0 1.1 16.8 0.07 I I ARM B 8.79 17.47 0.503 2.2 1.0 16.2 0.12 I I ARM C 15.73 24.99 0.630 4.6 1.7 27.9 0.11 I I ARM D 18.00 27.47 0.655 6.6 1.9 32.2 0.11 I I I ------------------------------------------------------------------------------------------------------------------
------------------------------------------------------------------------------------------------------------------ I TIME DEMAND CAPACITY DEMAND/ PEDESTRIAN START END DELAY GEOMETRIC DELAY AVERAGE DELAY I I (VEH/MIN) (VEH/MIN) CAPACITY FLOW QUEUE QUEUE (VEH.MIN/ (VEH.MIN/ PER ARRIVING I I (RFC) (PEDS/MIN) (VEHS) (VEHS) TIME SEGMENT) TIME SEGMENT) VEHICLE (MIN) I I 18.00-18.15 I I ARM A 12.24 29.52 0.415 1.1 0.7 10.9 0.06 I I ARM B 7.36 18.94 0.389 1.0 0.6 9.9 0.09 I I ARM C 13.18 26.30 0.501 1.7 1.0 15.7 0.08 I I ARM D 15.07 29.34 0.514 1.9 1.1 16.5 0.07 I I I ------------------------------------------------------------------------------------------------------------------
QUEUE AT ARM A -------------- TIME SEGMENT NO. OF ENDING VEHICLES IN QUEUE 17.00 0.7 * 17.15 1.1 * 17.30 2.0 ** 17.45 2.0 ** 18.00 1.1 * 18.15 0.7 *
QUEUE AT ARM B -------------- TIME SEGMENT NO. OF ENDING VEHICLES IN QUEUE 17.00 0.6 * 17.15 1.0 * 17.30 2.1 ** 17.45 2.2 ** 18.00 1.0 * 18.15 0.6 *
QUEUE AT ARM C -------------- TIME SEGMENT NO. OF ENDING VEHICLES IN QUEUE 17.00 1.0 * 17.15 1.7 ** 17.30 4.4 **** 17.45 4.6 ***** 18.00 1.7 ** 18.15 1.0 *
QUEUE AT ARM D -------------- TIME SEGMENT NO. OF ENDING VEHICLES IN QUEUE 17.00 1.0 * 17.15 1.8 ** 17.30 6.0 ****** 17.45 6.6 ******* 18.00 1.9 ** 18.15 1.1 *

-------------------------------------------------------------------------------- TRL TRL VIEWER 3.0 AC t:\M-EC Job Book\20111\capacity assessments\2021 A50-B5030 rdbt PM.vao - Page 4 -------------------------------------------------------------------------------- QUEUEING DELAY INFORMATION OVER WHOLE PERIOD -------------------------------------------- ---------------------------------------------------------------------------- I ARM I TOTAL DEMAND I * QUEUEING * I * INCLUSIVE QUEUEING * I I I I * DELAY * I * DELAY * I I I------------------------------------------------------------------I I I (VEH) (VEH/H) I (MIN) (MIN/VEH) I (MIN) (MIN/VEH) I ---------------------------------------------------------------------------- I A I 1342.4 I 894.9 I 111.8 I 0.08 I 111.8 I 0.08 I I B I 807.6 I 538.4 I 111.6 I 0.14 I 111.6 I 0.14 I I C I 1445.3 I 963.5 I 207.7 I 0.14 I 207.7 I 0.14 I I D I 1653.7 I 1102.5 I 262.7 I 0.16 I 262.7 I 0.16 I ---------------------------------------------------------------------------- I ALL I 5249.0 I 3499.3 I 693.7 I 0.13 I 693.8 I 0.13 I ---------------------------------------------------------------------------- * DELAY IS THAT OCCURRING ONLY WITHIN THE TIME PERIOD. * INCLUSIVE DELAY INCLUDES DELAY SUFFERED BY VEHICLES WHICH ARE STILL QUEUEING AFTER THE END OF THE TIME PERIOD. * THESE WILL ONLY BE SIGNIFICANTLY DIFFERENT IF THERE IS A LARGE QUEUE REMAINING AT THE END OF THE TIME PERIOD. END OF JOB ============================================= end of file ===============================================
[Printed at 12:19:11 on 05/07/2011]

-------------------------------------------------------------------------------- TRL TRL VIEWER 3.0 AC t:\M-EC Job Book\20111\capacity assessments\2021 A518-B5030 Spath rdbt AM.vao - Page 1 -------------------------------------------------------------------------------- ___________________ A R C A D Y 6 ___________________ ASSESSMENT OF ROUNDABOUT CAPACITY AND DELAY Analysis Program: Release 2.0 (MAR 2005) (c) Copyright TRL Limited, 2004 Adapted from ARCADY/3 which is Crown Copyright by permission of the controller of HMSO ______________________________________________________ For sales and distribution information, program advice and maintenance, contact: TRL Limited Tel: +44 (0) 1344 770018 Crowthorne House Fax: +44 (0) 1344 770864 Nine Mile Ride Email: [email protected] Wokingham, Berks. Web: www.trlsoftware.co.uk RG40 3GA,UK --------------------------------------------------------------------------------- THE USER OF THIS COMPUTER PROGRAM FOR THE SOLUTION OF AN ENGINEERING PROBLEM IS IN NO WAY RELIEVED OF THEIR RESPONSIBILITY FOR THE CORRECTNESS OF THE SOLUTION --------------------------------------------------------------------------------- Run with file:- "t:\M-EC Job Book\20111\capacity assessments\2021 A518-B5030 Spath rdbt AM.vai"(drive-on-the-left ) at 12:01:18 on Tuesday, 5 July 2011
FILE PROPERTIES *************** RUN TITLE: A518/B5030 Spath Rdbt LOCATION: DATE: 04/07/2011 CLIENT: ENUMERATOR: trose [TIMROSE] JOB NUMBER: 20111 STATUS: DESCRIPTION:
INPUT DATA ********** ARM A - A518 The Dove Way ARM B - A518 ARM C - B5030
GEOMETRIC DATA -------------- ----------------------------------------------------------------------------------------------------------------------- I ARM I V (M) I E (M) I L (M) I R (M) I D (M) I PHI (DEG) I SLOPE I INTERCEPT (PCU/MIN) I ----------------------------------------------------------------------------------------------------------------------- I ARM A I 4.00 I 8.00 I 30.00 I 35.00 I 58.00 I 54.0 I 0.593 I 32.218 I I ARM B I 5.00 I 6.00 I 15.00 I 45.00 I 58.00 I 53.0 I 0.549 I 27.864 I I ARM C I 4.50 I 8.00 I 30.00 I 40.00 I 58.00 I 57.0 I 0.600 I 33.131 I ----------------------------------------------------------------------------------------------------------------------- V = approach half-width L = effective flare length D = inscribed circle diameter E = entry width R = entry radius PHI = entry angle
TRAFFIC DEMAND DATA ------------------- (Only sets included in the current run are shown)
----------------------- I ARM I FLOW SCALE(%) I ----------------------- I A I 100 I I B I 100 I I C I 100 I -----------------------
TIME PERIOD BEGINS 07.45 AND ENDS 09.15
LENGTH OF TIME PERIOD - 90 MINUTES. LENGTH OF TIME SEGMENT - 15 MINUTES.

-------------------------------------------------------------------------------- TRL TRL VIEWER 3.0 AC t:\M-EC Job Book\20111\capacity assessments\2021 A518-B5030 Spath rdbt AM.vao - Page 2 -------------------------------------------------------------------------------- DEMAND FLOW PROFILES ARE SYNTHESISED FROM TURNING COUNT DATA DEMAND SET TITLE: A518/B5030 Spath Rdbt ----------------------------------------------------------------------------- I I NUMBER OF MINUTES FROM START WHEN I RATE OF FLOW (VEH/MIN) I I ARM I FLOW STARTS I TOP OF PEAK I FLOW STOPS I BEFORE I AT TOP I AFTER I I I TO RISE I IS REACHED IFALLING I PEAK I OF PEAK I PEAK I ----------------------------------------------------------------------------- I ARM A I 15.00 I 45.00 I 75.00 I 5.43 I 8.14 I 5.43 I I ARM B I 15.00 I 45.00 I 75.00 I 9.06 I 13.59 I 9.06 I I ARM C I 15.00 I 45.00 I 75.00 I 10.81 I 16.22 I 10.81 I ----------------------------------------------------------------------------- DEMAND SET TITLE: A518/B5030 Spath Rdbt
----------------------------------------------------------- I I TURNING PROPORTIONS I I I TURNING COUNTS (VEH/HR) I I I (PERCENTAGE OF H.V.S) I I -------------------------------------- I TIME I FROM/TO I ARM A I ARM B I ARM C I ----------------------------------------------------------- I 07.45 - 09.15 I I I I I I I ARM A I 0.000 I 0.558 I 0.442 I I I I 0.0 I 242.0 I 192.0 I I I I ( 10.0)I ( 10.0)I ( 10.0)I I I I I I I I I ARM B I 0.390 I 0.000 I 0.610 I I I I 283.0 I 0.0 I 442.0 I I I I ( 10.0)I ( 10.0)I ( 10.0)I I I I I I I I I ARM C I 0.190 I 0.810 I 0.000 I I I I 164.0 I 701.0 I 0.0 I I I I ( 10.0)I ( 10.0)I ( 10.0)I I I I I I I -----------------------------------------------------------
QUEUE AND DELAY INFORMATION FOR EACH 15 MIN TIME SEGMENT --------------------------------------------------------
------------------------------------------------------------------------------------------------------------------ I TIME DEMAND CAPACITY DEMAND/ PEDESTRIAN START END DELAY GEOMETRIC DELAY AVERAGE DELAY I I (VEH/MIN) (VEH/MIN) CAPACITY FLOW QUEUE QUEUE (VEH.MIN/ (VEH.MIN/ PER ARRIVING I I (RFC) (PEDS/MIN) (VEHS) (VEHS) TIME SEGMENT) TIME SEGMENT) VEHICLE (MIN) I I 07.45-08.00 I I ARM A 5.43 24.12 0.225 0.0 0.3 4.2 0.05 I I ARM B 9.06 24.02 0.377 0.0 0.6 8.8 0.07 I I ARM C 10.81 28.00 0.386 0.0 0.6 9.1 0.06 I I I ------------------------------------------------------------------------------------------------------------------
------------------------------------------------------------------------------------------------------------------ I TIME DEMAND CAPACITY DEMAND/ PEDESTRIAN START END DELAY GEOMETRIC DELAY AVERAGE DELAY I I (VEH/MIN) (VEH/MIN) CAPACITY FLOW QUEUE QUEUE (VEH.MIN/ (VEH.MIN/ PER ARRIVING I I (RFC) (PEDS/MIN) (VEHS) (VEHS) TIME SEGMENT) TIME SEGMENT) VEHICLE (MIN) I I 08.00-08.15 I I ARM A 6.48 23.10 0.280 0.3 0.4 5.7 0.06 I I ARM B 10.82 23.76 0.455 0.6 0.8 12.1 0.08 I I ARM C 12.91 27.59 0.468 0.6 0.9 12.8 0.07 I I I ------------------------------------------------------------------------------------------------------------------
------------------------------------------------------------------------------------------------------------------ I TIME DEMAND CAPACITY DEMAND/ PEDESTRIAN START END DELAY GEOMETRIC DELAY AVERAGE DELAY I I (VEH/MIN) (VEH/MIN) CAPACITY FLOW QUEUE QUEUE (VEH.MIN/ (VEH.MIN/ PER ARRIVING I I (RFC) (PEDS/MIN) (VEHS) (VEHS) TIME SEGMENT) TIME SEGMENT) VEHICLE (MIN) I I 08.15-08.30 I I ARM A 7.93 21.71 0.365 0.4 0.6 8.4 0.07 I I ARM B 13.25 23.41 0.566 0.8 1.3 18.6 0.10 I I ARM C 15.81 27.02 0.585 0.9 1.4 20.2 0.09 I I I ------------------------------------------------------------------------------------------------------------------
------------------------------------------------------------------------------------------------------------------ I TIME DEMAND CAPACITY DEMAND/ PEDESTRIAN START END DELAY GEOMETRIC DELAY AVERAGE DELAY I I (VEH/MIN) (VEH/MIN) CAPACITY FLOW QUEUE QUEUE (VEH.MIN/ (VEH.MIN/ PER ARRIVING I I (RFC) (PEDS/MIN) (VEHS) (VEHS) TIME SEGMENT) TIME SEGMENT) VEHICLE (MIN) I I 08.30-08.45 I I ARM A 7.93 21.69 0.366 0.6 0.6 8.6 0.07 I I ARM B 13.25 23.40 0.566 1.3 1.3 19.4 0.10 I I ARM C 15.81 27.01 0.585 1.4 1.4 21.0 0.09 I I I ------------------------------------------------------------------------------------------------------------------

-------------------------------------------------------------------------------- TRL TRL VIEWER 3.0 AC t:\M-EC Job Book\20111\capacity assessments\2021 A518-B5030 Spath rdbt AM.vao - Page 3 -------------------------------------------------------------------------------- ------------------------------------------------------------------------------------------------------------------ I TIME DEMAND CAPACITY DEMAND/ PEDESTRIAN START END DELAY GEOMETRIC DELAY AVERAGE DELAY I I (VEH/MIN) (VEH/MIN) CAPACITY FLOW QUEUE QUEUE (VEH.MIN/ (VEH.MIN/ PER ARRIVING I I (RFC) (PEDS/MIN) (VEHS) (VEHS) TIME SEGMENT) TIME SEGMENT) VEHICLE (MIN) I I 08.45-09.00 I I ARM A 6.48 23.07 0.281 0.6 0.4 6.0 0.06 I I ARM B 10.82 23.75 0.456 1.3 0.8 13.0 0.08 I I ARM C 12.91 27.58 0.468 1.4 0.9 13.7 0.07 I I I ------------------------------------------------------------------------------------------------------------------
------------------------------------------------------------------------------------------------------------------ I TIME DEMAND CAPACITY DEMAND/ PEDESTRIAN START END DELAY GEOMETRIC DELAY AVERAGE DELAY I I (VEH/MIN) (VEH/MIN) CAPACITY FLOW QUEUE QUEUE (VEH.MIN/ (VEH.MIN/ PER ARRIVING I I (RFC) (PEDS/MIN) (VEHS) (VEHS) TIME SEGMENT) TIME SEGMENT) VEHICLE (MIN) I I 09.00-09.15 I I ARM A 5.43 24.09 0.225 0.4 0.3 4.4 0.05 I I ARM B 9.06 24.01 0.377 0.8 0.6 9.4 0.07 I I ARM C 10.81 27.99 0.386 0.9 0.6 9.7 0.06 I I I ------------------------------------------------------------------------------------------------------------------
QUEUE AT ARM A -------------- TIME SEGMENT NO. OF ENDING VEHICLES IN QUEUE 08.00 0.3 08.15 0.4 08.30 0.6 * 08.45 0.6 * 09.00 0.4 09.15 0.3
QUEUE AT ARM B -------------- TIME SEGMENT NO. OF ENDING VEHICLES IN QUEUE 08.00 0.6 * 08.15 0.8 * 08.30 1.3 * 08.45 1.3 * 09.00 0.8 * 09.15 0.6 *
QUEUE AT ARM C -------------- TIME SEGMENT NO. OF ENDING VEHICLES IN QUEUE 08.00 0.6 * 08.15 0.9 * 08.30 1.4 * 08.45 1.4 * 09.00 0.9 * 09.15 0.6 *
QUEUEING DELAY INFORMATION OVER WHOLE PERIOD -------------------------------------------- ---------------------------------------------------------------------------- I ARM I TOTAL DEMAND I * QUEUEING * I * INCLUSIVE QUEUEING * I I I I * DELAY * I * DELAY * I I I------------------------------------------------------------------I I I (VEH) (VEH/H) I (MIN) (MIN/VEH) I (MIN) (MIN/VEH) I ---------------------------------------------------------------------------- I A I 595.1 I 396.7 I 37.4 I 0.06 I 37.4 I 0.06 I I B I 994.1 I 662.8 I 81.3 I 0.08 I 81.3 I 0.08 I I C I 1186.1 I 790.7 I 86.4 I 0.07 I 86.5 I 0.07 I ---------------------------------------------------------------------------- I ALL I 2775.3 I 1850.2 I 205.2 I 0.07 I 205.2 I 0.07 I ---------------------------------------------------------------------------- * DELAY IS THAT OCCURRING ONLY WITHIN THE TIME PERIOD. * INCLUSIVE DELAY INCLUDES DELAY SUFFERED BY VEHICLES WHICH ARE STILL QUEUEING AFTER THE END OF THE TIME PERIOD. * THESE WILL ONLY BE SIGNIFICANTLY DIFFERENT IF THERE IS A LARGE QUEUE REMAINING AT THE END OF THE TIME PERIOD. END OF JOB ============================================= end of file ===============================================

[Printed at 12:01:23 on 05/07/2011]

-------------------------------------------------------------------------------- TRL TRL VIEWER 3.0 AC t:\M-EC Job Book\20111\capacity assessments\2021 A518-B5030 Spath rdbt PM.vao - Page 1 -------------------------------------------------------------------------------- ___________________ A R C A D Y 6 ___________________ ASSESSMENT OF ROUNDABOUT CAPACITY AND DELAY Analysis Program: Release 2.0 (MAR 2005) (c) Copyright TRL Limited, 2004 Adapted from ARCADY/3 which is Crown Copyright by permission of the controller of HMSO ______________________________________________________ For sales and distribution information, program advice and maintenance, contact: TRL Limited Tel: +44 (0) 1344 770018 Crowthorne House Fax: +44 (0) 1344 770864 Nine Mile Ride Email: [email protected] Wokingham, Berks. Web: www.trlsoftware.co.uk RG40 3GA,UK --------------------------------------------------------------------------------- THE USER OF THIS COMPUTER PROGRAM FOR THE SOLUTION OF AN ENGINEERING PROBLEM IS IN NO WAY RELIEVED OF THEIR RESPONSIBILITY FOR THE CORRECTNESS OF THE SOLUTION --------------------------------------------------------------------------------- Run with file:- "t:\M-EC Job Book\20111\capacity assessments\2021 A518-B5030 Spath rdbt PM.vai"(drive-on-the-left ) at 12:05:37 on Tuesday, 5 July 2011
FILE PROPERTIES *************** RUN TITLE: A518/B5030 Spath Rdbt LOCATION: DATE: 04/07/2011 CLIENT: ENUMERATOR: trose [TIMROSE] JOB NUMBER: 20111 STATUS: DESCRIPTION:
INPUT DATA ********** ARM A - A518 The Dove Way ARM B - A518 ARM C - B5030
GEOMETRIC DATA -------------- ----------------------------------------------------------------------------------------------------------------------- I ARM I V (M) I E (M) I L (M) I R (M) I D (M) I PHI (DEG) I SLOPE I INTERCEPT (PCU/MIN) I ----------------------------------------------------------------------------------------------------------------------- I ARM A I 4.00 I 8.00 I 30.00 I 35.00 I 58.00 I 54.0 I 0.593 I 32.218 I I ARM B I 5.00 I 6.00 I 15.00 I 45.00 I 58.00 I 53.0 I 0.549 I 27.864 I I ARM C I 4.50 I 8.00 I 30.00 I 40.00 I 58.00 I 57.0 I 0.600 I 33.131 I ----------------------------------------------------------------------------------------------------------------------- V = approach half-width L = effective flare length D = inscribed circle diameter E = entry width R = entry radius PHI = entry angle
TRAFFIC DEMAND DATA ------------------- (Only sets included in the current run are shown)
----------------------- I ARM I FLOW SCALE(%) I ----------------------- I A I 100 I I B I 100 I I C I 100 I -----------------------
TIME PERIOD BEGINS 16.45 AND ENDS 18.15
LENGTH OF TIME PERIOD - 90 MINUTES. LENGTH OF TIME SEGMENT - 15 MINUTES.

-------------------------------------------------------------------------------- TRL TRL VIEWER 3.0 AC t:\M-EC Job Book\20111\capacity assessments\2021 A518-B5030 Spath rdbt PM.vao - Page 2 -------------------------------------------------------------------------------- DEMAND FLOW PROFILES ARE SYNTHESISED FROM TURNING COUNT DATA DEMAND SET TITLE: A518/B5030 Spath Rdbt ----------------------------------------------------------------------------- I I NUMBER OF MINUTES FROM START WHEN I RATE OF FLOW (VEH/MIN) I I ARM I FLOW STARTS I TOP OF PEAK I FLOW STOPS I BEFORE I AT TOP I AFTER I I I TO RISE I IS REACHED IFALLING I PEAK I OF PEAK I PEAK I ----------------------------------------------------------------------------- I ARM A I 15.00 I 45.00 I 75.00 I 4.95 I 7.42 I 4.95 I I ARM B I 15.00 I 45.00 I 75.00 I 10.48 I 15.71 I 10.48 I I ARM C I 15.00 I 45.00 I 75.00 I 15.35 I 23.03 I 15.35 I ----------------------------------------------------------------------------- DEMAND SET TITLE: A518/B5030 Spath Rdbt
----------------------------------------------------------- I I TURNING PROPORTIONS I I I TURNING COUNTS (VEH/HR) I I I (PERCENTAGE OF H.V.S) I I -------------------------------------- I TIME I FROM/TO I ARM A I ARM B I ARM C I ----------------------------------------------------------- I 16.45 - 18.15 I I I I I I I ARM A I 0.000 I 0.444 I 0.556 I I I I 0.0 I 176.0 I 220.0 I I I I ( 10.0)I ( 10.0)I ( 10.0)I I I I I I I I I ARM B I 0.304 I 0.000 I 0.696 I I I I 255.0 I 0.0 I 583.0 I I I I ( 10.0)I ( 10.0)I ( 10.0)I I I I I I I I I ARM C I 0.159 I 0.841 I 0.000 I I I I 195.0 I 1033.0 I 0.0 I I I I ( 10.0)I ( 10.0)I ( 10.0)I I I I I I I -----------------------------------------------------------
QUEUE AND DELAY INFORMATION FOR EACH 15 MIN TIME SEGMENT --------------------------------------------------------
------------------------------------------------------------------------------------------------------------------ I TIME DEMAND CAPACITY DEMAND/ PEDESTRIAN START END DELAY GEOMETRIC DELAY AVERAGE DELAY I I (VEH/MIN) (VEH/MIN) CAPACITY FLOW QUEUE QUEUE (VEH.MIN/ (VEH.MIN/ PER ARRIVING I I (RFC) (PEDS/MIN) (VEHS) (VEHS) TIME SEGMENT) TIME SEGMENT) VEHICLE (MIN) I I 16.45-17.00 I I ARM A 4.95 21.68 0.228 0.0 0.3 4.3 0.06 I I ARM B 10.48 23.83 0.440 0.0 0.8 11.3 0.07 I I ARM C 15.35 28.21 0.544 0.0 1.2 17.0 0.08 I I I ------------------------------------------------------------------------------------------------------------------
------------------------------------------------------------------------------------------------------------------ I TIME DEMAND CAPACITY DEMAND/ PEDESTRIAN START END DELAY GEOMETRIC DELAY AVERAGE DELAY I I (VEH/MIN) (VEH/MIN) CAPACITY FLOW QUEUE QUEUE (VEH.MIN/ (VEH.MIN/ PER ARRIVING I I (RFC) (PEDS/MIN) (VEHS) (VEHS) TIME SEGMENT) TIME SEGMENT) VEHICLE (MIN) I I 17.00-17.15 I I ARM A 5.91 20.17 0.293 0.3 0.4 6.1 0.07 I I ARM B 12.51 23.53 0.532 0.8 1.1 16.3 0.09 I I ARM C 18.33 27.84 0.658 1.2 1.9 27.2 0.10 I I I ------------------------------------------------------------------------------------------------------------------
------------------------------------------------------------------------------------------------------------------ I TIME DEMAND CAPACITY DEMAND/ PEDESTRIAN START END DELAY GEOMETRIC DELAY AVERAGE DELAY I I (VEH/MIN) (VEH/MIN) CAPACITY FLOW QUEUE QUEUE (VEH.MIN/ (VEH.MIN/ PER ARRIVING I I (RFC) (PEDS/MIN) (VEHS) (VEHS) TIME SEGMENT) TIME SEGMENT) VEHICLE (MIN) I I 17.15-17.30 I I ARM A 7.24 18.18 0.398 0.4 0.7 9.6 0.09 I I ARM B 15.32 23.13 0.662 1.1 1.9 27.3 0.13 I I ARM C 22.45 27.33 0.821 1.9 4.3 58.2 0.19 I I I ------------------------------------------------------------------------------------------------------------------
------------------------------------------------------------------------------------------------------------------ I TIME DEMAND CAPACITY DEMAND/ PEDESTRIAN START END DELAY GEOMETRIC DELAY AVERAGE DELAY I I (VEH/MIN) (VEH/MIN) CAPACITY FLOW QUEUE QUEUE (VEH.MIN/ (VEH.MIN/ PER ARRIVING I I (RFC) (PEDS/MIN) (VEHS) (VEHS) TIME SEGMENT) TIME SEGMENT) VEHICLE (MIN) I I 17.30-17.45 I I ARM A 7.24 18.10 0.400 0.7 0.7 9.9 0.09 I I ARM B 15.32 23.12 0.663 1.9 1.9 28.9 0.13 I I ARM C 22.45 27.32 0.822 4.3 4.4 65.8 0.20 I I I ------------------------------------------------------------------------------------------------------------------

-------------------------------------------------------------------------------- TRL TRL VIEWER 3.0 AC t:\M-EC Job Book\20111\capacity assessments\2021 A518-B5030 Spath rdbt PM.vao - Page 3 -------------------------------------------------------------------------------- ------------------------------------------------------------------------------------------------------------------ I TIME DEMAND CAPACITY DEMAND/ PEDESTRIAN START END DELAY GEOMETRIC DELAY AVERAGE DELAY I I (VEH/MIN) (VEH/MIN) CAPACITY FLOW QUEUE QUEUE (VEH.MIN/ (VEH.MIN/ PER ARRIVING I I (RFC) (PEDS/MIN) (VEHS) (VEHS) TIME SEGMENT) TIME SEGMENT) VEHICLE (MIN) I I 17.45-18.00 I I ARM A 5.91 20.07 0.295 0.7 0.4 6.4 0.07 I I ARM B 12.51 23.52 0.532 1.9 1.1 17.9 0.09 I I ARM C 18.33 27.82 0.659 4.4 2.0 31.4 0.11 I I I ------------------------------------------------------------------------------------------------------------------
------------------------------------------------------------------------------------------------------------------ I TIME DEMAND CAPACITY DEMAND/ PEDESTRIAN START END DELAY GEOMETRIC DELAY AVERAGE DELAY I I (VEH/MIN) (VEH/MIN) CAPACITY FLOW QUEUE QUEUE (VEH.MIN/ (VEH.MIN/ PER ARRIVING I I (RFC) (PEDS/MIN) (VEHS) (VEHS) TIME SEGMENT) TIME SEGMENT) VEHICLE (MIN) I I 18.00-18.15 I I ARM A 4.95 21.61 0.229 0.4 0.3 4.6 0.06 I I ARM B 10.48 23.82 0.440 1.1 0.8 12.2 0.08 I I ARM C 15.35 28.20 0.544 2.0 1.2 18.7 0.08 I I I ------------------------------------------------------------------------------------------------------------------
QUEUE AT ARM A -------------- TIME SEGMENT NO. OF ENDING VEHICLES IN QUEUE 17.00 0.3 17.15 0.4 17.30 0.7 * 17.45 0.7 * 18.00 0.4 18.15 0.3
QUEUE AT ARM B -------------- TIME SEGMENT NO. OF ENDING VEHICLES IN QUEUE 17.00 0.8 * 17.15 1.1 * 17.30 1.9 ** 17.45 1.9 ** 18.00 1.1 * 18.15 0.8 *
QUEUE AT ARM C -------------- TIME SEGMENT NO. OF ENDING VEHICLES IN QUEUE 17.00 1.2 * 17.15 1.9 ** 17.30 4.3 **** 17.45 4.4 **** 18.00 2.0 ** 18.15 1.2 *
QUEUEING DELAY INFORMATION OVER WHOLE PERIOD -------------------------------------------- ---------------------------------------------------------------------------- I ARM I TOTAL DEMAND I * QUEUEING * I * INCLUSIVE QUEUEING * I I I I * DELAY * I * DELAY * I I I------------------------------------------------------------------I I I (VEH) (VEH/H) I (MIN) (MIN/VEH) I (MIN) (MIN/VEH) I ---------------------------------------------------------------------------- I A I 543.0 I 362.0 I 40.8 I 0.08 I 40.8 I 0.08 I I B I 1149.1 I 766.0 I 114.0 I 0.10 I 114.0 I 0.10 I I C I 1683.8 I 1122.6 I 218.3 I 0.13 I 218.3 I 0.13 I ---------------------------------------------------------------------------- I ALL I 3375.9 I 2250.6 I 373.1 I 0.11 I 373.1 I 0.11 I ---------------------------------------------------------------------------- * DELAY IS THAT OCCURRING ONLY WITHIN THE TIME PERIOD. * INCLUSIVE DELAY INCLUDES DELAY SUFFERED BY VEHICLES WHICH ARE STILL QUEUEING AFTER THE END OF THE TIME PERIOD. * THESE WILL ONLY BE SIGNIFICANTLY DIFFERENT IF THERE IS A LARGE QUEUE REMAINING AT THE END OF THE TIME PERIOD. END OF JOB ============================================= end of file ===============================================

[Printed at 12:05:43 on 05/07/2011]

-------------------------------------------------------------------------------- TRL TRL VIEWER 3.0 AC t:\M-EC Job Book\20111\capacity assessments\2021 Derby Rd-Dove Walk Mini rdbt AM.vao - Page 1 -------------------------------------------------------------------------------- ___________________ A R C A D Y 6 ___________________ ASSESSMENT OF ROUNDABOUT CAPACITY AND DELAY Analysis Program: Release 2.0 (MAR 2005) (c) Copyright TRL Limited, 2004 Adapted from ARCADY/3 which is Crown Copyright by permission of the controller of HMSO ______________________________________________________ For sales and distribution information, program advice and maintenance, contact: TRL Limited Tel: +44 (0) 1344 770018 Crowthorne House Fax: +44 (0) 1344 770864 Nine Mile Ride Email: [email protected] Wokingham, Berks. Web: www.trlsoftware.co.uk RG40 3GA,UK --------------------------------------------------------------------------------- THE USER OF THIS COMPUTER PROGRAM FOR THE SOLUTION OF AN ENGINEERING PROBLEM IS IN NO WAY RELIEVED OF THEIR RESPONSIBILITY FOR THE CORRECTNESS OF THE SOLUTION --------------------------------------------------------------------------------- Run with file:- "t:\M-EC Job Book\20111\capacity assessments\2021 Derby Rd-Dove Walk Mini rdbt AM.vai"(drive-on-the-left ) at 11:31:46 on Tuesday, 5 July 2011
FILE PROPERTIES *************** RUN TITLE: The Dove Way LOCATION: DATE: 05/07/2011 CLIENT: ENUMERATOR: trose [TIMROSE] JOB NUMBER: 20111 STATUS: DESCRIPTION:
INPUT DATA ********** ARM A - Dove Walk ARM B - Dove Fields ARM C - Derby Rd SW ARM D - Derby Rd NE
MINI-ROUNDABOUT GEOMETRIC DATA ------------------------------ LIGHTING CONDITIONS : NORMAL ROAD SURFACE CONDITION: NORMAL ---------------------------------------------------------------------------------------------------------------------- I ARM I V (m) I E (m) I Lm(M) I Vm(M) I A (M) I K (M) I G (%) I SLOPE I INTERCEPT I I I I I I I I I I I (PCU/MIN) I ---------------------------------------------------------------------------------------------------------------------- I ARM A I 2.00 I 4.00 I 10.00 I 2.00 I 8.00 I 2.50 I 0.00 I 0.515 I 14.021 I I ARM B I 4.00 I 5.00 I 5.00 I 4.00 I 11.50 I 3.50 I 0.00 I 0.585 I 14.549 I I ARM C I 2.50 I 3.50 I 15.00 I 2.50 I 16.50 I 13.00 I 0.00 I 0.538 I 14.583 I I ARM D I 3.50 I 4.40 I 2.00 I 3.50 I 10.00 I 2.50 I 0.00 I 0.548 I 15.607 I ---------------------------------------------------------------------------------------------------------------------- V = approach half-width Lm = effective flare length A = distance between arms E = entry width Vm = minimum approach half-width K = entry corner kerb line G = gradient over 50m
TRAFFIC DEMAND DATA ------------------- (Only sets included in the current run are shown)
----------------------- I ARM I FLOW SCALE(%) I ----------------------- I A I 100 I I B I 100 I I C I 100 I I D I 100 I -----------------------
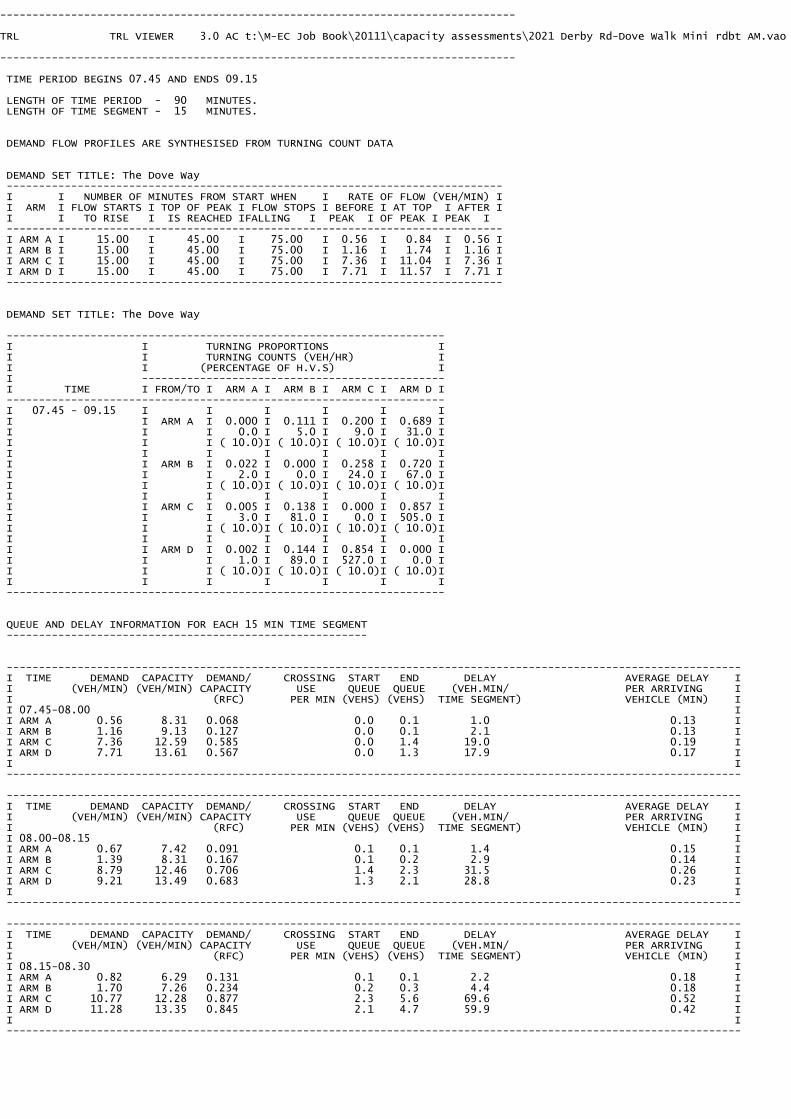
-------------------------------------------------------------------------------- TRL TRL VIEWER 3.0 AC t:\M-EC Job Book\20111\capacity assessments\2021 Derby Rd-Dove Walk Mini rdbt AM.vao - Page 2 -------------------------------------------------------------------------------- TIME PERIOD BEGINS 07.45 AND ENDS 09.15
LENGTH OF TIME PERIOD - 90 MINUTES. LENGTH OF TIME SEGMENT - 15 MINUTES.
DEMAND FLOW PROFILES ARE SYNTHESISED FROM TURNING COUNT DATA DEMAND SET TITLE: The Dove Way ----------------------------------------------------------------------------- I I NUMBER OF MINUTES FROM START WHEN I RATE OF FLOW (VEH/MIN) I I ARM I FLOW STARTS I TOP OF PEAK I FLOW STOPS I BEFORE I AT TOP I AFTER I I I TO RISE I IS REACHED IFALLING I PEAK I OF PEAK I PEAK I ----------------------------------------------------------------------------- I ARM A I 15.00 I 45.00 I 75.00 I 0.56 I 0.84 I 0.56 I I ARM B I 15.00 I 45.00 I 75.00 I 1.16 I 1.74 I 1.16 I I ARM C I 15.00 I 45.00 I 75.00 I 7.36 I 11.04 I 7.36 I I ARM D I 15.00 I 45.00 I 75.00 I 7.71 I 11.57 I 7.71 I ----------------------------------------------------------------------------- DEMAND SET TITLE: The Dove Way
-------------------------------------------------------------------- I I TURNING PROPORTIONS I I I TURNING COUNTS (VEH/HR) I I I (PERCENTAGE OF H.V.S) I I ----------------------------------------------- I TIME I FROM/TO I ARM A I ARM B I ARM C I ARM D I -------------------------------------------------------------------- I 07.45 - 09.15 I I I I I I I I ARM A I 0.000 I 0.111 I 0.200 I 0.689 I I I I 0.0 I 5.0 I 9.0 I 31.0 I I I I ( 10.0)I ( 10.0)I ( 10.0)I ( 10.0)I I I I I I I I I I ARM B I 0.022 I 0.000 I 0.258 I 0.720 I I I I 2.0 I 0.0 I 24.0 I 67.0 I I I I ( 10.0)I ( 10.0)I ( 10.0)I ( 10.0)I I I I I I I I I I ARM C I 0.005 I 0.138 I 0.000 I 0.857 I I I I 3.0 I 81.0 I 0.0 I 505.0 I I I I ( 10.0)I ( 10.0)I ( 10.0)I ( 10.0)I I I I I I I I I I ARM D I 0.002 I 0.144 I 0.854 I 0.000 I I I I 1.0 I 89.0 I 527.0 I 0.0 I I I I ( 10.0)I ( 10.0)I ( 10.0)I ( 10.0)I I I I I I I I --------------------------------------------------------------------
QUEUE AND DELAY INFORMATION FOR EACH 15 MIN TIME SEGMENT --------------------------------------------------------
------------------------------------------------------------------------------------------------------------------ I TIME DEMAND CAPACITY DEMAND/ CROSSING START END DELAY AVERAGE DELAY I I (VEH/MIN) (VEH/MIN) CAPACITY USE QUEUE QUEUE (VEH.MIN/ PER ARRIVING I I (RFC) PER MIN (VEHS) (VEHS) TIME SEGMENT) VEHICLE (MIN) I I 07.45-08.00 I I ARM A 0.56 8.31 0.068 0.0 0.1 1.0 0.13 I I ARM B 1.16 9.13 0.127 0.0 0.1 2.1 0.13 I I ARM C 7.36 12.59 0.585 0.0 1.4 19.0 0.19 I I ARM D 7.71 13.61 0.567 0.0 1.3 17.9 0.17 I I I ------------------------------------------------------------------------------------------------------------------
------------------------------------------------------------------------------------------------------------------ I TIME DEMAND CAPACITY DEMAND/ CROSSING START END DELAY AVERAGE DELAY I I (VEH/MIN) (VEH/MIN) CAPACITY USE QUEUE QUEUE (VEH.MIN/ PER ARRIVING I I (RFC) PER MIN (VEHS) (VEHS) TIME SEGMENT) VEHICLE (MIN) I I 08.00-08.15 I I ARM A 0.67 7.42 0.091 0.1 0.1 1.4 0.15 I I ARM B 1.39 8.31 0.167 0.1 0.2 2.9 0.14 I I ARM C 8.79 12.46 0.706 1.4 2.3 31.5 0.26 I I ARM D 9.21 13.49 0.683 1.3 2.1 28.8 0.23 I I I ------------------------------------------------------------------------------------------------------------------
------------------------------------------------------------------------------------------------------------------ I TIME DEMAND CAPACITY DEMAND/ CROSSING START END DELAY AVERAGE DELAY I I (VEH/MIN) (VEH/MIN) CAPACITY USE QUEUE QUEUE (VEH.MIN/ PER ARRIVING I I (RFC) PER MIN (VEHS) (VEHS) TIME SEGMENT) VEHICLE (MIN) I I 08.15-08.30 I I ARM A 0.82 6.29 0.131 0.1 0.1 2.2 0.18 I I ARM B 1.70 7.26 0.234 0.2 0.3 4.4 0.18 I I ARM C 10.77 12.28 0.877 2.3 5.6 69.6 0.52 I I ARM D 11.28 13.35 0.845 2.1 4.7 59.9 0.42 I I I ------------------------------------------------------------------------------------------------------------------
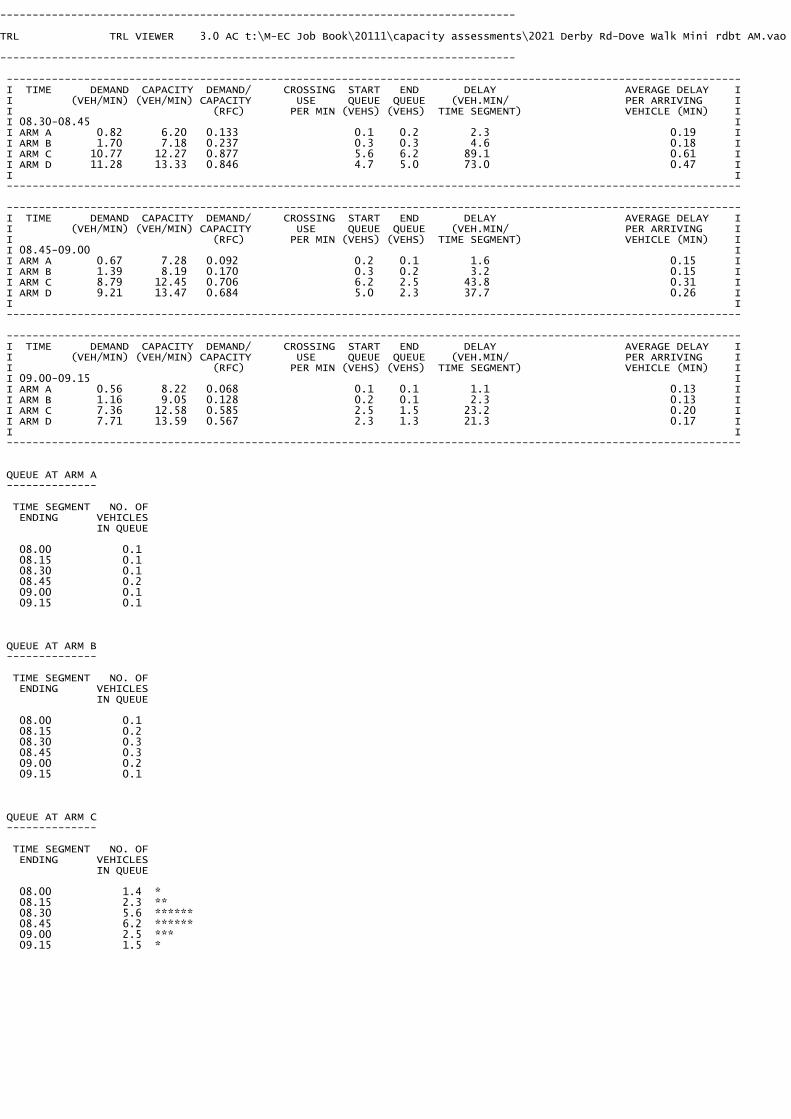
-------------------------------------------------------------------------------- TRL TRL VIEWER 3.0 AC t:\M-EC Job Book\20111\capacity assessments\2021 Derby Rd-Dove Walk Mini rdbt AM.vao - Page 3 -------------------------------------------------------------------------------- ------------------------------------------------------------------------------------------------------------------ I TIME DEMAND CAPACITY DEMAND/ CROSSING START END DELAY AVERAGE DELAY I I (VEH/MIN) (VEH/MIN) CAPACITY USE QUEUE QUEUE (VEH.MIN/ PER ARRIVING I I (RFC) PER MIN (VEHS) (VEHS) TIME SEGMENT) VEHICLE (MIN) I I 08.30-08.45 I I ARM A 0.82 6.20 0.133 0.1 0.2 2.3 0.19 I I ARM B 1.70 7.18 0.237 0.3 0.3 4.6 0.18 I I ARM C 10.77 12.27 0.877 5.6 6.2 89.1 0.61 I I ARM D 11.28 13.33 0.846 4.7 5.0 73.0 0.47 I I I ------------------------------------------------------------------------------------------------------------------
------------------------------------------------------------------------------------------------------------------ I TIME DEMAND CAPACITY DEMAND/ CROSSING START END DELAY AVERAGE DELAY I I (VEH/MIN) (VEH/MIN) CAPACITY USE QUEUE QUEUE (VEH.MIN/ PER ARRIVING I I (RFC) PER MIN (VEHS) (VEHS) TIME SEGMENT) VEHICLE (MIN) I I 08.45-09.00 I I ARM A 0.67 7.28 0.092 0.2 0.1 1.6 0.15 I I ARM B 1.39 8.19 0.170 0.3 0.2 3.2 0.15 I I ARM C 8.79 12.45 0.706 6.2 2.5 43.8 0.31 I I ARM D 9.21 13.47 0.684 5.0 2.3 37.7 0.26 I I I ------------------------------------------------------------------------------------------------------------------
------------------------------------------------------------------------------------------------------------------ I TIME DEMAND CAPACITY DEMAND/ CROSSING START END DELAY AVERAGE DELAY I I (VEH/MIN) (VEH/MIN) CAPACITY USE QUEUE QUEUE (VEH.MIN/ PER ARRIVING I I (RFC) PER MIN (VEHS) (VEHS) TIME SEGMENT) VEHICLE (MIN) I I 09.00-09.15 I I ARM A 0.56 8.22 0.068 0.1 0.1 1.1 0.13 I I ARM B 1.16 9.05 0.128 0.2 0.1 2.3 0.13 I I ARM C 7.36 12.58 0.585 2.5 1.5 23.2 0.20 I I ARM D 7.71 13.59 0.567 2.3 1.3 21.3 0.17 I I I ------------------------------------------------------------------------------------------------------------------
QUEUE AT ARM A -------------- TIME SEGMENT NO. OF ENDING VEHICLES IN QUEUE 08.00 0.1 08.15 0.1 08.30 0.1 08.45 0.2 09.00 0.1 09.15 0.1
QUEUE AT ARM B -------------- TIME SEGMENT NO. OF ENDING VEHICLES IN QUEUE 08.00 0.1 08.15 0.2 08.30 0.3 08.45 0.3 09.00 0.2 09.15 0.1
QUEUE AT ARM C -------------- TIME SEGMENT NO. OF ENDING VEHICLES IN QUEUE 08.00 1.4 * 08.15 2.3 ** 08.30 5.6 ****** 08.45 6.2 ****** 09.00 2.5 *** 09.15 1.5 *
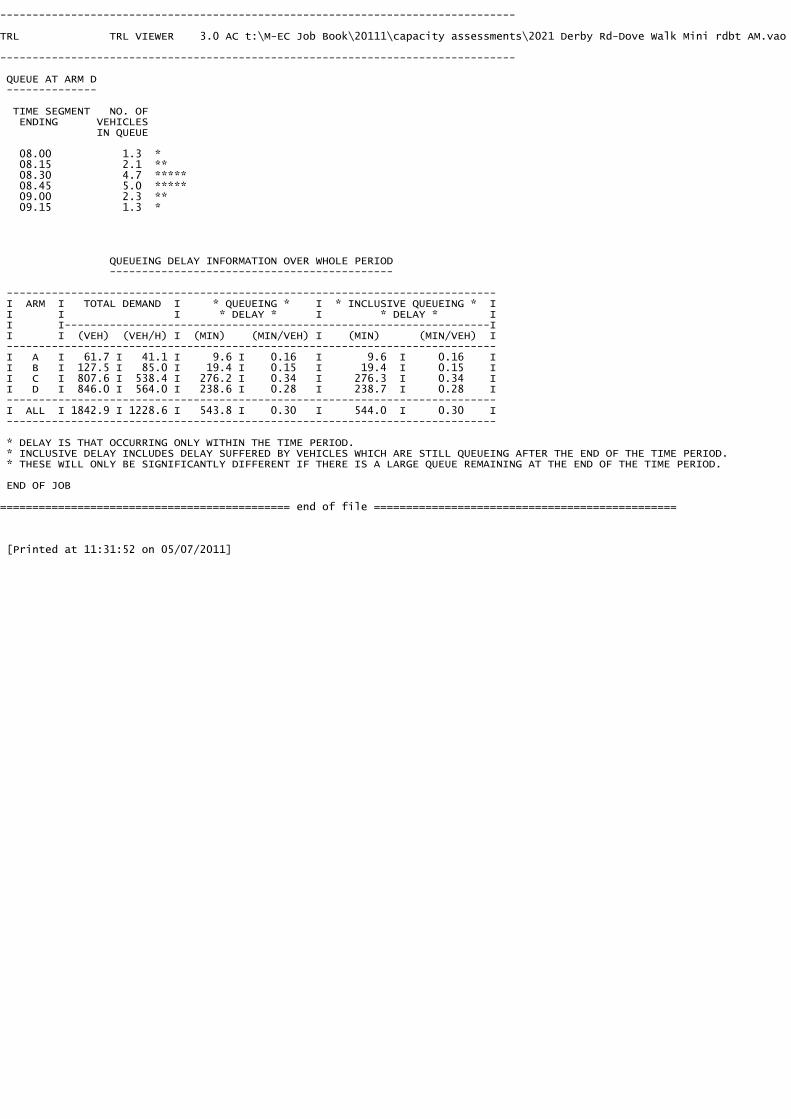
-------------------------------------------------------------------------------- TRL TRL VIEWER 3.0 AC t:\M-EC Job Book\20111\capacity assessments\2021 Derby Rd-Dove Walk Mini rdbt AM.vao - Page 4 -------------------------------------------------------------------------------- QUEUE AT ARM D -------------- TIME SEGMENT NO. OF ENDING VEHICLES IN QUEUE 08.00 1.3 * 08.15 2.1 ** 08.30 4.7 ***** 08.45 5.0 ***** 09.00 2.3 ** 09.15 1.3 *
QUEUEING DELAY INFORMATION OVER WHOLE PERIOD -------------------------------------------- ---------------------------------------------------------------------------- I ARM I TOTAL DEMAND I * QUEUEING * I * INCLUSIVE QUEUEING * I I I I * DELAY * I * DELAY * I I I------------------------------------------------------------------I I I (VEH) (VEH/H) I (MIN) (MIN/VEH) I (MIN) (MIN/VEH) I ---------------------------------------------------------------------------- I A I 61.7 I 41.1 I 9.6 I 0.16 I 9.6 I 0.16 I I B I 127.5 I 85.0 I 19.4 I 0.15 I 19.4 I 0.15 I I C I 807.6 I 538.4 I 276.2 I 0.34 I 276.3 I 0.34 I I D I 846.0 I 564.0 I 238.6 I 0.28 I 238.7 I 0.28 I ---------------------------------------------------------------------------- I ALL I 1842.9 I 1228.6 I 543.8 I 0.30 I 544.0 I 0.30 I ---------------------------------------------------------------------------- * DELAY IS THAT OCCURRING ONLY WITHIN THE TIME PERIOD. * INCLUSIVE DELAY INCLUDES DELAY SUFFERED BY VEHICLES WHICH ARE STILL QUEUEING AFTER THE END OF THE TIME PERIOD. * THESE WILL ONLY BE SIGNIFICANTLY DIFFERENT IF THERE IS A LARGE QUEUE REMAINING AT THE END OF THE TIME PERIOD. END OF JOB ============================================= end of file ===============================================
[Printed at 11:31:52 on 05/07/2011]

-------------------------------------------------------------------------------- TRL TRL VIEWER 3.0 AC t:\M-EC Job Book\20111\capacity assessments\2021 Derby Rd-Dove Walk Mini rdbt PM.vao - Page 1 -------------------------------------------------------------------------------- ___________________ A R C A D Y 6 ___________________ ASSESSMENT OF ROUNDABOUT CAPACITY AND DELAY Analysis Program: Release 2.0 (MAR 2005) (c) Copyright TRL Limited, 2004 Adapted from ARCADY/3 which is Crown Copyright by permission of the controller of HMSO ______________________________________________________ For sales and distribution information, program advice and maintenance, contact: TRL Limited Tel: +44 (0) 1344 770018 Crowthorne House Fax: +44 (0) 1344 770864 Nine Mile Ride Email: [email protected] Wokingham, Berks. Web: www.trlsoftware.co.uk RG40 3GA,UK --------------------------------------------------------------------------------- THE USER OF THIS COMPUTER PROGRAM FOR THE SOLUTION OF AN ENGINEERING PROBLEM IS IN NO WAY RELIEVED OF THEIR RESPONSIBILITY FOR THE CORRECTNESS OF THE SOLUTION --------------------------------------------------------------------------------- Run with file:- "t:\M-EC Job Book\20111\capacity assessments\2021 Derby Rd-Dove Walk Mini rdbt PM.vai"(drive-on-the-left ) at 11:49:17 on Tuesday, 5 July 2011
FILE PROPERTIES *************** RUN TITLE: The Dove Way LOCATION: DATE: 05/07/2011 CLIENT: ENUMERATOR: trose [TIMROSE] JOB NUMBER: 20111 STATUS: DESCRIPTION:
INPUT DATA ********** ARM A - Dove Walk ARM B - Dove Fields ARM C - Derby Rd SW ARM D - Derby Rd NE
MINI-ROUNDABOUT GEOMETRIC DATA ------------------------------ LIGHTING CONDITIONS : NORMAL ROAD SURFACE CONDITION: NORMAL ---------------------------------------------------------------------------------------------------------------------- I ARM I V (m) I E (m) I Lm(M) I Vm(M) I A (M) I K (M) I G (%) I SLOPE I INTERCEPT I I I I I I I I I I I (PCU/MIN) I ---------------------------------------------------------------------------------------------------------------------- I ARM A I 2.00 I 4.00 I 10.00 I 2.00 I 8.00 I 2.50 I 0.00 I 0.515 I 14.021 I I ARM B I 4.00 I 5.00 I 5.00 I 4.00 I 11.50 I 3.50 I 0.00 I 0.585 I 14.549 I I ARM C I 2.50 I 3.50 I 15.00 I 2.50 I 16.50 I 13.00 I 0.00 I 0.538 I 14.583 I I ARM D I 3.50 I 4.40 I 2.00 I 3.50 I 10.00 I 2.50 I 0.00 I 0.548 I 15.607 I ---------------------------------------------------------------------------------------------------------------------- V = approach half-width Lm = effective flare length A = distance between arms E = entry width Vm = minimum approach half-width K = entry corner kerb line G = gradient over 50m
TRAFFIC DEMAND DATA ------------------- (Only sets included in the current run are shown)
----------------------- I ARM I FLOW SCALE(%) I ----------------------- I A I 100 I I B I 100 I I C I 100 I I D I 100 I -----------------------

-------------------------------------------------------------------------------- TRL TRL VIEWER 3.0 AC t:\M-EC Job Book\20111\capacity assessments\2021 Derby Rd-Dove Walk Mini rdbt PM.vao - Page 2 -------------------------------------------------------------------------------- TIME PERIOD BEGINS 16.45 AND ENDS 18.15
LENGTH OF TIME PERIOD - 90 MINUTES. LENGTH OF TIME SEGMENT - 15 MINUTES.
DEMAND FLOW PROFILES ARE SYNTHESISED FROM TURNING COUNT DATA DEMAND SET TITLE: The Dove Way ----------------------------------------------------------------------------- I I NUMBER OF MINUTES FROM START WHEN I RATE OF FLOW (VEH/MIN) I I ARM I FLOW STARTS I TOP OF PEAK I FLOW STOPS I BEFORE I AT TOP I AFTER I I I TO RISE I IS REACHED IFALLING I PEAK I OF PEAK I PEAK I ----------------------------------------------------------------------------- I ARM A I 15.00 I 45.00 I 75.00 I 0.21 I 0.32 I 0.21 I I ARM B I 15.00 I 45.00 I 75.00 I 2.15 I 3.23 I 2.15 I I ARM C I 15.00 I 45.00 I 75.00 I 7.57 I 11.36 I 7.57 I I ARM D I 15.00 I 45.00 I 75.00 I 7.54 I 11.31 I 7.54 I ----------------------------------------------------------------------------- DEMAND SET TITLE: The Dove Way
-------------------------------------------------------------------- I I TURNING PROPORTIONS I I I TURNING COUNTS (VEH/HR) I I I (PERCENTAGE OF H.V.S) I I ----------------------------------------------- I TIME I FROM/TO I ARM A I ARM B I ARM C I ARM D I -------------------------------------------------------------------- I 16.45 - 18.15 I I I I I I I I ARM A I 0.000 I 0.353 I 0.294 I 0.353 I I I I 0.0 I 6.0 I 5.0 I 6.0 I I I I ( 10.0)I ( 10.0)I ( 10.0)I ( 10.0)I I I I I I I I I I ARM B I 0.012 I 0.000 I 0.605 I 0.384 I I I I 2.0 I 0.0 I 104.0 I 66.0 I I I I ( 10.0)I ( 10.0)I ( 10.0)I ( 10.0)I I I I I I I I I I ARM C I 0.050 I 0.092 I 0.000 I 0.858 I I I I 30.0 I 56.0 I 0.0 I 520.0 I I I I ( 10.0)I ( 10.0)I ( 10.0)I ( 10.0)I I I I I I I I I I ARM D I 0.022 I 0.056 I 0.922 I 0.000 I I I I 13.0 I 34.0 I 556.0 I 0.0 I I I I ( 10.0)I ( 10.0)I ( 10.0)I ( 10.0)I I I I I I I I --------------------------------------------------------------------
QUEUE AND DELAY INFORMATION FOR EACH 15 MIN TIME SEGMENT --------------------------------------------------------
------------------------------------------------------------------------------------------------------------------ I TIME DEMAND CAPACITY DEMAND/ CROSSING START END DELAY AVERAGE DELAY I I (VEH/MIN) (VEH/MIN) CAPACITY USE QUEUE QUEUE (VEH.MIN/ PER ARRIVING I I (RFC) PER MIN (VEHS) (VEHS) TIME SEGMENT) VEHICLE (MIN) I I 16.45-17.00 I I ARM A 0.21 8.63 0.025 0.0 0.0 0.4 0.12 I I ARM B 2.15 9.13 0.236 0.0 0.3 4.4 0.14 I I ARM C 7.57 12.76 0.593 0.0 1.4 19.7 0.19 I I ARM D 7.54 13.59 0.554 0.0 1.2 17.1 0.16 I I I ------------------------------------------------------------------------------------------------------------------
------------------------------------------------------------------------------------------------------------------ I TIME DEMAND CAPACITY DEMAND/ CROSSING START END DELAY AVERAGE DELAY I I (VEH/MIN) (VEH/MIN) CAPACITY USE QUEUE QUEUE (VEH.MIN/ PER ARRIVING I I (RFC) PER MIN (VEHS) (VEHS) TIME SEGMENT) VEHICLE (MIN) I I 17.00-17.15 I I ARM A 0.25 7.81 0.033 0.0 0.0 0.5 0.13 I I ARM B 2.57 8.31 0.309 0.3 0.4 6.4 0.17 I I ARM C 9.05 12.67 0.714 1.4 2.4 32.7 0.27 I I ARM D 9.00 13.47 0.668 1.2 1.9 27.1 0.22 I I I ------------------------------------------------------------------------------------------------------------------
------------------------------------------------------------------------------------------------------------------ I TIME DEMAND CAPACITY DEMAND/ CROSSING START END DELAY AVERAGE DELAY I I (VEH/MIN) (VEH/MIN) CAPACITY USE QUEUE QUEUE (VEH.MIN/ PER ARRIVING I I (RFC) PER MIN (VEHS) (VEHS) TIME SEGMENT) VEHICLE (MIN) I I 17.15-17.30 I I ARM A 0.31 6.75 0.046 0.0 0.0 0.7 0.16 I I ARM B 3.14 7.25 0.434 0.4 0.7 10.6 0.24 I I ARM C 11.08 12.53 0.884 2.4 5.9 72.6 0.53 I I ARM D 11.02 13.33 0.827 1.9 4.2 54.6 0.38 I I I ------------------------------------------------------------------------------------------------------------------

-------------------------------------------------------------------------------- TRL TRL VIEWER 3.0 AC t:\M-EC Job Book\20111\capacity assessments\2021 Derby Rd-Dove Walk Mini rdbt PM.vao - Page 3 -------------------------------------------------------------------------------- ------------------------------------------------------------------------------------------------------------------ I TIME DEMAND CAPACITY DEMAND/ CROSSING START END DELAY AVERAGE DELAY I I (VEH/MIN) (VEH/MIN) CAPACITY USE QUEUE QUEUE (VEH.MIN/ PER ARRIVING I I (RFC) PER MIN (VEHS) (VEHS) TIME SEGMENT) VEHICLE (MIN) I I 17.30-17.45 I I ARM A 0.31 6.68 0.047 0.0 0.0 0.7 0.16 I I ARM B 3.14 7.18 0.438 0.7 0.8 11.4 0.25 I I ARM C 11.08 12.53 0.884 5.9 6.5 93.8 0.63 I I ARM D 11.02 13.31 0.828 4.2 4.5 65.3 0.43 I I I ------------------------------------------------------------------------------------------------------------------
------------------------------------------------------------------------------------------------------------------ I TIME DEMAND CAPACITY DEMAND/ CROSSING START END DELAY AVERAGE DELAY I I (VEH/MIN) (VEH/MIN) CAPACITY USE QUEUE QUEUE (VEH.MIN/ PER ARRIVING I I (RFC) PER MIN (VEHS) (VEHS) TIME SEGMENT) VEHICLE (MIN) I I 17.45-18.00 I I ARM A 0.25 7.69 0.033 0.0 0.0 0.5 0.13 I I ARM B 2.57 8.19 0.313 0.8 0.5 7.3 0.18 I I ARM C 9.05 12.66 0.715 6.5 2.7 46.0 0.32 I I ARM D 9.00 13.45 0.669 4.5 2.1 34.7 0.24 I I I ------------------------------------------------------------------------------------------------------------------
------------------------------------------------------------------------------------------------------------------ I TIME DEMAND CAPACITY DEMAND/ CROSSING START END DELAY AVERAGE DELAY I I (VEH/MIN) (VEH/MIN) CAPACITY USE QUEUE QUEUE (VEH.MIN/ PER ARRIVING I I (RFC) PER MIN (VEHS) (VEHS) TIME SEGMENT) VEHICLE (MIN) I I 18.00-18.15 I I ARM A 0.21 8.56 0.025 0.0 0.0 0.4 0.12 I I ARM B 2.15 9.05 0.237 0.5 0.3 4.9 0.15 I I ARM C 7.57 12.76 0.594 2.7 1.5 24.1 0.20 I I ARM D 7.54 13.58 0.555 2.1 1.3 20.2 0.17 I I I ------------------------------------------------------------------------------------------------------------------
QUEUE AT ARM A -------------- TIME SEGMENT NO. OF ENDING VEHICLES IN QUEUE 17.00 0.0 17.15 0.0 17.30 0.0 17.45 0.0 18.00 0.0 18.15 0.0
QUEUE AT ARM B -------------- TIME SEGMENT NO. OF ENDING VEHICLES IN QUEUE 17.00 0.3 17.15 0.4 17.30 0.7 * 17.45 0.8 * 18.00 0.5 18.15 0.3
QUEUE AT ARM C -------------- TIME SEGMENT NO. OF ENDING VEHICLES IN QUEUE 17.00 1.4 * 17.15 2.4 ** 17.30 5.9 ****** 17.45 6.5 ******* 18.00 2.7 *** 18.15 1.5 **

-------------------------------------------------------------------------------- TRL TRL VIEWER 3.0 AC t:\M-EC Job Book\20111\capacity assessments\2021 Derby Rd-Dove Walk Mini rdbt PM.vao - Page 4 -------------------------------------------------------------------------------- QUEUE AT ARM D -------------- TIME SEGMENT NO. OF ENDING VEHICLES IN QUEUE 17.00 1.2 * 17.15 1.9 ** 17.30 4.2 **** 17.45 4.5 **** 18.00 2.1 ** 18.15 1.3 *
QUEUEING DELAY INFORMATION OVER WHOLE PERIOD -------------------------------------------- ---------------------------------------------------------------------------- I ARM I TOTAL DEMAND I * QUEUEING * I * INCLUSIVE QUEUEING * I I I I * DELAY * I * DELAY * I I I------------------------------------------------------------------I I I (VEH) (VEH/H) I (MIN) (MIN/VEH) I (MIN) (MIN/VEH) I ---------------------------------------------------------------------------- I A I 23.3 I 15.5 I 3.2 I 0.14 I 3.2 I 0.14 I I B I 235.8 I 157.2 I 44.9 I 0.19 I 44.9 I 0.19 I I C I 831.0 I 554.0 I 288.9 I 0.35 I 289.0 I 0.35 I I D I 826.8 I 551.2 I 219.1 I 0.26 I 219.1 I 0.27 I ---------------------------------------------------------------------------- I ALL I 1917.0 I 1278.0 I 556.1 I 0.29 I 556.3 I 0.29 I ---------------------------------------------------------------------------- * DELAY IS THAT OCCURRING ONLY WITHIN THE TIME PERIOD. * INCLUSIVE DELAY INCLUDES DELAY SUFFERED BY VEHICLES WHICH ARE STILL QUEUEING AFTER THE END OF THE TIME PERIOD. * THESE WILL ONLY BE SIGNIFICANTLY DIFFERENT IF THERE IS A LARGE QUEUE REMAINING AT THE END OF THE TIME PERIOD. END OF JOB ============================================= end of file ===============================================
[Printed at 11:49:22 on 05/07/2011]

-------------------------------------------------------------------------------- TRL TRL VIEWER 3.0 AC t:\M-EC Job Book\20111\capacity assessments\2021 Dove Bank-Town Meadows rdbt AM.vao - Page 1 -------------------------------------------------------------------------------- ___________________ A R C A D Y 6 ___________________ ASSESSMENT OF ROUNDABOUT CAPACITY AND DELAY Analysis Program: Release 2.0 (MAR 2005) (c) Copyright TRL Limited, 2004 Adapted from ARCADY/3 which is Crown Copyright by permission of the controller of HMSO ______________________________________________________ For sales and distribution information, program advice and maintenance, contact: TRL Limited Tel: +44 (0) 1344 770018 Crowthorne House Fax: +44 (0) 1344 770864 Nine Mile Ride Email: [email protected] Wokingham, Berks. Web: www.trlsoftware.co.uk RG40 3GA,UK --------------------------------------------------------------------------------- THE USER OF THIS COMPUTER PROGRAM FOR THE SOLUTION OF AN ENGINEERING PROBLEM IS IN NO WAY RELIEVED OF THEIR RESPONSIBILITY FOR THE CORRECTNESS OF THE SOLUTION --------------------------------------------------------------------------------- Run with file:- "t:\M-EC Job Book\20111\capacity assessments\2021 Dove Bank-Town Meadows rdbt AM.vai"(drive-on-the-left ) at 14:03:38 on Tuesday, 5 July 2011
FILE PROPERTIES *************** RUN TITLE: The Dove Way LOCATION: DATE: 05/07/2011 CLIENT: ENUMERATOR: trose [TIMROSE] JOB NUMBER: 20111 STATUS: DESCRIPTION:
INPUT DATA ********** ARM A - Retail Access ARM B - Town Meadows Way ARM C - Dove Bank ARM D - A518
GEOMETRIC DATA -------------- ----------------------------------------------------------------------------------------------------------------------- I ARM I V (M) I E (M) I L (M) I R (M) I D (M) I PHI (DEG) I SLOPE I INTERCEPT (PCU/MIN) I ----------------------------------------------------------------------------------------------------------------------- I ARM A I 4.00 I 5.00 I 5.00 I 20.00 I 40.00 I 30.0 I 0.581 I 23.279 I I ARM B I 5.00 I 7.00 I 23.00 I 25.00 I 40.00 I 60.0 I 0.634 I 30.025 I I ARM C I 3.00 I 5.00 I 30.00 I 45.00 I 40.00 I 56.0 I 0.547 I 21.994 I I ARM D I 7.00 I 7.00 I 0.00 I 15.00 I 40.00 I 64.0 I 0.628 I 30.603 I ----------------------------------------------------------------------------------------------------------------------- V = approach half-width L = effective flare length D = inscribed circle diameter E = entry width R = entry radius PHI = entry angle
TRAFFIC DEMAND DATA ------------------- (Only sets included in the current run are shown)
----------------------- I ARM I FLOW SCALE(%) I ----------------------- I A I 100 I I B I 100 I I C I 100 I I D I 100 I -----------------------
TIME PERIOD BEGINS 07.45 AND ENDS 09.15
LENGTH OF TIME PERIOD - 90 MINUTES. LENGTH OF TIME SEGMENT - 15 MINUTES.

-------------------------------------------------------------------------------- TRL TRL VIEWER 3.0 AC t:\M-EC Job Book\20111\capacity assessments\2021 Dove Bank-Town Meadows rdbt AM.vao - Page 2 -------------------------------------------------------------------------------- DEMAND FLOW PROFILES ARE SYNTHESISED FROM TURNING COUNT DATA DEMAND SET TITLE: The Dove Way ----------------------------------------------------------------------------- I I NUMBER OF MINUTES FROM START WHEN I RATE OF FLOW (VEH/MIN) I I ARM I FLOW STARTS I TOP OF PEAK I FLOW STOPS I BEFORE I AT TOP I AFTER I I I TO RISE I IS REACHED IFALLING I PEAK I OF PEAK I PEAK I ----------------------------------------------------------------------------- I ARM A I 15.00 I 45.00 I 75.00 I 1.42 I 2.14 I 1.42 I I ARM B I 15.00 I 45.00 I 75.00 I 11.81 I 17.72 I 11.81 I I ARM C I 15.00 I 45.00 I 75.00 I 4.84 I 7.26 I 4.84 I I ARM D I 15.00 I 45.00 I 75.00 I 11.66 I 17.49 I 11.66 I ----------------------------------------------------------------------------- DEMAND SET TITLE: The Dove Way
-------------------------------------------------------------------- I I TURNING PROPORTIONS I I I TURNING COUNTS (VEH/HR) I I I (PERCENTAGE OF H.V.S) I I ----------------------------------------------- I TIME I FROM/TO I ARM A I ARM B I ARM C I ARM D I -------------------------------------------------------------------- I 07.45 - 09.15 I I I I I I I I ARM A I 0.000 I 0.377 I 0.105 I 0.518 I I I I 0.0 I 43.0 I 12.0 I 59.0 I I I I ( 10.0)I ( 10.0)I ( 10.0)I ( 10.0)I I I I I I I I I I ARM B I 0.091 I 0.000 I 0.107 I 0.802 I I I I 86.0 I 0.0 I 101.0 I 758.0 I I I I ( 10.0)I ( 10.0)I ( 10.0)I ( 10.0)I I I I I I I I I I ARM C I 0.194 I 0.437 I 0.000 I 0.370 I I I I 75.0 I 169.0 I 0.0 I 143.0 I I I I ( 10.0)I ( 10.0)I ( 10.0)I ( 10.0)I I I I I I I I I I ARM D I 0.045 I 0.743 I 0.212 I 0.000 I I I I 42.0 I 693.0 I 198.0 I 0.0 I I I I ( 10.0)I ( 10.0)I ( 10.0)I ( 10.0)I I I I I I I I --------------------------------------------------------------------
QUEUE AND DELAY INFORMATION FOR EACH 15 MIN TIME SEGMENT --------------------------------------------------------
------------------------------------------------------------------------------------------------------------------ I TIME DEMAND CAPACITY DEMAND/ PEDESTRIAN START END DELAY GEOMETRIC DELAY AVERAGE DELAY I I (VEH/MIN) (VEH/MIN) CAPACITY FLOW QUEUE QUEUE (VEH.MIN/ (VEH.MIN/ PER ARRIVING I I (RFC) (PEDS/MIN) (VEHS) (VEHS) TIME SEGMENT) TIME SEGMENT) VEHICLE (MIN) I I 07.45-08.00 I I ARM A 1.42 13.50 0.106 0.0 0.1 1.7 0.08 I I ARM B 11.81 25.18 0.469 0.0 0.9 12.7 0.07 I I ARM C 4.84 13.85 0.349 0.0 0.5 7.7 0.11 I I ARM D 11.66 25.25 0.462 0.0 0.9 12.4 0.07 I I I ------------------------------------------------------------------------------------------------------------------
------------------------------------------------------------------------------------------------------------------ I TIME DEMAND CAPACITY DEMAND/ PEDESTRIAN START END DELAY GEOMETRIC DELAY AVERAGE DELAY I I (VEH/MIN) (VEH/MIN) CAPACITY FLOW QUEUE QUEUE (VEH.MIN/ (VEH.MIN/ PER ARRIVING I I (RFC) (PEDS/MIN) (VEHS) (VEHS) TIME SEGMENT) TIME SEGMENT) VEHICLE (MIN) I I 08.00-08.15 I I ARM A 1.70 11.99 0.142 0.1 0.2 2.4 0.10 I I ARM B 14.11 24.76 0.570 0.9 1.3 19.0 0.09 I I ARM C 5.78 12.64 0.457 0.5 0.8 11.9 0.14 I I ARM D 13.93 24.74 0.563 0.9 1.3 18.5 0.09 I I I ------------------------------------------------------------------------------------------------------------------
------------------------------------------------------------------------------------------------------------------ I TIME DEMAND CAPACITY DEMAND/ PEDESTRIAN START END DELAY GEOMETRIC DELAY AVERAGE DELAY I I (VEH/MIN) (VEH/MIN) CAPACITY FLOW QUEUE QUEUE (VEH.MIN/ (VEH.MIN/ PER ARRIVING I I (RFC) (PEDS/MIN) (VEHS) (VEHS) TIME SEGMENT) TIME SEGMENT) VEHICLE (MIN) I I 08.15-08.30 I I ARM A 2.08 9.95 0.209 0.2 0.3 3.8 0.13 I I ARM B 17.28 24.19 0.714 1.3 2.4 34.1 0.14 I I ARM C 7.07 11.01 0.643 0.8 1.7 23.9 0.25 I I ARM D 17.06 24.06 0.709 1.3 2.4 33.3 0.14 I I I ------------------------------------------------------------------------------------------------------------------
------------------------------------------------------------------------------------------------------------------ I TIME DEMAND CAPACITY DEMAND/ PEDESTRIAN START END DELAY GEOMETRIC DELAY AVERAGE DELAY I I (VEH/MIN) (VEH/MIN) CAPACITY FLOW QUEUE QUEUE (VEH.MIN/ (VEH.MIN/ PER ARRIVING I I (RFC) (PEDS/MIN) (VEHS) (VEHS) TIME SEGMENT) TIME SEGMENT) VEHICLE (MIN) I I 08.30-08.45 I I ARM A 2.08 9.90 0.210 0.3 0.3 4.0 0.13 I I ARM B 17.28 24.18 0.714 2.4 2.5 36.7 0.14 I I ARM C 7.07 10.97 0.645 1.7 1.8 26.3 0.26 I I ARM D 17.06 24.03 0.710 2.4 2.4 35.8 0.14 I I I ------------------------------------------------------------------------------------------------------------------

-------------------------------------------------------------------------------- TRL TRL VIEWER 3.0 AC t:\M-EC Job Book\20111\capacity assessments\2021 Dove Bank-Town Meadows rdbt AM.vao - Page 3 -------------------------------------------------------------------------------- ------------------------------------------------------------------------------------------------------------------ I TIME DEMAND CAPACITY DEMAND/ PEDESTRIAN START END DELAY GEOMETRIC DELAY AVERAGE DELAY I I (VEH/MIN) (VEH/MIN) CAPACITY FLOW QUEUE QUEUE (VEH.MIN/ (VEH.MIN/ PER ARRIVING I I (RFC) (PEDS/MIN) (VEHS) (VEHS) TIME SEGMENT) TIME SEGMENT) VEHICLE (MIN) I I 08.45-09.00 I I ARM A 1.70 11.91 0.143 0.3 0.2 2.6 0.10 I I ARM B 14.11 24.74 0.570 2.5 1.3 21.0 0.10 I I ARM C 5.78 12.59 0.459 1.8 0.9 13.6 0.15 I I ARM D 13.93 24.70 0.564 2.4 1.3 20.5 0.09 I I I ------------------------------------------------------------------------------------------------------------------
------------------------------------------------------------------------------------------------------------------ I TIME DEMAND CAPACITY DEMAND/ PEDESTRIAN START END DELAY GEOMETRIC DELAY AVERAGE DELAY I I (VEH/MIN) (VEH/MIN) CAPACITY FLOW QUEUE QUEUE (VEH.MIN/ (VEH.MIN/ PER ARRIVING I I (RFC) (PEDS/MIN) (VEHS) (VEHS) TIME SEGMENT) TIME SEGMENT) VEHICLE (MIN) I I 09.00-09.15 I I ARM A 1.42 13.44 0.106 0.2 0.1 1.8 0.08 I I ARM B 11.81 25.16 0.470 1.3 0.9 13.8 0.08 I I ARM C 4.84 13.81 0.350 0.9 0.5 8.5 0.11 I I ARM D 11.66 25.22 0.462 1.3 0.9 13.4 0.07 I I I ------------------------------------------------------------------------------------------------------------------
QUEUE AT ARM A -------------- TIME SEGMENT NO. OF ENDING VEHICLES IN QUEUE 08.00 0.1 08.15 0.2 08.30 0.3 08.45 0.3 09.00 0.2 09.15 0.1
QUEUE AT ARM B -------------- TIME SEGMENT NO. OF ENDING VEHICLES IN QUEUE 08.00 0.9 * 08.15 1.3 * 08.30 2.4 ** 08.45 2.5 ** 09.00 1.3 * 09.15 0.9 *
QUEUE AT ARM C -------------- TIME SEGMENT NO. OF ENDING VEHICLES IN QUEUE 08.00 0.5 * 08.15 0.8 * 08.30 1.7 ** 08.45 1.8 ** 09.00 0.9 * 09.15 0.5 *
QUEUE AT ARM D -------------- TIME SEGMENT NO. OF ENDING VEHICLES IN QUEUE 08.00 0.9 * 08.15 1.3 * 08.30 2.4 ** 08.45 2.4 ** 09.00 1.3 * 09.15 0.9 *

-------------------------------------------------------------------------------- TRL TRL VIEWER 3.0 AC t:\M-EC Job Book\20111\capacity assessments\2021 Dove Bank-Town Meadows rdbt AM.vao - Page 4 -------------------------------------------------------------------------------- QUEUEING DELAY INFORMATION OVER WHOLE PERIOD -------------------------------------------- ---------------------------------------------------------------------------- I ARM I TOTAL DEMAND I * QUEUEING * I * INCLUSIVE QUEUEING * I I I I * DELAY * I * DELAY * I I I------------------------------------------------------------------I I I (VEH) (VEH/H) I (MIN) (MIN/VEH) I (MIN) (MIN/VEH) I ---------------------------------------------------------------------------- I A I 156.3 I 104.2 I 16.3 I 0.10 I 16.3 I 0.10 I I B I 1295.8 I 863.9 I 137.2 I 0.11 I 137.3 I 0.11 I I C I 530.7 I 353.8 I 91.8 I 0.17 I 91.9 I 0.17 I I D I 1279.3 I 852.9 I 133.8 I 0.10 I 133.8 I 0.10 I ---------------------------------------------------------------------------- I ALL I 3262.1 I 2174.7 I 379.2 I 0.12 I 379.3 I 0.12 I ---------------------------------------------------------------------------- * DELAY IS THAT OCCURRING ONLY WITHIN THE TIME PERIOD. * INCLUSIVE DELAY INCLUDES DELAY SUFFERED BY VEHICLES WHICH ARE STILL QUEUEING AFTER THE END OF THE TIME PERIOD. * THESE WILL ONLY BE SIGNIFICANTLY DIFFERENT IF THERE IS A LARGE QUEUE REMAINING AT THE END OF THE TIME PERIOD. END OF JOB ============================================= end of file ===============================================
[Printed at 14:05:20 on 05/07/2011]

-------------------------------------------------------------------------------- TRL TRL VIEWER 3.0 AC t:\M-EC Job Book\20111\capacity assessments\2021 Dove Bank-Town Meadows rdbt PM.vao - Page 1 -------------------------------------------------------------------------------- ___________________ A R C A D Y 6 ___________________ ASSESSMENT OF ROUNDABOUT CAPACITY AND DELAY Analysis Program: Release 2.0 (MAR 2005) (c) Copyright TRL Limited, 2004 Adapted from ARCADY/3 which is Crown Copyright by permission of the controller of HMSO ______________________________________________________ For sales and distribution information, program advice and maintenance, contact: TRL Limited Tel: +44 (0) 1344 770018 Crowthorne House Fax: +44 (0) 1344 770864 Nine Mile Ride Email: [email protected] Wokingham, Berks. Web: www.trlsoftware.co.uk RG40 3GA,UK --------------------------------------------------------------------------------- THE USER OF THIS COMPUTER PROGRAM FOR THE SOLUTION OF AN ENGINEERING PROBLEM IS IN NO WAY RELIEVED OF THEIR RESPONSIBILITY FOR THE CORRECTNESS OF THE SOLUTION --------------------------------------------------------------------------------- Run with file:- "t:\M-EC Job Book\20111\capacity assessments\2021 Dove Bank-Town Meadows rdbt PM.vai"(drive-on-the-left ) at 14:12:40 on Tuesday, 5 July 2011
FILE PROPERTIES *************** RUN TITLE: The Dove Way LOCATION: DATE: 05/07/2011 CLIENT: ENUMERATOR: trose [TIMROSE] JOB NUMBER: 20111 STATUS: DESCRIPTION:
INPUT DATA ********** ARM A - Retail Access ARM B - Town Meadows Way ARM C - Dove Bank ARM D - A518
GEOMETRIC DATA -------------- ----------------------------------------------------------------------------------------------------------------------- I ARM I V (M) I E (M) I L (M) I R (M) I D (M) I PHI (DEG) I SLOPE I INTERCEPT (PCU/MIN) I ----------------------------------------------------------------------------------------------------------------------- I ARM A I 4.00 I 5.00 I 5.00 I 20.00 I 40.00 I 30.0 I 0.581 I 23.279 I I ARM B I 5.00 I 7.00 I 23.00 I 25.00 I 40.00 I 60.0 I 0.634 I 30.025 I I ARM C I 3.00 I 5.00 I 30.00 I 45.00 I 40.00 I 56.0 I 0.547 I 21.994 I I ARM D I 7.00 I 7.00 I 0.00 I 15.00 I 40.00 I 64.0 I 0.628 I 30.603 I ----------------------------------------------------------------------------------------------------------------------- V = approach half-width L = effective flare length D = inscribed circle diameter E = entry width R = entry radius PHI = entry angle
TRAFFIC DEMAND DATA ------------------- (Only sets included in the current run are shown)
----------------------- I ARM I FLOW SCALE(%) I ----------------------- I A I 100 I I B I 100 I I C I 100 I I D I 100 I -----------------------
TIME PERIOD BEGINS 16.45 AND ENDS 18.15
LENGTH OF TIME PERIOD - 90 MINUTES. LENGTH OF TIME SEGMENT - 15 MINUTES.

-------------------------------------------------------------------------------- TRL TRL VIEWER 3.0 AC t:\M-EC Job Book\20111\capacity assessments\2021 Dove Bank-Town Meadows rdbt PM.vao - Page 2 -------------------------------------------------------------------------------- DEMAND FLOW PROFILES ARE SYNTHESISED FROM TURNING COUNT DATA DEMAND SET TITLE: The Dove Way ----------------------------------------------------------------------------- I I NUMBER OF MINUTES FROM START WHEN I RATE OF FLOW (VEH/MIN) I I ARM I FLOW STARTS I TOP OF PEAK I FLOW STOPS I BEFORE I AT TOP I AFTER I I I TO RISE I IS REACHED IFALLING I PEAK I OF PEAK I PEAK I ----------------------------------------------------------------------------- I ARM A I 15.00 I 45.00 I 75.00 I 2.64 I 3.96 I 2.64 I I ARM B I 15.00 I 45.00 I 75.00 I 11.31 I 16.97 I 11.31 I I ARM C I 15.00 I 45.00 I 75.00 I 7.29 I 10.93 I 7.29 I I ARM D I 15.00 I 45.00 I 75.00 I 13.36 I 20.04 I 13.36 I ----------------------------------------------------------------------------- DEMAND SET TITLE: The Dove Way
-------------------------------------------------------------------- I I TURNING PROPORTIONS I I I TURNING COUNTS (VEH/HR) I I I (PERCENTAGE OF H.V.S) I I ----------------------------------------------- I TIME I FROM/TO I ARM A I ARM B I ARM C I ARM D I -------------------------------------------------------------------- I 16.45 - 18.15 I I I I I I I I ARM A I 0.000 I 0.436 I 0.156 I 0.408 I I I I 0.0 I 92.0 I 33.0 I 86.0 I I I I ( 10.0)I ( 10.0)I ( 10.0)I ( 10.0)I I I I I I I I I I ARM B I 0.122 I 0.000 I 0.199 I 0.680 I I I I 110.0 I 0.0 I 180.0 I 615.0 I I I I ( 10.0)I ( 10.0)I ( 10.0)I ( 10.0)I I I I I I I I I I ARM C I 0.206 I 0.379 I 0.000 I 0.415 I I I I 120.0 I 221.0 I 0.0 I 242.0 I I I I ( 10.0)I ( 10.0)I ( 10.0)I ( 10.0)I I I I I I I I I I ARM D I 0.066 I 0.765 I 0.168 I 0.000 I I I I 71.0 I 818.0 I 180.0 I 0.0 I I I I ( 10.0)I ( 10.0)I ( 10.0)I ( 10.0)I I I I I I I I --------------------------------------------------------------------
QUEUE AND DELAY INFORMATION FOR EACH 15 MIN TIME SEGMENT --------------------------------------------------------
------------------------------------------------------------------------------------------------------------------ I TIME DEMAND CAPACITY DEMAND/ PEDESTRIAN START END DELAY GEOMETRIC DELAY AVERAGE DELAY I I (VEH/MIN) (VEH/MIN) CAPACITY FLOW QUEUE QUEUE (VEH.MIN/ (VEH.MIN/ PER ARRIVING I I (RFC) (PEDS/MIN) (VEHS) (VEHS) TIME SEGMENT) TIME SEGMENT) VEHICLE (MIN) I I 16.45-17.00 I I ARM A 2.64 12.36 0.213 0.0 0.3 3.9 0.10 I I ARM B 11.31 24.94 0.454 0.0 0.8 11.9 0.07 I I ARM C 7.29 14.48 0.503 0.0 1.0 14.1 0.14 I I ARM D 13.36 24.31 0.550 0.0 1.2 17.3 0.09 I I I ------------------------------------------------------------------------------------------------------------------
------------------------------------------------------------------------------------------------------------------ I TIME DEMAND CAPACITY DEMAND/ PEDESTRIAN START END DELAY GEOMETRIC DELAY AVERAGE DELAY I I (VEH/MIN) (VEH/MIN) CAPACITY FLOW QUEUE QUEUE (VEH.MIN/ (VEH.MIN/ PER ARRIVING I I (RFC) (PEDS/MIN) (VEHS) (VEHS) TIME SEGMENT) TIME SEGMENT) VEHICLE (MIN) I I 17.00-17.15 I I ARM A 3.15 10.63 0.296 0.3 0.4 6.0 0.13 I I ARM B 13.51 24.48 0.552 0.8 1.2 17.7 0.09 I I ARM C 8.70 13.39 0.650 1.0 1.8 25.1 0.21 I I ARM D 15.96 23.61 0.676 1.2 2.0 28.9 0.13 I I I ------------------------------------------------------------------------------------------------------------------
------------------------------------------------------------------------------------------------------------------ I TIME DEMAND CAPACITY DEMAND/ PEDESTRIAN START END DELAY GEOMETRIC DELAY AVERAGE DELAY I I (VEH/MIN) (VEH/MIN) CAPACITY FLOW QUEUE QUEUE (VEH.MIN/ (VEH.MIN/ PER ARRIVING I I (RFC) (PEDS/MIN) (VEHS) (VEHS) TIME SEGMENT) TIME SEGMENT) VEHICLE (MIN) I I 17.15-17.30 I I ARM A 3.86 8.41 0.459 0.4 0.8 11.7 0.22 I I ARM B 16.54 23.87 0.693 1.2 2.2 31.1 0.13 I I ARM C 10.66 11.92 0.894 1.8 6.2 73.8 0.56 I I ARM D 19.54 22.76 0.859 2.0 5.4 70.0 0.27 I I I ------------------------------------------------------------------------------------------------------------------
------------------------------------------------------------------------------------------------------------------ I TIME DEMAND CAPACITY DEMAND/ PEDESTRIAN START END DELAY GEOMETRIC DELAY AVERAGE DELAY I I (VEH/MIN) (VEH/MIN) CAPACITY FLOW QUEUE QUEUE (VEH.MIN/ (VEH.MIN/ PER ARRIVING I I (RFC) (PEDS/MIN) (VEHS) (VEHS) TIME SEGMENT) TIME SEGMENT) VEHICLE (MIN) I I 17.30-17.45 I I ARM A 3.86 8.25 0.468 0.8 0.9 12.8 0.23 I I ARM B 16.54 23.84 0.694 2.2 2.2 33.3 0.14 I I ARM C 10.66 11.89 0.896 6.2 7.1 100.5 0.71 I I ARM D 19.54 22.67 0.862 5.4 5.8 84.5 0.31 I I I ------------------------------------------------------------------------------------------------------------------

-------------------------------------------------------------------------------- TRL TRL VIEWER 3.0 AC t:\M-EC Job Book\20111\capacity assessments\2021 Dove Bank-Town Meadows rdbt PM.vao - Page 3 -------------------------------------------------------------------------------- ------------------------------------------------------------------------------------------------------------------ I TIME DEMAND CAPACITY DEMAND/ PEDESTRIAN START END DELAY GEOMETRIC DELAY AVERAGE DELAY I I (VEH/MIN) (VEH/MIN) CAPACITY FLOW QUEUE QUEUE (VEH.MIN/ (VEH.MIN/ PER ARRIVING I I (RFC) (PEDS/MIN) (VEHS) (VEHS) TIME SEGMENT) TIME SEGMENT) VEHICLE (MIN) I I 17.45-18.00 I I ARM A 3.15 10.38 0.303 0.9 0.4 6.9 0.14 I I ARM B 13.51 24.43 0.553 2.2 1.3 19.5 0.09 I I ARM C 8.70 13.34 0.652 7.1 2.0 35.4 0.25 I I ARM D 15.96 23.46 0.680 5.8 2.2 35.9 0.14 I I I ------------------------------------------------------------------------------------------------------------------
------------------------------------------------------------------------------------------------------------------ I TIME DEMAND CAPACITY DEMAND/ PEDESTRIAN START END DELAY GEOMETRIC DELAY AVERAGE DELAY I I (VEH/MIN) (VEH/MIN) CAPACITY FLOW QUEUE QUEUE (VEH.MIN/ (VEH.MIN/ PER ARRIVING I I (RFC) (PEDS/MIN) (VEHS) (VEHS) TIME SEGMENT) TIME SEGMENT) VEHICLE (MIN) I I 18.00-18.15 I I ARM A 2.64 12.26 0.215 0.4 0.3 4.3 0.10 I I ARM B 11.31 24.92 0.454 1.3 0.8 12.9 0.07 I I ARM C 7.29 14.44 0.505 2.0 1.0 16.4 0.14 I I ARM D 13.36 24.25 0.551 2.2 1.2 19.4 0.09 I I I ------------------------------------------------------------------------------------------------------------------
QUEUE AT ARM A -------------- TIME SEGMENT NO. OF ENDING VEHICLES IN QUEUE 17.00 0.3 17.15 0.4 17.30 0.8 * 17.45 0.9 * 18.00 0.4 18.15 0.3
QUEUE AT ARM B -------------- TIME SEGMENT NO. OF ENDING VEHICLES IN QUEUE 17.00 0.8 * 17.15 1.2 * 17.30 2.2 ** 17.45 2.2 ** 18.00 1.3 * 18.15 0.8 *
QUEUE AT ARM C -------------- TIME SEGMENT NO. OF ENDING VEHICLES IN QUEUE 17.00 1.0 * 17.15 1.8 ** 17.30 6.2 ****** 17.45 7.1 ******* 18.00 2.0 ** 18.15 1.0 *
QUEUE AT ARM D -------------- TIME SEGMENT NO. OF ENDING VEHICLES IN QUEUE 17.00 1.2 * 17.15 2.0 ** 17.30 5.4 ***** 17.45 5.8 ****** 18.00 2.2 ** 18.15 1.2 *

-------------------------------------------------------------------------------- TRL TRL VIEWER 3.0 AC t:\M-EC Job Book\20111\capacity assessments\2021 Dove Bank-Town Meadows rdbt PM.vao - Page 4 -------------------------------------------------------------------------------- QUEUEING DELAY INFORMATION OVER WHOLE PERIOD -------------------------------------------- ---------------------------------------------------------------------------- I ARM I TOTAL DEMAND I * QUEUEING * I * INCLUSIVE QUEUEING * I I I I * DELAY * I * DELAY * I I I------------------------------------------------------------------I I I (VEH) (VEH/H) I (MIN) (MIN/VEH) I (MIN) (MIN/VEH) I ---------------------------------------------------------------------------- I A I 289.3 I 192.9 I 45.6 I 0.16 I 45.6 I 0.16 I I B I 1240.9 I 827.3 I 126.5 I 0.10 I 126.5 I 0.10 I I C I 799.4 I 532.9 I 265.3 I 0.33 I 265.3 I 0.33 I I D I 1465.8 I 977.2 I 256.1 I 0.17 I 256.1 I 0.17 I ---------------------------------------------------------------------------- I ALL I 3795.5 I 2530.3 I 693.4 I 0.18 I 693.5 I 0.18 I ---------------------------------------------------------------------------- * DELAY IS THAT OCCURRING ONLY WITHIN THE TIME PERIOD. * INCLUSIVE DELAY INCLUDES DELAY SUFFERED BY VEHICLES WHICH ARE STILL QUEUEING AFTER THE END OF THE TIME PERIOD. * THESE WILL ONLY BE SIGNIFICANTLY DIFFERENT IF THERE IS A LARGE QUEUE REMAINING AT THE END OF THE TIME PERIOD. END OF JOB ============================================= end of file ===============================================
[Printed at 14:12:45 on 05/07/2011]

-------------------------------------------------------------------------------- TRL TRL VIEWER 3.0 AC t:\M-EC Job Book\20111\capacity assessments\2021 Dove Way-Derby Rd rdbt AM.vao - Page 1 -------------------------------------------------------------------------------- ___________________ A R C A D Y 6 ___________________ ASSESSMENT OF ROUNDABOUT CAPACITY AND DELAY Analysis Program: Release 2.0 (MAR 2005) (c) Copyright TRL Limited, 2004 Adapted from ARCADY/3 which is Crown Copyright by permission of the controller of HMSO ______________________________________________________ For sales and distribution information, program advice and maintenance, contact: TRL Limited Tel: +44 (0) 1344 770018 Crowthorne House Fax: +44 (0) 1344 770864 Nine Mile Ride Email: [email protected] Wokingham, Berks. Web: www.trlsoftware.co.uk RG40 3GA,UK --------------------------------------------------------------------------------- THE USER OF THIS COMPUTER PROGRAM FOR THE SOLUTION OF AN ENGINEERING PROBLEM IS IN NO WAY RELIEVED OF THEIR RESPONSIBILITY FOR THE CORRECTNESS OF THE SOLUTION --------------------------------------------------------------------------------- Run with file:- "t:\M-EC Job Book\20111\capacity assessments\2021 Dove Way-Derby Rd rdbt AM.vai"(drive-on-the-left ) at 13:48:09 on Tuesday, 5 July 2011
FILE PROPERTIES *************** RUN TITLE: The Dove Way LOCATION: DATE: 05/07/2011 CLIENT: ENUMERATOR: trose [TIMROSE] JOB NUMBER: 20111 STATUS: DESCRIPTION:
INPUT DATA ********** ARM A - A518 Derby Road ARM B - A518 South ARM C - Access Road ARM D - The Dove Way
GEOMETRIC DATA -------------- ----------------------------------------------------------------------------------------------------------------------- I ARM I V (M) I E (M) I L (M) I R (M) I D (M) I PHI (DEG) I SLOPE I INTERCEPT (PCU/MIN) I ----------------------------------------------------------------------------------------------------------------------- I ARM A I 3.00 I 7.00 I 15.00 I 30.00 I 38.00 I 57.0 I 0.571 I 24.033 I I ARM B I 3.50 I 7.00 I 0.00 I 10.00 I 38.00 I 70.0 I 0.594 I 28.715 I I ARM C I 2.50 I 5.00 I 10.00 I 25.00 I 38.00 I 40.0 I 0.528 I 19.149 I I ARM D I 5.50 I 10.00 I 20.00 I 25.00 I 38.00 I 56.0 I 0.735 I 37.690 I ----------------------------------------------------------------------------------------------------------------------- V = approach half-width L = effective flare length D = inscribed circle diameter E = entry width R = entry radius PHI = entry angle
TRAFFIC DEMAND DATA ------------------- (Only sets included in the current run are shown)
----------------------- I ARM I FLOW SCALE(%) I ----------------------- I A I 100 I I B I 100 I I C I 100 I I D I 100 I -----------------------
TIME PERIOD BEGINS 07.45 AND ENDS 09.15
LENGTH OF TIME PERIOD - 90 MINUTES. LENGTH OF TIME SEGMENT - 15 MINUTES.

-------------------------------------------------------------------------------- TRL TRL VIEWER 3.0 AC t:\M-EC Job Book\20111\capacity assessments\2021 Dove Way-Derby Rd rdbt AM.vao - Page 2 -------------------------------------------------------------------------------- DEMAND FLOW PROFILES ARE SYNTHESISED FROM TURNING COUNT DATA DEMAND SET TITLE: The Dove Way ----------------------------------------------------------------------------- I I NUMBER OF MINUTES FROM START WHEN I RATE OF FLOW (VEH/MIN) I I ARM I FLOW STARTS I TOP OF PEAK I FLOW STOPS I BEFORE I AT TOP I AFTER I I I TO RISE I IS REACHED IFALLING I PEAK I OF PEAK I PEAK I ----------------------------------------------------------------------------- I ARM A I 15.00 I 45.00 I 75.00 I 6.93 I 10.39 I 6.93 I I ARM B I 15.00 I 45.00 I 75.00 I 12.00 I 18.00 I 12.00 I I ARM C I 15.00 I 45.00 I 75.00 I 0.04 I 0.06 I 0.04 I I ARM D I 15.00 I 45.00 I 75.00 I 5.36 I 8.04 I 5.36 I ----------------------------------------------------------------------------- DEMAND SET TITLE: The Dove Way
-------------------------------------------------------------------- I I TURNING PROPORTIONS I I I TURNING COUNTS (VEH/HR) I I I (PERCENTAGE OF H.V.S) I I ----------------------------------------------- I TIME I FROM/TO I ARM A I ARM B I ARM C I ARM D I -------------------------------------------------------------------- I 07.45 - 09.15 I I I I I I I I ARM A I 0.000 I 0.946 I 0.002 I 0.052 I I I I 0.0 I 524.0 I 1.0 I 29.0 I I I I ( 10.0)I ( 10.0)I ( 10.0)I ( 10.0)I I I I I I I I I I ARM B I 0.585 I 0.000 I 0.000 I 0.415 I I I I 562.0 I 0.0 I 0.0 I 398.0 I I I I ( 10.0)I ( 10.0)I ( 10.0)I ( 10.0)I I I I I I I I I I ARM C I 0.667 I 0.333 I 0.000 I 0.000 I I I I 2.0 I 1.0 I 0.0 I 0.0 I I I I ( 10.0)I ( 10.0)I ( 10.0)I ( 10.0)I I I I I I I I I I ARM D I 0.049 I 0.949 I 0.002 I 0.000 I I I I 21.0 I 407.0 I 1.0 I 0.0 I I I I ( 10.0)I ( 10.0)I ( 10.0)I ( 10.0)I I I I I I I I --------------------------------------------------------------------
QUEUE AND DELAY INFORMATION FOR EACH 15 MIN TIME SEGMENT --------------------------------------------------------
------------------------------------------------------------------------------------------------------------------ I TIME DEMAND CAPACITY DEMAND/ PEDESTRIAN START END DELAY GEOMETRIC DELAY AVERAGE DELAY I I (VEH/MIN) (VEH/MIN) CAPACITY FLOW QUEUE QUEUE (VEH.MIN/ (VEH.MIN/ PER ARRIVING I I (RFC) (PEDS/MIN) (VEHS) (VEHS) TIME SEGMENT) TIME SEGMENT) VEHICLE (MIN) I I 07.45-08.00 I I ARM A 6.93 18.94 0.366 0.0 0.6 8.3 0.08 I I ARM B 12.00 25.88 0.464 0.0 0.9 12.4 0.07 I I ARM C 0.04 10.91 0.003 0.0 0.0 0.1 0.09 I I ARM D 5.36 29.10 0.184 0.0 0.2 3.3 0.04 I I I ------------------------------------------------------------------------------------------------------------------
------------------------------------------------------------------------------------------------------------------ I TIME DEMAND CAPACITY DEMAND/ PEDESTRIAN START END DELAY GEOMETRIC DELAY AVERAGE DELAY I I (VEH/MIN) (VEH/MIN) CAPACITY FLOW QUEUE QUEUE (VEH.MIN/ (VEH.MIN/ PER ARRIVING I I (RFC) (PEDS/MIN) (VEHS) (VEHS) TIME SEGMENT) TIME SEGMENT) VEHICLE (MIN) I I 08.00-08.15 I I ARM A 8.27 18.37 0.450 0.6 0.8 11.8 0.10 I I ARM B 14.33 25.83 0.555 0.9 1.2 17.9 0.09 I I ARM C 0.04 9.63 0.005 0.0 0.0 0.1 0.10 I I ARM D 6.40 28.08 0.228 0.2 0.3 4.4 0.05 I I I ------------------------------------------------------------------------------------------------------------------
------------------------------------------------------------------------------------------------------------------ I TIME DEMAND CAPACITY DEMAND/ PEDESTRIAN START END DELAY GEOMETRIC DELAY AVERAGE DELAY I I (VEH/MIN) (VEH/MIN) CAPACITY FLOW QUEUE QUEUE (VEH.MIN/ (VEH.MIN/ PER ARRIVING I I (RFC) (PEDS/MIN) (VEHS) (VEHS) TIME SEGMENT) TIME SEGMENT) VEHICLE (MIN) I I 08.15-08.30 I I ARM A 10.13 17.59 0.576 0.8 1.3 19.1 0.13 I I ARM B 17.55 25.77 0.681 1.2 2.1 29.7 0.12 I I ARM C 0.05 7.90 0.007 0.0 0.0 0.1 0.13 I I ARM D 7.84 26.70 0.294 0.3 0.4 6.1 0.05 I I I ------------------------------------------------------------------------------------------------------------------
------------------------------------------------------------------------------------------------------------------ I TIME DEMAND CAPACITY DEMAND/ PEDESTRIAN START END DELAY GEOMETRIC DELAY AVERAGE DELAY I I (VEH/MIN) (VEH/MIN) CAPACITY FLOW QUEUE QUEUE (VEH.MIN/ (VEH.MIN/ PER ARRIVING I I (RFC) (PEDS/MIN) (VEHS) (VEHS) TIME SEGMENT) TIME SEGMENT) VEHICLE (MIN) I I 08.30-08.45 I I ARM A 10.13 17.58 0.576 1.3 1.3 20.1 0.13 I I ARM B 17.55 25.77 0.681 2.1 2.1 31.5 0.12 I I ARM C 0.05 7.87 0.007 0.0 0.0 0.1 0.13 I I ARM D 7.84 26.68 0.294 0.4 0.4 6.2 0.05 I I I ------------------------------------------------------------------------------------------------------------------

-------------------------------------------------------------------------------- TRL TRL VIEWER 3.0 AC t:\M-EC Job Book\20111\capacity assessments\2021 Dove Way-Derby Rd rdbt AM.vao - Page 3 -------------------------------------------------------------------------------- ------------------------------------------------------------------------------------------------------------------ I TIME DEMAND CAPACITY DEMAND/ PEDESTRIAN START END DELAY GEOMETRIC DELAY AVERAGE DELAY I I (VEH/MIN) (VEH/MIN) CAPACITY FLOW QUEUE QUEUE (VEH.MIN/ (VEH.MIN/ PER ARRIVING I I (RFC) (PEDS/MIN) (VEHS) (VEHS) TIME SEGMENT) TIME SEGMENT) VEHICLE (MIN) I I 08.45-09.00 I I ARM A 8.27 18.36 0.450 1.3 0.8 12.9 0.10 I I ARM B 14.33 25.83 0.555 2.1 1.3 19.6 0.09 I I ARM C 0.04 9.59 0.005 0.0 0.0 0.1 0.10 I I ARM D 6.40 28.04 0.228 0.4 0.3 4.5 0.05 I I I ------------------------------------------------------------------------------------------------------------------
------------------------------------------------------------------------------------------------------------------ I TIME DEMAND CAPACITY DEMAND/ PEDESTRIAN START END DELAY GEOMETRIC DELAY AVERAGE DELAY I I (VEH/MIN) (VEH/MIN) CAPACITY FLOW QUEUE QUEUE (VEH.MIN/ (VEH.MIN/ PER ARRIVING I I (RFC) (PEDS/MIN) (VEHS) (VEHS) TIME SEGMENT) TIME SEGMENT) VEHICLE (MIN) I I 09.00-09.15 I I ARM A 6.93 18.93 0.366 0.8 0.6 8.9 0.08 I I ARM B 12.00 25.87 0.464 1.3 0.9 13.4 0.07 I I ARM C 0.04 10.87 0.003 0.0 0.0 0.1 0.09 I I ARM D 5.36 29.06 0.185 0.3 0.2 3.4 0.04 I I I ------------------------------------------------------------------------------------------------------------------
QUEUE AT ARM A -------------- TIME SEGMENT NO. OF ENDING VEHICLES IN QUEUE 08.00 0.6 * 08.15 0.8 * 08.30 1.3 * 08.45 1.3 * 09.00 0.8 * 09.15 0.6 *
QUEUE AT ARM B -------------- TIME SEGMENT NO. OF ENDING VEHICLES IN QUEUE 08.00 0.9 * 08.15 1.2 * 08.30 2.1 ** 08.45 2.1 ** 09.00 1.3 * 09.15 0.9 *
QUEUE AT ARM C -------------- TIME SEGMENT NO. OF ENDING VEHICLES IN QUEUE 08.00 0.0 08.15 0.0 08.30 0.0 08.45 0.0 09.00 0.0 09.15 0.0
QUEUE AT ARM D -------------- TIME SEGMENT NO. OF ENDING VEHICLES IN QUEUE 08.00 0.2 08.15 0.3 08.30 0.4 08.45 0.4 09.00 0.3 09.15 0.2

-------------------------------------------------------------------------------- TRL TRL VIEWER 3.0 AC t:\M-EC Job Book\20111\capacity assessments\2021 Dove Way-Derby Rd rdbt AM.vao - Page 4 -------------------------------------------------------------------------------- QUEUEING DELAY INFORMATION OVER WHOLE PERIOD -------------------------------------------- ---------------------------------------------------------------------------- I ARM I TOTAL DEMAND I * QUEUEING * I * INCLUSIVE QUEUEING * I I I I * DELAY * I * DELAY * I I I------------------------------------------------------------------I I I (VEH) (VEH/H) I (MIN) (MIN/VEH) I (MIN) (MIN/VEH) I ---------------------------------------------------------------------------- I A I 759.7 I 506.4 I 81.1 I 0.11 I 81.1 I 0.11 I I B I 1316.4 I 877.6 I 124.6 I 0.09 I 124.7 I 0.09 I I C I 4.1 I 2.7 I 0.5 I 0.11 I 0.5 I 0.11 I I D I 588.2 I 392.2 I 28.0 I 0.05 I 28.0 I 0.05 I ---------------------------------------------------------------------------- I ALL I 2668.4 I 1778.9 I 234.2 I 0.09 I 234.2 I 0.09 I ---------------------------------------------------------------------------- * DELAY IS THAT OCCURRING ONLY WITHIN THE TIME PERIOD. * INCLUSIVE DELAY INCLUDES DELAY SUFFERED BY VEHICLES WHICH ARE STILL QUEUEING AFTER THE END OF THE TIME PERIOD. * THESE WILL ONLY BE SIGNIFICANTLY DIFFERENT IF THERE IS A LARGE QUEUE REMAINING AT THE END OF THE TIME PERIOD. END OF JOB ============================================= end of file ===============================================
[Printed at 13:48:14 on 05/07/2011]
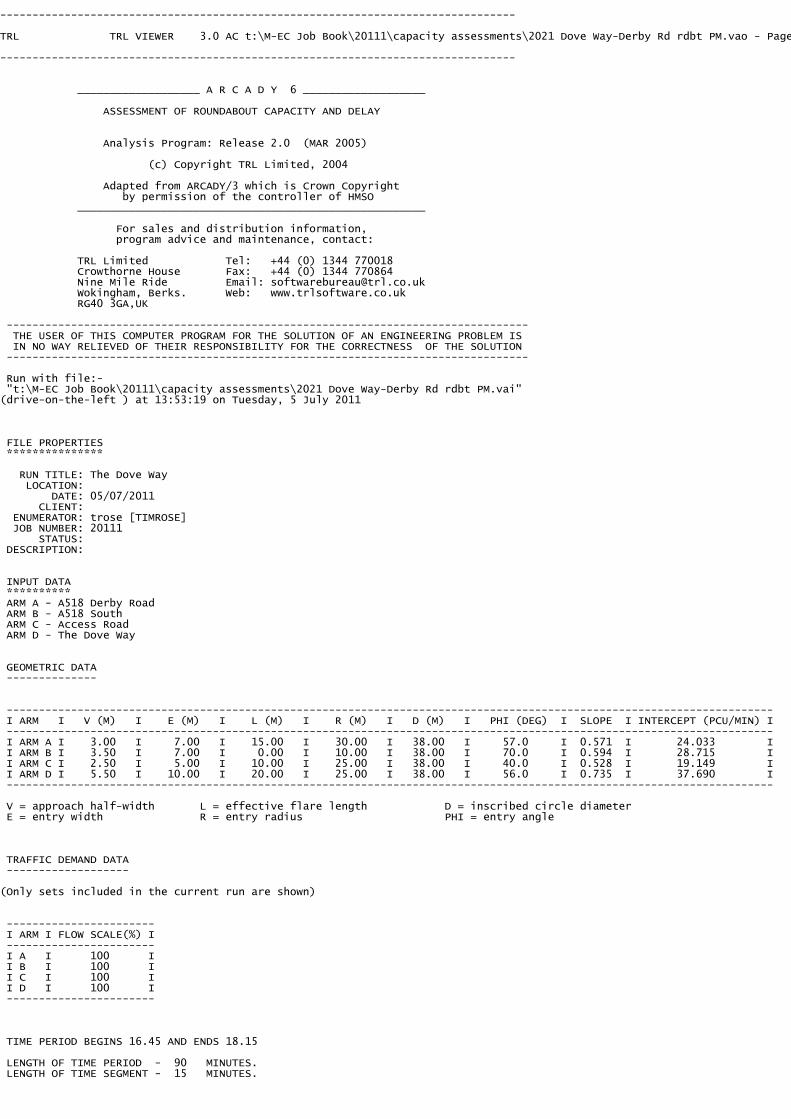
-------------------------------------------------------------------------------- TRL TRL VIEWER 3.0 AC t:\M-EC Job Book\20111\capacity assessments\2021 Dove Way-Derby Rd rdbt PM.vao - Page 1 -------------------------------------------------------------------------------- ___________________ A R C A D Y 6 ___________________ ASSESSMENT OF ROUNDABOUT CAPACITY AND DELAY Analysis Program: Release 2.0 (MAR 2005) (c) Copyright TRL Limited, 2004 Adapted from ARCADY/3 which is Crown Copyright by permission of the controller of HMSO ______________________________________________________ For sales and distribution information, program advice and maintenance, contact: TRL Limited Tel: +44 (0) 1344 770018 Crowthorne House Fax: +44 (0) 1344 770864 Nine Mile Ride Email: [email protected] Wokingham, Berks. Web: www.trlsoftware.co.uk RG40 3GA,UK --------------------------------------------------------------------------------- THE USER OF THIS COMPUTER PROGRAM FOR THE SOLUTION OF AN ENGINEERING PROBLEM IS IN NO WAY RELIEVED OF THEIR RESPONSIBILITY FOR THE CORRECTNESS OF THE SOLUTION --------------------------------------------------------------------------------- Run with file:- "t:\M-EC Job Book\20111\capacity assessments\2021 Dove Way-Derby Rd rdbt PM.vai"(drive-on-the-left ) at 13:53:19 on Tuesday, 5 July 2011
FILE PROPERTIES *************** RUN TITLE: The Dove Way LOCATION: DATE: 05/07/2011 CLIENT: ENUMERATOR: trose [TIMROSE] JOB NUMBER: 20111 STATUS: DESCRIPTION:
INPUT DATA ********** ARM A - A518 Derby Road ARM B - A518 South ARM C - Access Road ARM D - The Dove Way
GEOMETRIC DATA -------------- ----------------------------------------------------------------------------------------------------------------------- I ARM I V (M) I E (M) I L (M) I R (M) I D (M) I PHI (DEG) I SLOPE I INTERCEPT (PCU/MIN) I ----------------------------------------------------------------------------------------------------------------------- I ARM A I 3.00 I 7.00 I 15.00 I 30.00 I 38.00 I 57.0 I 0.571 I 24.033 I I ARM B I 3.50 I 7.00 I 0.00 I 10.00 I 38.00 I 70.0 I 0.594 I 28.715 I I ARM C I 2.50 I 5.00 I 10.00 I 25.00 I 38.00 I 40.0 I 0.528 I 19.149 I I ARM D I 5.50 I 10.00 I 20.00 I 25.00 I 38.00 I 56.0 I 0.735 I 37.690 I ----------------------------------------------------------------------------------------------------------------------- V = approach half-width L = effective flare length D = inscribed circle diameter E = entry width R = entry radius PHI = entry angle
TRAFFIC DEMAND DATA ------------------- (Only sets included in the current run are shown)
----------------------- I ARM I FLOW SCALE(%) I ----------------------- I A I 100 I I B I 100 I I C I 100 I I D I 100 I -----------------------
TIME PERIOD BEGINS 16.45 AND ENDS 18.15
LENGTH OF TIME PERIOD - 90 MINUTES. LENGTH OF TIME SEGMENT - 15 MINUTES.

-------------------------------------------------------------------------------- TRL TRL VIEWER 3.0 AC t:\M-EC Job Book\20111\capacity assessments\2021 Dove Way-Derby Rd rdbt PM.vao - Page 2 -------------------------------------------------------------------------------- DEMAND FLOW PROFILES ARE SYNTHESISED FROM TURNING COUNT DATA DEMAND SET TITLE: The Dove Way ----------------------------------------------------------------------------- I I NUMBER OF MINUTES FROM START WHEN I RATE OF FLOW (VEH/MIN) I I ARM I FLOW STARTS I TOP OF PEAK I FLOW STOPS I BEFORE I AT TOP I AFTER I I I TO RISE I IS REACHED IFALLING I PEAK I OF PEAK I PEAK I ----------------------------------------------------------------------------- I ARM A I 15.00 I 45.00 I 75.00 I 8.23 I 12.34 I 8.23 I I ARM B I 15.00 I 45.00 I 75.00 I 11.79 I 17.68 I 11.79 I I ARM C I 15.00 I 45.00 I 75.00 I 0.03 I 0.04 I 0.03 I I ARM D I 15.00 I 45.00 I 75.00 I 5.66 I 8.49 I 5.66 I ----------------------------------------------------------------------------- DEMAND SET TITLE: The Dove Way
-------------------------------------------------------------------- I I TURNING PROPORTIONS I I I TURNING COUNTS (VEH/HR) I I I (PERCENTAGE OF H.V.S) I I ----------------------------------------------- I TIME I FROM/TO I ARM A I ARM B I ARM C I ARM D I -------------------------------------------------------------------- I 16.45 - 18.15 I I I I I I I I ARM A I 0.000 I 0.962 I 0.002 I 0.036 I I I I 0.0 I 633.0 I 1.0 I 24.0 I I I I ( 10.0)I ( 10.0)I ( 10.0)I ( 10.0)I I I I I I I I I I ARM B I 0.613 I 0.000 I 0.002 I 0.385 I I I I 578.0 I 0.0 I 2.0 I 363.0 I I I I ( 10.0)I ( 10.0)I ( 10.0)I ( 10.0)I I I I I I I I I I ARM C I 1.000 I 0.000 I 0.000 I 0.000 I I I I 2.0 I 0.0 I 0.0 I 0.0 I I I I ( 10.0)I ( 10.0)I ( 10.0)I ( 10.0)I I I I I I I I I I ARM D I 0.035 I 0.962 I 0.002 I 0.000 I I I I 16.0 I 436.0 I 1.0 I 0.0 I I I I ( 10.0)I ( 10.0)I ( 10.0)I ( 10.0)I I I I I I I I --------------------------------------------------------------------
QUEUE AND DELAY INFORMATION FOR EACH 15 MIN TIME SEGMENT --------------------------------------------------------
------------------------------------------------------------------------------------------------------------------ I TIME DEMAND CAPACITY DEMAND/ PEDESTRIAN START END DELAY GEOMETRIC DELAY AVERAGE DELAY I I (VEH/MIN) (VEH/MIN) CAPACITY FLOW QUEUE QUEUE (VEH.MIN/ (VEH.MIN/ PER ARRIVING I I (RFC) (PEDS/MIN) (VEHS) (VEHS) TIME SEGMENT) TIME SEGMENT) VEHICLE (MIN) I I 16.45-17.00 I I ARM A 8.23 18.74 0.439 0.0 0.8 11.2 0.09 I I ARM B 11.79 25.91 0.455 0.0 0.8 12.0 0.07 I I ARM C 0.03 11.07 0.002 0.0 0.0 0.0 0.09 I I ARM D 5.66 28.96 0.196 0.0 0.2 3.6 0.04 I I I ------------------------------------------------------------------------------------------------------------------
------------------------------------------------------------------------------------------------------------------ I TIME DEMAND CAPACITY DEMAND/ PEDESTRIAN START END DELAY GEOMETRIC DELAY AVERAGE DELAY I I (VEH/MIN) (VEH/MIN) CAPACITY FLOW QUEUE QUEUE (VEH.MIN/ (VEH.MIN/ PER ARRIVING I I (RFC) (PEDS/MIN) (VEHS) (VEHS) TIME SEGMENT) TIME SEGMENT) VEHICLE (MIN) I I 17.00-17.15 I I ARM A 9.82 18.13 0.542 0.8 1.2 16.8 0.12 I I ARM B 14.08 25.87 0.544 0.8 1.2 17.2 0.08 I I ARM C 0.03 9.82 0.003 0.0 0.0 0.0 0.10 I I ARM D 6.76 27.91 0.242 0.2 0.3 4.7 0.05 I I I ------------------------------------------------------------------------------------------------------------------
------------------------------------------------------------------------------------------------------------------ I TIME DEMAND CAPACITY DEMAND/ PEDESTRIAN START END DELAY GEOMETRIC DELAY AVERAGE DELAY I I (VEH/MIN) (VEH/MIN) CAPACITY FLOW QUEUE QUEUE (VEH.MIN/ (VEH.MIN/ PER ARRIVING I I (RFC) (PEDS/MIN) (VEHS) (VEHS) TIME SEGMENT) TIME SEGMENT) VEHICLE (MIN) I I 17.15-17.30 I I ARM A 12.03 17.29 0.696 1.2 2.2 30.7 0.19 I I ARM B 17.24 25.82 0.668 1.2 2.0 28.1 0.12 I I ARM C 0.04 8.13 0.004 0.0 0.0 0.1 0.12 I I ARM D 8.28 26.50 0.313 0.3 0.5 6.7 0.05 I I I ------------------------------------------------------------------------------------------------------------------
------------------------------------------------------------------------------------------------------------------ I TIME DEMAND CAPACITY DEMAND/ PEDESTRIAN START END DELAY GEOMETRIC DELAY AVERAGE DELAY I I (VEH/MIN) (VEH/MIN) CAPACITY FLOW QUEUE QUEUE (VEH.MIN/ (VEH.MIN/ PER ARRIVING I I (RFC) (PEDS/MIN) (VEHS) (VEHS) TIME SEGMENT) TIME SEGMENT) VEHICLE (MIN) I I 17.30-17.45 I I ARM A 12.03 17.29 0.696 2.2 2.2 33.4 0.19 I I ARM B 17.24 25.82 0.668 2.0 2.0 29.7 0.12 I I ARM C 0.04 8.10 0.005 0.0 0.0 0.1 0.12 I I ARM D 8.28 26.48 0.313 0.5 0.5 6.8 0.05 I I I ------------------------------------------------------------------------------------------------------------------

-------------------------------------------------------------------------------- TRL TRL VIEWER 3.0 AC t:\M-EC Job Book\20111\capacity assessments\2021 Dove Way-Derby Rd rdbt PM.vao - Page 3 -------------------------------------------------------------------------------- ------------------------------------------------------------------------------------------------------------------ I TIME DEMAND CAPACITY DEMAND/ PEDESTRIAN START END DELAY GEOMETRIC DELAY AVERAGE DELAY I I (VEH/MIN) (VEH/MIN) CAPACITY FLOW QUEUE QUEUE (VEH.MIN/ (VEH.MIN/ PER ARRIVING I I (RFC) (PEDS/MIN) (VEHS) (VEHS) TIME SEGMENT) TIME SEGMENT) VEHICLE (MIN) I I 17.45-18.00 I I ARM A 9.82 18.12 0.542 2.2 1.2 18.9 0.12 I I ARM B 14.08 25.87 0.544 2.0 1.2 18.8 0.09 I I ARM C 0.03 9.78 0.003 0.0 0.0 0.0 0.10 I I ARM D 6.76 27.88 0.243 0.5 0.3 4.9 0.05 I I I ------------------------------------------------------------------------------------------------------------------
------------------------------------------------------------------------------------------------------------------ I TIME DEMAND CAPACITY DEMAND/ PEDESTRIAN START END DELAY GEOMETRIC DELAY AVERAGE DELAY I I (VEH/MIN) (VEH/MIN) CAPACITY FLOW QUEUE QUEUE (VEH.MIN/ (VEH.MIN/ PER ARRIVING I I (RFC) (PEDS/MIN) (VEHS) (VEHS) TIME SEGMENT) TIME SEGMENT) VEHICLE (MIN) I I 18.00-18.15 I I ARM A 8.23 18.73 0.439 1.2 0.8 12.3 0.10 I I ARM B 11.79 25.91 0.455 1.2 0.8 12.9 0.07 I I ARM C 0.03 11.03 0.002 0.0 0.0 0.0 0.09 I I ARM D 5.66 28.93 0.196 0.3 0.2 3.7 0.04 I I I ------------------------------------------------------------------------------------------------------------------
QUEUE AT ARM A -------------- TIME SEGMENT NO. OF ENDING VEHICLES IN QUEUE 17.00 0.8 * 17.15 1.2 * 17.30 2.2 ** 17.45 2.2 ** 18.00 1.2 * 18.15 0.8 *
QUEUE AT ARM B -------------- TIME SEGMENT NO. OF ENDING VEHICLES IN QUEUE 17.00 0.8 * 17.15 1.2 * 17.30 2.0 ** 17.45 2.0 ** 18.00 1.2 * 18.15 0.8 *
QUEUE AT ARM C -------------- TIME SEGMENT NO. OF ENDING VEHICLES IN QUEUE 17.00 0.0 17.15 0.0 17.30 0.0 17.45 0.0 18.00 0.0 18.15 0.0
QUEUE AT ARM D -------------- TIME SEGMENT NO. OF ENDING VEHICLES IN QUEUE 17.00 0.2 17.15 0.3 17.30 0.5 17.45 0.5 18.00 0.3 18.15 0.2

-------------------------------------------------------------------------------- TRL TRL VIEWER 3.0 AC t:\M-EC Job Book\20111\capacity assessments\2021 Dove Way-Derby Rd rdbt PM.vao - Page 4 -------------------------------------------------------------------------------- QUEUEING DELAY INFORMATION OVER WHOLE PERIOD -------------------------------------------- ---------------------------------------------------------------------------- I ARM I TOTAL DEMAND I * QUEUEING * I * INCLUSIVE QUEUEING * I I I I * DELAY * I * DELAY * I I I------------------------------------------------------------------I I I (VEH) (VEH/H) I (MIN) (MIN/VEH) I (MIN) (MIN/VEH) I ---------------------------------------------------------------------------- I A I 902.3 I 601.5 I 123.2 I 0.14 I 123.3 I 0.14 I I B I 1293.1 I 862.0 I 118.7 I 0.09 I 118.7 I 0.09 I I C I 2.7 I 1.8 I 0.3 I 0.11 I 0.3 I 0.11 I I D I 621.2 I 414.1 I 30.4 I 0.05 I 30.4 I 0.05 I ---------------------------------------------------------------------------- I ALL I 2819.2 I 1879.5 I 272.6 I 0.10 I 272.6 I 0.10 I ---------------------------------------------------------------------------- * DELAY IS THAT OCCURRING ONLY WITHIN THE TIME PERIOD. * INCLUSIVE DELAY INCLUDES DELAY SUFFERED BY VEHICLES WHICH ARE STILL QUEUEING AFTER THE END OF THE TIME PERIOD. * THESE WILL ONLY BE SIGNIFICANTLY DIFFERENT IF THERE IS A LARGE QUEUE REMAINING AT THE END OF THE TIME PERIOD. END OF JOB ============================================= end of file ===============================================
[Printed at 13:53:25 on 05/07/2011]

APPENDIX J


-------------------------------------------------------------------------------- TRL TRL VIEWER 3.0 AC t:\M-EC Job Book\20111\capacity assessments\2021 + DEV A50-A518 rdbt AM.vao - Page 1 -------------------------------------------------------------------------------- ___________________ A R C A D Y 6 ___________________ ASSESSMENT OF ROUNDABOUT CAPACITY AND DELAY Analysis Program: Release 2.0 (MAR 2005) (c) Copyright TRL Limited, 2004 Adapted from ARCADY/3 which is Crown Copyright by permission of the controller of HMSO ______________________________________________________ For sales and distribution information, program advice and maintenance, contact: TRL Limited Tel: +44 (0) 1344 770018 Crowthorne House Fax: +44 (0) 1344 770864 Nine Mile Ride Email: [email protected] Wokingham, Berks. Web: www.trlsoftware.co.uk RG40 3GA,UK --------------------------------------------------------------------------------- THE USER OF THIS COMPUTER PROGRAM FOR THE SOLUTION OF AN ENGINEERING PROBLEM IS IN NO WAY RELIEVED OF THEIR RESPONSIBILITY FOR THE CORRECTNESS OF THE SOLUTION --------------------------------------------------------------------------------- Run with file:- "t:\M-EC Job Book\20111\capacity assessments\2021 + DEV A50-A518 rdbt AM.vai"(drive-on-the-left ) at 11:41:59 on Friday, 5 August 2011
FILE PROPERTIES *************** RUN TITLE: The Dove Way LOCATION: DATE: 05/07/2011 CLIENT: ENUMERATOR: trose [TIMROSE] JOB NUMBER: 20111 STATUS: DESCRIPTION:
INPUT DATA ********** ARM A - A50 East ARM B - A518 ARM C - A50 West ARM D - Access Road
GEOMETRIC DATA -------------- ----------------------------------------------------------------------------------------------------------------------- I ARM I V (M) I E (M) I L (M) I R (M) I D (M) I PHI (DEG) I SLOPE I INTERCEPT (PCU/MIN) I ----------------------------------------------------------------------------------------------------------------------- I ARM A I 10.00 I 12.00 I 20.00 I 25.00 I 78.00 I 48.0 I 0.704 I 55.088 I I ARM B I 5.50 I 10.00 I 30.00 I 30.00 I 78.00 I 46.0 I 0.585 I 41.438 I I ARM C I 5.00 I 7.00 I 20.00 I 30.00 I 78.00 I 49.0 I 0.492 I 31.269 I I ARM D I 4.00 I 5.00 I 15.00 I 30.00 I 78.00 I 38.0 I 0.437 I 24.083 I ----------------------------------------------------------------------------------------------------------------------- V = approach half-width L = effective flare length D = inscribed circle diameter E = entry width R = entry radius PHI = entry angle
TRAFFIC DEMAND DATA ------------------- (Only sets included in the current run are shown)
----------------------- I ARM I FLOW SCALE(%) I ----------------------- I A I 100 I I B I 100 I I C I 100 I I D I 100 I -----------------------
TIME PERIOD BEGINS 07.45 AND ENDS 09.15
LENGTH OF TIME PERIOD - 90 MINUTES. LENGTH OF TIME SEGMENT - 15 MINUTES.

-------------------------------------------------------------------------------- TRL TRL VIEWER 3.0 AC t:\M-EC Job Book\20111\capacity assessments\2021 + DEV A50-A518 rdbt AM.vao - Page 2 -------------------------------------------------------------------------------- DEMAND FLOW PROFILES ARE SYNTHESISED FROM TURNING COUNT DATA DEMAND SET TITLE: The Dove Way ----------------------------------------------------------------------------- I I NUMBER OF MINUTES FROM START WHEN I RATE OF FLOW (VEH/MIN) I I ARM I FLOW STARTS I TOP OF PEAK I FLOW STOPS I BEFORE I AT TOP I AFTER I I I TO RISE I IS REACHED IFALLING I PEAK I OF PEAK I PEAK I ----------------------------------------------------------------------------- I ARM A I 15.00 I 45.00 I 75.00 I 13.06 I 19.59 I 13.06 I I ARM B I 15.00 I 45.00 I 75.00 I 8.14 I 12.21 I 8.14 I I ARM C I 15.00 I 45.00 I 75.00 I 12.44 I 18.66 I 12.44 I I ARM D I 15.00 I 45.00 I 75.00 I 0.10 I 0.15 I 0.10 I ----------------------------------------------------------------------------- DEMAND SET TITLE: The Dove Way
-------------------------------------------------------------------- I I TURNING PROPORTIONS I I I TURNING COUNTS (VEH/HR) I I I (PERCENTAGE OF H.V.S) I I ----------------------------------------------- I TIME I FROM/TO I ARM A I ARM B I ARM C I ARM D I -------------------------------------------------------------------- I 07.45 - 09.15 I I I I I I I I ARM A I 0.000 I 0.342 I 0.657 I 0.001 I I I I 0.0 I 357.0 I 687.0 I 1.0 I I I I ( 10.0)I ( 10.0)I ( 10.0)I ( 10.0)I I I I I I I I I I ARM B I 0.464 I 0.000 I 0.536 I 0.000 I I I I 302.0 I 0.0 I 349.0 I 0.0 I I I I ( 10.0)I ( 10.0)I ( 10.0)I ( 10.0)I I I I I I I I I I ARM C I 0.643 I 0.357 I 0.000 I 0.000 I I I I 640.0 I 355.0 I 0.0 I 0.0 I I I I ( 10.0)I ( 10.0)I ( 10.0)I ( 10.0)I I I I I I I I I I ARM D I 0.375 I 0.000 I 0.625 I 0.000 I I I I 3.0 I 0.0 I 5.0 I 0.0 I I I I ( 10.0)I ( 10.0)I ( 10.0)I ( 10.0)I I I I I I I I --------------------------------------------------------------------
QUEUE AND DELAY INFORMATION FOR EACH 15 MIN TIME SEGMENT --------------------------------------------------------
------------------------------------------------------------------------------------------------------------------ I TIME DEMAND CAPACITY DEMAND/ PEDESTRIAN START END DELAY GEOMETRIC DELAY AVERAGE DELAY I I (VEH/MIN) (VEH/MIN) CAPACITY FLOW QUEUE QUEUE (VEH.MIN/ (VEH.MIN/ PER ARRIVING I I (RFC) (PEDS/MIN) (VEHS) (VEHS) TIME SEGMENT) TIME SEGMENT) VEHICLE (MIN) I I 07.45-08.00 I I ARM A 13.06 46.93 0.278 0.0 0.4 5.7 0.03 I I ARM B 8.14 32.61 0.250 0.0 0.3 4.9 0.04 I I ARM C 12.44 26.57 0.468 0.0 0.9 12.7 0.07 I I ARM D 0.10 14.84 0.007 0.0 0.0 0.1 0.07 I I I ------------------------------------------------------------------------------------------------------------------
------------------------------------------------------------------------------------------------------------------ I TIME DEMAND CAPACITY DEMAND/ PEDESTRIAN START END DELAY GEOMETRIC DELAY AVERAGE DELAY I I (VEH/MIN) (VEH/MIN) CAPACITY FLOW QUEUE QUEUE (VEH.MIN/ (VEH.MIN/ PER ARRIVING I I (RFC) (PEDS/MIN) (VEHS) (VEHS) TIME SEGMENT) TIME SEGMENT) VEHICLE (MIN) I I 08.00-08.15 I I ARM A 15.60 46.31 0.337 0.4 0.5 7.5 0.03 I I ARM B 9.72 31.62 0.307 0.3 0.4 6.5 0.05 I I ARM C 14.85 26.20 0.567 0.9 1.3 18.8 0.09 I I ARM D 0.12 13.45 0.009 0.0 0.0 0.1 0.08 I I I ------------------------------------------------------------------------------------------------------------------
------------------------------------------------------------------------------------------------------------------ I TIME DEMAND CAPACITY DEMAND/ PEDESTRIAN START END DELAY GEOMETRIC DELAY AVERAGE DELAY I I (VEH/MIN) (VEH/MIN) CAPACITY FLOW QUEUE QUEUE (VEH.MIN/ (VEH.MIN/ PER ARRIVING I I (RFC) (PEDS/MIN) (VEHS) (VEHS) TIME SEGMENT) TIME SEGMENT) VEHICLE (MIN) I I 08.15-08.30 I I ARM A 19.10 45.47 0.420 0.5 0.7 10.7 0.04 I I ARM B 11.90 30.26 0.393 0.4 0.6 9.5 0.05 I I ARM C 18.19 25.70 0.708 1.3 2.4 33.3 0.13 I I ARM D 0.15 11.57 0.013 0.0 0.0 0.2 0.09 I I I ------------------------------------------------------------------------------------------------------------------
------------------------------------------------------------------------------------------------------------------ I TIME DEMAND CAPACITY DEMAND/ PEDESTRIAN START END DELAY GEOMETRIC DELAY AVERAGE DELAY I I (VEH/MIN) (VEH/MIN) CAPACITY FLOW QUEUE QUEUE (VEH.MIN/ (VEH.MIN/ PER ARRIVING I I (RFC) (PEDS/MIN) (VEHS) (VEHS) TIME SEGMENT) TIME SEGMENT) VEHICLE (MIN) I I 08.30-08.45 I I ARM A 19.10 45.45 0.420 0.7 0.7 10.8 0.04 I I ARM B 11.90 30.26 0.393 0.6 0.6 9.7 0.05 I I ARM C 18.19 25.70 0.708 2.4 2.4 35.6 0.13 I I ARM D 0.15 11.54 0.013 0.0 0.0 0.2 0.09 I I I ------------------------------------------------------------------------------------------------------------------

-------------------------------------------------------------------------------- TRL TRL VIEWER 3.0 AC t:\M-EC Job Book\20111\capacity assessments\2021 + DEV A50-A518 rdbt AM.vao - Page 3 -------------------------------------------------------------------------------- ------------------------------------------------------------------------------------------------------------------ I TIME DEMAND CAPACITY DEMAND/ PEDESTRIAN START END DELAY GEOMETRIC DELAY AVERAGE DELAY I I (VEH/MIN) (VEH/MIN) CAPACITY FLOW QUEUE QUEUE (VEH.MIN/ (VEH.MIN/ PER ARRIVING I I (RFC) (PEDS/MIN) (VEHS) (VEHS) TIME SEGMENT) TIME SEGMENT) VEHICLE (MIN) I I 08.45-09.00 I I ARM A 15.60 46.28 0.337 0.7 0.5 7.7 0.03 I I ARM B 9.72 31.61 0.307 0.6 0.4 6.8 0.05 I I ARM C 14.85 26.20 0.567 2.4 1.3 20.7 0.09 I I ARM D 0.12 13.40 0.009 0.0 0.0 0.1 0.08 I I I ------------------------------------------------------------------------------------------------------------------
------------------------------------------------------------------------------------------------------------------ I TIME DEMAND CAPACITY DEMAND/ PEDESTRIAN START END DELAY GEOMETRIC DELAY AVERAGE DELAY I I (VEH/MIN) (VEH/MIN) CAPACITY FLOW QUEUE QUEUE (VEH.MIN/ (VEH.MIN/ PER ARRIVING I I (RFC) (PEDS/MIN) (VEHS) (VEHS) TIME SEGMENT) TIME SEGMENT) VEHICLE (MIN) I I 09.00-09.15 I I ARM A 13.06 46.91 0.278 0.5 0.4 5.9 0.03 I I ARM B 8.14 32.60 0.250 0.4 0.3 5.1 0.04 I I ARM C 12.44 26.56 0.468 1.3 0.9 13.7 0.07 I I ARM D 0.10 14.80 0.007 0.0 0.0 0.1 0.07 I I I ------------------------------------------------------------------------------------------------------------------
QUEUE AT ARM A -------------- TIME SEGMENT NO. OF ENDING VEHICLES IN QUEUE 08.00 0.4 08.15 0.5 * 08.30 0.7 * 08.45 0.7 * 09.00 0.5 * 09.15 0.4
QUEUE AT ARM B -------------- TIME SEGMENT NO. OF ENDING VEHICLES IN QUEUE 08.00 0.3 08.15 0.4 08.30 0.6 * 08.45 0.6 * 09.00 0.4 09.15 0.3
QUEUE AT ARM C -------------- TIME SEGMENT NO. OF ENDING VEHICLES IN QUEUE 08.00 0.9 * 08.15 1.3 * 08.30 2.4 ** 08.45 2.4 ** 09.00 1.3 * 09.15 0.9 *
QUEUE AT ARM D -------------- TIME SEGMENT NO. OF ENDING VEHICLES IN QUEUE 08.00 0.0 08.15 0.0 08.30 0.0 08.45 0.0 09.00 0.0 09.15 0.0
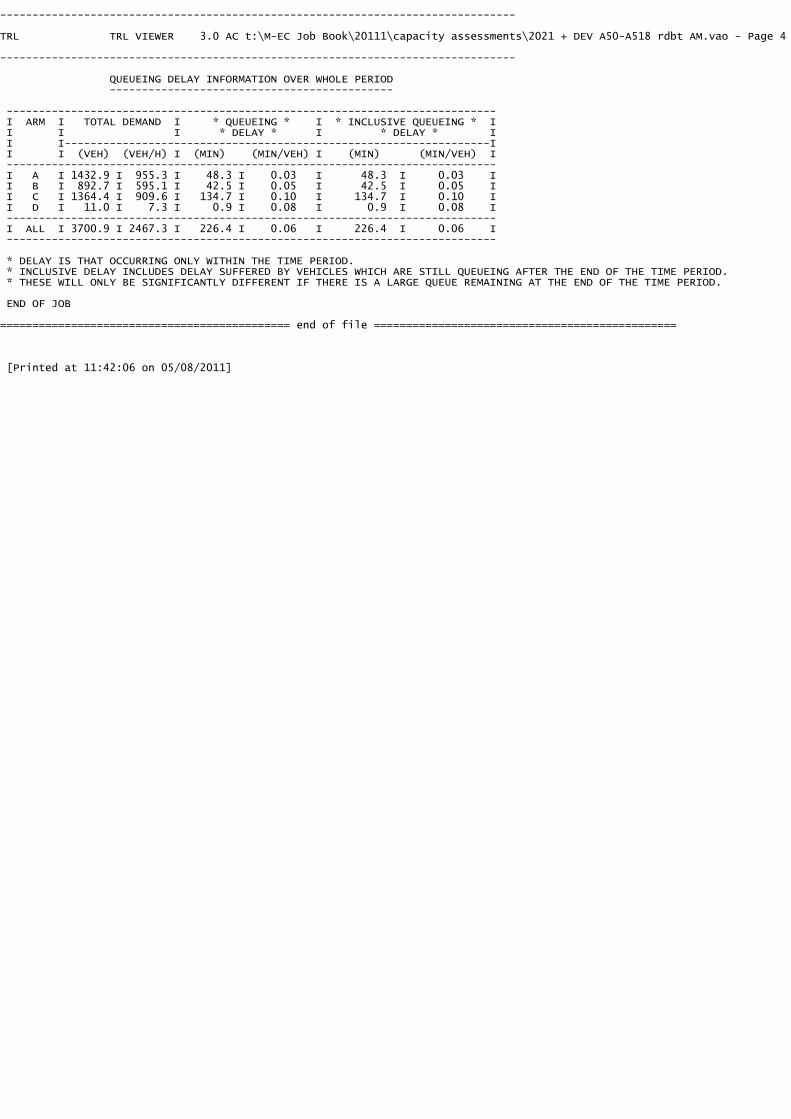
-------------------------------------------------------------------------------- TRL TRL VIEWER 3.0 AC t:\M-EC Job Book\20111\capacity assessments\2021 + DEV A50-A518 rdbt AM.vao - Page 4 -------------------------------------------------------------------------------- QUEUEING DELAY INFORMATION OVER WHOLE PERIOD -------------------------------------------- ---------------------------------------------------------------------------- I ARM I TOTAL DEMAND I * QUEUEING * I * INCLUSIVE QUEUEING * I I I I * DELAY * I * DELAY * I I I------------------------------------------------------------------I I I (VEH) (VEH/H) I (MIN) (MIN/VEH) I (MIN) (MIN/VEH) I ---------------------------------------------------------------------------- I A I 1432.9 I 955.3 I 48.3 I 0.03 I 48.3 I 0.03 I I B I 892.7 I 595.1 I 42.5 I 0.05 I 42.5 I 0.05 I I C I 1364.4 I 909.6 I 134.7 I 0.10 I 134.7 I 0.10 I I D I 11.0 I 7.3 I 0.9 I 0.08 I 0.9 I 0.08 I ---------------------------------------------------------------------------- I ALL I 3700.9 I 2467.3 I 226.4 I 0.06 I 226.4 I 0.06 I ---------------------------------------------------------------------------- * DELAY IS THAT OCCURRING ONLY WITHIN THE TIME PERIOD. * INCLUSIVE DELAY INCLUDES DELAY SUFFERED BY VEHICLES WHICH ARE STILL QUEUEING AFTER THE END OF THE TIME PERIOD. * THESE WILL ONLY BE SIGNIFICANTLY DIFFERENT IF THERE IS A LARGE QUEUE REMAINING AT THE END OF THE TIME PERIOD. END OF JOB ============================================= end of file ===============================================
[Printed at 11:42:06 on 05/08/2011]

-------------------------------------------------------------------------------- TRL TRL VIEWER 3.0 AC t:\M-EC Job Book\20111\capacity assessments\2021 + DEV A50-B5030 rdbt AM.vao - Page 1 -------------------------------------------------------------------------------- ___________________ A R C A D Y 6 ___________________ ASSESSMENT OF ROUNDABOUT CAPACITY AND DELAY Analysis Program: Release 2.0 (MAR 2005) (c) Copyright TRL Limited, 2004 Adapted from ARCADY/3 which is Crown Copyright by permission of the controller of HMSO ______________________________________________________ For sales and distribution information, program advice and maintenance, contact: TRL Limited Tel: +44 (0) 1344 770018 Crowthorne House Fax: +44 (0) 1344 770864 Nine Mile Ride Email: [email protected] Wokingham, Berks. Web: www.trlsoftware.co.uk RG40 3GA,UK --------------------------------------------------------------------------------- THE USER OF THIS COMPUTER PROGRAM FOR THE SOLUTION OF AN ENGINEERING PROBLEM IS IN NO WAY RELIEVED OF THEIR RESPONSIBILITY FOR THE CORRECTNESS OF THE SOLUTION --------------------------------------------------------------------------------- Run with file:- "t:\M-EC Job Book\20111\capacity assessments\2021 + DEV A50-B5030 rdbt AM.vai"(drive-on-the-left ) at 11:46:04 on Friday, 5 August 2011
FILE PROPERTIES *************** RUN TITLE: The Dove Way LOCATION: DATE: 04/07/2011 CLIENT: ENUMERATOR: trose [TIMROSE] JOB NUMBER: 20111 STATUS: DESCRIPTION:
INPUT DATA ********** ARM A - A50 East ARM B - B5030 ARM C - A50 West ARM D - A518
GEOMETRIC DATA -------------- ----------------------------------------------------------------------------------------------------------------------- I ARM I V (M) I E (M) I L (M) I R (M) I D (M) I PHI (DEG) I SLOPE I INTERCEPT (PCU/MIN) I ----------------------------------------------------------------------------------------------------------------------- I ARM A I 8.00 I 8.00 I 14.00 I 70.00 I 56.00 I 47.0 I 0.692 I 39.428 I I ARM B I 5.00 I 6.00 I 24.00 I 30.00 I 56.00 I 42.0 I 0.579 I 28.953 I I ARM C I 7.00 I 8.00 I 11.00 I 30.00 I 56.00 I 57.0 I 0.643 I 36.223 I I ARM D I 7.00 I 10.00 I 25.00 I 20.00 I 56.00 I 54.0 I 0.709 I 42.441 I ----------------------------------------------------------------------------------------------------------------------- V = approach half-width L = effective flare length D = inscribed circle diameter E = entry width R = entry radius PHI = entry angle
TRAFFIC DEMAND DATA ------------------- (Only sets included in the current run are shown)
----------------------- I ARM I FLOW SCALE(%) I ----------------------- I A I 100 I I B I 100 I I C I 100 I I D I 100 I -----------------------
TIME PERIOD BEGINS 07.45 AND ENDS 09.15
LENGTH OF TIME PERIOD - 90 MINUTES. LENGTH OF TIME SEGMENT - 15 MINUTES.

-------------------------------------------------------------------------------- TRL TRL VIEWER 3.0 AC t:\M-EC Job Book\20111\capacity assessments\2021 + DEV A50-B5030 rdbt AM.vao - Page 2 -------------------------------------------------------------------------------- DEMAND FLOW PROFILES ARE SYNTHESISED FROM TURNING COUNT DATA DEMAND SET TITLE: The Dove Way ----------------------------------------------------------------------------- I I NUMBER OF MINUTES FROM START WHEN I RATE OF FLOW (VEH/MIN) I I ARM I FLOW STARTS I TOP OF PEAK I FLOW STOPS I BEFORE I AT TOP I AFTER I I I TO RISE I IS REACHED IFALLING I PEAK I OF PEAK I PEAK I ----------------------------------------------------------------------------- I ARM A I 15.00 I 45.00 I 75.00 I 13.00 I 19.50 I 13.00 I I ARM B I 15.00 I 45.00 I 75.00 I 6.41 I 9.62 I 6.41 I I ARM C I 15.00 I 45.00 I 75.00 I 10.19 I 15.28 I 10.19 I I ARM D I 15.00 I 45.00 I 75.00 I 12.29 I 18.43 I 12.29 I ----------------------------------------------------------------------------- DEMAND SET TITLE: The Dove Way
-------------------------------------------------------------------- I I TURNING PROPORTIONS I I I TURNING COUNTS (VEH/HR) I I I (PERCENTAGE OF H.V.S) I I ----------------------------------------------- I TIME I FROM/TO I ARM A I ARM B I ARM C I ARM D I -------------------------------------------------------------------- I 07.45 - 09.15 I I I I I I I I ARM A I 0.000 I 0.189 I 0.406 I 0.405 I I I I 0.0 I 197.0 I 422.0 I 421.0 I I I I ( 10.0)I ( 10.0)I ( 10.0)I ( 10.0)I I I I I I I I I I ARM B I 0.347 I 0.000 I 0.380 I 0.273 I I I I 178.0 I 0.0 I 195.0 I 140.0 I I I I ( 10.0)I ( 10.0)I ( 10.0)I ( 10.0)I I I I I I I I I I ARM C I 0.590 I 0.173 I 0.000 I 0.237 I I I I 481.0 I 141.0 I 0.0 I 193.0 I I I I ( 10.0)I ( 10.0)I ( 10.0)I ( 10.0)I I I I I I I I I I ARM D I 0.344 I 0.333 I 0.323 I 0.000 I I I I 338.0 I 327.0 I 318.0 I 0.0 I I I I ( 10.0)I ( 10.0)I ( 10.0)I ( 10.0)I I I I I I I I --------------------------------------------------------------------
QUEUE AND DELAY INFORMATION FOR EACH 15 MIN TIME SEGMENT --------------------------------------------------------
------------------------------------------------------------------------------------------------------------------ I TIME DEMAND CAPACITY DEMAND/ PEDESTRIAN START END DELAY GEOMETRIC DELAY AVERAGE DELAY I I (VEH/MIN) (VEH/MIN) CAPACITY FLOW QUEUE QUEUE (VEH.MIN/ (VEH.MIN/ PER ARRIVING I I (RFC) (PEDS/MIN) (VEHS) (VEHS) TIME SEGMENT) TIME SEGMENT) VEHICLE (MIN) I I 07.45-08.00 I I ARM A 13.00 29.07 0.447 0.0 0.8 11.7 0.06 I I ARM B 6.41 17.95 0.357 0.0 0.6 8.0 0.09 I I ARM C 10.19 27.02 0.377 0.0 0.6 8.8 0.06 I I ARM D 12.29 31.53 0.390 0.0 0.6 9.3 0.05 I I I ------------------------------------------------------------------------------------------------------------------
------------------------------------------------------------------------------------------------------------------ I TIME DEMAND CAPACITY DEMAND/ PEDESTRIAN START END DELAY GEOMETRIC DELAY AVERAGE DELAY I I (VEH/MIN) (VEH/MIN) CAPACITY FLOW QUEUE QUEUE (VEH.MIN/ (VEH.MIN/ PER ARRIVING I I (RFC) (PEDS/MIN) (VEHS) (VEHS) TIME SEGMENT) TIME SEGMENT) VEHICLE (MIN) I I 08.00-08.15 I I ARM A 15.52 27.73 0.560 0.8 1.3 18.3 0.08 I I ARM B 7.66 16.31 0.470 0.6 0.9 12.6 0.12 I I ARM C 12.16 25.85 0.471 0.6 0.9 12.9 0.07 I I ARM D 14.67 30.13 0.487 0.6 0.9 13.8 0.06 I I I ------------------------------------------------------------------------------------------------------------------
------------------------------------------------------------------------------------------------------------------ I TIME DEMAND CAPACITY DEMAND/ PEDESTRIAN START END DELAY GEOMETRIC DELAY AVERAGE DELAY I I (VEH/MIN) (VEH/MIN) CAPACITY FLOW QUEUE QUEUE (VEH.MIN/ (VEH.MIN/ PER ARRIVING I I (RFC) (PEDS/MIN) (VEHS) (VEHS) TIME SEGMENT) TIME SEGMENT) VEHICLE (MIN) I I 08.15-08.30 I I ARM A 19.01 25.92 0.733 1.3 2.7 37.3 0.14 I I ARM B 9.38 14.09 0.666 0.9 1.9 26.6 0.21 I I ARM C 14.90 24.29 0.613 0.9 1.6 22.4 0.11 I I ARM D 17.97 28.26 0.636 0.9 1.7 24.7 0.10 I I I ------------------------------------------------------------------------------------------------------------------
------------------------------------------------------------------------------------------------------------------ I TIME DEMAND CAPACITY DEMAND/ PEDESTRIAN START END DELAY GEOMETRIC DELAY AVERAGE DELAY I I (VEH/MIN) (VEH/MIN) CAPACITY FLOW QUEUE QUEUE (VEH.MIN/ (VEH.MIN/ PER ARRIVING I I (RFC) (PEDS/MIN) (VEHS) (VEHS) TIME SEGMENT) TIME SEGMENT) VEHICLE (MIN) I I 08.30-08.45 I I ARM A 19.01 25.90 0.734 2.7 2.7 40.4 0.14 I I ARM B 9.38 14.04 0.668 1.9 2.0 29.2 0.21 I I ARM C 14.90 24.24 0.615 1.6 1.6 23.6 0.11 I I ARM D 17.97 28.22 0.637 1.7 1.7 25.9 0.10 I I I ------------------------------------------------------------------------------------------------------------------
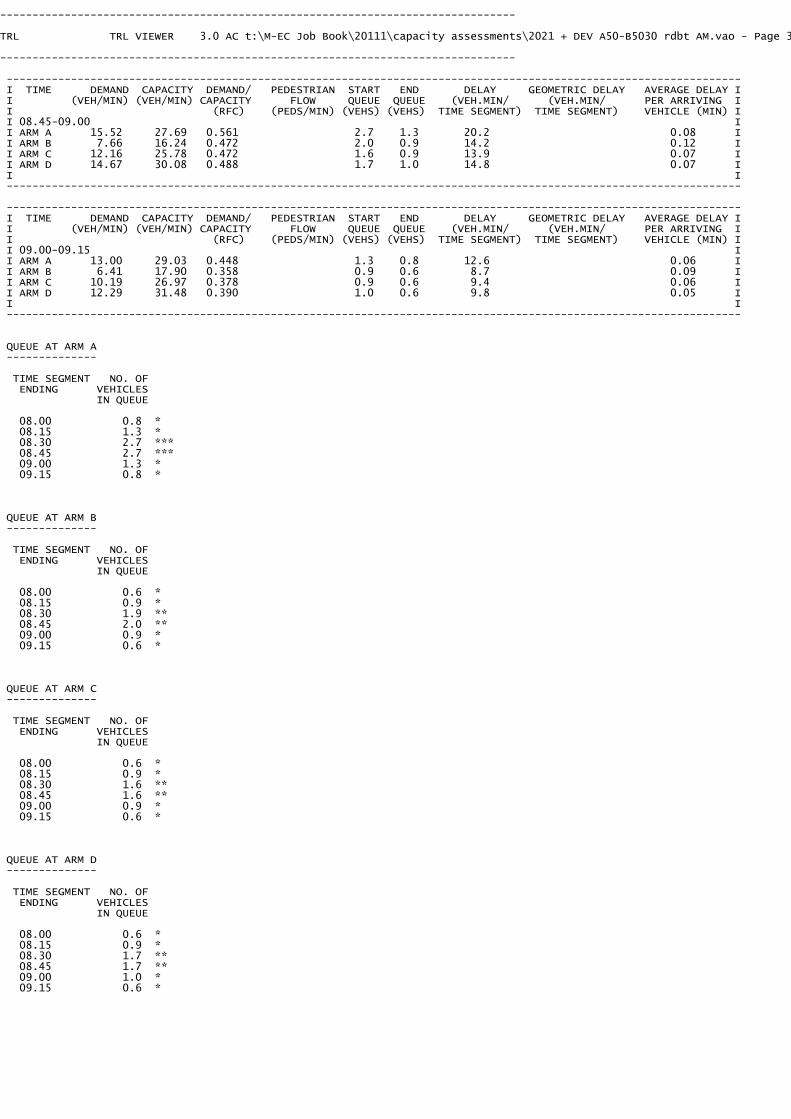
-------------------------------------------------------------------------------- TRL TRL VIEWER 3.0 AC t:\M-EC Job Book\20111\capacity assessments\2021 + DEV A50-B5030 rdbt AM.vao - Page 3 -------------------------------------------------------------------------------- ------------------------------------------------------------------------------------------------------------------ I TIME DEMAND CAPACITY DEMAND/ PEDESTRIAN START END DELAY GEOMETRIC DELAY AVERAGE DELAY I I (VEH/MIN) (VEH/MIN) CAPACITY FLOW QUEUE QUEUE (VEH.MIN/ (VEH.MIN/ PER ARRIVING I I (RFC) (PEDS/MIN) (VEHS) (VEHS) TIME SEGMENT) TIME SEGMENT) VEHICLE (MIN) I I 08.45-09.00 I I ARM A 15.52 27.69 0.561 2.7 1.3 20.2 0.08 I I ARM B 7.66 16.24 0.472 2.0 0.9 14.2 0.12 I I ARM C 12.16 25.78 0.472 1.6 0.9 13.9 0.07 I I ARM D 14.67 30.08 0.488 1.7 1.0 14.8 0.07 I I I ------------------------------------------------------------------------------------------------------------------
------------------------------------------------------------------------------------------------------------------ I TIME DEMAND CAPACITY DEMAND/ PEDESTRIAN START END DELAY GEOMETRIC DELAY AVERAGE DELAY I I (VEH/MIN) (VEH/MIN) CAPACITY FLOW QUEUE QUEUE (VEH.MIN/ (VEH.MIN/ PER ARRIVING I I (RFC) (PEDS/MIN) (VEHS) (VEHS) TIME SEGMENT) TIME SEGMENT) VEHICLE (MIN) I I 09.00-09.15 I I ARM A 13.00 29.03 0.448 1.3 0.8 12.6 0.06 I I ARM B 6.41 17.90 0.358 0.9 0.6 8.7 0.09 I I ARM C 10.19 26.97 0.378 0.9 0.6 9.4 0.06 I I ARM D 12.29 31.48 0.390 1.0 0.6 9.8 0.05 I I I ------------------------------------------------------------------------------------------------------------------
QUEUE AT ARM A -------------- TIME SEGMENT NO. OF ENDING VEHICLES IN QUEUE 08.00 0.8 * 08.15 1.3 * 08.30 2.7 *** 08.45 2.7 *** 09.00 1.3 * 09.15 0.8 *
QUEUE AT ARM B -------------- TIME SEGMENT NO. OF ENDING VEHICLES IN QUEUE 08.00 0.6 * 08.15 0.9 * 08.30 1.9 ** 08.45 2.0 ** 09.00 0.9 * 09.15 0.6 *
QUEUE AT ARM C -------------- TIME SEGMENT NO. OF ENDING VEHICLES IN QUEUE 08.00 0.6 * 08.15 0.9 * 08.30 1.6 ** 08.45 1.6 ** 09.00 0.9 * 09.15 0.6 *
QUEUE AT ARM D -------------- TIME SEGMENT NO. OF ENDING VEHICLES IN QUEUE 08.00 0.6 * 08.15 0.9 * 08.30 1.7 ** 08.45 1.7 ** 09.00 1.0 * 09.15 0.6 *

-------------------------------------------------------------------------------- TRL TRL VIEWER 3.0 AC t:\M-EC Job Book\20111\capacity assessments\2021 + DEV A50-B5030 rdbt AM.vao - Page 4 -------------------------------------------------------------------------------- QUEUEING DELAY INFORMATION OVER WHOLE PERIOD -------------------------------------------- ---------------------------------------------------------------------------- I ARM I TOTAL DEMAND I * QUEUEING * I * INCLUSIVE QUEUEING * I I I I * DELAY * I * DELAY * I I I------------------------------------------------------------------I I I (VEH) (VEH/H) I (MIN) (MIN/VEH) I (MIN) (MIN/VEH) I ---------------------------------------------------------------------------- I A I 1426.1 I 950.7 I 140.3 I 0.10 I 140.3 I 0.10 I I B I 703.4 I 469.0 I 99.4 I 0.14 I 99.4 I 0.14 I I C I 1117.5 I 745.0 I 90.9 I 0.08 I 90.9 I 0.08 I I D I 1347.9 I 898.6 I 98.4 I 0.07 I 98.4 I 0.07 I ---------------------------------------------------------------------------- I ALL I 4594.9 I 3063.3 I 429.0 I 0.09 I 429.1 I 0.09 I ---------------------------------------------------------------------------- * DELAY IS THAT OCCURRING ONLY WITHIN THE TIME PERIOD. * INCLUSIVE DELAY INCLUDES DELAY SUFFERED BY VEHICLES WHICH ARE STILL QUEUEING AFTER THE END OF THE TIME PERIOD. * THESE WILL ONLY BE SIGNIFICANTLY DIFFERENT IF THERE IS A LARGE QUEUE REMAINING AT THE END OF THE TIME PERIOD. END OF JOB ============================================= end of file ===============================================
[Printed at 11:46:21 on 05/08/2011]

-------------------------------------------------------------------------------- TRL TRL VIEWER 3.0 AC t:\M-EC Job Book\20111\capacity assessments\2021 + DEV Dove Way-Derby Rd rdbt AM.vao - Page 1 -------------------------------------------------------------------------------- ___________________ A R C A D Y 6 ___________________ ASSESSMENT OF ROUNDABOUT CAPACITY AND DELAY Analysis Program: Release 2.0 (MAR 2005) (c) Copyright TRL Limited, 2004 Adapted from ARCADY/3 which is Crown Copyright by permission of the controller of HMSO ______________________________________________________ For sales and distribution information, program advice and maintenance, contact: TRL Limited Tel: +44 (0) 1344 770018 Crowthorne House Fax: +44 (0) 1344 770864 Nine Mile Ride Email: [email protected] Wokingham, Berks. Web: www.trlsoftware.co.uk RG40 3GA,UK --------------------------------------------------------------------------------- THE USER OF THIS COMPUTER PROGRAM FOR THE SOLUTION OF AN ENGINEERING PROBLEM IS IN NO WAY RELIEVED OF THEIR RESPONSIBILITY FOR THE CORRECTNESS OF THE SOLUTION --------------------------------------------------------------------------------- Run with file:- "t:\M-EC Job Book\20111\capacity assessments\2021 + DEV Dove Way-Derby Rd rdbt AM.vai"(drive-on-the-left ) at 11:53:38 on Friday, 5 August 2011
FILE PROPERTIES *************** RUN TITLE: The Dove Way LOCATION: DATE: 05/07/2011 CLIENT: ENUMERATOR: trose [TIMROSE] JOB NUMBER: 20111 STATUS: DESCRIPTION:
INPUT DATA ********** ARM A - A518 Derby Road ARM B - A518 South ARM C - Access Road ARM D - The Dove Way
GEOMETRIC DATA -------------- ----------------------------------------------------------------------------------------------------------------------- I ARM I V (M) I E (M) I L (M) I R (M) I D (M) I PHI (DEG) I SLOPE I INTERCEPT (PCU/MIN) I ----------------------------------------------------------------------------------------------------------------------- I ARM A I 3.00 I 7.00 I 15.00 I 30.00 I 38.00 I 57.0 I 0.571 I 24.033 I I ARM B I 3.50 I 7.00 I 0.00 I 10.00 I 38.00 I 70.0 I 0.594 I 28.715 I I ARM C I 2.50 I 5.00 I 10.00 I 25.00 I 38.00 I 40.0 I 0.528 I 19.149 I I ARM D I 5.50 I 10.00 I 20.00 I 25.00 I 38.00 I 56.0 I 0.735 I 37.690 I ----------------------------------------------------------------------------------------------------------------------- V = approach half-width L = effective flare length D = inscribed circle diameter E = entry width R = entry radius PHI = entry angle
TRAFFIC DEMAND DATA ------------------- (Only sets included in the current run are shown)
----------------------- I ARM I FLOW SCALE(%) I ----------------------- I A I 100 I I B I 100 I I C I 100 I I D I 100 I -----------------------
TIME PERIOD BEGINS 07.45 AND ENDS 09.15
LENGTH OF TIME PERIOD - 90 MINUTES. LENGTH OF TIME SEGMENT - 15 MINUTES.

-------------------------------------------------------------------------------- TRL TRL VIEWER 3.0 AC t:\M-EC Job Book\20111\capacity assessments\2021 + DEV Dove Way-Derby Rd rdbt AM.vao - Page 2 -------------------------------------------------------------------------------- DEMAND FLOW PROFILES ARE SYNTHESISED FROM TURNING COUNT DATA DEMAND SET TITLE: The Dove Way ----------------------------------------------------------------------------- I I NUMBER OF MINUTES FROM START WHEN I RATE OF FLOW (VEH/MIN) I I ARM I FLOW STARTS I TOP OF PEAK I FLOW STOPS I BEFORE I AT TOP I AFTER I I I TO RISE I IS REACHED IFALLING I PEAK I OF PEAK I PEAK I ----------------------------------------------------------------------------- I ARM A I 15.00 I 45.00 I 75.00 I 8.00 I 12.00 I 8.00 I I ARM B I 15.00 I 45.00 I 75.00 I 12.79 I 19.18 I 12.79 I I ARM C I 15.00 I 45.00 I 75.00 I 0.04 I 0.06 I 0.04 I I ARM D I 15.00 I 45.00 I 75.00 I 6.16 I 9.24 I 6.16 I ----------------------------------------------------------------------------- DEMAND SET TITLE: The Dove Way
-------------------------------------------------------------------- I I TURNING PROPORTIONS I I I TURNING COUNTS (VEH/HR) I I I (PERCENTAGE OF H.V.S) I I ----------------------------------------------- I TIME I FROM/TO I ARM A I ARM B I ARM C I ARM D I -------------------------------------------------------------------- I 07.45 - 09.15 I I I I I I I I ARM A I 0.000 I 0.819 I 0.002 I 0.180 I I I I 0.0 I 524.0 I 1.0 I 115.0 I I I I ( 10.0)I ( 10.0)I ( 10.0)I ( 10.0)I I I I I I I I I I ARM B I 0.549 I 0.000 I 0.000 I 0.451 I I I I 562.0 I 0.0 I 0.0 I 461.0 I I I I ( 10.0)I ( 10.0)I ( 10.0)I ( 10.0)I I I I I I I I I I ARM C I 0.667 I 0.333 I 0.000 I 0.000 I I I I 2.0 I 1.0 I 0.0 I 0.0 I I I I ( 10.0)I ( 10.0)I ( 10.0)I ( 10.0)I I I I I I I I I I ARM D I 0.118 I 0.880 I 0.002 I 0.000 I I I I 58.0 I 434.0 I 1.0 I 0.0 I I I I ( 10.0)I ( 10.0)I ( 10.0)I ( 10.0)I I I I I I I I --------------------------------------------------------------------
QUEUE AND DELAY INFORMATION FOR EACH 15 MIN TIME SEGMENT --------------------------------------------------------
------------------------------------------------------------------------------------------------------------------ I TIME DEMAND CAPACITY DEMAND/ PEDESTRIAN START END DELAY GEOMETRIC DELAY AVERAGE DELAY I I (VEH/MIN) (VEH/MIN) CAPACITY FLOW QUEUE QUEUE (VEH.MIN/ (VEH.MIN/ PER ARRIVING I I (RFC) (PEDS/MIN) (VEHS) (VEHS) TIME SEGMENT) TIME SEGMENT) VEHICLE (MIN) I I 07.45-08.00 I I ARM A 8.00 18.75 0.427 0.0 0.7 10.6 0.09 I I ARM B 12.79 25.24 0.507 0.0 1.0 14.7 0.08 I I ARM C 0.04 9.94 0.004 0.0 0.0 0.1 0.10 I I ARM D 6.16 29.10 0.212 0.0 0.3 3.9 0.04 I I I ------------------------------------------------------------------------------------------------------------------
------------------------------------------------------------------------------------------------------------------ I TIME DEMAND CAPACITY DEMAND/ PEDESTRIAN START END DELAY GEOMETRIC DELAY AVERAGE DELAY I I (VEH/MIN) (VEH/MIN) CAPACITY FLOW QUEUE QUEUE (VEH.MIN/ (VEH.MIN/ PER ARRIVING I I (RFC) (PEDS/MIN) (VEHS) (VEHS) TIME SEGMENT) TIME SEGMENT) VEHICLE (MIN) I I 08.00-08.15 I I ARM A 9.55 18.14 0.527 0.7 1.1 15.9 0.12 I I ARM B 15.27 25.07 0.609 1.0 1.5 22.1 0.10 I I ARM C 0.04 8.46 0.005 0.0 0.0 0.1 0.12 I I ARM D 7.36 28.08 0.262 0.3 0.4 5.2 0.05 I I I ------------------------------------------------------------------------------------------------------------------
------------------------------------------------------------------------------------------------------------------ I TIME DEMAND CAPACITY DEMAND/ PEDESTRIAN START END DELAY GEOMETRIC DELAY AVERAGE DELAY I I (VEH/MIN) (VEH/MIN) CAPACITY FLOW QUEUE QUEUE (VEH.MIN/ (VEH.MIN/ PER ARRIVING I I (RFC) (PEDS/MIN) (VEHS) (VEHS) TIME SEGMENT) TIME SEGMENT) VEHICLE (MIN) I I 08.15-08.30 I I ARM A 11.70 17.30 0.676 1.1 2.0 28.4 0.17 I I ARM B 18.70 24.84 0.753 1.5 2.9 40.8 0.16 I I ARM C 0.05 6.48 0.008 0.0 0.0 0.1 0.16 I I ARM D 9.01 26.71 0.337 0.4 0.5 7.5 0.06 I I I ------------------------------------------------------------------------------------------------------------------
------------------------------------------------------------------------------------------------------------------ I TIME DEMAND CAPACITY DEMAND/ PEDESTRIAN START END DELAY GEOMETRIC DELAY AVERAGE DELAY I I (VEH/MIN) (VEH/MIN) CAPACITY FLOW QUEUE QUEUE (VEH.MIN/ (VEH.MIN/ PER ARRIVING I I (RFC) (PEDS/MIN) (VEHS) (VEHS) TIME SEGMENT) TIME SEGMENT) VEHICLE (MIN) I I 08.30-08.45 I I ARM A 11.70 17.30 0.676 2.0 2.1 30.6 0.18 I I ARM B 18.70 24.83 0.753 2.9 3.0 44.4 0.16 I I ARM C 0.05 6.43 0.009 0.0 0.0 0.1 0.16 I I ARM D 9.01 26.68 0.338 0.5 0.5 7.6 0.06 I I I ------------------------------------------------------------------------------------------------------------------

-------------------------------------------------------------------------------- TRL TRL VIEWER 3.0 AC t:\M-EC Job Book\20111\capacity assessments\2021 + DEV Dove Way-Derby Rd rdbt AM.vao - Page 3 -------------------------------------------------------------------------------- ------------------------------------------------------------------------------------------------------------------ I TIME DEMAND CAPACITY DEMAND/ PEDESTRIAN START END DELAY GEOMETRIC DELAY AVERAGE DELAY I I (VEH/MIN) (VEH/MIN) CAPACITY FLOW QUEUE QUEUE (VEH.MIN/ (VEH.MIN/ PER ARRIVING I I (RFC) (PEDS/MIN) (VEHS) (VEHS) TIME SEGMENT) TIME SEGMENT) VEHICLE (MIN) I I 08.45-09.00 I I ARM A 9.55 18.13 0.527 2.1 1.1 17.7 0.12 I I ARM B 15.27 25.06 0.609 3.0 1.6 24.9 0.10 I I ARM C 0.04 8.39 0.005 0.0 0.0 0.1 0.12 I I ARM D 7.36 28.03 0.263 0.5 0.4 5.4 0.05 I I I ------------------------------------------------------------------------------------------------------------------
------------------------------------------------------------------------------------------------------------------ I TIME DEMAND CAPACITY DEMAND/ PEDESTRIAN START END DELAY GEOMETRIC DELAY AVERAGE DELAY I I (VEH/MIN) (VEH/MIN) CAPACITY FLOW QUEUE QUEUE (VEH.MIN/ (VEH.MIN/ PER ARRIVING I I (RFC) (PEDS/MIN) (VEHS) (VEHS) TIME SEGMENT) TIME SEGMENT) VEHICLE (MIN) I I 09.00-09.15 I I ARM A 8.00 18.73 0.427 1.1 0.8 11.6 0.09 I I ARM B 12.79 25.23 0.507 1.6 1.0 16.1 0.08 I I ARM C 0.04 9.88 0.004 0.0 0.0 0.1 0.10 I I ARM D 6.16 29.06 0.212 0.4 0.3 4.1 0.04 I I I ------------------------------------------------------------------------------------------------------------------
QUEUE AT ARM A -------------- TIME SEGMENT NO. OF ENDING VEHICLES IN QUEUE 08.00 0.7 * 08.15 1.1 * 08.30 2.0 ** 08.45 2.1 ** 09.00 1.1 * 09.15 0.8 *
QUEUE AT ARM B -------------- TIME SEGMENT NO. OF ENDING VEHICLES IN QUEUE 08.00 1.0 * 08.15 1.5 ** 08.30 2.9 *** 08.45 3.0 *** 09.00 1.6 ** 09.15 1.0 *
QUEUE AT ARM C -------------- TIME SEGMENT NO. OF ENDING VEHICLES IN QUEUE 08.00 0.0 08.15 0.0 08.30 0.0 08.45 0.0 09.00 0.0 09.15 0.0
QUEUE AT ARM D -------------- TIME SEGMENT NO. OF ENDING VEHICLES IN QUEUE 08.00 0.3 08.15 0.4 08.30 0.5 * 08.45 0.5 * 09.00 0.4 09.15 0.3

-------------------------------------------------------------------------------- TRL TRL VIEWER 3.0 AC t:\M-EC Job Book\20111\capacity assessments\2021 + DEV Dove Way-Derby Rd rdbt AM.vao - Page 4 -------------------------------------------------------------------------------- QUEUEING DELAY INFORMATION OVER WHOLE PERIOD -------------------------------------------- ---------------------------------------------------------------------------- I ARM I TOTAL DEMAND I * QUEUEING * I * INCLUSIVE QUEUEING * I I I I * DELAY * I * DELAY * I I I------------------------------------------------------------------I I I (VEH) (VEH/H) I (MIN) (MIN/VEH) I (MIN) (MIN/VEH) I ---------------------------------------------------------------------------- I A I 877.6 I 585.1 I 114.8 I 0.13 I 114.8 I 0.13 I I B I 1402.7 I 935.2 I 163.0 I 0.12 I 163.0 I 0.12 I I C I 4.1 I 2.7 I 0.5 I 0.13 I 0.5 I 0.13 I I D I 676.0 I 450.7 I 33.8 I 0.05 I 33.8 I 0.05 I ---------------------------------------------------------------------------- I ALL I 2960.4 I 1973.6 I 312.2 I 0.11 I 312.2 I 0.11 I ---------------------------------------------------------------------------- * DELAY IS THAT OCCURRING ONLY WITHIN THE TIME PERIOD. * INCLUSIVE DELAY INCLUDES DELAY SUFFERED BY VEHICLES WHICH ARE STILL QUEUEING AFTER THE END OF THE TIME PERIOD. * THESE WILL ONLY BE SIGNIFICANTLY DIFFERENT IF THERE IS A LARGE QUEUE REMAINING AT THE END OF THE TIME PERIOD. END OF JOB ============================================= end of file ===============================================
[Printed at 11:53:44 on 05/08/2011]

-------------------------------------------------------------------------------- TRL TRL VIEWER 3.0 AC t:\M-EC Job Book\20111\capacity assessments\2021 + DEV Derby Rd-Dove Walk Mini rdbt AM.vao - Page 1 -------------------------------------------------------------------------------- ___________________ A R C A D Y 6 ___________________ ASSESSMENT OF ROUNDABOUT CAPACITY AND DELAY Analysis Program: Release 2.0 (MAR 2005) (c) Copyright TRL Limited, 2004 Adapted from ARCADY/3 which is Crown Copyright by permission of the controller of HMSO ______________________________________________________ For sales and distribution information, program advice and maintenance, contact: TRL Limited Tel: +44 (0) 1344 770018 Crowthorne House Fax: +44 (0) 1344 770864 Nine Mile Ride Email: [email protected] Wokingham, Berks. Web: www.trlsoftware.co.uk RG40 3GA,UK --------------------------------------------------------------------------------- THE USER OF THIS COMPUTER PROGRAM FOR THE SOLUTION OF AN ENGINEERING PROBLEM IS IN NO WAY RELIEVED OF THEIR RESPONSIBILITY FOR THE CORRECTNESS OF THE SOLUTION --------------------------------------------------------------------------------- Run with file:- "t:\M-EC Job Book\20111\capacity assessments\2021 + DEV Derby Rd-Dove Walk Mini rdbt AM.vai"(drive-on-the-left ) at 11:51:15 on Friday, 5 August 2011
FILE PROPERTIES *************** RUN TITLE: The Dove Way LOCATION: DATE: 05/07/2011 CLIENT: ENUMERATOR: trose [TIMROSE] JOB NUMBER: 20111 STATUS: DESCRIPTION:
INPUT DATA ********** ARM A - Dove Walk ARM B - Dove Fields ARM C - Derby Rd SW ARM D - Derby Rd NE
MINI-ROUNDABOUT GEOMETRIC DATA ------------------------------ LIGHTING CONDITIONS : NORMAL ROAD SURFACE CONDITION: NORMAL ---------------------------------------------------------------------------------------------------------------------- I ARM I V (m) I E (m) I Lm(M) I Vm(M) I A (M) I K (M) I G (%) I SLOPE I INTERCEPT I I I I I I I I I I I (PCU/MIN) I ---------------------------------------------------------------------------------------------------------------------- I ARM A I 2.00 I 4.00 I 10.00 I 2.00 I 8.00 I 2.50 I 0.00 I 0.515 I 14.021 I I ARM B I 4.00 I 5.00 I 5.00 I 4.00 I 11.50 I 3.50 I 0.00 I 0.585 I 14.549 I I ARM C I 2.50 I 3.50 I 15.00 I 2.50 I 16.50 I 13.00 I 0.00 I 0.538 I 14.583 I I ARM D I 3.50 I 4.40 I 2.00 I 3.50 I 10.00 I 2.50 I 0.00 I 0.548 I 15.607 I ---------------------------------------------------------------------------------------------------------------------- V = approach half-width Lm = effective flare length A = distance between arms E = entry width Vm = minimum approach half-width K = entry corner kerb line G = gradient over 50m
TRAFFIC DEMAND DATA ------------------- (Only sets included in the current run are shown)
----------------------- I ARM I FLOW SCALE(%) I ----------------------- I A I 100 I I B I 100 I I C I 100 I I D I 100 I -----------------------

-------------------------------------------------------------------------------- TRL TRL VIEWER 3.0 AC t:\M-EC Job Book\20111\capacity assessments\2021 + DEV Derby Rd-Dove Walk Mini rdbt AM.vao - Page 2 -------------------------------------------------------------------------------- TIME PERIOD BEGINS 07.45 AND ENDS 09.15
LENGTH OF TIME PERIOD - 90 MINUTES. LENGTH OF TIME SEGMENT - 15 MINUTES.
DEMAND FLOW PROFILES ARE SYNTHESISED FROM TURNING COUNT DATA DEMAND SET TITLE: The Dove Way ----------------------------------------------------------------------------- I I NUMBER OF MINUTES FROM START WHEN I RATE OF FLOW (VEH/MIN) I I ARM I FLOW STARTS I TOP OF PEAK I FLOW STOPS I BEFORE I AT TOP I AFTER I I I TO RISE I IS REACHED IFALLING I PEAK I OF PEAK I PEAK I ----------------------------------------------------------------------------- I ARM A I 15.00 I 45.00 I 75.00 I 0.56 I 0.84 I 0.56 I I ARM B I 15.00 I 45.00 I 75.00 I 1.16 I 1.74 I 1.16 I I ARM C I 15.00 I 45.00 I 75.00 I 7.82 I 11.74 I 7.82 I I ARM D I 15.00 I 45.00 I 75.00 I 8.79 I 13.18 I 8.79 I ----------------------------------------------------------------------------- DEMAND SET TITLE: The Dove Way
-------------------------------------------------------------------- I I TURNING PROPORTIONS I I I TURNING COUNTS (VEH/HR) I I I (PERCENTAGE OF H.V.S) I I ----------------------------------------------- I TIME I FROM/TO I ARM A I ARM B I ARM C I ARM D I -------------------------------------------------------------------- I 07.45 - 09.15 I I I I I I I I ARM A I 0.000 I 0.111 I 0.200 I 0.689 I I I I 0.0 I 5.0 I 9.0 I 31.0 I I I I ( 10.0)I ( 10.0)I ( 10.0)I ( 10.0)I I I I I I I I I I ARM B I 0.022 I 0.000 I 0.258 I 0.720 I I I I 2.0 I 0.0 I 24.0 I 67.0 I I I I ( 10.0)I ( 10.0)I ( 10.0)I ( 10.0)I I I I I I I I I I ARM C I 0.005 I 0.129 I 0.000 I 0.866 I I I I 3.0 I 81.0 I 0.0 I 542.0 I I I I ( 10.0)I ( 10.0)I ( 10.0)I ( 10.0)I I I I I I I I I I ARM D I 0.001 I 0.127 I 0.872 I 0.000 I I I I 1.0 I 89.0 I 613.0 I 0.0 I I I I ( 10.0)I ( 10.0)I ( 10.0)I ( 10.0)I I I I I I I I --------------------------------------------------------------------
QUEUE AND DELAY INFORMATION FOR EACH 15 MIN TIME SEGMENT --------------------------------------------------------
------------------------------------------------------------------------------------------------------------------ I TIME DEMAND CAPACITY DEMAND/ CROSSING START END DELAY AVERAGE DELAY I I (VEH/MIN) (VEH/MIN) CAPACITY USE QUEUE QUEUE (VEH.MIN/ PER ARRIVING I I (RFC) PER MIN (VEHS) (VEHS) TIME SEGMENT) VEHICLE (MIN) I I 07.45-08.00 I I ARM A 0.56 7.77 0.072 0.0 0.1 1.1 0.14 I I ARM B 1.16 8.52 0.136 0.0 0.2 2.3 0.14 I I ARM C 7.82 12.59 0.621 0.0 1.6 21.9 0.20 I I ARM D 8.79 13.61 0.646 0.0 1.8 24.2 0.20 I I I ------------------------------------------------------------------------------------------------------------------
------------------------------------------------------------------------------------------------------------------ I TIME DEMAND CAPACITY DEMAND/ CROSSING START END DELAY AVERAGE DELAY I I (VEH/MIN) (VEH/MIN) CAPACITY USE QUEUE QUEUE (VEH.MIN/ PER ARRIVING I I (RFC) PER MIN (VEHS) (VEHS) TIME SEGMENT) VEHICLE (MIN) I I 08.00-08.15 I I ARM A 0.67 6.78 0.099 0.1 0.1 1.6 0.16 I I ARM B 1.39 7.58 0.183 0.2 0.2 3.2 0.16 I I ARM C 9.34 12.46 0.750 1.6 2.8 38.0 0.31 I I ARM D 10.49 13.49 0.778 1.8 3.2 43.5 0.31 I I I ------------------------------------------------------------------------------------------------------------------
------------------------------------------------------------------------------------------------------------------ I TIME DEMAND CAPACITY DEMAND/ CROSSING START END DELAY AVERAGE DELAY I I (VEH/MIN) (VEH/MIN) CAPACITY USE QUEUE QUEUE (VEH.MIN/ PER ARRIVING I I (RFC) PER MIN (VEHS) (VEHS) TIME SEGMENT) VEHICLE (MIN) I I 08.15-08.30 I I ARM A 0.82 5.66 0.145 0.1 0.2 2.4 0.21 I I ARM B 1.70 6.51 0.261 0.2 0.3 5.0 0.21 I I ARM C 11.44 12.28 0.932 2.8 8.2 94.9 0.69 I I ARM D 12.85 13.35 0.962 3.2 10.6 117.8 0.76 I I I ------------------------------------------------------------------------------------------------------------------

-------------------------------------------------------------------------------- TRL TRL VIEWER 3.0 AC t:\M-EC Job Book\20111\capacity assessments\2021 + DEV Derby Rd-Dove Walk Mini rdbt AM.vao - Page 3 -------------------------------------------------------------------------------- ------------------------------------------------------------------------------------------------------------------ I TIME DEMAND CAPACITY DEMAND/ CROSSING START END DELAY AVERAGE DELAY I I (VEH/MIN) (VEH/MIN) CAPACITY USE QUEUE QUEUE (VEH.MIN/ PER ARRIVING I I (RFC) PER MIN (VEHS) (VEHS) TIME SEGMENT) VEHICLE (MIN) I I 08.30-08.45 I I ARM A 0.82 5.48 0.150 0.2 0.2 2.6 0.21 I I ARM B 1.70 6.35 0.268 0.3 0.4 5.4 0.21 I I ARM C 11.44 12.27 0.932 8.2 9.7 135.5 0.91 I I ARM D 12.85 13.34 0.964 10.6 13.5 182.3 1.11 I I I ------------------------------------------------------------------------------------------------------------------
------------------------------------------------------------------------------------------------------------------ I TIME DEMAND CAPACITY DEMAND/ CROSSING START END DELAY AVERAGE DELAY I I (VEH/MIN) (VEH/MIN) CAPACITY USE QUEUE QUEUE (VEH.MIN/ PER ARRIVING I I (RFC) PER MIN (VEHS) (VEHS) TIME SEGMENT) VEHICLE (MIN) I I 08.45-09.00 I I ARM A 0.67 6.37 0.105 0.2 0.1 1.9 0.18 I I ARM B 1.39 7.20 0.193 0.4 0.2 3.8 0.17 I I ARM C 9.34 12.45 0.750 9.7 3.3 62.5 0.42 I I ARM D 10.49 13.45 0.780 13.5 3.9 84.4 0.51 I I I ------------------------------------------------------------------------------------------------------------------
------------------------------------------------------------------------------------------------------------------ I TIME DEMAND CAPACITY DEMAND/ CROSSING START END DELAY AVERAGE DELAY I I (VEH/MIN) (VEH/MIN) CAPACITY USE QUEUE QUEUE (VEH.MIN/ PER ARRIVING I I (RFC) PER MIN (VEHS) (VEHS) TIME SEGMENT) VEHICLE (MIN) I I 09.00-09.15 I I ARM A 0.56 7.63 0.074 0.1 0.1 1.2 0.14 I I ARM B 1.16 8.38 0.139 0.2 0.2 2.5 0.14 I I ARM C 7.82 12.58 0.622 3.3 1.7 27.4 0.22 I I ARM D 8.79 13.59 0.647 3.9 1.9 30.9 0.22 I I I ------------------------------------------------------------------------------------------------------------------
QUEUE AT ARM A -------------- TIME SEGMENT NO. OF ENDING VEHICLES IN QUEUE 08.00 0.1 08.15 0.1 08.30 0.2 08.45 0.2 09.00 0.1 09.15 0.1
QUEUE AT ARM B -------------- TIME SEGMENT NO. OF ENDING VEHICLES IN QUEUE 08.00 0.2 08.15 0.2 08.30 0.3 08.45 0.4 09.00 0.2 09.15 0.2
QUEUE AT ARM C -------------- TIME SEGMENT NO. OF ENDING VEHICLES IN QUEUE 08.00 1.6 ** 08.15 2.8 *** 08.30 8.2 ******** 08.45 9.7 ********** 09.00 3.3 *** 09.15 1.7 **

-------------------------------------------------------------------------------- TRL TRL VIEWER 3.0 AC t:\M-EC Job Book\20111\capacity assessments\2021 + DEV Derby Rd-Dove Walk Mini rdbt AM.vao - Page 4 -------------------------------------------------------------------------------- QUEUE AT ARM D -------------- TIME SEGMENT NO. OF ENDING VEHICLES IN QUEUE 08.00 1.8 ** 08.15 3.2 *** 08.30 10.6 *********** 08.45 13.5 ************* 09.00 3.9 **** 09.15 1.9 **
QUEUEING DELAY INFORMATION OVER WHOLE PERIOD -------------------------------------------- ---------------------------------------------------------------------------- I ARM I TOTAL DEMAND I * QUEUEING * I * INCLUSIVE QUEUEING * I I I I * DELAY * I * DELAY * I I I------------------------------------------------------------------I I I (VEH) (VEH/H) I (MIN) (MIN/VEH) I (MIN) (MIN/VEH) I ---------------------------------------------------------------------------- I A I 61.7 I 41.1 I 10.8 I 0.18 I 10.8 I 0.18 I I B I 127.5 I 85.0 I 22.1 I 0.17 I 22.1 I 0.17 I I C I 858.4 I 572.3 I 380.3 I 0.44 I 380.4 I 0.44 I I D I 964.0 I 642.6 I 483.0 I 0.50 I 483.2 I 0.50 I ---------------------------------------------------------------------------- I ALL I 2011.6 I 1341.0 I 896.2 I 0.45 I 896.5 I 0.45 I ---------------------------------------------------------------------------- * DELAY IS THAT OCCURRING ONLY WITHIN THE TIME PERIOD. * INCLUSIVE DELAY INCLUDES DELAY SUFFERED BY VEHICLES WHICH ARE STILL QUEUEING AFTER THE END OF THE TIME PERIOD. * THESE WILL ONLY BE SIGNIFICANTLY DIFFERENT IF THERE IS A LARGE QUEUE REMAINING AT THE END OF THE TIME PERIOD. END OF JOB ============================================= end of file ===============================================
[Printed at 11:51:22 on 05/08/2011]

-------------------------------------------------------------------------------- TRL TRL VIEWER 3.0 AC t:\M-EC Job Book\20111\capacity assessments\2021 + DEV A518-B5030 Spath rdbt AM.vao - Page 1 -------------------------------------------------------------------------------- ___________________ A R C A D Y 6 ___________________ ASSESSMENT OF ROUNDABOUT CAPACITY AND DELAY Analysis Program: Release 2.0 (MAR 2005) (c) Copyright TRL Limited, 2004 Adapted from ARCADY/3 which is Crown Copyright by permission of the controller of HMSO ______________________________________________________ For sales and distribution information, program advice and maintenance, contact: TRL Limited Tel: +44 (0) 1344 770018 Crowthorne House Fax: +44 (0) 1344 770864 Nine Mile Ride Email: [email protected] Wokingham, Berks. Web: www.trlsoftware.co.uk RG40 3GA,UK --------------------------------------------------------------------------------- THE USER OF THIS COMPUTER PROGRAM FOR THE SOLUTION OF AN ENGINEERING PROBLEM IS IN NO WAY RELIEVED OF THEIR RESPONSIBILITY FOR THE CORRECTNESS OF THE SOLUTION --------------------------------------------------------------------------------- Run with file:- "t:\M-EC Job Book\20111\capacity assessments\2021 + DEV A518-B5030 Spath rdbt AM.vai"(drive-on-the-left ) at 11:48:35 on Friday, 5 August 2011
FILE PROPERTIES *************** RUN TITLE: A518/B5030 Spath Rdbt LOCATION: DATE: 04/07/2011 CLIENT: ENUMERATOR: trose [TIMROSE] JOB NUMBER: 20111 STATUS: DESCRIPTION:
INPUT DATA ********** ARM A - A518 The Dove Way ARM B - A518 ARM C - B5030
GEOMETRIC DATA -------------- ----------------------------------------------------------------------------------------------------------------------- I ARM I V (M) I E (M) I L (M) I R (M) I D (M) I PHI (DEG) I SLOPE I INTERCEPT (PCU/MIN) I ----------------------------------------------------------------------------------------------------------------------- I ARM A I 4.00 I 8.00 I 30.00 I 35.00 I 58.00 I 54.0 I 0.593 I 32.218 I I ARM B I 5.00 I 6.00 I 15.00 I 45.00 I 58.00 I 53.0 I 0.549 I 27.864 I I ARM C I 4.50 I 8.00 I 30.00 I 40.00 I 58.00 I 57.0 I 0.600 I 33.131 I ----------------------------------------------------------------------------------------------------------------------- V = approach half-width L = effective flare length D = inscribed circle diameter E = entry width R = entry radius PHI = entry angle
TRAFFIC DEMAND DATA ------------------- (Only sets included in the current run are shown)
----------------------- I ARM I FLOW SCALE(%) I ----------------------- I A I 100 I I B I 100 I I C I 100 I -----------------------
TIME PERIOD BEGINS 07.45 AND ENDS 09.15
LENGTH OF TIME PERIOD - 90 MINUTES. LENGTH OF TIME SEGMENT - 15 MINUTES.

-------------------------------------------------------------------------------- TRL TRL VIEWER 3.0 AC t:\M-EC Job Book\20111\capacity assessments\2021 + DEV A518-B5030 Spath rdbt AM.vao - Page 2 -------------------------------------------------------------------------------- DEMAND FLOW PROFILES ARE SYNTHESISED FROM TURNING COUNT DATA DEMAND SET TITLE: A518/B5030 Spath Rdbt ----------------------------------------------------------------------------- I I NUMBER OF MINUTES FROM START WHEN I RATE OF FLOW (VEH/MIN) I I ARM I FLOW STARTS I TOP OF PEAK I FLOW STOPS I BEFORE I AT TOP I AFTER I I I TO RISE I IS REACHED IFALLING I PEAK I OF PEAK I PEAK I ----------------------------------------------------------------------------- I ARM A I 15.00 I 45.00 I 75.00 I 5.66 I 8.49 I 5.66 I I ARM B I 15.00 I 45.00 I 75.00 I 9.29 I 13.93 I 9.29 I I ARM C I 15.00 I 45.00 I 75.00 I 10.93 I 16.39 I 10.93 I ----------------------------------------------------------------------------- DEMAND SET TITLE: A518/B5030 Spath Rdbt
----------------------------------------------------------- I I TURNING PROPORTIONS I I I TURNING COUNTS (VEH/HR) I I I (PERCENTAGE OF H.V.S) I I -------------------------------------- I TIME I FROM/TO I ARM A I ARM B I ARM C I ----------------------------------------------------------- I 07.45 - 09.15 I I I I I I I ARM A I 0.000 I 0.565 I 0.435 I I I I 0.0 I 256.0 I 197.0 I I I I ( 10.0)I ( 10.0)I ( 10.0)I I I I I I I I I ARM B I 0.405 I 0.000 I 0.595 I I I I 301.0 I 0.0 I 442.0 I I I I ( 10.0)I ( 10.0)I ( 10.0)I I I I I I I I I ARM C I 0.198 I 0.802 I 0.000 I I I I 173.0 I 701.0 I 0.0 I I I I ( 10.0)I ( 10.0)I ( 10.0)I I I I I I I -----------------------------------------------------------
QUEUE AND DELAY INFORMATION FOR EACH 15 MIN TIME SEGMENT --------------------------------------------------------
------------------------------------------------------------------------------------------------------------------ I TIME DEMAND CAPACITY DEMAND/ PEDESTRIAN START END DELAY GEOMETRIC DELAY AVERAGE DELAY I I (VEH/MIN) (VEH/MIN) CAPACITY FLOW QUEUE QUEUE (VEH.MIN/ (VEH.MIN/ PER ARRIVING I I (RFC) (PEDS/MIN) (VEHS) (VEHS) TIME SEGMENT) TIME SEGMENT) VEHICLE (MIN) I I 07.45-08.00 I I ARM A 5.66 24.12 0.235 0.0 0.3 4.5 0.05 I I ARM B 9.29 23.98 0.387 0.0 0.6 9.1 0.07 I I ARM C 10.93 27.87 0.392 0.0 0.6 9.4 0.06 I I I ------------------------------------------------------------------------------------------------------------------
------------------------------------------------------------------------------------------------------------------ I TIME DEMAND CAPACITY DEMAND/ PEDESTRIAN START END DELAY GEOMETRIC DELAY AVERAGE DELAY I I (VEH/MIN) (VEH/MIN) CAPACITY FLOW QUEUE QUEUE (VEH.MIN/ (VEH.MIN/ PER ARRIVING I I (RFC) (PEDS/MIN) (VEHS) (VEHS) TIME SEGMENT) TIME SEGMENT) VEHICLE (MIN) I I 08.00-08.15 I I ARM A 6.76 23.10 0.293 0.3 0.4 6.1 0.06 I I ARM B 11.09 23.72 0.468 0.6 0.9 12.7 0.08 I I ARM C 13.05 27.42 0.476 0.6 0.9 13.2 0.07 I I I ------------------------------------------------------------------------------------------------------------------
------------------------------------------------------------------------------------------------------------------ I TIME DEMAND CAPACITY DEMAND/ PEDESTRIAN START END DELAY GEOMETRIC DELAY AVERAGE DELAY I I (VEH/MIN) (VEH/MIN) CAPACITY FLOW QUEUE QUEUE (VEH.MIN/ (VEH.MIN/ PER ARRIVING I I (RFC) (PEDS/MIN) (VEHS) (VEHS) TIME SEGMENT) TIME SEGMENT) VEHICLE (MIN) I I 08.15-08.30 I I ARM A 8.28 21.71 0.381 0.4 0.6 9.0 0.07 I I ARM B 13.58 23.36 0.582 0.9 1.4 19.8 0.10 I I ARM C 15.98 26.82 0.596 0.9 1.5 21.0 0.09 I I I ------------------------------------------------------------------------------------------------------------------
------------------------------------------------------------------------------------------------------------------ I TIME DEMAND CAPACITY DEMAND/ PEDESTRIAN START END DELAY GEOMETRIC DELAY AVERAGE DELAY I I (VEH/MIN) (VEH/MIN) CAPACITY FLOW QUEUE QUEUE (VEH.MIN/ (VEH.MIN/ PER ARRIVING I I (RFC) (PEDS/MIN) (VEHS) (VEHS) TIME SEGMENT) TIME SEGMENT) VEHICLE (MIN) I I 08.30-08.45 I I ARM A 8.28 21.69 0.382 0.6 0.6 9.2 0.07 I I ARM B 13.58 23.35 0.582 1.4 1.4 20.6 0.10 I I ARM C 15.98 26.81 0.596 1.5 1.5 21.9 0.09 I I I ------------------------------------------------------------------------------------------------------------------

-------------------------------------------------------------------------------- TRL TRL VIEWER 3.0 AC t:\M-EC Job Book\20111\capacity assessments\2021 + DEV A518-B5030 Spath rdbt AM.vao - Page 3 -------------------------------------------------------------------------------- ------------------------------------------------------------------------------------------------------------------ I TIME DEMAND CAPACITY DEMAND/ PEDESTRIAN START END DELAY GEOMETRIC DELAY AVERAGE DELAY I I (VEH/MIN) (VEH/MIN) CAPACITY FLOW QUEUE QUEUE (VEH.MIN/ (VEH.MIN/ PER ARRIVING I I (RFC) (PEDS/MIN) (VEHS) (VEHS) TIME SEGMENT) TIME SEGMENT) VEHICLE (MIN) I I 08.45-09.00 I I ARM A 6.76 23.07 0.293 0.6 0.4 6.4 0.06 I I ARM B 11.09 23.71 0.468 1.4 0.9 13.7 0.08 I I ARM C 13.05 27.41 0.476 1.5 0.9 14.1 0.07 I I I ------------------------------------------------------------------------------------------------------------------
------------------------------------------------------------------------------------------------------------------ I TIME DEMAND CAPACITY DEMAND/ PEDESTRIAN START END DELAY GEOMETRIC DELAY AVERAGE DELAY I I (VEH/MIN) (VEH/MIN) CAPACITY FLOW QUEUE QUEUE (VEH.MIN/ (VEH.MIN/ PER ARRIVING I I (RFC) (PEDS/MIN) (VEHS) (VEHS) TIME SEGMENT) TIME SEGMENT) VEHICLE (MIN) I I 09.00-09.15 I I ARM A 5.66 24.09 0.235 0.4 0.3 4.7 0.05 I I ARM B 9.29 23.98 0.387 0.9 0.6 9.8 0.07 I I ARM C 10.93 27.86 0.392 0.9 0.6 9.9 0.06 I I I ------------------------------------------------------------------------------------------------------------------
QUEUE AT ARM A -------------- TIME SEGMENT NO. OF ENDING VEHICLES IN QUEUE 08.00 0.3 08.15 0.4 08.30 0.6 * 08.45 0.6 * 09.00 0.4 09.15 0.3
QUEUE AT ARM B -------------- TIME SEGMENT NO. OF ENDING VEHICLES IN QUEUE 08.00 0.6 * 08.15 0.9 * 08.30 1.4 * 08.45 1.4 * 09.00 0.9 * 09.15 0.6 *
QUEUE AT ARM C -------------- TIME SEGMENT NO. OF ENDING VEHICLES IN QUEUE 08.00 0.6 * 08.15 0.9 * 08.30 1.5 * 08.45 1.5 * 09.00 0.9 * 09.15 0.6 *
QUEUEING DELAY INFORMATION OVER WHOLE PERIOD -------------------------------------------- ---------------------------------------------------------------------------- I ARM I TOTAL DEMAND I * QUEUEING * I * INCLUSIVE QUEUEING * I I I I * DELAY * I * DELAY * I I I------------------------------------------------------------------I I I (VEH) (VEH/H) I (MIN) (MIN/VEH) I (MIN) (MIN/VEH) I ---------------------------------------------------------------------------- I A I 621.2 I 414.1 I 39.8 I 0.06 I 39.8 I 0.06 I I B I 1018.8 I 679.2 I 85.7 I 0.08 I 85.8 I 0.08 I I C I 1198.4 I 799.0 I 89.5 I 0.07 I 89.5 I 0.07 I ---------------------------------------------------------------------------- I ALL I 2838.4 I 1892.3 I 215.1 I 0.08 I 215.1 I 0.08 I ---------------------------------------------------------------------------- * DELAY IS THAT OCCURRING ONLY WITHIN THE TIME PERIOD. * INCLUSIVE DELAY INCLUDES DELAY SUFFERED BY VEHICLES WHICH ARE STILL QUEUEING AFTER THE END OF THE TIME PERIOD. * THESE WILL ONLY BE SIGNIFICANTLY DIFFERENT IF THERE IS A LARGE QUEUE REMAINING AT THE END OF THE TIME PERIOD. END OF JOB ============================================= end of file ===============================================

[Printed at 11:48:43 on 05/08/2011]

-------------------------------------------------------------------------------- TRL TRL VIEWER 3.0 AC t:\M-EC Job Book\20111\capacity assessments\2021 +DEV Dove Bank-Town Meadows rdbt AM.vao - Page 1 -------------------------------------------------------------------------------- ___________________ A R C A D Y 6 ___________________ ASSESSMENT OF ROUNDABOUT CAPACITY AND DELAY Analysis Program: Release 2.0 (MAR 2005) (c) Copyright TRL Limited, 2004 Adapted from ARCADY/3 which is Crown Copyright by permission of the controller of HMSO ______________________________________________________ For sales and distribution information, program advice and maintenance, contact: TRL Limited Tel: +44 (0) 1344 770018 Crowthorne House Fax: +44 (0) 1344 770864 Nine Mile Ride Email: [email protected] Wokingham, Berks. Web: www.trlsoftware.co.uk RG40 3GA,UK --------------------------------------------------------------------------------- THE USER OF THIS COMPUTER PROGRAM FOR THE SOLUTION OF AN ENGINEERING PROBLEM IS IN NO WAY RELIEVED OF THEIR RESPONSIBILITY FOR THE CORRECTNESS OF THE SOLUTION --------------------------------------------------------------------------------- Run with file:- "t:\M-EC Job Book\20111\capacity assessments\2021 +DEV Dove Bank-Town Meadows rdbt AM.vai"(drive-on-the-left ) at 11:56:46 on Friday, 5 August 2011
FILE PROPERTIES *************** RUN TITLE: The Dove Way LOCATION: DATE: 05/07/2011 CLIENT: ENUMERATOR: trose [TIMROSE] JOB NUMBER: 20111 STATUS: DESCRIPTION:
INPUT DATA ********** ARM A - Retail Access ARM B - Town Meadows Way ARM C - Dove Bank ARM D - A518
GEOMETRIC DATA -------------- ----------------------------------------------------------------------------------------------------------------------- I ARM I V (M) I E (M) I L (M) I R (M) I D (M) I PHI (DEG) I SLOPE I INTERCEPT (PCU/MIN) I ----------------------------------------------------------------------------------------------------------------------- I ARM A I 4.00 I 5.00 I 5.00 I 20.00 I 40.00 I 30.0 I 0.581 I 23.279 I I ARM B I 5.00 I 7.00 I 23.00 I 25.00 I 40.00 I 60.0 I 0.634 I 30.025 I I ARM C I 3.00 I 5.00 I 30.00 I 45.00 I 40.00 I 56.0 I 0.547 I 21.994 I I ARM D I 7.00 I 7.00 I 0.00 I 15.00 I 40.00 I 64.0 I 0.628 I 30.603 I ----------------------------------------------------------------------------------------------------------------------- V = approach half-width L = effective flare length D = inscribed circle diameter E = entry width R = entry radius PHI = entry angle
TRAFFIC DEMAND DATA ------------------- (Only sets included in the current run are shown)
----------------------- I ARM I FLOW SCALE(%) I ----------------------- I A I 100 I I B I 100 I I C I 100 I I D I 100 I -----------------------
TIME PERIOD BEGINS 07.45 AND ENDS 09.15
LENGTH OF TIME PERIOD - 90 MINUTES. LENGTH OF TIME SEGMENT - 15 MINUTES.

-------------------------------------------------------------------------------- TRL TRL VIEWER 3.0 AC t:\M-EC Job Book\20111\capacity assessments\2021 +DEV Dove Bank-Town Meadows rdbt AM.vao - Page 2 -------------------------------------------------------------------------------- DEMAND FLOW PROFILES ARE SYNTHESISED FROM TURNING COUNT DATA DEMAND SET TITLE: The Dove Way ----------------------------------------------------------------------------- I I NUMBER OF MINUTES FROM START WHEN I RATE OF FLOW (VEH/MIN) I I ARM I FLOW STARTS I TOP OF PEAK I FLOW STOPS I BEFORE I AT TOP I AFTER I I I TO RISE I IS REACHED IFALLING I PEAK I OF PEAK I PEAK I ----------------------------------------------------------------------------- I ARM A I 15.00 I 45.00 I 75.00 I 1.42 I 2.14 I 1.42 I I ARM B I 15.00 I 45.00 I 75.00 I 12.60 I 18.90 I 12.60 I I ARM C I 15.00 I 45.00 I 75.00 I 4.84 I 7.26 I 4.84 I I ARM D I 15.00 I 45.00 I 75.00 I 12.00 I 18.00 I 12.00 I ----------------------------------------------------------------------------- DEMAND SET TITLE: The Dove Way
-------------------------------------------------------------------- I I TURNING PROPORTIONS I I I TURNING COUNTS (VEH/HR) I I I (PERCENTAGE OF H.V.S) I I ----------------------------------------------- I TIME I FROM/TO I ARM A I ARM B I ARM C I ARM D I -------------------------------------------------------------------- I 07.45 - 09.15 I I I I I I I I ARM A I 0.000 I 0.377 I 0.105 I 0.518 I I I I 0.0 I 43.0 I 12.0 I 59.0 I I I I ( 10.0)I ( 10.0)I ( 10.0)I ( 10.0)I I I I I I I I I I ARM B I 0.085 I 0.000 I 0.100 I 0.814 I I I I 86.0 I 0.0 I 101.0 I 821.0 I I I I ( 10.0)I ( 10.0)I ( 10.0)I ( 10.0)I I I I I I I I I I ARM C I 0.194 I 0.437 I 0.000 I 0.370 I I I I 75.0 I 169.0 I 0.0 I 143.0 I I I I ( 10.0)I ( 10.0)I ( 10.0)I ( 10.0)I I I I I I I I I I ARM D I 0.044 I 0.750 I 0.206 I 0.000 I I I I 42.0 I 720.0 I 198.0 I 0.0 I I I I ( 10.0)I ( 10.0)I ( 10.0)I ( 10.0)I I I I I I I I --------------------------------------------------------------------
QUEUE AND DELAY INFORMATION FOR EACH 15 MIN TIME SEGMENT --------------------------------------------------------
------------------------------------------------------------------------------------------------------------------ I TIME DEMAND CAPACITY DEMAND/ PEDESTRIAN START END DELAY GEOMETRIC DELAY AVERAGE DELAY I I (VEH/MIN) (VEH/MIN) CAPACITY FLOW QUEUE QUEUE (VEH.MIN/ (VEH.MIN/ PER ARRIVING I I (RFC) (PEDS/MIN) (VEHS) (VEHS) TIME SEGMENT) TIME SEGMENT) VEHICLE (MIN) I I 07.45-08.00 I I ARM A 1.42 13.31 0.107 0.0 0.1 1.7 0.08 I I ARM B 12.60 25.18 0.500 0.0 1.0 14.3 0.08 I I ARM C 4.84 13.43 0.360 0.0 0.6 8.0 0.12 I I ARM D 12.00 25.25 0.475 0.0 0.9 13.0 0.07 I I I ------------------------------------------------------------------------------------------------------------------
------------------------------------------------------------------------------------------------------------------ I TIME DEMAND CAPACITY DEMAND/ PEDESTRIAN START END DELAY GEOMETRIC DELAY AVERAGE DELAY I I (VEH/MIN) (VEH/MIN) CAPACITY FLOW QUEUE QUEUE (VEH.MIN/ (VEH.MIN/ PER ARRIVING I I (RFC) (PEDS/MIN) (VEHS) (VEHS) TIME SEGMENT) TIME SEGMENT) VEHICLE (MIN) I I 08.00-08.15 I I ARM A 1.70 11.75 0.145 0.1 0.2 2.5 0.10 I I ARM B 15.05 24.76 0.608 1.0 1.5 22.0 0.10 I I ARM C 5.78 12.13 0.476 0.6 0.9 12.8 0.16 I I ARM D 14.33 24.74 0.579 0.9 1.4 19.7 0.10 I I I ------------------------------------------------------------------------------------------------------------------
------------------------------------------------------------------------------------------------------------------ I TIME DEMAND CAPACITY DEMAND/ PEDESTRIAN START END DELAY GEOMETRIC DELAY AVERAGE DELAY I I (VEH/MIN) (VEH/MIN) CAPACITY FLOW QUEUE QUEUE (VEH.MIN/ (VEH.MIN/ PER ARRIVING I I (RFC) (PEDS/MIN) (VEHS) (VEHS) TIME SEGMENT) TIME SEGMENT) VEHICLE (MIN) I I 08.15-08.30 I I ARM A 2.08 9.68 0.215 0.2 0.3 4.0 0.13 I I ARM B 18.43 24.19 0.762 1.5 3.1 42.4 0.17 I I ARM C 7.07 10.39 0.681 0.9 2.0 27.5 0.29 I I ARM D 17.55 24.07 0.729 1.4 2.6 36.5 0.15 I I I ------------------------------------------------------------------------------------------------------------------
------------------------------------------------------------------------------------------------------------------ I TIME DEMAND CAPACITY DEMAND/ PEDESTRIAN START END DELAY GEOMETRIC DELAY AVERAGE DELAY I I (VEH/MIN) (VEH/MIN) CAPACITY FLOW QUEUE QUEUE (VEH.MIN/ (VEH.MIN/ PER ARRIVING I I (RFC) (PEDS/MIN) (VEHS) (VEHS) TIME SEGMENT) TIME SEGMENT) VEHICLE (MIN) I I 08.30-08.45 I I ARM A 2.08 9.62 0.217 0.3 0.3 4.1 0.13 I I ARM B 18.43 24.18 0.762 3.1 3.1 46.5 0.17 I I ARM C 7.07 10.34 0.684 2.0 2.1 31.0 0.30 I I ARM D 17.55 24.03 0.730 2.6 2.7 39.5 0.15 I I I ------------------------------------------------------------------------------------------------------------------

-------------------------------------------------------------------------------- TRL TRL VIEWER 3.0 AC t:\M-EC Job Book\20111\capacity assessments\2021 +DEV Dove Bank-Town Meadows rdbt AM.vao - Page 3 -------------------------------------------------------------------------------- ------------------------------------------------------------------------------------------------------------------ I TIME DEMAND CAPACITY DEMAND/ PEDESTRIAN START END DELAY GEOMETRIC DELAY AVERAGE DELAY I I (VEH/MIN) (VEH/MIN) CAPACITY FLOW QUEUE QUEUE (VEH.MIN/ (VEH.MIN/ PER ARRIVING I I (RFC) (PEDS/MIN) (VEHS) (VEHS) TIME SEGMENT) TIME SEGMENT) VEHICLE (MIN) I I 08.45-09.00 I I ARM A 1.70 11.66 0.146 0.3 0.2 2.6 0.10 I I ARM B 15.05 24.74 0.608 3.1 1.6 24.8 0.11 I I ARM C 5.78 12.06 0.479 2.1 0.9 14.9 0.16 I I ARM D 14.33 24.69 0.580 2.7 1.4 22.0 0.10 I I I ------------------------------------------------------------------------------------------------------------------
------------------------------------------------------------------------------------------------------------------ I TIME DEMAND CAPACITY DEMAND/ PEDESTRIAN START END DELAY GEOMETRIC DELAY AVERAGE DELAY I I (VEH/MIN) (VEH/MIN) CAPACITY FLOW QUEUE QUEUE (VEH.MIN/ (VEH.MIN/ PER ARRIVING I I (RFC) (PEDS/MIN) (VEHS) (VEHS) TIME SEGMENT) TIME SEGMENT) VEHICLE (MIN) I I 09.00-09.15 I I ARM A 1.42 13.24 0.108 0.2 0.1 1.9 0.08 I I ARM B 12.60 25.16 0.501 1.6 1.0 15.7 0.08 I I ARM C 4.84 13.37 0.362 0.9 0.6 8.9 0.12 I I ARM D 12.00 25.22 0.476 1.4 0.9 14.1 0.08 I I I ------------------------------------------------------------------------------------------------------------------
QUEUE AT ARM A -------------- TIME SEGMENT NO. OF ENDING VEHICLES IN QUEUE 08.00 0.1 08.15 0.2 08.30 0.3 08.45 0.3 09.00 0.2 09.15 0.1
QUEUE AT ARM B -------------- TIME SEGMENT NO. OF ENDING VEHICLES IN QUEUE 08.00 1.0 * 08.15 1.5 ** 08.30 3.1 *** 08.45 3.1 *** 09.00 1.6 ** 09.15 1.0 *
QUEUE AT ARM C -------------- TIME SEGMENT NO. OF ENDING VEHICLES IN QUEUE 08.00 0.6 * 08.15 0.9 * 08.30 2.0 ** 08.45 2.1 ** 09.00 0.9 * 09.15 0.6 *
QUEUE AT ARM D -------------- TIME SEGMENT NO. OF ENDING VEHICLES IN QUEUE 08.00 0.9 * 08.15 1.4 * 08.30 2.6 *** 08.45 2.7 *** 09.00 1.4 * 09.15 0.9 *

-------------------------------------------------------------------------------- TRL TRL VIEWER 3.0 AC t:\M-EC Job Book\20111\capacity assessments\2021 +DEV Dove Bank-Town Meadows rdbt AM.vao - Page 4 -------------------------------------------------------------------------------- QUEUEING DELAY INFORMATION OVER WHOLE PERIOD -------------------------------------------- ---------------------------------------------------------------------------- I ARM I TOTAL DEMAND I * QUEUEING * I * INCLUSIVE QUEUEING * I I I I * DELAY * I * DELAY * I I I------------------------------------------------------------------I I I (VEH) (VEH/H) I (MIN) (MIN/VEH) I (MIN) (MIN/VEH) I ---------------------------------------------------------------------------- I A I 156.3 I 104.2 I 16.8 I 0.11 I 16.8 I 0.11 I I B I 1382.2 I 921.5 I 165.8 I 0.12 I 165.8 I 0.12 I I C I 530.7 I 353.8 I 103.2 I 0.19 I 103.2 I 0.19 I I D I 1316.4 I 877.6 I 144.8 I 0.11 I 144.8 I 0.11 I ---------------------------------------------------------------------------- I ALL I 3385.5 I 2257.0 I 430.5 I 0.13 I 430.5 I 0.13 I ---------------------------------------------------------------------------- * DELAY IS THAT OCCURRING ONLY WITHIN THE TIME PERIOD. * INCLUSIVE DELAY INCLUDES DELAY SUFFERED BY VEHICLES WHICH ARE STILL QUEUEING AFTER THE END OF THE TIME PERIOD. * THESE WILL ONLY BE SIGNIFICANTLY DIFFERENT IF THERE IS A LARGE QUEUE REMAINING AT THE END OF THE TIME PERIOD. END OF JOB ============================================= end of file ===============================================
[Printed at 11:56:52 on 05/08/2011]

-------------------------------------------------------------------------------- TRL TRL VIEWER 3.0 AC t:\M-EC Job Book\20111\capacity assessments\2021 + DEV A50-A518 rdbt PM.vao - Page 1 -------------------------------------------------------------------------------- ___________________ A R C A D Y 6 ___________________ ASSESSMENT OF ROUNDABOUT CAPACITY AND DELAY Analysis Program: Release 2.0 (MAR 2005) (c) Copyright TRL Limited, 2004 Adapted from ARCADY/3 which is Crown Copyright by permission of the controller of HMSO ______________________________________________________ For sales and distribution information, program advice and maintenance, contact: TRL Limited Tel: +44 (0) 1344 770018 Crowthorne House Fax: +44 (0) 1344 770864 Nine Mile Ride Email: [email protected] Wokingham, Berks. Web: www.trlsoftware.co.uk RG40 3GA,UK --------------------------------------------------------------------------------- THE USER OF THIS COMPUTER PROGRAM FOR THE SOLUTION OF AN ENGINEERING PROBLEM IS IN NO WAY RELIEVED OF THEIR RESPONSIBILITY FOR THE CORRECTNESS OF THE SOLUTION --------------------------------------------------------------------------------- Run with file:- "t:\M-EC Job Book\20111\capacity assessments\2021 + DEV A50-A518 rdbt PM.vai"(drive-on-the-left ) at 11:43:00 on Friday, 5 August 2011
FILE PROPERTIES *************** RUN TITLE: The Dove Way LOCATION: DATE: 05/07/2011 CLIENT: ENUMERATOR: trose [TIMROSE] JOB NUMBER: 20111 STATUS: DESCRIPTION:
INPUT DATA ********** ARM A - A50 East ARM B - A518 ARM C - A50 West ARM D - Access Road
GEOMETRIC DATA -------------- ----------------------------------------------------------------------------------------------------------------------- I ARM I V (M) I E (M) I L (M) I R (M) I D (M) I PHI (DEG) I SLOPE I INTERCEPT (PCU/MIN) I ----------------------------------------------------------------------------------------------------------------------- I ARM A I 10.00 I 12.00 I 20.00 I 25.00 I 78.00 I 48.0 I 0.704 I 55.088 I I ARM B I 5.50 I 10.00 I 30.00 I 30.00 I 78.00 I 46.0 I 0.585 I 41.438 I I ARM C I 5.00 I 7.00 I 20.00 I 30.00 I 78.00 I 49.0 I 0.492 I 31.269 I I ARM D I 4.00 I 5.00 I 15.00 I 30.00 I 78.00 I 38.0 I 0.437 I 24.083 I ----------------------------------------------------------------------------------------------------------------------- V = approach half-width L = effective flare length D = inscribed circle diameter E = entry width R = entry radius PHI = entry angle
TRAFFIC DEMAND DATA ------------------- (Only sets included in the current run are shown)
----------------------- I ARM I FLOW SCALE(%) I ----------------------- I A I 100 I I B I 100 I I C I 100 I I D I 100 I -----------------------
TIME PERIOD BEGINS 16.45 AND ENDS 18.15
LENGTH OF TIME PERIOD - 90 MINUTES. LENGTH OF TIME SEGMENT - 15 MINUTES.

-------------------------------------------------------------------------------- TRL TRL VIEWER 3.0 AC t:\M-EC Job Book\20111\capacity assessments\2021 + DEV A50-A518 rdbt PM.vao - Page 2 -------------------------------------------------------------------------------- DEMAND FLOW PROFILES ARE SYNTHESISED FROM TURNING COUNT DATA DEMAND SET TITLE: The Dove Way ----------------------------------------------------------------------------- I I NUMBER OF MINUTES FROM START WHEN I RATE OF FLOW (VEH/MIN) I I ARM I FLOW STARTS I TOP OF PEAK I FLOW STOPS I BEFORE I AT TOP I AFTER I I I TO RISE I IS REACHED IFALLING I PEAK I OF PEAK I PEAK I ----------------------------------------------------------------------------- I ARM A I 15.00 I 45.00 I 75.00 I 11.51 I 17.27 I 11.51 I I ARM B I 15.00 I 45.00 I 75.00 I 8.35 I 12.53 I 8.35 I I ARM C I 15.00 I 45.00 I 75.00 I 19.16 I 28.74 I 19.16 I I ARM D I 15.00 I 45.00 I 75.00 I 0.03 I 0.04 I 0.03 I ----------------------------------------------------------------------------- DEMAND SET TITLE: The Dove Way
-------------------------------------------------------------------- I I TURNING PROPORTIONS I I I TURNING COUNTS (VEH/HR) I I I (PERCENTAGE OF H.V.S) I I ----------------------------------------------- I TIME I FROM/TO I ARM A I ARM B I ARM C I ARM D I -------------------------------------------------------------------- I 16.45 - 18.15 I I I I I I I I ARM A I 0.000 I 0.320 I 0.679 I 0.001 I I I I 0.0 I 295.0 I 625.0 I 1.0 I I I I ( 10.0)I ( 10.0)I ( 10.0)I ( 10.0)I I I I I I I I I I ARM B I 0.457 I 0.000 I 0.540 I 0.003 I I I I 305.0 I 0.0 I 361.0 I 2.0 I I I I ( 10.0)I ( 10.0)I ( 10.0)I ( 10.0)I I I I I I I I I I ARM C I 0.772 I 0.224 I 0.000 I 0.003 I I I I 1184.0 I 344.0 I 0.0 I 5.0 I I I I ( 10.0)I ( 10.0)I ( 10.0)I ( 10.0)I I I I I I I I I I ARM D I 0.500 I 0.000 I 0.500 I 0.000 I I I I 1.0 I 0.0 I 1.0 I 0.0 I I I I ( 10.0)I ( 10.0)I ( 10.0)I ( 10.0)I I I I I I I I --------------------------------------------------------------------
QUEUE AND DELAY INFORMATION FOR EACH 15 MIN TIME SEGMENT --------------------------------------------------------
------------------------------------------------------------------------------------------------------------------ I TIME DEMAND CAPACITY DEMAND/ PEDESTRIAN START END DELAY GEOMETRIC DELAY AVERAGE DELAY I I (VEH/MIN) (VEH/MIN) CAPACITY FLOW QUEUE QUEUE (VEH.MIN/ (VEH.MIN/ PER ARRIVING I I (RFC) (PEDS/MIN) (VEHS) (VEHS) TIME SEGMENT) TIME SEGMENT) VEHICLE (MIN) I I 16.45-17.00 I I ARM A 11.51 47.07 0.245 0.0 0.3 4.8 0.03 I I ARM B 8.35 33.09 0.252 0.0 0.3 5.0 0.04 I I ARM C 19.16 26.54 0.722 0.0 2.5 35.0 0.13 I I ARM D 0.03 11.96 0.002 0.0 0.0 0.0 0.08 I I I ------------------------------------------------------------------------------------------------------------------
------------------------------------------------------------------------------------------------------------------ I TIME DEMAND CAPACITY DEMAND/ PEDESTRIAN START END DELAY GEOMETRIC DELAY AVERAGE DELAY I I (VEH/MIN) (VEH/MIN) CAPACITY FLOW QUEUE QUEUE (VEH.MIN/ (VEH.MIN/ PER ARRIVING I I (RFC) (PEDS/MIN) (VEHS) (VEHS) TIME SEGMENT) TIME SEGMENT) VEHICLE (MIN) I I 17.00-17.15 I I ARM A 13.75 46.49 0.296 0.3 0.4 6.2 0.03 I I ARM B 9.97 32.20 0.310 0.3 0.4 6.6 0.04 I I ARM C 22.88 26.16 0.875 2.5 6.1 79.4 0.27 I I ARM D 0.03 10.05 0.003 0.0 0.0 0.0 0.10 I I I ------------------------------------------------------------------------------------------------------------------
------------------------------------------------------------------------------------------------------------------ I TIME DEMAND CAPACITY DEMAND/ PEDESTRIAN START END DELAY GEOMETRIC DELAY AVERAGE DELAY I I (VEH/MIN) (VEH/MIN) CAPACITY FLOW QUEUE QUEUE (VEH.MIN/ (VEH.MIN/ PER ARRIVING I I (RFC) (PEDS/MIN) (VEHS) (VEHS) TIME SEGMENT) TIME SEGMENT) VEHICLE (MIN) I I 17.15-17.30 I I ARM A 16.84 46.07 0.365 0.4 0.6 8.5 0.03 I I ARM B 12.21 30.97 0.394 0.4 0.6 9.5 0.05 I I ARM C 28.02 25.66 1.092 6.1 46.6 411.1 1.21 I I ARM D 0.04 8.43 0.004 0.0 0.0 0.1 0.12 I I I ------------------------------------------------------------------------------------------------------------------
------------------------------------------------------------------------------------------------------------------ I TIME DEMAND CAPACITY DEMAND/ PEDESTRIAN START END DELAY GEOMETRIC DELAY AVERAGE DELAY I I (VEH/MIN) (VEH/MIN) CAPACITY FLOW QUEUE QUEUE (VEH.MIN/ (VEH.MIN/ PER ARRIVING I I (RFC) (PEDS/MIN) (VEHS) (VEHS) TIME SEGMENT) TIME SEGMENT) VEHICLE (MIN) I I 17.30-17.45 I I ARM A 16.84 46.02 0.366 0.6 0.6 8.6 0.03 I I ARM B 12.21 30.96 0.394 0.6 0.6 9.7 0.05 I I ARM C 28.02 25.65 1.092 46.6 83.0 972.6 2.65 I I ARM D 0.04 8.31 0.004 0.0 0.0 0.1 0.12 I I I ------------------------------------------------------------------------------------------------------------------

-------------------------------------------------------------------------------- TRL TRL VIEWER 3.0 AC t:\M-EC Job Book\20111\capacity assessments\2021 + DEV A50-A518 rdbt PM.vao - Page 3 -------------------------------------------------------------------------------- ------------------------------------------------------------------------------------------------------------------ I TIME DEMAND CAPACITY DEMAND/ PEDESTRIAN START END DELAY GEOMETRIC DELAY AVERAGE DELAY I I (VEH/MIN) (VEH/MIN) CAPACITY FLOW QUEUE QUEUE (VEH.MIN/ (VEH.MIN/ PER ARRIVING I I (RFC) (PEDS/MIN) (VEHS) (VEHS) TIME SEGMENT) TIME SEGMENT) VEHICLE (MIN) I I 17.45-18.00 I I ARM A 13.75 45.99 0.299 0.6 0.4 6.5 0.03 I I ARM B 9.97 32.19 0.310 0.6 0.5 6.9 0.05 I I ARM C 22.88 26.16 0.875 83.0 38.5 910.7 2.39 I I ARM D 0.03 8.65 0.003 0.0 0.0 0.1 0.12 I I I ------------------------------------------------------------------------------------------------------------------
------------------------------------------------------------------------------------------------------------------ I TIME DEMAND CAPACITY DEMAND/ PEDESTRIAN START END DELAY GEOMETRIC DELAY AVERAGE DELAY I I (VEH/MIN) (VEH/MIN) CAPACITY FLOW QUEUE QUEUE (VEH.MIN/ (VEH.MIN/ PER ARRIVING I I (RFC) (PEDS/MIN) (VEHS) (VEHS) TIME SEGMENT) TIME SEGMENT) VEHICLE (MIN) I I 18.00-18.15 I I ARM A 11.51 46.67 0.247 0.4 0.3 5.0 0.03 I I ARM B 8.35 33.08 0.252 0.5 0.3 5.1 0.04 I I ARM C 19.16 26.53 0.722 38.5 2.7 138.1 0.31 I I ARM D 0.03 10.85 0.002 0.0 0.0 0.0 0.09 I I I ------------------------------------------------------------------------------------------------------------------
QUEUE AT ARM A -------------- TIME SEGMENT NO. OF ENDING VEHICLES IN QUEUE 17.00 0.3 17.15 0.4 17.30 0.6 * 17.45 0.6 * 18.00 0.4 18.15 0.3
QUEUE AT ARM B -------------- TIME SEGMENT NO. OF ENDING VEHICLES IN QUEUE 17.00 0.3 17.15 0.4 17.30 0.6 * 17.45 0.6 * 18.00 0.5 18.15 0.3
QUEUE AT ARM C -------------- TIME SEGMENT NO. OF ENDING VEHICLES IN QUEUE 17.00 2.5 *** 17.15 6.1 ****** 17.30 46.6 *********************************************** 17.45 83.0 *********************************************************************************** 18.00 38.5 ************************************** 18.15 2.7 ***
QUEUE AT ARM D -------------- TIME SEGMENT NO. OF ENDING VEHICLES IN QUEUE 17.00 0.0 17.15 0.0 17.30 0.0 17.45 0.0 18.00 0.0 18.15 0.0

-------------------------------------------------------------------------------- TRL TRL VIEWER 3.0 AC t:\M-EC Job Book\20111\capacity assessments\2021 + DEV A50-A518 rdbt PM.vao - Page 4 -------------------------------------------------------------------------------- QUEUEING DELAY INFORMATION OVER WHOLE PERIOD -------------------------------------------- ---------------------------------------------------------------------------- I ARM I TOTAL DEMAND I * QUEUEING * I * INCLUSIVE QUEUEING * I I I I * DELAY * I * DELAY * I I I------------------------------------------------------------------I I I (VEH) (VEH/H) I (MIN) (MIN/VEH) I (MIN) (MIN/VEH) I ---------------------------------------------------------------------------- I A I 1262.9 I 841.9 I 39.6 I 0.03 I 39.6 I 0.03 I I B I 916.0 I 610.6 I 42.8 I 0.05 I 42.9 I 0.05 I I C I 2102.1 I 1401.4 I 2546.9 I 1.21 I 2547.0 I 1.21 I I D I 2.7 I 1.8 I 0.3 I 0.11 I 0.3 I 0.11 I ---------------------------------------------------------------------------- I ALL I 4283.7 I 2855.8 I 2629.6 I 0.61 I 2629.8 I 0.61 I ---------------------------------------------------------------------------- * DELAY IS THAT OCCURRING ONLY WITHIN THE TIME PERIOD. * INCLUSIVE DELAY INCLUDES DELAY SUFFERED BY VEHICLES WHICH ARE STILL QUEUEING AFTER THE END OF THE TIME PERIOD. * THESE WILL ONLY BE SIGNIFICANTLY DIFFERENT IF THERE IS A LARGE QUEUE REMAINING AT THE END OF THE TIME PERIOD. END OF JOB ============================================= end of file ===============================================
[Printed at 11:43:06 on 05/08/2011]

-------------------------------------------------------------------------------- TRL TRL VIEWER 3.0 AC t:\M-EC Job Book\20111\capacity assessments\2021 + DEV A50-B5030 rdbt PM.vao - Page 1 -------------------------------------------------------------------------------- ___________________ A R C A D Y 6 ___________________ ASSESSMENT OF ROUNDABOUT CAPACITY AND DELAY Analysis Program: Release 2.0 (MAR 2005) (c) Copyright TRL Limited, 2004 Adapted from ARCADY/3 which is Crown Copyright by permission of the controller of HMSO ______________________________________________________ For sales and distribution information, program advice and maintenance, contact: TRL Limited Tel: +44 (0) 1344 770018 Crowthorne House Fax: +44 (0) 1344 770864 Nine Mile Ride Email: [email protected] Wokingham, Berks. Web: www.trlsoftware.co.uk RG40 3GA,UK --------------------------------------------------------------------------------- THE USER OF THIS COMPUTER PROGRAM FOR THE SOLUTION OF AN ENGINEERING PROBLEM IS IN NO WAY RELIEVED OF THEIR RESPONSIBILITY FOR THE CORRECTNESS OF THE SOLUTION --------------------------------------------------------------------------------- Run with file:- "t:\M-EC Job Book\20111\capacity assessments\2021 + DEV A50-B5030 rdbt PM.vai"(drive-on-the-left ) at 11:47:25 on Friday, 5 August 2011
FILE PROPERTIES *************** RUN TITLE: The Dove Way LOCATION: DATE: 04/07/2011 CLIENT: ENUMERATOR: trose [TIMROSE] JOB NUMBER: 20111 STATUS: DESCRIPTION:
INPUT DATA ********** ARM A - A50 East ARM B - B5030 ARM C - A50 West ARM D - A518
GEOMETRIC DATA -------------- ----------------------------------------------------------------------------------------------------------------------- I ARM I V (M) I E (M) I L (M) I R (M) I D (M) I PHI (DEG) I SLOPE I INTERCEPT (PCU/MIN) I ----------------------------------------------------------------------------------------------------------------------- I ARM A I 8.00 I 8.00 I 14.00 I 70.00 I 56.00 I 47.0 I 0.692 I 39.428 I I ARM B I 5.00 I 6.00 I 24.00 I 30.00 I 56.00 I 42.0 I 0.579 I 28.953 I I ARM C I 7.00 I 8.00 I 11.00 I 30.00 I 56.00 I 57.0 I 0.643 I 36.223 I I ARM D I 7.00 I 10.00 I 25.00 I 20.00 I 56.00 I 54.0 I 0.709 I 42.441 I ----------------------------------------------------------------------------------------------------------------------- V = approach half-width L = effective flare length D = inscribed circle diameter E = entry width R = entry radius PHI = entry angle
TRAFFIC DEMAND DATA ------------------- (Only sets included in the current run are shown)
----------------------- I ARM I FLOW SCALE(%) I ----------------------- I A I 100 I I B I 100 I I C I 100 I I D I 100 I -----------------------
TIME PERIOD BEGINS 16.45 AND ENDS 18.15
LENGTH OF TIME PERIOD - 90 MINUTES. LENGTH OF TIME SEGMENT - 15 MINUTES.

-------------------------------------------------------------------------------- TRL TRL VIEWER 3.0 AC t:\M-EC Job Book\20111\capacity assessments\2021 + DEV A50-B5030 rdbt PM.vao - Page 2 -------------------------------------------------------------------------------- DEMAND FLOW PROFILES ARE SYNTHESISED FROM TURNING COUNT DATA DEMAND SET TITLE: The Dove Way ----------------------------------------------------------------------------- I I NUMBER OF MINUTES FROM START WHEN I RATE OF FLOW (VEH/MIN) I I ARM I FLOW STARTS I TOP OF PEAK I FLOW STOPS I BEFORE I AT TOP I AFTER I I I TO RISE I IS REACHED IFALLING I PEAK I OF PEAK I PEAK I ----------------------------------------------------------------------------- I ARM A I 15.00 I 45.00 I 75.00 I 12.24 I 18.36 I 12.24 I I ARM B I 15.00 I 45.00 I 75.00 I 7.36 I 11.04 I 7.36 I I ARM C I 15.00 I 45.00 I 75.00 I 13.26 I 19.89 I 13.26 I I ARM D I 15.00 I 45.00 I 75.00 I 15.34 I 23.01 I 15.34 I ----------------------------------------------------------------------------- DEMAND SET TITLE: The Dove Way
-------------------------------------------------------------------- I I TURNING PROPORTIONS I I I TURNING COUNTS (VEH/HR) I I I (PERCENTAGE OF H.V.S) I I ----------------------------------------------- I TIME I FROM/TO I ARM A I ARM B I ARM C I ARM D I -------------------------------------------------------------------- I 16.45 - 18.15 I I I I I I I I ARM A I 0.000 I 0.203 I 0.413 I 0.384 I I I I 0.0 I 199.0 I 404.0 I 376.0 I I I I ( 10.0)I ( 10.0)I ( 10.0)I ( 10.0)I I I I I I I I I I ARM B I 0.365 I 0.000 I 0.243 I 0.392 I I I I 215.0 I 0.0 I 143.0 I 231.0 I I I I ( 10.0)I ( 10.0)I ( 10.0)I ( 10.0)I I I I I I I I I I ARM C I 0.582 I 0.194 I 0.000 I 0.223 I I I I 618.0 I 206.0 I 0.0 I 237.0 I I I I ( 10.0)I ( 10.0)I ( 10.0)I ( 10.0)I I I I I I I I I I ARM D I 0.557 I 0.232 I 0.210 I 0.000 I I I I 684.0 I 285.0 I 258.0 I 0.0 I I I I ( 10.0)I ( 10.0)I ( 10.0)I ( 10.0)I I I I I I I I --------------------------------------------------------------------
QUEUE AND DELAY INFORMATION FOR EACH 15 MIN TIME SEGMENT --------------------------------------------------------
------------------------------------------------------------------------------------------------------------------ I TIME DEMAND CAPACITY DEMAND/ PEDESTRIAN START END DELAY GEOMETRIC DELAY AVERAGE DELAY I I (VEH/MIN) (VEH/MIN) CAPACITY FLOW QUEUE QUEUE (VEH.MIN/ (VEH.MIN/ PER ARRIVING I I (RFC) (PEDS/MIN) (VEHS) (VEHS) TIME SEGMENT) TIME SEGMENT) VEHICLE (MIN) I I 16.45-17.00 I I ARM A 12.24 29.39 0.416 0.0 0.7 10.4 0.06 I I ARM B 7.36 18.84 0.391 0.0 0.6 9.2 0.09 I I ARM C 13.26 26.35 0.503 0.0 1.0 14.5 0.08 I I ARM D 15.34 29.43 0.521 0.0 1.1 15.6 0.07 I I I ------------------------------------------------------------------------------------------------------------------
------------------------------------------------------------------------------------------------------------------ I TIME DEMAND CAPACITY DEMAND/ PEDESTRIAN START END DELAY GEOMETRIC DELAY AVERAGE DELAY I I (VEH/MIN) (VEH/MIN) CAPACITY FLOW QUEUE QUEUE (VEH.MIN/ (VEH.MIN/ PER ARRIVING I I (RFC) (PEDS/MIN) (VEHS) (VEHS) TIME SEGMENT) TIME SEGMENT) VEHICLE (MIN) I I 17.00-17.15 I I ARM A 14.61 28.13 0.520 0.7 1.1 15.6 0.07 I I ARM B 8.79 17.37 0.506 0.6 1.0 14.6 0.12 I I ARM C 15.84 25.06 0.632 1.0 1.7 24.2 0.11 I I ARM D 18.31 27.62 0.663 1.1 1.9 27.6 0.11 I I I ------------------------------------------------------------------------------------------------------------------
------------------------------------------------------------------------------------------------------------------ I TIME DEMAND CAPACITY DEMAND/ PEDESTRIAN START END DELAY GEOMETRIC DELAY AVERAGE DELAY I I (VEH/MIN) (VEH/MIN) CAPACITY FLOW QUEUE QUEUE (VEH.MIN/ (VEH.MIN/ PER ARRIVING I I (RFC) (PEDS/MIN) (VEHS) (VEHS) TIME SEGMENT) TIME SEGMENT) VEHICLE (MIN) I I 17.15-17.30 I I ARM A 17.90 26.49 0.676 1.1 2.0 29.0 0.11 I I ARM B 10.77 15.41 0.699 1.0 2.2 30.7 0.21 I I ARM C 19.40 23.32 0.832 1.7 4.5 60.1 0.23 I I ARM D 22.43 25.25 0.888 1.9 6.8 85.0 0.29 I I I ------------------------------------------------------------------------------------------------------------------
------------------------------------------------------------------------------------------------------------------ I TIME DEMAND CAPACITY DEMAND/ PEDESTRIAN START END DELAY GEOMETRIC DELAY AVERAGE DELAY I I (VEH/MIN) (VEH/MIN) CAPACITY FLOW QUEUE QUEUE (VEH.MIN/ (VEH.MIN/ PER ARRIVING I I (RFC) (PEDS/MIN) (VEHS) (VEHS) TIME SEGMENT) TIME SEGMENT) VEHICLE (MIN) I I 17.30-17.45 I I ARM A 17.90 26.38 0.678 2.0 2.1 31.0 0.12 I I ARM B 10.77 15.34 0.702 2.2 2.3 34.0 0.22 I I ARM C 19.40 23.27 0.834 4.5 4.8 70.0 0.26 I I ARM D 22.43 25.13 0.893 6.8 7.5 107.7 0.35 I I I ------------------------------------------------------------------------------------------------------------------
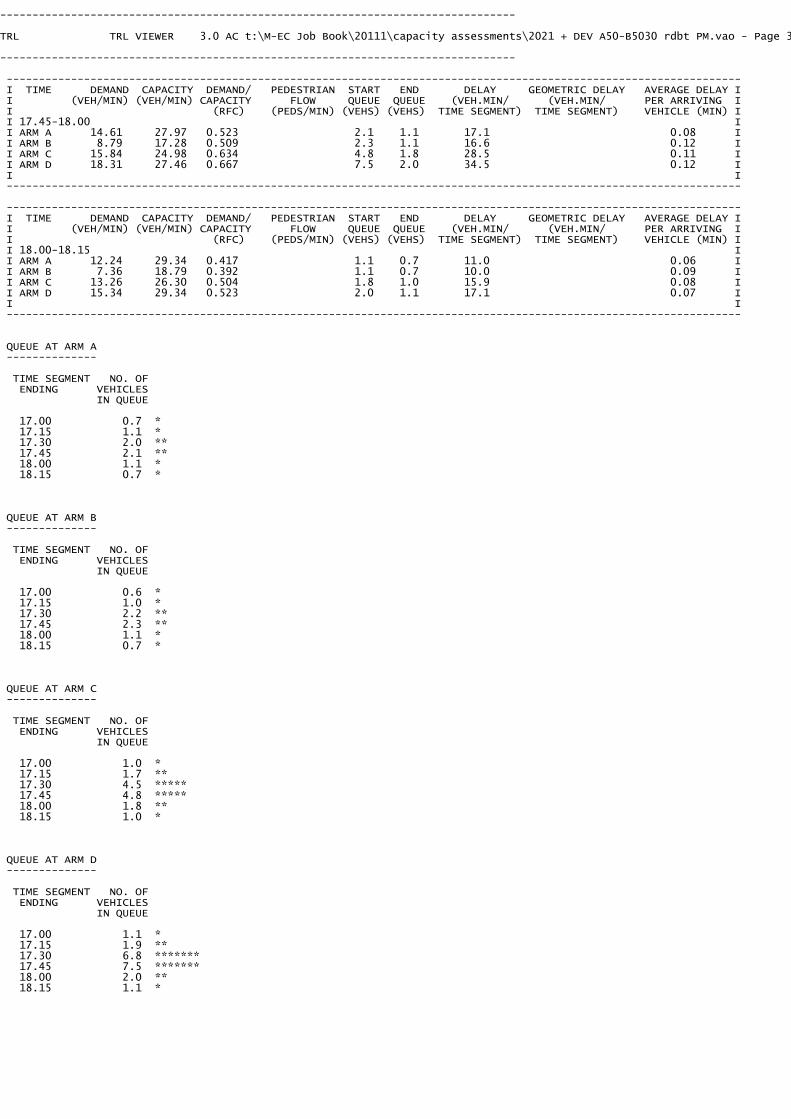
-------------------------------------------------------------------------------- TRL TRL VIEWER 3.0 AC t:\M-EC Job Book\20111\capacity assessments\2021 + DEV A50-B5030 rdbt PM.vao - Page 3 -------------------------------------------------------------------------------- ------------------------------------------------------------------------------------------------------------------ I TIME DEMAND CAPACITY DEMAND/ PEDESTRIAN START END DELAY GEOMETRIC DELAY AVERAGE DELAY I I (VEH/MIN) (VEH/MIN) CAPACITY FLOW QUEUE QUEUE (VEH.MIN/ (VEH.MIN/ PER ARRIVING I I (RFC) (PEDS/MIN) (VEHS) (VEHS) TIME SEGMENT) TIME SEGMENT) VEHICLE (MIN) I I 17.45-18.00 I I ARM A 14.61 27.97 0.523 2.1 1.1 17.1 0.08 I I ARM B 8.79 17.28 0.509 2.3 1.1 16.6 0.12 I I ARM C 15.84 24.98 0.634 4.8 1.8 28.5 0.11 I I ARM D 18.31 27.46 0.667 7.5 2.0 34.5 0.12 I I I ------------------------------------------------------------------------------------------------------------------
------------------------------------------------------------------------------------------------------------------ I TIME DEMAND CAPACITY DEMAND/ PEDESTRIAN START END DELAY GEOMETRIC DELAY AVERAGE DELAY I I (VEH/MIN) (VEH/MIN) CAPACITY FLOW QUEUE QUEUE (VEH.MIN/ (VEH.MIN/ PER ARRIVING I I (RFC) (PEDS/MIN) (VEHS) (VEHS) TIME SEGMENT) TIME SEGMENT) VEHICLE (MIN) I I 18.00-18.15 I I ARM A 12.24 29.34 0.417 1.1 0.7 11.0 0.06 I I ARM B 7.36 18.79 0.392 1.1 0.7 10.0 0.09 I I ARM C 13.26 26.30 0.504 1.8 1.0 15.9 0.08 I I ARM D 15.34 29.34 0.523 2.0 1.1 17.1 0.07 I I I ------------------------------------------------------------------------------------------------------------------
QUEUE AT ARM A -------------- TIME SEGMENT NO. OF ENDING VEHICLES IN QUEUE 17.00 0.7 * 17.15 1.1 * 17.30 2.0 ** 17.45 2.1 ** 18.00 1.1 * 18.15 0.7 *
QUEUE AT ARM B -------------- TIME SEGMENT NO. OF ENDING VEHICLES IN QUEUE 17.00 0.6 * 17.15 1.0 * 17.30 2.2 ** 17.45 2.3 ** 18.00 1.1 * 18.15 0.7 *
QUEUE AT ARM C -------------- TIME SEGMENT NO. OF ENDING VEHICLES IN QUEUE 17.00 1.0 * 17.15 1.7 ** 17.30 4.5 ***** 17.45 4.8 ***** 18.00 1.8 ** 18.15 1.0 *
QUEUE AT ARM D -------------- TIME SEGMENT NO. OF ENDING VEHICLES IN QUEUE 17.00 1.1 * 17.15 1.9 ** 17.30 6.8 ******* 17.45 7.5 ******* 18.00 2.0 ** 18.15 1.1 *

-------------------------------------------------------------------------------- TRL TRL VIEWER 3.0 AC t:\M-EC Job Book\20111\capacity assessments\2021 + DEV A50-B5030 rdbt PM.vao - Page 4 -------------------------------------------------------------------------------- QUEUEING DELAY INFORMATION OVER WHOLE PERIOD -------------------------------------------- ---------------------------------------------------------------------------- I ARM I TOTAL DEMAND I * QUEUEING * I * INCLUSIVE QUEUEING * I I I I * DELAY * I * DELAY * I I I------------------------------------------------------------------I I I (VEH) (VEH/H) I (MIN) (MIN/VEH) I (MIN) (MIN/VEH) I ---------------------------------------------------------------------------- I A I 1342.4 I 894.9 I 114.2 I 0.09 I 114.2 I 0.09 I I B I 807.6 I 538.4 I 115.1 I 0.14 I 115.2 I 0.14 I I C I 1454.9 I 969.9 I 213.2 I 0.15 I 213.2 I 0.15 I I D I 1682.5 I 1121.7 I 287.5 I 0.17 I 287.6 I 0.17 I ---------------------------------------------------------------------------- I ALL I 5287.4 I 3524.9 I 730.1 I 0.14 I 730.1 I 0.14 I ---------------------------------------------------------------------------- * DELAY IS THAT OCCURRING ONLY WITHIN THE TIME PERIOD. * INCLUSIVE DELAY INCLUDES DELAY SUFFERED BY VEHICLES WHICH ARE STILL QUEUEING AFTER THE END OF THE TIME PERIOD. * THESE WILL ONLY BE SIGNIFICANTLY DIFFERENT IF THERE IS A LARGE QUEUE REMAINING AT THE END OF THE TIME PERIOD. END OF JOB ============================================= end of file ===============================================
[Printed at 11:47:31 on 05/08/2011]

-------------------------------------------------------------------------------- TRL TRL VIEWER 3.0 AC t:\M-EC Job Book\20111\capacity assessments\2021 + DEV Dove Way-Derby Rd rdbt PM.vao - Page 1 -------------------------------------------------------------------------------- ___________________ A R C A D Y 6 ___________________ ASSESSMENT OF ROUNDABOUT CAPACITY AND DELAY Analysis Program: Release 2.0 (MAR 2005) (c) Copyright TRL Limited, 2004 Adapted from ARCADY/3 which is Crown Copyright by permission of the controller of HMSO ______________________________________________________ For sales and distribution information, program advice and maintenance, contact: TRL Limited Tel: +44 (0) 1344 770018 Crowthorne House Fax: +44 (0) 1344 770864 Nine Mile Ride Email: [email protected] Wokingham, Berks. Web: www.trlsoftware.co.uk RG40 3GA,UK --------------------------------------------------------------------------------- THE USER OF THIS COMPUTER PROGRAM FOR THE SOLUTION OF AN ENGINEERING PROBLEM IS IN NO WAY RELIEVED OF THEIR RESPONSIBILITY FOR THE CORRECTNESS OF THE SOLUTION --------------------------------------------------------------------------------- Run with file:- "t:\M-EC Job Book\20111\capacity assessments\2021 + DEV Dove Way-Derby Rd rdbt PM.vai"(drive-on-the-left ) at 11:54:45 on Friday, 5 August 2011
FILE PROPERTIES *************** RUN TITLE: The Dove Way LOCATION: DATE: 05/07/2011 CLIENT: ENUMERATOR: trose [TIMROSE] JOB NUMBER: 20111 STATUS: DESCRIPTION:
INPUT DATA ********** ARM A - A518 Derby Road ARM B - A518 South ARM C - Access Road ARM D - The Dove Way
GEOMETRIC DATA -------------- ----------------------------------------------------------------------------------------------------------------------- I ARM I V (M) I E (M) I L (M) I R (M) I D (M) I PHI (DEG) I SLOPE I INTERCEPT (PCU/MIN) I ----------------------------------------------------------------------------------------------------------------------- I ARM A I 3.00 I 7.00 I 15.00 I 30.00 I 38.00 I 57.0 I 0.571 I 24.033 I I ARM B I 3.50 I 7.00 I 0.00 I 10.00 I 38.00 I 70.0 I 0.594 I 28.715 I I ARM C I 2.50 I 5.00 I 10.00 I 25.00 I 38.00 I 40.0 I 0.528 I 19.149 I I ARM D I 5.50 I 10.00 I 20.00 I 25.00 I 38.00 I 56.0 I 0.735 I 37.690 I ----------------------------------------------------------------------------------------------------------------------- V = approach half-width L = effective flare length D = inscribed circle diameter E = entry width R = entry radius PHI = entry angle
TRAFFIC DEMAND DATA ------------------- (Only sets included in the current run are shown)
----------------------- I ARM I FLOW SCALE(%) I ----------------------- I A I 100 I I B I 100 I I C I 100 I I D I 100 I -----------------------
TIME PERIOD BEGINS 16.45 AND ENDS 18.15
LENGTH OF TIME PERIOD - 90 MINUTES. LENGTH OF TIME SEGMENT - 15 MINUTES.

-------------------------------------------------------------------------------- TRL TRL VIEWER 3.0 AC t:\M-EC Job Book\20111\capacity assessments\2021 + DEV Dove Way-Derby Rd rdbt PM.vao - Page 2 -------------------------------------------------------------------------------- DEMAND FLOW PROFILES ARE SYNTHESISED FROM TURNING COUNT DATA DEMAND SET TITLE: The Dove Way ----------------------------------------------------------------------------- I I NUMBER OF MINUTES FROM START WHEN I RATE OF FLOW (VEH/MIN) I I ARM I FLOW STARTS I TOP OF PEAK I FLOW STOPS I BEFORE I AT TOP I AFTER I I I TO RISE I IS REACHED IFALLING I PEAK I OF PEAK I PEAK I ----------------------------------------------------------------------------- I ARM A I 15.00 I 45.00 I 75.00 I 8.61 I 12.92 I 8.61 I I ARM B I 15.00 I 45.00 I 75.00 I 12.05 I 18.08 I 12.05 I I ARM C I 15.00 I 45.00 I 75.00 I 0.03 I 0.04 I 0.03 I I ARM D I 15.00 I 45.00 I 75.00 I 7.11 I 10.67 I 7.11 I ----------------------------------------------------------------------------- DEMAND SET TITLE: The Dove Way
-------------------------------------------------------------------- I I TURNING PROPORTIONS I I I TURNING COUNTS (VEH/HR) I I I (PERCENTAGE OF H.V.S) I I ----------------------------------------------- I TIME I FROM/TO I ARM A I ARM B I ARM C I ARM D I -------------------------------------------------------------------- I 16.45 - 18.15 I I I I I I I I ARM A I 0.000 I 0.919 I 0.001 I 0.080 I I I I 0.0 I 633.0 I 1.0 I 55.0 I I I I ( 10.0)I ( 10.0)I ( 10.0)I ( 10.0)I I I I I I I I I I ARM B I 0.600 I 0.000 I 0.002 I 0.398 I I I I 578.0 I 0.0 I 2.0 I 384.0 I I I I ( 10.0)I ( 10.0)I ( 10.0)I ( 10.0)I I I I I I I I I I ARM C I 1.000 I 0.000 I 0.000 I 0.000 I I I I 2.0 I 0.0 I 0.0 I 0.0 I I I I ( 10.0)I ( 10.0)I ( 10.0)I ( 10.0)I I I I I I I I I I ARM D I 0.148 I 0.851 I 0.002 I 0.000 I I I I 84.0 I 484.0 I 1.0 I 0.0 I I I I ( 10.0)I ( 10.0)I ( 10.0)I ( 10.0)I I I I I I I I --------------------------------------------------------------------
QUEUE AND DELAY INFORMATION FOR EACH 15 MIN TIME SEGMENT --------------------------------------------------------
------------------------------------------------------------------------------------------------------------------ I TIME DEMAND CAPACITY DEMAND/ PEDESTRIAN START END DELAY GEOMETRIC DELAY AVERAGE DELAY I I (VEH/MIN) (VEH/MIN) CAPACITY FLOW QUEUE QUEUE (VEH.MIN/ (VEH.MIN/ PER ARRIVING I I (RFC) (PEDS/MIN) (VEHS) (VEHS) TIME SEGMENT) TIME SEGMENT) VEHICLE (MIN) I I 16.45-17.00 I I ARM A 8.61 18.40 0.468 0.0 0.9 12.5 0.10 I I ARM B 12.05 25.68 0.469 0.0 0.9 12.7 0.07 I I ARM C 0.03 10.73 0.002 0.0 0.0 0.0 0.09 I I ARM D 7.11 28.96 0.246 0.0 0.3 4.8 0.05 I I I ------------------------------------------------------------------------------------------------------------------
------------------------------------------------------------------------------------------------------------------ I TIME DEMAND CAPACITY DEMAND/ PEDESTRIAN START END DELAY GEOMETRIC DELAY AVERAGE DELAY I I (VEH/MIN) (VEH/MIN) CAPACITY FLOW QUEUE QUEUE (VEH.MIN/ (VEH.MIN/ PER ARRIVING I I (RFC) (PEDS/MIN) (VEHS) (VEHS) TIME SEGMENT) TIME SEGMENT) VEHICLE (MIN) I I 17.00-17.15 I I ARM A 10.28 17.72 0.580 0.9 1.4 19.5 0.13 I I ARM B 14.39 25.60 0.562 0.9 1.3 18.4 0.09 I I ARM C 0.03 9.41 0.003 0.0 0.0 0.0 0.11 I I ARM D 8.49 27.92 0.304 0.3 0.4 6.4 0.05 I I I ------------------------------------------------------------------------------------------------------------------
------------------------------------------------------------------------------------------------------------------ I TIME DEMAND CAPACITY DEMAND/ PEDESTRIAN START END DELAY GEOMETRIC DELAY AVERAGE DELAY I I (VEH/MIN) (VEH/MIN) CAPACITY FLOW QUEUE QUEUE (VEH.MIN/ (VEH.MIN/ PER ARRIVING I I (RFC) (PEDS/MIN) (VEHS) (VEHS) TIME SEGMENT) TIME SEGMENT) VEHICLE (MIN) I I 17.15-17.30 I I ARM A 12.60 16.79 0.750 1.4 2.8 38.8 0.23 I I ARM B 17.62 25.49 0.691 1.3 2.2 31.0 0.13 I I ARM C 0.04 7.63 0.005 0.0 0.0 0.1 0.13 I I ARM D 10.40 26.50 0.392 0.4 0.6 9.4 0.06 I I I ------------------------------------------------------------------------------------------------------------------
------------------------------------------------------------------------------------------------------------------ I TIME DEMAND CAPACITY DEMAND/ PEDESTRIAN START END DELAY GEOMETRIC DELAY AVERAGE DELAY I I (VEH/MIN) (VEH/MIN) CAPACITY FLOW QUEUE QUEUE (VEH.MIN/ (VEH.MIN/ PER ARRIVING I I (RFC) (PEDS/MIN) (VEHS) (VEHS) TIME SEGMENT) TIME SEGMENT) VEHICLE (MIN) I I 17.30-17.45 I I ARM A 12.60 16.79 0.750 2.8 2.9 43.2 0.24 I I ARM B 17.62 25.49 0.691 2.2 2.2 33.0 0.13 I I ARM C 0.04 7.60 0.005 0.0 0.0 0.1 0.13 I I ARM D 10.40 26.48 0.393 0.6 0.6 9.7 0.06 I I I ------------------------------------------------------------------------------------------------------------------

-------------------------------------------------------------------------------- TRL TRL VIEWER 3.0 AC t:\M-EC Job Book\20111\capacity assessments\2021 + DEV Dove Way-Derby Rd rdbt PM.vao - Page 3 -------------------------------------------------------------------------------- ------------------------------------------------------------------------------------------------------------------ I TIME DEMAND CAPACITY DEMAND/ PEDESTRIAN START END DELAY GEOMETRIC DELAY AVERAGE DELAY I I (VEH/MIN) (VEH/MIN) CAPACITY FLOW QUEUE QUEUE (VEH.MIN/ (VEH.MIN/ PER ARRIVING I I (RFC) (PEDS/MIN) (VEHS) (VEHS) TIME SEGMENT) TIME SEGMENT) VEHICLE (MIN) I I 17.45-18.00 I I ARM A 10.28 17.71 0.581 2.9 1.4 22.4 0.14 I I ARM B 14.39 25.59 0.562 2.2 1.3 20.3 0.09 I I ARM C 0.03 9.36 0.003 0.0 0.0 0.0 0.11 I I ARM D 8.49 27.88 0.305 0.6 0.4 6.7 0.05 I I I ------------------------------------------------------------------------------------------------------------------
------------------------------------------------------------------------------------------------------------------ I TIME DEMAND CAPACITY DEMAND/ PEDESTRIAN START END DELAY GEOMETRIC DELAY AVERAGE DELAY I I (VEH/MIN) (VEH/MIN) CAPACITY FLOW QUEUE QUEUE (VEH.MIN/ (VEH.MIN/ PER ARRIVING I I (RFC) (PEDS/MIN) (VEHS) (VEHS) TIME SEGMENT) TIME SEGMENT) VEHICLE (MIN) I I 18.00-18.15 I I ARM A 8.61 18.38 0.468 1.4 0.9 13.9 0.10 I I ARM B 12.05 25.68 0.469 1.3 0.9 13.7 0.07 I I ARM C 0.03 10.68 0.002 0.0 0.0 0.0 0.09 I I ARM D 7.11 28.93 0.246 0.4 0.3 5.0 0.05 I I I ------------------------------------------------------------------------------------------------------------------
QUEUE AT ARM A -------------- TIME SEGMENT NO. OF ENDING VEHICLES IN QUEUE 17.00 0.9 * 17.15 1.4 * 17.30 2.8 *** 17.45 2.9 *** 18.00 1.4 * 18.15 0.9 *
QUEUE AT ARM B -------------- TIME SEGMENT NO. OF ENDING VEHICLES IN QUEUE 17.00 0.9 * 17.15 1.3 * 17.30 2.2 ** 17.45 2.2 ** 18.00 1.3 * 18.15 0.9 *
QUEUE AT ARM C -------------- TIME SEGMENT NO. OF ENDING VEHICLES IN QUEUE 17.00 0.0 17.15 0.0 17.30 0.0 17.45 0.0 18.00 0.0 18.15 0.0
QUEUE AT ARM D -------------- TIME SEGMENT NO. OF ENDING VEHICLES IN QUEUE 17.00 0.3 17.15 0.4 17.30 0.6 * 17.45 0.6 * 18.00 0.4 18.15 0.3

-------------------------------------------------------------------------------- TRL TRL VIEWER 3.0 AC t:\M-EC Job Book\20111\capacity assessments\2021 + DEV Dove Way-Derby Rd rdbt PM.vao - Page 4 -------------------------------------------------------------------------------- QUEUEING DELAY INFORMATION OVER WHOLE PERIOD -------------------------------------------- ---------------------------------------------------------------------------- I ARM I TOTAL DEMAND I * QUEUEING * I * INCLUSIVE QUEUEING * I I I I * DELAY * I * DELAY * I I I------------------------------------------------------------------I I I (VEH) (VEH/H) I (MIN) (MIN/VEH) I (MIN) (MIN/VEH) I ---------------------------------------------------------------------------- I A I 944.8 I 629.8 I 150.3 I 0.16 I 150.3 I 0.16 I I B I 1321.8 I 881.2 I 129.2 I 0.10 I 129.2 I 0.10 I I C I 2.7 I 1.8 I 0.3 I 0.11 I 0.3 I 0.11 I I D I 780.2 I 520.1 I 42.0 I 0.05 I 42.0 I 0.05 I ---------------------------------------------------------------------------- I ALL I 3049.6 I 2033.0 I 321.8 I 0.11 I 321.8 I 0.11 I ---------------------------------------------------------------------------- * DELAY IS THAT OCCURRING ONLY WITHIN THE TIME PERIOD. * INCLUSIVE DELAY INCLUDES DELAY SUFFERED BY VEHICLES WHICH ARE STILL QUEUEING AFTER THE END OF THE TIME PERIOD. * THESE WILL ONLY BE SIGNIFICANTLY DIFFERENT IF THERE IS A LARGE QUEUE REMAINING AT THE END OF THE TIME PERIOD. END OF JOB ============================================= end of file ===============================================
[Printed at 11:54:51 on 05/08/2011]

-------------------------------------------------------------------------------- TRL TRL VIEWER 3.0 AC t:\M-EC Job Book\20111\capacity assessments\2021 + DEV Derby Rd-Dove Walk Mini rdbt PM.vao - Page 1 -------------------------------------------------------------------------------- ___________________ A R C A D Y 6 ___________________ ASSESSMENT OF ROUNDABOUT CAPACITY AND DELAY Analysis Program: Release 2.0 (MAR 2005) (c) Copyright TRL Limited, 2004 Adapted from ARCADY/3 which is Crown Copyright by permission of the controller of HMSO ______________________________________________________ For sales and distribution information, program advice and maintenance, contact: TRL Limited Tel: +44 (0) 1344 770018 Crowthorne House Fax: +44 (0) 1344 770864 Nine Mile Ride Email: [email protected] Wokingham, Berks. Web: www.trlsoftware.co.uk RG40 3GA,UK --------------------------------------------------------------------------------- THE USER OF THIS COMPUTER PROGRAM FOR THE SOLUTION OF AN ENGINEERING PROBLEM IS IN NO WAY RELIEVED OF THEIR RESPONSIBILITY FOR THE CORRECTNESS OF THE SOLUTION --------------------------------------------------------------------------------- Run with file:- "t:\M-EC Job Book\20111\capacity assessments\2021 + DEV Derby Rd-Dove Walk Mini rdbt PM.vai"(drive-on-the-left ) at 11:52:20 on Friday, 5 August 2011
FILE PROPERTIES *************** RUN TITLE: The Dove Way LOCATION: DATE: 05/07/2011 CLIENT: ENUMERATOR: trose [TIMROSE] JOB NUMBER: 20111 STATUS: DESCRIPTION:
INPUT DATA ********** ARM A - Dove Walk ARM B - Dove Fields ARM C - Derby Rd SW ARM D - Derby Rd NE
MINI-ROUNDABOUT GEOMETRIC DATA ------------------------------ LIGHTING CONDITIONS : NORMAL ROAD SURFACE CONDITION: NORMAL ---------------------------------------------------------------------------------------------------------------------- I ARM I V (m) I E (m) I Lm(M) I Vm(M) I A (M) I K (M) I G (%) I SLOPE I INTERCEPT I I I I I I I I I I I (PCU/MIN) I ---------------------------------------------------------------------------------------------------------------------- I ARM A I 2.00 I 4.00 I 10.00 I 2.00 I 8.00 I 2.50 I 0.00 I 0.515 I 14.021 I I ARM B I 4.00 I 5.00 I 5.00 I 4.00 I 11.50 I 3.50 I 0.00 I 0.585 I 14.549 I I ARM C I 2.50 I 3.50 I 15.00 I 2.50 I 16.50 I 13.00 I 0.00 I 0.538 I 14.583 I I ARM D I 3.50 I 4.40 I 2.00 I 3.50 I 10.00 I 2.50 I 0.00 I 0.548 I 15.607 I ---------------------------------------------------------------------------------------------------------------------- V = approach half-width Lm = effective flare length A = distance between arms E = entry width Vm = minimum approach half-width K = entry corner kerb line G = gradient over 50m
TRAFFIC DEMAND DATA ------------------- (Only sets included in the current run are shown)
----------------------- I ARM I FLOW SCALE(%) I ----------------------- I A I 100 I I B I 100 I I C I 100 I I D I 100 I -----------------------

-------------------------------------------------------------------------------- TRL TRL VIEWER 3.0 AC t:\M-EC Job Book\20111\capacity assessments\2021 + DEV Derby Rd-Dove Walk Mini rdbt PM.vao - Page 2 -------------------------------------------------------------------------------- TIME PERIOD BEGINS 16.45 AND ENDS 18.15
LENGTH OF TIME PERIOD - 90 MINUTES. LENGTH OF TIME SEGMENT - 15 MINUTES.
DEMAND FLOW PROFILES ARE SYNTHESISED FROM TURNING COUNT DATA DEMAND SET TITLE: The Dove Way ----------------------------------------------------------------------------- I I NUMBER OF MINUTES FROM START WHEN I RATE OF FLOW (VEH/MIN) I I ARM I FLOW STARTS I TOP OF PEAK I FLOW STOPS I BEFORE I AT TOP I AFTER I I I TO RISE I IS REACHED IFALLING I PEAK I OF PEAK I PEAK I ----------------------------------------------------------------------------- I ARM A I 15.00 I 45.00 I 75.00 I 0.21 I 0.32 I 0.21 I I ARM B I 15.00 I 45.00 I 75.00 I 2.15 I 3.23 I 2.15 I I ARM C I 15.00 I 45.00 I 75.00 I 8.43 I 12.64 I 8.43 I I ARM D I 15.00 I 45.00 I 75.00 I 7.93 I 11.89 I 7.93 I ----------------------------------------------------------------------------- DEMAND SET TITLE: The Dove Way
-------------------------------------------------------------------- I I TURNING PROPORTIONS I I I TURNING COUNTS (VEH/HR) I I I (PERCENTAGE OF H.V.S) I I ----------------------------------------------- I TIME I FROM/TO I ARM A I ARM B I ARM C I ARM D I -------------------------------------------------------------------- I 16.45 - 18.15 I I I I I I I I ARM A I 0.000 I 0.353 I 0.294 I 0.353 I I I I 0.0 I 6.0 I 5.0 I 6.0 I I I I ( 10.0)I ( 10.0)I ( 10.0)I ( 10.0)I I I I I I I I I I ARM B I 0.012 I 0.000 I 0.605 I 0.384 I I I I 2.0 I 0.0 I 104.0 I 66.0 I I I I ( 10.0)I ( 10.0)I ( 10.0)I ( 10.0)I I I I I I I I I I ARM C I 0.045 I 0.083 I 0.000 I 0.872 I I I I 30.0 I 56.0 I 0.0 I 588.0 I I I I ( 10.0)I ( 10.0)I ( 10.0)I ( 10.0)I I I I I I I I I I ARM D I 0.021 I 0.054 I 0.926 I 0.000 I I I I 13.0 I 34.0 I 587.0 I 0.0 I I I I ( 10.0)I ( 10.0)I ( 10.0)I ( 10.0)I I I I I I I I --------------------------------------------------------------------
QUEUE AND DELAY INFORMATION FOR EACH 15 MIN TIME SEGMENT --------------------------------------------------------
------------------------------------------------------------------------------------------------------------------ I TIME DEMAND CAPACITY DEMAND/ CROSSING START END DELAY AVERAGE DELAY I I (VEH/MIN) (VEH/MIN) CAPACITY USE QUEUE QUEUE (VEH.MIN/ PER ARRIVING I I (RFC) PER MIN (VEHS) (VEHS) TIME SEGMENT) VEHICLE (MIN) I I 16.45-17.00 I I ARM A 0.21 8.44 0.025 0.0 0.0 0.4 0.12 I I ARM B 2.15 8.91 0.241 0.0 0.3 4.5 0.15 I I ARM C 8.43 12.76 0.660 0.0 1.9 25.4 0.22 I I ARM D 7.93 13.59 0.583 0.0 1.4 19.0 0.17 I I I ------------------------------------------------------------------------------------------------------------------
------------------------------------------------------------------------------------------------------------------ I TIME DEMAND CAPACITY DEMAND/ CROSSING START END DELAY AVERAGE DELAY I I (VEH/MIN) (VEH/MIN) CAPACITY USE QUEUE QUEUE (VEH.MIN/ PER ARRIVING I I (RFC) PER MIN (VEHS) (VEHS) TIME SEGMENT) VEHICLE (MIN) I I 17.00-17.15 I I ARM A 0.25 7.58 0.033 0.0 0.0 0.5 0.14 I I ARM B 2.57 8.04 0.319 0.3 0.5 6.7 0.18 I I ARM C 10.06 12.67 0.794 1.9 3.5 46.6 0.35 I I ARM D 9.46 13.48 0.702 1.4 2.2 31.2 0.24 I I I ------------------------------------------------------------------------------------------------------------------
------------------------------------------------------------------------------------------------------------------ I TIME DEMAND CAPACITY DEMAND/ CROSSING START END DELAY AVERAGE DELAY I I (VEH/MIN) (VEH/MIN) CAPACITY USE QUEUE QUEUE (VEH.MIN/ PER ARRIVING I I (RFC) PER MIN (VEHS) (VEHS) TIME SEGMENT) VEHICLE (MIN) I I 17.15-17.30 I I ARM A 0.31 6.51 0.048 0.0 0.0 0.7 0.16 I I ARM B 3.14 6.95 0.452 0.5 0.8 11.3 0.26 I I ARM C 12.32 12.54 0.983 3.5 12.1 130.9 0.90 I I ARM D 11.59 13.35 0.868 2.2 5.4 67.7 0.46 I I I ------------------------------------------------------------------------------------------------------------------

-------------------------------------------------------------------------------- TRL TRL VIEWER 3.0 AC t:\M-EC Job Book\20111\capacity assessments\2021 + DEV Derby Rd-Dove Walk Mini rdbt PM.vao - Page 3 -------------------------------------------------------------------------------- ------------------------------------------------------------------------------------------------------------------ I TIME DEMAND CAPACITY DEMAND/ CROSSING START END DELAY AVERAGE DELAY I I (VEH/MIN) (VEH/MIN) CAPACITY USE QUEUE QUEUE (VEH.MIN/ PER ARRIVING I I (RFC) PER MIN (VEHS) (VEHS) TIME SEGMENT) VEHICLE (MIN) I I 17.30-17.45 I I ARM A 0.31 6.40 0.049 0.0 0.1 0.8 0.16 I I ARM B 3.14 6.86 0.459 0.8 0.8 12.3 0.27 I I ARM C 12.32 12.53 0.983 12.1 16.2 214.6 1.36 I I ARM D 11.59 13.33 0.870 5.4 5.9 85.2 0.54 I I I ------------------------------------------------------------------------------------------------------------------
------------------------------------------------------------------------------------------------------------------ I TIME DEMAND CAPACITY DEMAND/ CROSSING START END DELAY AVERAGE DELAY I I (VEH/MIN) (VEH/MIN) CAPACITY USE QUEUE QUEUE (VEH.MIN/ PER ARRIVING I I (RFC) PER MIN (VEHS) (VEHS) TIME SEGMENT) VEHICLE (MIN) I I 17.45-18.00 I I ARM A 0.25 7.40 0.034 0.1 0.0 0.6 0.14 I I ARM B 2.57 7.89 0.326 0.8 0.5 7.7 0.19 I I ARM C 10.06 12.66 0.795 16.2 4.4 106.5 0.69 I I ARM D 9.46 13.41 0.705 5.9 2.5 42.8 0.28 I I I ------------------------------------------------------------------------------------------------------------------
------------------------------------------------------------------------------------------------------------------ I TIME DEMAND CAPACITY DEMAND/ CROSSING START END DELAY AVERAGE DELAY I I (VEH/MIN) (VEH/MIN) CAPACITY USE QUEUE QUEUE (VEH.MIN/ PER ARRIVING I I (RFC) PER MIN (VEHS) (VEHS) TIME SEGMENT) VEHICLE (MIN) I I 18.00-18.15 I I ARM A 0.21 8.34 0.025 0.0 0.0 0.4 0.12 I I ARM B 2.15 8.82 0.244 0.5 0.3 5.1 0.15 I I ARM C 8.43 12.76 0.660 4.4 2.0 33.5 0.25 I I ARM D 7.93 13.57 0.584 2.5 1.4 22.9 0.18 I I I ------------------------------------------------------------------------------------------------------------------
QUEUE AT ARM A -------------- TIME SEGMENT NO. OF ENDING VEHICLES IN QUEUE 17.00 0.0 17.15 0.0 17.30 0.0 17.45 0.1 18.00 0.0 18.15 0.0
QUEUE AT ARM B -------------- TIME SEGMENT NO. OF ENDING VEHICLES IN QUEUE 17.00 0.3 17.15 0.5 17.30 0.8 * 17.45 0.8 * 18.00 0.5 18.15 0.3
QUEUE AT ARM C -------------- TIME SEGMENT NO. OF ENDING VEHICLES IN QUEUE 17.00 1.9 ** 17.15 3.5 *** 17.30 12.1 ************ 17.45 16.2 **************** 18.00 4.4 **** 18.15 2.0 **

-------------------------------------------------------------------------------- TRL TRL VIEWER 3.0 AC t:\M-EC Job Book\20111\capacity assessments\2021 + DEV Derby Rd-Dove Walk Mini rdbt PM.vao - Page 4 -------------------------------------------------------------------------------- QUEUE AT ARM D -------------- TIME SEGMENT NO. OF ENDING VEHICLES IN QUEUE 17.00 1.4 * 17.15 2.2 ** 17.30 5.4 ***** 17.45 5.9 ****** 18.00 2.5 *** 18.15 1.4 *
QUEUEING DELAY INFORMATION OVER WHOLE PERIOD -------------------------------------------- ---------------------------------------------------------------------------- I ARM I TOTAL DEMAND I * QUEUEING * I * INCLUSIVE QUEUEING * I I I I * DELAY * I * DELAY * I I I------------------------------------------------------------------I I I (VEH) (VEH/H) I (MIN) (MIN/VEH) I (MIN) (MIN/VEH) I ---------------------------------------------------------------------------- I A I 23.3 I 15.5 I 3.3 I 0.14 I 3.3 I 0.14 I I B I 235.8 I 157.2 I 47.6 I 0.20 I 47.6 I 0.20 I I C I 924.2 I 616.1 I 557.4 I 0.60 I 557.6 I 0.60 I I D I 869.3 I 579.6 I 268.9 I 0.31 I 269.0 I 0.31 I ---------------------------------------------------------------------------- I ALL I 2052.7 I 1368.5 I 877.3 I 0.43 I 877.5 I 0.43 I ---------------------------------------------------------------------------- * DELAY IS THAT OCCURRING ONLY WITHIN THE TIME PERIOD. * INCLUSIVE DELAY INCLUDES DELAY SUFFERED BY VEHICLES WHICH ARE STILL QUEUEING AFTER THE END OF THE TIME PERIOD. * THESE WILL ONLY BE SIGNIFICANTLY DIFFERENT IF THERE IS A LARGE QUEUE REMAINING AT THE END OF THE TIME PERIOD. END OF JOB ============================================= end of file ===============================================
[Printed at 11:52:25 on 05/08/2011]

-------------------------------------------------------------------------------- TRL TRL VIEWER 3.0 AC t:\M-EC Job Book\20111\capacity assessments\2021 + DEV A518-B5030 Spath rdbt PM.vao - Page 1 -------------------------------------------------------------------------------- ___________________ A R C A D Y 6 ___________________ ASSESSMENT OF ROUNDABOUT CAPACITY AND DELAY Analysis Program: Release 2.0 (MAR 2005) (c) Copyright TRL Limited, 2004 Adapted from ARCADY/3 which is Crown Copyright by permission of the controller of HMSO ______________________________________________________ For sales and distribution information, program advice and maintenance, contact: TRL Limited Tel: +44 (0) 1344 770018 Crowthorne House Fax: +44 (0) 1344 770864 Nine Mile Ride Email: [email protected] Wokingham, Berks. Web: www.trlsoftware.co.uk RG40 3GA,UK --------------------------------------------------------------------------------- THE USER OF THIS COMPUTER PROGRAM FOR THE SOLUTION OF AN ENGINEERING PROBLEM IS IN NO WAY RELIEVED OF THEIR RESPONSIBILITY FOR THE CORRECTNESS OF THE SOLUTION --------------------------------------------------------------------------------- Run with file:- "t:\M-EC Job Book\20111\capacity assessments\2021 + DEV A518-B5030 Spath rdbt PM.vai"(drive-on-the-left ) at 11:49:28 on Friday, 5 August 2011
FILE PROPERTIES *************** RUN TITLE: A518/B5030 Spath Rdbt LOCATION: DATE: 04/07/2011 CLIENT: ENUMERATOR: trose [TIMROSE] JOB NUMBER: 20111 STATUS: DESCRIPTION:
INPUT DATA ********** ARM A - A518 The Dove Way ARM B - A518 ARM C - B5030
GEOMETRIC DATA -------------- ----------------------------------------------------------------------------------------------------------------------- I ARM I V (M) I E (M) I L (M) I R (M) I D (M) I PHI (DEG) I SLOPE I INTERCEPT (PCU/MIN) I ----------------------------------------------------------------------------------------------------------------------- I ARM A I 4.00 I 8.00 I 30.00 I 35.00 I 58.00 I 54.0 I 0.593 I 32.218 I I ARM B I 5.00 I 6.00 I 15.00 I 45.00 I 58.00 I 53.0 I 0.549 I 27.864 I I ARM C I 4.50 I 8.00 I 30.00 I 40.00 I 58.00 I 57.0 I 0.600 I 33.131 I ----------------------------------------------------------------------------------------------------------------------- V = approach half-width L = effective flare length D = inscribed circle diameter E = entry width R = entry radius PHI = entry angle
TRAFFIC DEMAND DATA ------------------- (Only sets included in the current run are shown)
----------------------- I ARM I FLOW SCALE(%) I ----------------------- I A I 100 I I B I 100 I I C I 100 I -----------------------
TIME PERIOD BEGINS 16.45 AND ENDS 18.15
LENGTH OF TIME PERIOD - 90 MINUTES. LENGTH OF TIME SEGMENT - 15 MINUTES.

-------------------------------------------------------------------------------- TRL TRL VIEWER 3.0 AC t:\M-EC Job Book\20111\capacity assessments\2021 + DEV A518-B5030 Spath rdbt PM.vao - Page 2 -------------------------------------------------------------------------------- DEMAND FLOW PROFILES ARE SYNTHESISED FROM TURNING COUNT DATA DEMAND SET TITLE: A518/B5030 Spath Rdbt ----------------------------------------------------------------------------- I I NUMBER OF MINUTES FROM START WHEN I RATE OF FLOW (VEH/MIN) I I ARM I FLOW STARTS I TOP OF PEAK I FLOW STOPS I BEFORE I AT TOP I AFTER I I I TO RISE I IS REACHED IFALLING I PEAK I OF PEAK I PEAK I ----------------------------------------------------------------------------- I ARM A I 15.00 I 45.00 I 75.00 I 5.34 I 8.01 I 5.34 I I ARM B I 15.00 I 45.00 I 75.00 I 10.56 I 15.84 I 10.56 I I ARM C I 15.00 I 45.00 I 75.00 I 15.40 I 23.10 I 15.40 I ----------------------------------------------------------------------------- DEMAND SET TITLE: A518/B5030 Spath Rdbt
----------------------------------------------------------- I I TURNING PROPORTIONS I I I TURNING COUNTS (VEH/HR) I I I (PERCENTAGE OF H.V.S) I I -------------------------------------- I TIME I FROM/TO I ARM A I ARM B I ARM C I ----------------------------------------------------------- I 16.45 - 18.15 I I I I I I I ARM A I 0.000 I 0.461 I 0.539 I I I I 0.0 I 197.0 I 230.0 I I I I ( 10.0)I ( 10.0)I ( 10.0)I I I I I I I I I ARM B I 0.310 I 0.000 I 0.690 I I I I 262.0 I 0.0 I 583.0 I I I I ( 10.0)I ( 10.0)I ( 10.0)I I I I I I I I I ARM C I 0.162 I 0.838 I 0.000 I I I I 199.0 I 1033.0 I 0.0 I I I I ( 10.0)I ( 10.0)I ( 10.0)I I I I I I I -----------------------------------------------------------
QUEUE AND DELAY INFORMATION FOR EACH 15 MIN TIME SEGMENT --------------------------------------------------------
------------------------------------------------------------------------------------------------------------------ I TIME DEMAND CAPACITY DEMAND/ PEDESTRIAN START END DELAY GEOMETRIC DELAY AVERAGE DELAY I I (VEH/MIN) (VEH/MIN) CAPACITY FLOW QUEUE QUEUE (VEH.MIN/ (VEH.MIN/ PER ARRIVING I I (RFC) (PEDS/MIN) (VEHS) (VEHS) TIME SEGMENT) TIME SEGMENT) VEHICLE (MIN) I I 16.45-17.00 I I ARM A 5.34 21.68 0.246 0.0 0.3 4.8 0.06 I I ARM B 10.56 23.76 0.445 0.0 0.8 11.5 0.08 I I ARM C 15.40 28.16 0.547 0.0 1.2 17.2 0.08 I I I ------------------------------------------------------------------------------------------------------------------
------------------------------------------------------------------------------------------------------------------ I TIME DEMAND CAPACITY DEMAND/ PEDESTRIAN START END DELAY GEOMETRIC DELAY AVERAGE DELAY I I (VEH/MIN) (VEH/MIN) CAPACITY FLOW QUEUE QUEUE (VEH.MIN/ (VEH.MIN/ PER ARRIVING I I (RFC) (PEDS/MIN) (VEHS) (VEHS) TIME SEGMENT) TIME SEGMENT) VEHICLE (MIN) I I 17.00-17.15 I I ARM A 6.37 20.17 0.316 0.3 0.5 6.7 0.07 I I ARM B 12.61 23.45 0.538 0.8 1.1 16.7 0.09 I I ARM C 18.39 27.77 0.662 1.2 1.9 27.6 0.11 I I I ------------------------------------------------------------------------------------------------------------------
------------------------------------------------------------------------------------------------------------------ I TIME DEMAND CAPACITY DEMAND/ PEDESTRIAN START END DELAY GEOMETRIC DELAY AVERAGE DELAY I I (VEH/MIN) (VEH/MIN) CAPACITY FLOW QUEUE QUEUE (VEH.MIN/ (VEH.MIN/ PER ARRIVING I I (RFC) (PEDS/MIN) (VEHS) (VEHS) TIME SEGMENT) TIME SEGMENT) VEHICLE (MIN) I I 17.15-17.30 I I ARM A 7.81 18.18 0.429 0.5 0.7 10.8 0.10 I I ARM B 15.45 23.03 0.671 1.1 2.0 28.3 0.13 I I ARM C 22.52 27.25 0.826 1.9 4.4 59.8 0.20 I I I ------------------------------------------------------------------------------------------------------------------
------------------------------------------------------------------------------------------------------------------ I TIME DEMAND CAPACITY DEMAND/ PEDESTRIAN START END DELAY GEOMETRIC DELAY AVERAGE DELAY I I (VEH/MIN) (VEH/MIN) CAPACITY FLOW QUEUE QUEUE (VEH.MIN/ (VEH.MIN/ PER ARRIVING I I (RFC) (PEDS/MIN) (VEHS) (VEHS) TIME SEGMENT) TIME SEGMENT) VEHICLE (MIN) I I 17.30-17.45 I I ARM A 7.81 18.10 0.431 0.7 0.8 11.2 0.10 I I ARM B 15.45 23.02 0.671 2.0 2.0 30.0 0.13 I I ARM C 22.52 27.24 0.827 4.4 4.6 67.9 0.21 I I I ------------------------------------------------------------------------------------------------------------------

-------------------------------------------------------------------------------- TRL TRL VIEWER 3.0 AC t:\M-EC Job Book\20111\capacity assessments\2021 + DEV A518-B5030 Spath rdbt PM.vao - Page 3 -------------------------------------------------------------------------------- ------------------------------------------------------------------------------------------------------------------ I TIME DEMAND CAPACITY DEMAND/ PEDESTRIAN START END DELAY GEOMETRIC DELAY AVERAGE DELAY I I (VEH/MIN) (VEH/MIN) CAPACITY FLOW QUEUE QUEUE (VEH.MIN/ (VEH.MIN/ PER ARRIVING I I (RFC) (PEDS/MIN) (VEHS) (VEHS) TIME SEGMENT) TIME SEGMENT) VEHICLE (MIN) I I 17.45-18.00 I I ARM A 6.37 20.07 0.318 0.8 0.5 7.2 0.07 I I ARM B 12.61 23.44 0.538 2.0 1.2 18.4 0.09 I I ARM C 18.39 27.76 0.662 4.6 2.0 32.0 0.11 I I I ------------------------------------------------------------------------------------------------------------------
------------------------------------------------------------------------------------------------------------------ I TIME DEMAND CAPACITY DEMAND/ PEDESTRIAN START END DELAY GEOMETRIC DELAY AVERAGE DELAY I I (VEH/MIN) (VEH/MIN) CAPACITY FLOW QUEUE QUEUE (VEH.MIN/ (VEH.MIN/ PER ARRIVING I I (RFC) (PEDS/MIN) (VEHS) (VEHS) TIME SEGMENT) TIME SEGMENT) VEHICLE (MIN) I I 18.00-18.15 I I ARM A 5.34 21.61 0.247 0.5 0.3 5.0 0.06 I I ARM B 10.56 23.75 0.445 1.2 0.8 12.4 0.08 I I ARM C 15.40 28.15 0.547 2.0 1.2 18.9 0.08 I I I ------------------------------------------------------------------------------------------------------------------
QUEUE AT ARM A -------------- TIME SEGMENT NO. OF ENDING VEHICLES IN QUEUE 17.00 0.3 17.15 0.5 17.30 0.7 * 17.45 0.8 * 18.00 0.5 18.15 0.3
QUEUE AT ARM B -------------- TIME SEGMENT NO. OF ENDING VEHICLES IN QUEUE 17.00 0.8 * 17.15 1.1 * 17.30 2.0 ** 17.45 2.0 ** 18.00 1.2 * 18.15 0.8 *
QUEUE AT ARM C -------------- TIME SEGMENT NO. OF ENDING VEHICLES IN QUEUE 17.00 1.2 * 17.15 1.9 ** 17.30 4.4 **** 17.45 4.6 ***** 18.00 2.0 ** 18.15 1.2 *
QUEUEING DELAY INFORMATION OVER WHOLE PERIOD -------------------------------------------- ---------------------------------------------------------------------------- I ARM I TOTAL DEMAND I * QUEUEING * I * INCLUSIVE QUEUEING * I I I I * DELAY * I * DELAY * I I I------------------------------------------------------------------I I I (VEH) (VEH/H) I (MIN) (MIN/VEH) I (MIN) (MIN/VEH) I ---------------------------------------------------------------------------- I A I 585.5 I 390.3 I 45.8 I 0.08 I 45.8 I 0.08 I I B I 1158.7 I 772.4 I 117.4 I 0.10 I 117.4 I 0.10 I I C I 1689.3 I 1126.2 I 223.4 I 0.13 I 223.4 I 0.13 I ---------------------------------------------------------------------------- I ALL I 3433.5 I 2289.0 I 386.6 I 0.11 I 386.7 I 0.11 I ---------------------------------------------------------------------------- * DELAY IS THAT OCCURRING ONLY WITHIN THE TIME PERIOD. * INCLUSIVE DELAY INCLUDES DELAY SUFFERED BY VEHICLES WHICH ARE STILL QUEUEING AFTER THE END OF THE TIME PERIOD. * THESE WILL ONLY BE SIGNIFICANTLY DIFFERENT IF THERE IS A LARGE QUEUE REMAINING AT THE END OF THE TIME PERIOD. END OF JOB ============================================= end of file ===============================================

[Printed at 11:49:34 on 05/08/2011]
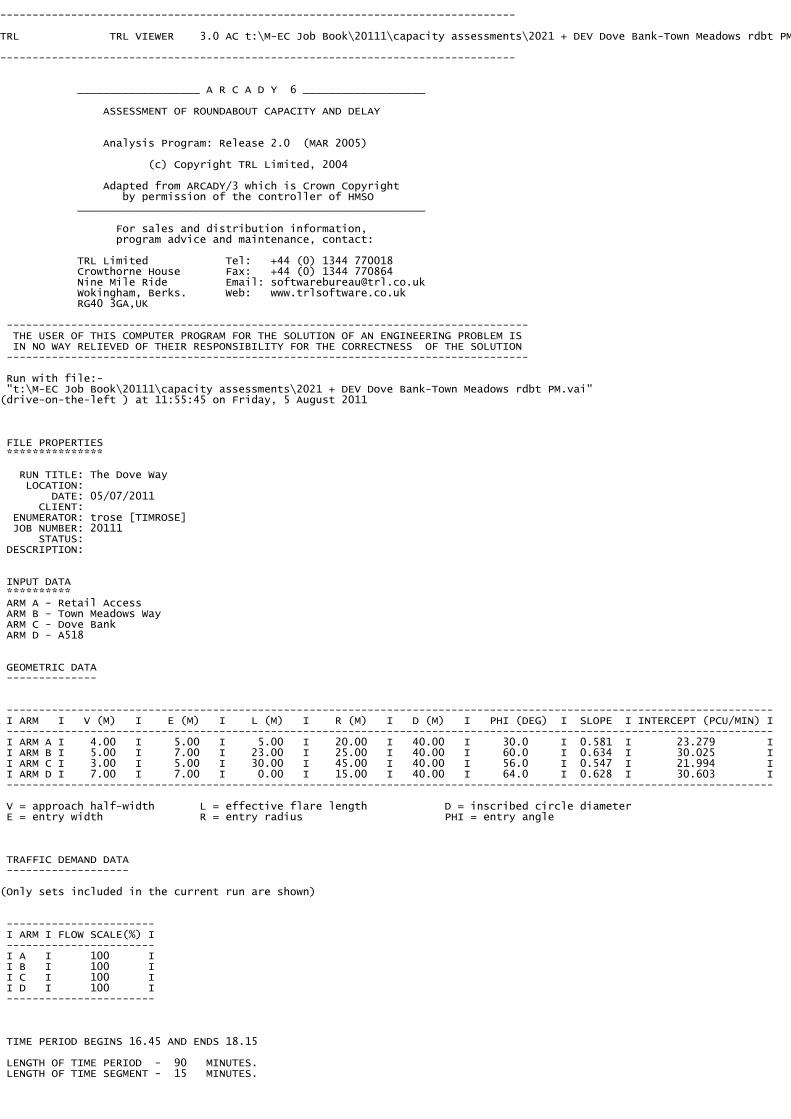
-------------------------------------------------------------------------------- TRL TRL VIEWER 3.0 AC t:\M-EC Job Book\20111\capacity assessments\2021 + DEV Dove Bank-Town Meadows rdbt PM.vao - Page 1 -------------------------------------------------------------------------------- ___________________ A R C A D Y 6 ___________________ ASSESSMENT OF ROUNDABOUT CAPACITY AND DELAY Analysis Program: Release 2.0 (MAR 2005) (c) Copyright TRL Limited, 2004 Adapted from ARCADY/3 which is Crown Copyright by permission of the controller of HMSO ______________________________________________________ For sales and distribution information, program advice and maintenance, contact: TRL Limited Tel: +44 (0) 1344 770018 Crowthorne House Fax: +44 (0) 1344 770864 Nine Mile Ride Email: [email protected] Wokingham, Berks. Web: www.trlsoftware.co.uk RG40 3GA,UK --------------------------------------------------------------------------------- THE USER OF THIS COMPUTER PROGRAM FOR THE SOLUTION OF AN ENGINEERING PROBLEM IS IN NO WAY RELIEVED OF THEIR RESPONSIBILITY FOR THE CORRECTNESS OF THE SOLUTION --------------------------------------------------------------------------------- Run with file:- "t:\M-EC Job Book\20111\capacity assessments\2021 + DEV Dove Bank-Town Meadows rdbt PM.vai"(drive-on-the-left ) at 11:55:45 on Friday, 5 August 2011
FILE PROPERTIES *************** RUN TITLE: The Dove Way LOCATION: DATE: 05/07/2011 CLIENT: ENUMERATOR: trose [TIMROSE] JOB NUMBER: 20111 STATUS: DESCRIPTION:
INPUT DATA ********** ARM A - Retail Access ARM B - Town Meadows Way ARM C - Dove Bank ARM D - A518
GEOMETRIC DATA -------------- ----------------------------------------------------------------------------------------------------------------------- I ARM I V (M) I E (M) I L (M) I R (M) I D (M) I PHI (DEG) I SLOPE I INTERCEPT (PCU/MIN) I ----------------------------------------------------------------------------------------------------------------------- I ARM A I 4.00 I 5.00 I 5.00 I 20.00 I 40.00 I 30.0 I 0.581 I 23.279 I I ARM B I 5.00 I 7.00 I 23.00 I 25.00 I 40.00 I 60.0 I 0.634 I 30.025 I I ARM C I 3.00 I 5.00 I 30.00 I 45.00 I 40.00 I 56.0 I 0.547 I 21.994 I I ARM D I 7.00 I 7.00 I 0.00 I 15.00 I 40.00 I 64.0 I 0.628 I 30.603 I ----------------------------------------------------------------------------------------------------------------------- V = approach half-width L = effective flare length D = inscribed circle diameter E = entry width R = entry radius PHI = entry angle
TRAFFIC DEMAND DATA ------------------- (Only sets included in the current run are shown)
----------------------- I ARM I FLOW SCALE(%) I ----------------------- I A I 100 I I B I 100 I I C I 100 I I D I 100 I -----------------------
TIME PERIOD BEGINS 16.45 AND ENDS 18.15
LENGTH OF TIME PERIOD - 90 MINUTES. LENGTH OF TIME SEGMENT - 15 MINUTES.

-------------------------------------------------------------------------------- TRL TRL VIEWER 3.0 AC t:\M-EC Job Book\20111\capacity assessments\2021 + DEV Dove Bank-Town Meadows rdbt PM.vao - Page 2 -------------------------------------------------------------------------------- DEMAND FLOW PROFILES ARE SYNTHESISED FROM TURNING COUNT DATA DEMAND SET TITLE: The Dove Way ----------------------------------------------------------------------------- I I NUMBER OF MINUTES FROM START WHEN I RATE OF FLOW (VEH/MIN) I I ARM I FLOW STARTS I TOP OF PEAK I FLOW STOPS I BEFORE I AT TOP I AFTER I I I TO RISE I IS REACHED IFALLING I PEAK I OF PEAK I PEAK I ----------------------------------------------------------------------------- I ARM A I 15.00 I 45.00 I 75.00 I 2.64 I 3.96 I 2.64 I I ARM B I 15.00 I 45.00 I 75.00 I 11.60 I 17.40 I 11.60 I I ARM C I 15.00 I 45.00 I 75.00 I 7.29 I 10.93 I 7.29 I I ARM D I 15.00 I 45.00 I 75.00 I 13.99 I 20.98 I 13.99 I ----------------------------------------------------------------------------- DEMAND SET TITLE: The Dove Way
-------------------------------------------------------------------- I I TURNING PROPORTIONS I I I TURNING COUNTS (VEH/HR) I I I (PERCENTAGE OF H.V.S) I I ----------------------------------------------- I TIME I FROM/TO I ARM A I ARM B I ARM C I ARM D I -------------------------------------------------------------------- I 16.45 - 18.15 I I I I I I I I ARM A I 0.000 I 0.436 I 0.156 I 0.408 I I I I 0.0 I 92.0 I 33.0 I 86.0 I I I I ( 10.0)I ( 10.0)I ( 10.0)I ( 10.0)I I I I I I I I I I ARM B I 0.119 I 0.000 I 0.194 I 0.688 I I I I 110.0 I 0.0 I 180.0 I 638.0 I I I I ( 10.0)I ( 10.0)I ( 10.0)I ( 10.0)I I I I I I I I I I ARM C I 0.206 I 0.379 I 0.000 I 0.415 I I I I 120.0 I 221.0 I 0.0 I 242.0 I I I I ( 10.0)I ( 10.0)I ( 10.0)I ( 10.0)I I I I I I I I I I ARM D I 0.063 I 0.776 I 0.161 I 0.000 I I I I 71.0 I 868.0 I 180.0 I 0.0 I I I I ( 10.0)I ( 10.0)I ( 10.0)I ( 10.0)I I I I I I I I --------------------------------------------------------------------
QUEUE AND DELAY INFORMATION FOR EACH 15 MIN TIME SEGMENT --------------------------------------------------------
------------------------------------------------------------------------------------------------------------------ I TIME DEMAND CAPACITY DEMAND/ PEDESTRIAN START END DELAY GEOMETRIC DELAY AVERAGE DELAY I I (VEH/MIN) (VEH/MIN) CAPACITY FLOW QUEUE QUEUE (VEH.MIN/ (VEH.MIN/ PER ARRIVING I I (RFC) (PEDS/MIN) (VEHS) (VEHS) TIME SEGMENT) TIME SEGMENT) VEHICLE (MIN) I I 16.45-17.00 I I ARM A 2.64 12.00 0.220 0.0 0.3 4.0 0.11 I I ARM B 11.60 24.94 0.465 0.0 0.9 12.5 0.07 I I ARM C 7.29 14.32 0.509 0.0 1.0 14.4 0.14 I I ARM D 13.99 24.31 0.575 0.0 1.3 19.1 0.10 I I I ------------------------------------------------------------------------------------------------------------------
------------------------------------------------------------------------------------------------------------------ I TIME DEMAND CAPACITY DEMAND/ PEDESTRIAN START END DELAY GEOMETRIC DELAY AVERAGE DELAY I I (VEH/MIN) (VEH/MIN) CAPACITY FLOW QUEUE QUEUE (VEH.MIN/ (VEH.MIN/ PER ARRIVING I I (RFC) (PEDS/MIN) (VEHS) (VEHS) TIME SEGMENT) TIME SEGMENT) VEHICLE (MIN) I I 17.00-17.15 I I ARM A 3.15 10.20 0.309 0.3 0.4 6.4 0.14 I I ARM B 13.85 24.48 0.566 0.9 1.3 18.7 0.09 I I ARM C 8.70 13.20 0.659 1.0 1.9 26.0 0.22 I I ARM D 16.70 23.61 0.707 1.3 2.3 33.1 0.14 I I I ------------------------------------------------------------------------------------------------------------------
------------------------------------------------------------------------------------------------------------------ I TIME DEMAND CAPACITY DEMAND/ PEDESTRIAN START END DELAY GEOMETRIC DELAY AVERAGE DELAY I I (VEH/MIN) (VEH/MIN) CAPACITY FLOW QUEUE QUEUE (VEH.MIN/ (VEH.MIN/ PER ARRIVING I I (RFC) (PEDS/MIN) (VEHS) (VEHS) TIME SEGMENT) TIME SEGMENT) VEHICLE (MIN) I I 17.15-17.30 I I ARM A 3.86 7.93 0.487 0.4 0.9 12.9 0.24 I I ARM B 16.96 23.88 0.711 1.3 2.4 33.6 0.14 I I ARM C 10.66 11.70 0.911 1.9 6.9 80.6 0.62 I I ARM D 20.46 22.77 0.898 2.3 7.2 89.5 0.34 I I I ------------------------------------------------------------------------------------------------------------------
------------------------------------------------------------------------------------------------------------------ I TIME DEMAND CAPACITY DEMAND/ PEDESTRIAN START END DELAY GEOMETRIC DELAY AVERAGE DELAY I I (VEH/MIN) (VEH/MIN) CAPACITY FLOW QUEUE QUEUE (VEH.MIN/ (VEH.MIN/ PER ARRIVING I I (RFC) (PEDS/MIN) (VEHS) (VEHS) TIME SEGMENT) TIME SEGMENT) VEHICLE (MIN) I I 17.30-17.45 I I ARM A 3.86 7.73 0.499 0.9 1.0 14.4 0.26 I I ARM B 16.96 23.84 0.712 2.4 2.4 36.1 0.15 I I ARM C 10.66 11.66 0.914 6.9 8.1 114.1 0.82 I I ARM D 20.46 22.67 0.902 7.2 8.1 115.7 0.42 I I I ------------------------------------------------------------------------------------------------------------------

-------------------------------------------------------------------------------- TRL TRL VIEWER 3.0 AC t:\M-EC Job Book\20111\capacity assessments\2021 + DEV Dove Bank-Town Meadows rdbt PM.vao - Page 3 -------------------------------------------------------------------------------- ------------------------------------------------------------------------------------------------------------------ I TIME DEMAND CAPACITY DEMAND/ PEDESTRIAN START END DELAY GEOMETRIC DELAY AVERAGE DELAY I I (VEH/MIN) (VEH/MIN) CAPACITY FLOW QUEUE QUEUE (VEH.MIN/ (VEH.MIN/ PER ARRIVING I I (RFC) (PEDS/MIN) (VEHS) (VEHS) TIME SEGMENT) TIME SEGMENT) VEHICLE (MIN) I I 17.45-18.00 I I ARM A 3.15 9.86 0.319 1.0 0.5 7.5 0.15 I I ARM B 13.85 24.42 0.567 2.4 1.3 20.8 0.10 I I ARM C 8.70 13.15 0.662 8.1 2.0 38.7 0.27 I I ARM D 16.70 23.44 0.713 8.1 2.6 44.1 0.17 I I I ------------------------------------------------------------------------------------------------------------------
------------------------------------------------------------------------------------------------------------------ I TIME DEMAND CAPACITY DEMAND/ PEDESTRIAN START END DELAY GEOMETRIC DELAY AVERAGE DELAY I I (VEH/MIN) (VEH/MIN) CAPACITY FLOW QUEUE QUEUE (VEH.MIN/ (VEH.MIN/ PER ARRIVING I I (RFC) (PEDS/MIN) (VEHS) (VEHS) TIME SEGMENT) TIME SEGMENT) VEHICLE (MIN) I I 18.00-18.15 I I ARM A 2.64 11.88 0.222 0.5 0.3 4.4 0.11 I I ARM B 11.60 24.91 0.466 1.3 0.9 13.6 0.08 I I ARM C 7.29 14.28 0.510 2.0 1.1 16.8 0.15 I I ARM D 13.99 24.25 0.577 2.6 1.4 21.6 0.10 I I I ------------------------------------------------------------------------------------------------------------------
QUEUE AT ARM A -------------- TIME SEGMENT NO. OF ENDING VEHICLES IN QUEUE 17.00 0.3 17.15 0.4 17.30 0.9 * 17.45 1.0 * 18.00 0.5 18.15 0.3
QUEUE AT ARM B -------------- TIME SEGMENT NO. OF ENDING VEHICLES IN QUEUE 17.00 0.9 * 17.15 1.3 * 17.30 2.4 ** 17.45 2.4 ** 18.00 1.3 * 18.15 0.9 *
QUEUE AT ARM C -------------- TIME SEGMENT NO. OF ENDING VEHICLES IN QUEUE 17.00 1.0 * 17.15 1.9 ** 17.30 6.9 ******* 17.45 8.1 ******** 18.00 2.0 ** 18.15 1.1 *
QUEUE AT ARM D -------------- TIME SEGMENT NO. OF ENDING VEHICLES IN QUEUE 17.00 1.3 * 17.15 2.3 ** 17.30 7.2 ******* 17.45 8.1 ******** 18.00 2.6 *** 18.15 1.4 *

-------------------------------------------------------------------------------- TRL TRL VIEWER 3.0 AC t:\M-EC Job Book\20111\capacity assessments\2021 + DEV Dove Bank-Town Meadows rdbt PM.vao - Page 4 -------------------------------------------------------------------------------- QUEUEING DELAY INFORMATION OVER WHOLE PERIOD -------------------------------------------- ---------------------------------------------------------------------------- I ARM I TOTAL DEMAND I * QUEUEING * I * INCLUSIVE QUEUEING * I I I I * DELAY * I * DELAY * I I I------------------------------------------------------------------I I I (VEH) (VEH/H) I (MIN) (MIN/VEH) I (MIN) (MIN/VEH) I ---------------------------------------------------------------------------- I A I 289.3 I 192.9 I 49.6 I 0.17 I 49.6 I 0.17 I I B I 1272.5 I 848.3 I 135.2 I 0.11 I 135.2 I 0.11 I I C I 799.4 I 532.9 I 290.5 I 0.36 I 290.5 I 0.36 I I D I 1534.4 I 1022.9 I 323.2 I 0.21 I 323.2 I 0.21 I ---------------------------------------------------------------------------- I ALL I 3895.6 I 2597.1 I 798.5 I 0.20 I 798.6 I 0.20 I ---------------------------------------------------------------------------- * DELAY IS THAT OCCURRING ONLY WITHIN THE TIME PERIOD. * INCLUSIVE DELAY INCLUDES DELAY SUFFERED BY VEHICLES WHICH ARE STILL QUEUEING AFTER THE END OF THE TIME PERIOD. * THESE WILL ONLY BE SIGNIFICANTLY DIFFERENT IF THERE IS A LARGE QUEUE REMAINING AT THE END OF THE TIME PERIOD. END OF JOB ============================================= end of file ===============================================
[Printed at 11:55:51 on 05/08/2011]

APPENDIX K

FULL LISTING Run on:07/ 04/2011
AccsMap - Accident Analysis System
(60) months
Notes:Selection:
andAccidents between dates 31/12/201001/01/2006
Selected using Manual Selection
06401406 518ARoad: Grid Reference: 333760409490Acc. Ref. No:
11-January-2006Time: 0750
Fine without high winds
Wet/Damp
Darkness: street lights present and lit
Road surface
Speed limit: 30
SLIGHT
District Council:
Severity:
Lighting: Weather:
WednesdayEast Staffordshire
Location: TOWN MEADOWS WAY R'ABOUT UTTOXETER J/W DOVE BANK
The accident occured at a roundabout on the A518, at its junction with the A518 controlled by a give way or uncontrolled. There was apelican/puffin/toucan within 50 metres..
Special conditions and hazards: None
Vehicle 1 Car, travelling from N to S was going ahead other on the main carriageway. The vehicle was entering main road and collided withvehicle 2. The female driver aged 36 lived in ST3 had regularly travelled through the site before.
Vehicle 2 Pedal Cycle, travelling from W to E was going ahead other on the main carriageway. The vehicle was mid junction - on roundabout ormain road and collided with vehicle 1. The male driver aged 35 lived in ST14 had regularly travelled through the site before.
Casualty 1 (Vehicle 2) A male rider aged 35 suffered a slight injury.
Contributory Factors
Junction restartVehicle 1
Vehicle 1 Failed to look properly
06401962 522ARoad: Grid Reference: 334330408660Acc. Ref. No:
16-January-2006Time: 1845
Raining without high winds
Wet/Damp
Darkness: street lights present and lit
Road surface
Speed limit: 30
SLIGHT
District Council:
Severity:
Lighting: Weather:
MondayEast Staffordshire
Location: NEW RD J/W HOLLY RD UTTOXETER
The accident occured at a T or staggered junction on the A522, a single carriageway at its junction with the Unclassified539 controlled by agive way or uncontrolled. There was a pelican/puffin/toucan within 50 metres..
Special conditions and hazards: None
Vehicle 1 Car, travelling from SE to NW was going ahead other on the main carriageway. The vehicle was mid junction - on roundabout or mainroad and collided with vehicle 2. The female driver aged 35 lived in ST6 .
Vehicle 2 Car, travelling from SW to NE was starting on the main carriageway. The vehicle was entering main road and collided with vehicle 1.The male driver aged 22 lived in ST14.
Casualty 1 (Vehicle 1) A male vehicle or pillion passenger age unknown suffered a slight injury.
Contributory Factors
Disobeyed Give Way or Stop sign or markingsVehicle 2
Vehicle 1 Other
06402580 50ARoad: Grid Reference: 334670407930Acc. Ref. No:
16-January-2006Time: 0745
Raining without high winds
Wet/Damp
Daylight:street lights present
Road surface
Speed limit: 70
SLIGHT
District Council:
Severity:
Lighting: Weather:
MondayEast Staffordshire
Location: A50 W/B J/W A522 NEW ROAD UTTOXETER
The accident occured at a T or staggered junction on the A50, a dual carriageway at its junction with the A522 controlled by a give way oruncontrolled..
Special conditions and hazards: None
Vehicle 1 Goods 7.5 tonnes mgw and over, travelling from E to NW was changing lane to right on the main carriageway. The vehicle was midjunction - on roundabout or main road and collided with vehicle 2. The male driver aged 55 lived in DN3 had regularly travelled through the site before.
Vehicle 2 Goods 7.5 tonnes mgw and over, travelling from E to NW was going ahead other on the main carriageway. The vehicle was midjunction - on roundabout or main road and collided with vehicle 1. The male driver aged 49 lived in LE11 had regularly travelled through the site before.
Vehicle 3 Car, travelling from E to NW was overtaking a moving vehicle on the offside on the main carriageway. The vehicle was mid junction - onroundabout or main road and collided with vehicle 1. The female driver aged 25 lived in NG7 had regularly travelled through the site before.
Vehicle 4 Car, travelling from S to NW was turning left on the main carriageway. The vehicle was entering main road. The untraced driver of anunknown age .
Casualty 1 (Vehicle 3) A female driver aged 25 suffered a slight injury.
Contributory Factors
Failed to look properlyVehicle 4
Vehicle 2 Sudden braking
Vehicle 1 Slippery road (due to weather)
Vehicle 1 Swerved
Vehicle 4 Careless/Reckless/In a hurry
1Registered to: Staffordshire County Council

FULL LISTING Run on:07/ 04/2011
AccsMap - Accident Analysis System
(60) months
Notes:Selection:
andAccidents between dates 31/12/201001/01/2006
Selected using Manual Selection
06402998 50ARoad: Grid Reference: 334730408660Acc. Ref. No:
23-January-2006Time: 2207
Fine without high winds
Dry
Darkness: street lights present and lit
Road surface
Speed limit: 40
SLIGHT
District Council:
Severity:
Lighting: Weather:
MondayEast Staffordshire
Location: A50 R/BOUT ASBOURNE RD UTTOXETER
The accident occured at a roundabout on the A50, at its junction with the B5030 controlled by a give way or uncontrolled..
Special conditions and hazards: None
Vehicle 1 Car, travelling from W to E was going ahead other on the main carriageway. The vehicle was entering roundabout and collided withvehicle 2. The male driver of an unknown age .
Vehicle 2 Pedal Cycle, travelling from S to N was going ahead other on the main carriageway. The vehicle was mid junction - on roundabout ormain road and collided with vehicle 1. The male driver aged 18 lived in ST14 had regularly travelled through the site before.
Casualty 1 (Vehicle 2) A male rider aged 18 suffered a slight injury.
06404773 50ARoad: Grid Reference: 334720408710Acc. Ref. No:
12-February-2006Time: 1235
Raining without high winds
Wet/Damp
Daylight:street lights present
Road surface
Speed limit: 50
SLIGHT
District Council:
Severity:
Lighting: Weather:
SundayEast Staffordshire
Location: A50 J/W ASHBOURNE ROAD UTTOXETER
The accident occured at a roundabout on the A50, at its junction with the A518 controlled by a give way or uncontrolled. There was apelican/puffin/toucan within 50 metres..
Special conditions and hazards: None
Vehicle 1 Car, travelling from E to W was going ahead other on the main carriageway. The vehicle was approaching junction or waiting/parked atjunction approach and skidded and collided with vehicle 2. The male driver aged 34 lived in NN16.
Vehicle 2 Car, travelling from E to W was stopping on the main carriageway. The vehicle was approaching junction or waiting/parked at junctionapproach and collided with vehicle 1. The female driver aged 41 lived in LE7 .
Casualty 1 (Vehicle 2) A male vehicle or pillion passenger aged 14 suffered a slight injury.
Contributory Factors
Sudden brakingVehicle 1
Vehicle 1 Slippery road (due to weather)
06407069 50ARoad: Grid Reference: 334470409950Acc. Ref. No:
03-March-2006Time: 1750
Fine without high winds
Dry
Darkness: street lights present and lit
Road surface
Speed limit: 70
SLIGHT
District Council:
Severity:
Lighting: Weather:
FridayEast Staffordshire
Location: A50 E/B J/W DERBY ROAD UTTOXETER
The accident occured at a roundabout on the A50, at its junction with the A518 controlled by a give way or uncontrolled..
Special conditions and hazards: None
Vehicle 1 Car, travelling from NW to E was going ahead other on the main carriageway. The vehicle was approaching junction or waiting/parkedat junction approach and collided with vehicle 2. The male driver aged 59 lived in CA14 had occasionally travelled through the site before.
Vehicle 2 Car, travelling from NW to E was stopping on the main carriageway. The vehicle was approaching junction or waiting/parked at junctionapproach and collided with vehicle 1. The female driver aged 41 lived in WA9 had occasionally travelled through the site before.
Casualty 1 (Vehicle 2) A female driver aged 41 suffered a slight injury.
Casualty 2 (Vehicle 2) A male vehicle or pillion passenger aged 49 suffered a slight injury.
Contributory Factors
Following too closeVehicle 1
Vehicle 1 Failed to look properly
Vehicle 1 Failed to judge other persons path or speed
Vehicle 1 Careless/Reckless/In a hurry
2Registered to: Staffordshire County Council

FULL LISTING Run on:07/ 04/2011
AccsMap - Accident Analysis System
(60) months
Notes:Selection:
andAccidents between dates 31/12/201001/01/2006
Selected using Manual Selection
06408642 ARoad: Grid Reference: 334710408660Acc. Ref. No:
18-March-2006Time: 1229
Fine without high winds
Dry
Daylight:street lights present
Road surface
Speed limit: 60
SLIGHT
District Council:
Severity:
Lighting: Weather:
SaturdayEast Staffordshire
Location: A50 W/B J/W ASHBOURNE RD UTTOXETER
Special conditions and hazards: None
Vehicle 1 Car, travelling from E to N was turning right on the main carriageway. The vehicle was mid junction - on roundabout or main road andcollided with vehicle 2. The female driver aged 25 lived in N4 .
Vehicle 2 Motor Cycle over 50 cc and up to 125cc, travelling from E to W was going ahead other on the main carriageway. The vehicle was midjunction - on roundabout or main road and collided with vehicle 1. The male driver aged 35 lived in PR1 .
Casualty 1 (Vehicle 2) A male rider aged 35 suffered a slight injury.
Contributory Factors
Failed to judge other persons path or speedVehicle 1
Vehicle 1 Poor turn or manoevre
06410836 530DRoad: Grid Reference: 333560409140Acc. Ref. No:
10-April-2006Time: 1500
Fine without high winds
Dry
Daylight:street lights present
Road surface
Speed limit: 30
SLIGHT
District Council:
Severity:
Lighting: Weather:
MondayEast Staffordshire
Location: HIGH ST UTTOXETER APPROX 65MTRS S/W J/W SMITHFIELD RD
The accident occured on the D530, There was a zebra crossing within 50 metres..
Special conditions and hazards: Other object in carriageway
Vehicle 1 Car, travelling from N to S was going ahead other on the main carriageway. The vehicle was not at, or within 20M of a junction. Themale driver aged 22 lived in LE51 had not travelled through the site before.
Casualty 1 (Vehicle 1) A female vehicle or pillion passenger aged 18 suffered a slight injury.
Contributory Factors
Disobeyed automatic traffic signalVehicle 1
Vehicle 1 Failed to look properly
Vehicle 1 Traffic calming (eg speed cushions etc.)
06416800 544DRoad: Grid Reference: 334470408940Acc. Ref. No:
12-June-2006Time: 1350
Fine without high winds
Dry
Daylight:street lights present
Road surface
Speed limit: 30
SLIGHT
District Council:
Severity:
Lighting: Weather:
MondayEast Staffordshire
Location: OS 7 PARK ST UTTOXETER APPROX 5MTRS SE J/W JOHNSON RD.
The accident occured at a T or staggered junction on the D544, a single carriageway at its junction with the Unclassified544 controlled by agive way or uncontrolled..
Special conditions and hazards: None
Vehicle 1 Car, travelling from SE to SW was turning left on the main carriageway. The vehicle was approaching junction or waiting/parked atjunction approach and skidded. The female driver aged 19 lived in ST14 had regularly travelled through the site before.
Casualty 1 (Vehicle 1) A female driver aged 19 suffered a slight injury.
Contributory Factors
Loss of controlVehicle 1
3Registered to: Staffordshire County Council
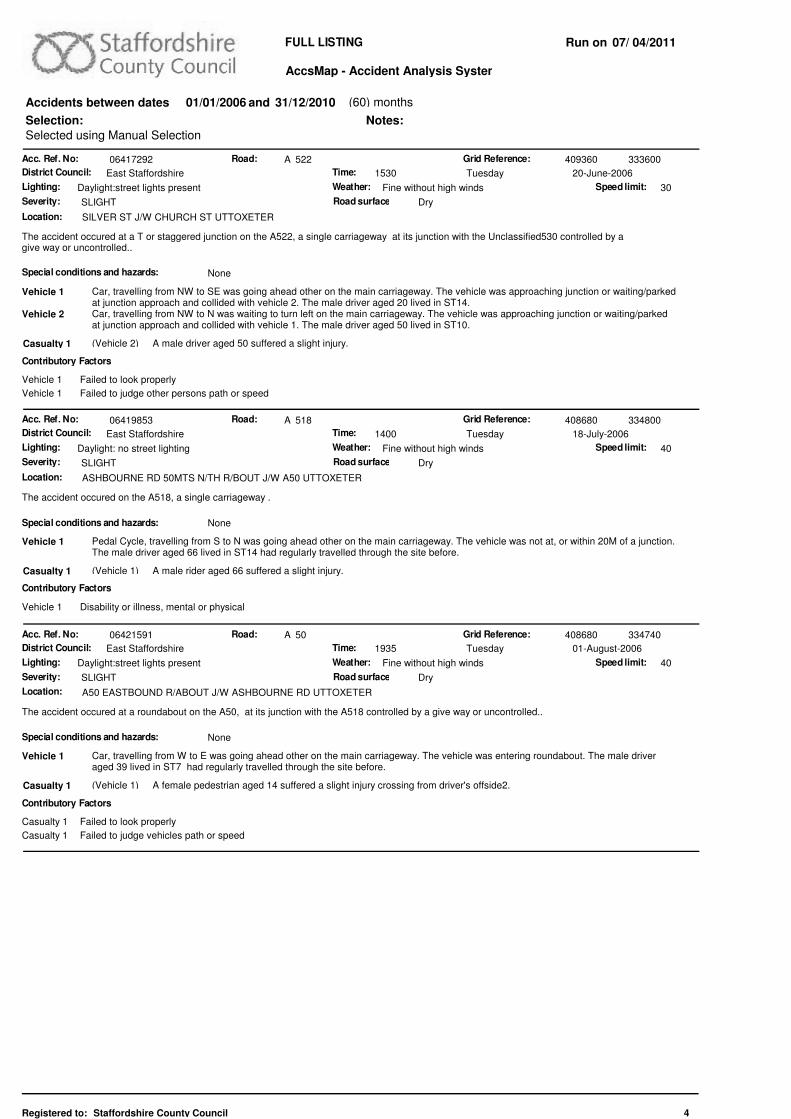
FULL LISTING Run on:07/ 04/2011
AccsMap - Accident Analysis System
(60) months
Notes:Selection:
andAccidents between dates 31/12/201001/01/2006
Selected using Manual Selection
06417292 522ARoad: Grid Reference: 333600409360Acc. Ref. No:
20-June-2006Time: 1530
Fine without high winds
Dry
Daylight:street lights present
Road surface
Speed limit: 30
SLIGHT
District Council:
Severity:
Lighting: Weather:
TuesdayEast Staffordshire
Location: SILVER ST J/W CHURCH ST UTTOXETER
The accident occured at a T or staggered junction on the A522, a single carriageway at its junction with the Unclassified530 controlled by agive way or uncontrolled..
Special conditions and hazards: None
Vehicle 1 Car, travelling from NW to SE was going ahead other on the main carriageway. The vehicle was approaching junction or waiting/parkedat junction approach and collided with vehicle 2. The male driver aged 20 lived in ST14.
Vehicle 2 Car, travelling from NW to N was waiting to turn left on the main carriageway. The vehicle was approaching junction or waiting/parkedat junction approach and collided with vehicle 1. The male driver aged 50 lived in ST10.
Casualty 1 (Vehicle 2) A male driver aged 50 suffered a slight injury.
Contributory Factors
Failed to look properlyVehicle 1
Vehicle 1 Failed to judge other persons path or speed
06419853 518ARoad: Grid Reference: 334800408680Acc. Ref. No:
18-July-2006Time: 1400
Fine without high winds
Dry
Daylight: no street lighting
Road surface
Speed limit: 40
SLIGHT
District Council:
Severity:
Lighting: Weather:
TuesdayEast Staffordshire
Location: ASHBOURNE RD 50MTS N/TH R/BOUT J/W A50 UTTOXETER
The accident occured on the A518, a single carriageway .
Special conditions and hazards: None
Vehicle 1 Pedal Cycle, travelling from S to N was going ahead other on the main carriageway. The vehicle was not at, or within 20M of a junction.The male driver aged 66 lived in ST14 had regularly travelled through the site before.
Casualty 1 (Vehicle 1) A male rider aged 66 suffered a slight injury.
Contributory Factors
Disability or illness, mental or physicalVehicle 1
06421591 50ARoad: Grid Reference: 334740408680Acc. Ref. No:
01-August-2006Time: 1935
Fine without high winds
Dry
Daylight:street lights present
Road surface
Speed limit: 40
SLIGHT
District Council:
Severity:
Lighting: Weather:
TuesdayEast Staffordshire
Location: A50 EASTBOUND R/ABOUT J/W ASHBOURNE RD UTTOXETER
The accident occured at a roundabout on the A50, at its junction with the A518 controlled by a give way or uncontrolled..
Special conditions and hazards: None
Vehicle 1 Car, travelling from W to E was going ahead other on the main carriageway. The vehicle was entering roundabout. The male driveraged 39 lived in ST7 had regularly travelled through the site before.
Casualty 1 (Vehicle 1) A female pedestrian aged 14 suffered a slight injury crossing from driver's offside2.
Contributory Factors
Failed to look properlyCasualty 1
Casualty 1 Failed to judge vehicles path or speed
4Registered to: Staffordshire County Council

FULL LISTING Run on:07/ 04/2011
AccsMap - Accident Analysis System
(60) months
Notes:Selection:
andAccidents between dates 31/12/201001/01/2006
Selected using Manual Selection
06424352 50ARoad: Grid Reference: 334730408650Acc. Ref. No:
02-September-2006Time: 0640
Fine without high winds
Dry
Daylight:street lights present
Road surface
Speed limit: 60
SLIGHT
District Council:
Severity:
Lighting: Weather:
SaturdayEast Staffordshire
Location: A50 UTTOXETER BY PASS R/BOUT J/W ASHBOURNE RD UTTOXETER
The accident occured at a roundabout on the A50, at its junction with the A518 controlled by a give way or uncontrolled..
Special conditions and hazards: None
Vehicle 1 Car, travelling from W to E was going ahead other on the main carriageway. The vehicle was entering roundabout and skidded. Themale driver aged 30.
Casualty 1 (Vehicle 1) A male driver aged 30 suffered a slight injury.
Contributory Factors
Disobeyed Give Way or Stop sign or markingsVehicle 1
Vehicle 1 Exceeding speed limit
Vehicle 1 Travelling too fast for conditions
Vehicle 1 Junction overshoot
Vehicle 1 Impaired by alcohol
06425125 544DRoad: Grid Reference: 334280409050Acc. Ref. No:
16-September-2006Time: 1650
Fine without high winds
Dry
Daylight:street lights present
Road surface
Speed limit: 30
SLIGHT
District Council:
Severity:
Lighting: Weather:
SaturdayEast Staffordshire
Location: PARK ST UTTOXETER APPROX 30 MTRS N/W SLADEFIELDS
The accident occured on the D544, a single carriageway .
Special conditions and hazards: None
Vehicle 1 Car, travelling from S to N was going ahead other on the main carriageway. The vehicle was not at, or within 20M of a junction. Themale driver of an unknown age had regularly travelled through the site before.
Vehicle 2 Car, travelling from S to N was going ahead other on the main carriageway. The vehicle was not at, or within 20M of a junction. Thefemale driver of an unknown age .
Casualty 1 (Vehicle 1) A female pedestrian age unknown suffered a slight injury9.
06428178 522ARoad: Grid Reference: 333730409410Acc. Ref. No:
19-October-2006Time: 1526
Fine without high winds
Dry
Daylight:street lights present
Road surface
Speed limit: 30
SERIOUS
District Council:
Severity:
Lighting: Weather:
ThursdayEast Staffordshire
Location: DOVE BANK UTTOXETER O/S 35
The accident occured on the A522, a single carriageway .
Special conditions and hazards: None
Vehicle 1 Car, travelling from SW to NE was going ahead other on the main carriageway. The vehicle was not at, or within 20M of a junction. Thefemale driver aged 51 lived in DE65 had regularly travelled through the site before.
Casualty 1 (Vehicle 1) A male pedestrian aged 14 suffered a serious injury crossing from driver's nearside4.
Contributory Factors
Failed to look properlyCasualty 1
5Registered to: Staffordshire County Council

FULL LISTING Run on:07/ 04/2011
AccsMap - Accident Analysis System
(60) months
Notes:Selection:
andAccidents between dates 31/12/201001/01/2006
Selected using Manual Selection
06029677 50ARoad: Grid Reference: 334720408590Acc. Ref. No:
06-November-2006Time: 0650
Fine without high winds
Wet/Damp
Daylight:street lights present
Road surface
Speed limit: 70
SLIGHT
District Council:
Severity:
Lighting: Weather:
MondayEast Staffordshire
Location: A50 E/B APPROACHING J/W ASHBOURNE RD
The accident occured on the A50, a dual carriageway .
Special conditions and hazards: None
Vehicle 1 Car, travelling from W to E was overtaking a moving vehicle on the offside on the main carriageway. The vehicle was not at, or within20M of a junction and skidded and collided with vehicle 2. The male driver aged 22 lived in ST3 had regularly travelled through the site before.
Vehicle 2 Car, travelling from W to E was stopping on the main carriageway. The vehicle was not at, or within 20M of a junction and collided withvehicle 1. The male driver aged 29 lived in ST3 had regularly travelled through the site before.
Casualty 1 (Vehicle 1) A male vehicle or pillion passenger aged 25 suffered a slight injury.
Contributory Factors
Careless/Reckless/In a hurryVehicle 1
Vehicle 1 Following too close
07001363 522ARoad: Grid Reference: 334330408650Acc. Ref. No:
08-January-2007Time: 1705
Fine without high winds
Dry
Darkness: street lights present and lit
Road surface
Speed limit: 30
SLIGHT
District Council:
Severity:
Lighting: Weather:
MondayEast Staffordshire
Location: NEW RD UTTOXETER J/W HOLLY RD
The accident occured at a crossroads on the A522, a single carriageway at its junction with the Unclassified539 controlled by a give way oruncontrolled. There was a pelican/puffin/toucan within 50 metres..
Special conditions and hazards: None
Vehicle 1 Car, travelling from E to W was going ahead other on the main carriageway. The vehicle was mid junction - on roundabout or main roadand collided with vehicle 2. The female driver aged 22 lived in ST14.
Vehicle 2 Car, travelling from S to N was starting on the main carriageway. The vehicle was entering main road and collided with vehicle 1. Themale driver aged 41 lived in ST6 .
Casualty 1 (Vehicle 2) A male driver aged 41 suffered a slight injury.
Contributory Factors
Junction restartVehicle 2
Vehicle 2 Failed to judge other persons path or speed
07003369 522ARoad: Grid Reference: 333600409360Acc. Ref. No:
22-January-2007Time: 1830
Fine without high winds
Dry
Daylight:street lights present
Road surface
Speed limit: 30
SLIGHT
District Council:
Severity:
Lighting: Weather:
MondayEast Staffordshire
Location: SILVER ST UTTOXETER J/W CHURCH ST
The accident occured at a T or staggered junction on the A522, a single carriageway at its junction with the A522 controlled by a give wayor uncontrolled..
Special conditions and hazards: None
Vehicle 1 Car, travelling from NW to S was going ahead other on the main carriageway. The vehicle was approaching junction or waiting/parkedat junction approach and collided with vehicle 2. The female driver aged 33 lived in ST14 had regularly travelled through the site before.
Vehicle 2 Car, travelling from NW to N was waiting to turn left on the main carriageway. The vehicle was approaching junction or waiting/parkedat junction approach and collided with vehicle 1. The female driver aged 25 lived in ST14 had regularly travelled through the site before.
Casualty 1 (Vehicle 2) A female driver aged 25 suffered a slight injury.
Contributory Factors
Failed to look properlyVehicle 1
Vehicle 1 Careless/Reckless/In a hurry
6Registered to: Staffordshire County Council

FULL LISTING Run on:07/ 04/2011
AccsMap - Accident Analysis System
(60) months
Notes:Selection:
andAccidents between dates 31/12/201001/01/2006
Selected using Manual Selection
07006680 50ARoad: Grid Reference: 334450410040Acc. Ref. No:
08-March-2007Time: 1015
Fine without high winds
Dry
Daylight:street lights present
Road surface
Speed limit: 70
SLIGHT
District Council:
Severity:
Lighting: Weather:
ThursdayEast Staffordshire
Location: A50 E/B 20 MTS EAST OF DERBY ROAD UTTOXETER
The accident occured on the A50, a dual carriageway .
Special conditions and hazards: None
Vehicle 1 Goods 7.5 tonnes mgw and over, travelling from SW to E was changing lane to left on the main carriageway. The vehicle was not at, orwithin 20M of a junction and collided with vehicle 2. The male driver aged 56 lived in WS15 had regularly travelled through the site before.
Vehicle 2 Car, travelling from SW to E was overtaking on the nearside on the main carriageway. The vehicle was not at, or within 20M of ajunction and collided with vehicle 1. The female driver aged 19 lived in ST14 had regularly travelled through the site before.
Casualty 1 (Vehicle 2) A female driver aged 19 suffered a slight injury.
Contributory Factors
Illegal turn or direction of travelVehicle 2
Vehicle 1 Failed to look properly
Vehicle 2 Failed to judge other persons path or speed
Vehicle 2 Poor turn or manoevre
07007329 110CRoad: Grid Reference: 334990408620Acc. Ref. No:
08-March-2007Time: 1558
Fine without high winds
Dry
Daylight:street lights present
Road surface
Speed limit: 40
SERIOUS
District Council:
Severity:
Lighting: Weather:
ThursdayEast Staffordshire
Location: ASHBOURNE RD O/S FOUR WINDS STRAMSHALL
The accident occured on the C110, a single carriageway .
Special conditions and hazards: None
Vehicle 1 Bus or coach, travelling from E to N was going ahead on a right bend on the main carriageway. The vehicle was not at, or within 20M ofa junction. The male driver aged 59 lived in ST4 had regularly travelled through the site before.
Casualty 1 (Vehicle 1) A female vehicle or pillion passenger aged 15 suffered a serious injury.
Contributory Factors
OtherCasualty 1
07006758 518ARoad: Grid Reference: 335160408780Acc. Ref. No:
11-March-2007Time: 2148
Fine without high winds
Dry
Darkness: street lights present and lit
Road surface
Speed limit: 40
SLIGHT
District Council:
Severity:
Lighting: Weather:
SundayEast Staffordshire
Location: ASHBOURNE RD R'ABOUT UTTOXETER J/W THE DOVE WAY
The accident occured at a roundabout on the A518, at its junction with the B5030 controlled by a give way or uncontrolled..
Special conditions and hazards: None
Vehicle 1 Car, travelling from NE to SW was going ahead other on the main carriageway. The vehicle was entering roundabout and overturned.The male driver aged 57 lived in ST10.
Casualty 1 (Vehicle 1) A male driver aged 57 suffered a slight injury.
Contributory Factors
Junction overshootVehicle 1
Vehicle 1 Exceeding speed limit
7Registered to: Staffordshire County Council

FULL LISTING Run on:07/ 04/2011
AccsMap - Accident Analysis System
(60) months
Notes:Selection:
andAccidents between dates 31/12/201001/01/2006
Selected using Manual Selection
07008641 530DRoad: Grid Reference: 333590409360Acc. Ref. No:
31-March-2007Time: 2140
Fine without high winds
Dry
Darkness: street lights present and lit
Road surface
Speed limit: 30
SLIGHT
District Council:
Severity:
Lighting: Weather:
SaturdayEast Staffordshire
Location: CHURCH ST J/W SILVER ST UTTOXETER
The accident occured at a T or staggered junction on the D530, a single carriageway at its junction with the A522 controlled by a give wayor uncontrolled..
Special conditions and hazards: None
Vehicle 1 Car, travelling from W to S was turning right on the main carriageway. The vehicle was entering main road and collided with vehicle 2.The male driver aged 19 lived in DE4 had not travelled through the site before.
Vehicle 2 Car, travelling from S to N was going ahead other on the main carriageway. The vehicle was mid junction - on roundabout or main roadand skidded and collided with vehicle 1. The male driver aged 26 lived in ST14 had regularly travelled through the site before.
Casualty 1 (Vehicle 2) A male driver aged 26 suffered a slight injury.
Contributory Factors
Poor turn or manoevreVehicle 1
Vehicle 1 Failed to look properly
Vehicle 1 Failed to judge other persons path or speed
07008793 5030BRoad: Grid Reference: 334730409030Acc. Ref. No:
31-March-2007Time: 1755
Fine without high winds
Dry
Daylight:street lights present
Road surface
Speed limit: 70
SLIGHT
District Council:
Severity:
Lighting: Weather:
SaturdayEast Staffordshire
Location: A50 APPROX 325 MTS EAST R/BOUT J/W ASHBOURNE UTTOXETER
The accident occured on the B5030, a dual carriageway .
Special conditions and hazards: None
Vehicle 1 Car, travelling from W to E was going ahead other on the main carriageway. The vehicle was not at, or within 20M of a junction andcollided with vehicle 2. The male driver aged 42 lived in ST10.
Vehicle 2 Goods over 3.5 tonnes and under 7.5 tonnes mgw, travelling from W to E was stopping on the main carriageway. The vehicle was notat, or within 20M of a junction and collided with vehicle 1. The male driver aged 40 lived in ST6 .
Casualty 1 (Vehicle 2) A male vehicle or pillion passenger aged 25 suffered a slight injury.
Casualty 2 (Vehicle 1) A male driver aged 42 suffered a slight injury.
Contributory Factors
Following too closeVehicle 1
07011420 522ARoad: Grid Reference: 333600409350Acc. Ref. No:
02-May-2007Time: 2205
Fine without high winds
Dry
Darkness: street lights present and lit
Road surface
Speed limit: 30
SLIGHT
District Council:
Severity:
Lighting: Weather:
WednesdayEast Staffordshire
Location: SILVER ST APPROX 17MTRS E Y/W CHURCH ST UTTOXETER
The accident occured at a T or staggered junction on the A522, at its junction with the A522 controlled by a give way or uncontrolled..
Special conditions and hazards: None
Vehicle 1 Car, travelling from S to W was going ahead on a left bend on the main carriageway. The vehicle was approaching junction orwaiting/parked at junction approach and skidded and overturned. The male driver aged 17 lived in ST14.
Casualty 1 (Vehicle 1) A male driver aged 17 suffered a slight injury.
Contributory Factors
SwervedVehicle 1
Vehicle 1 Distraction in vehicle
8Registered to: Staffordshire County Council

FULL LISTING Run on:07/ 04/2011
AccsMap - Accident Analysis System
(60) months
Notes:Selection:
andAccidents between dates 31/12/201001/01/2006
Selected using Manual Selection
07015361 50ARoad: Grid Reference: 334680407930Acc. Ref. No:
16-June-2007Time: 1235
Fine without high winds
Dry
Daylight:street lights present
Road surface
Speed limit: 70
SLIGHT
District Council:
Severity:
Lighting: Weather:
SaturdayEast Staffordshire
Location: A50 E/B OPPOSITE A522 NEW RD UTTOXETER
The accident occured on the A50, a dual carriageway .
Special conditions and hazards: None
Vehicle 1 Car, travelling from W to E was going ahead other on the main carriageway. The vehicle was not at, or within 20M of a junction andskidded and collided with vehicle 2. The female driver aged 71 lived in PR4 .
Vehicle 2 Car, travelling from W to E was going ahead but held up on the main carriageway. The vehicle was not at, or within 20M of a junctionand collided with vehicle 1. The male driver aged 32 lived in GL1 .
Vehicle 3 Car, travelling from W to E was going ahead but held up on the main carriageway. The vehicle was not at, or within 20M of a junctionand collided with vehicle 2. The male driver aged 61 lived in LN3 .
Casualty 1 (Vehicle 1) A female driver aged 71 suffered a slight injury.
Casualty 2 (Vehicle 2) A male driver aged 32 suffered a slight injury.
Casualty 3 (Vehicle 2) A female vehicle or pillion passenger aged 30 suffered a slight injury.
Contributory Factors
Following too closeVehicle 1
Vehicle 1 Sudden braking
07016988 50ARoad: Grid Reference: 334710408530Acc. Ref. No:
03-July-2007Time: 1350
Raining without high winds
Wet/Damp
Daylight:street lights present
Road surface
Speed limit: 40
SLIGHT
District Council:
Severity:
Lighting: Weather:
TuesdayEast Staffordshire
Location: A50 EAST BOUND APPROX 150 MTRS W J/W A518 UTTOXETER
The accident occured on the A50, a dual carriageway .
Special conditions and hazards: None
Vehicle 1 Motorcycle over 500cc, travelling from W to E was stopping on the main carriageway. The vehicle was not at, or within 20M of ajunction and skidded. The male driver aged 44 lived in N93 .
Casualty 1 (Vehicle 1) A female vehicle or pillion passenger aged 43 suffered a slight injury.
Contributory Factors
Slippery road (due to weather)Vehicle 1
07017930 522ARoad: Grid Reference: 334240408780Acc. Ref. No:
07-July-2007Time: 1812
Fine without high winds
Dry
Daylight:street lights present
Road surface
Speed limit: 30
SERIOUS
District Council:
Severity:
Lighting: Weather:
SaturdayEast Staffordshire
Location: CHEADLE RD UTTOXETER O/S HEATH HOUSE
The accident occured on the A522, a single carriageway .
Special conditions and hazards: None
Vehicle 1 Car, travelling from NW to SE was going ahead other on the main carriageway. The vehicle was not at, or within 20M of a junction. Themale driver aged 70 lived in ST14.
Casualty 1 (Vehicle 1) A male driver aged 70 suffered a serious injury.
Contributory Factors
Illness or disability, mental or physicalVehicle 1
Vehicle 1 Loss of control
9Registered to: Staffordshire County Council

FULL LISTING Run on:07/ 04/2011
AccsMap - Accident Analysis System
(60) months
Notes:Selection:
andAccidents between dates 31/12/201001/01/2006
Selected using Manual Selection
07019038 522ARoad: Grid Reference: 334660407930Acc. Ref. No:
19-July-2007Time: 0940
Fine without high winds
Dry
Daylight:street lights present
Road surface
Speed limit: 70
SLIGHT
District Council:
Severity:
Lighting: Weather:
ThursdayEast Staffordshire
Location: NEW RD J/W A50 UTTOXETER
The accident occured at a T or staggered junction on the A522, a slip road at its junction with the A50 controlled by a give way oruncontrolled..
Special conditions and hazards: None
Vehicle 1 Car, travelling from SE to NW was going ahead but held up on the main carriageway. The vehicle was entering from slip road andcollided with vehicle 2. The male driver aged 35 lived in ST5 had regularly travelled through the site before.
Vehicle 2 Car, travelling from SE to NW was going ahead other on the main carriageway. The vehicle was entering from slip road and collidedwith vehicle 1. The male driver aged 41 lived in ST14 had regularly travelled through the site before.
Casualty 1 (Vehicle 2) A female vehicle or pillion passenger aged 39 suffered a slight injury.
Contributory Factors
Junction restartVehicle 1
Vehicle 1 Failed to look properly
07020940 50ARoad: Grid Reference: 334670407920Acc. Ref. No:
12-August-2007Time: 1840
Fine without high winds
Dry
Daylight:street lights present
Road surface
Speed limit: 60
SLIGHT
District Council:
Severity:
Lighting: Weather:
SundayEast Staffordshire
Location: A50 W/B J/W NEW RD UTTOXETER
The accident occured at a T or staggered junction on the A50, a dual carriageway at its junction with the A522 controlled by a give way oruncontrolled..
Special conditions and hazards: None
Vehicle 1 Car, travelling from E to W was going ahead other on the main carriageway. The vehicle was mid junction - on roundabout or main roadand collided with vehicle 2. The female driver aged 47 lived in NN3 had occasionally travelled through the site before.
Vehicle 2 Car, travelling from E to W was going ahead other on the main carriageway. The vehicle was mid junction - on roundabout or main roadand collided with vehicle 1. The male driver aged 67 lived in CW12 had occasionally travelled through the site before.
Vehicle 3 Car, travelling from E to W on the main carriageway. The vehicle was mid junction - on roundabout or main road. The untraced driverof an unknown age .
Casualty 1 (Vehicle 2) A male driver aged 67 suffered a slight injury.
Contributory Factors
Travelling too fast for conditionsVehicle 1
Vehicle 1 Failed to judge other persons path or speed
Vehicle 2 Sudden braking
Vehicle 1 Careless/Reckless/In a hurry
Vehicle 1 Dazzling sun
07023384 50ARoad: Grid Reference: 334700408660Acc. Ref. No:
09-September-2007Time: 1900
Fine without high winds
Dry
Daylight:street lights present
Road surface
Speed limit: 70
SLIGHT
District Council:
Severity:
Lighting: Weather:
SundayEast Staffordshire
Location: A50 R'BOUT UTTOXETER J/W ASHBOURNE RD
The accident occured at a roundabout on the A50, at its junction with the B5030 controlled by a give way or uncontrolled..
Special conditions and hazards: None
Vehicle 1 Car, travelling from W to W was going ahead other on the main carriageway. The vehicle was leaving roundabout and skidded. Themale driver aged 20 had regularly travelled through the site before.
Casualty 1 (Vehicle 1) A male driver aged 20 suffered a slight injury.
Casualty 2 (Vehicle 1) A male vehicle or pillion passenger aged 20 suffered a slight injury.
Contributory Factors
Inexperience with type of vehicleVehicle 1
Vehicle 1 Loss of control
Vehicle 1 Travelling too fast for conditions
10Registered to: Staffordshire County Council

FULL LISTING Run on:07/ 04/2011
AccsMap - Accident Analysis System
(60) months
Notes:Selection:
andAccidents between dates 31/12/201001/01/2006
Selected using Manual Selection
07024112 518ARoad: Grid Reference: 334790408670Acc. Ref. No:
18-September-2007Time: 1700
Fine without high winds
Dry
Daylight:street lights present
Road surface
Speed limit: 40
SLIGHT
District Council:
Severity:
Lighting: Weather:
TuesdayEast Staffordshire
Location: AHSBOURNE RD APPROX 45MTRS J/W A50 UTTOXETER
The accident occured on the A518, a single carriageway .
Special conditions and hazards: None
Vehicle 1 Car, travelling from E to N was going ahead other on the main carriageway. The vehicle was not at, or within 20M of a junction andcollided with vehicle 2. The female driver aged 22 lived in RG41.
Vehicle 2 Goods 7.5 tonnes mgw and over, travelling from E to N was stopping on the main carriageway. The vehicle was not at, or within 20M ofa junction and collided with vehicle 1. The male driver of an unknown age lived in ST14.
Casualty 1 (Vehicle 1) A female driver aged 22 suffered a slight injury.
Casualty 2 (Vehicle 1) A female vehicle or pillion passenger aged 20 suffered a slight injury.
Contributory Factors
Following too closeVehicle 1
07025946 50ARoad: Grid Reference: 334690408360Acc. Ref. No:
10-October-2007Time: 0730
Fine without high winds
Wet/Damp
Daylight:street lights present
Road surface
Speed limit: 70
SLIGHT
District Council:
Severity:
Lighting: Weather:
WednesdayEast Staffordshire
Location: A50 UTTOXETER APPROX 290 MTRS WEST J/W B5030
The accident occured on the A50, a dual carriageway .
Special conditions and hazards: None
Vehicle 1 Car, travelling from W to E was going ahead other on the main carriageway. The vehicle was not at, or within 20M of a junction andcollided with vehicle 2. The male driver aged 57 lived in BL9 .
Vehicle 2 Car, travelling from W to E was going ahead other on the main carriageway. The vehicle was not at, or within 20M of a junction andcollided with vehicle 1. The male driver aged 33 lived in PL11.
Casualty 1 (Vehicle 1) A male driver aged 57 suffered a slight injury.
Contributory Factors
Failed to signal/Misleading signalVehicle 1
Vehicle 1 Failed to look properly
Vehicle 1 Failed to judge other persons path or speed
Vehicle 1 Loss of control
Vehicle 1 Aggressive driving
Vehicle 1 Careless/Reckless/In a hurry
07026863 50ARoad: Grid Reference: 334420410000Acc. Ref. No:
21-October-2007Time: 0750
Fog or mist
Wet/Damp
Daylight:street lights present
Road surface
Speed limit: 70
SLIGHT
District Council:
Severity:
Lighting: Weather:
SundayEast Staffordshire
Location: A50 BYPASS R/B J/W DERBY RD UTTOXETER
The accident occured at a roundabout on the A50, at its junction with the A518 controlled by a give way or uncontrolled..
Special conditions and hazards: None
Vehicle 1 Other motor vehicle, travelling from SE to NW was going ahead on a left bend on the main carriageway. The vehicle was mid junction -on roundabout or main road. The male driver aged 59 lived in NG34.
Casualty 1 (Vehicle 1) A male driver aged 59 suffered a slight injury.
Contributory Factors
Loss of controlVehicle 1
Vehicle 1 Exceeding speed limit
11Registered to: Staffordshire County Council

FULL LISTING Run on:07/ 04/2011
AccsMap - Accident Analysis System
(60) months
Notes:Selection:
andAccidents between dates 31/12/201001/01/2006
Selected using Manual Selection
07028619 522ARoad: Grid Reference: 333670409370Acc. Ref. No:
13-November-2007Time: 1250
Fine without high winds
Dry
Daylight:street lights present
Road surface
Speed limit: 30
SLIGHT
District Council:
Severity:
Lighting: Weather:
TuesdayEast Staffordshire
Location: DOVE BANK UTTOXETER APPROX 15MTS N/TH BACK LANE
The accident occured at a T or staggered junction on the A522, a single carriageway at its junction with the Unclassified0 controlled by agive way or uncontrolled..
Special conditions and hazards: None
Vehicle 1 Car, travelling from NE to S was going ahead on a left bend on the main carriageway. The vehicle was approaching junction orwaiting/parked at junction approach and skidded and collided with vehicle 2. The female driver aged 28 lived in ST14.
Vehicle 2 Car, travelling from S to NE was going ahead on a right bend on the main carriageway. The vehicle cleared junction or waiting/parkedat junction exit and collided with vehicle 1. The male driver aged 81 lived in DE13.
Casualty 1 (Vehicle 1) A female driver aged 28 suffered a slight injury.
Casualty 2 (Vehicle 2) A male driver aged 81 suffered a slight injury.
Contributory Factors
Exceeding speed limitVehicle 1
Vehicle 1 Loss of control
07029041 518ARoad: Grid Reference: 334750408690Acc. Ref. No:
15-November-2007Time: 1430
Fine without high winds
Dry
Daylight:street lights present
Road surface
Speed limit: 40
SLIGHT
District Council:
Severity:
Lighting: Weather:
ThursdayEast Staffordshire
Location: ASHBOURNE RD R/B J/W A50 UTTOXETER
The accident occured at a roundabout on the A518, at its junction with the A50 controlled by a give way or uncontrolled..
Special conditions and hazards: None
Vehicle 1 Car, travelling from N to S was going ahead other on the main carriageway. The vehicle was entering roundabout and collided withvehicle 2. The male driver of an unknown age had occasionally travelled through the site before.
Vehicle 2 Car, travelling from N to S was going ahead other on the main carriageway. The vehicle was entering roundabout and collided withvehicle 1. The male driver aged 47 lived in ST14 had regularly travelled through the site before.
Casualty 1 (Vehicle 2) A female vehicle or pillion passenger age unknown suffered a slight injury.
Contributory Factors
Following too closeVehicle 1
07028802 522ARoad: Grid Reference: 334470408270Acc. Ref. No:
15-November-2007Time: 1730
Fine without high winds
Dry
Darkness: street lights present and lit
Road surface
Speed limit: 30
SLIGHT
District Council:
Severity:
Lighting: Weather:
ThursdayEast Staffordshire
Location: NEW RD UTTOXETER J/W GRANGE RD
The accident occured at a T or staggered junction on the A522, a single carriageway at its junction with the Unclassified541 controlled by agive way or uncontrolled..
Special conditions and hazards: None
Vehicle 1 Car, travelling from W to E was going ahead other on the main carriageway. The vehicle was mid junction - on roundabout or main roadand collided with vehicle 2. The male driver of an unknown age had regularly travelled through the site before.
Vehicle 2 Car, travelling from W to S was turning right on the main carriageway. The vehicle was leaving main road and collided with vehicle 1.The female driver aged 34 lived in ST14 had regularly travelled through the site before.
Casualty 1 (Vehicle 2) A female driver aged 34 suffered a slight injury.
Casualty 2 (Vehicle 2) A male vehicle or pillion passenger aged 39 suffered a slight injury.
Casualty 3 (Vehicle 2) A female vehicle or pillion passenger aged 11 suffered a slight injury.
Contributory Factors
Failed to look properlyVehicle 1
Vehicle 1 Careless/Reckless/In a hurry
12Registered to: Staffordshire County Council

FULL LISTING Run on:07/ 04/2011
AccsMap - Accident Analysis System
(60) months
Notes:Selection:
andAccidents between dates 31/12/201001/01/2006
Selected using Manual Selection
07029985 522ARoad: Grid Reference: 334640407950Acc. Ref. No:
25-November-2007Time: 0400
Fine without high winds
Wet/Damp
Darkness: street lights present and lit
Road surface
Speed limit: 70
FATAL
District Council:
Severity:
Lighting: Weather:
SundayEast Staffordshire
Location: NEW RD J/W A50 WESTBOUND UTTOXETER
The accident occured at a slip road on the A522, a slip road at its junction with the A50 controlled by a give way or uncontrolled..
Special conditions and hazards: Road works
Vehicle 1 Car, travelling from E to S was changing lane to left on the main carriageway. The vehicle was leaving main road and collided withvehicle 2. The male driver aged 49 lived in ST3 had regularly travelled through the site before.
Vehicle 2 Goods 7.5 tonnes mgw and over, on the main carriageway. The vehicle was approaching junction or waiting/parked at junctionapproach and collided with vehicle 1. The male driver of an unknown age .
Casualty 1 (Vehicle 1) A male driver aged 49 suffered a fatal injury.
Contributory Factors
Temporary road layout (eg contraflow)Vehicle 1
Vehicle 1 Fatigue
07031300 522ARoad: Grid Reference: 333600409360Acc. Ref. No:
10-December-2007Time: 1030
Fine without high winds
Dry
Daylight:street lights present
Road surface
Speed limit: 30
SLIGHT
District Council:
Severity:
Lighting: Weather:
MondayEast Staffordshire
Location: SILVER ST J/W CHURCH ST UTTOXETER
The accident occured at a T or staggered junction on the A522, a single carriageway at its junction with the Unclassified530 controlled by agive way or uncontrolled..
Special conditions and hazards: None
Vehicle 1 Car, travelling from NW to SE was going ahead other on the main carriageway. The vehicle was approaching junction or waiting/parkedat junction approach and collided with vehicle 2. The male driver of an unknown age lived in ST14.
Vehicle 2 Car, travelling from NW to N was waiting to turn left on the main carriageway. The vehicle was approaching junction or waiting/parkedat junction approach and collided with vehicle 1. The female driver aged 47 lived in ST10.
Casualty 1 (Vehicle 2) A female driver aged 47 suffered a slight injury.
Contributory Factors
Dazzling sunVehicle 1
08003125 518ARoad: Grid Reference: 333850409500Acc. Ref. No:
29-January-2008Time: 1845
Raining without high winds
Wet/Damp
Darkness: street lights present and lit
Road surface
Speed limit: 40
SERIOUS
District Council:
Severity:
Lighting: Weather:
TuesdayEast Staffordshire
Location: TOWN MEADOWS WAY J/W THE DOVE WAY UTTOXETER
The accident occured at a roundabout on the A518, at its junction with the A518 controlled by a give way or uncontrolled..
Special conditions and hazards: Permanent road signing defective or obscured
Vehicle 1 Other motor vehicle, travelling from S to NE was turning right on the main carriageway. The vehicle was mid junction - on roundabout ormain road and collided with vehicle 2. The male driver aged 45 lived in ST10 had regularly travelled through the site before.
Vehicle 2 Motorcycle 50cc and under, travelling from N to S was going ahead other on the main carriageway. The vehicle was enteringroundabout and collided with vehicle 1. The male driver aged 17 lived in ST14.
Casualty 1 (Vehicle 2) A male rider aged 17 suffered a serious injury.
Contributory Factors
Deposit on road (eg oil, mud, chippings)Vehicle 2
Vehicle 2 Inadequate/Masked signs or road markings
Vehicle 1 Failed to signal/Misleading signal
Vehicle 2 Failed to look properly
Vehicle 2 Failed to judge other persons path or speed
Vehicle 2 Inexperienced or learner driver/rider
13Registered to: Staffordshire County Council
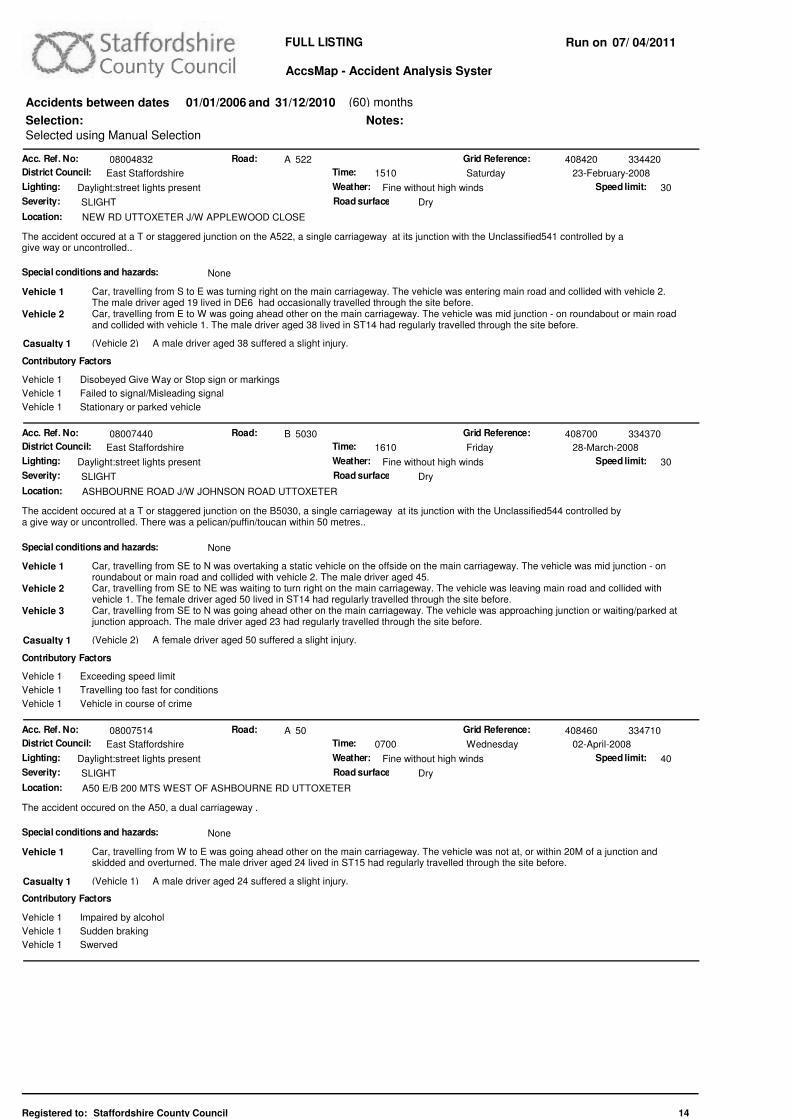
FULL LISTING Run on:07/ 04/2011
AccsMap - Accident Analysis System
(60) months
Notes:Selection:
andAccidents between dates 31/12/201001/01/2006
Selected using Manual Selection
08004832 522ARoad: Grid Reference: 334420408420Acc. Ref. No:
23-February-2008Time: 1510
Fine without high winds
Dry
Daylight:street lights present
Road surface
Speed limit: 30
SLIGHT
District Council:
Severity:
Lighting: Weather:
SaturdayEast Staffordshire
Location: NEW RD UTTOXETER J/W APPLEWOOD CLOSE
The accident occured at a T or staggered junction on the A522, a single carriageway at its junction with the Unclassified541 controlled by agive way or uncontrolled..
Special conditions and hazards: None
Vehicle 1 Car, travelling from S to E was turning right on the main carriageway. The vehicle was entering main road and collided with vehicle 2.The male driver aged 19 lived in DE6 had occasionally travelled through the site before.
Vehicle 2 Car, travelling from E to W was going ahead other on the main carriageway. The vehicle was mid junction - on roundabout or main roadand collided with vehicle 1. The male driver aged 38 lived in ST14 had regularly travelled through the site before.
Casualty 1 (Vehicle 2) A male driver aged 38 suffered a slight injury.
Contributory Factors
Disobeyed Give Way or Stop sign or markingsVehicle 1
Vehicle 1 Failed to signal/Misleading signal
Vehicle 1 Stationary or parked vehicle
08007440 5030BRoad: Grid Reference: 334370408700Acc. Ref. No:
28-March-2008Time: 1610
Fine without high winds
Dry
Daylight:street lights present
Road surface
Speed limit: 30
SLIGHT
District Council:
Severity:
Lighting: Weather:
FridayEast Staffordshire
Location: ASHBOURNE ROAD J/W JOHNSON ROAD UTTOXETER
The accident occured at a T or staggered junction on the B5030, a single carriageway at its junction with the Unclassified544 controlled bya give way or uncontrolled. There was a pelican/puffin/toucan within 50 metres..
Special conditions and hazards: None
Vehicle 1 Car, travelling from SE to N was overtaking a static vehicle on the offside on the main carriageway. The vehicle was mid junction - onroundabout or main road and collided with vehicle 2. The male driver aged 45.
Vehicle 2 Car, travelling from SE to NE was waiting to turn right on the main carriageway. The vehicle was leaving main road and collided withvehicle 1. The female driver aged 50 lived in ST14 had regularly travelled through the site before.
Vehicle 3 Car, travelling from SE to N was going ahead other on the main carriageway. The vehicle was approaching junction or waiting/parked atjunction approach. The male driver aged 23 had regularly travelled through the site before.
Casualty 1 (Vehicle 2) A female driver aged 50 suffered a slight injury.
Contributory Factors
Exceeding speed limitVehicle 1
Vehicle 1 Travelling too fast for conditions
Vehicle 1 Vehicle in course of crime
08007514 50ARoad: Grid Reference: 334710408460Acc. Ref. No:
02-April-2008Time: 0700
Fine without high winds
Dry
Daylight:street lights present
Road surface
Speed limit: 40
SLIGHT
District Council:
Severity:
Lighting: Weather:
WednesdayEast Staffordshire
Location: A50 E/B 200 MTS WEST OF ASHBOURNE RD UTTOXETER
The accident occured on the A50, a dual carriageway .
Special conditions and hazards: None
Vehicle 1 Car, travelling from W to E was going ahead other on the main carriageway. The vehicle was not at, or within 20M of a junction andskidded and overturned. The male driver aged 24 lived in ST15 had regularly travelled through the site before.
Casualty 1 (Vehicle 1) A male driver aged 24 suffered a slight injury.
Contributory Factors
Impaired by alcoholVehicle 1
Vehicle 1 Sudden braking
Vehicle 1 Swerved
14Registered to: Staffordshire County Council

FULL LISTING Run on:07/ 04/2011
AccsMap - Accident Analysis System
(60) months
Notes:Selection:
andAccidents between dates 31/12/201001/01/2006
Selected using Manual Selection
08011266 351CRoad: Grid Reference: 333620409090Acc. Ref. No:
06-May-2008Time: 1333
Fine without high winds
Dry
Daylight:street lights present
Road surface
Speed limit: 30
SLIGHT
District Council:
Severity:
Lighting: Weather:
TuesdayEast Staffordshire
Location: SMITHFIELD RD UTTOXETER 85 MTRS EAST J/W SHORT ST
The accident occured on the C351, a single carriageway There was a zebra crossing within 50 metres..
Special conditions and hazards: None
Vehicle 1 Motorcycle 50cc and under, travelling from W to E was stopping on the main carriageway. The vehicle was not at, or within 20M of ajunction. The female driver aged 22 lived in ST14.
Casualty 1 (Vehicle 1) A female rider aged 22 suffered a slight injury.
Contributory Factors
Sudden brakingVehicle 1
Vehicle 1 Inexperienced or learner driver/rider
08009828 522ARoad: Grid Reference: 334590407910Acc. Ref. No:
07-May-2008Time: 2000
Fine without high winds
Dry
Daylight:street lights present
Road surface
Speed limit: 30
SLIGHT
District Council:
Severity:
Lighting: Weather:
WednesdayEast Staffordshire
Location: UTTOXETER RD. APPROX.9MTS.WEST R/B J/W NEW RD. UTTOXETER.
The accident occured at a roundabout on the A522, at its junction with the A522 controlled by a give way or uncontrolled..
Special conditions and hazards: None
Vehicle 1 Car, travelling from NW to SE was going ahead other on the main carriageway. The vehicle was approaching junction or waiting/parkedat junction approach and collided with vehicle 2. The untraced driver of an unknown age .
Vehicle 2 Car, travelling from NW to SE was going ahead but held up on the main carriageway. The vehicle was approaching junction orwaiting/parked at junction approach and collided with vehicle 1. The female driver aged 19 lived in ST10 had regularly travelled through the site before.
Casualty 1 (Vehicle 2) A female driver aged 19 suffered a slight injury.
Contributory Factors
Failed to look properlyVehicle 1
08014022 544DRoad: Grid Reference: 334410408760Acc. Ref. No:
30-July-2008Time: 2030
Fine without high winds
Dry
Daylight:street lights present
Road surface
Speed limit: 30
SLIGHT
District Council:
Severity:
Lighting: Weather:
WednesdayEast Staffordshire
Location: HOWITT CRES J/W JOHNSON ROAD UTTOXETER
The accident occured at a T or staggered junction on the D544, a single carriageway at its junction with the Unclassified544 controlled by agive way or uncontrolled..
Special conditions and hazards: None
Vehicle 1 Car, travelling from SW to N was reversing on the main carriageway. The vehicle was leaving main road and collided with vehicle 2.The male driver of an unknown age lived in ST14 had regularly travelled through the site before.
Vehicle 2 Pedal Cycle, travelling from S to N was going ahead other on the main carriageway. The vehicle cleared junction or waiting/parked atjunction exit and collided with vehicle 1. The male driver aged 14 lived in ST14 had regularly travelled through the site before.
Casualty 1 (Vehicle 2) A male rider aged 14 suffered a slight injury.
Contributory Factors
Failed to look properlyVehicle 1
Vehicle 2 Cyclist entering road from pavement
Vehicle 2 Failed to look properly
15Registered to: Staffordshire County Council

FULL LISTING Run on:07/ 04/2011
AccsMap - Accident Analysis System
(60) months
Notes:Selection:
andAccidents between dates 31/12/201001/01/2006
Selected using Manual Selection
08014302 522ARoad: Grid Reference: 334340408660Acc. Ref. No:
14-August-2008Time: 2145
Fine without high winds
Dry
Darkness: street lights present and lit
Road surface
Speed limit: 30
SLIGHT
District Council:
Severity:
Lighting: Weather:
ThursdayEast Staffordshire
Location: NEW RD.J/W HOLOLY RD.UTTOXETER.
The accident occured at a T or staggered junction on the A522, a single carriageway at its junction with the Unclassified539 controlled by agive way or uncontrolled..
Special conditions and hazards: None
Vehicle 1 Car, travelling from NW to SW was turning right on the main carriageway. The vehicle was leaving main road and collided with vehicle2. The male driver aged 49 lived in ST10 had regularly travelled through the site before.
Vehicle 2 Motorcycle 50cc and under, travelling from SE to NW was going ahead other on the main carriageway. The vehicle was mid junction -on roundabout or main road and collided with vehicle 1. The male driver aged 17 lived in ST14 had occasionally travelled through the site before.
Casualty 1 (Vehicle 2) A male rider aged 17 suffered a slight injury.
08014250 50ARoad: Grid Reference: 334720408650Acc. Ref. No:
14-August-2008Time: 1045
Fine without high winds
Dry
Daylight: no street lighting
Road surface
Speed limit: 60
SLIGHT
District Council:
Severity:
Lighting: Weather:
ThursdayEast Staffordshire
Location: A50 BYPASS R/B J/W ASHBOURNE RD UTTOXETER
The accident occured at a roundabout on the A50, at its junction with the A518 controlled by a give way or uncontrolled..
Special conditions and hazards: None
Vehicle 1 Car, travelling from W to E was going ahead but held up on the main carriageway. The vehicle was approaching junction orwaiting/parked at junction approach and collided with vehicle 2. The female driver aged 34 lived in CH6 had occasionally travelled through the site before.
Vehicle 2 Car, travelling from W to E was stopping on the main carriageway. The vehicle was approaching junction or waiting/parked at junctionapproach and collided with vehicle 1. The male driver aged 27 lived in MK12 had regularly travelled through the site before.
Casualty 1 (Vehicle 1) A female driver aged 34 suffered a slight injury.
08015232 351CRoad: Grid Reference: 333630409120Acc. Ref. No:
09-September-2008Time: 1845
Fine without high winds
Wet/Damp
Daylight:street lights present
Road surface
Speed limit: 30
SLIGHT
District Council:
Severity:
Lighting: Weather:
TuesdayEast Staffordshire
Location: SMITHFIELD RD J/W HIGH ST UTTOXETER
The accident occured at a T or staggered junction on the C351, a single carriageway at its junction with the Unclassified530 controlled by agive way or uncontrolled. There was a zebra crossing within 50 metres..
Special conditions and hazards: None
Vehicle 1 Car, travelling from N to W was going ahead on a right bend on the main carriageway. The vehicle was mid junction - on roundabout ormain road and skidded. The female driver aged 20 lived in ST14.
Casualty 1 (Vehicle 1) A female vehicle or pillion passenger aged 17 suffered a slight injury.
Contributory Factors
Stolen vehicleVehicle 1
Vehicle 1 Careless/Reckless/In a hurry
Vehicle 1 Loss of control
Vehicle 1 Impaired by alcohol
16Registered to: Staffordshire County Council

FULL LISTING Run on:07/ 04/2011
AccsMap - Accident Analysis System
(60) months
Notes:Selection:
andAccidents between dates 31/12/201001/01/2006
Selected using Manual Selection
08015471 522ARoad: Grid Reference: 333630409310Acc. Ref. No:
17-September-2008Time: 1335
Raining without high winds
Wet/Damp
Daylight:street lights present
Road surface
Speed limit: 30
SLIGHT
District Council:
Severity:
Lighting: Weather:
WednesdayEast Staffordshire
Location: SILVER ST J/W BACK LANE UTTOXETER
The accident occured at a T or staggered junction on the A522, a single carriageway at its junction with the Unclassified0 controlled byautomatic traffic signal(s). There was a pelican/puffin/toucan within 50 metres..
Special conditions and hazards: None
Vehicle 1 Car, travelling from W to SE was going ahead on a right bend on the main carriageway. The vehicle was mid junction - on roundaboutor main road and skidded and collided with vehicle 2. The male driver aged 26 lived in DE72.
Vehicle 2 Car, travelling from NW to SE was going ahead but held up on the main carriageway. The vehicle was mid junction - on roundabout ormain road and collided with vehicle 1. The female driver aged 18 lived in ST10 had regularly travelled through the site before.
Vehicle 3 Car, travelling from NW to SE was going ahead but held up on the main carriageway. The vehicle cleared junction or waiting/parked atjunction exit and collided with vehicle 2. The female driver of an unknown age lived in ST10.
Casualty 1 (Vehicle 2) A female driver aged 18 suffered a slight injury.
Contributory Factors
Careless/Reckless/In a hurryVehicle 1
Vehicle 1 Inexperience with type of vehicle
Vehicle 1 Failed to judge other persons path or speed
08015796 544DRoad: Grid Reference: 334180409080Acc. Ref. No:
24-September-2008Time: 0900
Fine without high winds
Dry
Daylight:street lights present
Road surface
Speed limit: 30
SLIGHT
District Council:
Severity:
Lighting: Weather:
WednesdayEast Staffordshire
Location: PARK ST 20MTS N/TH J/W CROFT GROVE UTTOXETER
The accident occured at a T or staggered junction on the D544, a single carriageway at its junction with the Unclassified546 controlled by agive way or uncontrolled..
Special conditions and hazards: None
Vehicle 1 Other motor vehicle, travelling from S to N was going ahead other on the main carriageway. The vehicle was leaving roundabout. Themale driver aged 68 lived in ST14 had regularly travelled through the site before.
Casualty 1 (Vehicle 1) A male pedestrian aged 13 suffered a slight injury9.
Contributory Factors
Failed to look properlyVehicle 1
Vehicle 1 Passing too close to cyclist, horse rider or pedestrian
08015773 518ARoad: Grid Reference: 333960409700Acc. Ref. No:
27-September-2008Time: 0936
Fog or mist
Dry
Daylight:street lights present
Road surface
Speed limit: 30
SLIGHT
District Council:
Severity:
Lighting: Weather:
SaturdayEast Staffordshire
Location: DERBY RD UTTOXETER J/W ENT TO ANGUS MCKINNON
The accident occured at a private drive on the A518, a single carriageway at its junction with the Unclassified0 controlled by a give way oruncontrolled..
Special conditions and hazards: None
Vehicle 1 Car, travelling from NW to SW was turning right on the main carriageway. The vehicle was entering main road and collided with vehicle2. The male driver aged 40 lived in st5 had regularly travelled through the site before.
Vehicle 2 Motor Cycle over 125 cc and up to 500cc, travelling from SW to NE was going ahead other on the main carriageway. The vehicle wasmid junction - on roundabout or main road and collided with vehicle 1. The male driver aged 30 lived in st14 had regularly travelled through the site before.
Casualty 1 (Vehicle 2) A male rider aged 30 suffered a slight injury.
Contributory Factors
Poor turn or manoevreVehicle 1
Vehicle 1 Failed to look properly
Vehicle 1 Failed to judge other persons path or speed
Vehicle 1 Rain, sleet, snow, or fog
17Registered to: Staffordshire County Council
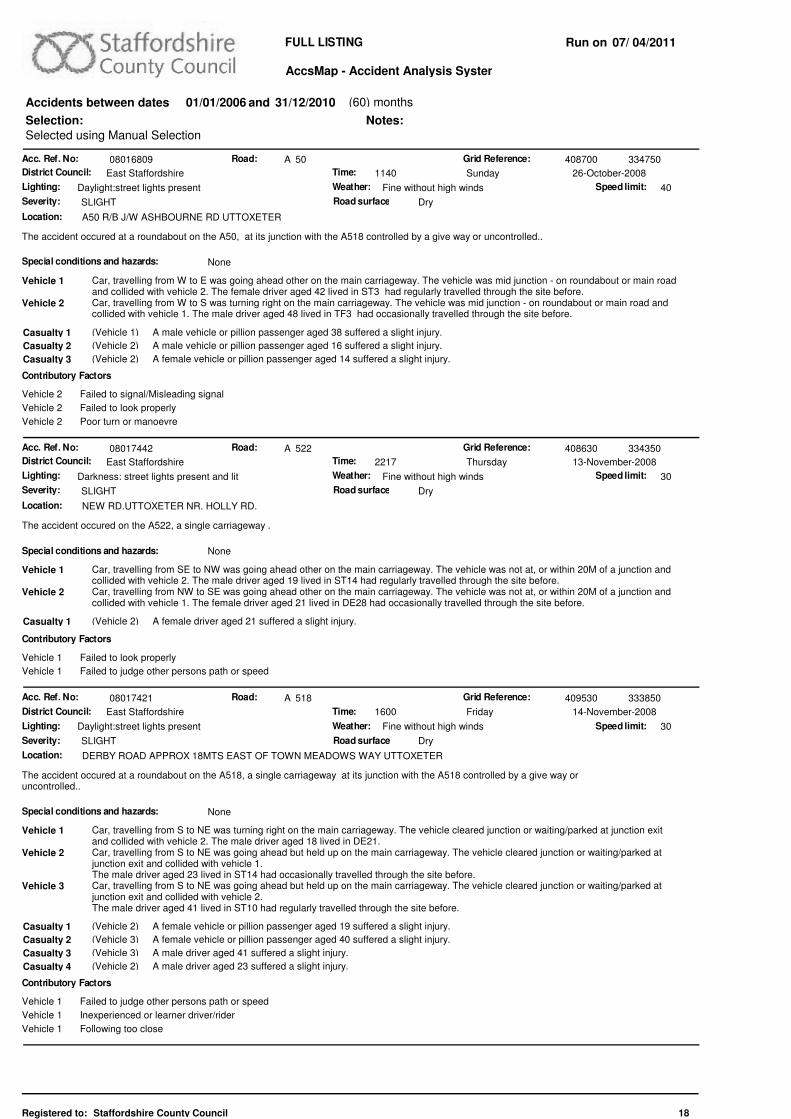
FULL LISTING Run on:07/ 04/2011
AccsMap - Accident Analysis System
(60) months
Notes:Selection:
andAccidents between dates 31/12/201001/01/2006
Selected using Manual Selection
08016809 50ARoad: Grid Reference: 334750408700Acc. Ref. No:
26-October-2008Time: 1140
Fine without high winds
Dry
Daylight:street lights present
Road surface
Speed limit: 40
SLIGHT
District Council:
Severity:
Lighting: Weather:
SundayEast Staffordshire
Location: A50 R/B J/W ASHBOURNE RD UTTOXETER
The accident occured at a roundabout on the A50, at its junction with the A518 controlled by a give way or uncontrolled..
Special conditions and hazards: None
Vehicle 1 Car, travelling from W to E was going ahead other on the main carriageway. The vehicle was mid junction - on roundabout or main roadand collided with vehicle 2. The female driver aged 42 lived in ST3 had regularly travelled through the site before.
Vehicle 2 Car, travelling from W to S was turning right on the main carriageway. The vehicle was mid junction - on roundabout or main road andcollided with vehicle 1. The male driver aged 48 lived in TF3 had occasionally travelled through the site before.
Casualty 1 (Vehicle 1) A male vehicle or pillion passenger aged 38 suffered a slight injury.
Casualty 2 (Vehicle 2) A male vehicle or pillion passenger aged 16 suffered a slight injury.
Casualty 3 (Vehicle 2) A female vehicle or pillion passenger aged 14 suffered a slight injury.
Contributory Factors
Failed to signal/Misleading signalVehicle 2
Vehicle 2 Failed to look properly
Vehicle 2 Poor turn or manoevre
08017442 522ARoad: Grid Reference: 334350408630Acc. Ref. No:
13-November-2008Time: 2217
Fine without high winds
Dry
Darkness: street lights present and lit
Road surface
Speed limit: 30
SLIGHT
District Council:
Severity:
Lighting: Weather:
ThursdayEast Staffordshire
Location: NEW RD.UTTOXETER NR. HOLLY RD.
The accident occured on the A522, a single carriageway .
Special conditions and hazards: None
Vehicle 1 Car, travelling from SE to NW was going ahead other on the main carriageway. The vehicle was not at, or within 20M of a junction andcollided with vehicle 2. The male driver aged 19 lived in ST14 had regularly travelled through the site before.
Vehicle 2 Car, travelling from NW to SE was going ahead other on the main carriageway. The vehicle was not at, or within 20M of a junction andcollided with vehicle 1. The female driver aged 21 lived in DE28 had occasionally travelled through the site before.
Casualty 1 (Vehicle 2) A female driver aged 21 suffered a slight injury.
Contributory Factors
Failed to look properlyVehicle 1
Vehicle 1 Failed to judge other persons path or speed
08017421 518ARoad: Grid Reference: 333850409530Acc. Ref. No:
14-November-2008Time: 1600
Fine without high winds
Dry
Daylight:street lights present
Road surface
Speed limit: 30
SLIGHT
District Council:
Severity:
Lighting: Weather:
FridayEast Staffordshire
Location: DERBY ROAD APPROX 18MTS EAST OF TOWN MEADOWS WAY UTTOXETER
The accident occured at a roundabout on the A518, a single carriageway at its junction with the A518 controlled by a give way oruncontrolled..
Special conditions and hazards: None
Vehicle 1 Car, travelling from S to NE was turning right on the main carriageway. The vehicle cleared junction or waiting/parked at junction exitand collided with vehicle 2. The male driver aged 18 lived in DE21.
Vehicle 2 Car, travelling from S to NE was going ahead but held up on the main carriageway. The vehicle cleared junction or waiting/parked atjunction exit and collided with vehicle 1. The male driver aged 23 lived in ST14 had occasionally travelled through the site before.
Vehicle 3 Car, travelling from S to NE was going ahead but held up on the main carriageway. The vehicle cleared junction or waiting/parked atjunction exit and collided with vehicle 2. The male driver aged 41 lived in ST10 had regularly travelled through the site before.
Casualty 1 (Vehicle 2) A female vehicle or pillion passenger aged 19 suffered a slight injury.
Casualty 2 (Vehicle 3) A female vehicle or pillion passenger aged 40 suffered a slight injury.
Casualty 3 (Vehicle 3) A male driver aged 41 suffered a slight injury.
Casualty 4 (Vehicle 2) A male driver aged 23 suffered a slight injury.
Contributory Factors
Failed to judge other persons path or speedVehicle 1
Vehicle 1 Inexperienced or learner driver/rider
Vehicle 1 Following too close
18Registered to: Staffordshire County Council

FULL LISTING Run on:07/ 04/2011
AccsMap - Accident Analysis System
(60) months
Notes:Selection:
andAccidents between dates 31/12/201001/01/2006
Selected using Manual Selection
08017560 50ARoad: Grid Reference: 334730408650Acc. Ref. No:
17-November-2008Time: 1707
Raining without high winds
Wet/Damp
Darkness: street lights present and lit
Road surface
Speed limit: 70
SERIOUS
District Council:
Severity:
Lighting: Weather:
MondayEast Staffordshire
Location: A50 EASTBOUND APPTOX 5MTS WEST J/W A518 ASHBOURNE ROAD R'BOUT
The accident occured at a roundabout on the A50, a dual carriageway at its junction with the A50 controlled by a give way or uncontrolled..
Special conditions and hazards: None
Vehicle 1 Car, travelling from W to E was stopping on the main carriageway. The vehicle was approaching junction or waiting/parked at junctionapproach and skidded and collided with vehicle 2. The male driver aged 76 lived in ST14 had regularly travelled through the site before.
Vehicle 2 Goods 3.5 tonnes mgw and under, travelling from W to E was going ahead but held up on the main carriageway. The vehicle wasentering roundabout and collided with vehicle 1. The male driver aged 34 lived in ST3 had regularly travelled through the site before.
Casualty 1 (Vehicle 2) A male vehicle or pillion passenger aged 32 suffered a slight injury.
Casualty 2 (Vehicle 1) A male driver aged 76 suffered a serious injury.
Casualty 3 (Vehicle 2) A male driver aged 34 suffered a slight injury.
Contributory Factors
Failed to look properlyVehicle 1
Vehicle 1 Careless/Reckless/In a hurry
080X0098 50ARoad: Grid Reference: 334740408720Acc. Ref. No:
18-December-2008Time: 1100
Fog or mist
Wet/Damp
Daylight: no street lighting
Road surface
Speed limit: 40
SLIGHT
District Council:
Severity:
Lighting: Weather:
ThursdayEast Staffordshire
Location: A50 BYPASS R/B J/W ASHBOURNE RD UTTOXETER
The accident occured at a roundabout on the A50, at its junction with the A518 controlled by a give way or uncontrolled..
Special conditions and hazards: None
Vehicle 1 Car, travelling from W to E was going ahead other on the main carriageway. The vehicle was leaving roundabout and collided withvehicle 2. The female driver aged 27 lived in DE14.
Vehicle 2 Car, travelling from W to E was going ahead other on the main carriageway. The vehicle was leaving roundabout and collided withvehicle 1. The female driver aged 20 lived in M9 .
Casualty 1 (Vehicle 2) A female driver aged 20 suffered a slight injury.
Contributory Factors
Poor turn or manoevreVehicle 1
09000435 544DRoad: Grid Reference: 334640408780Acc. Ref. No:
07-January-2009Time: 0941
Fine without high winds
Dry
Daylight:street lights present
Road surface
Speed limit: 30
SLIGHT
District Council:
Severity:
Lighting: Weather:
WednesdayEast Staffordshire
Location: PARK AVE APPROX 15MTS WEST J/W PARK AVE (CUL DE SAC) UTTOXETER
The accident occured at a T or staggered junction on the D544, a single carriageway at its junction with the Unclassified544 controlled by agive way or uncontrolled..
Special conditions and hazards: None
Vehicle 1 Bus or coach, travelling from NW to SE was starting on the main carriageway. The vehicle was approaching junction or waiting/parkedat junction approach. The male driver aged 44 lived in DE13 had regularly travelled through the site before.
Casualty 1 (Vehicle 1) A female vehicle or pillion passenger aged 86 suffered a slight injury.
Contributory Factors
OtherCasualty 1
19Registered to: Staffordshire County Council

FULL LISTING Run on:07/ 04/2011
AccsMap - Accident Analysis System
(60) months
Notes:Selection:
andAccidents between dates 31/12/201001/01/2006
Selected using Manual Selection
09002045 544DRoad: Grid Reference: 334230409080Acc. Ref. No:
20-February-2009Time: 0815
Fine without high winds
Dry
Daylight: street lighting unknown
Road surface
Speed limit: 30
SERIOUS
District Council:
Severity:
Lighting: Weather:
FridayEast Staffordshire
Location: PARK ST.UTTOXETER NEAR NO.79.
The accident occured on the D544, a single carriageway .
Special conditions and hazards: None
Vehicle 1 Motor Cycle over 125 cc and up to 500cc, travelling from NW to SE was going ahead other on the main carriageway. The vehicle wasnot at, or within 20M of a junction. The male driver aged 42 lived in ST14.
Casualty 1 (Vehicle 1) A male rider aged 42 suffered a serious injury.
Contributory Factors
Loss of controlVehicle 1
09001877 50ARoad: Grid Reference: 334660407980Acc. Ref. No:
01-March-2009Time: 0955
Fine without high winds
Dry
Daylight:street lights present
Road surface
Speed limit: 40
SLIGHT
District Council:
Severity:
Lighting: Weather:
SundayEast Staffordshire
Location: A50 WESTBOUND EXIT SLIP TO A522 NEW RD UTTOXETER
The accident occured at a slip road on the A50, a slip road at its junction with the A522 controlled by a give way or uncontrolled. There wasa central reservation within 50 metres..
Special conditions and hazards: None
Vehicle 1 Car, travelling from E to S was stopping on the main carriageway. The vehicle was leaving main road and skidded. The male driveraged 22 lived in ST14 had occasionally travelled through the site before.
Casualty 1 (Vehicle 1) A male vehicle or pillion passenger aged 21 suffered a slight injury.
Casualty 2 (Vehicle 1) A male driver aged 22 suffered a slight injury.
Contributory Factors
Junction overshootVehicle 1
Vehicle 1 Poor turn or manoevre
Vehicle 1 Sudden braking
Vehicle 1 Swerved
Vehicle 1 Loss of control
09002512 50ARoad: Grid Reference: 334480409970Acc. Ref. No:
03-March-2009Time: 0947
Unknown
Dry
Daylight: street lighting unknown
Road surface
Speed limit: 60
SLIGHT
District Council:
Severity:
Lighting: Weather:
TuesdayEast Staffordshire
Location: A50 J/W DERBY ROAD UTTOXETER
The accident occured at a roundabout on the A50, at its junction with the A518 controlled by a give way or uncontrolled..
Special conditions and hazards: None
Vehicle 1 Car, travelling from SW to E was turning right on the main carriageway. The vehicle was mid junction - on roundabout or main road andcollided with vehicle 2. The untraced driver of an unknown age .
Vehicle 2 Car, travelling from SW to E was turning right on the main carriageway. The vehicle was mid junction - on roundabout or main road andcollided with vehicle 1. The male driver aged 39 lived in NG9 had regularly travelled through the site before.
Casualty 1 (Vehicle 2) A male driver aged 39 suffered a slight injury.
Contributory Factors
Failed to look properlyVehicle 1
Vehicle 1 Careless/Reckless/In a hurry
20Registered to: Staffordshire County Council

FULL LISTING Run on:07/ 04/2011
AccsMap - Accident Analysis System
(60) months
Notes:Selection:
andAccidents between dates 31/12/201001/01/2006
Selected using Manual Selection
09002733 50ARoad: Grid Reference: 334700408360Acc. Ref. No:
31-March-2009Time: 0747
Fine without high winds
Dry
Daylight:street lights present
Road surface
Speed limit: 40
SLIGHT
District Council:
Severity:
Lighting: Weather:
TuesdayEast Staffordshire
Location: A50 E/B APPROX 300MTS WEST OF ASHBOURNE ROAD UTTOXETER
The accident occured on the A50, a dual carriageway .
Special conditions and hazards: None
Vehicle 1 Car, travelling from W to E was going ahead other on the main carriageway. The vehicle was not at, or within 20M of a junction andcollided with vehicle 2. The female driver aged 49 lived in M33 .
Vehicle 2 Goods 7.5 tonnes mgw and over, travelling from W to E was going ahead other on the main carriageway. The vehicle was not at, orwithin 20M of a junction and collided with vehicle 1. The male driver aged 35 lived in NG31.
Casualty 1 (Vehicle 1) A female driver aged 49 suffered a slight injury.
Contributory Factors
Failed to look properlyVehicle 1
Vehicle 1 Distraction in vehicle
Vehicle 1 Dazzling sun
09005050 518ARoad: Grid Reference: 335160408740Acc. Ref. No:
02-May-2009Time: 1230
Fine without high winds
Wet/Damp
Daylight:street lights present
Road surface
Speed limit: 30
SLIGHT
District Council:
Severity:
Lighting: Weather:
SaturdayEast Staffordshire
Location: ASHBOURNE RD R/B J/W UTTOXETER RD UTTOXETER
The accident occured at a roundabout on the A518, at its junction with the B5030 controlled by a give way or uncontrolled..
Special conditions and hazards: None
Vehicle 1 Motorcycle over 500cc, travelling from SW to NE was going ahead other on the main carriageway. The vehicle was mid junction - onroundabout or main road and skidded. The male driver of an unknown age lived in WS2 .
Casualty 1 (Vehicle 1) A male rider age unknown suffered a slight injury.
Contributory Factors
Loss of controlVehicle 1
09003888 518ARoad: Grid Reference: 333840409530Acc. Ref. No:
13-May-2009Time: 1620
Fine without high winds
Dry
Daylight: street lighting unknown
Road surface
Speed limit: 30
SLIGHT
District Council:
Severity:
Lighting: Weather:
WednesdayEast Staffordshire
Location: DERBY RD APPROX 20MTS EAST R/B J/W THE DOVE WAY UTTOXETER
The accident occured at a roundabout on the A518, a single carriageway at its junction with the A518 controlled by a give way oruncontrolled..
Special conditions and hazards: None
Vehicle 1 Car, travelling from NE to S was going ahead other on the main carriageway. The vehicle was approaching junction or waiting/parked atjunction approach and skidded and collided with vehicle 2. The female driver aged 27 lived in SY1 .
Vehicle 2 Motor Cycle over 125 cc and up to 500cc, travelling from NE to S was waiting to turn left on the main carriageway. The vehicle wasapproaching junction or waiting/parked at junction approach and collided with vehicle 1. The female driver aged 36 lived in ST14 had regularly travelled through the site before.
Casualty 1 (Vehicle 2) A female rider aged 36 suffered a slight injury.
Contributory Factors
Inexperience with type of vehicleVehicle 1
Vehicle 1 Loss of control
21Registered to: Staffordshire County Council

FULL LISTING Run on:07/ 04/2011
AccsMap - Accident Analysis System
(60) months
Notes:Selection:
andAccidents between dates 31/12/201001/01/2006
Selected using Manual Selection
09004075 522ARoad: Grid Reference: 334180408840Acc. Ref. No:
22-May-2009Time: 1545
Raining without high winds
Wet/Damp
Daylight:street lights present
Road surface
Speed limit: 30
SLIGHT
District Council:
Severity:
Lighting: Weather:
FridayEast Staffordshire
Location: CHEADLE RD.NR.FIRE STATION UTTOXETER.
The accident occured on the A522, a single carriageway .
Special conditions and hazards: Road works
Vehicle 1 Car, travelling from SE to NW was going ahead other on the main carriageway. The vehicle was not at, or within 20M of a junction andskidded and collided with vehicle 2. The male driver aged 27.
Vehicle 2 Car, travelling from SE to NW was going ahead but held up on the main carriageway. The vehicle was not at, or within 20M of ajunction and collided with vehicle 1. The male driver aged 38 lived in DE14 had not travelled through the site before.
Casualty 1 (Vehicle 2) A male driver aged 38 suffered a slight injury.
Casualty 2 (Vehicle 2) A male vehicle or pillion passenger aged 28 suffered a slight injury.
Contributory Factors
Following too closeVehicle 1
Vehicle 1 Failed to look properly
Vehicle 1 Careless/Reckless/In a hurry
09005023 50ARoad: Grid Reference: 334720408910Acc. Ref. No:
24-June-2009Time: 1000
Fine without high winds
Dry
Daylight:street lights present
Road surface
Speed limit: 70
SLIGHT
District Council:
Severity:
Lighting: Weather:
WednesdayEast Staffordshire
Location: A50 W/B AT MARKER POST 113/2 UTTOXETER
The accident occured on the A50, a dual carriageway .
Special conditions and hazards: None
Vehicle 1 Car, travelling from E to W was stopping on the main carriageway. The vehicle was not at, or within 20M of a junction and skidded andcollided with vehicle 2. The female driver aged 21 lived in ST14.
Vehicle 2 Car, travelling from E to W was stopping on the main carriageway. The vehicle was not at, or within 20M of a junction and collided withvehicle 1. The male driver aged 46 lived in PE10.
Vehicle 3 Car, travelling from E to W was stopping on the main carriageway. The vehicle was not at, or within 20M of a junction and collided withvehicle 2. The female driver aged 27 lived in NG4 .
Casualty 1 (Vehicle 1) A female driver aged 21 suffered a slight injury.
Casualty 2 (Vehicle 1) A female vehicle or pillion passenger aged 1 suffered a slight injury.
Casualty 3 (Vehicle 3) A female vehicle or pillion passenger aged 27 suffered a slight injury.
Contributory Factors
Failed to look properlyVehicle 1
Vehicle 1 Careless/Reckless/In a hurry
09005218 518ARoad: Grid Reference: 334240409400Acc. Ref. No:
02-July-2009Time: 1610
Fine without high winds
Dry
Daylight: no street lighting
Road surface
Speed limit: 60
FATAL
District Council:
Severity:
Lighting: Weather:
ThursdayEast Staffordshire
Location: THE DOVE WAY APPROX 400MTS NORTH OF DERBY ROAD UTTOXETER
The accident occured on the A518, a single carriageway .
Special conditions and hazards: None
Vehicle 1 Motorcycle over 500cc, travelling from SE to NW was overtaking on the nearside on the main carriageway. The vehicle was not at, orwithin 20M of a junction and skidded. The male driver aged 20 lived in ST3 .
Vehicle 2 Car, travelling from SE to NW was going ahead other on the main carriageway. The vehicle was not at, or within 20M of a junction. Themale driver aged 65 lived in ST14.
Vehicle 3 Car, travelling from SE to NW was going ahead other on the main carriageway. The vehicle was not at, or within 20M of a junction. Themale driver aged 65 lived in DE6 .
Vehicle 4 Car, travelling from NW to SE was going ahead other on the main carriageway. The vehicle was not at, or within 20M of a junction. Themale driver aged 42 had occasionally travelled through the site before.
Casualty 1 (Vehicle 1) A male rider aged 20 suffered a fatal injury.
Contributory Factors
Careless/Reckless/In a hurryVehicle 1
Vehicle 1 Inexperienced or learner driver/rider
22Registered to: Staffordshire County Council

FULL LISTING Run on:07/ 04/2011
AccsMap - Accident Analysis System
(60) months
Notes:Selection:
andAccidents between dates 31/12/201001/01/2006
Selected using Manual Selection
09005352 518ARoad: Grid Reference: 334760408690Acc. Ref. No:
09-July-2009Time: 0910
Fine without high winds
Dry
Daylight:street lights present
Road surface
Speed limit: 60
SLIGHT
District Council:
Severity:
Lighting: Weather:
ThursdayEast Staffordshire
Location: ASHBOURNE RD.J/W A50 UTTOXETER.
The accident occured at a roundabout on the A518, a single carriageway at its junction with the A50 controlled by a give way oruncontrolled..
Special conditions and hazards: None
Vehicle 1 Car, travelling from N to S was going ahead other on the main carriageway. The vehicle was approaching junction or waiting/parked atjunction approach and collided with vehicle 2. The male driver aged 39 lived in DE74.
Vehicle 2 Car, travelling from N to W was waiting to turn right on the main carriageway. The vehicle was approaching junction or waiting/parked atjunction approach and collided with vehicle 1. The female driver aged 18 lived in ST14 had regularly travelled through the site before.
Casualty 1 (Vehicle 1) A male vehicle or pillion passenger aged 17 suffered a slight injury.
Contributory Factors
Following too closeVehicle 1
Vehicle 1 Failed to judge other persons path or speed
09005507 522ARoad: Grid Reference: 333680409370Acc. Ref. No:
13-July-2009Time: 0750
Fine without high winds
Dry
Daylight:street lights present
Road surface
Speed limit: 30
SLIGHT
District Council:
Severity:
Lighting: Weather:
MondayEast Staffordshire
Location: DOVE BANK UTTOXETER J/W ENT. TO THOMAS ALLEYNE HIGH SCHOOL.
The accident occured at a private drive on the A522, a single carriageway at its junction with the Unclassified0 controlled by a give way oruncontrolled..
Special conditions and hazards: None
Vehicle 1 Car, travelling from NE to NW was turning right on the main carriageway. The vehicle was leaving main road and collided with vehicle2. The female driver aged 38 lived in ST14 had regularly travelled through the site before.
Vehicle 2 Pedal Cycle, travelling from W to NE was going ahead other on the main carriageway. The vehicle was mid junction - on roundabout ormain road and collided with vehicle 1. The male driver aged 30.
Casualty 1 (Vehicle 2) A male rider aged 30 suffered a slight injury.
Contributory Factors
Failed to look properlyVehicle 1
Vehicle 2 Failed to look properly
Vehicle 1 Careless/Reckless/In a hurry
Vehicle 2 Careless/Reckless/In a hurry
09005802 518ARoad: Grid Reference: 334810408680Acc. Ref. No:
26-July-2009Time: 1445
Fine without high winds
Wet/Damp
Daylight:street lights present
Road surface
Speed limit: 40
SLIGHT
District Council:
Severity:
Lighting: Weather:
SundayEast Staffordshire
Location: ASHBORNE ROAD APPROX 50MTS NORTH OF A50 SPATH UTTOXETER
The accident occured at a private drive on the A518, a single carriageway at its junction with the Unclassified0 controlled by a give way oruncontrolled..
Special conditions and hazards: None
Vehicle 1 Car, travelling from S to N was stopping on the main carriageway. The vehicle was approaching junction or waiting/parked at junctionapproach and collided with vehicle 2. The male driver aged 18 lived in ST14 had regularly travelled through the site before.
Vehicle 2 Car, travelling from S to S was performing a U-turn on the main carriageway. The vehicle was approaching junction or waiting/parked atjunction approach and collided with vehicle 1. The male driver aged 26 lived in L1 .
Casualty 1 (Vehicle 2) A male driver aged 26 suffered a slight injury.
Contributory Factors
Failed to look properlyVehicle 1
Vehicle 2 Poor turn or manoevre
23Registered to: Staffordshire County Council

FULL LISTING Run on:07/ 04/2011
AccsMap - Accident Analysis System
(60) months
Notes:Selection:
andAccidents between dates 31/12/201001/01/2006
Selected using Manual Selection
09006286 522ARoad: Grid Reference: 334550408040Acc. Ref. No:
16-August-2009Time: 1045
Fine without high winds
Dry
Daylight:street lights present
Road surface
Speed limit: 30
SLIGHT
District Council:
Severity:
Lighting: Weather:
SundayEast Staffordshire
Location: NEW ROAD O/S ENT TO SHELL FILLING STATION UTTOXETER
The accident occured at a private drive on the A522, a single carriageway at its junction with the Unclassified0 controlled by a give way oruncontrolled..
Special conditions and hazards: None
Vehicle 1 Car, travelling from N to NW was turning right on the main carriageway. The vehicle was entering main road and collided with vehicle 2.The male driver aged 22 lived in ST14 had regularly travelled through the site before.
Vehicle 2 Motorcycle over 500cc, travelling from SE to NW was going ahead other on the main carriageway. The vehicle was mid junction - onroundabout or main road and collided with vehicle 1. The male driver aged 45 lived in ST4 had occasionally travelled through the site before.
Casualty 1 (Vehicle 2) A female vehicle or pillion passenger aged 28 suffered a slight injury.
Casualty 2 (Vehicle 2) A male rider aged 45 suffered a slight injury.
Contributory Factors
Failed to look properlyVehicle 1
Vehicle 1 Failed to judge other persons path or speed
09007303 50ARoad: Grid Reference: 334430410020Acc. Ref. No:
28-September-2009Time: 0915
Fine without high winds
Dry
Daylight:street lights present
Road surface
Speed limit: 70
SLIGHT
District Council:
Severity:
Lighting: Weather:
MondayEast Staffordshire
Location: A50 R/B AT DERBY RD.UTTOXETER J/W A50 BYPASS.
The accident occured at a roundabout on the A50, a dual carriageway at its junction with the A50 controlled by a give way or uncontrolled.There was a central reservation within 50 metres..
Special conditions and hazards: None
Vehicle 1 Car, travelling from E to SW was turning left on the main carriageway. The vehicle was leaving roundabout and collided with vehicle 2.The male driver aged 52 lived in LE4 had regularly travelled through the site before.
Vehicle 2 Goods 7.5 tonnes mgw and over, travelling from E to NW was going ahead other on the main carriageway. The vehicle was midjunction - on roundabout or main road and collided with vehicle 1. The male driver aged 36 lived in DE12 had regularly travelled through the site before.
Casualty 1 (Vehicle 1) A male vehicle or pillion passenger age unknown suffered a slight injury.
Contributory Factors
Poor turn or manoevreVehicle 1
Vehicle 1 Failed to signal/Misleading signal
Vehicle 1 Failed to judge other persons path or speed
Vehicle 1 Careless/Reckless/In a hurry
09008002 50ARoad: Grid Reference: 334460410020Acc. Ref. No:
07-October-2009Time: 1430
Fine without high winds
Dry
Darkness: street lights present but unlit
Road surface
Speed limit: 60
SLIGHT
District Council:
Severity:
Lighting: Weather:
WednesdayEast Staffordshire
Location: A50 BYPASS R/B J/W DERBY RD. UTTOXETER.
The accident occured at a roundabout on the A50, at its junction with the A518 controlled by a give way or uncontrolled..
Special conditions and hazards: None
Vehicle 1 Car, travelling from NW to E was going ahead on a left bend on the main carriageway. The vehicle was leaving roundabout and collidedwith vehicle 2. The male driver aged 48 lived in M28 .
Vehicle 2 Other motor vehicle, travelling from NW to E was going ahead on a left bend on the main carriageway. The vehicle was leavingroundabout and collided with vehicle 1. The male driver of an unknown age lived in LE15.
Casualty 1 (Vehicle 1) A male driver aged 48 suffered a slight injury.
24Registered to: Staffordshire County Council

FULL LISTING Run on:07/ 04/2011
AccsMap - Accident Analysis System
(60) months
Notes:Selection:
andAccidents between dates 31/12/201001/01/2006
Selected using Manual Selection
09009287 518ARoad: Grid Reference: 334760408690Acc. Ref. No:
09-December-2009Time: 0820
Fine without high winds
Frost/Ice
Daylight:street lights present
Road surface
Speed limit: 40
SLIGHT
District Council:
Severity:
Lighting: Weather:
WednesdayEast Staffordshire
Location: ASHBOURNE ROAD J/W A50 UTTOXETER
The accident occured at a roundabout on the A518, a single carriageway at its junction with the A50 controlled by a give way oruncontrolled. There was a pelican/puffin/toucan within 50 metres..
Special conditions and hazards: None
Vehicle 1 Car, travelling from N to S was starting on the main carriageway. The vehicle was approaching junction or waiting/parked at junctionapproach and collided with vehicle 2. The male driver aged 21 lived in ST14 had regularly travelled through the site before.
Vehicle 2 Car, travelling from N to S was stopping on the main carriageway. The vehicle was approaching junction or waiting/parked at junctionapproach and collided with vehicle 1. The male driver aged 32 lived in DE6 had regularly travelled through the site before.
Casualty 1 (Vehicle 2) A male driver aged 32 suffered a slight injury.
Contributory Factors
Junction restartVehicle 2
Vehicle 1 Junction restart
Vehicle 1 Failed to look properly
10000876 5030BRoad: Grid Reference: 334330408720Acc. Ref. No:
03-February-2010Time: 0645
Fine without high winds
Frost/Ice
Darkness: street lights present and lit
Road surface
Speed limit: 30
SLIGHT
District Council:
Severity:
Lighting: Weather:
WednesdayEast Staffordshire
Location: ASHBOURNE ROAD J/W CHEADLE ROAD UTTOXETER
The accident occured at a roundabout on the B5030, a single carriageway at its junction with the A522 controlled by a give way oruncontrolled. There was a pelican/puffin/toucan within 50 metres..
Special conditions and hazards: None
Vehicle 1 Car, travelling from NW to SE was going ahead other on the main carriageway. The vehicle was entering roundabout and collided withvehicle 2. The male driver aged 46 lived in ST14 had regularly travelled through the site before.
Vehicle 2 Pedal Cycle, travelling from NW to SE was turning right on the main carriageway. The vehicle was mid junction - on roundabout or mainroad and collided with vehicle 1. The female driver aged 70 lived in ST14 had regularly travelled through the site before.
Casualty 1 (Vehicle 2) A female rider aged 70 suffered a slight injury.
Contributory Factors
Failed to look properlyVehicle 1
10001217 50ARoad: Grid Reference: 334730408630Acc. Ref. No:
16-February-2010Time: 2140
Fine without high winds
Frost/Ice
Darkness: street lights present and lit
Road surface
Speed limit: 70
SLIGHT
District Council:
Severity:
Lighting: Weather:
TuesdayEast Staffordshire
Location: A50 E/B APPROX 25MTS W OF ASHBOURNE ROAD UTTOXETER
The accident occured on the A50, a dual carriageway .
Special conditions and hazards: None
Vehicle 1 Goods 3.5 tonnes mgw and under, travelling from W to E was going ahead other on the main carriageway. The vehicle was not at, orwithin 20M of a junction and skidded and collided with vehicle 2. The female driver aged 44 lived in ST10 had regularly travelled through the site before.
Vehicle 2 Car, travelling from W to E was going ahead but held up on the main carriageway. The vehicle was not at, or within 20M of a junctionand collided with vehicle 1. The male driver aged 52 lived in ST10 had regularly travelled through the site before.
Casualty 1 (Vehicle 2) A male driver aged 52 suffered a slight injury.
Contributory Factors
Failed to look properlyVehicle 1
25Registered to: Staffordshire County Council

FULL LISTING Run on:07/ 04/2011
AccsMap - Accident Analysis System
(60) months
Notes:Selection:
andAccidents between dates 31/12/201001/01/2006
Selected using Manual Selection
10001198 50ARoad: Grid Reference: 334660408140Acc. Ref. No:
16-February-2010Time: 2114
Fine without high winds
Dry
Darkness: street lights present and lit
Road surface
Speed limit: 70
SERIOUS
District Council:
Severity:
Lighting: Weather:
TuesdayEast Staffordshire
Location: A50 WESTBOUND UTTOXETER APPROX 160MTS EAST NEW RD R'BT EXIT
The accident occured on the A50, a dual carriageway .
Special conditions and hazards: None
Vehicle 1 Car, travelling from E to W was going ahead other on the main carriageway. The vehicle was not at, or within 20M of a junction andcollided with vehicle 2. The male driver aged 50 lived in ST3 .
Vehicle 2 Goods over 3.5 tonnes and under 7.5 tonnes mgw, on the main carriageway. The vehicle was not at, or within 20M of a junction andcollided with vehicle 1. The female driver aged 31 lived in ST6 .
Vehicle 3 Car, travelling from E to W was overtaking a static vehicle on the offside on the main carriageway. The vehicle was not at, or within20M of a junction and collided with vehicle 1. The male driver aged 36 lived in ST3 .
Casualty 1 (Vehicle 1) A male driver aged 50 suffered a serious injury.
Contributory Factors
Animal or object in carriagewayVehicle 1
Vehicle 1 Failed to look properly
10001949 DRoad: Grid Reference: 333650409340Acc. Ref. No:
09-March-2010Time: 1355
Fine without high winds
Dry
Daylight:street lights present
Road surface
Speed limit: 30
SLIGHT
District Council:
Severity:
Lighting: Weather:
TuesdayEast Staffordshire
Location: BACK LANE UTTOXETER BETWEEN SILVER ST AND CHURCH ST
The accident occured on an unclassified road, .
Special conditions and hazards: None
Vehicle 1 Car, travelling from SW to NE was overtaking a static vehicle on the offside on the main carriageway. The vehicle was not at, or within20M of a junction. The female driver aged 18 lived in ST10 had regularly travelled through the site before.
Casualty 1 (Vehicle 1) A male pedestrian aged 17 suffered a slight injury9.
Contributory Factors
Failed to look properlyCasualty 1
Vehicle 1 Inexperienced or learner driver/rider
10001885 50ARoad: Grid Reference: 334440409950Acc. Ref. No:
21-March-2010Time: 0950
Fine without high winds
Dry
Daylight:street lights present
Road surface
Speed limit: 70
SLIGHT
District Council:
Severity:
Lighting: Weather:
SundayEast Staffordshire
Location: A50 W/B J/W DERBY ROAD UTTOXETER
The accident occured at a roundabout on the A50, a dual carriageway at its junction with the A518 controlled by a give way oruncontrolled..
Special conditions and hazards: None
Vehicle 1 Car, travelling from SW to E was turning right on the main carriageway. The vehicle was entering roundabout. The female driver aged40.
Vehicle 2 Motorcycle over 500cc, travelling from E to NW was going ahead on a right bend on the main carriageway. The vehicle was leavingroundabout. The female driver aged 44 lived in DE65.
Casualty 1 (Vehicle 2) A female rider aged 44 suffered a slight injury.
Contributory Factors
Failed to look properlyVehicle 2
Vehicle 2 Failed to judge other persons path or speed
Vehicle 2 Loss of control
Vehicle 1 Failed to look properly
Vehicle 1 Failed to judge other persons path or speed
26Registered to: Staffordshire County Council

FULL LISTING Run on:07/ 04/2011
AccsMap - Accident Analysis System
(60) months
Notes:Selection:
andAccidents between dates 31/12/201001/01/2006
Selected using Manual Selection
10002238 522ARoad: Grid Reference: 333990409010Acc. Ref. No:
03-April-2010Time: 1635
Fine without high winds
Dry
Daylight:street lights present
Road surface
Speed limit: 30
SLIGHT
District Council:
Severity:
Lighting: Weather:
SaturdayEast Staffordshire
Location: CHEADLE RD UTTOXETER O/S NUMBER 20
The accident occured on the A522, a single carriageway .
Special conditions and hazards: None
Vehicle 1 Car, travelling from NW to SE was going ahead on a left bend on the main carriageway. The vehicle was not at, or within 20M of ajunction and skidded and collided with vehicle 2. The male driver aged 21 lived in ST14 had regularly travelled through the site before.
Vehicle 2 Car, travelling from NW to SE on the main carriageway. The vehicle was not at, or within 20M of a junction and collided with vehicle 1.The female driver aged 68 lived in DE13 had occasionally travelled through the site before.
Casualty 1 (Vehicle 1) A male driver aged 21 suffered a slight injury.
Contributory Factors
Exceeding speed limitVehicle 1
Vehicle 1 Loss of control
Vehicle 1 Sudden braking
Vehicle 1 Careless/Reckless/In a hurry
10002651 522ARoad: Grid Reference: 333650409120Acc. Ref. No:
21-April-2010Time: 1600
Fine without high winds
Dry
Daylight:street lights present
Road surface
Speed limit: 30
SLIGHT
District Council:
Severity:
Lighting: Weather:
WednesdayEast Staffordshire
Location: HIIGH ST J/W BRADLEY ST UTTOXETER
The accident occured at a T or staggered junction on the A522, a single carriageway at its junction with the Unclassified530 controlled by agive way or uncontrolled. There was a pelican/puffin/toucan within 50 metres..
Special conditions and hazards: None
Vehicle 1 Car, travelling from SE to NW was going ahead other on the main carriageway. The vehicle was mid junction - on roundabout or mainroad and collided with vehicle 2. The male driver aged 29 lived in PN7 .
Vehicle 2 Car, travelling from SE to NW was going ahead but held up on the main carriageway. The vehicle was mid junction - on roundabout ormain road and collided with vehicle 1. The male driver aged 64 lived in ST10 had regularly travelled through the site before.
Casualty 1 (Vehicle 2) A male driver aged 64 suffered a slight injury.
Contributory Factors
Following too closeVehicle 1
Vehicle 1 Travelling too fast for conditions
10003051 530DRoad: Grid Reference: 333620409130Acc. Ref. No:
08-May-2010Time: 1640
Fine without high winds
Dry
Daylight:street lights present
Road surface
Speed limit: 30
SLIGHT
District Council:
Severity:
Lighting: Weather:
SaturdayEast Staffordshire
Location: HIGH ST UTTOXETER APPROX 10 MTRS STH J/W SMITHFIELD RD
The accident occured at a T or staggered junction on the D530, at its junction with the C351 controlled by a give way or uncontrolled..
Special conditions and hazards: None
Vehicle 1 Motor Cycle over 50 cc and up to 125cc, travelling from NW to SE was going ahead other on the main carriageway. The vehicle clearedjunction or waiting/parked at junction exit. The male driver aged 22 lived in ST14 had regularly travelled through the site before.
Casualty 1 (Vehicle 1) A male rider aged 22 suffered a slight injury.
Contributory Factors
Failed to look properlyVehicle 1
27Registered to: Staffordshire County Council

FULL LISTING Run on:07/ 04/2011
AccsMap - Accident Analysis System
(60) months
Notes:Selection:
andAccidents between dates 31/12/201001/01/2006
Selected using Manual Selection
10003013 50ARoad: Grid Reference: 334660407930Acc. Ref. No:
10-May-2010Time: 1640
Fine without high winds
Dry
Daylight:street lights present
Road surface
Speed limit: 40
SLIGHT
District Council:
Severity:
Lighting: Weather:
MondayEast Staffordshire
Location: A50 W/B ENT.SLIP TO A50 FROM R/B JN.A522 CHEADLE RD. UTTOXETER.
The accident occured at a T or staggered junction on the A50, a slip road at its junction with the A50 controlled by a give way oruncontrolled..
Special conditions and hazards: None
Vehicle 1 Car, travelling from SE to W was going ahead other on the main carriageway. The vehicle was approaching junction or waiting/parkedat junction approach and collided with vehicle 2. The female driver aged 44 lived in ST3 had regularly travelled through the site before.
Vehicle 2 Car, travelling from SE to W was going ahead but held up on the main carriageway. The vehicle was approaching junction orwaiting/parked at junction approach and collided with vehicle 1. The male driver aged 53 lived in ST5 had regularly travelled through the site before.
Casualty 1 (Vehicle 2) A male driver aged 53 suffered a slight injury.
Contributory Factors
Failed to judge other persons path or speedVehicle 1
Vehicle 1 Failed to look properly
10004217 544DRoad: Grid Reference: 334430408983Acc. Ref. No:
01-July-2010Time: 1650
Fine without high winds
Dry
Daylight:street lights present
Road surface
Speed limit: 30
SLIGHT
District Council:
Severity:
Lighting: Weather:
ThursdayEast Staffordshire
Location: PARK ST.NEAR NO.123 UTTOXETER.
The accident occured on the D544, a single carriageway .
Special conditions and hazards: None
Vehicle 1 Pedal Cycle, travelling from NW to SE was going ahead other on the main carriageway. The vehicle was not at, or within 20M of ajunction and collided with vehicle 2. The male driver aged 13 lived in ST14 had occasionally travelled through the site before.
Vehicle 2 Car, travelling from NW to SE was overtaking a moving vehicle on the offside on the main carriageway. The vehicle was not at, orwithin 20M of a junction and collided with vehicle 1. The male driver aged 22 lived in ST10 had occasionally travelled through the site before.
Casualty 1 (Vehicle 1) A male rider aged 13 suffered a slight injury.
Contributory Factors
SwervedVehicle 1
Vehicle 1 Failed to signal/Misleading signal
Vehicle 1 Failed to look properly
10004729 50ARoad: Grid Reference: 334658408137Acc. Ref. No:
23-July-2010Time: 2125
Fine without high winds
Dry
Darkness: street lights present and lit
Road surface
Speed limit: 70
SLIGHT
District Council:
Severity:
Lighting: Weather:
FridayEast Staffordshire
Location: A50 W/BOUND UTTOXETER J/W A50 SLIP 150 MTRS EAST OF A522 R'BOUT
The accident occured at a slip road on the A50, a dual carriageway at its junction with the A50 controlled by a give way or uncontrolled..
Special conditions and hazards: Other object in carriageway
Vehicle 1 Goods 7.5 tonnes mgw and over, travelling from E to W was going ahead other on the main carriageway. The vehicle was mid junction- on roundabout or main road and collided with vehicle 2. The male driver aged 25 lived in TF9 had regularly travelled through the site before.
Vehicle 2 Goods 7.5 tonnes mgw and over, travelling from E to W was going ahead but held up on the main carriageway. The vehicle was midjunction - on roundabout or main road and collided with vehicle 1. The male driver aged 73 lived in WA1 had regularly travelled through the site before.
Casualty 1 (Vehicle 1) A male driver aged 25 suffered a slight injury.
Contributory Factors
Failed to look properlyVehicle 1
Vehicle 1 Stationary or parked vehicle
Vehicle 2 Other
28Registered to: Staffordshire County Council

FULL LISTING Run on:07/ 04/2011
AccsMap - Accident Analysis System
(60) months
Notes:Selection:
andAccidents between dates 31/12/201001/01/2006
Selected using Manual Selection
10004947 518ARoad: Grid Reference: 334761408693Acc. Ref. No:
01-August-2010Time: 2000
Fine without high winds
Dry
Daylight: street lighting unknown
Road surface
Speed limit: 40
SLIGHT
District Council:
Severity:
Lighting: Weather:
SundayEast Staffordshire
Location: ASHBOURNE RD APPROX 5MTS N'TH J/W UTTOXETER BY PASS
The accident occured at a roundabout on the A518, a single carriageway at its junction with the A50 controlled by a give way oruncontrolled..
Special conditions and hazards: None
Vehicle 1 Car, travelling from N to S was starting on the main carriageway. The vehicle was approaching junction or waiting/parked at junctionapproach and collided with vehicle 2. The female driver of an unknown age lived in CV10.
Vehicle 2 Car, travelling from N to E was going ahead but held up on the main carriageway. The vehicle was approaching junction orwaiting/parked at junction approach and collided with vehicle 1. The female driver aged 21 lived in IP32.
Casualty 1 (Vehicle 2) A female driver aged 21 suffered a slight injury.
Casualty 2 (Vehicle 2) A male vehicle or pillion passenger aged 26 suffered a slight injury.
Contributory Factors
Failed to look properlyVehicle 1
Vehicle 1 Failed to judge other persons path or speed
10005376 522ARoad: Grid Reference: 334664407932Acc. Ref. No:
22-August-2010Time: 1445
Fine without high winds
Dry
Daylight:street lights present
Road surface
Speed limit: 60
SLIGHT
District Council:
Severity:
Lighting: Weather:
SundayEast Staffordshire
Location: A522 UTTOXETER 5 MTRS S/E OF J/W W/B A50 SLIPROAD
The accident occured at a T or staggered junction on the A522, a slip road at its junction with the A50 controlled by a give way oruncontrolled..
Special conditions and hazards: None
Vehicle 1 Car, travelling from SE to W was going ahead other on the main carriageway. The vehicle was approaching junction or waiting/parkedat junction approach and collided with vehicle 2. The male driver of an unknown age lived in ST10.
Vehicle 2 Car, travelling from SE to W was waiting to turn left on the main carriageway. The vehicle was approaching junction or waiting/parked atjunction approach and collided with vehicle 1. The male driver aged 42 lived in ST10 had occasionally travelled through the site before.
Casualty 1 (Vehicle 2) A female vehicle or pillion passenger aged 39 suffered a slight injury.
Casualty 2 (Vehicle 2) A male vehicle or pillion passenger aged 9 suffered a slight injury.
Casualty 3 (Vehicle 2) A female vehicle or pillion passenger aged 7 suffered a slight injury.
Casualty 4 (Vehicle 2) A male driver aged 42 suffered a slight injury.
10005580 50ARoad: Grid Reference: 334732408643Acc. Ref. No:
23-August-2010Time: 1729
Raining without high winds
Wet/Damp
Daylight: no street lighting
Road surface
Speed limit: 70
SLIGHT
District Council:
Severity:
Lighting: Weather:
MondayEast Staffordshire
Location: A50 EASTBOUND WITHIN 20MTS R'BT J/W ASHBOURNE RD UTTOXETER
The accident occured at a roundabout on the A50, a dual carriageway at its junction with the A518 controlled by a give way oruncontrolled..
Special conditions and hazards: None
Vehicle 1 Car, travelling from W to E was stopping on the main carriageway. The vehicle was approaching junction or waiting/parked at junctionapproach and collided with vehicle 2. The male driver of an unknown age lived in DE23.
Vehicle 2 Goods 3.5 tonnes mgw and under, travelling from W to E was stopping on the main carriageway. The vehicle was approaching junctionor waiting/parked at junction approach and collided with vehicle 1. The male driver aged 29 lived in NG4 .
Casualty 1 (Vehicle 2) A male driver aged 29 suffered a slight injury.
Contributory Factors
Failed to judge other persons path or speedVehicle 1
29Registered to: Staffordshire County Council

FULL LISTING Run on:07/ 04/2011
AccsMap - Accident Analysis System
(60) months
Notes:Selection:
andAccidents between dates 31/12/201001/01/2006
Selected using Manual Selection
10006508 50ARoad: Grid Reference: 334750408702Acc. Ref. No:
24-October-2010Time: 0135
Fine without high winds
Dry
Darkness: street lights present and lit
Road surface
Speed limit: 40
SLIGHT
District Council:
Severity:
Lighting: Weather:
SundayEast Staffordshire
Location: A50 EASTBOUND R'BT J/W ASHBOURNE RD UTTOXETER
The accident occured at a roundabout on the A50, at its junction with the A518 controlled by a give way or uncontrolled..
Special conditions and hazards: None
Vehicle 1 Car, travelling from W to E was going ahead other on the main carriageway. The vehicle was mid junction - on roundabout or mainroad. The male driver aged 27 lived in LE2 .
Casualty 1 (Vehicle 1) A male driver aged 27 suffered a slight injury.
Contributory Factors
Impaired by alcoholVehicle 1
10006673 50ARoad: Grid Reference: 334736408653Acc. Ref. No:
28-October-2010Time: 1114
Fine without high winds
Dry
Daylight:street lights present
Road surface
Speed limit: 40
SLIGHT
District Council:
Severity:
Lighting: Weather:
ThursdayEast Staffordshire
Location: A50 UTTOXETER 5 MTRS WEST J/W ASHBOURNE RD R'BOUT
The accident occured at a roundabout on the A50, a dual carriageway at its junction with the A50 controlled by a give way or uncontrolled.There was a central reservation within 50 metres..
Special conditions and hazards: None
Vehicle 1 Goods 7.5 tonnes mgw and over, travelling from W to E was going ahead other on the main carriageway. The vehicle was approachingjunction or waiting/parked at junction approach and collided with vehicle 2. The male driver aged 36 had not travelled through the site before.
Vehicle 2 Car, travelling from W to E was going ahead but held up on the main carriageway. The vehicle was approaching junction orwaiting/parked at junction approach and collided with vehicle 1. The male driver aged 51 lived in GU17 had not travelled through the site before.
Casualty 1 (Vehicle 2) A female vehicle or pillion passenger aged 46 suffered a slight injury.
Casualty 2 (Vehicle 2) A male driver aged 51 suffered a slight injury.
Contributory Factors
Loss of controlVehicle 1
10007060 50ARoad: Grid Reference: 334734408652Acc. Ref. No:
14-November-2010Time: 0935
Fine without high winds
Wet/Damp
Daylight:street lights present
Road surface
Speed limit: 40
SLIGHT
District Council:
Severity:
Lighting: Weather:
SundayEast Staffordshire
Location: A50 E/B R/B J/W ASHBOURNE RD. UTTOXETER
The accident occured at a roundabout on the A50, at its junction with the A518 controlled by a give way or uncontrolled. There was apelican/puffin/toucan within 50 metres..
Special conditions and hazards: None
Vehicle 1 Car, travelling from W to E was stopping on the main carriageway. The vehicle was approaching junction or waiting/parked at junctionapproach and collided with vehicle 2. The female driver aged 53 lived in PR4 had regularly travelled through the site before.
Vehicle 2 Car, travelling from W to E was going ahead but held up on the main carriageway. The vehicle was approaching junction orwaiting/parked at junction approach and collided with vehicle 1. The female driver aged 30 lived in DE23 had occasionally travelled through the site before.
Casualty 1 (Vehicle 2) A female driver aged 30 suffered a slight injury.
Contributory Factors
Failed to judge other persons path or speedVehicle 1
30Registered to: Staffordshire County Council

APPENDIX L


APPENDIX M

-------------------------------------------------------------------------------- TRL TRL VIEWER 3.0 AC t:\M-EC Job Book\20111\capacity assessments\2021 + DEV Access AM.vao - Page 1 -------------------------------------------------------------------------------- ___________________ A R C A D Y 6 ___________________ ASSESSMENT OF ROUNDABOUT CAPACITY AND DELAY Analysis Program: Release 2.0 (MAR 2005) (c) Copyright TRL Limited, 2004 Adapted from ARCADY/3 which is Crown Copyright by permission of the controller of HMSO ______________________________________________________ For sales and distribution information, program advice and maintenance, contact: TRL Limited Tel: +44 (0) 1344 770018 Crowthorne House Fax: +44 (0) 1344 770864 Nine Mile Ride Email: [email protected] Wokingham, Berks. Web: www.trlsoftware.co.uk RG40 3GA,UK --------------------------------------------------------------------------------- THE USER OF THIS COMPUTER PROGRAM FOR THE SOLUTION OF AN ENGINEERING PROBLEM IS IN NO WAY RELIEVED OF THEIR RESPONSIBILITY FOR THE CORRECTNESS OF THE SOLUTION --------------------------------------------------------------------------------- Run with file:- "t:\M-EC Job Book\20111\capacity assessments\2021 + DEV Access AM.vai"(drive-on-the-left ) at 11:39:07 on Friday, 5 August 2011
FILE PROPERTIES *************** RUN TITLE: The Dove Way LOCATION: DATE: 06/07/2011 CLIENT: ENUMERATOR: trose [TIMROSE] JOB NUMBER: 20111 STATUS: DESCRIPTION:
INPUT DATA ********** ARM A - Eastern Access ARM B - A518 South ARM C - Western Access ARM D - A518 North
GEOMETRIC DATA -------------- ----------------------------------------------------------------------------------------------------------------------- I ARM I V (M) I E (M) I L (M) I R (M) I D (M) I PHI (DEG) I SLOPE I INTERCEPT (PCU/MIN) I ----------------------------------------------------------------------------------------------------------------------- I ARM A I 3.65 I 8.60 I 30.00 I 19.00 I 40.00 I 40.0 I 0.692 I 33.495 I I ARM B I 3.65 I 8.70 I 30.00 I 20.00 I 40.00 I 45.0 I 0.684 I 33.185 I I ARM C I 3.65 I 6.00 I 20.00 I 26.80 I 40.00 I 38.0 I 0.617 I 26.642 I I ARM D I 3.75 I 7.50 I 30.00 I 27.30 I 40.00 I 45.0 I 0.664 I 31.199 I ----------------------------------------------------------------------------------------------------------------------- V = approach half-width L = effective flare length D = inscribed circle diameter E = entry width R = entry radius PHI = entry angle
TRAFFIC DEMAND DATA ------------------- (Only sets included in the current run are shown)
----------------------- I ARM I FLOW SCALE(%) I ----------------------- I A I 100 I I B I 100 I I C I 100 I I D I 100 I -----------------------
TIME PERIOD BEGINS 07.45 AND ENDS 09.15
LENGTH OF TIME PERIOD - 90 MINUTES. LENGTH OF TIME SEGMENT - 15 MINUTES.
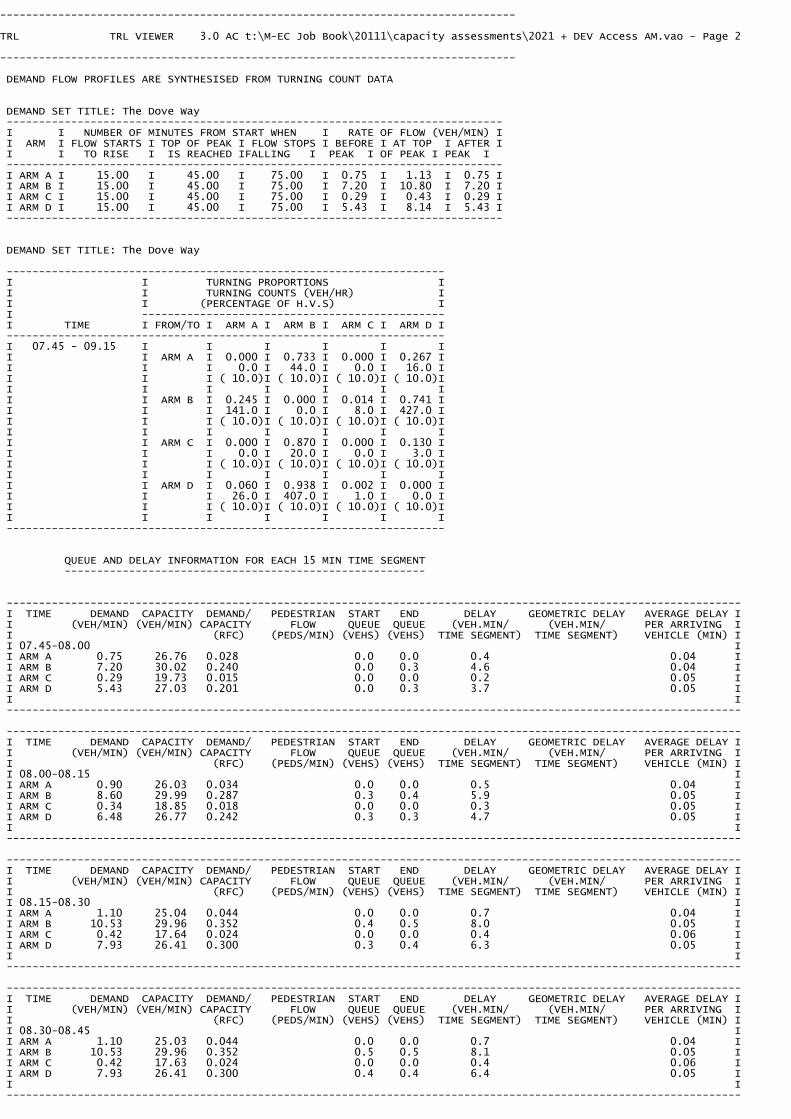
-------------------------------------------------------------------------------- TRL TRL VIEWER 3.0 AC t:\M-EC Job Book\20111\capacity assessments\2021 + DEV Access AM.vao - Page 2 -------------------------------------------------------------------------------- DEMAND FLOW PROFILES ARE SYNTHESISED FROM TURNING COUNT DATA DEMAND SET TITLE: The Dove Way ----------------------------------------------------------------------------- I I NUMBER OF MINUTES FROM START WHEN I RATE OF FLOW (VEH/MIN) I I ARM I FLOW STARTS I TOP OF PEAK I FLOW STOPS I BEFORE I AT TOP I AFTER I I I TO RISE I IS REACHED IFALLING I PEAK I OF PEAK I PEAK I ----------------------------------------------------------------------------- I ARM A I 15.00 I 45.00 I 75.00 I 0.75 I 1.13 I 0.75 I I ARM B I 15.00 I 45.00 I 75.00 I 7.20 I 10.80 I 7.20 I I ARM C I 15.00 I 45.00 I 75.00 I 0.29 I 0.43 I 0.29 I I ARM D I 15.00 I 45.00 I 75.00 I 5.43 I 8.14 I 5.43 I ----------------------------------------------------------------------------- DEMAND SET TITLE: The Dove Way
-------------------------------------------------------------------- I I TURNING PROPORTIONS I I I TURNING COUNTS (VEH/HR) I I I (PERCENTAGE OF H.V.S) I I ----------------------------------------------- I TIME I FROM/TO I ARM A I ARM B I ARM C I ARM D I -------------------------------------------------------------------- I 07.45 - 09.15 I I I I I I I I ARM A I 0.000 I 0.733 I 0.000 I 0.267 I I I I 0.0 I 44.0 I 0.0 I 16.0 I I I I ( 10.0)I ( 10.0)I ( 10.0)I ( 10.0)I I I I I I I I I I ARM B I 0.245 I 0.000 I 0.014 I 0.741 I I I I 141.0 I 0.0 I 8.0 I 427.0 I I I I ( 10.0)I ( 10.0)I ( 10.0)I ( 10.0)I I I I I I I I I I ARM C I 0.000 I 0.870 I 0.000 I 0.130 I I I I 0.0 I 20.0 I 0.0 I 3.0 I I I I ( 10.0)I ( 10.0)I ( 10.0)I ( 10.0)I I I I I I I I I I ARM D I 0.060 I 0.938 I 0.002 I 0.000 I I I I 26.0 I 407.0 I 1.0 I 0.0 I I I I ( 10.0)I ( 10.0)I ( 10.0)I ( 10.0)I I I I I I I I --------------------------------------------------------------------
QUEUE AND DELAY INFORMATION FOR EACH 15 MIN TIME SEGMENT --------------------------------------------------------
------------------------------------------------------------------------------------------------------------------ I TIME DEMAND CAPACITY DEMAND/ PEDESTRIAN START END DELAY GEOMETRIC DELAY AVERAGE DELAY I I (VEH/MIN) (VEH/MIN) CAPACITY FLOW QUEUE QUEUE (VEH.MIN/ (VEH.MIN/ PER ARRIVING I I (RFC) (PEDS/MIN) (VEHS) (VEHS) TIME SEGMENT) TIME SEGMENT) VEHICLE (MIN) I I 07.45-08.00 I I ARM A 0.75 26.76 0.028 0.0 0.0 0.4 0.04 I I ARM B 7.20 30.02 0.240 0.0 0.3 4.6 0.04 I I ARM C 0.29 19.73 0.015 0.0 0.0 0.2 0.05 I I ARM D 5.43 27.03 0.201 0.0 0.3 3.7 0.05 I I I ------------------------------------------------------------------------------------------------------------------
------------------------------------------------------------------------------------------------------------------ I TIME DEMAND CAPACITY DEMAND/ PEDESTRIAN START END DELAY GEOMETRIC DELAY AVERAGE DELAY I I (VEH/MIN) (VEH/MIN) CAPACITY FLOW QUEUE QUEUE (VEH.MIN/ (VEH.MIN/ PER ARRIVING I I (RFC) (PEDS/MIN) (VEHS) (VEHS) TIME SEGMENT) TIME SEGMENT) VEHICLE (MIN) I I 08.00-08.15 I I ARM A 0.90 26.03 0.034 0.0 0.0 0.5 0.04 I I ARM B 8.60 29.99 0.287 0.3 0.4 5.9 0.05 I I ARM C 0.34 18.85 0.018 0.0 0.0 0.3 0.05 I I ARM D 6.48 26.77 0.242 0.3 0.3 4.7 0.05 I I I ------------------------------------------------------------------------------------------------------------------
------------------------------------------------------------------------------------------------------------------ I TIME DEMAND CAPACITY DEMAND/ PEDESTRIAN START END DELAY GEOMETRIC DELAY AVERAGE DELAY I I (VEH/MIN) (VEH/MIN) CAPACITY FLOW QUEUE QUEUE (VEH.MIN/ (VEH.MIN/ PER ARRIVING I I (RFC) (PEDS/MIN) (VEHS) (VEHS) TIME SEGMENT) TIME SEGMENT) VEHICLE (MIN) I I 08.15-08.30 I I ARM A 1.10 25.04 0.044 0.0 0.0 0.7 0.04 I I ARM B 10.53 29.96 0.352 0.4 0.5 8.0 0.05 I I ARM C 0.42 17.64 0.024 0.0 0.0 0.4 0.06 I I ARM D 7.93 26.41 0.300 0.3 0.4 6.3 0.05 I I I ------------------------------------------------------------------------------------------------------------------
------------------------------------------------------------------------------------------------------------------ I TIME DEMAND CAPACITY DEMAND/ PEDESTRIAN START END DELAY GEOMETRIC DELAY AVERAGE DELAY I I (VEH/MIN) (VEH/MIN) CAPACITY FLOW QUEUE QUEUE (VEH.MIN/ (VEH.MIN/ PER ARRIVING I I (RFC) (PEDS/MIN) (VEHS) (VEHS) TIME SEGMENT) TIME SEGMENT) VEHICLE (MIN) I I 08.30-08.45 I I ARM A 1.10 25.03 0.044 0.0 0.0 0.7 0.04 I I ARM B 10.53 29.96 0.352 0.5 0.5 8.1 0.05 I I ARM C 0.42 17.63 0.024 0.0 0.0 0.4 0.06 I I ARM D 7.93 26.41 0.300 0.4 0.4 6.4 0.05 I I I ------------------------------------------------------------------------------------------------------------------

-------------------------------------------------------------------------------- TRL TRL VIEWER 3.0 AC t:\M-EC Job Book\20111\capacity assessments\2021 + DEV Access AM.vao - Page 3 -------------------------------------------------------------------------------- ------------------------------------------------------------------------------------------------------------------ I TIME DEMAND CAPACITY DEMAND/ PEDESTRIAN START END DELAY GEOMETRIC DELAY AVERAGE DELAY I I (VEH/MIN) (VEH/MIN) CAPACITY FLOW QUEUE QUEUE (VEH.MIN/ (VEH.MIN/ PER ARRIVING I I (RFC) (PEDS/MIN) (VEHS) (VEHS) TIME SEGMENT) TIME SEGMENT) VEHICLE (MIN) I I 08.45-09.00 I I ARM A 0.90 26.02 0.034 0.0 0.0 0.5 0.04 I I ARM B 8.60 29.99 0.287 0.5 0.4 6.1 0.05 I I ARM C 0.34 18.84 0.018 0.0 0.0 0.3 0.05 I I ARM D 6.48 26.76 0.242 0.4 0.3 4.9 0.05 I I I ------------------------------------------------------------------------------------------------------------------
------------------------------------------------------------------------------------------------------------------ I TIME DEMAND CAPACITY DEMAND/ PEDESTRIAN START END DELAY GEOMETRIC DELAY AVERAGE DELAY I I (VEH/MIN) (VEH/MIN) CAPACITY FLOW QUEUE QUEUE (VEH.MIN/ (VEH.MIN/ PER ARRIVING I I (RFC) (PEDS/MIN) (VEHS) (VEHS) TIME SEGMENT) TIME SEGMENT) VEHICLE (MIN) I I 09.00-09.15 I I ARM A 0.75 26.74 0.028 0.0 0.0 0.4 0.04 I I ARM B 7.20 30.02 0.240 0.4 0.3 4.8 0.04 I I ARM C 0.29 19.71 0.015 0.0 0.0 0.2 0.05 I I ARM D 5.43 27.02 0.201 0.3 0.3 3.8 0.05 I I I ------------------------------------------------------------------------------------------------------------------
QUEUE AT ARM A -------------- TIME SEGMENT NO. OF ENDING VEHICLES IN QUEUE 08.00 0.0 08.15 0.0 08.30 0.0 08.45 0.0 09.00 0.0 09.15 0.0
QUEUE AT ARM B -------------- TIME SEGMENT NO. OF ENDING VEHICLES IN QUEUE 08.00 0.3 08.15 0.4 08.30 0.5 * 08.45 0.5 * 09.00 0.4 09.15 0.3
QUEUE AT ARM C -------------- TIME SEGMENT NO. OF ENDING VEHICLES IN QUEUE 08.00 0.0 08.15 0.0 08.30 0.0 08.45 0.0 09.00 0.0 09.15 0.0
QUEUE AT ARM D -------------- TIME SEGMENT NO. OF ENDING VEHICLES IN QUEUE 08.00 0.3 08.15 0.3 08.30 0.4 08.45 0.4 09.00 0.3 09.15 0.3

-------------------------------------------------------------------------------- TRL TRL VIEWER 3.0 AC t:\M-EC Job Book\20111\capacity assessments\2021 + DEV Access AM.vao - Page 4 -------------------------------------------------------------------------------- QUEUEING DELAY INFORMATION OVER WHOLE PERIOD -------------------------------------------- ---------------------------------------------------------------------------- I ARM I TOTAL DEMAND I * QUEUEING * I * INCLUSIVE QUEUEING * I I I I * DELAY * I * DELAY * I I I------------------------------------------------------------------I I I (VEH) (VEH/H) I (MIN) (MIN/VEH) I (MIN) (MIN/VEH) I ---------------------------------------------------------------------------- I A I 82.3 I 54.8 I 3.3 I 0.04 I 3.3 I 0.04 I I B I 789.8 I 526.5 I 37.6 I 0.05 I 37.6 I 0.05 I I C I 31.5 I 21.0 I 1.7 I 0.05 I 1.7 I 0.05 I I D I 595.1 I 396.7 I 29.8 I 0.05 I 29.8 I 0.05 I ---------------------------------------------------------------------------- I ALL I 1498.7 I 999.2 I 72.4 I 0.05 I 72.4 I 0.05 I ---------------------------------------------------------------------------- * DELAY IS THAT OCCURRING ONLY WITHIN THE TIME PERIOD. * INCLUSIVE DELAY INCLUDES DELAY SUFFERED BY VEHICLES WHICH ARE STILL QUEUEING AFTER THE END OF THE TIME PERIOD. * THESE WILL ONLY BE SIGNIFICANTLY DIFFERENT IF THERE IS A LARGE QUEUE REMAINING AT THE END OF THE TIME PERIOD. END OF JOB ============================================= end of file ===============================================
[Printed at 11:39:14 on 05/08/2011]

-------------------------------------------------------------------------------- TRL TRL VIEWER 3.0 AC t:\M-EC Job Book\20111\capacity assessments\2021 + DEV Access PM.vao - Page 1 -------------------------------------------------------------------------------- ___________________ A R C A D Y 6 ___________________ ASSESSMENT OF ROUNDABOUT CAPACITY AND DELAY Analysis Program: Release 2.0 (MAR 2005) (c) Copyright TRL Limited, 2004 Adapted from ARCADY/3 which is Crown Copyright by permission of the controller of HMSO ______________________________________________________ For sales and distribution information, program advice and maintenance, contact: TRL Limited Tel: +44 (0) 1344 770018 Crowthorne House Fax: +44 (0) 1344 770864 Nine Mile Ride Email: [email protected] Wokingham, Berks. Web: www.trlsoftware.co.uk RG40 3GA,UK --------------------------------------------------------------------------------- THE USER OF THIS COMPUTER PROGRAM FOR THE SOLUTION OF AN ENGINEERING PROBLEM IS IN NO WAY RELIEVED OF THEIR RESPONSIBILITY FOR THE CORRECTNESS OF THE SOLUTION --------------------------------------------------------------------------------- Run with file:- "t:\M-EC Job Book\20111\capacity assessments\2021 + DEV Access PM.vai"(drive-on-the-left ) at 11:40:26 on Friday, 5 August 2011
FILE PROPERTIES *************** RUN TITLE: The Dove Way LOCATION: DATE: 06/07/2011 CLIENT: ENUMERATOR: trose [TIMROSE] JOB NUMBER: 20111 STATUS: DESCRIPTION:
INPUT DATA ********** ARM A - Eastern Access ARM B - A518 South ARM C - Western Access ARM D - A518 North
GEOMETRIC DATA -------------- ----------------------------------------------------------------------------------------------------------------------- I ARM I V (M) I E (M) I L (M) I R (M) I D (M) I PHI (DEG) I SLOPE I INTERCEPT (PCU/MIN) I ----------------------------------------------------------------------------------------------------------------------- I ARM A I 3.65 I 8.60 I 30.00 I 19.00 I 40.00 I 40.0 I 0.692 I 33.495 I I ARM B I 3.65 I 8.70 I 30.00 I 20.00 I 40.00 I 45.0 I 0.684 I 33.185 I I ARM C I 3.65 I 6.00 I 20.00 I 26.80 I 40.00 I 38.0 I 0.617 I 26.642 I I ARM D I 3.75 I 7.50 I 30.00 I 27.30 I 40.00 I 45.0 I 0.664 I 31.199 I ----------------------------------------------------------------------------------------------------------------------- V = approach half-width L = effective flare length D = inscribed circle diameter E = entry width R = entry radius PHI = entry angle
TRAFFIC DEMAND DATA ------------------- (Only sets included in the current run are shown)
----------------------- I ARM I FLOW SCALE(%) I ----------------------- I A I 100 I I B I 100 I I C I 100 I I D I 100 I -----------------------
TIME PERIOD BEGINS 16.45 AND ENDS 18.15
LENGTH OF TIME PERIOD - 90 MINUTES. LENGTH OF TIME SEGMENT - 15 MINUTES.

-------------------------------------------------------------------------------- TRL TRL VIEWER 3.0 AC t:\M-EC Job Book\20111\capacity assessments\2021 + DEV Access PM.vao - Page 2 -------------------------------------------------------------------------------- DEMAND FLOW PROFILES ARE SYNTHESISED FROM TURNING COUNT DATA DEMAND SET TITLE: The Dove Way ----------------------------------------------------------------------------- I I NUMBER OF MINUTES FROM START WHEN I RATE OF FLOW (VEH/MIN) I I ARM I FLOW STARTS I TOP OF PEAK I FLOW STOPS I BEFORE I AT TOP I AFTER I I I TO RISE I IS REACHED IFALLING I PEAK I OF PEAK I PEAK I ----------------------------------------------------------------------------- I ARM A I 15.00 I 45.00 I 75.00 I 1.67 I 2.51 I 1.67 I I ARM B I 15.00 I 45.00 I 75.00 I 6.20 I 9.30 I 6.20 I I ARM C I 15.00 I 45.00 I 75.00 I 0.16 I 0.24 I 0.16 I I ARM D I 15.00 I 45.00 I 75.00 I 5.79 I 8.68 I 5.79 I ----------------------------------------------------------------------------- DEMAND SET TITLE: The Dove Way
-------------------------------------------------------------------- I I TURNING PROPORTIONS I I I TURNING COUNTS (VEH/HR) I I I (PERCENTAGE OF H.V.S) I I ----------------------------------------------- I TIME I FROM/TO I ARM A I ARM B I ARM C I ARM D I -------------------------------------------------------------------- I 16.45 - 18.15 I I I I I I I I ARM A I 0.000 I 0.784 I 0.000 I 0.216 I I I I 0.0 I 105.0 I 0.0 I 29.0 I I I I ( 10.0)I ( 10.0)I ( 10.0)I ( 10.0)I I I I I I I I I I ARM B I 0.069 I 0.000 I 0.036 I 0.895 I I I I 34.0 I 0.0 I 18.0 I 444.0 I I I I ( 10.0)I ( 10.0)I ( 10.0)I ( 10.0)I I I I I I I I I I ARM C I 0.000 I 0.846 I 0.000 I 0.154 I I I I 0.0 I 11.0 I 0.0 I 2.0 I I I I ( 10.0)I ( 10.0)I ( 10.0)I ( 10.0)I I I I I I I I I I ARM D I 0.017 I 0.976 I 0.006 I 0.000 I I I I 8.0 I 452.0 I 3.0 I 0.0 I I I I ( 10.0)I ( 10.0)I ( 10.0)I ( 10.0)I I I I I I I I --------------------------------------------------------------------
QUEUE AND DELAY INFORMATION FOR EACH 15 MIN TIME SEGMENT --------------------------------------------------------
------------------------------------------------------------------------------------------------------------------ I TIME DEMAND CAPACITY DEMAND/ PEDESTRIAN START END DELAY GEOMETRIC DELAY AVERAGE DELAY I I (VEH/MIN) (VEH/MIN) CAPACITY FLOW QUEUE QUEUE (VEH.MIN/ (VEH.MIN/ PER ARRIVING I I (RFC) (PEDS/MIN) (VEHS) (VEHS) TIME SEGMENT) TIME SEGMENT) VEHICLE (MIN) I I 16.45-17.00 I I ARM A 1.67 26.42 0.063 0.0 0.1 1.0 0.04 I I ARM B 6.20 29.89 0.207 0.0 0.3 3.8 0.04 I I ARM C 0.16 20.31 0.008 0.0 0.0 0.1 0.05 I I ARM D 5.79 27.99 0.207 0.0 0.3 3.8 0.04 I I I ------------------------------------------------------------------------------------------------------------------
------------------------------------------------------------------------------------------------------------------ I TIME DEMAND CAPACITY DEMAND/ PEDESTRIAN START END DELAY GEOMETRIC DELAY AVERAGE DELAY I I (VEH/MIN) (VEH/MIN) CAPACITY FLOW QUEUE QUEUE (VEH.MIN/ (VEH.MIN/ PER ARRIVING I I (RFC) (PEDS/MIN) (VEHS) (VEHS) TIME SEGMENT) TIME SEGMENT) VEHICLE (MIN) I I 17.00-17.15 I I ARM A 2.00 25.64 0.078 0.1 0.1 1.3 0.04 I I ARM B 7.40 29.84 0.248 0.3 0.3 4.9 0.04 I I ARM C 0.19 19.55 0.010 0.0 0.0 0.1 0.05 I I ARM D 6.91 27.92 0.248 0.3 0.3 4.9 0.05 I I I ------------------------------------------------------------------------------------------------------------------
------------------------------------------------------------------------------------------------------------------ I TIME DEMAND CAPACITY DEMAND/ PEDESTRIAN START END DELAY GEOMETRIC DELAY AVERAGE DELAY I I (VEH/MIN) (VEH/MIN) CAPACITY FLOW QUEUE QUEUE (VEH.MIN/ (VEH.MIN/ PER ARRIVING I I (RFC) (PEDS/MIN) (VEHS) (VEHS) TIME SEGMENT) TIME SEGMENT) VEHICLE (MIN) I I 17.15-17.30 I I ARM A 2.45 24.56 0.100 0.1 0.1 1.6 0.05 I I ARM B 9.07 29.77 0.305 0.3 0.4 6.4 0.05 I I ARM C 0.24 18.51 0.013 0.0 0.0 0.2 0.05 I I ARM D 8.46 27.82 0.304 0.3 0.4 6.4 0.05 I I I ------------------------------------------------------------------------------------------------------------------
------------------------------------------------------------------------------------------------------------------ I TIME DEMAND CAPACITY DEMAND/ PEDESTRIAN START END DELAY GEOMETRIC DELAY AVERAGE DELAY I I (VEH/MIN) (VEH/MIN) CAPACITY FLOW QUEUE QUEUE (VEH.MIN/ (VEH.MIN/ PER ARRIVING I I (RFC) (PEDS/MIN) (VEHS) (VEHS) TIME SEGMENT) TIME SEGMENT) VEHICLE (MIN) I I 17.30-17.45 I I ARM A 2.45 24.55 0.100 0.1 0.1 1.7 0.05 I I ARM B 9.07 29.77 0.305 0.4 0.4 6.5 0.05 I I ARM C 0.24 18.50 0.013 0.0 0.0 0.2 0.05 I I ARM D 8.46 27.82 0.304 0.4 0.4 6.5 0.05 I I I ------------------------------------------------------------------------------------------------------------------

-------------------------------------------------------------------------------- TRL TRL VIEWER 3.0 AC t:\M-EC Job Book\20111\capacity assessments\2021 + DEV Access PM.vao - Page 3 -------------------------------------------------------------------------------- ------------------------------------------------------------------------------------------------------------------ I TIME DEMAND CAPACITY DEMAND/ PEDESTRIAN START END DELAY GEOMETRIC DELAY AVERAGE DELAY I I (VEH/MIN) (VEH/MIN) CAPACITY FLOW QUEUE QUEUE (VEH.MIN/ (VEH.MIN/ PER ARRIVING I I (RFC) (PEDS/MIN) (VEHS) (VEHS) TIME SEGMENT) TIME SEGMENT) VEHICLE (MIN) I I 17.45-18.00 I I ARM A 2.00 25.63 0.078 0.1 0.1 1.3 0.04 I I ARM B 7.40 29.84 0.248 0.4 0.3 5.0 0.04 I I ARM C 0.19 19.55 0.010 0.0 0.0 0.2 0.05 I I ARM D 6.91 27.92 0.248 0.4 0.3 5.0 0.05 I I I ------------------------------------------------------------------------------------------------------------------
------------------------------------------------------------------------------------------------------------------ I TIME DEMAND CAPACITY DEMAND/ PEDESTRIAN START END DELAY GEOMETRIC DELAY AVERAGE DELAY I I (VEH/MIN) (VEH/MIN) CAPACITY FLOW QUEUE QUEUE (VEH.MIN/ (VEH.MIN/ PER ARRIVING I I (RFC) (PEDS/MIN) (VEHS) (VEHS) TIME SEGMENT) TIME SEGMENT) VEHICLE (MIN) I I 18.00-18.15 I I ARM A 1.67 26.40 0.063 0.1 0.1 1.0 0.04 I I ARM B 6.20 29.89 0.207 0.3 0.3 4.0 0.04 I I ARM C 0.16 20.30 0.008 0.0 0.0 0.1 0.05 I I ARM D 5.79 27.99 0.207 0.3 0.3 4.0 0.05 I I I ------------------------------------------------------------------------------------------------------------------
QUEUE AT ARM A -------------- TIME SEGMENT NO. OF ENDING VEHICLES IN QUEUE 17.00 0.1 17.15 0.1 17.30 0.1 17.45 0.1 18.00 0.1 18.15 0.1
QUEUE AT ARM B -------------- TIME SEGMENT NO. OF ENDING VEHICLES IN QUEUE 17.00 0.3 17.15 0.3 17.30 0.4 17.45 0.4 18.00 0.3 18.15 0.3
QUEUE AT ARM C -------------- TIME SEGMENT NO. OF ENDING VEHICLES IN QUEUE 17.00 0.0 17.15 0.0 17.30 0.0 17.45 0.0 18.00 0.0 18.15 0.0
QUEUE AT ARM D -------------- TIME SEGMENT NO. OF ENDING VEHICLES IN QUEUE 17.00 0.3 17.15 0.3 17.30 0.4 17.45 0.4 18.00 0.3 18.15 0.3

-------------------------------------------------------------------------------- TRL TRL VIEWER 3.0 AC t:\M-EC Job Book\20111\capacity assessments\2021 + DEV Access PM.vao - Page 4 -------------------------------------------------------------------------------- QUEUEING DELAY INFORMATION OVER WHOLE PERIOD -------------------------------------------- ---------------------------------------------------------------------------- I ARM I TOTAL DEMAND I * QUEUEING * I * INCLUSIVE QUEUEING * I I I I * DELAY * I * DELAY * I I I------------------------------------------------------------------I I I (VEH) (VEH/H) I (MIN) (MIN/VEH) I (MIN) (MIN/VEH) I ---------------------------------------------------------------------------- I A I 183.7 I 122.5 I 7.9 I 0.04 I 7.9 I 0.04 I I B I 680.1 I 453.4 I 30.7 I 0.05 I 30.7 I 0.05 I I C I 17.8 I 11.9 I 0.9 I 0.05 I 0.9 I 0.05 I I D I 634.9 I 423.2 I 30.7 I 0.05 I 30.7 I 0.05 I ---------------------------------------------------------------------------- I ALL I 1516.6 I 1011.0 I 70.2 I 0.05 I 70.2 I 0.05 I ---------------------------------------------------------------------------- * DELAY IS THAT OCCURRING ONLY WITHIN THE TIME PERIOD. * INCLUSIVE DELAY INCLUDES DELAY SUFFERED BY VEHICLES WHICH ARE STILL QUEUEING AFTER THE END OF THE TIME PERIOD. * THESE WILL ONLY BE SIGNIFICANTLY DIFFERENT IF THERE IS A LARGE QUEUE REMAINING AT THE END OF THE TIME PERIOD. END OF JOB ============================================= end of file ===============================================
[Printed at 11:40:36 on 05/08/2011]

MEWIES ENGINEERING
CONSULTANTS LTD
Wellington House
Leicester Road
Ibstock
Leicestershire LE67 6HP
Tel: 01530 264 753
Fax: 01530 588 116
www.m-ec.co.uk