Embed Size (px)
Citation preview

Proposed Low Carbon Fuel Standard (LCFS) Pathway for the Production of
Biomethane from the Clean Thermal Biomass Conversion (CTBC) of Organic
Green Wastes
New Pathway Proposal
SUBMISSION DATE: June 5, 2014
VERSION 1.0

Interra Energy, Inc.
Pathway Proposal
Proposed Low Carbon Fuel Standard (LCFS) Pathway for the Production of
Biomethane from the Clean Thermal Biomass Conversion (CTBC) of Organic
Green Wastes
Interra Energy, Inc.
6456 Osler St.
San Diego, CA 92111
Kenny S. Key
Vice President, General Counsel
Thomas Del Monte
President, CTO

Table of Contents
Executive Summary ...................................................................................................................................... 5
I. Overview ........................................................................................................................................... 5
II. Carbon Credit for Avoided Emissions .............................................................................................. 8
III. Landfill Gas Collection Efficiency ................................................................................................ 8
IV. Modeled Results ............................................................................................................................ 9
Narrative ..................................................................................................................................................... 11
I. Introduction ..................................................................................................................................... 11
A. Use of the CA-GREET Model for LCA Analysis ...................................................................... 11
B. Clean Thermal Biomass Conversion Pathway ............................................................................ 12
II. Feedstock Characterization and Energy Use ................................................................................... 15
A. Feedstock Characterization ......................................................................................................... 15
B. Feedstock Energy Use ................................................................................................................. 16
III. Biogas Yield Estimates ............................................................................................................... 20
IV. Clean Thermal Biomass Conversion (CTBC) Process ................................................................ 22
A. Brief Explanation of CTBC Reactor Process .............................................................................. 22
V. Facility Electrical Energy Load ....................................................................................................... 23
VI. Biogas Purification, Compression and Transmission .................................................................. 24
VII. Co-Product Biochar Operations .................................................................................................. 28
A. Biochar Carbon Sequestration .................................................................................................... 29
VIII. Credits and Proposed Carbon Intensity ....................................................................................... 34
A. Carbon Credit for Avoided Emissions ........................................................................................ 34
B. Co-Product Credit ....................................................................................................................... 37
C. Tank-to-Wheel Emissions ........................................................................................................... 38
D. Proposed Biomethane Fuel Carbon Intensity .............................................................................. 39
E. Conditions for Use of CI Value .................................................................................................. 40
IX. References ................................................................................................................................... 42
Appendix A ................................................................................................................................................. 46
I. Appendix Figure A-1: Pathway Supplemental Questions .............................................................. 47
II. Appendix Figure A-2: Facility Information .................................................................................... 48

Page 4 of 48
List of Figures
Figure 1: Schematic of High Solids Anaerobic Digestion (HSAD) Pathway - Proposed by ARB Staff June
28, 2012 ........................................................................................................................................................ 6
Figure 2: Schematic of Clean Thermal Biomass Conversion Pathway with Changes from HSAD Pathway
Highlighted ................................................................................................................................................... 6
Figure 3: Proactive Utilization of Waste Streams to Derive Useful Products ............................................ 13
Figure 4: Schematic of Clean Thermal Biomass Conversion Pathway ...................................................... 15
Figure 5: Biochar - Black Carbon Continuum ............................................................................................ 32

Page 5 of 48
Executive Summary I. Overview
Interra is proposing a Low Carbon Fuel Standard (LCFS) Clean Thermal Biomass Conversion
Pathway (CTBC Pathway) for the production of biomethane from organic green wastes. By
definition, a clean thermal biomass conversion process is one in which the biomass is converted in
a continuous feed pressurized reactor. The pressurized reactor is heated to 750º F to 1,150º F and
the biomass stays in the system for approximately 25 minutes. The process change of the organic
material results in a biomethane gas, biochar, and water. To establish the carbon intensity (CI) of
the fuel for the proposed pathway, Interra has modeled an initial composition of 100 percent green
wastes (comprised of equal proportions of leaves, grass clippings, weeds, yard trimmings, wood
waste, branches and stumps, home garden residues, and other miscellaneous organic materials).
Staff assumes for the purposes of this analysis that the CTBC facility would be sited adjacent to a
landfill, or local transfer station, minimizing any transportation distance differentials between
feedstock delivered to the CTBC facility and wastes delivered to disposal or recovery facilities
(landfill or composting).
Interra modeled a majority of the proposed pathway after an internal ARB pathway titled -
Production of Biomethane from High Solids Anaerobic Digestion (HSAD) of Organic (Food and
Green) Wastes (HSAD Pathway). The front-end processes and diversion is the same as the
HSAD pathway, except this pathway focuses solely on diverting organic green waste and not
food waste. The back-end processes are similar, in that the HSAD Pathway produces a compost
based soil amendment and this pathway produces a biochar based soil amendment. Most of the
calculations, tables, and figures used in the HSAD Pathway documentation are included in this
pathway documentation, with slight changes based on differences in the pathway processes and
technologies. A comparison of the scope of the pathways is included in the following figures and
table.
The main difference between the pathways comes from the technology that will process the
green waste feedstock. In the HSAD Pathway, an anaerobic digester is used to process the
feedstock, resulting in a biomethane gas and digestate. The biomethane is used as a fuel and the
digestate remnants are composted. In this proposed pathway, the feedstock is processed through
a clean thermal biomass conversion technology. This technology produces a biomethane gas and
a biochar co-product. A portion of the biomethane gas can be converted to electricity to power
on-site energy needs.
The biogas produced from the CTBC of the organic matter (mostly methane (CH4) and carbon
dioxide (CO2) in equimolar proportions) would be purified to pipeline quality biomethane, or be
made available on-site at the facility to fuel transit buses and other compressed natural gas
(CNG) fueled-vehicles. Interra estimates that for pipeline quality fuel, the purified biomethane
(product gas) would be compressed and injected into the utility company’s natural gas
transmission grid at a connector located approximately five miles from the CTBC facility.
Additionally, the process co-product (Biochar) would be integrated with fill material. The result
would be a high-quality biochar co-product that could be marketed as a soil amendment.

Page 6 of 48
Figure 1: Schematic of High Solids Anaerobic Digestion (HSAD) Pathway - Proposed by
ARB Staff June 28, 2012
Figure 2: Schematic of Clean Thermal Biomass Conversion Pathway with Changes from HSAD Pathway Highlighted

Page 7 of 48
Table 1: Comparison of HSAD and CTBC Pathways
HSAD Pathway CTBC Pathway Units
Feedstock Throughput 100,000 42,188 Tons / year
Fuel Energy Value 238,199,913 105,478,530 MJ / year
Carbon Intensity Value -15.29 -24.09 g CO2e / MJ
MJ Per Ton 2382.00 2500.20 MJ/ton
Emission Reduction Per Ton -36,426.44 -60,242.33 g CO2e / ton
As can be seen in Table 1, the CTBC process is favorable to the lowest CI pathway in ARB’s
portfolio in terms of efficiency and environmental attributes. The proposed CTBC Pathway
produces 5% more MJ per ton of feedstock processed and has 65% more emission reductions
per ton of feedstock than the existing HSAD Pathway. So, while each unit, or project, under
the CTBC Pathway does not process as much feedstock as the HSAD Pathway, the CTBC
Pathway technology is far more efficient and results in more emission reductions per ton
processed. If throughput is a concern, multiple CTBC units can be sited at a single project site,
which would result in greater emission reductions per ton because the loading, unloading, and
processing equipment emissions can be shared across multiple units. Thus, the proposed
pathway offers the lowest CI pathway in ARB’s portfolio along with one of the most efficient
technology for generating renewable biofuels.
This document presents the results of a life cycle analysis (LCA) performed on the CTBC
Pathway described above. Interra collected the process-related information used to perform this
LCA from industry, consultants, and academics. Specifically, Interra used the existing ARB
Pathway – Production of Biomethane from High Solids Anaerobic Digestion of Organic (Food
and Green) Waste (HSAD Pathway).1 Interra combined process energy consumption (petroleum
diesel, electricity, and natural gas) with published empirical biogas yield factors for various
organic substances to develop a greenhouse gas (GHG) emissions profile for the proposed CTBC
Pathway, and to estimate the CI value of the transportation fuel produced.
Interra used the staff estimates from the HSAD pathway to estimate the upstream energy use for
the production of petroleum diesel and electrical energy (fuel cycle emissions) by using the
California-Modified Greenhouse Gases, Regulated Emissions, and Energy Use in Transportation
model (CA-GREET) (Argonne National Laboratory; and Life Cycle Associates LLC, 2009).
However, not all greenhouse gases (GHG) emissions from this pathway could be estimated using
CA-GREET. Interra therefore relied upon published research, process efficiencies and yields,
and scientific principles to estimate the pathway CI.
A model was developed that considered the totality of all emissions occurring within the system
boundaries: process and fugitive emissions (including biogenic emissions), credits for avoided
landfilling and composting emissions from the disposal of green wastes, emission credits for the
carbon sequestration in biochar, and a co-product credit for the displacement of synthetic
fertilizers by the biochar produced.
1 http://www.arb.ca.gov/fuels/lcfs/2a2b/internal/hsad-rng-062812.pdf

Page 8 of 48
It should be noted that a portion of the biomethane produced could be used to produce electricity
to power CTBC process and ancillary equipment. For the purposes of this document, Interra
assumes that the electricity required is procured from the grid. This is the most conservative
estimate as emissions from electricity from the grid are higher than emission from power
produced on-site.
II. Carbon Credit for Avoided Emissions
The carbon credit for avoided emission was introduced by ARB staff in the HSAD Pathway.
Previous ARB LCFS pathways such as the landfill gas (LFG) to liquefied natural gas (LNG)
pathway (ARB, 2009a) have included a process credit for avoiding the flaring of landfill gas
collected by landfill collection and control systems required at the landfills. The collection
systems, however, do not collect all of the landfill gas generated by the anaerobically
decomposing organic matter in the landfill. Uncollected LFG fugitive emissions that contain
methane contribute to atmospheric warming. A CTBC system can also accomplish the
decomposition of organic matter to produce CH4 and CO2, albeit with greater accountability for
materials and energy transfers within the system boundaries. By avoiding most of the fugitive
LFG emissions that naturally occur in a landfill, the biogas production pathway based on the
CTBC of organic matter in an artificial reactor warrants a credit that exceeds the flaring credit
included in the LFG pathway. Therefore, following the staff recommendations in the HSAD
pathway, Interra will include a carbon credit model that results in a higher carbon credit for
avoided fugitive GHG emissions when organic wastes destined for a landfill or composting
facility are diverted to a CTBC facility for biogas production. The value and derivation of this
credit is discussed in Section VIII of this report.
III. Landfill Gas Collection Efficiency
An important variable that influences the CI for the proposed HSAD Pathway is the efficiency of
landfill gas collection systems. The size of the CTBC Pathway carbon credit is largely
determined by the assumed efficiency of such systems. Lower LFG collection efficiencies in
landfills mean that a higher percentage of fugitive GHGs are released to the atmosphere, and that
more fugitive GHGs are prevented by the diversion of wastes from landfills to CTBC facilities.
Although the available collection efficiency estimates are highly variable, the point estimates
have tended to range between 75-85 percent (U.S. EPA, 1998; ARB, 2009d; ARCADIS U.S.,
2012). Because 75 percent is a commonly used value in studies focusing on landfill gas
generation and collection, ARB staff has used that value in previous analysis, and Interra uses
that figure here. As additional data on LFG collection efficiencies in place at compliant landfills
becomes available, staff will consider amending the value of the carbon credit for avoided
emissions used in this analysis.2
2 As pathway CIs are revised, however, previously earned credits are not retroactively adjusted to reflect the revised
values. Only credits earned subsequent to CI revisions are affected. A detailed WTW analysis of the GHG
emissions from the proposed CTBC Pathway is presented in Table ES-2 below. The material and energy balances,
GHG emissions, and proposed CI for the CTBC Pathway are based on one full year of operation.

Page 9 of 48
IV. Modeled Results
The CI for the CTBC Pathway estimated herein is based on energy inputs from CA-GREET, as
well as several factors obtained from other sources, such as CalRecycle, ARB, and published
research on biomass conversion processes.
Interra’s estimate of the well-to-wheel (WTW) CI for the HSAD Pathway is -24.09 g CO2e / MJ
of energy. A summary of the process parameters for the CTBC Pathway that contribute to the
carbon intensity value of the fuel are presented in Table ES-1 below for all components of the
pathway.
Table ES-1
Summary of the CTBC Pathway Characteristics
Parameter
Value
Units
Feedstock:
Organic Green Wastes
42,188 (100 %)
short tons per year
(tons / year)
Net Annual Biomethane Production Rate
111,150,000
standard cubic feet per year (scf / year)
Fuel Energy Value
105,478,530
mega-joules per year (MJ / year)
Net Annual GHG Emissions
-2,541,503,457
grams CO2 equivalent / year
(g CO2e / year)
Process
Clean Thermal Biomass
Conversion
Primary Product Fuel
Biomethane
-
Co-Product
Biochar -
Total Fossil Fuel Energy Use
-
- No. 2 Diesel Fuel
17,405
gallons per year (gal / year)
- Grid Electricity Use
3,750,000
kilo-watt hours per year (kWh / year)

Page 10 of 48
Parameter
Value
Units
Reference
CTBC Process GHG Emissions
23,325,185,245
23,325,185,245.48
g CO2e / year
Table VI-5
CTBC Wastes Loading GHG Emissions
174,562,143
g CO2e / year
Based on Tables II-2 and II-4
Total Fuel Cycle Electric Use GHG Emissions
1,420,119,549
g CO2e / year
Based on Table V-2
Total Low Sulfur Diesel Well-to-Tank GHG Emissions
47,897,831
g CO2e / year
Based on Table II-5
Total CTBC Process and Operations GHG Emissions (A)
24,967,764,768
25.25,105,340,312.60
25,105,340,312.60
g CO2e / year
Sum Above
Tank-to-Wheel (TTW) GHG Emissions from RNG Combustion (B)
13,896,324,909
g CO2e / year
Table VIII-3
Less Carbon Credit for Avoided Landfilling & Composting Emissions (C)
21,213,362,726.79
g CO2e / year
Section VIII (A), Table VIII-2
Less Compost Emissions Reduction Factor (CERF) (D)
5,740,777,500
g CO2e / year
Section VIII (B)
Less Biochar Emission Reduction Factor (E)
14,451,452,908
Table VII-1
Net GHG Emissions (1) (Sum A-E Above)
-2,541,503,457
g CO2e / year
-
Biomethane Fuel Energy Value (2)
105,478,530
MJ / year
Table III-2a
Proposed CTBC Pathway Carbon Intensity Value (1 ÷ 2)
-24.09
g CO2e / MJ
Table ES-2
Summary of GHG Emissions and Proposed CI Value
a
Based on Lower Heat Value (LHV) of 930 Btu / scf for Natural Gas, as found in the Fuel Specs tab of CA-GREET,
version 1.80b, December 2009 (Life Cycle Associates LLC. And Systems Assessment Section, 2009).

Page 11 of 48
Narrative
I. Introduction
The use of life cycle analysis (LCA) to estimate the CI of a transportation fuel requires a full
well-to-wheels (WTW) accounting of the GHG emissions from the production, processing,
distribution, and combustion of that fuel. The system boundary within which this accounting
takes place includes the upstream (fuel cycle) emissions from the energy consumed to produce
and distribute the process fuels such as petroleum based diesel, and electricity used to power the
CTBC Pathway process. A WTW analysis is comprised of two components:
A Well-to-Tank (WTT) component, which accounts for the energy use and emissions
from the delivery of the feedstock to the facility; processing, production, and refining
of the fuel, and the distribution of the final product; and
A Tank-to-Wheels (TTW) analysis, which accounts for the emissions from the actual
combustion of the fuel in a motor vehicle used for motive power. For this pathway,
combustion of the fuel is assumed to occur in a heavy-duty, natural-gas-fired vehicle.
WTT emissions are sometimes referred to as well-to-pump emissions, while TTW emissions are
sometimes referred to as pump-to-wheels emissions. Interra has conducted a WTW analysis for
biogas produced from the processing of organic green wastes in a CTBC system. Under this
pathway, the biogas produced is purified to biomethane, which could then be compressed and
sold onsite or transmitted in the natural gas pipeline.
A. Use of the CA-GREET Model for LCA Analysis
A California-specific version of an LCA model called the Greenhouse gases, Regulated
Emissions, and Energy use in Transportation (GREET) model, originally developed by Argonne
National Laboratory and Life Cycle Associates (Argonne National Laboratory and Life Cycle
Associates LLC, 2009), was the source of some of the energy use and greenhouse gas (GHG)
emissions data used to develop the CI for the CTBC Pathway. The California-specific version of
the model, known as CA-GREET contains California-specific emission factors, electrical
generation energy mixes, and transportation distances. The analytical methodology inherent in
the original GREET model was not changed. Interra used this California-modified GREET
model to calculate GHG emissions from the CTBC Pathway whenever the necessary emissions
factors were present in the model. Interra relied on published factors, and actual process
efficiencies and yields when required factors were not available in the CA-GREET model.
The analysis that follows uses conventions and technical terms with specific meanings that are
defined here:
CA-GREET employs a recursive methodology to calculate energy consumption and
emissions. To calculate WTT energy and emissions, the values being calculated are
often utilized in the calculation. For example, crude oil is used as a process fuel to
recover crude oil. The total crude oil recovery energy consumption includes the direct

Page 12 of 48
crude oil consumption and the energy associated with crude recovery (which is the
value being calculated).
Btu/MMBtu is the energy input necessary in BTU, or Btu to produce one million BTU
of a finished (or intermediate) product. This description is used consistently in GREET
for all energy calculations.
gCO2e/MJ provides the total greenhouse gas emissions on a CO2 equivalent basis per
unit of energy (MJ) in a given fuel. Methane (CH4) and nitrous oxide (N2O) are
converted to a CO2 equivalent basis using IPCC global warming potential (GWP)
values and included in the total. CA-GREET assumes that VOC and CO are
converted to CO2 in the atmosphere and includes these pollutants in the total CO2 value
using ratios of the appropriate molecular weights.
Process Efficiency for any step in GREET is defined as the ratio of energy output to the
sum of the energy output and energy consumed.
Note that rounding of values has not been performed in several tables in this document.
This is to allow stakeholders executing runs with the GREET model to compare actual
output values from the CA-modified model with values in this document.
As used in this document, the term ― upstream refers to the energy use and emissions
associated with the inputs supplied to the fuel production process. In the case of most
fuels, the two upstream processes considered in the WTT analysis are the production of
diesel fuel, and the generation of electricity. In the case of diesel fuel, the energy used
to extract, process, and transport the fuel are quantified. In the case of electrical
generation, the energy needed to produce and transport the fuels used to generate the
electrical energy are considered. In both cases, the expenditure of this energy results in
GHG emissions.
The fuel production process can yield what are known as co- products. The biodiesel
production process, for example, yields glycerin as a co-product. If that glycerin is
sold, it displaces glycerin from other sources. The GHGs associated with the
production of glycerin from those other sources could be greater than the GHGs
associated with the biodiesel co-product. As an example, glycerin from the production
of biodiesel sometimes displaces glycerin produced from petrochemicals. This
indicates that biodiesel should be credited for the GHG reduction associated with this
displacement.
Production and feedstock production emissions are also adjusted to reflect material
losses incurred during the production process. These are accounted for through the use
of a capture efficiency
The WTT and TTW emissions estimates presented in the following sections include analyses of
the process conditions, and the applicability of credits for avoided landfilling and composting
emissions, and for co- products produced.
B. Clean Thermal Biomass Conversion Pathway
Interra modeled a majority of the proposed pathway after an internal ARB pathway titled -
Production of Biomethane from High Solids Anaerobic Digestion (HSAD) of Organic (Food and
Green) Wastes.3 This pathway borrows calculations from the up-stream and down-stream
3 Please see Executive Summary Section I and Figures 1 &2 to see the differences in the pathway processes.
Page 13 of 48
emission calculations, as those portions of the process are similar. The main difference from the
HSAD Pathway to this CTBC Pathway is the technology used to process the feedstock to
generate biomethane gas.
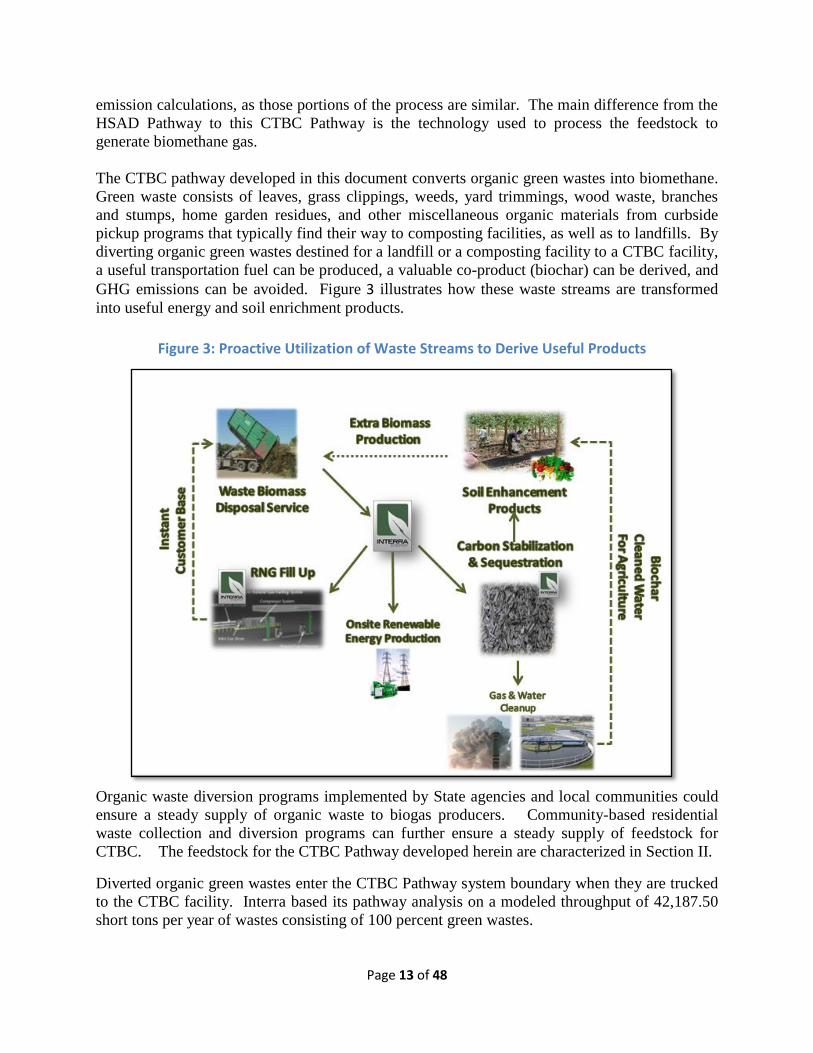
The CTBC pathway developed in this document converts organic green wastes into biomethane.
Green waste consists of leaves, grass clippings, weeds, yard trimmings, wood waste, branches
and stumps, home garden residues, and other miscellaneous organic materials from curbside
pickup programs that typically find their way to composting facilities, as well as to landfills. By
diverting organic green wastes destined for a landfill or a composting facility to a CTBC facility,
a useful transportation fuel can be produced, a valuable co-product (biochar) can be derived, and
GHG emissions can be avoided. Figure 3 illustrates how these waste streams are transformed
into useful energy and soil enrichment products.
Organic waste diversion programs implemented by State agencies and local communities could
ensure a steady supply of organic waste to biogas producers. Community-based residential
waste collection and diversion programs can further ensure a steady supply of feedstock for
CTBC. The feedstock for the CTBC Pathway developed herein are characterized in Section II.
Diverted organic green wastes enter the CTBC Pathway system boundary when they are trucked
to the CTBC facility. Interra based its pathway analysis on a modeled throughput of 42,187.50
short tons per year of wastes consisting of 100 percent green wastes.
Figure 3: Proactive Utilization of Waste Streams to Derive Useful Products

Page 14 of 48
Very little energy is expended to pre-process and screen the wastes for metal and large objects in
a CTBC operation. Nor is extensive screening, grinding, or slurrying required for CTBC.
The biogas collected after the green waste has been processed by the CTBC reactor has a
composition of approximately 35 percent CH4 and 65 percent CO2 and is refined to nearly pure
biomethane via an integrate water scrubbing system and additional catalysts. Biogas yield
estimates are discussed in Section III.
The CTBC process is discussed in more detail in Section IV. Several processes can be employed
to strip the biogas of its CO2 and other impurities (among them, hydrogen sulfide or H2S),
including using the biochar co-product as an activated carbon filter. The result is a high-purity
biomethane stream (90-99 percent CH4). Biogas purification technology process emissions are
discussed in Section VI. The refined biomethane can be sold as compressed natural gas (CNG)
or further pressurized in a product compressor for pipeline transmission. For this analysis,
Interra has assumed a biomethane discharge pressure of no greater than 800 psig, and a tie-in to
the utility company’s natural gas transmission system at a distance of approximately 5 miles
from the production facility. Biomethane compression and transmission emissions are also
discussed in Section VI.
A solid residue (biochar) is also produced by the reactor. A bulking agent (typically fresh soil or
composted green waste) is added to the biochar to produce a stable soil amendment mixture.
The finished product is sold as a high-quality soil amendment. Biochar (co-product) operations
are discussed in Section VII.
Interra has used previous staff estimated regarding the co-product credit for soil amendment
produced from the biochar co-product. This co-product credit is further discussed in Section
VIII. Lastly, a summary of all emissions, including the overall pathway WTW CI is presented in
Section VIII. Interra has also broken the WTW estimate into WTT and TTW components.
TTW emissions are calculated assuming that the fuel produced is used to power heavy-duty
natural-gas-fueled vehicles. The CI value is reported in units of grams of CO2-equivalent per
megajoule (MJ) of fuel energy, which expresses the total greenhouse gas emissions on a CO2
equivalent basis. The pathway CI value also includes all applicable carbon credits from avoided
landfilling and composting emissions, and a credit for the displacement of commercially
manufactured fertilizer by the biochar soil amendment produced from the process.
A schematic of the CTBC process is presented in Figure 4 below.

Page 15 of 48
Figure 4: Schematic of Clean Thermal Biomass Conversion Pathway
II. Feedstock Characterization and Energy Use
A. Feedstock Characterization
Interra developed the life cycle CI for the CTBC Pathway by estimating the energy consumption
and GHG emissions associated with the production of biomethane from an organic waste mixture
comprised of 100 percent organic green waste.
The green wastes could be procured from curbside yard waste collection programs implemented
in local communities across the State. Additionally, green wastes from landscaping services
could contribute to this resource. Interra assumes that the composition of the green wastes would
be approximately equal proportions of leaves, grass clippings, weeds, yard trimmings, wood
waste, branches and stumps, home garden residues, and other miscellaneous organic materials.
Interra recognizes that seasonality might be an important factor influencing the availability of
green-waste resources. While the feedstock characterization model makes no adjustment for
seasonal variation, staff assumes that during periods of low green wastes availability, the
feedstock for the CTBC process would be augmented with wastes that have equivalent or greater
yields of biogas, primarily other forms of wood waste including the following: mixed paper

Page 16 of 48
wastes, non-treated construction wood waste, and agricultural residues. In 2008, disposed paper
material amounted to an estimated four million tons in the State, or 17 percent of the overall
waste-stream and could be sourced if green-waste feedstock levels fall short.
Previously, ARB staff determined that the majority of the green-waste are destined for a green-
waste composting facility. The following figures come from the analysis conducted by staff for
the HSAD Pathway. Statistics suggests that the amount of green waste going to composting
operations could be as high as two-thirds of the total amount of green waste generated (Climate
Action Reserve, 2010). The other one-third of the green wastes is believed to be destined for
the landfill. The fate of the green wastes is also an important determinant of the carbon credit
model for avoided composting emissions.
California’s geography and climate limit the development of a statewide seasonal green waste
feedstock assessment. Operators generally do not separate collected green waste by specific
material type. Sacramento, as an example, has the following seasonal variability for green waste
material collected (CalRecycle, 2010):
Table II-1
Seasonality of Collected Green Material (City of Sacramento)4
Monthly Green Wastes Collected
(tons)
Month / Year 2006
2007
2008
January 7,836 4,785 9,976
February 4,452 4,205 4,583
March 4,547 6,233 6,444
April 6,225 6,803 6,495
May 7,528 6,602 6,658
June 6,501 5,224 6,340
July 4,686 4,858 5,504
August 5,071 5,236 3,979
September 5,986 4,517 4,652
October 7,304 6,438 5,741
November 10,175 8,693 7,317
December 9,942 7,598 10,570
Average Monthly
6,688
5,933
6,522
B. Feedstock Energy Use
Interra will next present the fossil fuel energy consumption for loading the organic wastes into
the CTBC process. Interra has assumed that the CTBC facility would be sited at a location
adjacent to the local landfill, or a local transfer station, so that transportation distance differences
4 http://www.calfog.org/GreaseFacilities.html

Page 17 of 48
between delivery of wastes destined for disposal or recovery, and the proposed CTBC facility
would be minimized.
In a typical CTBC facility, organic wastes are dumped into an open receiving hall. After the
wastes are pre-screened5, the wastes piles are worked and transferred to a day bin for drying.
Recycled heat from the CTBC reaction is used to heat the incoming waste feedstock.
Waste loading is achieved by working payloads of organic wastes feedstock dumped to the
receiving hall with a front-end loader. Based on a throughput of 42,000 tons per year of green
wastes staff anticipates the need for one 195 kW (260 hp) rated Front- End Loader to be operated
for approximately 6 hours a day, 1,200 total hours a year.
The calculations below are conservative estimates. The CTBC process can be set up such that
feedstock loading can be fueled/powered by the biomethane produced by the process. In that
case, no fossil energy emissions would be associated with this part of the pathway.
The total fossil fuel based energy (low-sulfur diesel) requirement for the CTBC Pathway is based
on a projected fuel use for 42,000 tons of feedstock. The total fossil fuel-based energy use for
CTBC unit loading is presented in Table II-2 below.
Table II-2
Estimate of Fossil Energy Use for Unit Loading
Parameter
Type / Value
Unit
Equipment:
Front End Loader
Rated Output:
195 (261)
kW (hp)
Hours of Operation:
1,200
hours per year
Annual Loads:
208
loads per year
Average Daily Operation:
6
hours per day
Average Hourly Output:
35%
ICE Engine Efficiency:
42%
Energy Type:
No. 2 Diesel, CNG from CTBC Process
Fuel LHV: (No. 2 Diesel)
127,464
Btu per gallon
5 Interra expects that a minimal amount of wastes pre-screening will occur in a CTBC operation. For this pathway,
Interra has based their analysis on 5 percent of the wastes delivered being removed due to pre-screening of metal
objects (for examples, forks and knives, etc.).

Page 18 of 48
Energy Use (30,000 tons/year)
5,221
gallons / year
Projected CTBC Pathway Throughput:
42,000
short tons / year
Total Fuel Use for
Unit Loading and
Biochar Moving:
17,404
gallons / year
The annual energy consumption for the Front End Loader is based on the following analysis:
Assuming an internal combustion engine (ICE) efficiency of 42 percent, and a throughput of 95
percent of the design load, the total fossil fuel energy consumed is estimated to be as follows:
The biochar co-product is moved to outdoor piles and is blended with a bulking agent to form a
soil amendment end-product. Earth-moving equipment such as front-end loaders are used to
work the piles. These emissions are included in the 17,404 gallon requirement.
The total fossil fuel use for the CTBC Pathway consists of the sum of the fuel used to load the
CTBC unit. This total is the total fuel usage identified in Table II-2 above. This total is
presented in Table II-3.

Page 19 of 48
Pollutant
Emissions Factora
( g / MMBtu)
Annual Emissions
(g / year)
Annual GHG Emissions
(g CO2e / year)
VOC 107.69 238,895 745,353
CO 402.58 893,068 1,402,117
CH4 9.72 21,555 538,878
N2O 0.92 2,041 608,190
CO2 77,204.08 171,267,605 171,267,605
Total Annual Emissions
(g CO2e / year)
174,562,143
Table II-3
Estimate of Total Fossil Fuel Based Energy Use
Earth Moving
Equipment Usage
Annual Quantity
(gallons per year)
Total Fuel Use for CTBC Loading:
17,404
Total Fossil Fuel Use
17,404
Process emissions from the combustion of fossil fuel occur when low-sulfur diesel fuel is
consumed by the earth-moving equipment used in waste loading and biochar operations. Interra
assumes that both CTBC unit loading as well as biochar operations would utilize Front-End
Loaders, water trucks, and dump trucks. To assess process emissions from fossil energy use,
Interra approximated the emissions from the earth-moving equipment by using the diesel farm
tractor emissions factor from CA-GREET (version1.80b, December 2009).
The total GHG emissions estimate from combustion of fossil fuels during materials handling
(waste loading) is shown in Table II-4 below.
Table II-4
Material Handling GHG Emissions
a CA-GREET Version 1.80b, December 2009. See Worksheet ―EF,‖ Emission Factors of
Fuel Combustion for Stationary Applications (grams per MMBtu of fuel burned) (Farming Tractor).
Fuel cycle or upstream emissions are emissions associated with the production of the net quantity
of low-sulfur diesel fuel consumed during feedstock loading and to work the compost piles using
earth-moving and turning equipment. A complete lifecycle analysis requires that the emissions
associated with fuel production be accounted for. These emissions are known as upstream or
fuel cycle emissions. The fuel cycle emissions associated with the fuel use described in this
section are shown in Table II-5. The total emissions are calculated from emissions factors
obtained from CA-GREET (version 1.80b, December 2009)

Page 20 of 48
Pollutant
Fuel Cycle Emissions
Factor (g / MMBtu)a
Total Annual Emissions Based on
Energy Use (g / year)
Annual Emissions
(g CO2e / year)
VOC 9.80 21,734 67,811
CO 26.88 59,628 93,616
CH4 101.29 224,690 5,617,247
N2O 0.23 503 149,936
CO2 18,918.90 41,969,220 41,969,220
Total Annual Emissions
47,897,831
Table II-5
Fuel Cycle (Well-to-Tank) GHG Emissions for Diesel Production
a CA-GREET Version 1.80b, December 2009. See Worksheet ―Petroleum, Summary of Energy Consumption and
Emissions: Btu or Grams per mmBtu of Fuel Throughput at Each Stage, and Energy Use and Total Emissions.
The GHG emissions from electrical generation (fuel cycle emissions) are discussed in Section V.
III. Biogas Yield Estimates Interra estimated the biomethane yield for the green wastes from biogas yield factors (m
3 / dry
metric ton) developed for the respective wastes and from internal modeling done on Aspen+.
Interra then converted the biogas yield estimates to biomethane yield by assuming the quality of
the biogas to be 35 percent methane. Another factor critical to the conversion is the organic
fraction moisture content. This factor is used to convert the yield estimates from a dry basis to
a wet basis. The following moisture contents were assumed to be applicable to the specific
wastes types:
wood waste (30 percent)
leaves and brush (30 percent);
grass (60 percent); and
mixed paper, which represents office, coated, newspaper, and corrugated containers (5-
6 percent).
Green waste is expected to comprise 100 percent of the waste feedstock stream. Interra assumes
that the green waste would be sourced from residential and commercial yard waste with equal
proportions of leaves, grass clippings, weeds, yard trimmings, wood waste, branches and
stumps, home garden residues, and other miscellaneous organic materials. The biogas yield
estimate for green wastes is expected to be 221.05 cubic meters per metric ton, wet basis.
Based on an annual throughput of 42,187.50 tons per year, the average daily biogas yield is
expected to be 1,097,746 million standard cubic feet (mm scf) of biogas per day, or an average
yield of 772 standard cubic feet per minute (scfm). This represents a biomethane potential of
approximately 247 scfm. Biogas and biomethane production levels from CTBC of the feedstock
are presented in Table III-1 below.

Page 21 of 48
Table III-1
Biogas and Biomethane Production Estimates
Organic
Component
Biogas
Yield (Nm3
/ metric
ton)
Biogas
Yield (scf /
metric ton)
Staff
Modeled
Organic
Fraction
Average Daily
Component
Throughput (short
tons / day)
Biogas
Generation
Potential (scf
/ day)
Wood Waste
232.68
8,213.59
80%
108
887,067.81
Green & Yard
Wastes
221.05
7,802.91
20%
27
210,678.61
Mixed Paper
289
10,217
0%
-
-
Biogas Potential
1,097,746 (scf /
day)
Average Daily
Throughput
135 (tons / day)
Annual Throughput
42,187.50 (tons /
year)
Annual Throughput
38,271.86 (m.t. /
year)
Biogas Potential
772 (scf /min)
Annual Biogas
Potential
346,510,864 (scf /
year)
Biomethane
Potential
247 (scf /min)
Ann. Biomethane
Potential
111,150,000 (scf /
year)
m.t. = metric tons; scf = standard cubic feet; min = minute; N = Normal
Table III-2
Net Annual Biomethane Potential
Source
Biomethane Potential
Unit
Biogas Potential
772
(scf / min)
Biomethane Potential
247
(scf / min)
Feed Compressor Losses
N/A
*Unit operates at
pressure
Page 22 of 48
Adsorber Capture Losses
N/A
*3% loss included in
potential number
Product Compressor
Losses
(9.40)
(scf / min)
Annual Biomethane
Potential with Losses
238.60
(scf / min)
Annual Biomethane Potential with Losses
107,505,000
(scf / year)
Net Annual Biomethane
Production Potential
107,505,000
(scf / year)
Net Annual Biomethane
Energy Potential
105,478,530
(MJ / year)
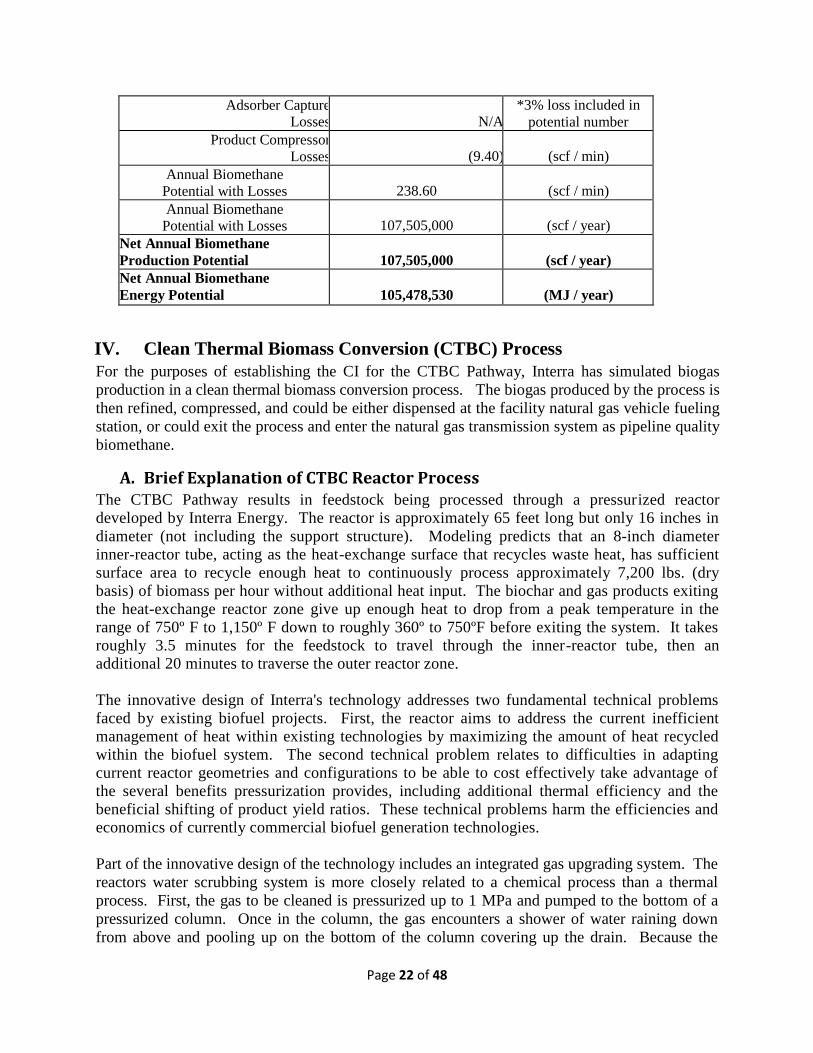
IV. Clean Thermal Biomass Conversion (CTBC) Process
For the purposes of establishing the CI for the CTBC Pathway, Interra has simulated biogas
production in a clean thermal biomass conversion process. The biogas produced by the process is
then refined, compressed, and could be either dispensed at the facility natural gas vehicle fueling
station, or could exit the process and enter the natural gas transmission system as pipeline quality
biomethane.
A. Brief Explanation of CTBC Reactor Process The CTBC Pathway results in feedstock being processed through a pressurized reactor
developed by Interra Energy. The reactor is approximately 65 feet long but only 16 inches in
diameter (not including the support structure). Modeling predicts that an 8-inch diameter
inner-reactor tube, acting as the heat-exchange surface that recycles waste heat, has sufficient
surface area to recycle enough heat to continuously process approximately 7,200 lbs. (dry
basis) of biomass per hour without additional heat input. The biochar and gas products exiting
the heat-exchange reactor zone give up enough heat to drop from a peak temperature in the
range of 750º F to 1,150º F down to roughly 360º to 750ºF before exiting the system. It takes
roughly 3.5 minutes for the feedstock to travel through the inner-reactor tube, then an
additional 20 minutes to traverse the outer reactor zone.
The innovative design of Interra's technology addresses two fundamental technical problems
faced by existing biofuel projects. First, the reactor aims to address the current inefficient
management of heat within existing technologies by maximizing the amount of heat recycled
within the biofuel system. The second technical problem relates to difficulties in adapting
current reactor geometries and configurations to be able to cost effectively take advantage of
the several benefits pressurization provides, including additional thermal efficiency and the
beneficial shifting of product yield ratios. These technical problems harm the efficiencies and
economics of currently commercial biofuel generation technologies.
Part of the innovative design of the technology includes an integrated gas upgrading system. The
reactors water scrubbing system is more closely related to a chemical process than a thermal
process. First, the gas to be cleaned is pressurized up to 1 MPa and pumped to the bottom of a
pressurized column. Once in the column, the gas encounters a shower of water raining down
from above and pooling up on the bottom of the column covering up the drain. Because the

Page 23 of 48
drain on the bottom is covered with water, the only direction the gas can go is up against the
direction of the water shower. The water must be slowly drained out of the bottom of the
column and out of the pressurized zone of the system without allowing the drain opening to
uncover. The gas reaching the top of the column has been stripped of nearly all of its CO2, yet
nearly all of the methane remains, exiting the system.
The biogas exits the reactor and is routed to an additional biogas purification system (if
necessary), where the separation of the methane and any remaining carbon dioxide occurs, along
with removal of some other trace impurities, such as hydrogen sulfide, to produce pipeline
quality biomethane fuel.
The biomethane can exit the biogas purification system at a pressure of approximately 100 psig,
which is suitable for a small natural gas fuel dispensing station sited at the CTBC facility. For
the purposes of this pathway, staff assumes that the biomethane would be compressed to 600-800
psig, and then tie into the natural gas transmission system at a distance of approximately 5 miles.
The total annual electrical power requirements for feedstock pre-treatment, unit loading, gas pre-
treatment, exhaust fan and blower, instrument air, and power, plant, and lighting (PPL) is
estimated to be approximately 1.5 million kilowatt hours per year (kWh / year). This will be
discussed in Section V. Interra assumes that the electricity for the CTBC process will be
provided by power derived from the biogas generated by the organic wastes.
V. Facility Electrical Energy Load
For a CTBC operation that processes 42,187.50 tons per year of green wastes, Interra anticipates
a process electrical energy load of approximately 200 kW, or 1.5 million kilowatt hours per year
for waste pre-screening and processing. The total electrical energy requirements for biogas purification is based on the use of a vacuum
pump, a product gas compressor, and miscellaneous instrumentation and controls. The load
demand from biogas purification, compression, and transmission is estimated to be
approximately 300 kW, or 2,250,000 million kilowatt hours per year. The estimated electrical
demand identified above is based on proprietary equipment counts for the respective process
units.
These numbers are used here as conservative estimates. The CTBC process can generate
electricity on-site to power all of these needs, and still produce biomethane gas for transportation
fuel. If that were the actual operational conditions, then there would be far less emissions from
the on-site power generation than from the California Marginal Energy Mix.
Table V-1
Total Electrical Energy Demand for the CTBC Pathway
Purpose
Operation
Demand
(kWh / year)
Wastes Screening and Processing
CTBC Process
1,500,000

Page 24 of 48
Pollutant
Feedstock (g / mmBtu)
Fuel (g / mmBtu)
Total (g / mmBtu)
Emissions (g / year)
GHG Emissions (g CO2e /
year)
VOC
16.70
5.67
22.37
286,353
893,423
CO
15.55
39.68
55.23
706,834
1,109,739
CH4
270.51
7.04
277.55
3,552,301
88,807,534
N2O
0.14
2.48
2.62
33,524
9,990,228
CO2
6,833.08
96,249.68
103,082.76
1,319,318,633
1,319,318,633
Total Annual Emissions
1,420,119,549
Biogas Purification, Compression,
& Transmission
Biogas Refining
2,250,000
Total Annual Demand
(kWh)
3,750,000
Staff used the CA-GREET model to estimate the fuel-cycle energy use and emissions from
electrical generation. These estimates are based on the California Marginal electrical mix. The
results are summarized in Table V-2 below.
Table V-2
Fuel Cycle Emissions from Electrical Generation
(California Marginal Energy Mix)6
VI. Biogas Purification, Compression and Transmission The specific GHG emissions that are estimated in this Section are related to compression and
transmission of the feed biogas and the refined biomethane. Once the biogas has been purified
by stripping its carbon dioxide and trace impurities, such as hydrogen, the near-pure biomethane
product gas is primarily high-quality methane in composition (90-99 percent). The biomethane
exits the system at a pressure of approximately 100 psig, which is suitable for storage and low-
volume dispensing from an on-site natural gas vehicle fueling station at the CTBC facility.
However, Interra assumes that since the biomethane meets or exceeds the standards for pipeline
6 CA-GREET Version 1.80b, December 2009. See Worksheet ―Electric,‖ Fuel-Cycle Energy Use and Emissions of
Electric Generation: Btu or Grams per mmBtu of Electricity Available at User Sites (wall outlets) (Based on
California Marginal Use). The Feedstock factor represents the emissions from the energy expended to procure the
fuel for electrical generation, and the Fuel factor represents the emissions from the fuel expended to produce the
electrical energy.

Page 25 of 48
quality natural gas,7 a compressor will be required to further compress the biomethane to utility
company pipeline pressure specifications.
Product compressors, as well as compressors used in transmission and distribution, are a
significant source of fugitive as well as point-source GHG emissions. Interra has estimated that
high efficiency electric compressors could serve the purpose of achieving feed gas (to biogas
purification unit) pressures of 100 psig, as well as product gas pipeline pressures of 600-800 psig
required to tie into the natural gas transmissions system.8
Interra has further assumed that a
connector of approximately five linear miles will be required to tie into the transmission system.
Compressor specifications for estimating GHG emissions are presented below in Table VI-1.
GHG emissions sources during compression and transmission include compressor seals, fugitive
emissions from compressor blow down of open ended line valves, emissions from pressure relief
valves, and other miscellaneous emissions sources. An estimate (ARB, 2009b) of these
emissions is presented in Table VI-1 below. Interra uses previously published ARB staff
determinations of the impact of product compressor methane losses to be an equivalent loss of
9.4 scfm.
Table VI-1
Feed and Product Gas Compressor Operating Specifications
Parameter
Product Gas
Compressor
Unit
Type
Reciprocating
Fuel Type
Electric
Number of Compressor
Seals/Cylinders
4
Number of Pressurized Operating Hours
7,000
per year
Number of Pressurized Idle Hours
1,000
per year
Number of De-pressurized Idle Hours
760
per year
Gas Quality 1
0.99
Methane (CH4)
Gas Quality 2
0.01
Carbon Dioxide (CO2)
7 In summary, as required by the San Diego Air Pollution Control District (SDAPCD) Rule 30 (Biomethane Gas
Delivery Specifications Limits and Action Levels), specifications for pipeline quality bio-methane include a fuel
higher heat value (HHV) of 990-1,150 Btu/cubic foot, a Wobbe Number (WN) of 1,279-1,385, be commercially free
of Siloxanes, and have a Hydrogen Sulfide concentration of no greater than 0.25 grain / 100 scf (~ 8 ppm). 8 Pursuant to ARB Staff conversation with Jack Dunlap, PG&E, on December 29, 2011 (as cited in the HSAD
Pathway).

Page 26 of 48
Pollutant
Emissions Factora
(g / mmBtu RNG Transported)
Total Emissions
(g/ year)
Total GHG Emissions
(g CO2e/ year)
VOC 0.21 46,463 144,966
CO 2.02 46,463 72,948
CH4 2.86 643,584 16,089,591
N2O 0.02 4,731 1,409,945
CO2 2,299.85 518,029,048 518,029,048
Total Emissions
536,387,008
Table VI-2
Estimate of Feed and Product Compressor GHG Emissions
Emissions Source
Emissions
(metric tons CO2e/year)
Product Compressor to
Natural Gas Pipeline
- Compressor Seals 1,023.54
- Compressor Blow Down 1,153.07
- Pressure Relief Valves 218.01
- Miscellaneous Emissions 105.46
TOTAL EMISSIONS FROM PRODUCT COMPRESSOR
2,500.07
Total Compressor Emissions
2,500.07
In addition to the sources of point and fugitive GHG emissions identified above, Interra used ARB staff estimates of the GHG emissions potential from biomethane compression and transmission in the pipeline. ARB staff estimated transmission GHG emissions using the CA-GREET model.
9 Furthermore, ARB staff assumed a tie-into the utility company’s natural gas
transmission system at a distance of five miles. ARB staff assumed the use of electric compressors. These emissions are presented in Table VI-3 below
Table VI-3
Estimate of GHG Emissions from Transmission of RNG
a CA-GREET Version 1.80b, December 2009. See Worksheets "T&D" and "T&D Flow Chart" Modules,
Calculations of Energy Use and Emissions: Transportation and Distribution of Energy Feedstocks and Fuels (Energy
Consumption and Emissions of Feedstock and Fuel Transportation).
Interra estimated the total process GHG emissions for the CTBC Pathway by using 42,187.50
tons per year of green wastes as a basis. Interra adjusted the biogas yield from the processing of
the wastes to account for the biogas refining efficiency, and product gas compressor losses
discussed above in this Section. A step-by-step walk through of the GHG emissions from the
CTBC process is presented in Table VI-4 below:
9 CA-GREET Version 1.80b, December 2009.

Page 27 of 48
Table VI-4
CTBC Process GHG Emissions
Parameter
Value
Units Estimated Green Wastes Annual Throughput Less Contaminants
42,187.50
short tons/year
Estimate of Biogas Yield from Process
772
scfm
Estimate of Biomethane Yield (35 percent) in Feed Gas to Biogas Purification Unit
270.20
scfm
Therefore, CO2 Yield (65 percent):
501.80
scfm
Biogas Refining Adsorber Capture Efficiency (PSA)
92
percent
Tail Gas Methane to Flare
0.00
scfm
Biomethane Yield and Flow rate to Compression / Liquefaction Plant:
262.09
scfm
Net Product Gas Less Methane Emissions from Product Compressor
252.69
scfm
Fugitive Biomethane Emissions Not Going to Flare (Volumetric Flow Rate)
8.1
scfm
Fugitive Biomethane Emissions Not Going to Flare (Mass Flow Rate)
8,796.46
g CH4 / hour
Flare Destruction Efficiency:
99.77
percent
Equivalent CO2e Emissions (GWP CH4 = 25)
219,911.61
g CO2e / hour
Annualized Equivalent CO2e Emissions from Uncombusted Flare Methane
1,649,337,056
g CO2e / year (A)
Total Biomethane and CO2 to Flare or water wash
501.80
scfm
"Pass Through" CO2 Emissions from Flare (Volume Basis):
497.04
scfm
Uncombusted Flare Methane Emissions
(Volume Basis):
0.00
scfm
Uncombusted Flare Methane Emissions
(Mass Basis):
0.00
g CH4 / hour
Equivalent CO2e Emissions (GWP CH4 = 25)
0.00
g CO2e / hour
Annualized Equivalent CO2e Emissions from Uncombusted Flare Methane:
0.00
g CO2e / year (B)
Combusted CO2 Emissions from Flare (CH4 + 2O2 ---> CO2 + 2H2O)
0.00
g CO2 / year (C)
"Pass Through" CO2 Emissions from Flare (Mass Basis):
14,508,417,557.48
g CO2 / year (D)
Secondary N2O Emissions from Flare
13,862,539
g N2O / year
Equivalent CO2e Emissions of N2O Emissions Above
4,131,036,624
g CO2e / year (E)
CTBC Process GHG (CO2e) Emissions (A + B + C + D + E)
20,288,791,327
g CO2e / year

Page 28 of 48
The total GHG emissions from the CTBC production and transport process consist of the
following:
Product gas compressor emissions estimated in Table VI-2 above;
GHG emissions from transmission of biomethane in the natural gas pipeline system that
conveys the biomethane from the CTBC plant to the utility company’s natural gas
distribution system estimated in Table VI-3 above; and
The CTBC process GHG emissions estimated in Table VI-4 above.
These emissions are summarized in Table VI-5 below.
Table VI-5
Total Process, Compression, and Transmission GHG Emissions
Process Segment
GHG Emissions
(g CO2e / year)
CTBC Process CO2e Emissions
20,288,791,327
Total Product Gas Compressor Emissions
2,500,007,000
Transmission to Pipeline
Emissions
536,387,008
Total Annual CTBC Process
GHG Emissions (g CO2e)
23,325,185,245.48
VII. Co-Product Biochar Operations
The solid residue that is left behind in the CTBC units after the gas is removed is called biochar.
Biochar is a solid material obtained from the carbonization of biomass. Carbonization is the
process of converting feedstock into biochar through reductive thermal processing. The process
involves a combination of time, heat, and pressure exposure factors that can vary between
processors, equipment, and feedstock.
Biochar may be added to soils with the intention to improve soil functions and to reduce emissions
from biomass that would otherwise naturally degrade to greenhouse gases. Biochar also has
appreciable carbon sequestration value. These properties are measurable and verifiable in a
characterization scheme, or in a carbon emission offset protocol.
Biochar is the carbon (C) rich product when green waste biomass, such as wood, or leaves, is
heated with little or no available oxygen. In more technical terms, biochar is produced by thermal
decomposition of organic material under limited supply of oxygen (O2), and at relatively low
temperatures (<700°C). This process often mirrors the production of charcoal, which is perhaps
the most ancient industrial technology developed by humankind. However, it distinguishes itself
from charcoal and similar materials by the fact that biochar is produced with the intent to be
applied to soil as a means to improve soil health, to filter and retain nutrients from percolating soil
water, and to provide carbon storage.

Page 29 of 48
Biochar is typically blended with a bulking agent that may comprise of compost or fresh soil,
and the combined material is then bagged and sold as a soil amendment.
The carbon sequestration potential of biochar is explained below.
A. Biochar Carbon Sequestration Biochar production represents a strategy to impact the release of CO2 from the breakdown of
organic matter in soil by converting organic matter into biochar using a process of thermal
stabilisation. Biochar decomposes and releases CO2 very slowly with long mean residence times
in soil, ranging from 1,000 to 10,000 years, with 5,000 years being a common estimate.10,11
Without thermal stabilization, the same biomass will release all the carbon it contains to the
atmosphere in a short period of time, with much of the carbon being lost within a few months
and with the majority of the carbon being lost within 10 years due to incorporation into soil,
agricultural burning, composting, or even use for biofuels.
Stabilisation of carbon in biochar represents an opportunity to remove CO2 from the atmosphere
by converting biomass into a stable form of carbon and preventing the release of this carbon back
to the atmosphere. Where prior management for biomass includes incorporation in soil,
production of biochar from this biomass represents an opportunity to lock in and stabilize the
carbon that decomposing biomass would otherwise release into the atmosphere.12
When added to soil, biochar continues to store carbon and enhance soil quality. Using biochar
can increase agricultural production without increasing cropped area, all the while reducing
fertilizer and water inputs.
Typically 80-90% of C added to soil as plant biomass will be lost as CO2 after 10 years. The
amount remaining after 10 years is influenced mainly by soil type and environmental factors.
Although the decomposition of plant material in soil is a complex process, simple models have
successfully described the long-term dynamics of soil C and are widely used to predict the
carbon that will remain from the organic matter applied to soil. Such models have informed both
national greenhouse inventory assessments and proposed carbon offset methodologies.
Biochar is formed when organic matter is heated in the absence of oxygen (or partially
combusted in the presence of a limited oxygen supply). The release of C when organic matter is
transformed into biochar differs markedly from non-transformed organic matter. Carbon is
released in three distinct phases, as biochar is produced and applied to soil: A) rapid release of
approximately 50% of the C in the feedstock during thermal transformation (i.e. during the
CTBC reaction); B) release of labile mainly volatile C through rapid biotic decomposition; and
10
Cheng, C., Lehmann, J., Thies, J., and Burton, S. (2008) Stability of black carbon in soils across a climatic
gradient J. Geophysical Res. Vol 113. G02027, 10 pp 11
Warnock, D. D. and Lehmann, J. (2007) ‘Mycorrhizal responses to biochar in soil – concepts and mechanisms’
Plant & Soil. vol 300. pp 9-20 12
Lehmann, J., Gaunt, J., Rondon, M. (2006) Biochar sequestration in terrestrial ecosystems – a review. Mit. Adapt.
Strat. Global Change, 11, pp 403-427.

Page 30 of 48
C) long-term slow release of C due biotic and abiotic breakdown of resistant C forms.
Table VII-1 gives the GHG Emission Reductions from the stable carbon contained in biochar. A
discussion of the methodology used to calculate the figures follows.
Table VII - 1
GHG Emission Reductions Units
Biochar – Stable Carbon .59 Mg CO2e / Mg-1 DM
Throughput (Dry Basis) 27,000 Tons / year
Annual Emission Reduction 14,451.45 Mg CO2e / year
Total Annual GHG Emission
Reductions from Biochar
Sequestration
14,451,452,908 g CO2e
The following analysis stems from a report on biochar carbon sequestration used by consultants
to calculate the biochar sequestration of Interra’s CTBC process. The criteria is currently being
vetted by the American Carbon Registry to establish a methodology for carbon credits for
biochar projects, due to be released in the Fall of 2014.13
1. Measurement of Long term Stable Carbon contained in Biochar
During the thermal transformation of biomass to produce biochar the structure of the organic
matter that was used as a feedstock is fundamentally transformed. The proportion of aromatic
structures increases and as temperatures increase these become increasingly ordered until
graphite like structures are formed (Downie et al. 2009). This transformation releases a portion
of C contained in the feedstock and the C remaining is rendered more stable than in the original
feedstock.
Longitudinal decomposition studies utilizing biochar to establish the long-term stable C
component are lacking. In the absence of such date there are a number of evidence sources that
can be used to inform our understanding of the longevity of biochar when added to soil. These
were reviewed by Lehmann et al. (2009) and the evidence was summarized by DeGryze et al.
(2010). Three general approaches have been adopted in the literature:
Rates calculated from incubation studies using “aged charcoal”. Soils containing
old charcoal (such as Amazonia Dark Earths) or samples of old / aged biochar are
studied to assess turnover.
Radiocarbon dating. Uses radiocarbon techniques to assess the age of biochar
samples or soils containing biochar.
Large scale C budgeting / balances . This approach has been applied at various
scales. With assumptions as to the rate of biochar formation the age and mean
residence time of biochar required to explain current levels of biochar in soil.
13
http://americancarbonregistry.org/carbon-accounting/methodology-for-biochar-projects
Page 31 of 48
Taken in isolation each of the approaches described above can be criticized and has flaws.
However, they represent reinforcing and independent sources of evidence that all point to a mean
residence time for biochar in soil of 100s to 1000’s of years. Recall that where the alternative
management is incorporation in soil under aerobic conditions residence time in soil is a ‘few’
years (Baldock and Smernik, 2002).
Despite the evidence that biochars are inherently stable, they contain a labile C component that is
accessible to biotic and abiotic oxidation processes in soil.
Thus, there are two requirements:
To establish that feedstock has been transformed from its original form into a more stable
biochar
To estimate the long term stable C contained in biochar.
2. Indicator of transformation of organic matter During the heating associated with the reaction and associated transformation of organic
structures the molar ratio of H:C and O:C decrease as connections to protons and OH groups are
shed.
Data summarized from a number of sources by Krull et al. (2009) showed that H:C and O:C
ratios tended to be highest in feedstock materials and low-temperature biochars, partially charred
plant materials and biochars produced during very short heating intervals. Lower ratios were
observed in naturally produced wood char, vegetation fire residues, biochar produced in the
laboratory under high temperatures, and/or prolonged heating
The H:C and O:C ratios decreases with increasing production temperature or prolonged heating.
The H:C ratio of unburned fuel materials, such as cellulose or lignin, is approximately 1.5.
Kuhlbusch and Crutzen (1996) used molar H:C ratios of ≤ 0.2 to define ‘black carbon’. Graetz
and Skjemstad (2003) concluded that temperatures during biomass burning are predominantly
greater than 400°C (smouldering combustion) and that chars formed during these temperatures
are likely to have H:C ratios of <0.5. Spokas
http://www.ars.usda.gov/SP2UserFiles/person/41695/Presentations/ISTC2010.pd summarized
the relationship between molar O:C and thermo-chemical conversion products as shown in the
schematic below.

Page 32 of 48
Figure 5: Biochar - Black Carbon Continuum
The H:C and O:C ratios can be measured using a procedure called Ultimate analysis, this is a
quantitative analysis in which percentages of all elements in the substance are determined.
International standards under ASTMS (www.astm.org) exist for ultimate analysis, the relevant
method is (ASTM D3176).
Therefore it is proposed that an O:C ratio of <0.6 measured by ASTM D3176 or equivalent be
used to indicate that the material has been transformed or stabilized through the CTBC process.
3. Estimation of stable C contained in biochar Whilst the stabilization of C in biochar is obvious and molar O:C ratios provide an indicator
thermal transformation, the C content measured by ultimate analysis is only a direct measure of
the C that remains in a biochar sample after transformation, it does not reflect the long term C
stable portion of biochar because it also includes the labile components.
As was discussed above the long term stable C is that portion that remains after the labile
components that are subject to biotic and abiotic oxidation processes when added to soil is lost.
Currently this is an area of considerable research and debate and no established method exists.
Incubation studies indicate that the amount released is typically small and it is released relatively
rapidly when biochar is added to soil. However, as expected this is influenced by feedstock and
process conditions.
A number of research groups are seeking to apply accelerated decomposition or oxidative
procedures to measure this labile component, however at this time this remains an active field of
study and no consensus exists.
Fixed C measured by proximate analysis has been proposed as a measure of stable C. Proximate
analysis involves establishing the loss of material as samples are heated to predefined
temperatures and typically reports volatile matter, fixed carbon, moisture content, and ash
present in a fuel as a percentage of dry fuel weight. International standards under ASTMS exist

Page 33 of 48
for this measure. ASTM D1672-84 measures volatile carbon by heating a sample to 950 Celsius
in an inert atmosphere and any matter that leaves is considered volatile matter. The ash is
generated by exposing the coal to air at 750 Celsius until all the available carbon is reacted to
carbon dioxide and any metal salts are converted to the corresponding metal oxides.
McLaughlin et al. (2009) argues that incremental carbonization and calcination of the biochar
sample, occurs whenever a char is heated above the highest treatment temperature (HTT) used in
its production. As most biochars will be produced at temperatures between 450 – 650 celsius
McLaughlin et al. (2009) proposed lowering the volatile matter – fixed carbon temperature to
450 Celsius, and the ashing temperature to 550 Celsius to minimize additional volatile
generation.
Using this approach the proportion of volatile C was between 0.3 and 17% of total C (calculated
as fixed + volatile C). Evidence of the relationship, if any, between Fixed C measured by
proximate analysis and long term stable C does not exist.
Given research to establish biochar specific measures are underway we propose to adopt a
conservative approach in the meantime. The fixed C measured by ultimate analysis is multiplied
by a factor as a conservative estimate of the stable component.
Stable C is taken as the C content measured by ASTM D3176 or equivalent * 0.85.
4. References:
Baldock and Smernik, (2002).
DeGryze et al. (2010).
Downie, A, Crosky, A and Munroe P. (2009). Physical properties of biochar in J. Lehmann and
S. Joseph (eds) Biochar for environmental management: science and technology. Earthscan. UK.
Graetz, R.D. and Skjemstad, J.O. (2003) ‘The charcoal sink of biomass burning on the Australian
continent’, CSIRO Atmospheric Research, Aspendale.
Kuhlbusch,T. A. J. and Crutzen, P. J. (1996) ‘Black carbon, the global carbon cycle, and
atmospheric carbon dioxide’, in J. S. Levine (ed) Biomass Burning and Global Change, MIT
Press, Cambridge, UK, pp 161–169.
Krull et al. (2009).
Lehmann, J., Czimczik, C., Laird, D., and Sohi, S. (2009) ‘Stability of Biochar in Soil’ J.
Lehmann and S. Joseph (eds) Biochar for environmental management: science and technology.
Earthscan. UK.
McLaughlin, H. Anderson, P. Shields F. and Reed T. (2009) All Biochars are Not Created Equal
and How to Tell Them Apart. http://cees.colorado.edu/biochar_characterization.html.
Spokas, K.A., Baker, J.M., Reicosky, D. 2010. Ethylene: Potential Key for Biochar Amendment
Impacts. Plant and Soil Journal. 333:443-452.

Page 34 of 48
VIII. Credits and Proposed Carbon Intensity
This sections draws heavily on a similar section developed by ARB staff for the HSAD Pathway.
A. Carbon Credit for Avoided Emissions
The breakdown of organic matter in a CTBC reactor is similar to the decomposition of that
material in a landfill. The difference between the two processes is that, in an artificially
controlled and closed environment such as a reactor, there is greater accountability for materials
and energy flows within system boundaries. The decomposition of organic matter primarily
yields methane and carbon dioxide gases, which are known to contribute to atmospheric
warming. The available research indicates that approximately 75 percent of the methane
generated in a landfill can be captured and routed to a flare or be consumed as fuel to power
vehicles and electrical generators (USEPA, 2008). The remaining 25 percent of the methane
escapes to the atmosphere as fugitive emissions, contributing to the trapping of heat in the
atmosphere.
The management of wastes at a landfill also produces emissions. Wastes are transported,
emplaced, and covered using heavy-duty diesel-powered equipment. LFG capture and leachate
management systems consume electrical energy. Over the longer term, landfills reach their full
waste storage capacity and must be decommissioned, and new landfill sites must be developed.
Research presented below (Barlaz and Levis, 2011) suggests that landfill and waste management
emissions rates are a function of the amount of waste processed. These emissions are related to
landfill construction, operations, gas and leachate management, long-term maintenance and
monitoring, and final cover placement, and their corresponding emissions factors are presented
in Table VIII-1 below:
Table VIII-1
Landfill Management Emissions Factors
Landfill Process
Emissions
Factor
Units
Converted
Units
Construction
1.4
kg CO2e / Mg
1,400
g CO2 / metric ton
Operations
3.9
kg CO2e / Mg
3,900
g CO2 / metric ton
Final Cover Placement
1.2
kg CO2e / Mg
1,200
g CO2 / metric ton
Gas and Leachate Management
0.31
kg CO2e / Mg
310
g CO2 / metric ton
Maintenance and Monitoring
0.06
kg CO2e / Mg
60
g CO2 / metric ton
Total
6.87
kg CO2e / Mg
6,870
g CO2 / metric ton
This landfill management emission factor is reasonable for increases or decreases in waste
volumes that are large enough to trigger corresponding increases or decreases in the amount of
equipment in use, or in the intensity of equipment utilization. Landfill operations are unlikely to
respond, however, to small changes in waste volumes. Interra believes that the diversion of

Page 35 of 48
green wastes from a medium-to-large landfill will not be enough to trigger changes in equipment
use, construction, and closure regimes. Although diversion of wastes to an CTBC facility has to
the potential to impact the transportation component of the life cycle analysis,14
emissions
reductions from reduced waste processing at the landfill will be accounted for in this CTBC
Pathway when and if the magnitude of the effect becomes clear in landfill emissions inventory
data.
By diverting organic wastes such as green wastes from a landfill, however, fugitive GHG
emissions from the landfill are avoided. By accounting for almost all of the material and energy
within the system boundary of an CTBC process, not only is a valuable transportation fuel and
soil amendment produced, but the impact of decomposing organic matter on the environment is
reduced and the production of biochar sequesters a large portion of the carbon content. This
greater accountability of material and energy flows makes it possible to estimate a CTBC carbon
credit that exceeds the flaring credit associated with the simple capture and use of landfill gas
(LFG). Hence, Interra will use the credit calculations that ARB staff has created in the HSAD
Pathway. ARB staff created a carbon credit model for avoided landfilling and composting
emissions from green wastes by accounting for the GHG emissions from the carbon contained in
the HSAD Pathway feedstock waste streams.
The carbon credit model developed from the schematic shown in Figure VIII-3 begins with the
simplifying assumption that green wastes are comprised of the cellulose monomer C6H10O5.
Actual green wastes also contain significant amounts of hemicellulose and lignin. The green
wastes making up the CTBC process feedstock stream are assumed to contain 40 percent
moisture. Given these two assumptions, the overall carbon fraction of the feedstock comes to
approximately 27 percent. Of that 27 percent, 36 percent is assumed to be stable and not
subject to rapid decomposition (Barlaz, 2008). As such, this fraction is considered to be
inactive and is excluded from subsequent GHG emissions estimates. All carbon except for this
fraction is assumed to undergo either anaerobic digestion or aerobic decomposition.
The assumptions about the alternative fate of green wastes will be summarized here:
75 percent of the methane generated in the landfill from green wasted would be
collected and flared;
The remainder escapes as fugitive emissions;
About 10 percent of the fugitive methane is oxidized to CO2 as it rises to the surface
of the landfill (Chanton et al. 2009);
The remaining 90 percent of the uncollected methane escapes to the atmosphere,
exacerbating the trapping of atmospheric heat; and
Of the green-waste-generated methane that is collected from
the landfill, 99 percent is destroyed by the flare and one percent passes through the
flare to the atmosphere intact.
14
The HSAD Pathway assumes that the AD facility would be sited adjacent to a landfill, thereby minimizing any
transportation distance differentials between the landfill and the AD facility. Interra assumes the same for the CTBC
facility.

Page 36 of 48
Figure VIII-1
Schematic of Natural Fate of Carbon in Green Waste
The total carbon credit for avoided landfilling and composting emissions when green wastes are
diverted is the sum of the carbon credits from the green waste model.
Under the CTBC Pathway, an annual throughput of 38,271.85 metric tons per year of green
wastes produces an estimated carbon credit of 21.2 billion g CO2e per year. Table VIII-1 below
presents a summary of the overall carbon credit for avoided emissions. The “Total Avoid

Page 37 of 48
Parameter
Value
Unit
Estimated Green Wastes Pre-Screened Annual Throughput
38,271.85
metric tons / year
Total Avoided Landfilling / Flaring / Composting Emissions (Green Wastes)
554,281
g CO2e / metric ton
Total Carbon Credit (Green Wastes)
21,213,362,736.79
g CO2e / year
Applicable Carbon Credit for CTBC Pathway
21,213,362,726.79
g CO2e /
year
Landfilling / Flaring / Composting Emissions” figure comes directly from the ARB staff
calculations in the HSAD Pathway.
Table VIII-2
Summary of Carbon Credits for Avoided Emissions
B. Co-Product Credit
The solid residue co-product (biochar) of the CTBC process contains organic nutrients that yield
a high-quality material that is marketed as a soil amendment. The market impact of fully
utilizing available resources by turning the feedstock into biochar is the displacement of
synthetically produced fertilizer. The magnitude of this displacement effect can be estimated
by assuming that the nutrients in the biochar product displace equal proportions of synthetically
produced nitrogen, phosphorus, and potassium (NPK). The net GHG savings from the
displacement of the synthetic fertilizer becomes the CTBC Pathway’s co-product credit.
ARB Staff has estimated the GHG emissions reduction benefit from the displaced NPK fertilizer
to be approximately 0.26 MTCO2e per ton of finished compost (ARB, 2011). Interra will
conservatively use this number. This is conservative because biochar is a permanent soil
enhancer, and will replace fertilizer for many years, while compost is a yearly replacement.
To calculate the emissions benefit, the basis must be changed from one ton of finished compost
to one ton of feedstock. In making this change, the amount of bulking agent added to the biochar
is subtracted. Interra estimates that the conversion factor to change the basis from one ton of
finished product to one ton of biochar is approximately 0.64. To account for the yield of
biochar, based on the mass of feedstock, staff estimate the conversion factor to be approximately
0.84. Therefore, the final compost emissions reduction factor (CERF) based on reduced
fertilizer use is estimated to be:

Page 38 of 48
CERF Annualized = 0.15 MTCO2e × 38,271.85 metric tons = 5,740.78 metric tons CO2e / year
Total Annualized Carbon Emission co-product credit:
= 5,740.78 metric tons CO2e × 1,000 kg × 1,000 g = 5,740,777,500 g CO2e / year
C. Tank-to-Wheel Emissions
The Tank-to-Wheel Emissions for the CTBC Pathway will be the same as for the HSAD
Pathway. As such, ARB staff estimates and figures from the HSAD Pathway are used. Staff
assumed that the biogas produced in the HSAD process and eventually refined to pipeline quality
biomethane would enter the transportation fuels market for natural-gas-fired heavy-duty vehicles,
such as transit buses, and cargo delivery trucks. Staff has assessed tank-to-wheel GHG
emissions based on the assumption that all carbon in the fuel would convert to carbon dioxide
(ARB, 2009c). Staff has further assessed CH4 and N2O emissions from combustion of
biomethane in the heavy-duty natural gas engine based on emissions factors of 0.0375 gram per
mile. These CH4 and N2O emissions were further evaluated at their global warming potentials of
25 and 298, respectively, to determine total TTW GHG emissions.
The tank-to-wheels emissions for this pathway are summarized in Table VIII-3 below:
Table VIII-3
Estimate of Tank-to-Wheel GHG Emissions
Parameter
Parameter Identifier
Value
Unit
Product Gas Produced
242,776,246
scf / year
Product Gas Energy Density
20.4
g / scf
Product Gas Energy
4,952,635,407
g / year

Page 39 of 48
Product Gas Carbon Content
0.724
g C / g Sales Gas
Product Gas Total Carbon Emissions
3,585,708,035
g C / year
CO2 Emissions
A
13,147,596,127
g CO2 / year
NGV Fuel Economy
4.8
MJ / mile
Annual Miles
50,343,529
miles / year
CH4 Emissions
1,887,882
g CH4 / year
CO2e Emissions
B
47,197,059
g CO2e / year
N2O Emissions
1,887,882
g N2O / year
CO2e Emissions
C
562,588,940
g CO2e / year
1% ―Pass Through‖
CO2 Emissions
D
138,942,783
g CO2e / year
Total TTW GHG
Emissions
A + B + C + D
13,896,324,909
g CO2e / year
D. Proposed Biomethane Fuel Carbon Intensity
In this section, all the CTBC life cycle emissions and credits discussed in previous sections will
be brought together so that the net pathway carbon intensity can be calculated. Those emissions
and credits break down as follows:
All well-to-tank process emissions, including upstream, fuel cycle emissions;
Electrical energy, including upstream fuel cycle emissions;
Carbon credits for avoided landfilling and composting emissions;
Co-product credit for the synthetic fertilizer displaced by the biochar co-product; and
Tank-to-wheels tailpipe GHG emissions.
A summary of all Well-to-Wheels emissions is presented in Figure VIII-4 below.

Page 40 of 48
Table VIII-4
Proposed CI for CTBC Pathway
Estimated Net Annual
Biomethane Production (scf /
year)
Fuel Energy Value
(MJ / year)
No. 2 Diesel Use
(gal / year)
Grid
Electricity Use (kWh /
year)
Natural Gas Use
(scf / year)
111,150,000
105,478,530
GHG Emissions Source
(g CO2e / year)
CTBC Process GHG Emissions 23,325,185,245.48
3,750,000
CTBC Wastes Loading Fossil
Fuel Use & Emissions
174,562,143
17,405
Total Fuel Cycle Electric Emissions
1,420,119,549
Total Low Sulfur Diesel
WTT Emissions
47,897,831
Total CTBC Process Emissions
24,967,764,768
GHG Emissions from CNG
Combustion in HDV (TTW)
13,896,324,909
Less Carbon Credit from Biochar
Carbon Sequestration
-14,451,452,908
Less Carbon Credit from
"MODEL"
-21,213,362,726.79
Less Compost Emissions
Reduction Factor (CERF)
-5,740,777,500
Net Annual GHG Emissions
-2,541,503,457
Proposed CTBC Pathway CI (g
CO2e/MJ):
-24.09
17,405
3,750,000
Based on the analysis in this report, staff estimates the CI of the biomethane fuel produced from
the clean thermal biomass conversion of green wastes to be -24.09 g CO2e / MJ of energy.
E. Conditions for Use of CI Value
Interra has stipulated some specific conditions that prospective users of this CTBC Pathway must
meet. These conditions are not only based on model parameters, but also intended to offer the
biofuel producer operating flexibility. These operating conditions are as follows:
The organic waste feedstock stream must consist of green wastes.

Page 41 of 48
The pathway applies only to fuel produced by a clean thermal biomass conversion
process operating at pressure. It does not apply to traditional thermal conversion
processes such as incineration, combustion, or gasification.
The annual organic waste throughput of the CTBC process must be equal to or greater
than 30,000 tons.
The process is based on the use of grid-based electricity generated from a marginal
energy mix with a CI at or below the CI associated with 78.7 percent natural gas and
21.3 percent renewables (excluding large hydroelectric and biomass-based generation).
If injected into a pipeline, the biomethane produced must conform to prevailing California
15 pipeline quality compositional and performance laws, regulations or
standards, including any specifications imposed by the regulated utility and transmission companies on parameters such as the Wobbe Index, and trace impurity levels of compounds such as hydrogen sulfide (H2S).
The product gas discharge pressure must be no greater than 800 psig for tie-into the
utility company’s transmission system.
The pathway co-product (Biochar) must not be used as a fuel source.
15
As mandated by the California Public Utilities Commission (PUC), California Energy Commission (CEC),
California Air Resources Board (ARB), or any other applicable State law.

Page 42 of 48
IX. References
ARCADIS U.S., 2012. Quantifying Methane Abatement Efficiency at Three Municipal Solid
Waste Landfills—Final Report, Prepared for Susan A. Thorneloe, U.S. Environmental Protection
Agency, Office of Research and Development, National Risk Management Research Laboratory,
Air Pollution Prevention and Control Division.
(EPA/600/R-11/033), January 2012.
Argonne National Laboratory and Life Cycle Associates LLC, 2009. California-Modified
Greenhouse Gases, Regulated Emissions, and Energy Use in Transportation Model (CA-
GREET), Version 1.8b, Systems Assessment Section, Center for Transportation Research, ANL,
December 2009. http://www.arb.ca.gov/fuels/lcfs/ca_greet1.8b_dec09.xls
Barlaz, 2008. "Corrections to Published Carbon Storage Factors for Mixed Municipal Waste,"
Barlaz, Morton A., NC State University, Raleigh, North Carolina, October 27, 2008.
http://www.epa.gov/ Barlaz and Levis, 2011. ―"Is biodegradability a Desirable Attribute for Discarded Solid Waste?
Perspectives from a National Landfill Greenhouse Gas Inventory Model,‖ Barlaz, M., and Levis,
J., Environ. Sci. Technol., 2011, 45 (13), 5470-5476.
California Air Resources Board, 2009a. ―Detailed California-Modified GREET Pathway for
Liquefied Natural Gas (LNG) from Landfill Gas,‖ Version 2.0, September 23, 2009.
California Air Resources Board, 2009b. "Emissions Calculation Methodologies for Natural Gas
Transmissions and Distribution," Staff Draft Report Prepared by the GHG Measures Section,
Measures Assessment Branch (SSD), See Method 15: Emissions from Compressors, October
2009.
California Air Resources Board, 2009c. "Detailed California Modified GREET Pathway for
Compressed Natural Gas," Appendix A, Section 5.1, February 2009.
California Air Resources Board, 2009d. "Staff Report: Initial Statement of Reasons for the
Proposed Regulation to Reduce Methane Emissions from Municipal Solid Waste Landfills,"
Stationary Source Division, Emissions Assessment Branch, (Page IV-5 / Appendix D), May
2009.
California Air Resources Board, 2011. "Method for Estimating Greenhouse Gas Emissions
Reduction from Compost of Commercial Organic Wastes," (Table 3: Fugitive CH4 and N2O
Emissions from Composting), Planning & Technical Support Division, November 2011.
CCR, 2012. California Code of Regulations, Title 14, Division 7 (Natural Resources), Chapter
3.1 (Composting Operations Regulatory Requirements), Article 7 (Environmental Health
Standards), Section 17868.3 (Specifications for Pathogen Reduction).
CalRecycle, 2007. California Department of Resources Recycling and Recovery, ―Emissions
Testing of Volatile Organic Compounds from Greenwaste Composting at the Modesto Compost

Page 43 of 48
Facility in the San Joaquin Valley,‖ October 2007.
http://www.calrecycle.ca.gov/Publications/default.asp?pubid=1263
CalRecycle, 2008. California Department of Resources Recycling and Recovery, ―Best
Management Practices for Greenwaste Composting Operations: Air Emissions Tests vs.
Feedstock Controls & Aeration Techniques,‖ October 2008.
http://www.calrecycle.ca.gov/Publications/default.asp?pubid=1301
CalRecycle, 2010. California Department of Resources Recycling and Recovery, ―Third
Assessment of California’s Compost- and Mulch- Producing Infrastructure—Management
Practices and Market Conditions,‖ Prepared by Integrated Waste Management Consulting, LLC,
Matthew Cotton, Principal Researcher. Publication # DRRR-2010-007, August 2010.
http://www.calrecycle.ca.gov/Publications/Organics/2010007.pdf
CalRecycle, 2011. California Department of Resources Recycling and Recovery, ―An
Investigation of the Potential for Ground-Level Ozone Formation Resulting from Compost
Facility Emissions,‖ February 2011.
http://www.calrecycle.ca.gov/Publications/default.asp?pubid=1369
California Fats, Oils and Grease Workgroup (CalFOG), n.d. Facilities Accepting Grease [a table
providing locations and phone numbers of facilities that accept deliveries of waste grease].
http://www.calfog.org/GreaseFacilities.html
Cascadia Consulting Group, 2010. ―California 2008 Statewide Waste Characterization Study,‖
http://www.calrecycle.ca.gov/Publications/General/2009023.pdf
Chanton, Jeffrey P., David K. Powelson, and Roger B. Green, 2009. "Methane Oxidation in
Landfill Cover Soils, is a 10% Default Value Reasonable?‖ Journal of Environmental Quality,
38:654–663, 2009.
Chynoweth D.P., C.E. Turick, J.M. Owens, D.E. Jerger, M.W. Peck, 1993. "Biochemical
Methane Potential of Biomass and Waste Feedstock." Biomass and Bioenergy, 5 (1), 95-111,
1993 (For Food Wastes).
Chynoweth, D.P., J.M. Owens, 1993. "Biochemical Methane Potential of MSW Components,"
Water Science and Technology, 27(2), 1-14, 1993 (For Green Wastes).
Climate Action Reserve, 2010. ―Organic Waste Composting – Project Protocol,‖ version 1.0,
June 30, 2010.
Davidsson, Asa, Gruvberger, Christopher, Christensen, Thomas H., Lund Hansen, Trine, Jes la
Cour, Jansen, 2007. "Methane Yield in Source- Sorted Organic Fraction of Municipal Solid
Waste," Waste Management, 27 (2007), 406-414, 2007.
De la Cruz, F.B. and Barlaz, M.A., 2010. "Estimation of Waste Component-Specific Landfill
Decay Rates Using Laboratory-Scale Decomposition Data," (Table 1), Environmental Science &
Technology, Volume 44, No. 12, 2010.

Page 44 of 48
Engineered Compost Systems (ECS), 2007.
Development of a Low Cost, Environmentally Compliant and Cost Effective On-Site Animal
Manure Management Composting Technology,‖ Phase I SBIR Grant Final Report (Proposal
Number 2007-01005), Seattle, Washington,
2007.
Gaunt, John, About the Interra Carbon Reset, White Paper (2012).
Harvest Power, n.d. ―High Solids Anaerobic Digestion, Company Brochure.
http://www.harvestpower.com/
Interra Energy, Clean Thermal Biomass Conversion – Technology Overview, Company
Brochure (2014).
Komilis and Ham, 2004. ―Life-Cycle Inventory of Municipal Solid Waste and Yard Waste
Windrow Composting in the United States,‖ Journal of Environmental Engineering (ASCE),
November 2004.
SJVUAPCD, 2011. San Joaquin Valley Unified Air Pollution Control District, Organic Material
Composting Operations, Adopted August 18, 2011.
http://www.valleyair.org/rules/currntrules/Rule4566CleanRule.pdf
Schievano / Scaglia / D'Imporzano / Malagutti / Gozzi / Adani, 2009. "Prediction of Biogas
Potentials Using Quick Laboratory Analyses: Upgrading Previous Models for Application to
Heterogeneous Organic Matrices,‖ Bioresource Technology, 100 (2009) 5777-5782, 2009.
Sher, 1989. Assembly Bill 939, California Code of Regulations, Public Resources Code, Section
40050-40063. http://www.leginfo.ca.gov/
Solomon et al, 2007. ―Climate Change 2007: The Physical Science Basis,‖ Technical Summary,
.Contribution of Working Group I to the Fourth Assessment Report of the Intergovernmental
Panel on Climate Change, Solomon, S., Qin, D., Manning, M., Alley, R.B., Berntsen, T.,
Bindoff, N.L., Chen, Z., Chidthaisong, A., Gregory, J.M., Hegerl, G.C., Heimann, M., Hewitson,
B., Hoskins, B.J., Joos, F., Jouzel, J., Kattsov, V., Lohmann, U., Matsuno, T., Molina, M.,
Nicholls, N. , Overpeck, J., Raga, G., Ramaswamy, V., Ren, J., Rusticucci, M., Somerville, R.,
Stocker, T.F., Whetton, P., Wood, R.A., and Wratt, D.,. In: Cambridge University Press,
Cambridge, UK, and New York, USA, 2007.
SCAQMD, 2003. South Coast Air Quality Management District, Rule 1133, Composting and
Related Operations, Adopted January 10, 2003. http://www.aqmd.gov/rules/reg/reg11/r1133.pdf
USEPA, 2008. U.S. Environmental Protection Agency, Technology Transfer Network (TTN),
Clearinghouse for Inventories and Emissions Factors (CHIEF), AP-42, 5th
Edition, Compilation

Page 45 of 48
of Air Pollutant Emission Factors (Chapter 2), November 2008. http://www.epa.gov/ttnchie1/ap42/ch02/final/c02s04.pdf
Yepsen, Rhodes, 2012, ―Residential Food Waste Collection in the U.S.,BioCycle Magazine, 53
(1): 23, January 2012.

Page 46 of 48
Appendix A
Additional Supporting Documentation

Page 47 of 48
I. Appendix Figure A-1: Pathway Supplemental Questions

Page 48 of 48
II. Appendix Figure A-2: Facility Information