Embed Size (px)
Citation preview

ADM Method 2B Submission – May 18, 2011 rev Page 1
M E T H O D 2 B P A T H W A Y
C A L I F O R N I A L O W C A R B O N F U E L S T A N D A R D
GENERAL INFORMATION
Applicant: Archer Daniels Midland Company 4666 Faries Parkway Decatur, IL 62526 LCFS Business Partner ID Code: 4888 (same as EPA Code)

ADM Method 2B Submission – May 18, 2011 rev Page 2
TABLE OF CONTENTS
General information ............................................................................................................................................................... 1
Background ........................................................................................................................................................................... 3
Method 2A and 2B Application Form - draft ................................................................................................................ 4
ADM Dry Grind Ethanol Process description ............................................................................................................. 11
Corn Milling ......................................................................................................................................................................... 11
Starch Conversion ............................................................................................................................................................ 11
Fermentation ...................................................................................................................................................................... 11
Distillation and Dehydration ........................................................................................................................................ 12
Stillage Processing ............................................................................................................................................................ 12
Feed Products from Stillage Processing .................................................................................................................. 13
Dry Mill Process Flow Diagram ................................................................................................................................... 15
ADM Dry Mill Energy BTU per Gallon Calculation ................................................................................................... 16
Cogeneration / combined Heat and Power ................................................................................................................ 19
CA-GREET Model Scenarios .............................................................................................................................................. 21
Appendices:
Appendix A: Columbus, NE - Dry Mill Air Construction Permit
Appendix B: Columbus, NE - Cogen Air Construction Permit
Appendix C: CA-GREET Electronic Files

ADM Method 2B Submission – May 18, 2011 rev Page 3
BACKGROUND
Archer Daniels Midland Company (ADM) has constructed two new dry mill facilities. One facility is located in Columbus, Nebraska and the other facility is located in Cedar Rapids, IA. Both facilities are located adjacent to an ADM corn wet mill and a combined heat and power plant. Combined heat and power is also commonly referred to as cogeneration. These “sister” dry mill facilities also have similar design and operational characteristics. However, the Cedar Rapids, IA facility does have some differences from Columbus such as fuels combusted in the cogeneration. As a result, this submission only addresses the Columbus, NE dry mill at this time. Based on communications with CARB, this application will be updated to include the Cedar Rapids, IA facility in the near future.
These plants have three unique processes for dry mills, which form the basis for the new pathway request and these include the use of advanced process technology and heat integration for reduced process energy, solid fuel fired cogeneration, and specifically co-firing of biomass. Additional information is provided for each of these in this application.
Due to these factors, there is not a current pathway that accurately describes these new dry mills. There isn’t a pathway for any dry mill that uses coal and/or cogeneration and the energy requirements used to establish the current pathways are significantly different than these new facilities. Therefore, the Method 2B application requests a new pathway for these processes.
This revised submission adjusts a couple of process input parameters, primarily the overall energy for fuel ethanol production and the energy share percents. The changes are based on a discrepancy identified in the original documentation used for the analysis and actual operational data. These changes are to the input values only. The lowered energy requirement coupled with the higher coal percentage offset each other resulting in minor change to the overall carbon intensity. In all cases, the carbon intensity values are less than the original case, and ADM is requesting this minor change in pathway values.
This document contains trade secret / confidential information which are indicated by red text. The information reported under the contact information in this application should be used if there are questions concerning it. A public version of this document with the trade secret information redacted is also provided with this copy.

ADM Method 2B Submission – May 18, 2011 rev Page 4
METHOD 2A AND 2B APPLICATION FORM - DRAFT
I. Application Submission Date: November 5, 2010 (Original); May 18, 2011 (Revised)
II. Company Contact Information
a. Company Name: Archer Daniels Midland Company
b. Mailing Address:
Address Line 1 4666 Faries Parkway
Address Line 2
City Decatur
State/Province IL
Zip/Postal Code 62526
c. Main Company Phone Number: 800-637-5843
d. Secondary Company Phone Number: 217-424-5200
e. Fax number: 217-451-7415
f. Company Web Site URL: www.adm.com
g. Primary Method 2A/2B Contact Person:
Name: Dean Frommelt
Position/Title: Divisional Manager Environmental
Email Address: [email protected]
Office Phone Number: 217-451-6330
Mobile Phone Number: 217-358-0317
Fax Number: 217-451-7415
h. Consultant/Third Party Application Preparer:
Name: n/a
Position/Title: n/a
Affiliation/Firm: n/a
Email Address: n/a
Office Phone Number: n/a

ADM Method 2B Submission – May 18, 2011 rev Page 5
Mobile Phone Number: n/a
Fax Number: n/a
Consulting entity’s web site URL: n/a
i. LCFS Reporting Tool Organization ID code (if known):
j. U.S. Environmental Protection Agency (U.S. EPA) Company ID (if known): 4888
k. U.S. EPA Facility ID (if known):
III. Pathway Information
a. Pathway application type. Applicants are encouraged to discuss their pathway application types with ARB staff before proceeding. Please check one box only.
Method 2A: Sub-pathway Method 2B: New Pathway
b. Brief description of proposed pathway. Please emphasize the important innovations and/or distinctive characteristics associated with the proposed pathway or sub-pathway
The proposed pathways are based on ADM design information considering equipment and operational constraints. The operational constraints are based on annual average values (e.g., 27 % overall feed moisture) and average ethanol production of 851,307 gallons per day for 352 days per year. Carbon Intensities from CA-GREET are noted in parenthetical following each pathway. Additional details regarding the pathways are found later in this document.
Pathway:
1. Midwest, Dry Mill, Dryer Closed-loop Heat Recovery, Cogeneration - Coal (90.99)
a. Supplemental fuel pathway: 5% biomass (89.08) b. Supplemental fuel pathway: 10% biomass (87.16) c. Supplemental fuel pathway: 15% biomass (85.24)
2. Midwest, Dry Mill, Dryer Closed-loop Enhanced Heat Recovery, Cogeneration – Coal (89.80)
a. Supplemental fuel pathway: 5% biomass (87.86) b. Supplemental fuel pathway: 10% biomass (85.91) c. Supplemental fuel pathway: 15% biomass (83.96)

ADM Method 2B Submission – May 18, 2011 rev Page 6
c. For Method 2A Applications only
1. Reference pathway (Existing fuel pathway to which the proposed new sub-pathway is most closely related). The carbon intensity of the reference pathway must be higher by at least 5 gCO2e/MJ than the carbon intensity of the proposed pathway described in this application. Show all pathway information exactly as it appears in the LCFS Lookup Table:
Fuel: n/a
Pathway Description: n/a
Carbon Intensity Values (gCO2e/MJ): n/a
Direct Emissions: n/a
Land Use or Other Indirect Effect: n/a
Total: n/a
2. Compositional differences (if any) between the fuel produced by the new sub-pathway and the reference pathway identified in item c, 1, above).
n/a – Method 2B
d. Final carbon Intensity of the proposed pathway or sub-pathway:
See question III.b.
e. Annual volume of fuel that would be produced using the proposed new sub-pathway (millions of gallons per year [MGY]).
The Columbus dry mill is permitted to produce approximately 400 MGY.

ADM Method 2B Submission – May 18, 2011 rev Page 7
1. This production volume is expected to be achieved within how many years from the start of production?
The facility commenced operations and typical rates are expected to be achieved during 2011.
2. Does the applicant expect this volume be achieved by a single or by multiple facilities?
A single facility Multiple facilities
3. If the applicant expects this volume to be achieved by multiple facilities, would all facilities be owned by a single firm?
Single firm Multiple firms
f. Lower Heating Value of the fuel to be produced from new sub-pathway (megajoules per gallon):
Undenatured Ethanol – 80.53 megajoules per gallon
g. The range of production volumes over which the proposed pathway carbon intensity value is valid. The values reported below must be supported in the documentation accompanying this application.
Fuel Volume Units (gallons; litres; joules,etc.)
Lower bound of production volume range 0 Gallons
Upper bound of production volume range 400 Million Gallons per
year per facility

ADM Method 2B Submission – May 18, 2011 rev Page 8
h. Please provide any information that may be helpful in determining the land use change impacts (if any) of the proposed pathway. Although it is ARB’s responsibility to perform all land use change impact analyses, the applicant may provide any information that may be useful to the ARB in completing that analysis.
This new pathway will not change the land use impacts for corn ethanol.
IV. Application Submittal Checklist. Listed below are the documents and files that may be submitted in support of a method 2A/2B application. Check the box to the left of each document or file type included in your submittal. After each submittal category is a check box labeled “includes trade secrets.” Check that box if the submittal category contains any information the applicant considers to be a trade secret. In the actual submittal, the specific information falling into the trade secret category must be clearly marked. Additional information regarding the submission of trade secrets can be found in the Instructions above.
Life cycle analysis report
Includes trade secrets
Engineering reports
Includes trade secrets
Equipment technical specifications
Includes trade secrets
Production process schematics, technical drawings flow diagrams, maps, or other graphical representations
Includes trade secrets

ADM Method 2B Submission – May 18, 2011 rev Page 9
Technical papers or journal articles
Includes trade secrets
Emissions monitoring data or emissions modeling results
Includes trade secrets
Spreadsheets, data files, and similar files documenting the calculations behind the fuel life cycle analysis
Includes trade secrets
Other: In the space below, describe any additional submittals. Rationales for documents submitted or omitted may also be provided.
Includes trade secrets

ADM Method 2B Submission – May 18, 2011 rev Page 10
ARB Method 2A and 2B Application Process Contacts
Name Phone Number E-mail Address
John Courtis 916-323-2661 [email protected]
Wes Ingram 916-327-2965 [email protected]
Chan Pham 916-323-1069 [email protected]
Kevin Cleary 916-323-1009 [email protected]
Alan Glabe 916-323-2416 [email protected]

ADM Method 2B Submission – May 18, 2011 rev Page 11
ADM DRY GRIND ETHANOL PROCESS DESCRIPTION
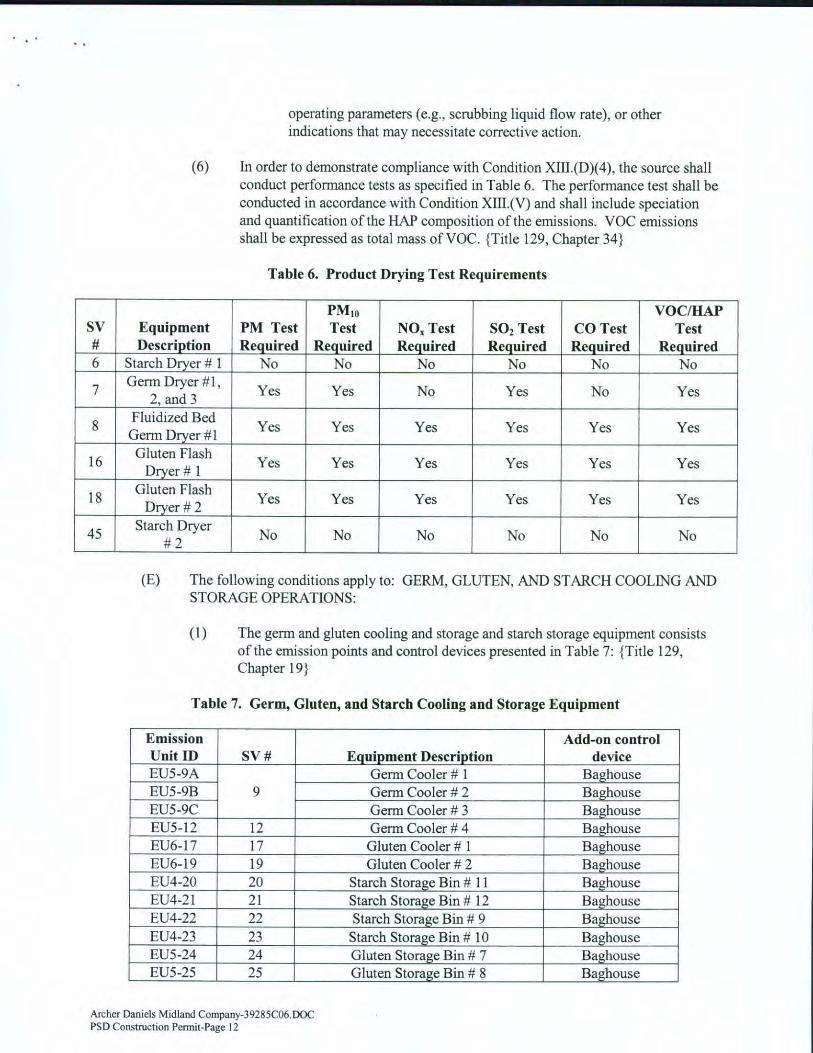
Utilizing the dry-grind method of ethanol production, processors can produce about 2.7 gallons of ethanol from a bushel of corn. Continued improvements to process will move this number closer to 2.8 in near future. But current plant design energy numbers are based on the 2.7 to be conservative. Overall the ADM dry mill process operation is similar to those reviewed by CARB for the other ethanol pathways with the exceptions noted below which includes the heat recovery systems for distillation/dehydration, evaporation, and co-product drying. A process flow diagram that generally corresponds to the process steps below is attached as Figure 3. This figure also identifies the major combustion sources (i.e., dryers, flare, RTO) in the dry mill by the fuel input labels which are all natural gas. Typical natural gas usage for the dry mill is shown in Figure 4. Combustion sources for the Cogeneration facility are discussed under that section.
CORN MILLING
In the ADM facility the entire corn kernel is ground into a coarse flour, then slurried with water to form a "mash." The mash is then cooked, treated with enzymes, fermented and distilled. Products of the dry-grind process include distillers grains and ethanol.
STARCH CONVERSION
Corn endosperm starch cannot be utilized directly by yeast. It must first be broken down into simple sugars prior to fermentation. In order to accomplish this conversion, enzymes are added to the mash during cooking. The first step in breaking down the starch molecule utilizes an alpha-amylase enzyme and steam (gelatinization and liquefaction). The next step involves adding gluco-amylase enzymes at a lower temperature to produce smaller fermentable sugars (saccharification). ADM utilizes continuous cooking which is generally more energy efficient as the flash steam can be used as heat source directly in the process from this unit operation. Discharge from this steam heated source is also heat recovered via a series of heat exchangers to minimize steam usage.
FERMENTATION
After starch conversion has been initiated, the mash is transferred to fermenters where yeast (Saccharomyces cerevisia) is added to the converted corn endosperm starch to produce ethanol.
ADM utilizes a continuous fermentation system in order to minimize hardware and water usage which in turn reduces the overall plant evaporation and distillation energy requirements.

ADM Method 2B Submission – May 18, 2011 rev Page 12
DISTILLATION AND DEHYDRATION
Distillation is the process of separating the ethanol from the solids and water in the mash. Conventional distillation/rectification methods can produce 95% pure (190 proof) ethanol. In the ADM design there is a reduction in energy in running l he rectifier and utilizing the addition of pressurized 3 bed molecular sieve system. s
The rate of this undenatured Ethanol is gallons per hour. Condensing this s BTU/hr. When you divide this BTU/hr number by production non-denatured gallons per hour you get BTU/gallon undenatured ETOH energy savings utilizing this improved molecular sieve system with heat recovery system. The anhydrous ethanol is then blended with about approximately 2% denaturant (such as gasoline) to render it undrinkable and thus not subject to beverage alcohol tax.
STILLAGE PROCESSING
The solid and liquid fraction remaining after distillation is referred to as “stillage”. Stillage includes the fiber, oil and protein components of the grain, as well as the non-fermented starch. The “thin stillage” is separated from the insoluble solid fraction using centrifuges. The thin stillage is then sent to evaporators to remove excess water. In the ADM design this is 3 different reboiler systems.
1. Steam reboiler system 2. Waste heat from Dryer (process steam) 3. 4. Stillage (Dedert design) MVR (mechanical vapor recompression) primary
evaporation http://www.dedert.com/evaporator.htm 5. This preconcentrated evaporator is then concentrated to final DS target by HPD MVR
(mechanical vapor recompression) evaporation system.

ADM Method 2B Submission – May 18, 2011 rev Page 13
FIGURE 1 Stillage evaporation system including falling film evaporator train and high solids concentration system (reference: http://www.hpdsystems.com/en/industries/industrysolutions/ethanolbiofuels/)
Published and Documented MVR Evaporation Benefits:
• Steam and overall energy consumption was significantly reduced compared to conventional steam heated evaporator systems with the same capacity.
• Cooling water requirements were reduced • The main vacuum system for the evaporator system was reduced in horsepower, capacity
and size compared to one required without use of a MVR • Higher condensate temperatures provide additional steam savings by providing hot water
(185-190 F) source for use in the process.
After evaporation, the thick, viscous syrup is mixed back with the solids to create a feed product known as Wet Distillers Grains with Solubles (WDGS).
FEED PRODUCTS FROM STILLAGE PROCESSING
WDGS, containing 65% moisture, can be used directly as a feed product. In fact, it is often favored by dairy and beef feeders because cattle seem to prefer the moist texture. However, WDGS has a shelf life of only one to two weeks. To increase shelf life and lower transportation costs, WDGS is usually dried to 10 to 12% moisture to produce a product known as Dried Distillers Grain with Solubles (DDGS). Drying distillers grains is energy-intensive, consuming about one-third of the energy requirements of the entire dry-grind plant. With recent technology improvement and closed loop superheated steam dryers this energy is recovered area to displace traditional steam from boilers or Cogeneration in the case for the Columbus facility.

ADM Method 2B Submission – May 18, 2011 rev Page 14
FIGURE 2 Indirect-fired SSD dryer – ring (reference: http://www.barr-rosin.com/applications/solids drying.asp)
This is an important breakthrough as producing a uniform, stable, high-quality feed co-product is essential to the profitability of the plant. The Columbus NE facility has the advantage of a very well developed, local wet feed market for cattle. Design for the Columbus, NE facility is yearly average moisture of . Steam from the feed dryers is condensed in reboilers . At a Wet Bulb (or higher based on recent information) this condensed approximately % of steam from this source according to process instrumentation and Aspen model validation. Or in energy terms we generate lb/hr steam at psig. Condensate from reboilers would be
lb/hr or BTU/hr recovered to process. When you divide this BTU/hr number by production non-denatured gallons per hour you get BTU/gallon undenatured ETOH energy savings utilizing this improved drying technology. This range of BTU per gallon is substantiated in the article at the following link. http://www.usda.gov/oce/reports/energy/2008Ethanol June final.pdf

ADM Method 2B Submission – May 18, 2011 rev Page 15
DRY MILL PROCESS FLOW DIAGRAM

ADM Method 2B Submission – May 18, 2011 rev Page 16
ADM DRY MILL ENERGY BTU PER GALLON CALCULATION
In reviewing the USDA model for Dry Grind ETOH it is clear from this model that the Dryer steam is not recovered and hence accounts for the majority of the difference between the ADM design and the results presented in this effort. In the USDA model Ethanol final product is condensed on the regeneration stream from a molecular sieve. ADM uses this heat to directly displace steam in distillation reboilers and is able to preheat the same purge stream at the same time. It is able to accomplish this because of the difference in evaporation types. ADM utilizes a Mechanical Vapor Recompression (MVR) evaporator whereas the USDA utilized a less capital intensive and operationally intensive multi-effect evaporator. The difference of the two approaches is that ADM has a much higher temperature condensate to be used back in the process. This excess heat allows the ethanol final product to reduce the BTU/gallon ethanol number as detailed below. Contrasting the USDA model to ADM’s more capital intensive facilities, suggests that ADM has installed and utilizes several additional heat recovery heat exchangers beyond the USDA more basic design. The typical Midwest ethanol dry mill analyzed in CA Greet uses 36,000 BTU/Gallon which is also consistent with the USDA model for dry mill ethanol plants. These plants do not incorporate the dryer steam heat recovery or the distillation/dehydration heat recovery. Subtracting the energy savings associated with these technologies results in a value equivalent to the ADM design value. Typical Midwest Dry Mill 36,000 btu/gal Dryer Heat Recovery btu/gal Typical Midwest Dry Mill w/ADM Heat Recovery btu/gal
Distillation/Dehydrations Heat Recovery btu/gal
ADM Dry Mill Design Value (facility gate) btu/gal Due to the heat recovery integration, particularly the heat from the dryer system, there is minimal difference in the overall plant energy demand whether wet or dry feed is produced. The reason for this is the steam produced in the closed-loop dryers is displacing steam required from the coal boilers. The closed-loop dryer natural gas burners have a higher efficiency than the coal fired cogeneration boilers. As summarized below there is only a btu/lbs steam or about % difference between distillation steam supplied by the cogeneration boilers versus steam generated from the dryers.
% Cogeneration Steam BTU required/lb Steam in
Cogeneration Efficiency 970 BTU/lb water condensed
1293.33 Required Coal BTU's for 970 BTU/lb steam
% Dryer Efficiency BTU/lb Water Evaporator in Dryer Percent that can be condensed in at Wet Bulb (worst case)
Equivalent BTU input required per usable lb steam in via Dryer steam Discharge Difference in BTU/lb steam

ADM Method 2B Submission – May 18, 2011 rev Page 17
ADM produces different feed products and is continually working with customers to develop new blends to meet their needs. These products include Distillers Dry Grain Solubles, 40 DS Modified, 60 DS Modified, Corn Condensed Distillers Solubles and a modified blend with wet mill wet feed called Golden Synergy. The type of feed product produced varies at any given time based on market demand, equipment operations and other issues which many times cannot be controlled by the facility. Market demand and moisture tolerances can also vary depending on the time of year. Because of the interdependency of operations for feed and ethanol production, minimal difference in energy required to produce the different feed products, the ability to obtain an accurate energy split between feed products and market variability, ADM does not differentiate in energy for each product. Figure 4 represents the most recent snapshot of energy tracking for the facility. As indicated by the trend line, the energy usage continues to improve as the facility continues through the start-up process. As the ethanol production rate increases, there is a corresponding decrease in energy per gallon. This is due to the increased efficiencies of operating at a higher rate. As the start-up issues are addressed the production rate will continue to increase and stabilize.

ADM Method 2B Submission – May 18, 2011 rev Page 18
FIGURE 4 Columbus Dry Mill Energy Tracking
Etha
nol
Gal
lons
/ D
ay
Proc
ess
BTU
/ G
allo
n
Columbus Dry Mill Energy Trends
Total BTU/Gal EtOH Natural Gas BTU/Gal EtOH Steam BTU/Gal EtOH
Elec BTU/Gal EtOH EtOH Production

ADM Method 2B Submission – May 18, 2011 rev Page 19
COGENERATION / COMBINED HEAT AND POWER
Cogeneration (COGEN) or combined heat and power (CHP) plants allow a simultaneous production of electricity and useful thermal energy (steam) using a single source of primary energy (natural gas, coal, biomass) and offers significant efficiency improvements over separately producing same amounts of electric and thermal energy. Figure 5 below describes the efficiency improvements for a COGEN plant in comparison to individual heat and power plants.
FIGURE 5 COGEN Efficiency Improvements: (a) Separate heat and power system with 100 units fuel inputs; (b) Combined heat and power (COGEN) system with 100 units fuel inputs. ( 1
Such a plant offers excellent synergies for large chemical plants with multiple production facilities (e.g. Combined Petroleum Refinery & Petrochemical Complex). ADM’s operations in Columbus, NE can be considered analogous to a Petroleum Complex, with a Wet Mill and Dry Mill co-located on the same site.
)
In such an operation, steam and electricity generation can be optimized to meet process energy demands from various onsite plants and at the same time, it provides COGEN the flexibility to meet these demands without sacrificing optimal performance.

ADM Method 2B Submission – May 18, 2011 rev Page 20
The cogeneration (COGEN) plant at Columbus, NE serves the dry and wet mill operations. The steam produced from the COGEN is capable of supplying the needs for the Dry mill and Wet mill. However, COGEN electricity is solely consumed by the dry mill and any additional electricity that may need to be purchased would be for the wet mill.
The Columbus COGEN plant is comprised of two high-pressure circulating fluidized bed (CFB) boilers with a single backpressure turbine generator. The CFB boilers are currently fueled by North Antelope Rochelle mine coal, which is located in the Powder River Basin (PRB) region of United States. These boilers are designed and permitted to co-fire up to 20% biomass with coal. While no co-firing has been done so far in Columbus, dried biomass from the onsite process wastewater treatment plant, agricultural seeds and corn stover have been co-fired in Cedar Rapids COGEN, without any difference in its performance.
The combination of high-pressure boilers and backpressure turbines are proven to provide significant efficiency improvements and cost savings over conventional low pressure boilers (2). Columbus COGEN operation in its current operation has an overall efficiency of approximately
%a
Columbus COGEN operation is working to increase the co-firing of biomass fuels such as agricultural seeds, dried waste biomass, and other sources of biomass, which will further reduce CO2 emissions from cogeneration of steam and electricity, because of the carbon-neutral nature of such biomass sources. It is important to note that seed being burnt in COGEN is generally end of year inventory of unsold seed or out of specification which historically has been managed through incineration.
.
a COGEN Efficiency = (Dry Mill Steam BTU+Dry Mill Electric BTU+Wet Mill Steam BTU)/(Coal BTU+Dry Mill Condensate Return BTU+Wet Mill Condensate Return+Make-up water BTU)

ADM Method 2B Submission – May 18, 2011 rev Page 21
CA-GREET MODEL SCENARIOS
Table 1 lists the user design inputs that were changed in CA-GREET for ADM pathway Midwest, Dry Mill, Dryer Closed-loop Enhanced Heat Recovery, Cogeneration – Coal and the biomass pathways. All other parameters are unchanged for the proposed sub-pathway including raw materials, ethanol energy content and land use change.
TABLE 1 User design inputs for CA-GREET and ADM Pathway MIDWEST, DRY MILL, DRYER CLOSED-LOOP ENHANCED HEAT RECOVERY, COGENERATION - COAL
CA-GREET Worksheet
Cell Reference
Input Units CA-GREET Value
ADM Pathway 1 Value
Inputs B4 Target Year of Simulation
2010 2010
Fuel_Prod_TS C271 EtOH Yield of Corn Dry Mill EtOH Plant
gal/bushel 2.72 2.70
Inputs C244, D244 Share of corn ethanol plant types
% 85% dry mill, 15% wet mill
100% dry mill, 0% wet mill
Fuel_Prod_TS K271 Total ethanol energy use (undenatured)
BTU/gal 36,000
Inputs C247 Electricity share of process fuel
% 10.2% 0%
Fuel_Prod_TS S271 Share of Coal in total process fuels
% 20% Base: 70.52% 5% Biomass: 64.36% 10% Biomass: 58.19% 15% Biomass: 52.02%
Inputs C255 Share of NG as Process Fuel
% 100% 29.48%
Inputs C256 Share of Coal as Process Fuel
% 0% Base: 70.52% 5% Biomass: 64.36% 10% Biomass: 58.19% 15% Biomass: 52.02%
Inputs E255 Biomass as Process Fuel
% Base: 0% 5% Biomass: 5% 10% Biomass: 10% 15% Biomass: 15%
Inputs C262 Share of Biomass used as process fuel: Corn Stover
% 100% 100%
EtOH C101 DGS Yield bone-dry lb. per gallon EtOH
5.34 5.87

ADM Method 2B Submission – May 18, 2011 rev Page 22
CA-GREET Worksheet
Cell Reference
Input Units CA-GREET Value
ADM Pathway 1 Value
Regional LT H192 Midwest – Coal LHV
BTU/short-ton
19,546,300 16,497,700
Regional LT H193 Midwest – Coal HHV
BTU/short-ton
20,608,570 17,366,000
Regional LT H194 Midwest – Coal Carbon Content
% wt 63.7% 47.8%
Regional LT H195 Midwest – S ratio
ppm by wt 11,100 4,000
TABLE 2 Total Well to Tank (WTT) emissions for Dry Milling Corn Ethanol production under ADM Pathway MIDWEST, DRY MILL, DRYER CLOSED-LOOP ENHANCED HEAT RECOVERY, COGENERATION - COAL
Results are specified as BTU or grams per MMBTU of Ethanol Corn Ethanol: Dry Milling Ethanol
Total WTT (well to tank) results
Corn w/o loss
factor Corn w/ loss
factor Ethanol
Loss factor
1.001
Total energy 181,068 181,159
Fossil fuels 176,104 176,193
Coal 25,091 25,104
Natural gas 85,581 85,624
Petroleum 65,433 65,466
VOC 16.214 16 54.214 70
CO 146.284 146.358 29.958 176
NOx 70.852 70.888 92.264 163
PM10 7.807 7.811 80.164 88
PM2.5 4.059 4.061 26.278 30
SOx 32.609 32.626 53.306 86
CH4 16.826 16.834 47.449 64
N2O 40.366 40.386 0.255 41
CO2 14,567 14,574 33,961 48,535
GHG Emissions 27,030 35,223 62,253
Total Direct Emissions 59.00 g CO2/MJ EtOH Land Use Change 30 g CO2/MJ EtOH Denaturant (CARBOB blended
at 2% with anhydrous EtOH) 0.8 g CO2/MJ EtOH Total Carbon Intensity 89.80 g CO2/MJ EtOH

ADM Method 2B Submission – May 18, 2011 rev Page 23
TABLE 3 Total Well to Tank (WTT) emissions for Dry Milling Corn Ethanol production under ADM Pathway MIDWEST, DRY MILL, DRYER CLOSED-LOOP ENHANCED HEAT RECOVERY, COGENERATION – COAL AND 5% BIOMASS
Results are specified as BTU or grams per MMBTU of Ethanol Corn Ethanol: Dry Milling Ethanol
Total WTT (well to tank) results
Corn w/o loss
factor Corn w/ loss
factor Ethanol
Loss factor
1.001
Total energy 181,068 181,159
Fossil fuels 176,104 176,193
Coal 25,091 25,104
Natural gas 85,581 85,624
Petroleum 65,433 65,466
VOC 16.214 16 54.206 70
CO 146.284 146.358 30.114 176
NOx 70.852 70.888 91.345 162
PM10 7.807 7.811 74.594 82
PM2.5 4.059 4.061 24.430 28
SOx 32.609 32.626 49.047 82
CH4 16.826 16.834 44.913 62
N2O 40.366 40.386 0.515 41
CO2 14,567 14,574 31,892 46,466
GHG Emissions 27,030 33,168 60,198
Total Direct Emissions 57.06 g CO2/MJ EtOH Land Use Change 30 g CO2/MJ EtOH Denaturant (CARBOB blended
at 2% with anhydrous EtOH) 0.8 g CO2/MJ EtOH Total Carbon Intensity 87.86 g CO2/MJ EtOH

ADM Method 2B Submission – May 18, 2011 rev Page 24
TABLE 4 Total Well to Tank (WTT) emissions for Dry Milling Corn Ethanol production under ADM Pathway MIDWEST, DRY MILL, DRYER CLOSED-LOOP ENHANCED HEAT RECOVERY, COGENERATION – COAL AND 10% BIOMASS
Results are specified as BTU or grams per MMBTU of Ethanol Corn Ethanol: Dry Milling Ethanol
Total WTT (well to tank) results
Corn w/o loss
factor Corn w/ loss
factor Ethanol
Loss factor
1.001
Total energy 181,068 181,159
Fossil fuels 176,104 176,193
Coal 25,091 25,104
Natural gas 85,581 85,624
Petroleum 65,433 65,466
VOC 16.214 16 54.199 70
CO 146.284 146.358 30.270 177
NOx 70.852 70.888 90.425 161
PM10 7.807 7.811 69.023 77
PM2.5 4.059 4.061 22.582 27
SOx 32.609 32.626 44.789 77
CH4 16.826 16.834 42.376 59
N2O 40.366 40.386 0.775 41
CO2 14,567 14,574 29,822 44,396
GHG Emissions 27,030 31,113 58,143
Total Direct Emissions 55.11 g CO2/MJ EtOH Land Use Change 30 g CO2/MJ EtOH Denaturant (CARBOB blended
at 2% with anhydrous EtOH) 0.8 g CO2/MJ EtOH Total Carbon Intensity 85.91 g CO2/MJ EtOH

ADM Method 2B Submission – May 18, 2011 rev Page 25
TABLE 5 Total Well to Tank (WTT) emissions for Dry Milling Corn Ethanol production under ADM Pathway MIDWEST, DRY MILL, DRYER CLOSED-LOOP ENHANCED HEAT RECOVERY, COGENERATION – COAL AND 15% BIOMASS
Results are specified as BTU or grams per MMBTU of Ethanol Corn Ethanol: Dry Milling Ethanol
Total WTT (well to tank) results
Corn w/o loss
factor Corn w/ loss
factor Ethanol
Loss factor
1.001
Total energy 181,068 181,159
Fossil fuels 176,104 176,193
Coal 25,091 25,104
Natural gas 85,581 85,624
Petroleum 65,433 65,466
VOC 16.214 16 54.191 70
CO 146.284 146.358 30.426 177
NOx 70.852 70.888 89.506 160
PM10 7.807 7.811 63.452 71
PM2.5 4.059 4.061 20.735 25
SOx 32.609 32.626 40.531 73
CH4 16.826 16.834 39.840 57
N2O 40.366 40.386 1.035 41
CO2 14,567 14,574 27,753 42,327
GHG Emissions 27,030 29,057 56,088
Total Direct Emissions 53.16 g CO2/MJ EtOH Land Use Change 30 g CO2/MJ EtOH Denaturant (CARBOB blended
at 2% with anhydrous EtOH) 0.8 g CO2/MJ EtOH Total Carbon Intensity 83.96 g CO2/MJ EtOH

ADM Method 2B Submission – May 18, 2011 rev Page 26
Table 6 lists the user design inputs that were changed in CA-GREET for ADM pathway Midwest, Dry Mill, Dryer Closed-loop Heat Recovery, Cogeneration – Coal and the biomass pathways. All other parameters are unchanged for the proposed sub-pathway including raw materials, ethanol energy content and land use change.
TABLE 6 User design inputs for CA-GREET and ADM Pathway MIDWEST, DRY MILL, DRYER CLOSED-LOOP HEAT RECOVERY, COGENERATION – COAL AND BIOMASS PATHWAYS
CA-GREET Worksheet
Cell Reference
Input Units CA-GREET Value
ADM Pathway 1 Value
Inputs B4 Target Year of Simulation
2010 2010
Fuel_Prod_TS C271 EtOH Yield of Corn Dry Mill EtOH Plant
gal/bushel
2.72 2.70
Inputs C244, D244
Share of corn ethanol plant types
% 85% dry mill, 15% wet mill
100% dry mill, 0% wet mill
Fuel_Prod_TS K271 Total ethanol energy use (undenatured)
BTU/gal 36,000
Inputs C247 Electricity share of process fuel
% 10.2% 0%
Fuel_Prod_TS S271 Share of Coal in total process fuels
% 20% Base: 71% 5% Biomass: 65.15% 10% Biomass: 59.29% 15% Biomass: 53.44%
Inputs C255 Share of NG as Process Fuel
% 100% 29.00%
Inputs C256 Share of Coal as Process Fuel
% 0% Base: 71% 5% Biomass: 65.15% 10% Biomass: 59.29% 15% Biomass: 53.44%
Inputs E255 Biomass as Process Fuel
% Base: 0% 5% Biomass: 5% 10% Biomass: 10% 15% Biomass: 15%
Inputs C262 Share of Biomass used as process fuel: Corn Stover
% 100% 100%
EtOH C101 DGS Yield bone-dry lb. per gallon EtOH
5.34 5.87
Regional LT H192 Midwest – Coal BTU/sho 19,546,300 16,497,700

ADM Method 2B Submission – May 18, 2011 rev Page 27
CA-GREET Worksheet
Cell Reference
Input Units CA-GREET Value
ADM Pathway 1 Value
LHV rt-ton Regional LT H193 Midwest – Coal
HHV BTU/short-ton
20,608,570 17,366,000
Regional LT H194 Midwest – Coal Carbon Content
% wt 63.7% 47.8%
Regional LT H195 Midwest – S ratio
ppm by wt
11,100 4,000
TABLE 7 Total Well to Tank (WTT) emissions for Dry Milling Corn Ethanol production under ADM Pathway MIDWEST, DRY MILL, DRYER CLOSED-LOOP HEAT RECOVERY, COGENERATION - COAL
Outputs:
Results are specified as BTU or grams per MMBTU of Ethanol Corn Ethanol: Dry Milling Ethanol
Total WTT (well to tank) results
Corn w/o loss
factor Corn w/ loss
factor Ethanol
Loss factor
1.001
Total energy 181,068 181,159
Fossil fuels 176,104 176,193
Coal 25,091 25,104
Natural gas 85,581 85,624
Petroleum 65,433 65,466
VOC 16.214 16 54.340 71
CO 146.284 146.358 30.309 177
NOx 70.852 70.888 94.276 165
PM10 7.807 7.811 83.132 91
PM2.5 4.059 4.061 27.298 31
SOx 32.609 32.626 55.602 88
CH4 16.826 16.834 49.081 66
N2O 40.366 40.386 0.262 41
CO2 14,567 14,574 35,172 49,746
GHG Emissions 27,030 36,477 63,507
Total Direct Emissions 60.19 g CO2/MJ EtOH Land Use Change 30 g CO2/MJ EtOH Denaturant (CARBOB blended
at 2% with anhydrous EtOH) 0.8 g CO2/MJ EtOH Total Carbon Intensity 90.99 g CO2/MJ EtOH

TABLE 8 Total Well to Tank (WTT) emissions for Dry Milling Corn Ethanol production under ADM Pathway MIDWEST, DRY MILL, DRYER CLOSED-LOOP HEAT RECOVERY, COGENERATION – COAL AND 5% BIOMASS
Results are specified as BTU or grams per MMBTU of Ethanol Corn Ethanol: Dry Milling Ethanol
Total WTT (well to tank) results
Corn w/o loss
factor Corn w/ loss
factor Ethanol
Loss factor
1.001
Total energy 181,068 181,159
Fossil fuels 176,104 176,193
Coal 25,091 25,104
Natural gas 85,581 85,624
Petroleum 65,433 65,466
VOC 16.214 16 54.333 71
CO 146.284 146.358 31.062 177
NOx 70.852 70.888 93.372 164
PM10 7.807 7.811 77.654 85
PM2.5 4.059 4.061 25.481 30
SOx 32.609 32.626 51.414 84
CH4 16.826 16.834 46.587 63
N2O 40.366 40.386 0.518 41
CO2 14,567 14,574 33,137 47,711
GHG Emissions 27,030 34,456 61,486
Total Direct Emissions 58.28 g CO2/MJ EtOH Land Use Change 30 g CO2/MJ EtOH Denaturant (CARBOB blended
at 2% with anhydrous EtOH) 0.8 g CO2/MJ EtOH Total Carbon Intensity 89.08 g CO2/MJ EtOH

TABLE 9 Total Well to Tank (WTT) emissions for Dry Milling Corn Ethanol production under ADM Pathway MIDWEST, DRY MILL, DRYER CLOSED-LOOP HEAT RECOVERY, COGENERATION – COAL AND 10% BIOMASS
Results are specified as BTU or grams per MMBTU of Ethanol Corn Ethanol: Dry Milling Ethanol
Total WTT (well to tank) results
Corn w/o loss
factor Corn w/ loss
factor Ethanol
Loss factor
1.001
Total energy 181,068 181,159
Fossil fuels 176,104 176,193
Coal 25,091 25,104
Natural gas 85,581 85,624
Petroleum 65,433 65,466
VOC 16.214 16 54.325 71
CO 146.284 146.358 31.216 178
NOx 70.852 70.888 92.466 163
PM10 7.807 7.811 72.166 80
PM2.5 4.059 4.061 23.660 28
SOx 32.609 32.626 47.220 80
CH4 16.826 16.834 44.088 61
N2O 40.366 40.386 0.774 41
CO2 14,567 14,574 31,099 45,673
GHG Emissions 27,030 32,431 59,461
Total Direct Emissions 56.36 g CO2/MJ EtOH Land Use Change 30 g CO2/MJ EtOH Denaturant (CARBOB blended
at 2% with anhydrous EtOH) 0.8 g CO2/MJ EtOH Total Carbon Intensity 87.16 g CO2/MJ EtOH

TABLE 10 Total Well to Tank (WTT) emissions for Dry Milling Corn Ethanol production under ADM Pathway MIDWEST, DRY MILL, DRYER CLOSED-LOOP HEAT RECOVERY, COGENERATION – COAL AND 15% BIOMASS
Results are specified as BTU or grams per MMBTU of Ethanol Corn Ethanol: Dry Milling Ethanol
Total WTT (well to tank) results
Corn w/o loss
factor Corn w/ loss
factor Ethanol
Loss factor
1.001
Total energy 181,068 181,159
Fossil fuels 176,104 176,193
Coal 25,091 25,104
Natural gas 85,581 85,624
Petroleum 65,433 65,466
VOC 16.214 16 54.318 71
CO 146.284 146.358 31.370 178
NOx 70.852 70.888 91.561 162
PM10 7.807 7.811 66.687 74
PM2.5 4.059 4.061 21.843 26
SOx 32.609 32.626 43.032 76
CH4 16.826 16.834 41.594 58
N2O 40.366 40.386 1.030 41
CO2 14,567 14,574 29,063 43,638
GHG Emissions 27,030 30,419 57,449
Total Direct Emissions 54.44 g CO2/MJ EtOH Land Use Change 30 g CO2/MJ EtOH Denaturant (CARBOB blended
at 2% with anhydrous EtOH) 0.8 g CO2/MJ EtOH Total Carbon Intensity 85.24 g CO2/MJ EtOH

Appendix A
Columbus, NE – Dry Mill Air Permit


Appendix B
Columbus, NE – Cogen Air Permit


Appendix C
CA-GREET Electronic Files

References: (1) Demirbas, Ayhan. 2005. New Opportunities Resulting from Cogeneration Systems Based on Biomass Gasification. Energy Sources 27, no. 10: 941-948. (2) Industrial Technologies Program. 2004. Consider Installing High Pressure Boilers with Backpressure Turbine-Generators. Steam Tip Sheet #22. http://www.nrel.gov/docs/fy04osti/36924.pdf.