Embed Size (px)
Citation preview

P-242-SSL-SUGAR-72018
FOR
PROPOSED EXPANSION OF SUGAR FACTORY FROM 800 TCD TO
10000 TCD, ESTABLISHMENT OF 60 MW CO-GEN PLANT
& 200 KLPD MOLASSES BASED DISTILLERY
BY
NHAVI (BK.), TAL.: KOREGAON, DIST.: SATARA
STATE : MAHARASHTRA
PREPARED BY
ENVIRONMENTAL; CIVIL & CHEMICAL ENGINEERS, CONSULTANTS & ANALYSTS,
KOLHAPUR (MS)
E-mail: [email protected], [email protected]
2018 - 2019
EQUINOX ENVIRONMENTS (I) PVT. LTD.,
AN ISO 9001 : 2015 & QCI - NABET ACCREDITED ORGANIZATION
TM
SHIVNERI SUGARS LTD.
SUMMARY ENVIRONMENTAL IMPACT ASSESSMENT
(EIA) REPORT(IN ENGLISH AND MARATHI)


INDEX
Sr. No. Description Page No.
1. Summary EIA in English 1 - 19
2. Summary EIA in Marathi 20 - 41

Summary of Draft EIA Report for
Expansion of Sugar factory from 800 TCD to 10000 TCD and Establishment of 60 MW Co-generation Plant (50 MW electricity generation from Co-gen & 10 MW from
Distillery) and 200 KLPD Molasses based Distillery By
Shivneri Sugars Ltd. (SSL) A/p. - Ganesh Tekadi, Nhavi (Bk.), Tal: Koregaon, Dist.: Satara, Maharashtra State
1) THE PROJECT
Shivneri Sugars Ltd. (SSL) is located at Ganesh Tekadi, Nhavi (Bk.), Tal.: Koregaon, Dist.: Satara, Maharashtra State. It is towards South-East of Satara, at a distance of about 24 Km from city. The existing cane crushing capacity of the sugar factory is about 800 TCD, establishment of Co-generation capacity of 60 MW (50 MW electricity generations from Co-gen & 10 MW from Distillery) and 200 KLPD Molasses based Distillery.
As per the Environmental Impact Assessment (EIA) Notification dated 14th September 2006 and amendments there at issued by the Ministry of Environment and Forests (MoEF) project comes under Category A, listed at item 5(j), 5(g) and 1(d).
The management of ‘SSL’ has decided to go for expansion of existing sugar factory from 800 to 10000 TCD (increased by 9200 TCD), establishment of co-gen plant of 60 MW (50 MW electricity generations from Co-gen & 10 MW from Distillery) distillery of 200 KLPD. The project would be formulated in such a fashion and manner so that the utmost care of Safety Norms and Environment Protection shall be taken. The total capital investment details are given in following table -
Table 1 - Project Investment Details
Sr. No. Industrial unit Capital Investment (Rs. Cr.)
Existing Proposed Total 1. Sugar Factory, Co-gen Plant & Distillery Rs. 10 Cr. Rs. 610 Cr. Rs. 620 Cr.
2) THE PLACEThe proposed expansion of sugar factory, establishment of co-gen plant & distillery by SSL should be set up at Survey. No. 164,166,173,174,175,176,177,178,180,181, Nhavi (Bk.), taluka Koregaon, district Satara, Maharashtra.
Total land acquired by the industry for an integrated project complex of sugar factory, co-generation plant and distillery is about 20.64 Ha. No objection certificate for the proposed expansion project activities has been obtained from the Grampanchayat Nhavi (Bk.) Following aspects have been taken into consideration while planning expansion project activities in the SSL complex -
1. Availability of excess cane for crushing in sugar factory from the operational area.2. Availability of adequate equipments and allied infrastructure in sugar factory, co-gen and
distillery unit.3. Availability of adequate quantity of water and electricity for the proposed project.4. Rahimatpur city is located at about 6 Km from the project site which is very well connected
with other parts of the country by roads, rail.5. No rehabilitation and resettlement are required to be done.
The area requirement for various amenities and buildings under existing as well as proposed expansion of sugar factory, co-gen plant and distillery is as follows -
1

Table 2 - Total Area Break up A Sugar Factory & Co-gen Area (Sq.M.) 1 Sugar Plant 5184.00 2 Clarification House 1008.00 3 Gunny Bags 123.25 4 Sugar House 346.00 5 Limes Slaker 288.00 6 Injection Pump House 288.00 7 Sugar Cooling Tower 800.00 8 Sugar Boiler & Fan House 3900.00 9 Sugar Boiler Power House 1200.00
10 Work Shop 180.00 11 Store 315.00 12 Sugar Godown 1800.00 13 Molasses Tanks (3 No.s) 207.34 14 ETP 1200.00 15 Raw Water Tank 1250.00 16 CPU 1500.00 17 WTP 450.00 18 Store Yard 1100.00 19 Bagasse Yard 5250.00 20 Cane Yard 8820.00 21 Co-gen Boiler 2800.00 22 Co-gen Power House 2400.00 23 Co-gen Cooling Tower 800.00
Total 41209.59 B Distillery 1 Ware House 2800.00 2 Distillation 1875.00 3 Fermentation 1875.00 4 Incineration Boiler & Power House 3300.00 5 Coal Yard 3525.00
Total 13375.00 C Colony 1 Guest House 360.00 2 C Type Colony (2 No.s) 600.00 3 D Type Colony (4 No.s) 400.00 4 B Type Colony (2 No.s) 450.00 5 Admin Buildings 1000.00 6 Road 10590.9
Total 13400.9 D Total Built-up Area (A+B+C) 67985.00 E Green Belt 68796.6 F Open Space 69682.00
Total Area 206464.00
2

From the above table, it could be seen that the land available is much more than actual requirement. In an area other than the project space requirement, infrastructure for green belt development and roads would be provided. Here a good network of internal as well as main approach roads would be prepared. Refer Appendix - A for plot layout plan of proposed project.
3) THE PROMOTERS
The proposed sugar factory expansion by 9200 TCD, establishment of distillery plant of 200 KLPD & Co-gen of 60 MW (50 MW electricity generations from Co-gen & 10 MW from Distillery) should be implemented by the management of SSL in the existing sugar factory premises. The SSL promoters are well experienced in the field of sugar, co-gen and distillery & have made a thorough study of entire project planning as well as implementation schedule. The names and designations of the promoters are as under-
Table 3 - Promoters of SSL Sr. No. Name Designation
1. Mr. Shrimant B Patil Chairman & Managing Director 2. Mr. Shrinivas Patil Director 3. Mr. Yogesh Patil Director 4. Mr. Sushant Patil Director
4) THE PRODUCTS
The details products and by- product manufactured / to be manufactured under existing and expansion projects activities have been presented in following table.
Table 4 - Products of the Sugar Factory, Co- Gen Plant & Distillery a. Sugar Factory
Industrial unit
Product & By-product
Quantity Existing
(800 TCD) Expansion (9200
TCD) Total
(10000 TCD)
Sugar Factory
Sugar 3120 (MT/ M) 35880 (MT/ M) 39000 (MT/ M) By-product
Molasses 960 (MT/ M) 11040 (MT/ M) 12000 (MT/ M) Bagasse 7200 (MT/ M) 82800 (MT/ M) 90000 (MT/ M)
Press Mud 960 (MT/ M) 11040 (MT/ M) 12000 (MT/ M)
b. Co-gen Plant & DistilleryIndustrial
unit Product & By-product Proposed Quantities
Co-Gen Electricity 50 (MW)
Distillery
Rectified Spirit (RS) 200 (KLPD) Extra Neural Alcohol (ENA) 200 (KLPD) Ethanol 200 (KLPD) Electricity (MW) 10 (MW)
Details of the manufacturing process and flow chart for sugar factory, co-gen plant & distillery are given in Chapter 2 of the EIA Report.
3
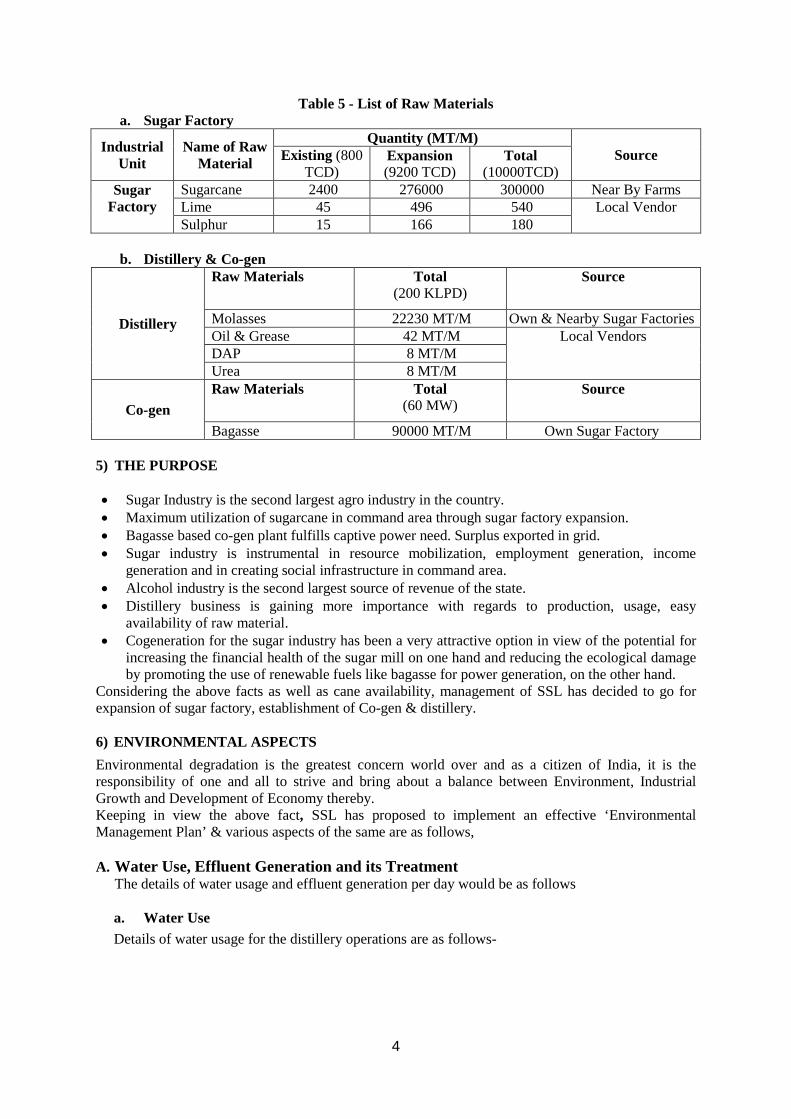
Table 5 - List of Raw Materials a. Sugar Factory
Industrial Unit
Name of Raw Material
Quantity (MT/M) Source Existing (800
TCD) Expansion (9200 TCD)
Total (10000TCD)
Sugar Factory
Sugarcane 2400 276000 300000 Near By Farms Lime 45 496 540 Local Vendor Sulphur 15 166 180
b. Distillery & Co-gen
Distillery
Raw Materials Total (200 KLPD)
Source
Molasses 22230 MT/M Own & Nearby Sugar Factories Oil & Grease 42 MT/M Local Vendors DAP 8 MT/M Urea 8 MT/M
Co-gen Raw Materials Total
(60 MW) Source
Bagasse 90000 MT/M Own Sugar Factory
5) THE PURPOSE
• Sugar Industry is the second largest agro industry in the country.• Maximum utilization of sugarcane in command area through sugar factory expansion.• Bagasse based co-gen plant fulfills captive power need. Surplus exported in grid.• Sugar industry is instrumental in resource mobilization, employment generation, income
generation and in creating social infrastructure in command area.• Alcohol industry is the second largest source of revenue of the state.• Distillery business is gaining more importance with regards to production, usage, easy
availability of raw material.• Cogeneration for the sugar industry has been a very attractive option in view of the potential for
increasing the financial health of the sugar mill on one hand and reducing the ecological damageby promoting the use of renewable fuels like bagasse for power generation, on the other hand.
Considering the above facts as well as cane availability, management of SSL has decided to go for expansion of sugar factory, establishment of Co-gen & distillery.
6) ENVIRONMENTAL ASPECTSEnvironmental degradation is the greatest concern world over and as a citizen of India, it is the responsibility of one and all to strive and bring about a balance between Environment, Industrial Growth and Development of Economy thereby. Keeping in view the above fact, SSL has proposed to implement an effective ‘Environmental Management Plan’ & various aspects of the same are as follows,
A. Water Use, Effluent Generation and its Treatment The details of water usage and effluent generation per day would be as follows
a. Water UseDetails of water usage for the distillery operations are as follows-
4

Table 6- Details of Water Consumption in Sugar & co-gen of SSL Sr. No. Description Existing Water
Requirement (m3/day) Expansion Water
Requirement (m3/day) Total Water
Requirement (m3/day) 1. Domestic 4 (# 0.8+ $ 3.2 ) 46 (#9.2 + $36.8) 50 (#10 + $40) 2. Industrial
a. Process *260 *2813 *3073b. Cooling Makeup *104 *1196 *1300c. Boiler Makeup 40 (#18+*22) 440 (#210+*230) 480 (#228+*252) d. Lab& Wash *4 *61 *65e. DM Backwash *14 *186 *200f. Ash Quenching *1 *9 *10Industrial Use (a+b+c+d+e+f) 423 (#18 +*405) 4705 (#210+*4495) 5128 (#228+*4900)
3. Grand Total (1+2) 427 (#18.8+*405+ $3.2) 4751(#219.2+*4495+$33.6) 5178 (#238+*4900+$40)Note: # - Water taken from River, * - Cane Condensate water, $ - Treated water in Proposed STP
Table 7 - Details of Water Consumption in Distillery of SSL Sr. No. Description Total Water Requirement
(M3/day) 1. Domestic 27 (#7 +$20) 2. Industrial
a. Fermentation dilution 1587 (#1032 + *555) b. Cooling tower replenishment *554c. Boiler Blow down #180 d. Lab & Wash #5 e. Scrubber -- Industrial Use (a+b+c+d+e) 2326 (#1217 + *1109)
3. Grand Total 2353 (#1224 +*1109+$20) Note: # - Water taken from River, * - Condensate water from MEE, $ - Treated water in Proposed STP
b. Effluent Treatmenti) Domestic Effluent-Total domestic effluent generated from SSL project complex will be 67 M3/D (Domestic effluent from Sugar factory and Co-gen plant - 45 M3/D and from Distillery - of 27 M3/D) same shall be treated in proposed Sewage Treatment Plant (STP).
ii) Industrial Effluent-Total industrial effluent generated from expansion of sugar factory & proposed co-gen plant shall be 997 M3/D. same shall be treated in proposed Effluent Treatment Plant (ETP). Treated water from ETP shall be used for gardening on own land as well as for irrigation in nearby farmlands. Details of wastewater generation under existing and proposed operations are as follows-
Table 8 - Effluent Generation in Sugar & Co-gen of SSL Complex
Description Existing (M3/day) (800 TCD)
Expansion (M3/day) (9200 TCD & 50 MW)
Total (M3/day) (10000 TCD &
50MW) Disposal
Domestic 3 42 45 Treated in proposed STP
Industrial a. Process 50 547 597 Treated in full
fledge ETP b. Cooling Blow down
6 69 75
5

c. Boiler Blow down
4 56 60
d. Lab& Wash 4 61 65 e. DM Backwash 14 186 200 f. Ash Quenching -- --- -- Industrial Use (a+b+c+d+e+f)
78 919 997
Grand Total 81 961 1042
Table 9 - Details of Effluent Generation in Distillery of SSL
Figure 1 - Flow Chart of Sugar ETP
Purpose Quantity (CMD) Disposal Method
Domestic 22 Treated in proposed Sewage Treatment Plant (STP) Industrial Process Fermentation dilution
Raw Spent wash -1600 Conc. Spent wash - 640 (3.2 KL/KL) MEE Condensate-960
Raw spent wash shall be concentrated in Multi Effect Evaporator (MEE). Conc. Spent wash shall be incinerated in incineration boiler.
Spent lees - 400 Other Effluents viz. spent lees, cooling blow down, boiler blow down, lab & washing, MEE condensate shall be forwarded to Distillery CPU. Cooling Blow Down 110
Boiler Blow Down 18 Lab and Washing 34
Total Conc. Sp. wash - 1640 Other effluent - 562
6

Figure 2 - Flow Chart of CPU in Distillery
Table 10 - Spentwash Generation from Distillery No. Description Quantity
1. Quantity of raw spentwash generated from 200 KLPD molassesdistillery
1600 m3/day
2. Total quantity of spentwash generated after Conc. in MEE 640 m3/day 3. Working days 330 Nos. 4. Total quantity of Conc. spentwash generated 2, 1,200 m3/Season.
The treated effluent should be used for green belt to be developed in own premises as well as nearby farmers.
B. Air Emissions
Emissions will be generated from 200 TPH bagasse fired boiler as well as 75 TPH incineration boiler (fuel-coal + conc. spent wash). ESP will be installed for same as APC equipment Details of air pollution aspect and the control measures are given in following Table.
Table 11 - Details of Boiler and Stack in SSL Sr. No.
Description Proposed
1 Capacity 200 TPH 75 TPH 2 Fuel type Bagasse Spent Wash blended
with coal 3 Fuel Quantity 2400 MT/D Sp. wash- 906 MT/D
Coal – 36 MT/D 4 Height of Stack, M (above ground level) 94 M 91 M 5 Material of construction RCC RCC 6 Shape (round/rectangular) Round Round
7

Sr. No.
Description Proposed
7 Diameter/ size, in meters 6 M 3.2 M 8 Flue Gas Temp 1600C 1600C 9 Gas flow rate in Nm3/Hr 3,56,460 NM3/Hr 2,22,222 NM3/Hr 10 Height of sampling Port 20 M 20 M 12 Control Equipment preceding the stack ESP ESP 13 Online monitoring system To be Installed
(Parameters – SPM) To be Installed
(Parameters – SPM)
C. Noise Pollution Aspect
1. Sources of Noisei. In proposed unit, very high noise generating sources would not exist. D.G. Set should be one of the
sources of noise pollution. But the operation of D.G. Set would be only in the case of powerfailure. Expected noise levels in the section would be about 72 dB (A). Adequate noise abatementmeasures like silencer should be implemented in this section. Moreover, enclosures to themachinery should be provided wherever possible.
ii. Fermentation section & distillation section should be the other minor noise generating sources. Theexpected noise levels in these sections should be in the range of 70 to 80 dB (A).
iii. Pumps, compressors, boiler house, turbine, movement of trucks for material transportation etc.
2. Control Measures
Isolation, separation and insulation techniques to be followed, PPE in the form of earmuffs, earplugs etc. should be provided to workers. The D.G. Set shall be enclosed in a separate canopy to reduce the noise levels.
D. Hazardous Wastes
The different types of hazardous wastes being generated from existing operations as well as those to be generated from proposed activities and their disposal methods are presented in following table.
Table 12 - Hazardous Waste Details
Sr. No. Description Quantity Mode of Disposal
1 Cat. No. 5.1 Spent Oil 0.5 MT/M Burnt with bagasse in Co-gen boiler
No any hazardous waste shall be generated from the proposed 60 KLPD Distillery plant.
E. Solid Wastes
Solid wastes from the industries are categorized as hazardous and non-hazardous. Wastes that pose substantial dangers immediately or over a period of time to human, plant, or animal life are classified as hazardous wastes. Non- hazardous waste is defined as the waste that contributes no damage to human or animal life. However, it only adds to the quantity of waste.
Following table gives details of solid waste generated in the existing, proposed modernization cum expansion Sugar factory & establishment of Distillery unit as well as Co-gen plant.
8

Table 13 Solid Waste Generation, Storage and Disposal Details Sr. No. Type of Waste Quantity Disposal
1 Yeast Sludge 349.5 MT/M Used as manure 2 CPU Sludge 0.5 MT/M 3 ETP sludge 11 MT/M 4 Boiler Ash- bagasse 720 MT/M 5 Boiler Ash- Coal 138 MT/M Sold to brick manufacturer 6 Boiler Ash- Spent wash 4892 MT/M
F. Odour Pollution
Odour sources of proposed project are molasses handling and storage, bacterial growth in interconnecting pipes & unattended drains. Under proposed project, spentwash shall be carried through closed pipeline for incineration and concentration in MEE. Hence, odour nuisance due to spentwash storage and incineration activity shall be entirely eliminated.
G. Compliance with the Norms
All the relevant acts, rules and guidelines with respect to effluent treatment and disposal, solid & hazardous wastes handling and disposal as well as in respect of emission handling and disposal, wherever applicable, as specified by the Maharashtra Pollution Control Board (MPCB) or any other concerned authority are strictly followed in the existing set up. Same practice shall be continued after implementation of proposed expansion.
H. Environmental Management Cell
The SSL have planned an Environmental Management Cell (EMC) functioning under its proposed activity. Members of the EMC are well qualified and experienced in their concerned fields. This cell shall be further augmented suitably under expansion. The proposed EMC members are as under-.
Table 14 - Environmental Management Cell
Sr. No. Name of Member Designation
Number of Working Person(s)
1. Mr. Shrimant Patil Chairman & Managing Director 1 2. Dr. Sangram Ghugare Env. Consultant
Equinox Environments (I) Pvt. Ltd. 1
3. Mr. Padamraj C. Pai Environmental Officer (Unit 1) 1 4. Mr. Tushar Karkare Environmental Officer (Unit 2) 1 5. Mr. Chandrashekhar D. Lihare ETP Incharge (Unit 1) 1 6. Mr. Sujitkumar Chougule Safety Officer (Unit 1) 1
Total 06
Members of the environmental cell should be well qualified and experienced in the concerned fields.
The capital as well as O & M cost towards environmental aspects under the proposed activities would be as follows –
Table 15 - Capital as well as O & M Costs Sr. No. Description Cost Component (In Crores)
Capital Annual O & M 1 Air Pollution Control (APC) equipment – ESP for Rs. 20.00 Rs.4.00
9

Sr. Description Cost Component (In Crores) Boiler – 1 Nos. in Co-gen (Stack height 94 M) & 1 Nos. In distillery (Stack height 91 M).
2 Spentwash Treatment Facility – Spentwash Storage tanks, Bio-methanation Plant, MEE, CPUs, Proposed ETP
Rs. 25.00 Rs.8.50
3 Noise Pollution Control Rs. 2.00 Rs. 0.25 4 Environmental Monitoring & management Rs. 1.50 Rs. 0.35 5 Occupational Health & Safety Rs. 0.35 Rs. 0.10 6 Green Belt Development & Rain Water Harvesting Rs. 1.50 Rs. 0.25 7 Provision towards CER in Five Years after grant of EC Rs. 11.00 Rs. 0.20
Total Rs. 61.35 Cr. Rs. 23.55 Cr.
I. Rainwater Harvesting Aspect
Total area of Plot - 206464 M2
Total Open space – 69682 M2
Average annual rainfall in the area = 783 mm.
Rooftop Harvesting
Roof Top harvesting area of 4,610M2
Roof Top harvesting yield is – 3,088.7 M3
Surface Harvesting
Surface Harvesting area of 69,682 M2
Surface harvesting yield is – 21,824.40 M3
Hence, the total water becoming available after rooftop and land harvesting would be- 3,088.7+ 21,824.40= 24,913.1M3 i.e. 24.19ML
J. The Green Belt Table 16 - Area Details
No. Description Area (Sq. M) 1. Total Plot Area 206464.00 2. Built up Area 67985.00 3. Green Belt (Proposed – 33.3% of Total Plot Area) 68796.60 4. Open Space 69682.00
The Criteria for Green Belt Development Plan
Emission of SPM, SO2 is the main criteria for consideration of green belt development. The green belt development is provided to abate effects of the emissions of SPM & SO2. Moreover, there would also be control on noise from the industry to surrounding localities as considerable attenuation would occur due to the barrier of trees in proposed green belt.
K. Socio-Economic Development
The socio economic study was carried out in 36 villages out of the total 19 villages within 10 Km radius of the study area. The methodology adopted involved a structured close ended interview schedule (33 questions) in Marathi, which was drafted prior to and employed during the survey. Refer Socio – economic profile in Chapter 3 of EIA report for detailed information of socio economic aspect. The observations and conclusions after the socio-economic study are as follows-
10

i. Most respondents from all villages are dependent on agriculture and allied activities for theirlivelihood.
ii. Major crops grown in the area included sugarcane, ginger, turmeric and wheat.iii. Water conservation activities like “Pani Foundation” are implemented on mountain region areas
like Borgaon, Ambheri, Velu & Nhavi Bk.
7) ENVIRONMENTAL IMPACTS AND MITIGATION MEASURES
A. Impact on Topography
There would be no change in topography, land use or change in water body due to manufacturing activities in sugar factory, distillery and co-gen plant unit.
B. Impact on Climate
Impact on the climate conditions due to the proposed activity is not envisaged, as emissions to the atmosphere, of flue gases with very high temperatures are not expected
C. Impact on Air Quality
A study area of 10 km radius is considered for determination of impacts.
i. Baseline Ambient Air Concentrations
The 24 hourly 98th percentile concentrations and averages of PM10, PM2.5, SO2 and NOx in Ambient Air, recorded during the field study conducted for the season October – November – December 2018 are considered as baseline values.
The existing baseline concentrations are summarized in following table
Table 17 - Baseline Concentrations Parameter Concentration (µg/m3)
PM10 62.02 PM2.5 27.31 SO2 26.97 NOX 31.47 CO 0.14
ii. Air Polluting Sources
Steam required for proposed activities of sugar factory and co-gen plant will be taken from proposed 200 TPH co-gen boiler. Bagasse will be used as fuel for the same. ESP will be installed as APC along with stack of 94 M height. Steam required for distillery operations will be taken from 75 TPH incineration boiler. Coal and conc. spent wash will be used as fuel for the incineration boiler. ESP will be used as APC along with a stack of 91 M will be provided to the same. 2 DG Sets of capacity 1 MW will be installed on site. HSD will be used as fuel for the same.
D. IMPACT ON WATER RESOURCES
i. Impact on Surface Water Resources
Fresh water requirement for the various units in SSL campus for expansion as well as establishment shall be met from the Krishna River. The Industry has been applied granted permission for lifting
11

1500 M3 water annually from the Irrigation Dept; Govt. of Maharashtra. For details w.r.t water consumption refer above Table 5 and 6. Further, copy of water lifting permission application is enclosed Appendix – D.
Raw spent wash (1600 M3/day) shall be concentrated in Multi Effect Evaporator (MEE). Conc. Spent wash (640) shall be incinerated in incineration boiler.
ii. Impact on Ground Water Resources
Water required for the industry would be obtained from irrigation scheme on Krishna River. Further, copy of water lifting permission application is enclosed Appendix – D. As ground water shall not be a source of raw water for the proposed project, there shall not be any impact on ground water level.
E. IMPACT ON SOIL
Impact on the soil characteristics is usually attributed to air emissions, wastewater discharges and solid waste disposal. Deposition of particulate matter in ambient air without APC equipment can result in to alteration of properties of soil and its composition. Accidental discharge of spent wash, effluent or solid waste on land may change soil characteristics and soil fertility slowly; making it saline and non-suitable for agricultural or and any other vegetation to survive.
Solid waste generated from distillery and co-gen plant is yeast sludge and Boiler Ash respectively. Yeast sludge would be used as manure and Boiler Ash would be sold to brick manufacturer. The domestic effluent would be treated in sewage plant to be provided on site. Here, no impact is envisaged, as the quality of the effluent would be as per the norms stated by MPCB.
F. IMPACT ON NOISE LEVELS
The workers could get annoyance and can lose concentration during operation. It can cause disturbance during working. People working near the source need risk criteria for hearing damage while the people who stay near the industry need annoyance and psychological damage as the criteria for noise level impact analysis. The major noise emanating sources in SSL complex shall be plant & machinery in sugar factory like mill, compressors etc., boiler, turbine and DG set. SSL is not a major noise producing industry.
G. IMPACT ON LAND USE
The proposed expansion activity should be implemented in existing sugar factory, Co-gen plant & distillery premises on the same acquired land & hence no any change in the land use pattern is expected. Therefore the impact on land use is non-significant.
H. IMPACT ON FLORA AND FAUNA
The expansion of existing sugar, co-gen plant and distillery factory is carried out in the existing premises of SSL. Hence, there is no any terrestrial habitats loss. In study area of 10 Km radius of project site, there is no presence of any Ecological Sensitive Zones, Reserved /Protected Forest / National Parks/ Wildlife Sanctuary. The study area represents a semi-arid ecosystem with habitat types of agriculture, scrubs, and scattered trees, and human habitations.
Effect on Vegetation: In the case of proposed project, particulate emissions from boiler without APC / less efficient APC should be of concern. SPM forms coating on surface of leaves and retard photosynthetic activity of plants.
Habitat Loss/ Removal: In study area of 10 Km radius of Project Site there is no presence of any Ecological Sensitive Zones, Protected Forest / National Parks/ Wildlife Sanctuary.
12

I. IMPACT ON HISTORICAL PLACES
No any historical place is within the study area of 10 Km radius. There would be no any significant impact on historical place by the proposed modernization and expansion project.
8) ENVIRONMENTAL MONITORING PROGRAMME
Reconnaissance of the study area was undertaken in the month of October 2018. Field monitoring for measuring meteorological conditions, ambient air quality, water quality, soil quality and noise levels was initiated in December 2018. The report incorporates the data monitored during the period from October – November - December 2018 and secondary data collected from various sources which include Government Departments related to ground water, soil, agriculture, forest etc.
A. Land Use
Land use study requires data regarding topography, zoning, settlement, industry, forest, roads and traffic etc. The collection of this data was done from various secondary sources viz., Census books, Revenue records, State and Central Government Offices, Survey of India toposheets as well as high resolution satellite image and through primary field surveys.
B. Land Use/ Land Cover Categories of Study Area
Table 18 - Land Use/ Land Cover Sr. No. Classes Area in Ha. Percentage
1 Built Up Area 970 3.09 2 Crop Land 12380 39.41 3 Fallow Land 4150 13.21 4 Water Bodies 150 0.48 5 River 35 0.11 6 Forest Area 2070 6.59 7 Barren Land 1850 5.89 8 Open Scurb Land 9810 31.23
Total 31415 100
C. Meteorology
The methodology adopted for monitoring surface observations is as per the norms laid down by Bureau of Indian Standards (BIS) and the India Meteorology Department (IMD). On-site monitoring was undertaken for various meteorological variables in order to generate the data. Further, certain secondary meteorological data like temperatures, relative humidity, rainfall intensity etc. have been taken from IMD, Satara.
The meteorological parameters were monitored during the period October - November –December 2018. The details of parameters monitored, equipments used and the frequency of monitoring have been given in Chapter 3 of the EIA report.
D. Air Quality
This section describes the selection of sampling locations, includes the methodology of sampling and analytical techniques with frequency of sampling. Presentation of results for October 2018 – November – December 2018 survey is followed by observations. All the requisite monitoring
13

assignments, sampling and analysis was conducted through the laboratory of M/s. Green Envirosafe Engineers & Consultant Private Limited, Pune. Lab has received NABL accreditation and has been approved by MoEF; New Delhi. Further it has also received ISO 9001:2008, ISO 14001:2004 OHSAS 18001–2007 certifications by DNV.
Ambient air monitoring was conducted in the study area to assess the quality of air for PM10, PM2.5, SO2, NOx and CO. The various monitoring stations selected are shown in following table
Table 19 - Ambient Air Quality Monitoring (AAQM) Locations AAQM Station
Code Name of the
Station Station
Location Distance from the
Site (Km) Direction w.r.t.
the Site A1 Industrial Site - -- -- A2 Nhavi Nearest
Habitation 1.82 SSE
A3 Pimpri Downwind 2.30 W A4 Arvi Downwind 5.78 S A5 Velu Up- Wind 2.21 NE A6 Landewadi Crosswind 5.22 SSE A7 Sap Crosswind 2.93 NW A8 Pawarwadi Crosswind 3.68 SE
Table 20 - Summary of the AAQ Monitoring Results for Season [October – November – December 2018]
Location Industrial
Site Nhavi Pimpri Arvi Velu Landewadi Sap Pawarwadi
PM10
µg/M3 Max. 64.95 61.35 62.79 62.83 63.58 63.57 64.59 63.28 Min. 53.76 51.81 53.34 51.06 53.62 51.93 51.91 51.72 Avg. 58.84 56.04 57.32 56.00 57.81 57.20 58.18 57.29 98% 62.02 60.22 61.49 60.17 61.98 60.81 61.45 60.70
PM2.5
µg/M3 Max. 30.54 27.96 27.61 27.28 26.10 28.78 27.32 26.44 Min. 20.04 18.39 20.05 20.10 20.61 21.28 20.52 21.11 Avg. 21.84 23.82 23.50 23.00 23.91 24.49 24.08 23.75 98% 27.31 26.80 26.31 26.11 25.81 27.31 26.54 26.18
SO2
µg/M3 Max. 30.54 24.14 25.21 26.65 27.65 24.98 29.58 27.89 Min. 20.34 18.39 19.83 18.68 18.56 18.71 18.57 20.53 Avg. 25.64 21.38 22.19 22.19 22.63 21.35 23.14 23.80 98% 26.97 23.02 23.60 24.61 25.46 23.29 25.54 25.45
NOx µg/M3
Max. 32.63 31.91 31.88 33.01 30.55 32.71 34.28 34.33 Min. 29.30 28.06 29.01 27.59 25.57 27.96 29.15 27.79 Avg. 30.69 29.97 30.41 29.84 28.05 30.19 31.42 30.58 98% 31.47 30.72 31.20 30.66 29.20 31.21 32.85 32.22
CO mg/M3
Max. 0.15 0.14 0.16 0.16 0.15 0.15 0.15 0.15 Min. 0.07 0.06 0.07 0.05 0.06 0.09 0.08 0.08 Avg. 0.11 0.10 0.12 0.11 0.11 0.12 0.11 0.11 98% 0.14 0.13 0.15 0.13 0.13 0.14 0.13 0.13
Notes: PM10, PM2.5, SO2 and NOx are computed based on 24 hourly values, CO concentrations were observed to be well below detectable limits and hence the same are not mentioned in the above table.
14

Table 21 - National Ambient Air Quality Standards (NAAQS) Specified by CPCB Notification (New Delhi, the 18th November, 2009)
Zone Station Industrial, Residential and Rural
Area Ecosensitive Area Notified by
Govt. PM10
µg/M3 24 Hr 100 100 A.A. 60 60
PM2.5
µg/M3 24 Hr 60 60 A.A. 40 40
SO2
µg/M3 24 Hr 80 80 A.A. 50 20
NOx µg/M3
24 Hr 80 80 A.A. 40 30
CO mg/M3 8 Hr 4 4 1 Hr 2 2
Water Quality
Sampling and analysis of water samples for physical, chemical and heavy metals were also undertaken through the laboratory of M/s. Green Envirosafe Engineers & Consultant Private Limited, Pune.
As per standard ToRs 8 locations for surface water and 8 locations for ground water were selected. The locations are mentioned below-
Table 22 - Monitoring Locations for Surface Water
Station Code Name of the Station Distance from the
Site (Km) Direction w.r.t. the
Site SW1 Nhavi 1.29 SSE SW2 Pimpri 1.67 SW SW3 Project Site 0.93 SW SW4 Takale 9.76 WWS SW5 Nigadi Vandan 9.86 W SW6 Belewadi 2.99 NE SW7 Sap 4.44 NW SW8 Apshinge 8 NW
Table 23 - Monitoring Locations for Ground Water Station Code Geographical Location Distance from the
Centre of Site (M) Direction w.r.t.
Site GW1 17°33'22.78"N, 74°14'39.21"E GW2 17°33'31.41"N,17°33'31.41"N GW3 17°33'27.72"N, 74°14'38.75"E GW4 17°33'50.17"N, 74°14'55.99"E GW5 17°33'42.70"N, 74°14'50.49"E GW6 17°33'26.59"N, 74°14'49.98"E GW7 17°33'17.11"N, 74°15'2.09"E GW8 17°33'23.53"N, 74°15'6.61"E
The results observed after monitoring for above locations are well within the limits as per IS10500:2012. Refer Chapter 3, section 3.9.2 table 3.14 & table 3.15 for analysis results of surface water and ground water.
15

F. Noise Level Survey
The study area of 10 Km radius with reference to the proposed expansion project site has been covered for noise environment. The four zones viz. Residential, Commercial, Industrial and Silence Zones have been considered for noise monitoring. Some of the major arterial roads were covered to assess the noise due to traffic. Noise monitoring was undertaken for 24 hours at each location. The details of noise monitoring stations are given in following table
Table 24 - Noise Sampling Locations & Ambient Noise Levels
Station Code
Name of the Sampling Point Direction Distance
(Km) Average Noise Level in dB(A)
L10 L50 L90 Leq(day) Leq(night) Ldn N1 Industrial Site -- -- 58.69 61.70 70.24 69.7 60.4 70.0 N2 Ambheri N 4.71 42.89 44.85 47.15 51.0 39.6 50.5 N3 Rahimatpur NW 6.89 42.24 44.45 47.06 50.8 38.9 50.2 N4 Wathar SW 6.85 42.29 44.40 48.00 50.2 40.2 50.2 N5 Arvi SW 5.98 41.82 44.10 46.22 50.1 39.0 49.7 N6 Nagjari S 7.61 43.21 44.15 47.16 52.1 39.0 51.2 N7 Nhavi SE 1.93 43.15 44.55 47.61 52.9 39.1 51.8 N8 Nandoshi SE 6.68 43.21 43.15 47.16 52.1 39.0 51.2
G. Socio-Economic Profile
Socio-economic status of the population is an indicator for the development of the region. Any developmental project of any magnitude will have a bearing on the living conditions and on the economic base of population in particular and the region as a whole. Chapter 3 may be referred for details of this aspect.
H. Ecology
Field survey for ecology and biodiversity studies were carried out on 15.11.2018 to 18.11.2018 for proposed expansion of SSL. Before selecting field study sites, a preliminary survey of the study area was done with help of toposheet, landuse maps, census data, satellite imagery as well as literature review. Total 47 villages out of which 9 villages fall in 5 km radius and 38 villages fall between 5 to 10 km radius.
In field study random sampling and opportunistic method was used for study of flora and fauna. In addition, a questionnaire survey, comprising of 21 ecology-biodiversity related questions in Marathi was carried out. Chapter 3 may be referred for details of this aspect.
Table 25 Villages visited for EB field study and questionnaire survey
In radius 0 to 5 Km In radius 5 to 10 Km Sr. No.
Names of Study villages Sr. No.
Names of Study villages
1 Pimpri 10 Boriv 2 Sap 11 Takle 3 Velu 12 Borgaon 4 Ambhari 13 Kombadwadi 5 Belwade 14 Nagjhari 6 Surli 15 Nandoshi 7 Nhavi Bk 16 Aundh
16

8 Powarwadi 17 Ambheri 9 Khabalwadi
Observations
1. The study area is a mosaic of manmade ecosystems i.e. agriculture, horticulture and naturalterrestrial ecosystems such as woodland, grassland, fallow land, scrub and wetlands such aspercolation tanks, streams and river.
2. Due to availability of water through lift irrigation from River Krishna in the West and someseasonal village tanks, major part of cultivated area is under sugarcane along with turmeric andginger.
3. Aquatic habitats studied include 16 water tanks near villages namely Velu, Belwade, Pawarwadi,Nandoshi, Nagzari, Kombadwadi, Ambheri, Boriv and Borgaon and marshy areas, streams andstretches of Krishna River.
4. Near villages and settlements washing of clothes and vehicles, dumping of solid wastes, anddischarge of untreated domestic sewage, non point run off of agro-chemicals from the adjoiningpredominant sugarcane cultivation in the Krishna catchments is polluting the streams, villagetanks and the river causing cumulative adverse environmental impact on ecology and biodiversityof the area.
8) ADDITIONAL STUDIES & INFORMATION
Risks Assessment –
Risk to human health is inherent. It is safe only when the installation is dismantled at the end of its useful life. The following principles should be used as guidelines for the selection of risk criteria - 1. The increase in risk, caused by the presence of the plant to local community (i.e. neighboring
public) should be negligible in comparison to the risk they already have in their daily life. 2. The work force on the plant should be expected to accept a potentially greater risk than the
members of the local community since the work force have been trained to protect themselves from the possible hazards and thus reducing the actual risk to themselves.
The risk criteria considered by Green A.G. (1982) are given as below:
1. Risk to Plant: This risk is to be given priority only when it is proved beyond doubt that the risk tolife is so low that reducing this risk may not be justified. Under this consideration, the risk toeconomic damage may be considered.
2. Risk to Public and Employees: The scale used for risk to employee and public is Fatal AccidentRate (F.A.R.) or more commonly Fatal Accident Frequency Rate. (F.A.F.R.). The F.A.R. andF.A.F.R. is defined as number of deaths from industrial injury expected in a group of 1000 menduring their working period.
For more details w.r.t. this aspect, Chapter 7 may be referred.
9) SALIENT FEATURES OF EMP
1. Management during Construction Phase
During construction phase, following recommendations are suggested-
17

Suitable measures should be taken to protect workers against dust arising from leveling, drilling, crushing, excavation and transportation. Extensive tree plantation programme would be carried out along the boundaries of the proposed plant and internal roads.
The construction site should be provided with sufficient and suitable sanitation facilities for workers to maintain proper standards of hygiene. Noise prone activities would be restricted during night particularly between the period 22 hrs to 06 hrs in order to have minimum adverse impact. 2. Management during Post Construction Phase Measures to be taken during the post construction phase especially w.r.t. monitoring are presented below-
Table 26 - Plan for Monitoring of Environmental Attributes within Industrial Premises
No. Description Location Parameters Frequency Person Responsible Conducted by
1 Ambient Air Quality Upwind-1, Downwind-2 (Near Cane Yard, Near Bagasse yard, Near Colony)
PM2.5, PM10, SO2,NOx&CO Monthly EHS Officer
MoEFCC and NABL
Approved External
Laboratory
2 Work Zone Air Quality
4 Locations (Mill section, Fermentation section, Sugar bagging section, Distillation section)
PM10, PM2.5, SO2, NOx, CO
Monthly or CPCB / SPCB requirement
3 Stack Emissions Boiler – 2 Nos. 2 Nos.(Distillery and Co-gen boiler) D.G – 2 Nos.
SPM, SO2, NOx Monthly
4 Ambient Noise 5 Locations - (Near Main Gate, Near ETP, Near Sugar Godown, Near fermentation Area, Near Cane Yard)
Spot Noise Level recording; Leq(n), Leq (d), Leq (dn)
Monthly
EHS Officer
Work zone Noise Premises –5 Nos. (Mill section, Distillation section, Boiler, DG set, Turbine section)
Spot Noise Level recording; Leq(n),Leq(d), Leq(dn)
Monthly
5 Effluent • Treated • Untreated
pH, SS, TDS, COD, BOD, Chlorides, Sulphates, Oil & Grease.
Monthly
EHS Officer
MoEFCC and
NABL Approved External
Laboratory
6 Drinking Water Admin Office, Boiling Section & ETP Office Parameters as per drinking water Std IS:10500
Monthly
7 Fugitive Emissions Bagasse Yard VOC Monthly
8 Waste Management Implement waste management plan that Identifies and Records of Solid Waste Twice in a year EHS Officer
18
No. Description Location Parameters Frequency Person Responsible Conducted by
characterizes every waste associated with proposed & expansion activities and which identifies the procedures for collection, handling & disposal of each waste arising.
Generation, Treatment and Disposal shall be maintained
By SSL
9 Emergency Preparedness as Fire Fighting
Fire protection and safety measures to take care of fire and explosion hazards, to be assessed and steps taken for their prevention.
On site Emergency Plan, Evacuation Plan, fire fighting mock drills
Twice a year Safety Officer
10 Health Check up Employees and migrant labour health check ups All relevant health check-up parameters as per factories act.
Once in a Year Safety Officer
11 Green Belt Within Industry premises as well as nearby villages Survival rate of planted sapling.
In consultation with DFO.
Environmental Engineer/ Safety
Officer
19


![INDEX [164.100.154.113]164.100.154.113/notices/pdf/Executive_Summary_eng_11062018.pdf1 Summary EIA Report for Proposed Expansion of Sugar Factory from 5,000 TCD to 10,000 TCD (i.e](https://img.pdfslide.us/doc/110x75/5e0a3f85345d48415e08be75/index-164100154113164100154113noticespdfexecutivesummaryeng-summary.jpg)