Embed Size (px)
Citation preview
Lidl UK GmbH / James and Jenkins
Proposed Change of Use Application, Llandaff North, Cardiff
Transport Assessment
May 2014
i
Contents
1 INTRODUCTION ........................................................................................................... 1
2 EXISTING CONDITIONS ................................................................................................. 2
Site Details .................................................................................................................. 2
Existing/Extant Use ...................................................................................................... 2
Site Access ................................................................................................................... 3
Local Highway Network ............................................................................................... 3
A4054 Station Road ............................................................................................ 3
Pedestrians and Cyclists ............................................................................................... 4
Accessibility by Public Transport .................................................................................. 8
Public Transport ................................................................................................. 8
Rail .............................................................................................................................. 9
Accident Analysis ......................................................................................................... 9
Base Year Traffic Flows .............................................................................................. 10
Base Year Traffic Speeds ............................................................................................ 12
3 DEVELOPMENT PROPOSALS ....................................................................................... 13
Development Composition ........................................................................................ 13
Vehicular Access ........................................................................................................ 13
Pedestrian/Cycling facilities ....................................................................................... 13
Parking ...................................................................................................................... 14
Internal Highway Layout ............................................................................................ 15
Servicing .................................................................................................................... 15
4 TRAFFIC ANALYSIS ..................................................................................................... 16
Background Traffic Growth ........................................................................................ 16
Committed Development........................................................................................... 16
Traffic Generation ...................................................................................................... 16
Extant/Permitted Use ................................................................................................ 19
Trip Type Assessment ................................................................................................ 20
Distributions .............................................................................................................. 22
Effect on the Network ................................................................................................ 22
Junction Capacity analysis .......................................................................................... 23
Summary ......................................................................................................... 24
Forecast Parking Utilisation ....................................................................................... 25
5 SUMMARY AND CONCLUSIONS .................................................................................. 26
Summary ................................................................................................................... 26
Conclusion ................................................................................................................. 27
ii
Figures
Figure 1 ‐ Site Location Plan
Figures 2a/b ‐ 2km and 5km Accessibility Catchment
Figure 3 ‐ Extract from Cardiff’s Cycling Map
Figure 4 ‐ Annual PIA Profile
Figure 5 ‐ Observed Traffic Flows – Pentwyn Road – Friday AM and PM Peak
Figure 6 ‐ Observed Traffic Flows – Pentwyn Road – Saturday Peak
Figures 7‐9 ‐ 2015 Forecast Opening Year Traffic Flows
Figures 10‐12 ‐ 2020 Forecast Design Year Traffic Flows
Figures 13‐15 ‐ Forecast Development Traffic Distributions
Figures 16‐18 ‐ 2020 Forecast Design Year with Development Traffic Flows
Figure 19 ‐ Forecast Parking Utilisation
Drawings
W141264/SK/02 ‐ Proposed Site Layout
W141264/AT/A01 ‐ Vehicle Swept Path Analysis
Appendices
Appendix A ‐ Agreed Scope of Transport Statement
Appendix B ‐ PIA Data
Appendix C ‐ Traffic Surveys
Appendix D ‐ NTM Traffic Growth
Appendix E ‐ TRICS Outputs
Appendix F ‐ PICADY Outputs
Lidl – Llandaff North, Cardiff 1
H:\Projects\W140000\W141264 ‐ Lidl – Llandaff North\Word\R01‐TB‐141264‐14_03_18 ‐ TA‐Final.docx
May 2014
1 INTRODUCTION
1.1 Vectos is retained by Lidl UK GmbH and James and Jenkins to provide traffic and transport
advice in support of their planning application for a change of use application on the former
James and Jenkins garage and car showroom on Station Road in Llandaff North, Cardiff.
1.2 It is proposed to develop the site which has an existing GFA of 2,582 m2 to accommodate a
Lidl food retail store with a Gross Internal Area (GIA) of 1,732 m2 and associated car parking
and servicing facilities.
1.3 This Transport Assessment has been prepared to assess:
the sites accessibility by sustainable modes of transport;
the trip attraction associated with the proposed redevelopment of the site and potential
impact on the adjoining local highway network;
the proposed access arrangements to the site, including junction capacity assessment
based on traffic surveys at the site access junction for the Friday AM, PM and Saturday
peak periods; and
the servicing arrangements and parking provision within the site.
1.4 The scope of this Transport Assessment has been agreed with the traffic and transportation
officers within Cardiff Council (CC). A copy of the agreed scope is included in Appendix A.
1.5 The structure of the report is as follows:
Section 2: sets out the existing conditions;
Section 3: provides details of the development proposals;
Section 4: details the forecast vehicular trip attraction to the proposal and provides
comment on the effect on the:
adjacent highway;
the utilisation of the car park;
the proposed servicing arrangements; and
Section 5: Provides a summary and conclusions.
Lidl – Llandaff North, Cardiff 2
H:\Projects\W140000\W141264 ‐ Lidl – Llandaff North\Word\R01‐TB‐141264‐14_03_18 ‐ TA‐Final.docx
May 2014
2 EXISTING CONDITIONS
Site Details
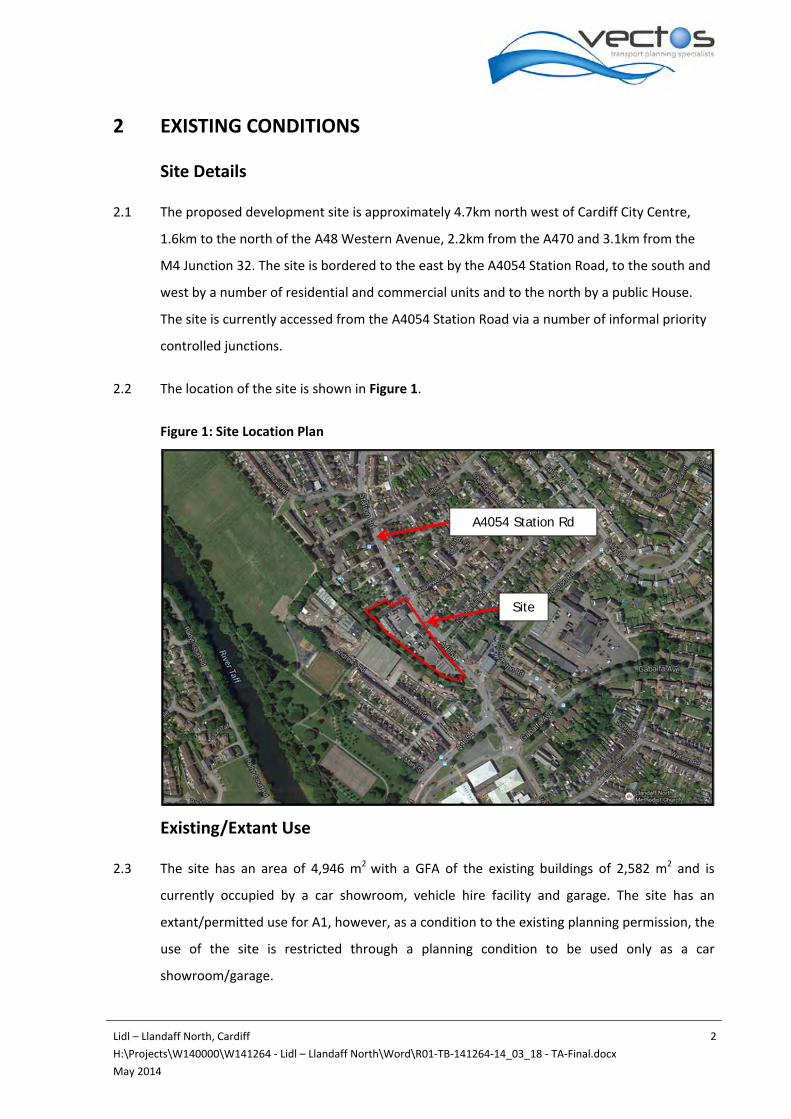
2.1 The proposed development site is approximately 4.7km north west of Cardiff City Centre,
1.6km to the north of the A48 Western Avenue, 2.2km from the A470 and 3.1km from the
M4 Junction 32. The site is bordered to the east by the A4054 Station Road, to the south and
west by a number of residential and commercial units and to the north by a public House.
The site is currently accessed from the A4054 Station Road via a number of informal priority
controlled junctions.
2.2 The location of the site is shown in Figure 1.
Figure 1: Site Location Plan
Existing/Extant Use
2.3 The site has an area of 4,946 m2 with a GFA of the existing buildings of 2,582 m2 and is
currently occupied by a car showroom, vehicle hire facility and garage. The site has an
extant/permitted use for A1, however, as a condition to the existing planning permission, the
use of the site is restricted through a planning condition to be used only as a car
showroom/garage.
Site
A4054 Station Rd
Lidl – Llandaff North, Cardiff 3
H:\Projects\W140000\W141264 ‐ Lidl – Llandaff North\Word\R01‐TB‐141264‐14_03_18 ‐ TA‐Final.docx
May 2014
2.4 The site is ideally located to meet the convenience shopping needs in this part of Cardiff. It
will cater mainly for food and convenience shopping needs, as well as the 'top‐up' shopping
requirements of a significant walk‐in catchment population. There will also, due to the
location of the site, be an element of pass‐by and linked trips.
Site Access
2.5 There are currently a number of formal and informal vehicular access points and cross over
areas to the site from the A4054 Station Road. Pedestrian access is provided via the footways
adjacent to Station Road. Cyclists are accommodated on the road in the vicinity of the site.
Local Highway Network
A4054 Station Road
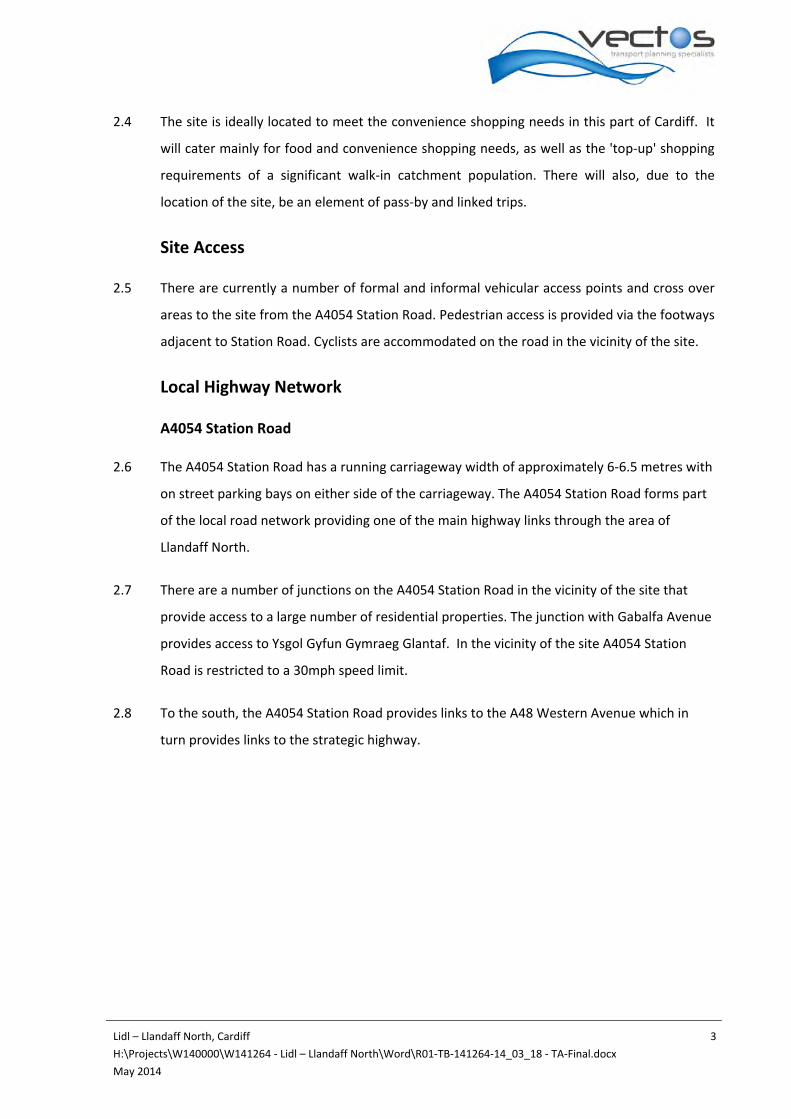
2.6 The A4054 Station Road has a running carriageway width of approximately 6‐6.5 metres with
on street parking bays on either side of the carriageway. The A4054 Station Road forms part
of the local road network providing one of the main highway links through the area of
Llandaff North.
2.7 There are a number of junctions on the A4054 Station Road in the vicinity of the site that
provide access to a large number of residential properties. The junction with Gabalfa Avenue
provides access to Ysgol Gyfun Gymraeg Glantaf. In the vicinity of the site A4054 Station
Road is restricted to a 30mph speed limit.
2.8 To the south, the A4054 Station Road provides links to the A48 Western Avenue which in
turn provides links to the strategic highway.
Lidl – Llandaff North, Cardiff 4
H:\Projects\W140000\W141264 ‐ Lidl – Llandaff North\Word\R01‐TB‐141264‐14_03_18 ‐ TA‐Final.docx
May 2014
Photograph 1: A4054 Station Road in the vicinity of the site
.
Pedestrians and Cyclists
2.9 One of the main factors demonstrating the suitability of a development site is its accessibility
by non‐car modes of transport. This helps to reduce the reliance on the use of the private car
as well as promoting the aims of ‘smarter’ travel choices.
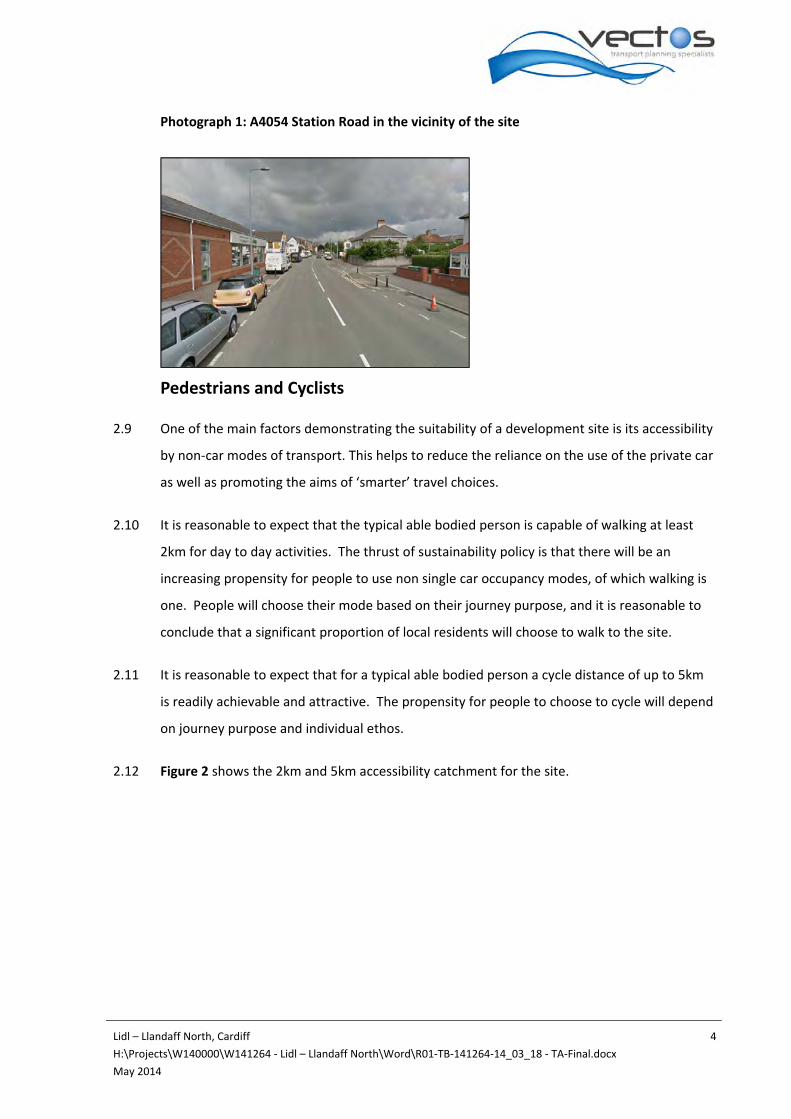
2.10 It is reasonable to expect that the typical able bodied person is capable of walking at least
2km for day to day activities. The thrust of sustainability policy is that there will be an
increasing propensity for people to use non single car occupancy modes, of which walking is
one. People will choose their mode based on their journey purpose, and it is reasonable to
conclude that a significant proportion of local residents will choose to walk to the site.
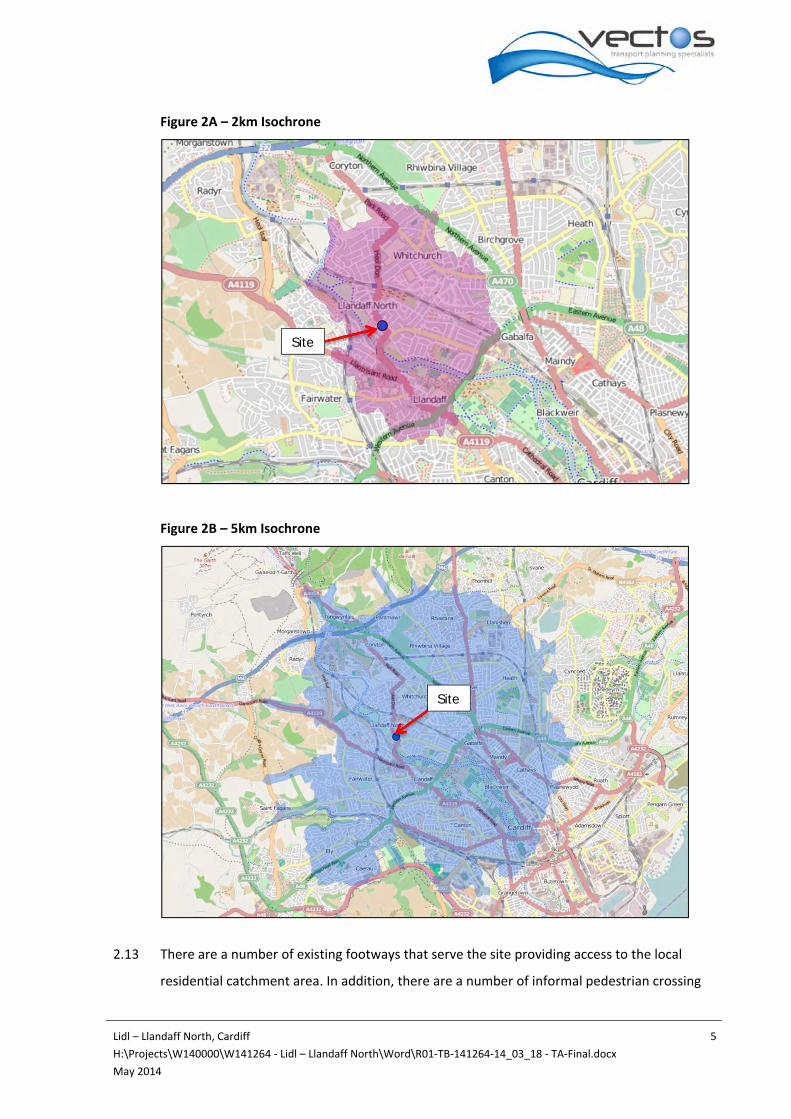
2.11 It is reasonable to expect that for a typical able bodied person a cycle distance of up to 5km
is readily achievable and attractive. The propensity for people to choose to cycle will depend
on journey purpose and individual ethos.
2.12 Figure 2 shows the 2km and 5km accessibility catchment for the site.
Lidl – Llandaff North, Cardiff 5
H:\Projects\W140000\W141264 ‐ Lidl – Llandaff North\Word\R01‐TB‐141264‐14_03_18 ‐ TA‐Final.docx
May 2014
Figure 2A – 2km Isochrone
Figure 2B – 5km Isochrone
2.13 There are a number of existing footways that serve the site providing access to the local
residential catchment area. In addition, there are a number of informal pedestrian crossing
Site
Site
Lidl – Llandaff North, Cardiff 6
H:\Projects\W140000\W141264 ‐ Lidl – Llandaff North\Word\R01‐TB‐141264‐14_03_18 ‐ TA‐Final.docx
May 2014
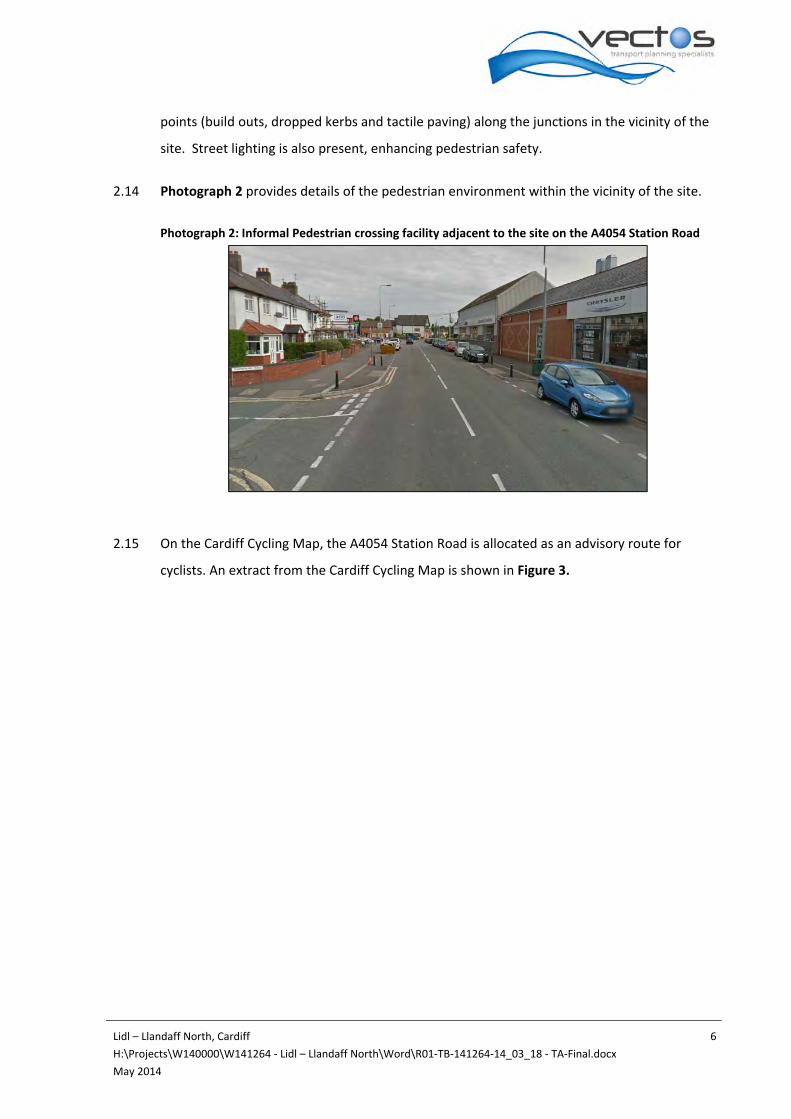
points (build outs, dropped kerbs and tactile paving) along the junctions in the vicinity of the
site. Street lighting is also present, enhancing pedestrian safety.
2.14 Photograph 2 provides details of the pedestrian environment within the vicinity of the site.
Photograph 2: Informal Pedestrian crossing facility adjacent to the site on the A4054 Station Road
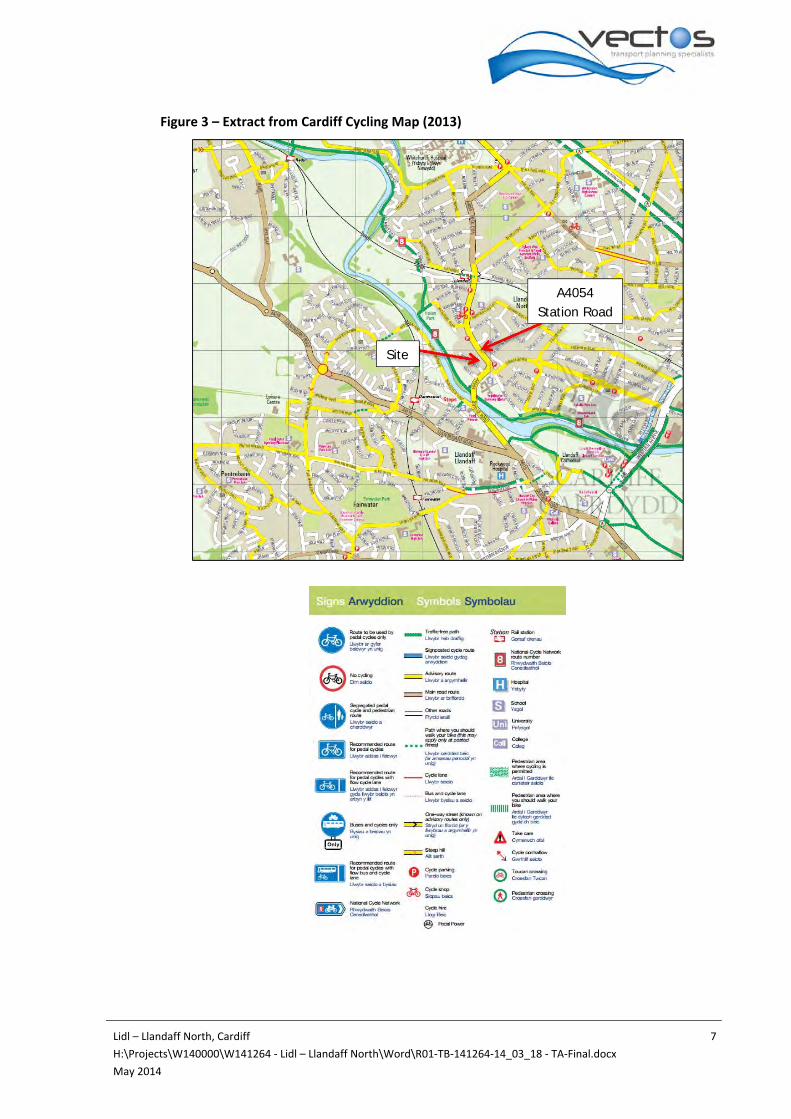
2.15 On the Cardiff Cycling Map, the A4054 Station Road is allocated as an advisory route for
cyclists. An extract from the Cardiff Cycling Map is shown in Figure 3.
Lidl – Llandaff North, Cardiff 7
H:\Projects\W140000\W141264 ‐ Lidl – Llandaff North\Word\R01‐TB‐141264‐14_03_18 ‐ TA‐Final.docx
May 2014
Figure 3 – Extract from Cardiff Cycling Map (2013)
A4054 Station Road
Site
Lidl – Llandaff North, Cardiff 8
H:\Projects\W140000\W141264 ‐ Lidl – Llandaff North\Word\R01‐TB‐141264‐14_03_18 ‐ TA‐Final.docx
May 2014
2.16 As Figure 3 shows, the advisory cycle route along the A4054 Station Road links to National
Cycle Route 8 which is a traffic free route. There is also cycle parking at a number of
locations on Station Road in the form of Sheffield Stands.
Accessibility by Public Transport
Public Transport
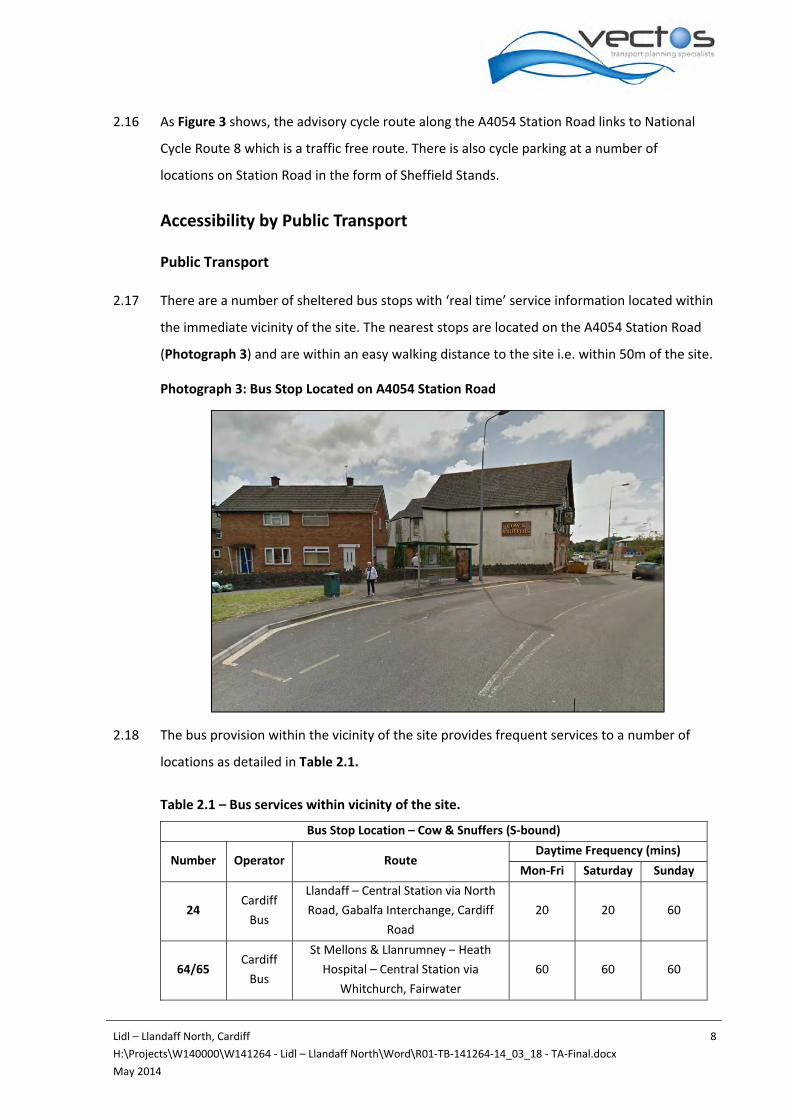
2.17 There are a number of sheltered bus stops with ‘real time’ service information located within
the immediate vicinity of the site. The nearest stops are located on the A4054 Station Road
(Photograph 3) and are within an easy walking distance to the site i.e. within 50m of the site.
Photograph 3: Bus Stop Located on A4054 Station Road
2.18 The bus provision within the vicinity of the site provides frequent services to a number of
locations as detailed in Table 2.1.
Table 2.1 – Bus services within vicinity of the site.
Bus Stop Location – Cow & Snuffers (S‐bound)
Number Operator Route Daytime Frequency (mins)
Mon‐Fri Saturday Sunday
24 Cardiff
Bus
Llandaff – Central Station via North
Road, Gabalfa Interchange, Cardiff
Road
20 20 60
64/65 Cardiff
Bus
St Mellons & Llanrumney – Heath
Hospital – Central Station via
Whitchurch, Fairwater
60 60 60

Lidl – Llandaff North, Cardiff 9
H:\Projects\W140000\W141264 ‐ Lidl – Llandaff North\Word\R01‐TB‐141264‐14_03_18 ‐ TA‐Final.docx
May 2014
Bus Stop Location – James & Jenkins (NW‐bound)
Number Operator Route Daytime Frequency (mins)
Mon‐Fri Saturday Sunday
25 Cardiff
Bus
Whitchurch – Central Station via
Cardiff Road, Gabalfa Interchange,
North Road
20 20 60
64/65 Cardiff
Bus
Central Station – Heath Hospital – St
Mellons & Llanrumney via Fairwater
– Whitchurch
60 60 60
Rail
2.19 Llandaf Rail Station is located approximately 700m to the north of the site and provides
routes to a number of destinations including:
Cardiff Central;
Merthyr Tydfil;
Barry Island;
Treherbert;
Bridgend; and
Aberdare.
2.20 There are half hourly services to Cardiff Central, Merthyr Tydfil, Barry Island, Treherbert and
Aberdare, and an hourly service is provided to Bridgend via Rhoose Cardiff International
Airport.
Accident Analysis
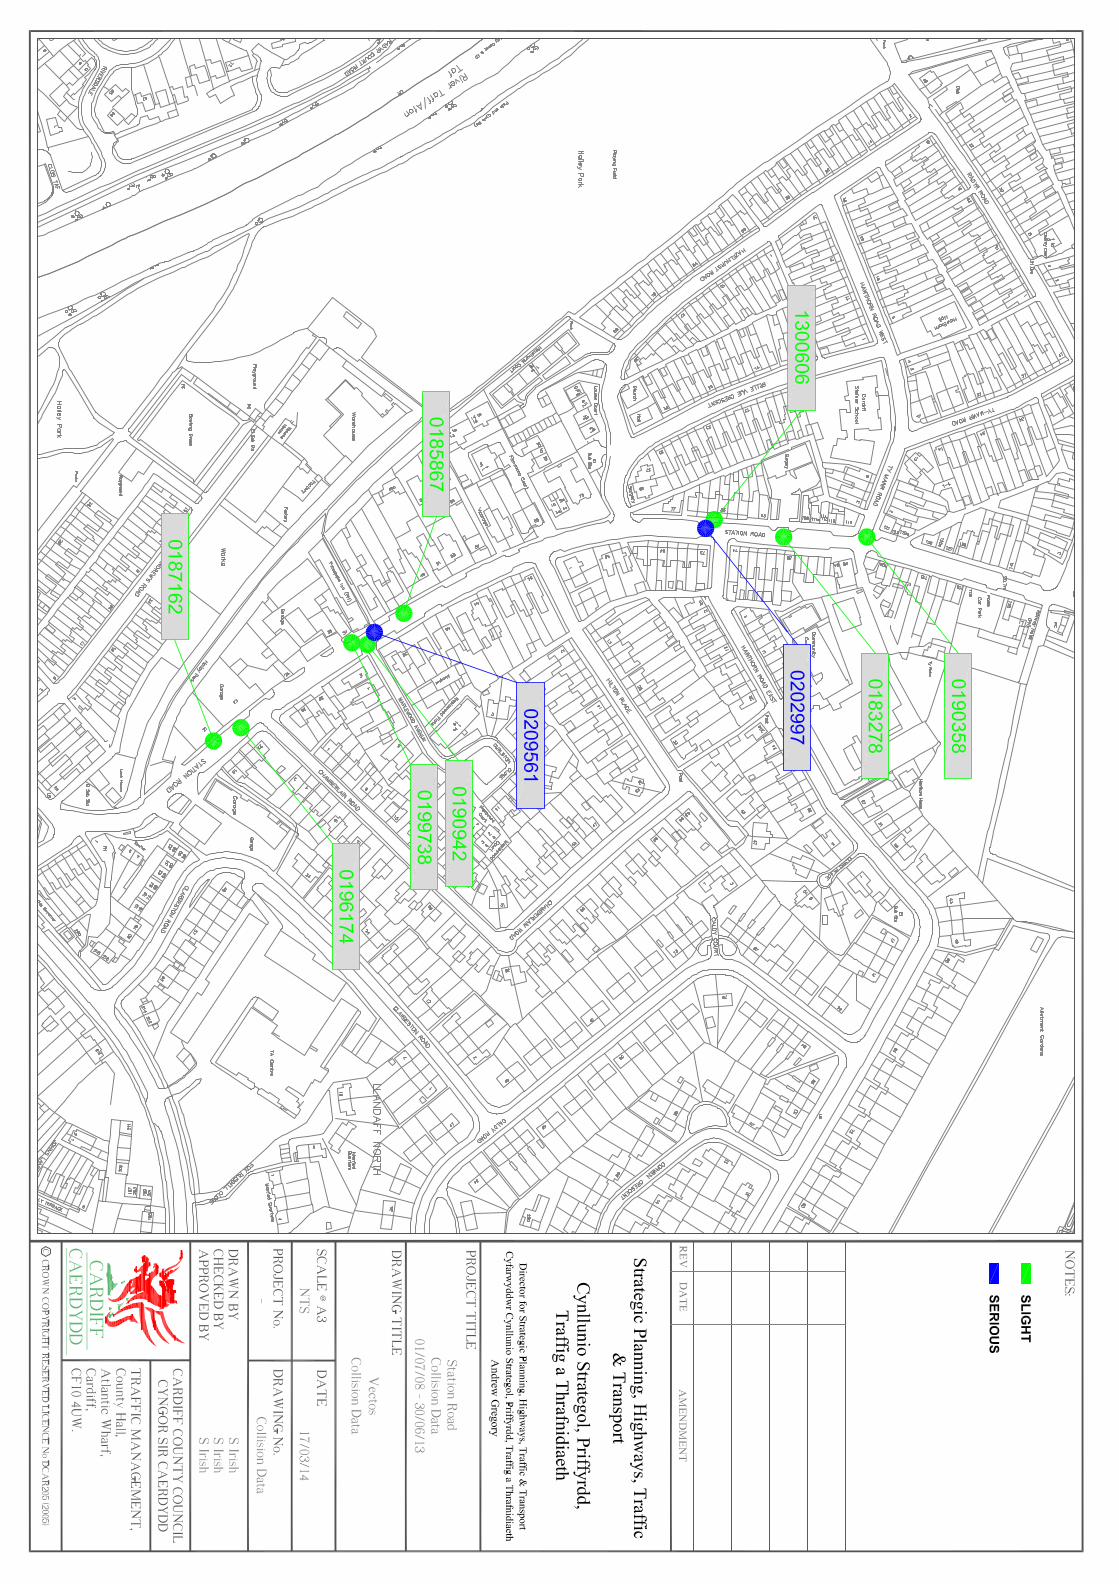
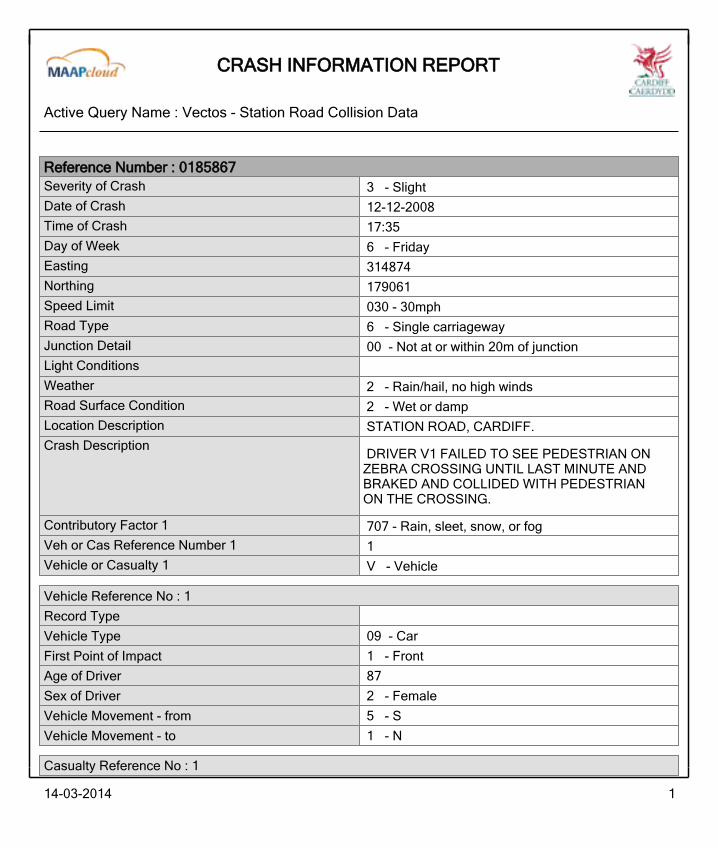
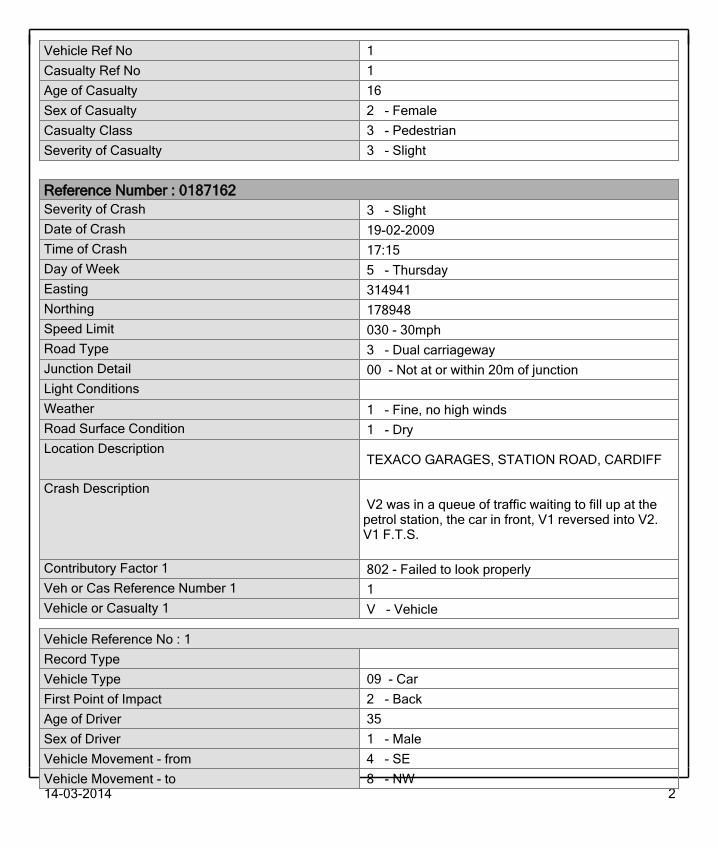
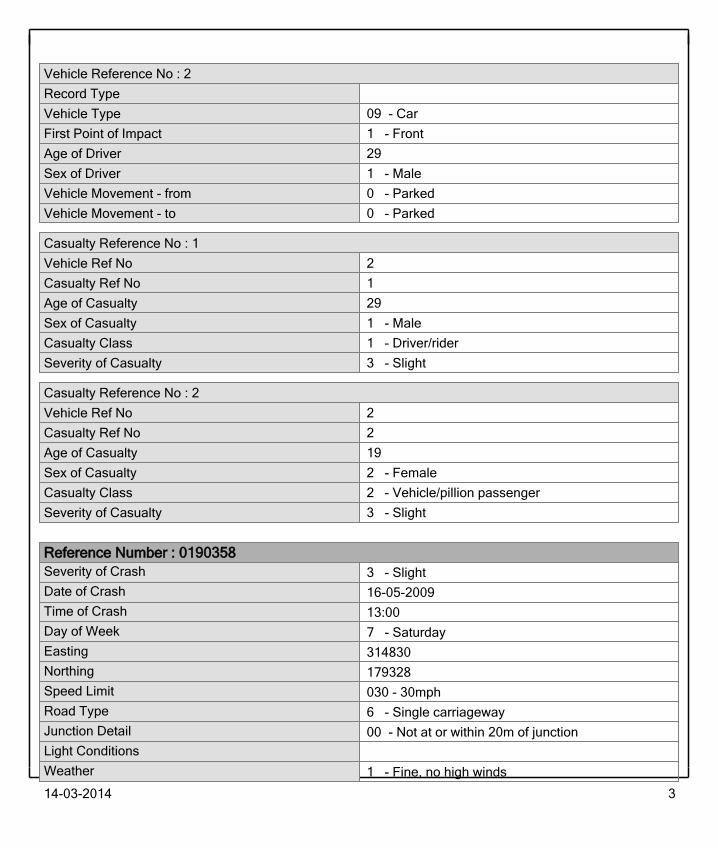
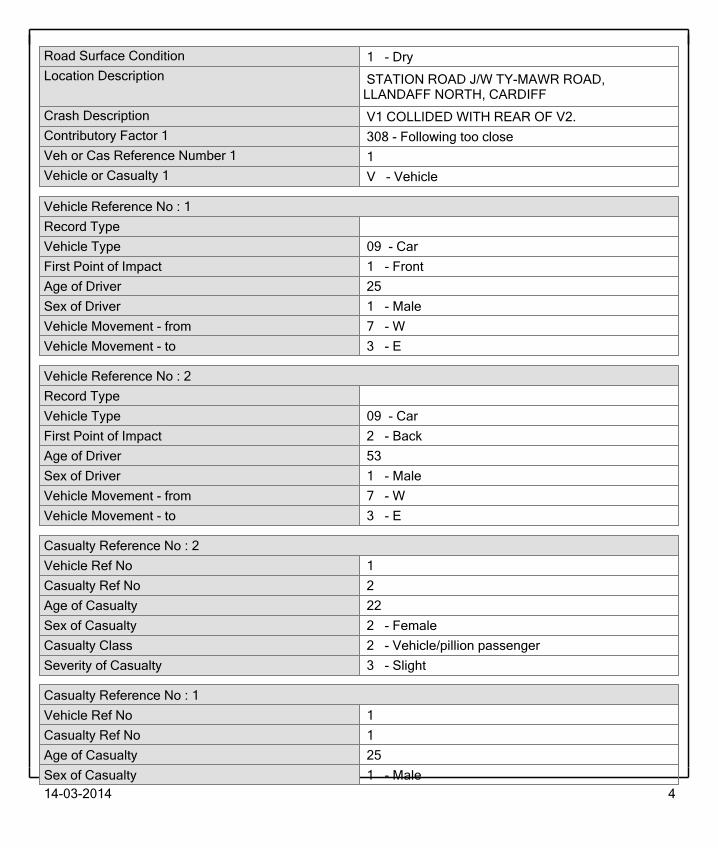
2.21 The latest Personal Injury Accident (PIA) data has been obtained from Cardiff Council for the
road network within the vicinity of the development site and reflects the most recent 5‐year
period whereby data is available (01/04/08 to 31/03/13). The location and severity of the
recorded accidents and detailed copy of the PIA data is attached in Appendix B.
2.22 An examination of the PIA data indicates that:
Within the study area (as detailed in the PIA location plan included in Appendix B) there
have been 10 recorded PIA’s over the most recent 5 year period;
Of these accidents, 8 were classified as slight and 2 serious in nature;
Of the accidents, 4 involved pedestrians, 1 involved a cyclist and 1 involved a bus;

Lidl – Llandaff North, Cardiff 10
H:\Projects\W140000\W141264 ‐ Lidl – Llandaff North\Word\R01‐TB‐141264‐14_03_18 ‐ TA‐Final.docx
May 2014
Two accidents were recorded near the site access.
Figure 4 – Annual PIA Profile
2.23 The accident profile as indicated in Figure 4 shows that there have been relatively few
accidents in the study area over the last 5 years. The likely contributory factors of the
recorded accidents are:
Adverse weather conditions;
Failure to look properly;
Following too close;
Loss of control;
Failure to judge other person’s path or speed; and
Pedestrian crossing road masked by stationary or parked car.
2.24 Based on the severity, frequency and contributory factors of the PIA’s, it is considered that
there is not a specific highway issue in the vicinity of the site. It is also considered that the
consolidation of the existing access arrangements as part of the proposals arrangements will
reduce the interaction of vehicles at this location and improve highway safety.
Base Year Traffic Flows
2.25 Base Year (2014) traffic flows have been obtained from an Automatic Traffic Counter (ATC)
placed on Station Road adjacent to the site access.
0
1
2
3
4
5
2008 2009 2010 2011 2012 2013 (to endof March)
No
. of
PIA
's
Year
Fatal Serious Slight
Lidl – Llandaff North, Cardiff 11
H:\Projects\W140000\W141264 ‐ Lidl – Llandaff North\Word\R01‐TB‐141264‐14_03_18 ‐ TA‐Final.docx
May 2014
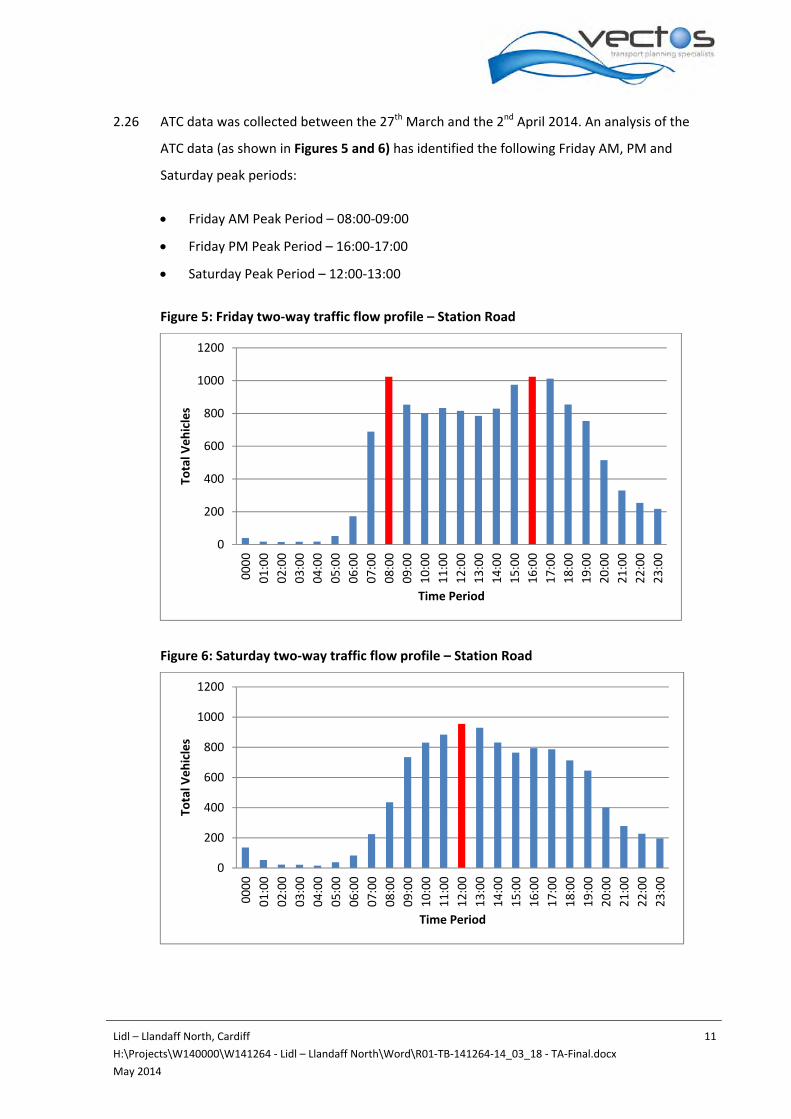
2.26 ATC data was collected between the 27th March and the 2nd April 2014. An analysis of the
ATC data (as shown in Figures 5 and 6) has identified the following Friday AM, PM and
Saturday peak periods:
Friday AM Peak Period – 08:00‐09:00
Friday PM Peak Period – 16:00‐17:00
Saturday Peak Period – 12:00‐13:00
Figure 5: Friday two‐way traffic flow profile – Station Road
Figure 6: Saturday two‐way traffic flow profile – Station Road
0
200
400
600
800
1000
1200
0000
01:00
02:00
03:00
04:00
05:00
06:00
07:00
08:00
09:00
10:00
11:00
12:00
13:00
14:00
15:00
16:00
17:00
18:00
19:00
20:00
21:00
22:00
23:00
Total V
ehicles
Time Period
0
200
400
600
800
1000
1200
0000
01:00
02:00
03:00
04:00
05:00
06:00
07:00
08:00
09:00
10:00
11:00
12:00
13:00
14:00
15:00
16:00
17:00
18:00
19:00
20:00
21:00
22:00
23:00
Total V
ehicles
Time Period
Lidl – Llandaff North, Cardiff 12
H:\Projects\W140000\W141264 ‐ Lidl – Llandaff North\Word\R01‐TB‐141264‐14_03_18 ‐ TA‐Final.docx
May 2014
Base Year Traffic Speeds
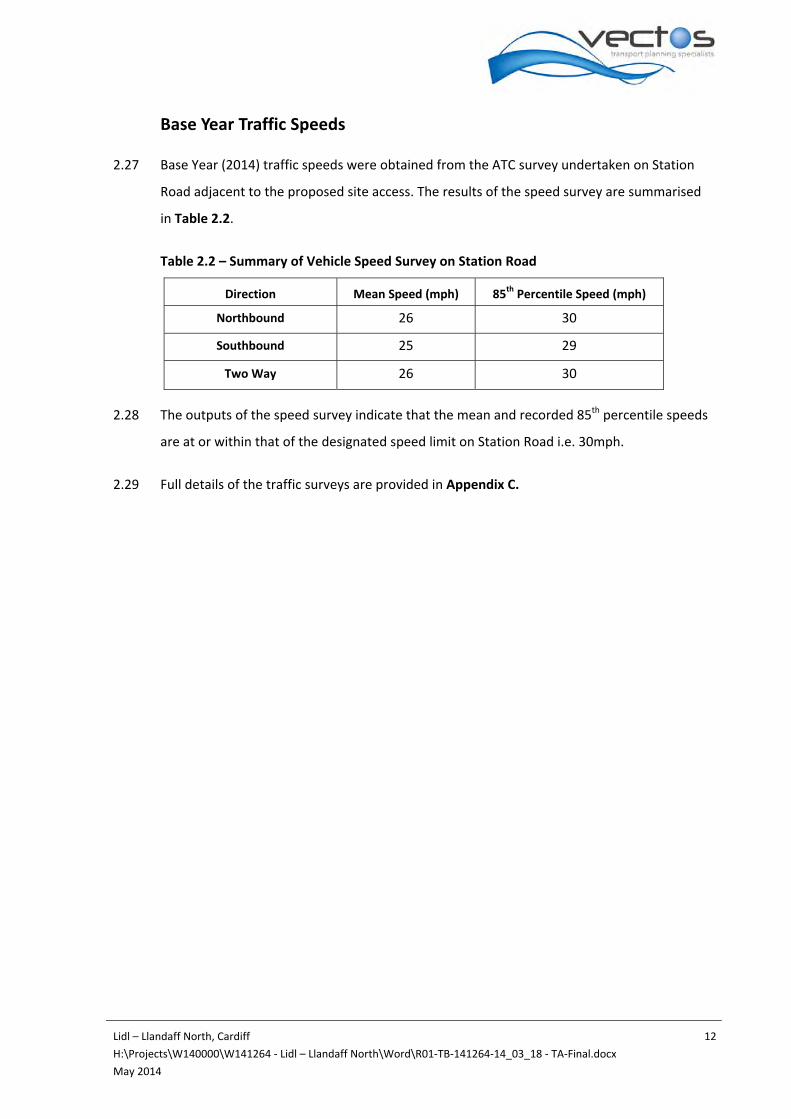
2.27 Base Year (2014) traffic speeds were obtained from the ATC survey undertaken on Station
Road adjacent to the proposed site access. The results of the speed survey are summarised
in Table 2.2.
Table 2.2 – Summary of Vehicle Speed Survey on Station Road
Direction Mean Speed (mph) 85th Percentile Speed (mph)
Northbound 26 30
Southbound 25 29
Two Way 26 30
2.28 The outputs of the speed survey indicate that the mean and recorded 85th percentile speeds
are at or within that of the designated speed limit on Station Road i.e. 30mph.
2.29 Full details of the traffic surveys are provided in Appendix C.

Lidl – Llandaff North, Cardiff 13
H:\Projects\W140000\W141264 ‐ Lidl – Llandaff North\Word\R01‐TB‐141264‐14_03_18 ‐ TA‐Final.docx
May 2014
3 DEVELOPMENT PROPOSALS
Development Composition
3.1 It is proposed to change the existing use of the site from car showroom/garages to A1
discount food retail with a GIA of 1732m2. The site was formally occupied by a complex of
car show rooms and garages, although at the time of writing this report the site was only
partially occupied with limited operational traffic associated with its use.
3.2 The previous planning permission restricted the use of the site to ‘Car Showroom’ therefore
effectively extinguishing the Permitted Development rights for the change of use of the
building to retail. The assessment has therefore been undertaken on this basis.
3.3 It is noted that although the site has an extant use for a car showroom with garages, for
robustness the gross impact of trip attraction of the proposed use has been assessed, with
no account taken of the net effect over the existing use.
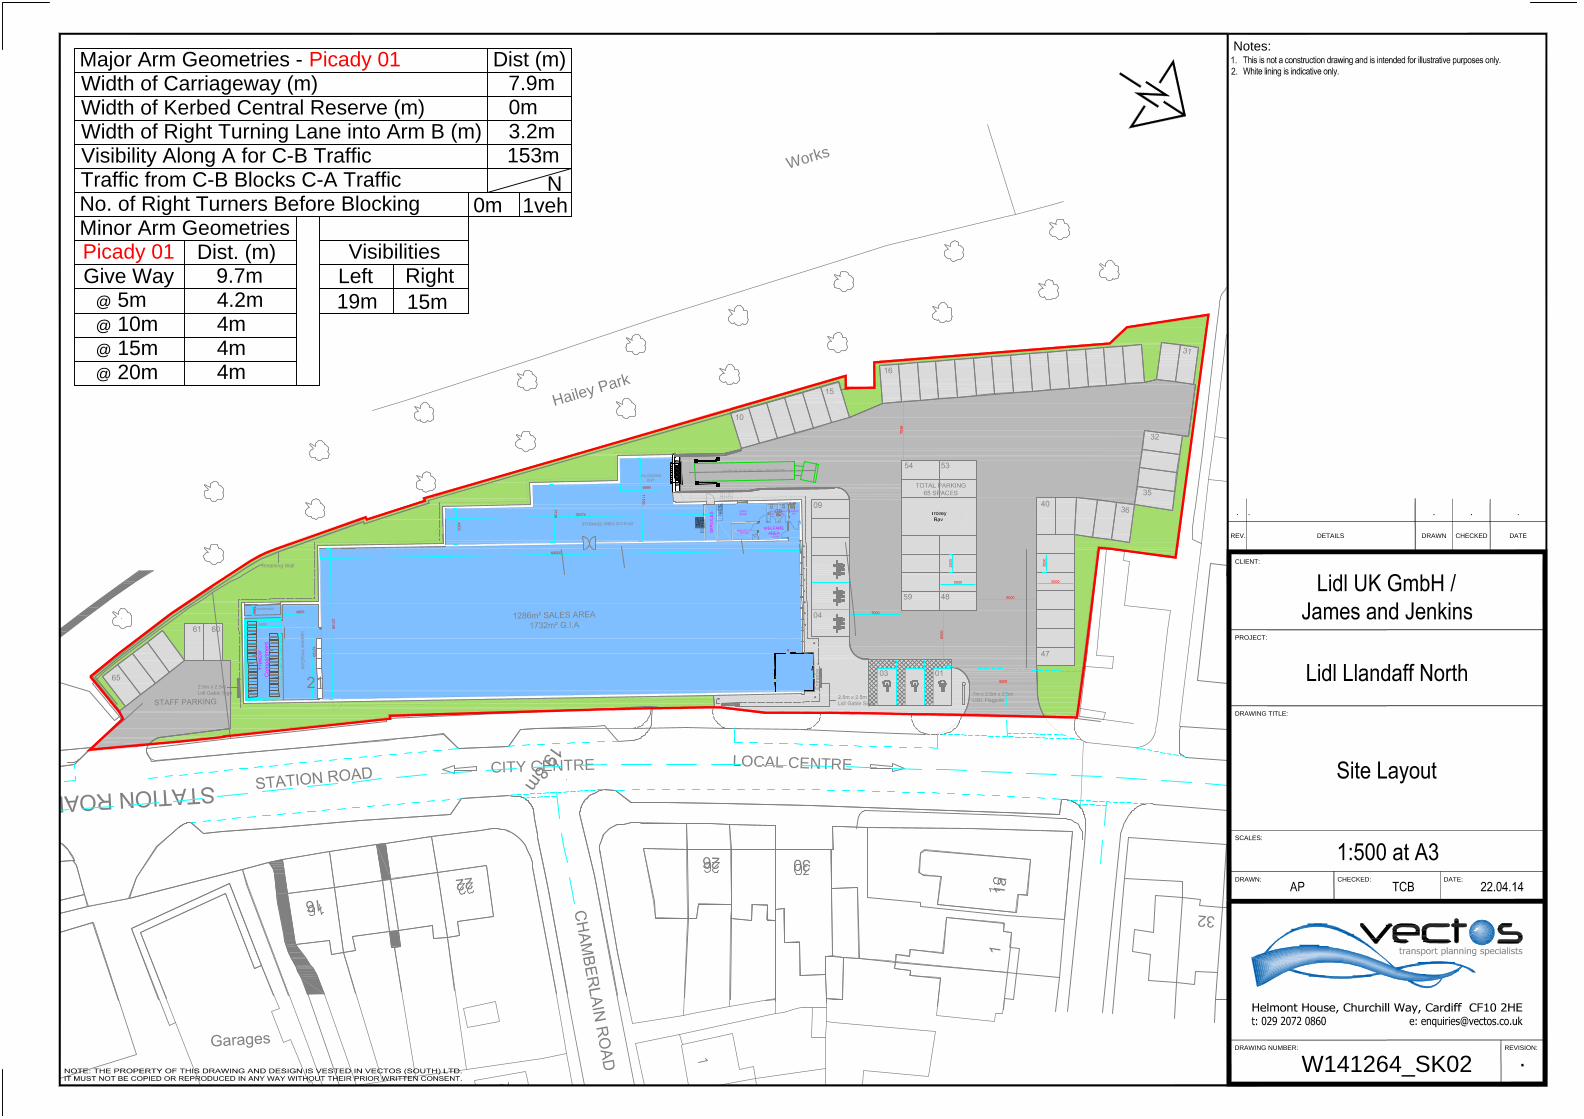
3.4 A copy of the proposed site plan including access and parking arrangements is shown in
Drawing Ref: W141264/SK/02.
Vehicular Access
3.5 The site will be accessed by customers and service vehicles via the existing northern most
access to the site. A staff parking area will also be provided to the south of the site and
accessed via the current southernmost access to the site. The proposed site access
arrangements are shown in Drawing Ref: W141264/SK/02.
Pedestrian/Cycling facilities
3.6 The existing Pedestrian and cycling facilities in the vicinity of the site are considered to be
very good. The location of the site is extremely well placed in terms of accessibility and
connects with the existing pedestrian and cycling network immediately adjacent to the site.
Cycle parking is also available at a number of locations on the A4054 Station Road.
3.7 Long term and short term cycle parking will be provided on site for the use of employees and
customers in a safe, secure and convenient location within the car park in close proximity to
the store entrance of the site as shown in Drawing Ref: W141264/SK/02.
Lidl – Llandaff North, Cardiff 14
H:\Projects\W140000\W141264 ‐ Lidl – Llandaff North\Word\R01‐TB‐141264‐14_03_18 ‐ TA‐Final.docx
May 2014
Parking
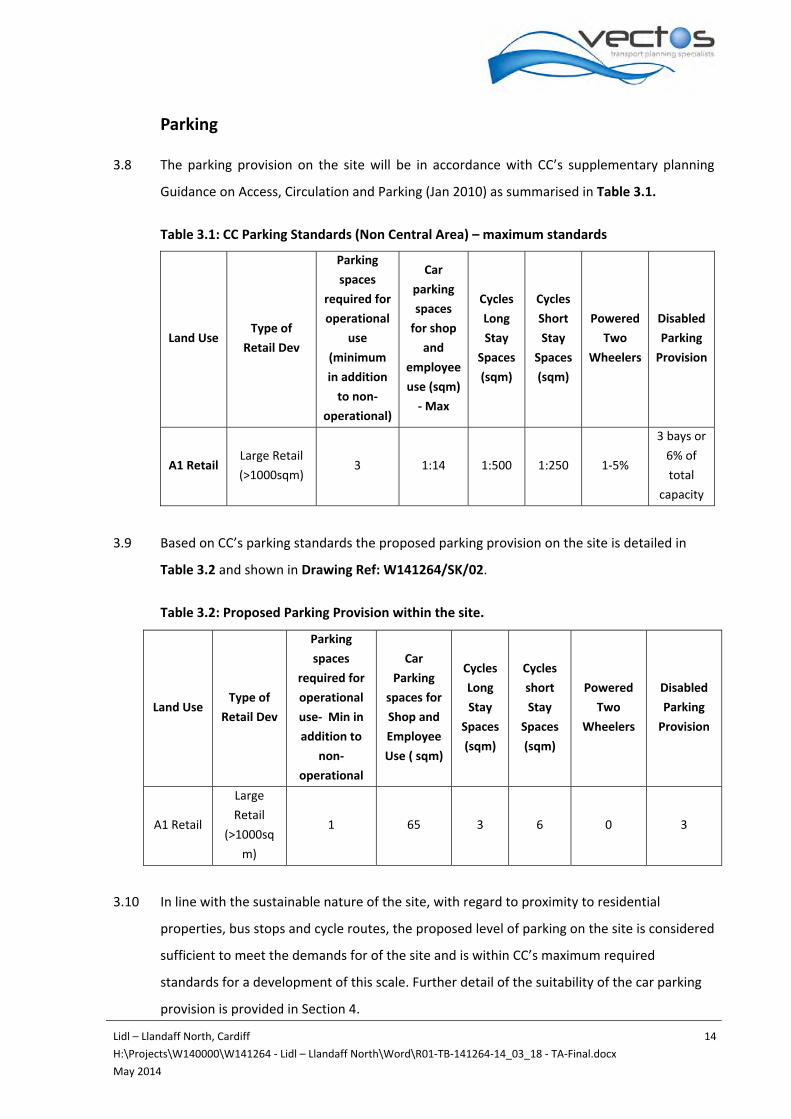
3.8 The parking provision on the site will be in accordance with CC’s supplementary planning
Guidance on Access, Circulation and Parking (Jan 2010) as summarised in Table 3.1.
Table 3.1: CC Parking Standards (Non Central Area) – maximum standards
Land Use Type of
Retail Dev
Parking
spaces
required for
operational
use
(minimum
in addition
to non‐
operational)
Car
parking
spaces
for shop
and
employee
use (sqm)
‐ Max
Cycles
Long
Stay
Spaces
(sqm)
Cycles
Short
Stay
Spaces
(sqm)
Powered
Two
Wheelers
Disabled
Parking
Provision
A1 Retail Large Retail
(>1000sqm) 3 1:14 1:500 1:250 1‐5%
3 bays or
6% of
total
capacity
3.9 Based on CC’s parking standards the proposed parking provision on the site is detailed in
Table 3.2 and shown in Drawing Ref: W141264/SK/02.
Table 3.2: Proposed Parking Provision within the site.
3.10 In line with the sustainable nature of the site, with regard to proximity to residential
properties, bus stops and cycle routes, the proposed level of parking on the site is considered
sufficient to meet the demands for of the site and is within CC’s maximum required
standards for a development of this scale. Further detail of the suitability of the car parking
provision is provided in Section 4.
Land Use Type of
Retail Dev
Parking
spaces
required for
operational
use‐ Min in
addition to
non‐
operational
Car
Parking
spaces for
Shop and
Employee
Use ( sqm)
Cycles
Long
Stay
Spaces
(sqm)
Cycles
short
Stay
Spaces
(sqm)
Powered
Two
Wheelers
Disabled
Parking
Provision
A1 Retail
Large
Retail
(>1000sq
m)
1 65 3 6 0 3
Lidl – Llandaff North, Cardiff 15
H:\Projects\W140000\W141264 ‐ Lidl – Llandaff North\Word\R01‐TB‐141264‐14_03_18 ‐ TA‐Final.docx
May 2014
Internal Highway Layout
3.11 The proposed internal site layout is shown in Drawing Ref: W141264/SK/02 and has been
designed to make the most efficient use of the space whilst having regard to the safe access,
circulation and parking within the site.
Servicing
3.12 Servicing of the proposed site will be facilitated at the northern edge of the store through
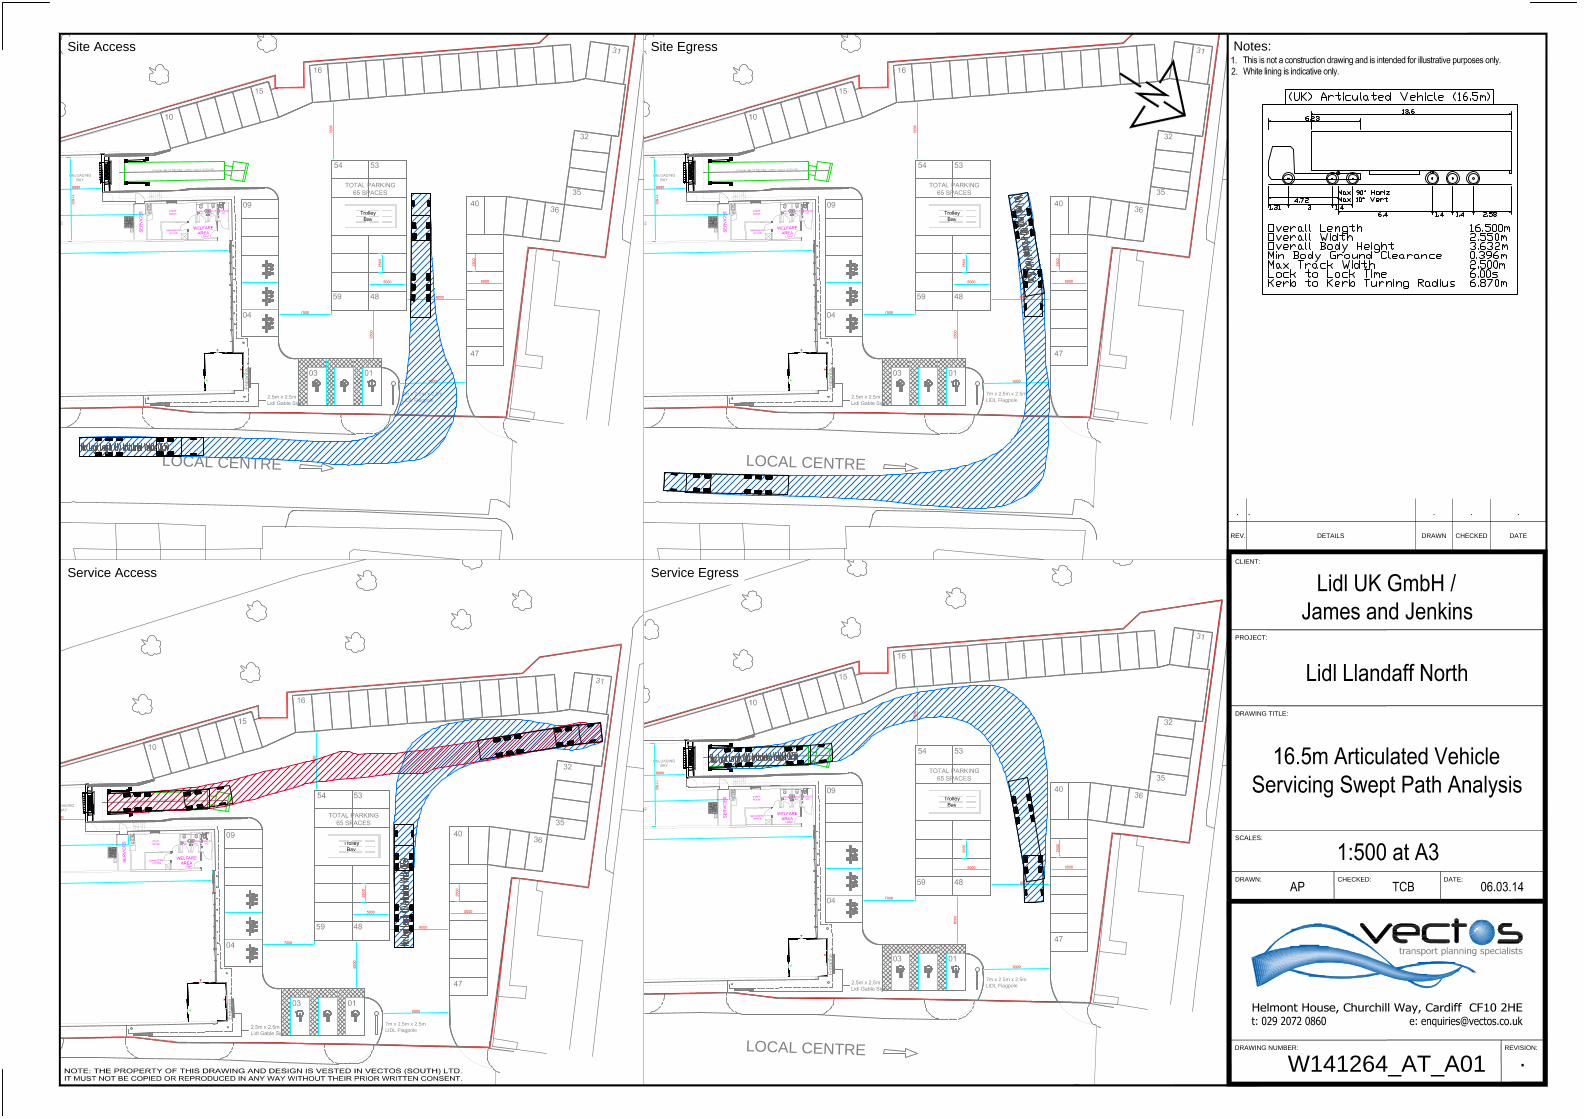
the use of a dedicated service bay. Drawing Ref: W141264/AT/A01 shows how the proposed
servicing arrangements can be accommodated within the site for the largest 16.5m
Articulated Vehicle anticipated for this type of development.
3.13 With regard to the servicing of the Lidl food store, Lidl as a multi‐national operator, have full
control over their supply chain and have the have the infrastructure, expertise and logistics
network in place to allow efficient multi‐platform operations and cross docking of goods at
nationwide centralised depots. For this reason deliveries can be confined to a minimal
number and undertaken in an adept manner, so that all servicing is both efficient and
effective and can fully control all servicing requirements associated with their operation.
Under Lidl’s current servicing arrangements Lidl food stores of this size receive 1 delivery per
day or infrequently where peak periods in demand dictate otherwise e.g. Christmas period, a
maximum of 2 deliveries per day, which are scheduled to arrive at different times during the
day i.e. 1 delivery in the morning and 1 delivery in the afternoon.
3.14 For these reasons the provision of one service bay is considered more than sufficient to meet
the requirements of the forecast servicing arrangements of the site and is in line with other
existing Lidl stores within Cardiff i.e. Cathay’s, Splott, Ely.
3.15 In the majority of instances, deliveries to the store will be undertaken at off‐peak highway
hours when traffic levels are relatively light. In other words, it is unlikely that deliveries will
be undertaken in the weekday AM or PM peak hour.
3.16 Instead of the main depot delivery returning empty, on their return journey, Lidl vehicles
remove food waste and recyclable materials, thereby reducing the number of servicing trips.
This also reduces fuel usage, vehicle mileage and overall lowers servicing trips.
Lidl – Llandaff North, Cardiff 16
H:\Projects\W140000\W141264 ‐ Lidl – Llandaff North\Word\R01‐TB‐141264‐14_03_18 ‐ TA‐Final.docx
May 2014
4 TRAFFIC ANALYSIS
4.1 This section examines the forecast effect of the proposed development traffic on the local
highway network. The scope of the operational assessment has been agreed with CC, and
accordingly the potential effects of development traffic have been assessed at the Proposed
Site Access / Station Road priority junction.
Background Traffic Growth
4.2 National Traffic Model (NTM) background traffic growth factors have been applied to the
observed 2014 traffic data for the Weekday AM, PM and Saturday peak periods to reflect the
potential traffic flows on this part of the highway network in the design year (2019). The full
NTM summary is provided in Appendix D.
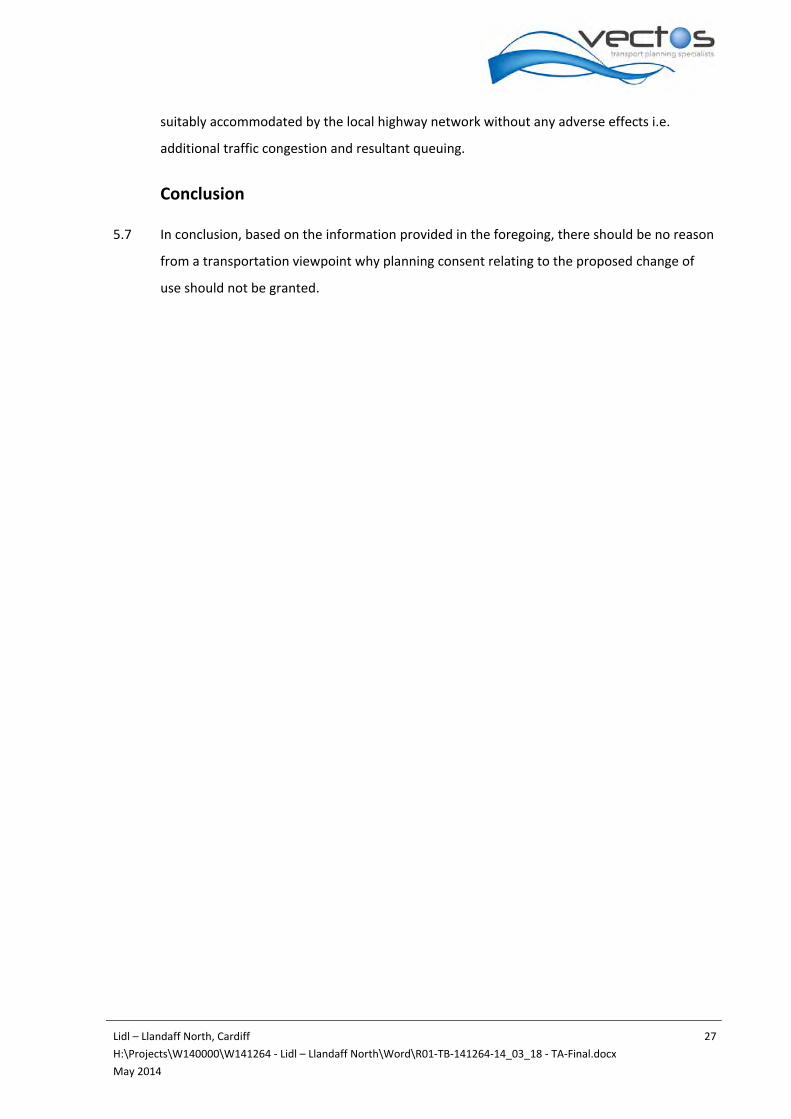
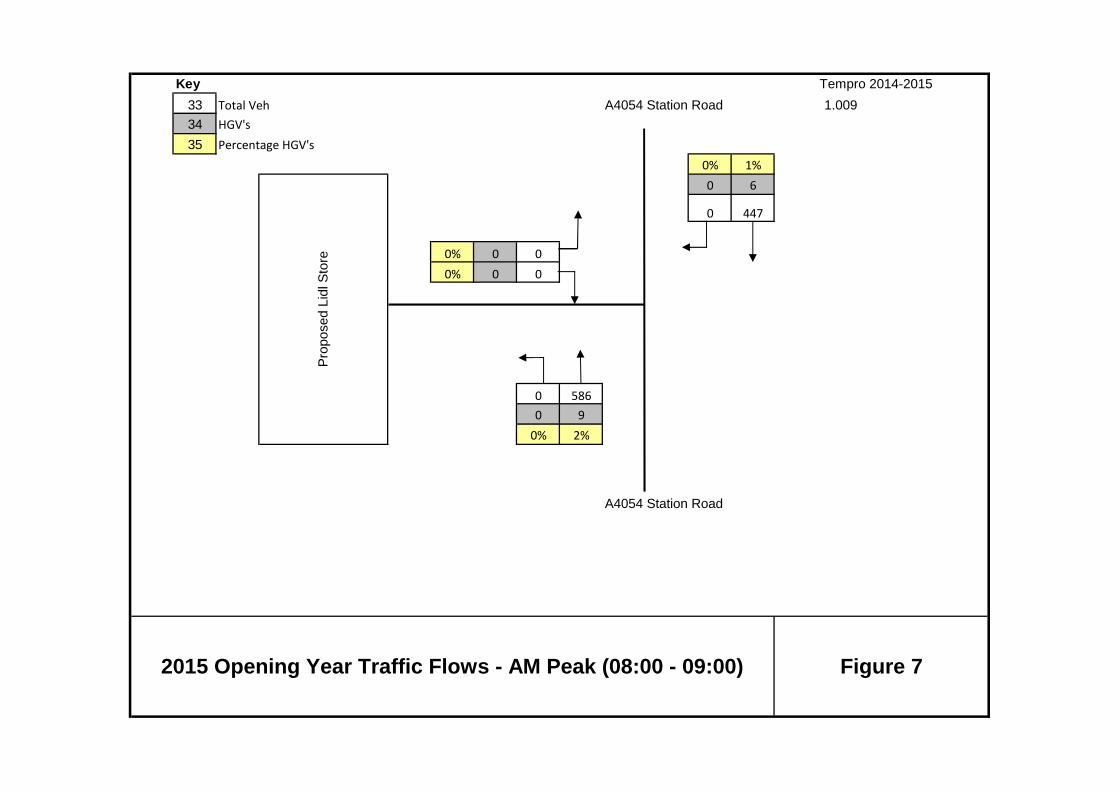
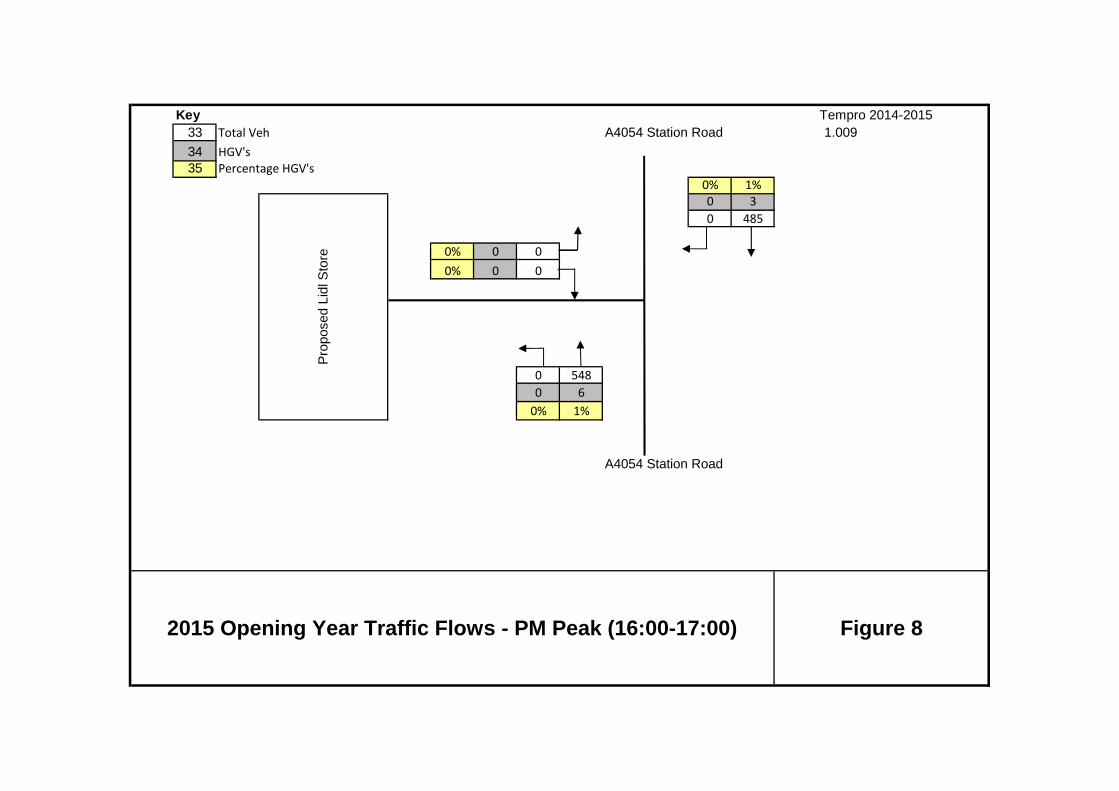
4.3 The background opening year (2015) and design year (2020) traffic flows for the weekday
AM, PM and Saturday peak periods are shown in Figures 7‐9 and 10‐12.
Committed Development
4.4 It has been confirmed by CC there are no committed developments and hence trip
attractions to consider as part of this TA.
Traffic Generation
4.5 Vehicle trip rates for the proposed development have been based on trips derived from the
TRICS database for the corresponding land use. TRICS is a database of trip generation data
from a wide variety of land uses (retail, employment, leisure etc.) across the UK. Traffic
surveys are carried out to measure how many people travel to a site, by what mode, at what
time of day. The purpose of the database is to provide an estimate of likely trip generation
to/from a new development, by comparing it with trip generation from existing comparative
sites.
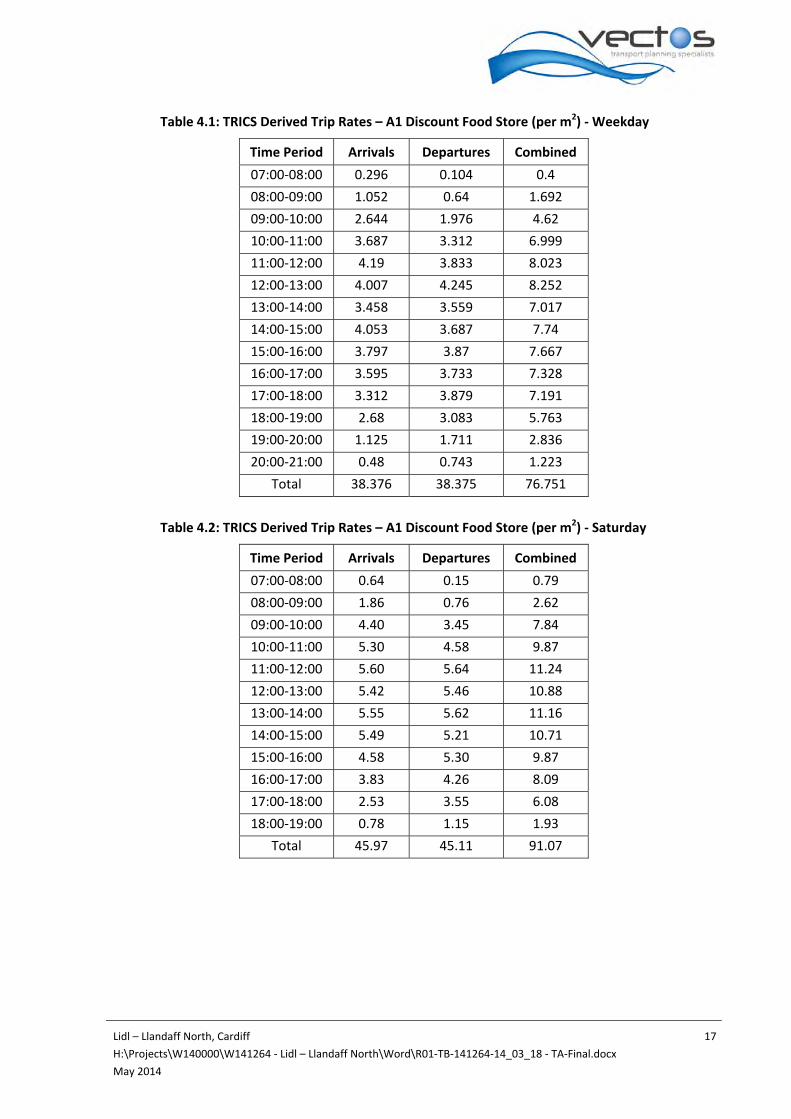
4.6 The TRICS derived trip rates for a typical Friday and Saturday are shown in Tables 4.1 and 4.2
and the detailed TRICS data sets are shown in Appendix E.
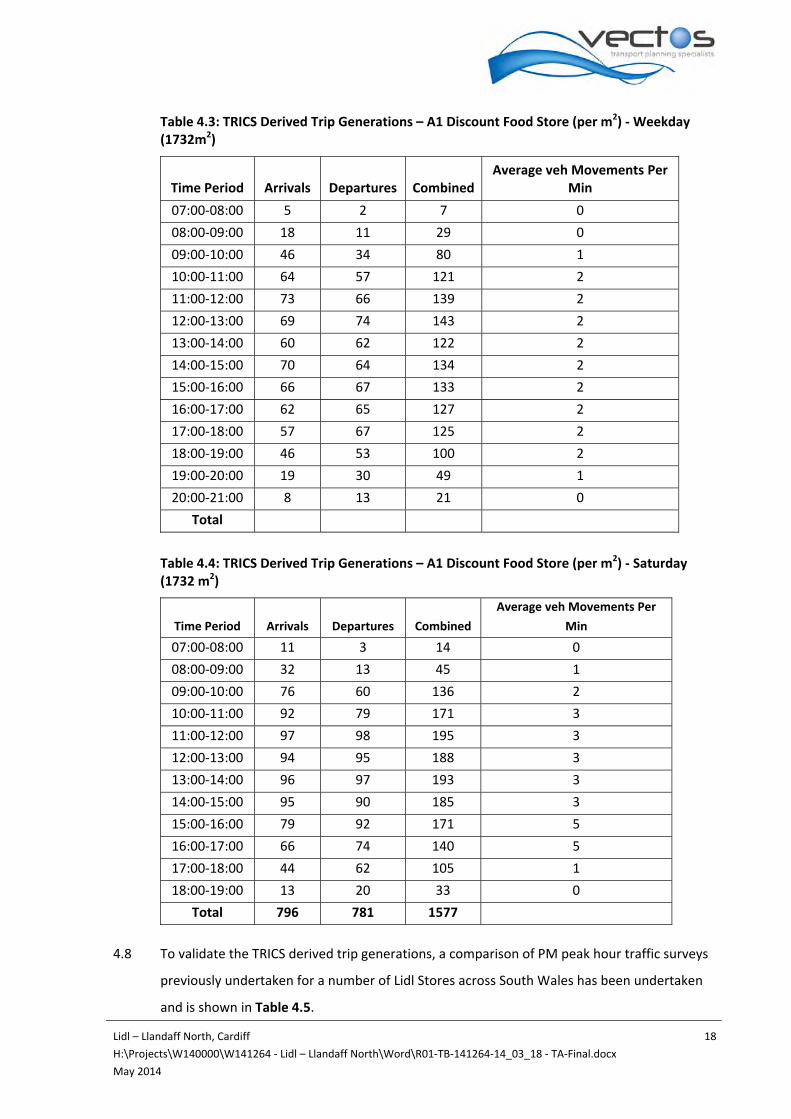
4.7 The corresponding TRICS derived trip generations for the proposed development are shown
in Tables 4.3 and 4.4.
Lidl – Llandaff North, Cardiff 17
H:\Projects\W140000\W141264 ‐ Lidl – Llandaff North\Word\R01‐TB‐141264‐14_03_18 ‐ TA‐Final.docx
May 2014
Table 4.1: TRICS Derived Trip Rates – A1 Discount Food Store (per m2) ‐ Weekday
Time Period Arrivals Departures Combined
07:00‐08:00 0.296 0.104 0.4
08:00‐09:00 1.052 0.64 1.692
09:00‐10:00 2.644 1.976 4.62
10:00‐11:00 3.687 3.312 6.999
11:00‐12:00 4.19 3.833 8.023
12:00‐13:00 4.007 4.245 8.252
13:00‐14:00 3.458 3.559 7.017
14:00‐15:00 4.053 3.687 7.74
15:00‐16:00 3.797 3.87 7.667
16:00‐17:00 3.595 3.733 7.328
17:00‐18:00 3.312 3.879 7.191
18:00‐19:00 2.68 3.083 5.763
19:00‐20:00 1.125 1.711 2.836
20:00‐21:00 0.48 0.743 1.223
Total 38.376 38.375 76.751
Table 4.2: TRICS Derived Trip Rates – A1 Discount Food Store (per m2) ‐ Saturday
Time Period Arrivals Departures Combined
07:00‐08:00 0.64 0.15 0.79
08:00‐09:00 1.86 0.76 2.62
09:00‐10:00 4.40 3.45 7.84
10:00‐11:00 5.30 4.58 9.87
11:00‐12:00 5.60 5.64 11.24
12:00‐13:00 5.42 5.46 10.88
13:00‐14:00 5.55 5.62 11.16
14:00‐15:00 5.49 5.21 10.71
15:00‐16:00 4.58 5.30 9.87
16:00‐17:00 3.83 4.26 8.09
17:00‐18:00 2.53 3.55 6.08
18:00‐19:00 0.78 1.15 1.93
Total 45.97 45.11 91.07
Lidl – Llandaff North, Cardiff 18
H:\Projects\W140000\W141264 ‐ Lidl – Llandaff North\Word\R01‐TB‐141264‐14_03_18 ‐ TA‐Final.docx
May 2014
Table 4.3: TRICS Derived Trip Generations – A1 Discount Food Store (per m2) ‐ Weekday (1732m2)
Time Period Arrivals Departures CombinedAverage veh Movements Per
Min
07:00‐08:00 5 2 7 0
08:00‐09:00 18 11 29 0
09:00‐10:00 46 34 80 1
10:00‐11:00 64 57 121 2
11:00‐12:00 73 66 139 2
12:00‐13:00 69 74 143 2
13:00‐14:00 60 62 122 2
14:00‐15:00 70 64 134 2
15:00‐16:00 66 67 133 2
16:00‐17:00 62 65 127 2
17:00‐18:00 57 67 125 2
18:00‐19:00 46 53 100 2
19:00‐20:00 19 30 49 1
20:00‐21:00 8 13 21 0
Total
Table 4.4: TRICS Derived Trip Generations – A1 Discount Food Store (per m2) ‐ Saturday (1732 m2)
Time Period Arrivals Departures Combined
Average veh Movements Per
Min
07:00‐08:00 11 3 14 0
08:00‐09:00 32 13 45 1
09:00‐10:00 76 60 136 2
10:00‐11:00 92 79 171 3
11:00‐12:00 97 98 195 3
12:00‐13:00 94 95 188 3
13:00‐14:00 96 97 193 3
14:00‐15:00 95 90 185 3
15:00‐16:00 79 92 171 5
16:00‐17:00 66 74 140 5
17:00‐18:00 44 62 105 1
18:00‐19:00 13 20 33 0
Total 796 781 1577
4.8 To validate the TRICS derived trip generations, a comparison of PM peak hour traffic surveys
previously undertaken for a number of Lidl Stores across South Wales has been undertaken
and is shown in Table 4.5.
Lidl – Llandaff North, Cardiff 19
H:\Projects\W140000\W141264 ‐ Lidl – Llandaff North\Word\R01‐TB‐141264‐14_03_18 ‐ TA‐Final.docx
May 2014
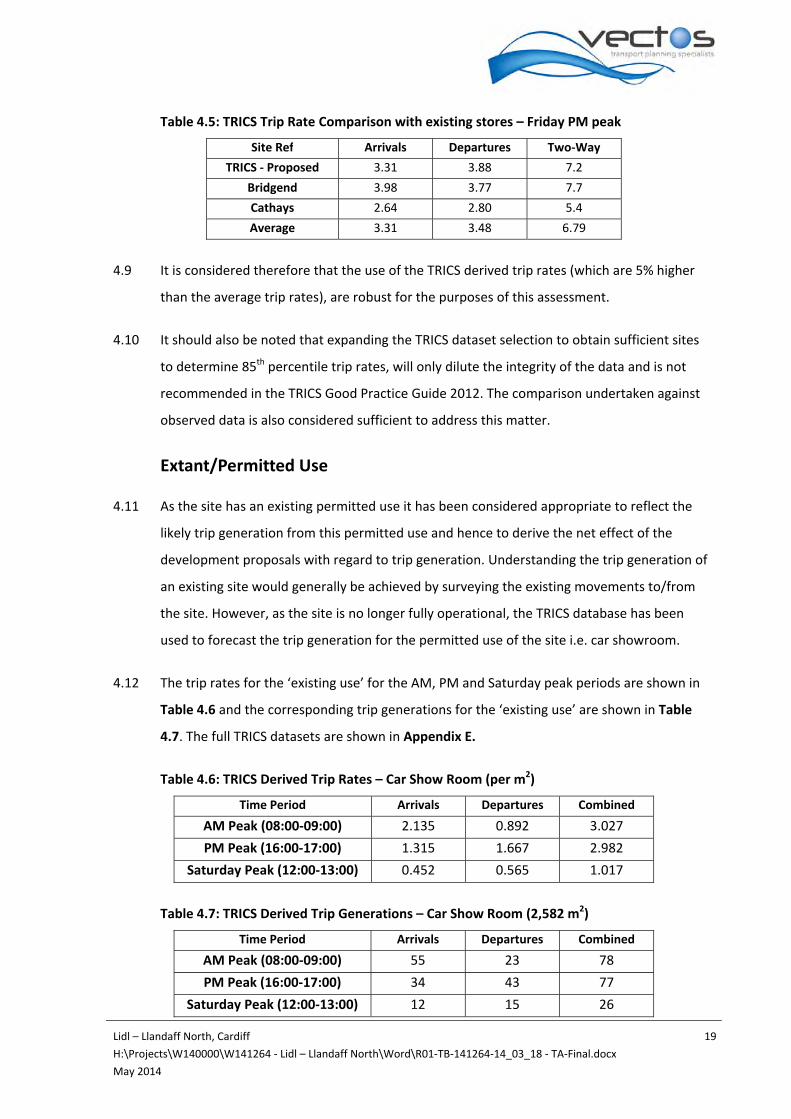
Table 4.5: TRICS Trip Rate Comparison with existing stores – Friday PM peak
Site Ref Arrivals Departures Two‐Way
TRICS ‐ Proposed 3.31 3.88 7.2
Bridgend 3.98 3.77 7.7
Cathays 2.64 2.80 5.4
Average 3.31 3.48 6.79
4.9 It is considered therefore that the use of the TRICS derived trip rates (which are 5% higher
than the average trip rates), are robust for the purposes of this assessment.
4.10 It should also be noted that expanding the TRICS dataset selection to obtain sufficient sites
to determine 85th percentile trip rates, will only dilute the integrity of the data and is not
recommended in the TRICS Good Practice Guide 2012. The comparison undertaken against
observed data is also considered sufficient to address this matter.
Extant/Permitted Use
4.11 As the site has an existing permitted use it has been considered appropriate to reflect the
likely trip generation from this permitted use and hence to derive the net effect of the
development proposals with regard to trip generation. Understanding the trip generation of
an existing site would generally be achieved by surveying the existing movements to/from
the site. However, as the site is no longer fully operational, the TRICS database has been
used to forecast the trip generation for the permitted use of the site i.e. car showroom.
4.12 The trip rates for the ‘existing use’ for the AM, PM and Saturday peak periods are shown in
Table 4.6 and the corresponding trip generations for the ‘existing use’ are shown in Table
4.7. The full TRICS datasets are shown in Appendix E.
Table 4.6: TRICS Derived Trip Rates – Car Show Room (per m2)
Time Period Arrivals Departures Combined
AM Peak (08:00‐09:00) 2.135 0.892 3.027
PM Peak (16:00‐17:00) 1.315 1.667 2.982
Saturday Peak (12:00‐13:00) 0.452 0.565 1.017
Table 4.7: TRICS Derived Trip Generations – Car Show Room (2,582 m2)
Time Period Arrivals Departures Combined
AM Peak (08:00‐09:00) 55 23 78
PM Peak (16:00‐17:00) 34 43 77
Saturday Peak (12:00‐13:00) 12 15 26
Lidl – Llandaff North, Cardiff 20
H:\Projects\W140000\W141264 ‐ Lidl – Llandaff North\Word\R01‐TB‐141264‐14_03_18 ‐ TA‐Final.docx
May 2014
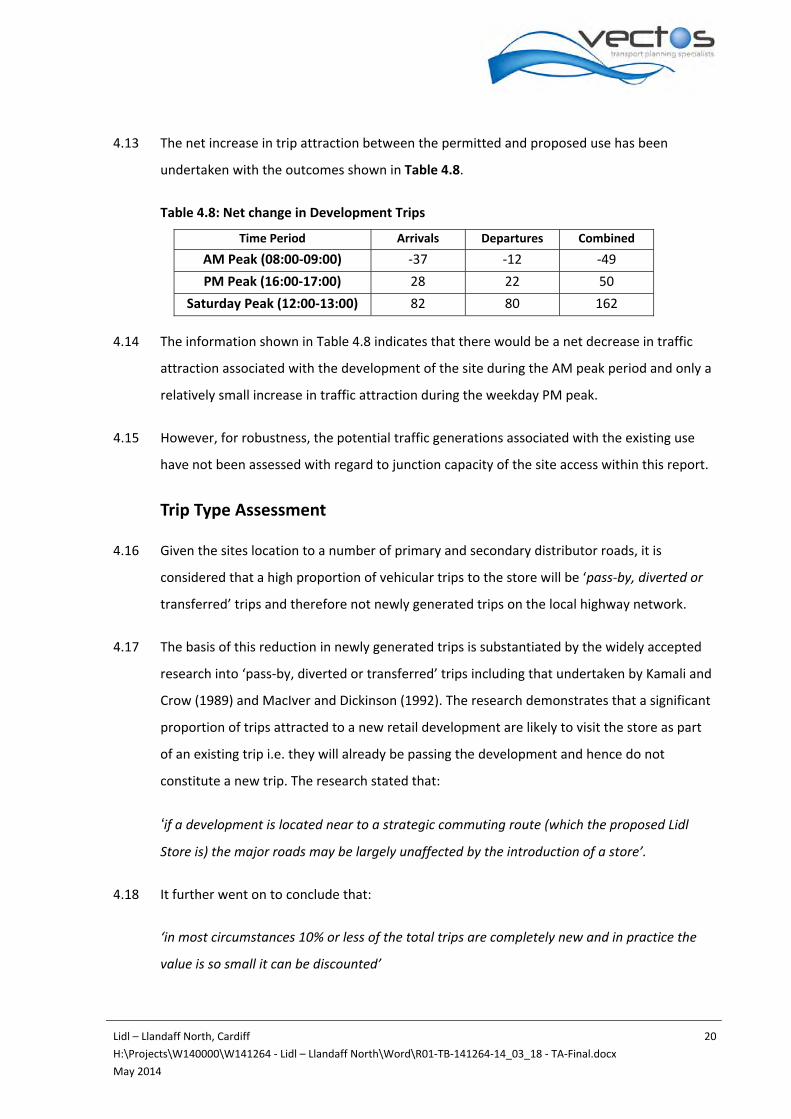
4.13 The net increase in trip attraction between the permitted and proposed use has been
undertaken with the outcomes shown in Table 4.8.
Table 4.8: Net change in Development Trips
Time Period Arrivals Departures Combined
AM Peak (08:00‐09:00) ‐37 ‐12 ‐49
PM Peak (16:00‐17:00) 28 22 50
Saturday Peak (12:00‐13:00) 82 80 162
4.14 The information shown in Table 4.8 indicates that there would be a net decrease in traffic
attraction associated with the development of the site during the AM peak period and only a
relatively small increase in traffic attraction during the weekday PM peak.
4.15 However, for robustness, the potential traffic generations associated with the existing use
have not been assessed with regard to junction capacity of the site access within this report.
Trip Type Assessment
4.16 Given the sites location to a number of primary and secondary distributor roads, it is
considered that a high proportion of vehicular trips to the store will be ‘pass‐by, diverted or
transferred’ trips and therefore not newly generated trips on the local highway network.
4.17 The basis of this reduction in newly generated trips is substantiated by the widely accepted
research into ‘pass‐by, diverted or transferred’ trips including that undertaken by Kamali and
Crow (1989) and MacIver and Dickinson (1992). The research demonstrates that a significant
proportion of trips attracted to a new retail development are likely to visit the store as part
of an existing trip i.e. they will already be passing the development and hence do not
constitute a new trip. The research stated that:
‘if a development is located near to a strategic commuting route (which the proposed Lidl
Store is) the major roads may be largely unaffected by the introduction of a store’.
4.18 It further went on to conclude that:
‘in most circumstances 10% or less of the total trips are completely new and in practice the
value is so small it can be discounted’
Lidl – Llandaff North, Cardiff 21
H:\Projects\W140000\W141264 ‐ Lidl – Llandaff North\Word\R01‐TB‐141264‐14_03_18 ‐ TA‐Final.docx
May 2014
4.19 A proportion of trips to a new food store will also comprise ‘transferred trips’, which can be
classified as trips made to another food store (e.g. Tesco Whitchurch /Galbafa) that have
transferred to the new development.
4.20 On this basis, we consider that during the peak periods, it would be realistic to assume that a
large proportion of trips associated with the development of a food store in this location
would already be on the highway network in the vicinity of the site.
4.21 Based on the widely accepted principles detailed above, regarding trip type proportions to
new food stores, it is considered that new trips to the food store would account for 10% and
15% of total trips to the site on a Friday and Saturday respectively.
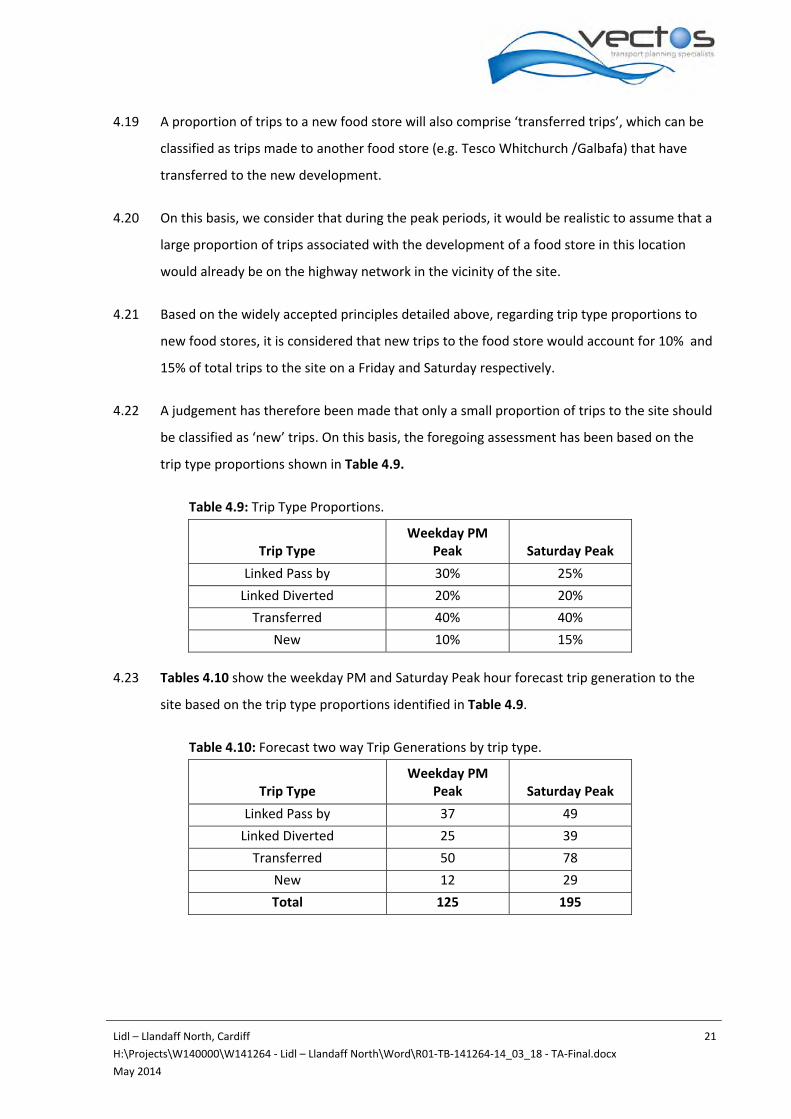
4.22 A judgement has therefore been made that only a small proportion of trips to the site should
be classified as ‘new’ trips. On this basis, the foregoing assessment has been based on the
trip type proportions shown in Table 4.9.
Table 4.9: Trip Type Proportions.
Trip Type Weekday PM
Peak Saturday Peak
Linked Pass by 30% 25%
Linked Diverted 20% 20%
Transferred 40% 40%
New 10% 15%
4.23 Tables 4.10 show the weekday PM and Saturday Peak hour forecast trip generation to the
site based on the trip type proportions identified in Table 4.9.
Table 4.10: Forecast two way Trip Generations by trip type.
Trip Type Weekday PM
Peak Saturday Peak
Linked Pass by 37 49
Linked Diverted 25 39
Transferred 50 78
New 12 29
Total 125 195
Lidl – Llandaff North, Cardiff 22
H:\Projects\W140000\W141264 ‐ Lidl – Llandaff North\Word\R01‐TB‐141264‐14_03_18 ‐ TA‐Final.docx
May 2014
4.24 However, in order to undertake a robust capacity assessment and to ensure network
resilience, no trip type assumptions have been applied to the trip attractions used within the
junction capacity assessments.
Distributions
4.25 The vehicle movements generated from the proposed development have been assigned
onto the local highway network using the observed traffic flows from the ATC Data to reflect
the potential origins and destinations of journeys undertaken by employees/customers of
the site.
4.26 The distribution is shown in Figures 13 to 15.
Effect on the Network
4.27 The effect of the proposed development on the network has been based on the proportions
of new, linked diverted and transferred trips, which for assessment purposes are considered
to be additional trips to this specific part of the highway network.
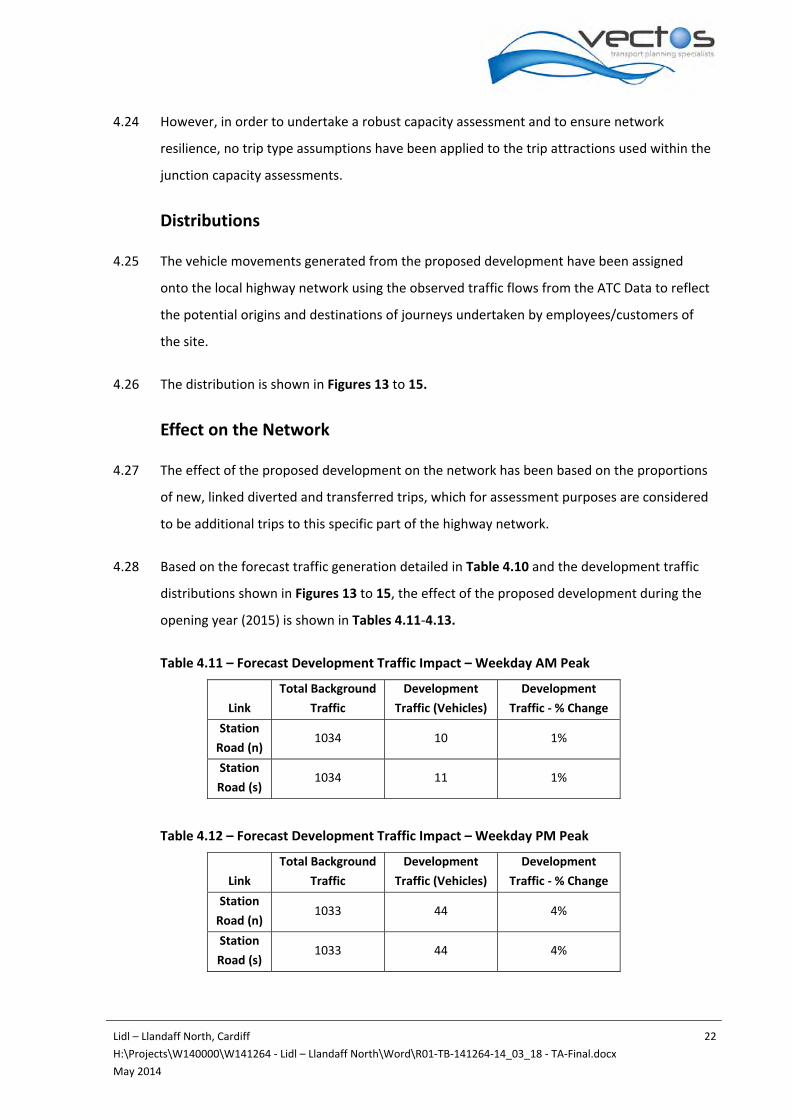
4.28 Based on the forecast traffic generation detailed in Table 4.10 and the development traffic
distributions shown in Figures 13 to 15, the effect of the proposed development during the
opening year (2015) is shown in Tables 4.11‐4.13.
Table 4.11 – Forecast Development Traffic Impact – Weekday AM Peak
Link
Total Background
Traffic
Development
Traffic (Vehicles)
Development
Traffic ‐ % Change
Station
Road (n) 1034 10 1%
Station
Road (s) 1034 11 1%
Table 4.12 – Forecast Development Traffic Impact – Weekday PM Peak
Link
Total Background
Traffic
Development
Traffic (Vehicles)
Development
Traffic ‐ % Change
Station
Road (n) 1033 44 4%
Station
Road (s) 1033 44 4%
Lidl – Llandaff North, Cardiff 23
H:\Projects\W140000\W141264 ‐ Lidl – Llandaff North\Word\R01‐TB‐141264‐14_03_18 ‐ TA‐Final.docx
May 2014
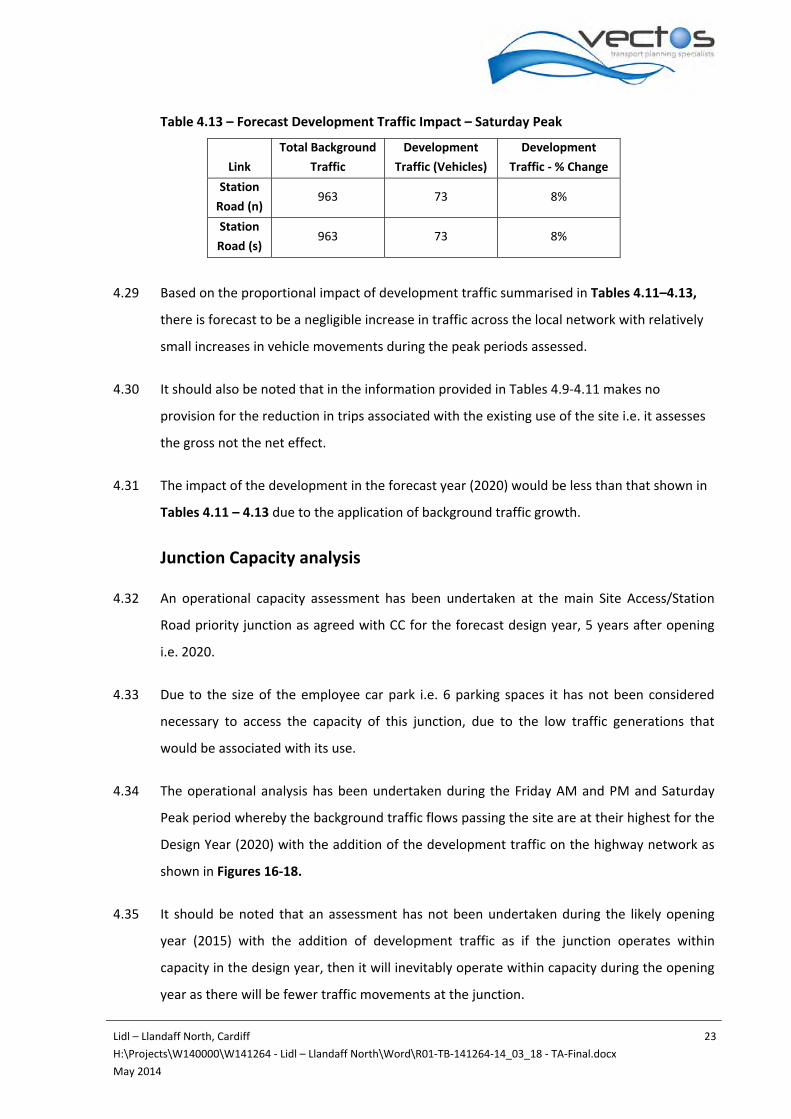
Table 4.13 – Forecast Development Traffic Impact – Saturday Peak
Link
Total Background
Traffic
Development
Traffic (Vehicles)
Development
Traffic ‐ % Change
Station
Road (n) 963 73 8%
Station
Road (s) 963 73 8%
4.29 Based on the proportional impact of development traffic summarised in Tables 4.11–4.13,
there is forecast to be a negligible increase in traffic across the local network with relatively
small increases in vehicle movements during the peak periods assessed.
4.30 It should also be noted that in the information provided in Tables 4.9‐4.11 makes no
provision for the reduction in trips associated with the existing use of the site i.e. it assesses
the gross not the net effect.
4.31 The impact of the development in the forecast year (2020) would be less than that shown in
Tables 4.11 – 4.13 due to the application of background traffic growth.
Junction Capacity analysis
4.32 An operational capacity assessment has been undertaken at the main Site Access/Station
Road priority junction as agreed with CC for the forecast design year, 5 years after opening
i.e. 2020.
4.33 Due to the size of the employee car park i.e. 6 parking spaces it has not been considered
necessary to access the capacity of this junction, due to the low traffic generations that
would be associated with its use.
4.34 The operational analysis has been undertaken during the Friday AM and PM and Saturday
Peak period whereby the background traffic flows passing the site are at their highest for the
Design Year (2020) with the addition of the development traffic on the highway network as
shown in Figures 16‐18.
4.35 It should be noted that an assessment has not been undertaken during the likely opening
year (2015) with the addition of development traffic as if the junction operates within
capacity in the design year, then it will inevitably operate within capacity during the opening
year as there will be fewer traffic movements at the junction.

Lidl – Llandaff North, Cardiff 24
H:\Projects\W140000\W141264 ‐ Lidl – Llandaff North\Word\R01‐TB‐141264‐14_03_18 ‐ TA‐Final.docx
May 2014
4.36 PICADY v5 has been used to model traffic conditions on the proposed site access. PICADY is a
computer programmes that forecasts capacities, queues and delays at priority junctions.
4.37 The theoretical capacity at a junction has a Ratio of Flow to Capacity (RFC) value of 1.0,
whereas the design capacity has a value between 0.85‐0.90. When values exceed 0.85‐0.90
queuing is normally forecast. These standard variables are taken from the Institute of
Highways and Transportation publications “Guidelines for Traffic Impact Assessment” Para
3.8.11.
4.38 The results from the analysis of the site access junction based on the forecast effect of
proposed development on the local highway network and inclusion of background traffic
growth is summarised in Table 4.14 in terms of Ratio of Flow Capacity (RFC) and maximum
vehicle queue lengths. The PICADY outputs are provided in Appendix F.
Table 4.14: Site Access / Station Road ‐ PICADY Outputs (Design Year 2020 with Development)
Link
Reference
AM 2019 PM 2019 SAT 2019
Max RFC
Queue Length
(veh) Max RFC
Queue Length
(veh) Max RFC
Queue Length
(veh)
B ‐ C 0.013 0 0.071 1 0.104 1
B ‐ A 0.018 0 0.107 1 0.155 1
C ‐ AB 0.023 0 0.093 1 0.138 1
Link Names – A= Station Road (S), B= Site Access, C= Station Road (N)
4.39 The results for the Site Access/ Station Road junction in the Design Year 2020 with
Development scenario show that the maximum RFC modelled at this junction is 0.155 with
one vehicle queuing and is forecast to occur during the Saturday peak period.
Summary
4.40 The operational analysis has confirmed that in the Design Year (2020), the addition of the
development traffic to the local highway network has a negligible impact in capacity terms.
4.41 Based on the forecast level of trip attraction to the site, and specifically the level of new trips
to the site as detailed in Table 4.10, the level of impact of the proposed development is
considered to be negligible.
Lidl – Llandaff North, Cardiff 25
H:\Projects\W140000\W141264 ‐ Lidl – Llandaff North\Word\R01‐TB‐141264‐14_03_18 ‐ TA‐Final.docx
May 2014
Forecast Parking Utilisation
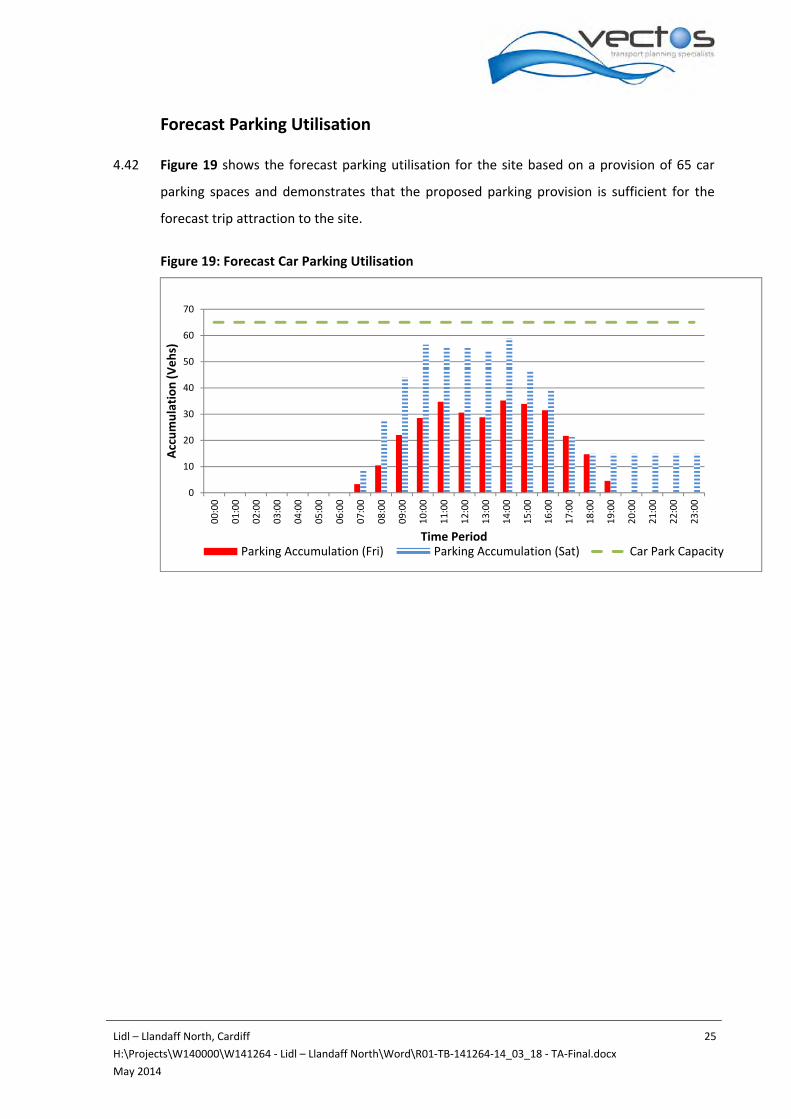
4.42 Figure 19 shows the forecast parking utilisation for the site based on a provision of 65 car
parking spaces and demonstrates that the proposed parking provision is sufficient for the
forecast trip attraction to the site.
Figure 19: Forecast Car Parking Utilisation
0
10
20
30
40
50
60
70
00:00
01:00
02:00
03:00
04:00
05:00
06:00
07:00
08:00
09:00
10:00
11:00
12:00
13:00
14:00
15:00
16:00
17:00
18:00
19:00
20:00
21:00
22:00
23:00
Accumulation (Vehs)
Time PeriodParking Accumulation (Fri) Parking Accumulation (Sat) Car Park Capacity
Lidl – Llandaff North, Cardiff 26
H:\Projects\W140000\W141264 ‐ Lidl – Llandaff North\Word\R01‐TB‐141264‐14_03_18 ‐ TA‐Final.docx
May 2014
5 SUMMARY AND CONCLUSIONS
Summary
5.1 This Transport Assessment has assessed the effect in terms of traffic demand and parking
utilisation for the proposed change of use from Car Show Room/ Garage and van Hire facility
to A1 Food Retail.
5.2 The scope of the Transport Statement has been agreed with Highways officers in Cardiff
Council (CC), a copy of which is provided in Appendix A.
5.3 The development of the site accords with national Planning Policy in regard to access by
sustainable transport modes.
5.4 There are a number of benefits to the proposed development from a transportation
perspective including:
The retail offering and location of the site to a number of primary and secondary
distributor roads, will result in a significant proportion of vehicular trips to the store
being either ‘pass‐by’ ‘linked’ and ’diverted’ trips and therefore not newly generated
trips on the highway network;
The location of the site makes it an attractive option for the resident population to
walk/cycle to the site;
The consolidation of the existing access points to the site is considered to be beneficial
in removing unnecessary interaction between vehicles at this location and should have a
beneficial effect on highway safety;
Cycle parking will be provided within the site in safe, secure and convenient locations
encouraging both employees and customers to cycle to the site;
The site is located within 100m of a number of bus stops and cycle routes providing an
ideal location, for customers and employees to travel to the site by these sustainable
modes.
5.5 The proposed car parking provision has been shown to be suitable for the requirements of
the site, and is within CC maximum parking standards for food retail developments.
5.6 The operational analysis undertaken for the Site Access / Station Road priority junction
clearly shows that forecast traffic generation as a result of the proposals will be able to be
Lidl – Llandaff North, Cardiff 27
H:\Projects\W140000\W141264 ‐ Lidl – Llandaff North\Word\R01‐TB‐141264‐14_03_18 ‐ TA‐Final.docx
May 2014
suitably accommodated by the local highway network without any adverse effects i.e.
additional traffic congestion and resultant queuing.
Conclusion
5.7 In conclusion, based on the information provided in the foregoing, there should be no reason
from a transportation viewpoint why planning consent relating to the proposed change of
use should not be granted.

FIGURES 7‐1у
Key Tempro 2014-2015
33 Total Veh A4054 Station Road 1.009
34 HGV's
35 Percentage HGV's
0% 1%
0 6
0 447
0% 0 0
0% 0 0
0 586
0 9
0% 2%
A4054 Station Road
Pro
pose
d Li
dl S
tore
2015 Opening Year Traffic Flows - AM Peak (08:00 - 09:00) Figure 7
Key Tempro 2014-201533 Total Veh A4054 Station Road 1.009
34 HGV's35 Percentage HGV's
0% 1%0 3
0 485
0% 0 0
0% 0 0
0 548
0 6
0% 1%
A4054 Station Road
Pro
pose
d Li
dl S
tore
2015 Opening Year Traffic Flows - PM Peak (16:00-17:00) Figure 8
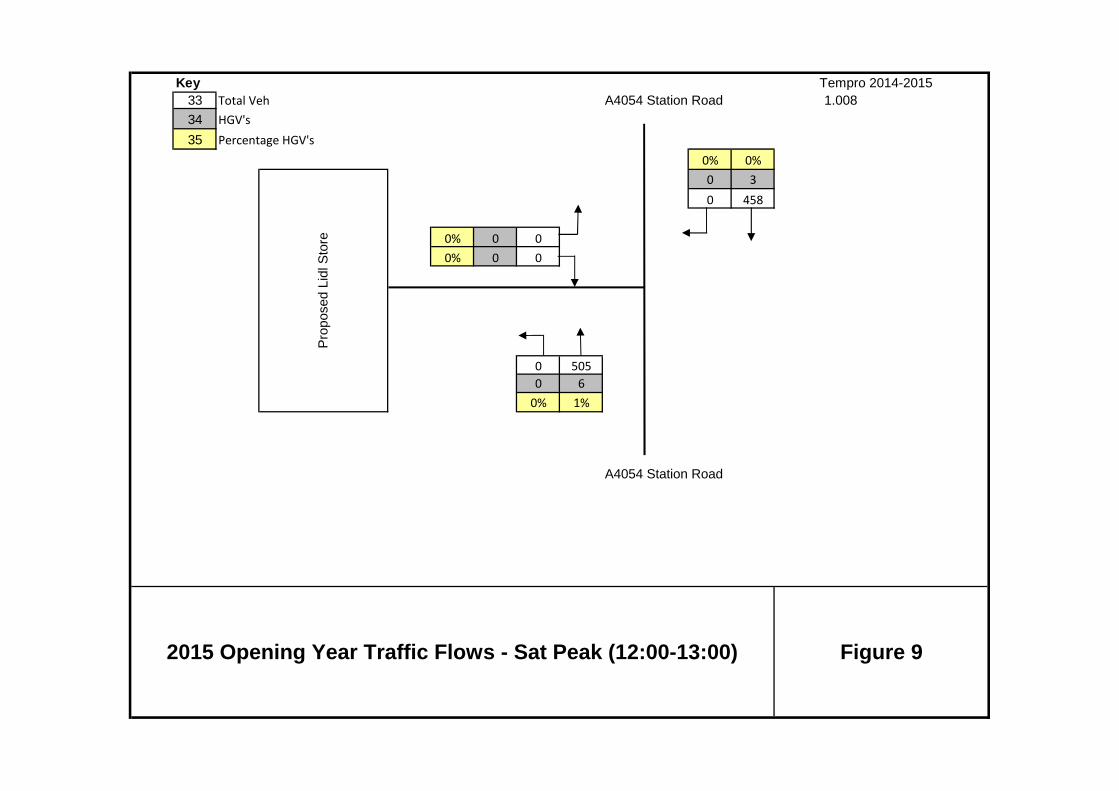
Key Tempro 2014-201533 Total Veh A4054 Station Road 1.008
34 HGV's
35 Percentage HGV's
0% 0%
0 3
0 458
0% 0 0
0% 0 0
0 505
0 6
0% 1%
A4054 Station Road
2015 Opening Year Traffic Flows - Sat Peak (12:00-13:00) Figure 9
Pro
pose
d Li
dl S
tore

Key Tempro 2014-2015
33 Total Veh A4054 Station Road 1.095
34 HGV's
35 Percentage HGV's
0% 1%
0 6
0 490
0% 0 0
0% 0 0
0 642
0 10
0% 2%
A4054 Station Road
Figure 10
Pro
pose
d Li
dl S
tore
2020 Design Year Traffic Flows - AM Peak (08:00 - 09:00)

Key Tempro 2014-201533 Total Veh A4054 Station Road 1.093
34 HGV's35 Percentage HGV's
0% 1%0 3
0 530
0% 0 0
0% 0 0
0 599
0 7
0% 1%
A4054 Station Road
Figure 11
Pro
pose
d Li
dl S
tore
2020 Design Year Traffic Flows - PM Peak (16:00-17:00)
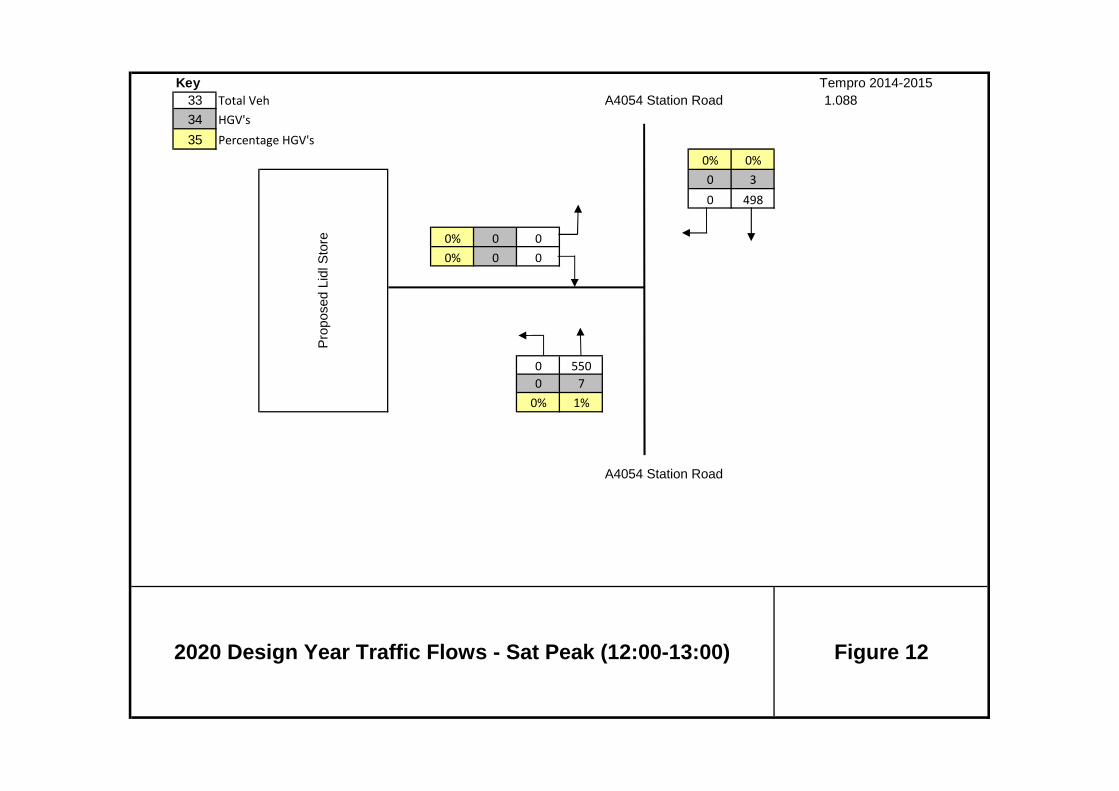
Key Tempro 2014-201533 Total Veh A4054 Station Road 1.088
34 HGV's
35 Percentage HGV's
0% 0%
0 3
0 498
0% 0 0
0% 0 0
0 550
0 7
0% 1%
A4054 Station Road
2020 Design Year Traffic Flows - Sat Peak (12:00-13:00) Figure 12
Pro
pose
d Li
dl S
tore
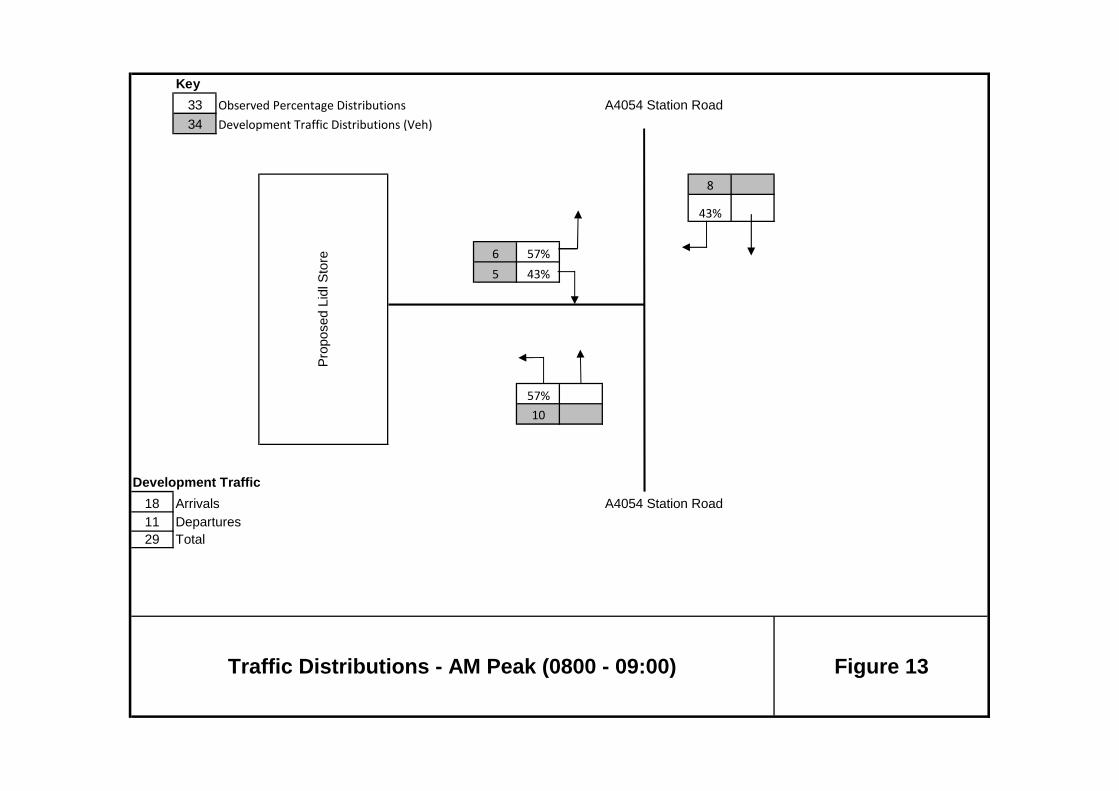
Key
33 Observed Percentage Distributions A4054 Station Road
34 Development Traffic Distributions (Veh)
8
43%
6 57%
5 43%
57%
10
Development Traffic
18 Arrivals A4054 Station Road11 Departures29 Total
Pro
pose
d Li
dl S
tore
Traffic Distributions - AM Peak (0800 - 09:00) Figure 13
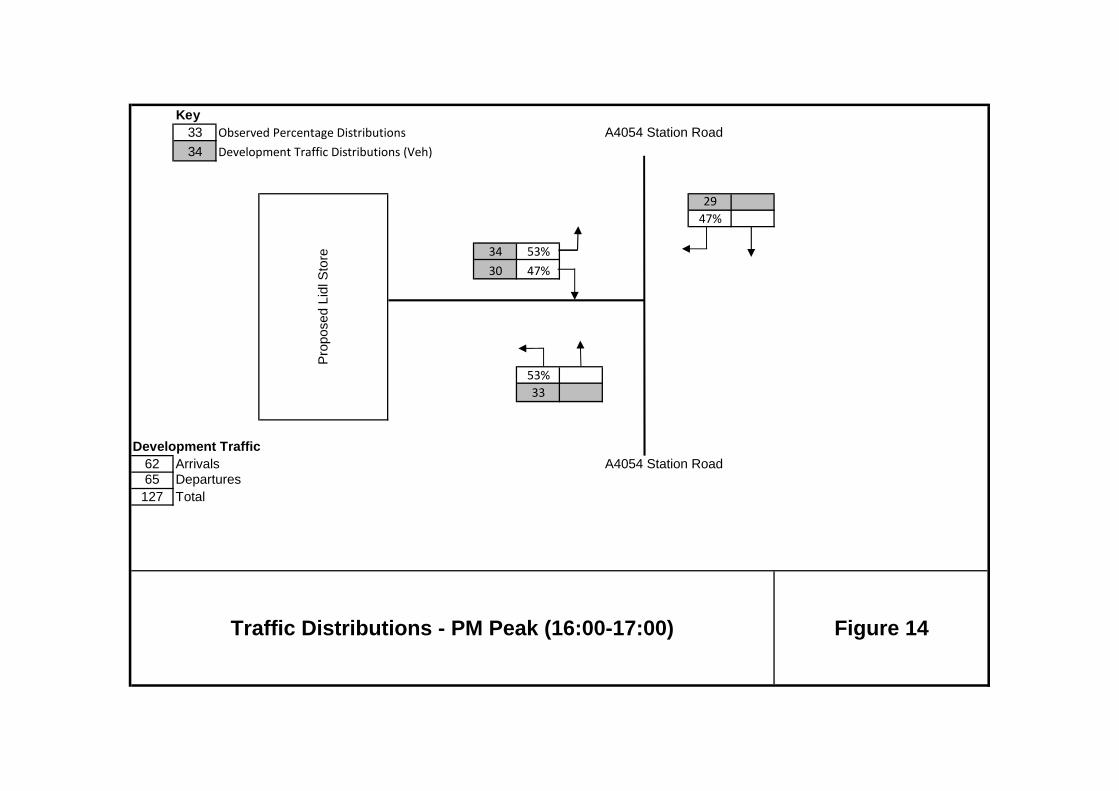
Key33 Observed Percentage Distributions A4054 Station Road
34 Development Traffic Distributions (Veh)
29
47%
34 53%
30 47%
53%
33
Development Traffic62 Arrivals A4054 Station Road65 Departures127 Total
Pro
pose
d Li
dl S
tore
Traffic Distributions - PM Peak (16:00-17:00) Figure 14
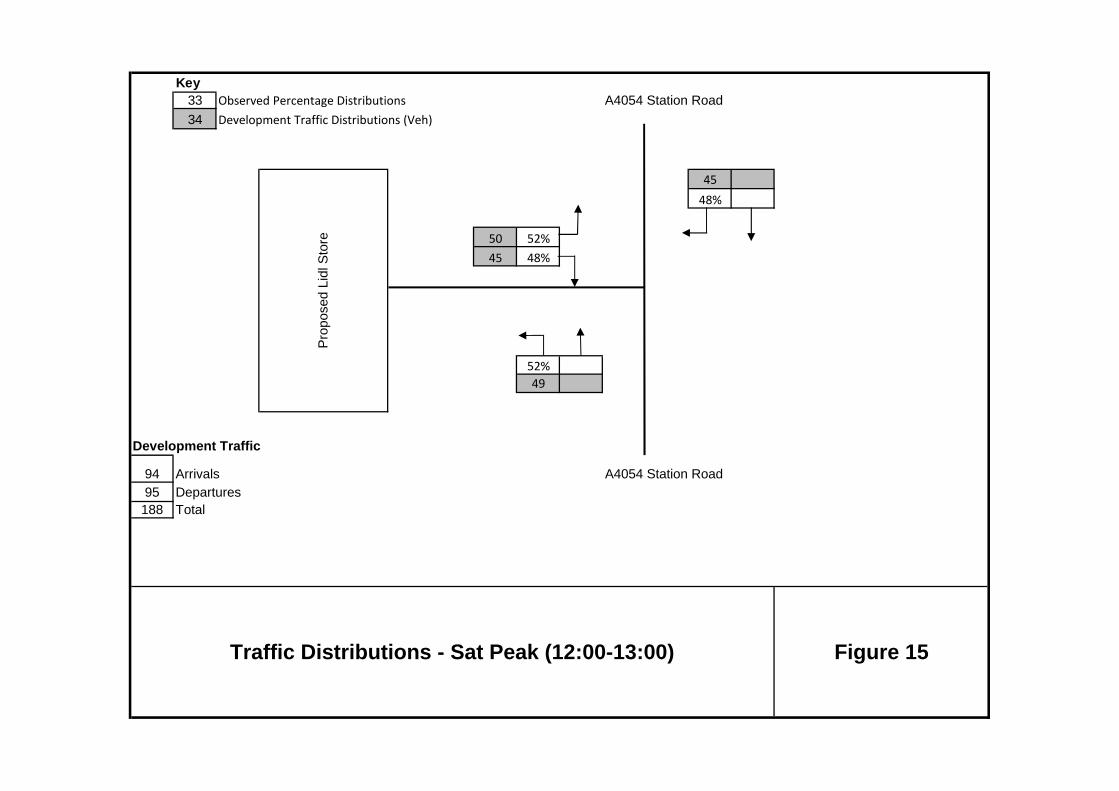
Key33 Observed Percentage Distributions A4054 Station Road
34 Development Traffic Distributions (Veh)
45
48%
50 52%
45 48%
52%
49
Development Traffic
94 Arrivals A4054 Station Road95 Departures188 Total
Pro
pose
d Li
dl S
tore
Traffic Distributions - Sat Peak (12:00-13:00) Figure 15
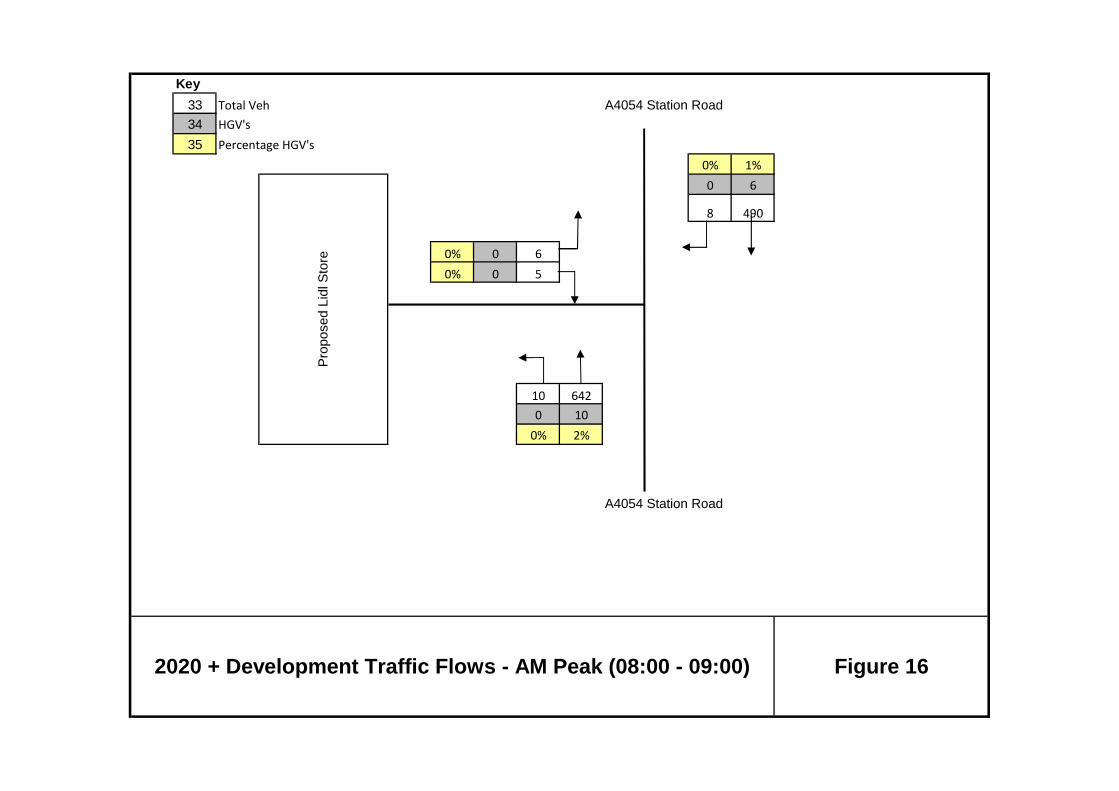
Key
33 Total Veh A4054 Station Road
34 HGV's
35 Percentage HGV's
0% 1%
0 6
8 490
0% 0 6
0% 0 5
10 642
0 10
0% 2%
A4054 Station Road
Pro
pose
d Li
dl S
tore
2020 + Development Traffic Flows - AM Peak (08:00 - 09:00) Figure 16
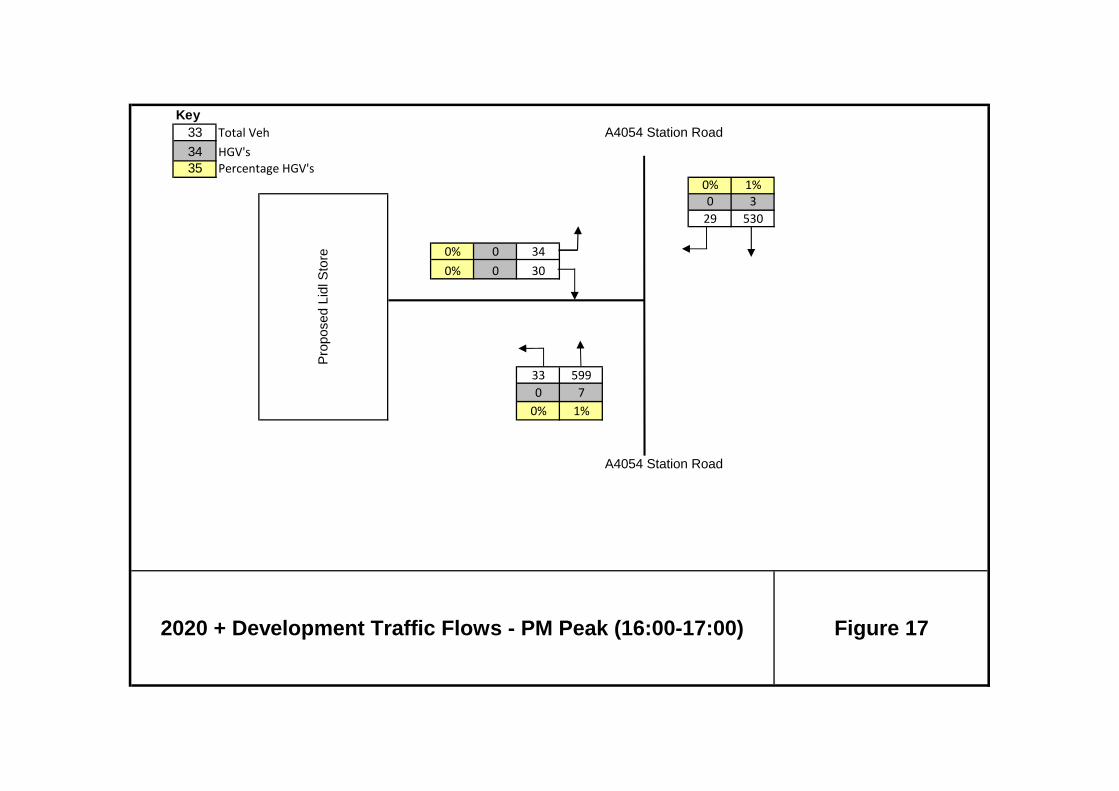
Key33 Total Veh A4054 Station Road
34 HGV's35 Percentage HGV's
0% 1%0 3
29 530
0% 0 34
0% 0 30
33 599
0 7
0% 1%
A4054 Station Road
Pro
pose
d Li
dl S
tore
2020 + Development Traffic Flows - PM Peak (16:00-17:00) Figure 17
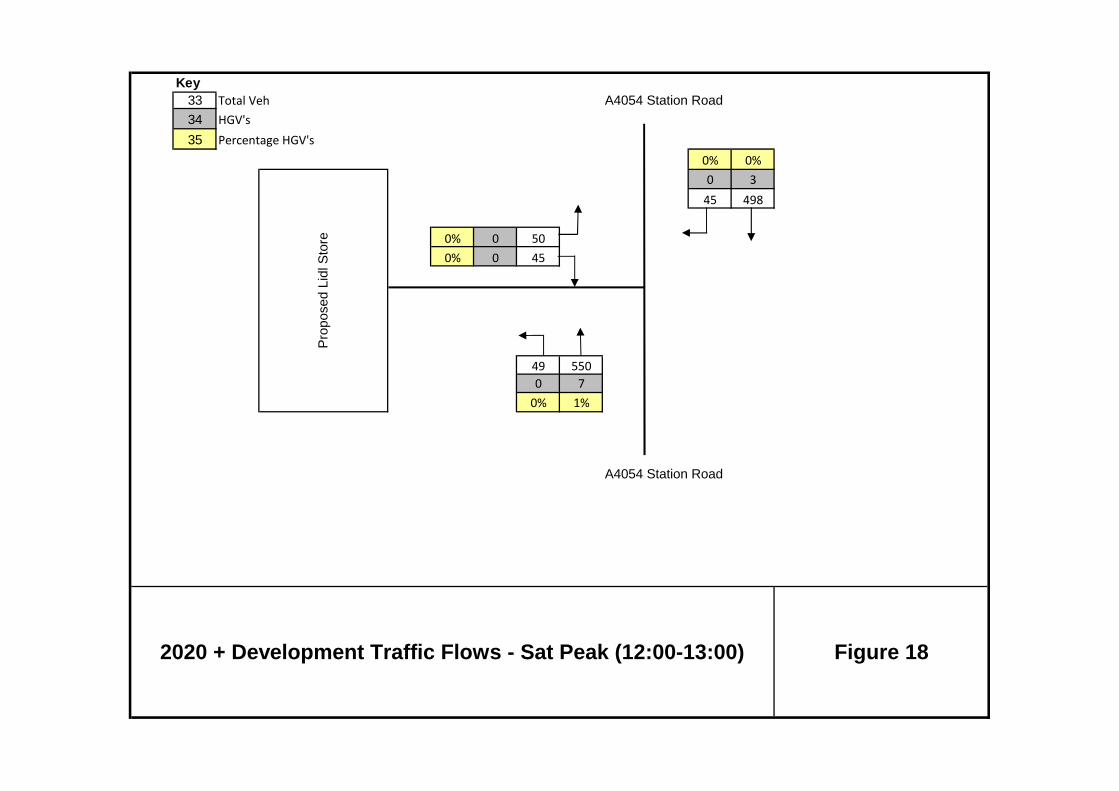
Key33 Total Veh A4054 Station Road
34 HGV's
35 Percentage HGV's
0% 0%
0 3
45 498
0% 0 50
0% 0 45
49 550
0 7
0% 1%
A4054 Station Road
Pro
pose
d Li
dl S
tore
2020 + Development Traffic Flows - Sat Peak (12:00-13:00) Figure 18

DRAWINGS
H
a
ile
y
P
a
r
k
W
o
r
k
s
CITY CENTRE
LOCAL CENTRE
7m x 2.5m x 2.5m
LIDL Flagpole
2.5m x 2.5m
Lidl Gable Sign
Retaining Wall
W141264_SK02
.
DRAWING NUMBER:
SCALES:
DRAWN: CHECKED:
REVISION:
DATE:
DRAWING TITLE:
PROJECT:
CLIENT:
REV. DETAILS DRAWN DATECHECKED
Notes:
Major Arm Geometries - Picady 01
Width of Carriageway (m)
Width of Kerbed Central Reserve (m)
Width of Right Turning Lane into Arm B (m)
Visibility Along A for C-B Traffic
Traffic from C-B Blocks C-A Traffic
No. of Right Turners Before Blocking
Minor Arm Geometries
Dist (m)
Picady 01 Dist. (m)
Give Way
@ 5m
@ 10m
@ 15m
@ 20m
9.7m
4.2m
4m
4m
4m
Visibilities
Left
19m
Right
7.9m
0m
3.2m
153m
0m
15m
N
1veh
H
a
ile
y
P
a
r
k
LOCAL CENTRE
7m x 2.5m x 2.5m
LIDL Flagpole
LOCAL CENTRE
7m x 2.5m x 2.5m
LIDL Flagpole
H
a
ile
y
P
a
r
k
LOCAL CENTRE
7m x 2.5m x 2.5m
LIDL Flagpole
H
a
ile
y
P
a
r
k
LOCAL CENTRE
7m x 2.5m x 2.5m
LIDL Flagpole
W141264_AT_A01
.
DRAWING NUMBER:
SCALES:
DRAWN: CHECKED:
REVISION:
DATE:
DRAWING TITLE:
PROJECT:
CLIENT:
REV. DETAILS DRAWN DATECHECKED
Notes:Site Access Site Egress
Service Access Service Egress

APPENDIX A
Transport Assessment Scope
1
Cerian Rowlands
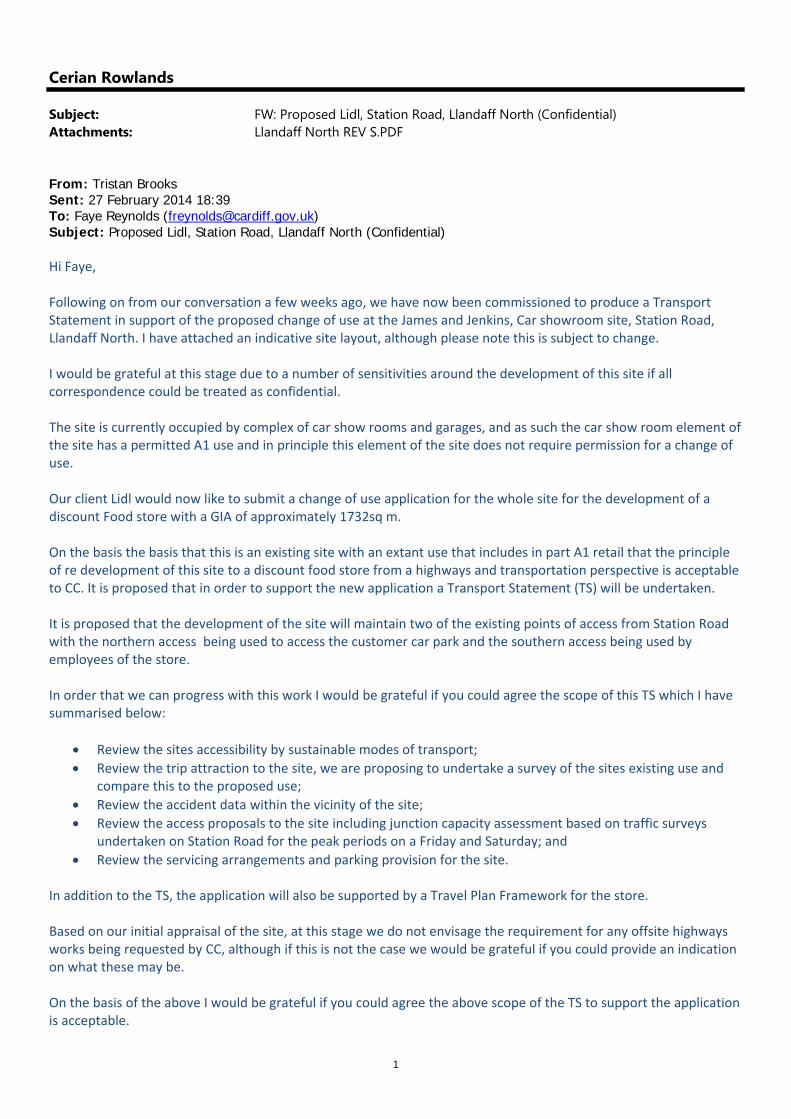
Subject: FW: Proposed Lidl, Station Road, Llandaff North (Confidential)Attachments: Llandaff North REV S.PDF
From: Tristan Brooks Sent: 27 February 2014 18:39 To: Faye Reynolds ([email protected]) Subject: Proposed Lidl, Station Road, Llandaff North (Confidential) Hi Faye, Following on from our conversation a few weeks ago, we have now been commissioned to produce a Transport Statement in support of the proposed change of use at the James and Jenkins, Car showroom site, Station Road, Llandaff North. I have attached an indicative site layout, although please note this is subject to change. I would be grateful at this stage due to a number of sensitivities around the development of this site if all correspondence could be treated as confidential. The site is currently occupied by complex of car show rooms and garages, and as such the car show room element of the site has a permitted A1 use and in principle this element of the site does not require permission for a change of use. Our client Lidl would now like to submit a change of use application for the whole site for the development of a discount Food store with a GIA of approximately 1732sq m. On the basis the basis that this is an existing site with an extant use that includes in part A1 retail that the principle of re development of this site to a discount food store from a highways and transportation perspective is acceptable to CC. It is proposed that in order to support the new application a Transport Statement (TS) will be undertaken. It is proposed that the development of the site will maintain two of the existing points of access from Station Road with the northern access being used to access the customer car park and the southern access being used by employees of the store. In order that we can progress with this work I would be grateful if you could agree the scope of this TS which I have summarised below:
Review the sites accessibility by sustainable modes of transport;
Review the trip attraction to the site, we are proposing to undertake a survey of the sites existing use and compare this to the proposed use;
Review the accident data within the vicinity of the site;
Review the access proposals to the site including junction capacity assessment based on traffic surveys undertaken on Station Road for the peak periods on a Friday and Saturday; and
Review the servicing arrangements and parking provision for the site. In addition to the TS, the application will also be supported by a Travel Plan Framework for the store. Based on our initial appraisal of the site, at this stage we do not envisage the requirement for any offsite highways works being requested by CC, although if this is not the case we would be grateful if you could provide an indication on what these may be. On the basis of the above I would be grateful if you could agree the above scope of the TS to support the application is acceptable.

2
If you have any queries, please feel free to give me a call. Regards Tristan Brooks Associate Tel: 02920 720870 Mobile: 07816 966701 www.vectos.co.uk 10th Floor Helmont House Churchill Way Cardiff CF10 2HE
Registered in England. Registered address: Vectos (South) Limited, Hardwick House, Prospect Place, Swindon SN1 3LJ. Company no. 7591661

APPENDIX B
PIA Data

The attached road casualty collision data has been provided solely for the purpose for which it was requested and the data set supplied must be treated in confidence. Data summaries and analysis of the data should be checked to ensure that there is no risk that any person could be identified by the application of other knowledge about any incident. Any other use of any part of the data, or passing it to a third party, could result in a breach of the data protection act.
14-03-2014 1
CRASH INFORMATION REPORT
Active Query Name : Vectos - Station Road Collision Data
Reference Number : 0185867 3 - SlightSeverity of Crash
12-12-2008Date of Crash
17:35Time of Crash
6 - FridayDay of Week
314874Easting
179061Northing
030 - 30mphSpeed Limit
6 - Single carriagewayRoad Type
00 - Not at or within 20m of junctionJunction DetailLight Conditions
2 - Rain/hail, no high windsWeather
2 - Wet or dampRoad Surface Condition
STATION ROAD, CARDIFF.Location Description
DRIVER V1 FAILED TO SEE PEDESTRIAN ONZEBRA CROSSING UNTIL LAST MINUTE ANDBRAKED AND COLLIDED WITH PEDESTRIANON THE CROSSING.
Crash Description
707 - Rain, sleet, snow, or fogContributory Factor 1
1Veh or Cas Reference Number 1
V - VehicleVehicle or Casualty 1
Vehicle Reference No : 1Record TypeVehicle Type 09 - CarFirst Point of Impact 1 - FrontAge of Driver 87Sex of Driver 2 - FemaleVehicle Movement - from 5 - SVehicle Movement - to 1 - N
Casualty Reference No : 1
14-03-2014 2
Vehicle Ref No 1Casualty Ref No 1Age of Casualty 16Sex of Casualty 2 - FemaleCasualty Class 3 - PedestrianSeverity of Casualty 3 - Slight
Reference Number : 0187162 3 - SlightSeverity of Crash
19-02-2009Date of Crash
17:15Time of Crash
5 - ThursdayDay of Week
314941Easting
178948Northing
030 - 30mphSpeed Limit
3 - Dual carriagewayRoad Type
00 - Not at or within 20m of junctionJunction DetailLight Conditions
1 - Fine, no high windsWeather
1 - DryRoad Surface Condition
TEXACO GARAGES, STATION ROAD, CARDIFFLocation Description
V2 was in a queue of traffic waiting to fill up at thepetrol station, the car in front, V1 reversed into V2.V1 F.T.S.
Crash Description
802 - Failed to look properlyContributory Factor 1
1Veh or Cas Reference Number 1
V - VehicleVehicle or Casualty 1
Vehicle Reference No : 1Record TypeVehicle Type 09 - CarFirst Point of Impact 2 - BackAge of Driver 35Sex of Driver 1 - MaleVehicle Movement - from 4 - SEVehicle Movement - to 8 - NW
14-03-2014 3
Vehicle Reference No : 2Record TypeVehicle Type 09 - CarFirst Point of Impact 1 - FrontAge of Driver 29Sex of Driver 1 - MaleVehicle Movement - from 0 - ParkedVehicle Movement - to 0 - Parked
Casualty Reference No : 1Vehicle Ref No 2Casualty Ref No 1Age of Casualty 29Sex of Casualty 1 - MaleCasualty Class 1 - Driver/riderSeverity of Casualty 3 - Slight
Casualty Reference No : 2Vehicle Ref No 2Casualty Ref No 2Age of Casualty 19Sex of Casualty 2 - FemaleCasualty Class 2 - Vehicle/pillion passengerSeverity of Casualty 3 - Slight
Reference Number : 0190358 3 - SlightSeverity of Crash
16-05-2009Date of Crash
13:00Time of Crash
7 - SaturdayDay of Week
314830Easting
179328Northing
030 - 30mphSpeed Limit
6 - Single carriagewayRoad Type
00 - Not at or within 20m of junctionJunction DetailLight Conditions
1 - Fine, no high windsWeather
14-03-2014 4
1 - DryRoad Surface Condition
STATION ROAD J/W TY-MAWR ROAD,LLANDAFF NORTH, CARDIFF
Location Description
V1 COLLIDED WITH REAR OF V2.Crash Description
308 - Following too closeContributory Factor 1
1Veh or Cas Reference Number 1
V - VehicleVehicle or Casualty 1
Vehicle Reference No : 1Record TypeVehicle Type 09 - CarFirst Point of Impact 1 - FrontAge of Driver 25Sex of Driver 1 - MaleVehicle Movement - from 7 - WVehicle Movement - to 3 - E
Vehicle Reference No : 2Record TypeVehicle Type 09 - CarFirst Point of Impact 2 - BackAge of Driver 53Sex of Driver 1 - MaleVehicle Movement - from 7 - WVehicle Movement - to 3 - E
Casualty Reference No : 2Vehicle Ref No 1Casualty Ref No 2Age of Casualty 22Sex of Casualty 2 - FemaleCasualty Class 2 - Vehicle/pillion passengerSeverity of Casualty 3 - Slight
Casualty Reference No : 1Vehicle Ref No 1Casualty Ref No 1Age of Casualty 25Sex of Casualty 1 - Male
14-03-2014 5
Casualty Class 1 - Driver/riderSeverity of Casualty 3 - Slight
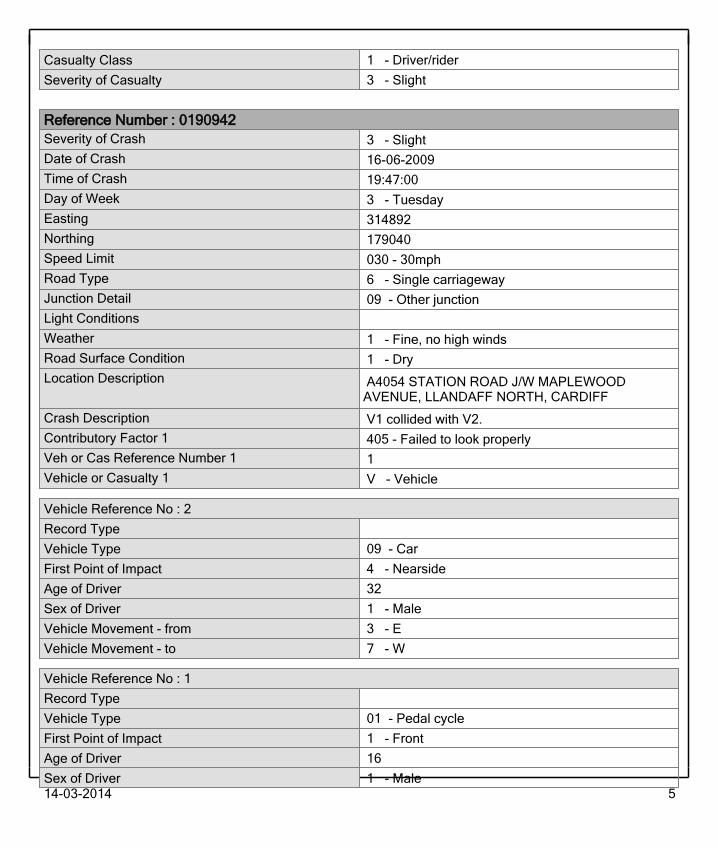
Reference Number : 0190942 3 - SlightSeverity of Crash
16-06-2009Date of Crash
19:47:00Time of Crash
3 - TuesdayDay of Week
314892Easting
179040Northing
030 - 30mphSpeed Limit
6 - Single carriagewayRoad Type
09 - Other junctionJunction DetailLight Conditions
1 - Fine, no high windsWeather
1 - DryRoad Surface Condition
A4054 STATION ROAD J/W MAPLEWOODAVENUE, LLANDAFF NORTH, CARDIFF
Location Description
V1 collided with V2.Crash Description
405 - Failed to look properlyContributory Factor 1
1Veh or Cas Reference Number 1
V - VehicleVehicle or Casualty 1
Vehicle Reference No : 2Record TypeVehicle Type 09 - CarFirst Point of Impact 4 - NearsideAge of Driver 32Sex of Driver 1 - MaleVehicle Movement - from 3 - EVehicle Movement - to 7 - W
Vehicle Reference No : 1Record TypeVehicle Type 01 - Pedal cycleFirst Point of Impact 1 - FrontAge of Driver 16Sex of Driver 1 - Male
14-03-2014 6
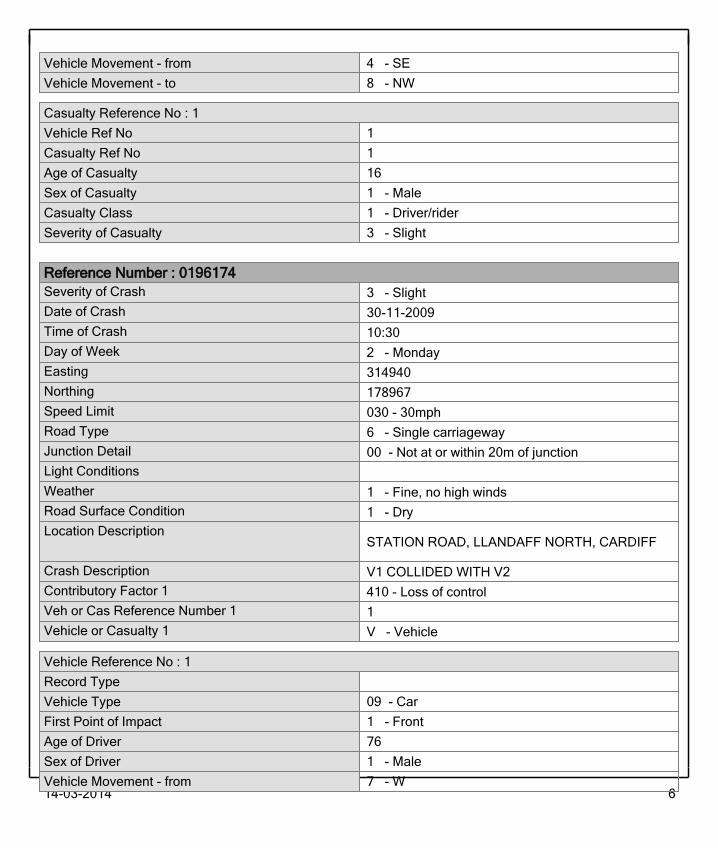
Vehicle Movement - from 4 - SEVehicle Movement - to 8 - NW
Casualty Reference No : 1Vehicle Ref No 1Casualty Ref No 1Age of Casualty 16Sex of Casualty 1 - MaleCasualty Class 1 - Driver/riderSeverity of Casualty 3 - Slight
Reference Number : 0196174 3 - SlightSeverity of Crash
30-11-2009Date of Crash
10:30Time of Crash
2 - MondayDay of Week
314940Easting
178967Northing
030 - 30mphSpeed Limit
6 - Single carriagewayRoad Type
00 - Not at or within 20m of junctionJunction DetailLight Conditions
1 - Fine, no high windsWeather
1 - DryRoad Surface Condition
STATION ROAD, LLANDAFF NORTH, CARDIFFLocation Description
V1 COLLIDED WITH V2Crash Description
410 - Loss of controlContributory Factor 1
1Veh or Cas Reference Number 1
V - VehicleVehicle or Casualty 1
Vehicle Reference No : 1Record TypeVehicle Type 09 - CarFirst Point of Impact 1 - FrontAge of Driver 76Sex of Driver 1 - MaleVehicle Movement - from 7 - W
14-03-2014 7
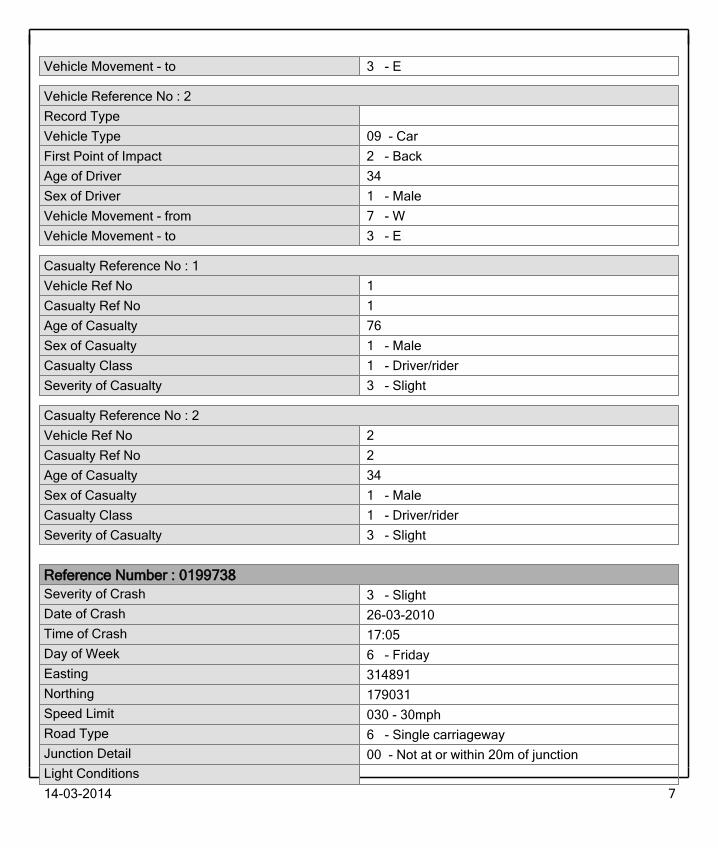
Vehicle Movement - to 3 - E
Vehicle Reference No : 2Record TypeVehicle Type 09 - CarFirst Point of Impact 2 - BackAge of Driver 34Sex of Driver 1 - MaleVehicle Movement - from 7 - WVehicle Movement - to 3 - E
Casualty Reference No : 1Vehicle Ref No 1Casualty Ref No 1Age of Casualty 76Sex of Casualty 1 - MaleCasualty Class 1 - Driver/riderSeverity of Casualty 3 - Slight
Casualty Reference No : 2Vehicle Ref No 2Casualty Ref No 2Age of Casualty 34Sex of Casualty 1 - MaleCasualty Class 1 - Driver/riderSeverity of Casualty 3 - Slight
Reference Number : 0199738 3 - SlightSeverity of Crash
26-03-2010Date of Crash
17:05Time of Crash
6 - FridayDay of Week
314891Easting
179031Northing
030 - 30mphSpeed Limit
6 - Single carriagewayRoad Type
00 - Not at or within 20m of junctionJunction DetailLight Conditions
14-03-2014 8
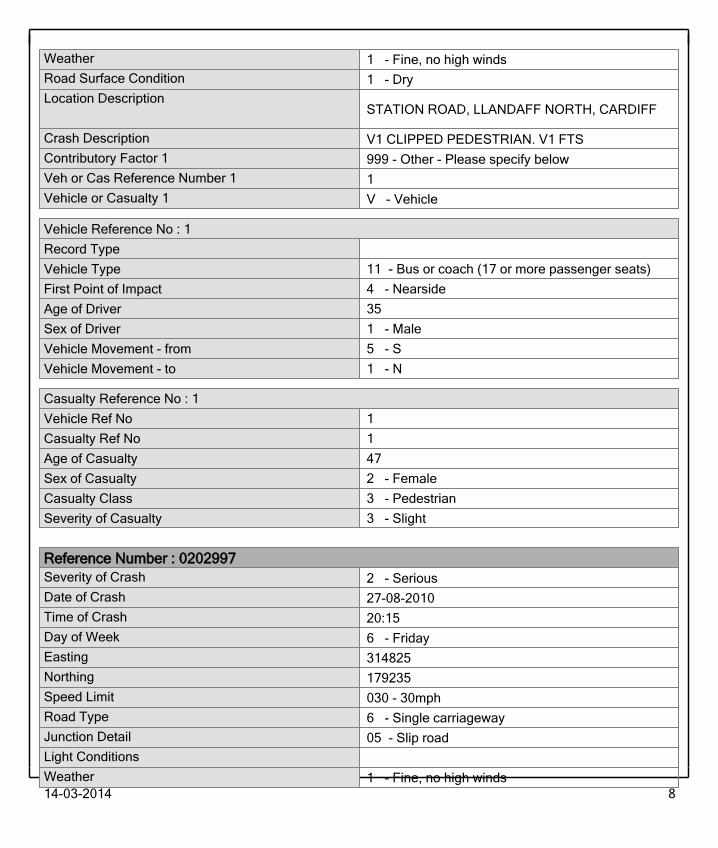
1 - Fine, no high windsWeather
1 - DryRoad Surface Condition
STATION ROAD, LLANDAFF NORTH, CARDIFFLocation Description
V1 CLIPPED PEDESTRIAN. V1 FTSCrash Description
999 - Other - Please specify belowContributory Factor 1
1Veh or Cas Reference Number 1
V - VehicleVehicle or Casualty 1
Vehicle Reference No : 1Record TypeVehicle Type 11 - Bus or coach (17 or more passenger seats)First Point of Impact 4 - NearsideAge of Driver 35Sex of Driver 1 - MaleVehicle Movement - from 5 - SVehicle Movement - to 1 - N
Casualty Reference No : 1Vehicle Ref No 1Casualty Ref No 1Age of Casualty 47Sex of Casualty 2 - FemaleCasualty Class 3 - PedestrianSeverity of Casualty 3 - Slight
Reference Number : 0202997 2 - SeriousSeverity of Crash
27-08-2010Date of Crash
20:15Time of Crash
6 - FridayDay of Week
314825Easting
179235Northing
030 - 30mphSpeed Limit
6 - Single carriagewayRoad Type
05 - Slip roadJunction DetailLight Conditions
1 - Fine, no high windsWeather

14-03-2014 9
1 - DryRoad Surface Condition
A4054, STATION ROAD, JUNCTION HAWTHORNROAD EAST, CARDIFF
Location Description
V1 collided with V2.Crash Description
801 - Crossed road masked by stationary or parke…Contributory Factor 1
1Veh or Cas Reference Number 1
C - CasualtyVehicle or Casualty 1
Vehicle Reference No : 1Record TypeVehicle Type 09 - CarFirst Point of Impact 4 - NearsideAge of Driver 72Sex of Driver 1 - MaleVehicle Movement - from 4 - SEVehicle Movement - to 8 - NW
Casualty Reference No : 1Vehicle Ref No 1Casualty Ref No 1Age of Casualty 13Sex of Casualty 1 - MaleCasualty Class 3 - PedestrianSeverity of Casualty 2 - Serious
Reference Number : 0183278 3 - SlightSeverity of Crash
11-07-2008Date of Crash
09:20Time of Crash
6 - FridayDay of Week
314830Easting
179280Northing
030 - 30mphSpeed Limit
6 - Single carriagewayRoad Type
00 - Not at or within 20m of junctionJunction DetailLight Conditions
2 - Rain/hail, no high windsWeather
2 - Wet or dampRoad Surface Condition
14-03-2014 10
O/S DOCTOR`S SURGERY, STATION ROAD,LLANDAFF NORTH, CARDIFF
Location Description
V1 DRIVING TOO CLOSELY TO V2. V2 BRAKED& V1 COLLIDED WITH ITS REAR
Crash Description
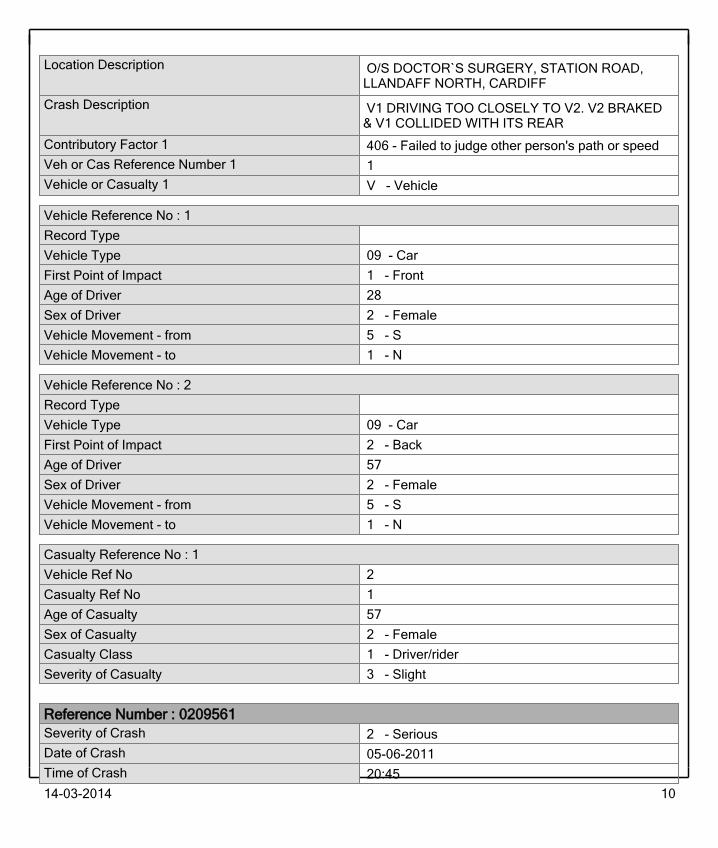
406 - Failed to judge other person's path or speedContributory Factor 1
1Veh or Cas Reference Number 1
V - VehicleVehicle or Casualty 1
Vehicle Reference No : 1Record TypeVehicle Type 09 - CarFirst Point of Impact 1 - FrontAge of Driver 28Sex of Driver 2 - FemaleVehicle Movement - from 5 - SVehicle Movement - to 1 - N
Vehicle Reference No : 2Record TypeVehicle Type 09 - CarFirst Point of Impact 2 - BackAge of Driver 57Sex of Driver 2 - FemaleVehicle Movement - from 5 - SVehicle Movement - to 1 - N
Casualty Reference No : 1Vehicle Ref No 2Casualty Ref No 1Age of Casualty 57Sex of Casualty 2 - FemaleCasualty Class 1 - Driver/riderSeverity of Casualty 3 - Slight
Reference Number : 0209561 2 - SeriousSeverity of Crash
05-06-2011Date of Crash
20:45Time of Crash
14-03-2014 11
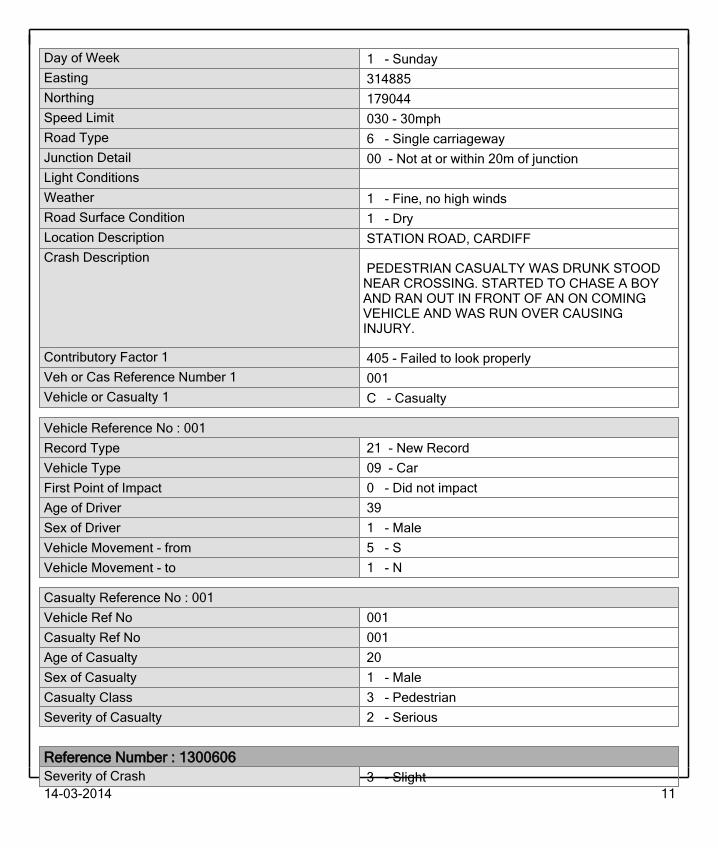
1 - SundayDay of Week
314885Easting
179044Northing
030 - 30mphSpeed Limit
6 - Single carriagewayRoad Type
00 - Not at or within 20m of junctionJunction DetailLight Conditions
1 - Fine, no high windsWeather
1 - DryRoad Surface Condition
STATION ROAD, CARDIFFLocation Description
PEDESTRIAN CASUALTY WAS DRUNK STOODNEAR CROSSING. STARTED TO CHASE A BOYAND RAN OUT IN FRONT OF AN ON COMINGVEHICLE AND WAS RUN OVER CAUSINGINJURY.
Crash Description
405 - Failed to look properlyContributory Factor 1
001Veh or Cas Reference Number 1
C - CasualtyVehicle or Casualty 1
Vehicle Reference No : 001Record Type 21 - New RecordVehicle Type 09 - CarFirst Point of Impact 0 - Did not impactAge of Driver 39Sex of Driver 1 - MaleVehicle Movement - from 5 - SVehicle Movement - to 1 - N
Casualty Reference No : 001Vehicle Ref No 001Casualty Ref No 001Age of Casualty 20Sex of Casualty 1 - MaleCasualty Class 3 - PedestrianSeverity of Casualty 2 - Serious
Reference Number : 1300606 3 - SlightSeverity of Crash
14-03-2014 12
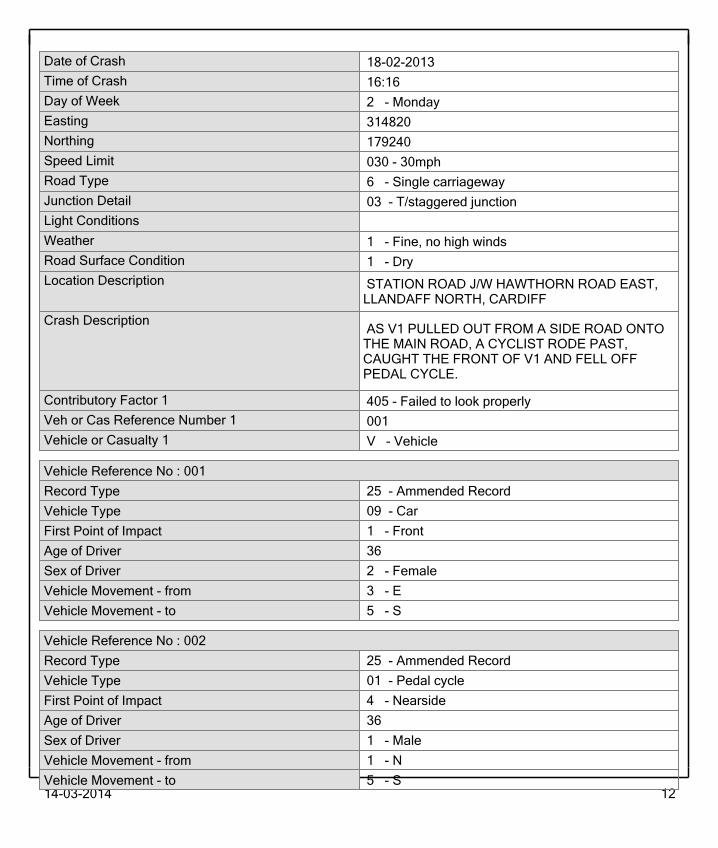
18-02-2013Date of Crash
16:16Time of Crash
2 - MondayDay of Week
314820Easting
179240Northing
030 - 30mphSpeed Limit
6 - Single carriagewayRoad Type
03 - T/staggered junctionJunction DetailLight Conditions
1 - Fine, no high windsWeather
1 - DryRoad Surface Condition
STATION ROAD J/W HAWTHORN ROAD EAST,LLANDAFF NORTH, CARDIFF
Location Description
AS V1 PULLED OUT FROM A SIDE ROAD ONTOTHE MAIN ROAD, A CYCLIST RODE PAST,CAUGHT THE FRONT OF V1 AND FELL OFFPEDAL CYCLE.
Crash Description
405 - Failed to look properlyContributory Factor 1
001Veh or Cas Reference Number 1
V - VehicleVehicle or Casualty 1
Vehicle Reference No : 001Record Type 25 - Ammended RecordVehicle Type 09 - CarFirst Point of Impact 1 - FrontAge of Driver 36Sex of Driver 2 - FemaleVehicle Movement - from 3 - EVehicle Movement - to 5 - S
Vehicle Reference No : 002Record Type 25 - Ammended RecordVehicle Type 01 - Pedal cycleFirst Point of Impact 4 - NearsideAge of Driver 36Sex of Driver 1 - MaleVehicle Movement - from 1 - NVehicle Movement - to 5 - S

14-03-2014 13
Casualty Reference No : 002Vehicle Ref No 002Casualty Ref No 002Age of Casualty 36Sex of Casualty 1 - MaleCasualty Class 1 - Driver/riderSeverity of Casualty 3 - Slight

APPENDIX C
Traffic Surveys

C0467 STATION ROAD
GENERAL LOCATION PLANMARCH 2014
1 of 58Prepared for
The Scottish Executive
C0467
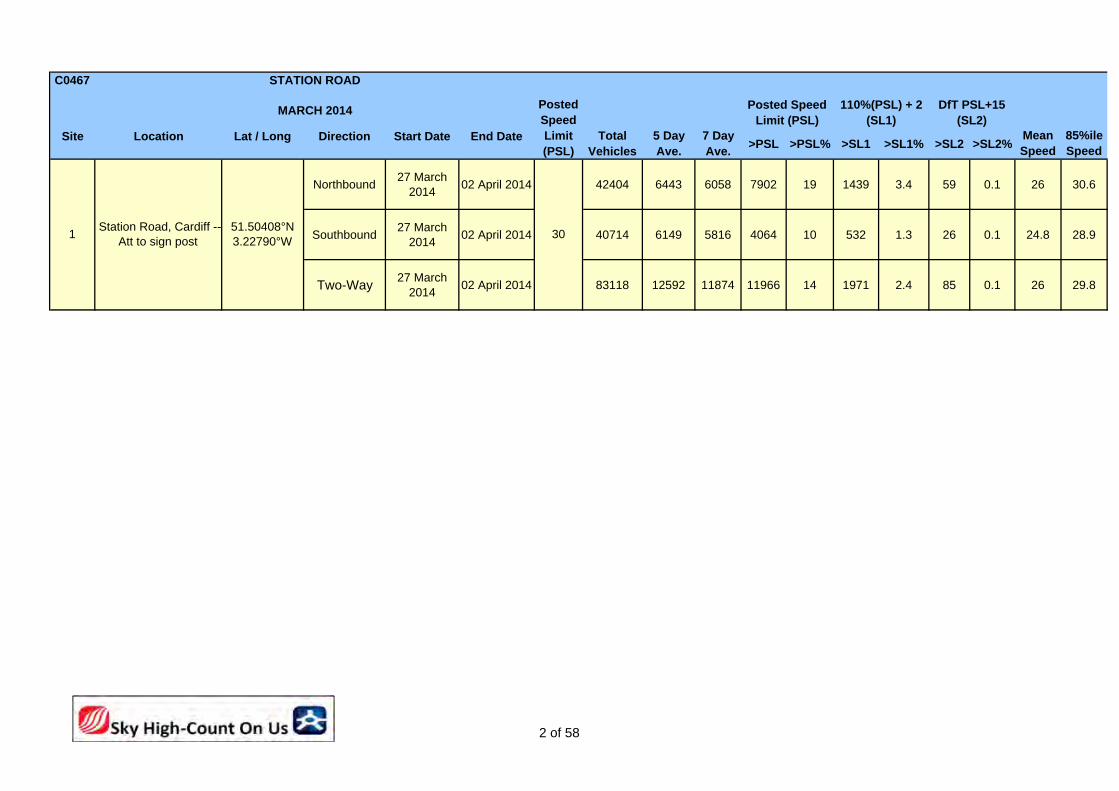
Site Location Lat / Long Direction Start Date End Date>PSL >PSL% >SL1 >SL1% >SL2 >SL2%
Mean Speed
85%ile Speed
Northbound27 March
201402 April 2014 42404 6443 6058 7902 19 1439 3.4 59 0.1 26 30.6
Southbound27 March
201402 April 2014 40714 6149 5816 4064 10 532 1.3 26 0.1 24.8 28.9
Two-Way27 March
201402 April 2014 83118 12592 11874 11966 14 1971 2.4 85 0.1 26 29.8
110%(PSL) + 2 (SL1)
DfT PSL+15 (SL2)
5 Day Ave.
7 Day Ave.
STATION ROAD
MARCH 2014 Posted Speed Limit (PSL)
Posted Speed Limit (PSL)
3051.50408°N 3.22790°W
Station Road, Cardiff -- Att to sign post
1
Total Vehicles
2 of 58

C0467
Site Location Lat / Long Direction Start Date End Date
Northbound27 March
201402 April 2014
Southbound27 March
201402 April 2014
Two-Way27 March
201402 April 2014
STATION ROAD
MARCH 2014 Posted Speed Limit (PSL)
3051.50408°N 3.22790°W
Station Road, Cardiff -- Att to sign post
1
95%ile Speed
33.8
31.8
32.9
3 of 58

C0467 Site 1 Location
to Direction Northbound
0000 16 0 15 1 0 0 0 0 0 0 0 0 0 001:00 9 0 7 2 0 0 0 0 0 0 0 0 0 002:00 4 1 0 3 0 0 0 0 0 0 0 0 0 003:00 3 0 3 0 0 0 0 0 0 0 0 0 0 004:00 9 0 9 0 0 0 0 0 0 0 0 0 0 005:00 34 0 30 3 0 1 0 0 0 0 0 0 0 006:00 90 2 69 14 1 3 0 0 1 0 0 0 0 007:00 401 11 335 45 2 5 1 0 2 0 0 0 0 008:00 627 4 550 58 4 1 4 1 4 0 1 0 0 009:00 377 6 319 48 2 0 0 1 1 0 0 0 0 010:00 353 6 310 32 0 5 0 0 0 0 0 0 0 011:00 359 1 312 45 1 0 0 0 0 0 0 0 0 012:00 393 5 334 46 3 2 1 0 2 0 0 0 0 013:00 395 8 339 45 0 0 1 0 1 0 1 0 0 014:00 393 0 344 44 2 0 0 0 1 1 0 1 0 015:00 444 3 398 37 2 0 1 0 2 0 0 1 0 016:00 501 4 433 59 1 1 0 0 3 0 0 0 0 017:00 511 19 449 32 0 1 4 1 5 0 0 0 0 018:00 531 8 490 25 0 2 2 0 2 0 0 1 0 119:00 339 9 309 18 0 1 0 0 2 0 0 0 0 020:00 295 3 266 23 0 1 0 1 0 0 1 0 0 021:00 194 1 183 10 0 0 0 0 0 0 0 0 0 022:00 124 2 115 7 0 0 0 0 0 0 0 0 0 023:00 63 2 56 5 0 0 0 0 0 0 0 0 0 007-19 5285 75 4613 516 17 17 14 3 23 1 2 3 0 106-22 6203 90 5440 581 18 22 14 4 26 1 3 3 0 106-00 6390 94 5611 593 18 22 14 4 26 1 3 3 0 100-00 6465 95 5675 602 18 23 14 4 26 1 3 3 0 1
SEVEN OR MORE AXLE
ARTICFIVE AXLE
ARTIC
SIX OR MORE AXLE
ARTIC
SIX AXLE MULTI-
TRAILER ARTIC
27 March 2014
Station Road, Cardiff -- Att to sign post (51.50408°N 3.22790°W)
27 March 2014 02 April 2014
STATION ROAD
LIGHT GOODS
VEHICLES
FIVE OR LESS AXLE
MULTI-TRAILER
ARTICMOTOR-CYCLES
FOUR OR MORE AXLE
RIGIDBUSES
FOUR OR LESS AXLE
ARTICTOTAL
VEHICLES
CARS OR CAR-
BASED LGV
THREE AXLE
RIGID
TWO AXLE, SIX
TYRE, RIGID
TIME PERIOD
4 of 58

C0467 Site 1 Location
to Direction Northbound
SEVEN OR MORE AXLE
ARTICFIVE AXLE
ARTIC
SIX OR MORE AXLE
ARTIC
SIX AXLE MULTI-
TRAILER ARTIC
Station Road, Cardiff -- Att to sign post (51.50408°N 3.22790°W)
27 March 2014 02 April 2014
STATION ROAD
LIGHT GOODS
VEHICLES
FIVE OR LESS AXLE
MULTI-TRAILER
ARTICMOTOR-CYCLES
FOUR OR MORE AXLE
RIGIDBUSES
FOUR OR LESS AXLE
ARTICTOTAL
VEHICLES
CARS OR CAR-
BASED LGV
THREE AXLE
RIGID
TWO AXLE, SIX
TYRE, RIGID
TIME PERIOD
0000 14 0 14 0 0 0 0 0 0 0 0 0 0 001:00 9 0 9 0 0 0 0 0 0 0 0 0 0 002:00 6 0 5 1 0 0 0 0 0 0 0 0 0 003:00 10 1 9 0 0 0 0 0 0 0 0 0 0 004:00 9 0 7 2 0 0 0 0 0 0 0 0 0 005:00 25 0 22 2 0 1 0 0 0 0 0 0 0 006:00 84 1 65 11 1 4 0 0 1 0 1 0 0 007:00 351 4 296 44 2 3 0 0 2 0 0 0 0 008:00 581 3 523 46 3 3 0 0 3 0 0 0 0 009:00 437 7 387 39 1 3 0 0 0 0 0 0 0 010:00 403 1 345 51 2 0 1 0 3 0 0 0 0 011:00 431 3 387 35 1 2 1 0 1 0 1 0 0 012:00 423 3 368 42 3 1 2 0 3 0 0 0 0 113:00 404 4 357 32 1 3 1 0 4 0 2 0 0 014:00 432 3 372 48 1 2 1 0 5 0 0 0 0 015:00 505 9 449 41 1 2 1 0 2 0 0 0 0 016:00 543 9 492 36 1 2 2 0 1 0 0 0 0 017:00 550 15 483 46 0 1 2 0 3 0 0 0 0 018:00 421 6 386 22 0 2 1 0 3 0 0 1 0 019:00 362 1 344 13 0 1 1 0 1 0 0 1 0 020:00 242 3 225 11 0 1 2 0 0 0 0 0 0 021:00 157 3 147 7 0 0 0 0 0 0 0 0 0 022:00 125 3 109 13 0 0 0 0 0 0 0 0 0 023:00 107 1 100 5 0 0 0 0 1 0 0 0 0 007-19 5481 67 4845 482 16 24 12 0 30 0 3 1 0 106-22 6326 75 5626 524 17 30 15 0 32 0 4 2 0 106-00 6558 79 5835 542 17 30 15 0 33 0 4 2 0 100-00 6631 80 5901 547 17 31 15 0 33 0 4 2 0 1
28 March 2014
5 of 58

C0467 Site 1 Location
to Direction Northbound
SEVEN OR MORE AXLE
ARTICFIVE AXLE
ARTIC
SIX OR MORE AXLE
ARTIC
SIX AXLE MULTI-
TRAILER ARTIC
Station Road, Cardiff -- Att to sign post (51.50408°N 3.22790°W)
27 March 2014 02 April 2014
STATION ROAD
LIGHT GOODS
VEHICLES
FIVE OR LESS AXLE
MULTI-TRAILER
ARTICMOTOR-CYCLES
FOUR OR MORE AXLE
RIGIDBUSES
FOUR OR LESS AXLE
ARTICTOTAL
VEHICLES
CARS OR CAR-
BASED LGV
THREE AXLE
RIGID
TWO AXLE, SIX
TYRE, RIGID
TIME PERIOD
0000 74 0 71 3 0 0 0 0 0 0 0 0 0 001:00 21 0 18 3 0 0 0 0 0 0 0 0 0 002:00 8 0 7 1 0 0 0 0 0 0 0 0 0 003:00 11 0 10 1 0 0 0 0 0 0 0 0 0 004:00 9 0 8 1 0 0 0 0 0 0 0 0 0 005:00 26 1 21 4 0 0 0 0 0 0 0 0 0 006:00 46 1 37 6 2 0 0 0 0 0 0 0 0 007:00 109 3 84 18 0 3 1 0 0 0 0 0 0 008:00 242 11 209 18 2 1 0 0 1 0 0 0 0 009:00 370 8 321 33 3 0 3 0 2 0 0 0 0 010:00 417 9 373 31 1 2 1 0 0 0 0 0 0 011:00 461 4 422 29 1 0 2 0 1 0 1 1 0 012:00 501 4 455 36 2 0 1 0 2 0 0 1 0 013:00 481 6 442 30 0 0 2 0 1 0 0 0 0 014:00 431 10 397 18 1 0 2 0 3 0 0 0 0 015:00 379 6 348 21 0 0 1 0 2 0 1 0 0 016:00 415 7 387 18 0 0 0 1 1 0 0 0 0 117:00 383 3 356 21 0 0 2 0 1 0 0 0 0 018:00 374 4 350 17 1 0 1 0 1 0 0 0 0 019:00 295 3 270 18 0 1 1 0 2 0 0 0 0 020:00 220 1 209 8 0 1 0 0 1 0 0 0 0 021:00 139 3 130 5 0 1 0 0 0 0 0 0 0 022:00 109 1 102 4 0 1 1 0 0 0 0 0 0 023:00 104 2 93 8 0 1 0 0 0 0 0 0 0 007-19 4563 75 4144 290 11 6 16 1 15 0 2 2 0 106-22 5263 83 4790 327 13 9 17 1 18 0 2 2 0 106-00 5476 86 4985 339 13 11 18 1 18 0 2 2 0 100-00 5625 87 5120 352 13 11 18 1 18 0 2 2 0 1
29 March 2014
6 of 58

C0467 Site 1 Location
to Direction Northbound
SEVEN OR MORE AXLE
ARTICFIVE AXLE
ARTIC
SIX OR MORE AXLE
ARTIC
SIX AXLE MULTI-
TRAILER ARTIC
Station Road, Cardiff -- Att to sign post (51.50408°N 3.22790°W)
27 March 2014 02 April 2014
STATION ROAD
LIGHT GOODS
VEHICLES
FIVE OR LESS AXLE
MULTI-TRAILER
ARTICMOTOR-CYCLES
FOUR OR MORE AXLE
RIGIDBUSES
FOUR OR LESS AXLE
ARTICTOTAL
VEHICLES
CARS OR CAR-
BASED LGV
THREE AXLE
RIGID
TWO AXLE, SIX
TYRE, RIGID
TIME PERIOD
0000 64 0 59 5 0 0 0 0 0 0 0 0 0 001:00 32 0 28 4 0 0 0 0 0 0 0 0 0 002:00 17 0 16 1 0 0 0 0 0 0 0 0 0 003:00 14 0 13 1 0 0 0 0 0 0 0 0 0 004:00 21 0 16 5 0 0 0 0 0 0 0 0 0 005:00 26 1 23 2 0 0 0 0 0 0 0 0 0 006:00 49 1 42 6 0 0 0 0 0 0 0 0 0 007:00 91 2 84 5 0 0 0 0 0 0 0 0 0 008:00 205 8 183 13 0 0 0 0 1 0 0 0 0 009:00 313 5 293 14 1 0 0 0 0 0 0 0 0 010:00 372 8 343 15 1 0 1 0 4 0 0 0 0 011:00 463 10 427 23 1 0 2 0 0 0 0 0 0 012:00 391 9 364 15 0 0 2 0 1 0 0 0 0 013:00 363 9 334 17 1 0 1 0 1 0 0 0 0 014:00 354 7 329 12 1 0 2 0 3 0 0 0 0 015:00 380 6 357 16 0 0 0 0 1 0 0 0 0 016:00 359 5 331 20 1 0 0 0 2 0 0 0 0 017:00 315 5 295 13 0 0 0 0 2 0 0 0 0 018:00 258 5 239 11 0 0 1 0 2 0 0 0 0 019:00 210 3 192 13 0 0 0 0 2 0 0 0 0 020:00 140 1 130 9 0 0 0 0 0 0 0 0 0 021:00 77 3 71 3 0 0 0 0 0 0 0 0 0 022:00 33 0 31 2 0 0 0 0 0 0 0 0 0 023:00 17 0 17 0 0 0 0 0 0 0 0 0 0 007-19 3864 79 3579 174 6 0 9 0 17 0 0 0 0 006-22 4340 87 4014 205 6 0 9 0 19 0 0 0 0 006-00 4390 87 4062 207 6 0 9 0 19 0 0 0 0 000-00 4564 88 4217 225 6 0 9 0 19 0 0 0 0 0
30 March 2014
7 of 58

C0467 Site 1 Location
to Direction Northbound
SEVEN OR MORE AXLE
ARTICFIVE AXLE
ARTIC
SIX OR MORE AXLE
ARTIC
SIX AXLE MULTI-
TRAILER ARTIC
Station Road, Cardiff -- Att to sign post (51.50408°N 3.22790°W)
27 March 2014 02 April 2014
STATION ROAD
LIGHT GOODS
VEHICLES
FIVE OR LESS AXLE
MULTI-TRAILER
ARTICMOTOR-CYCLES
FOUR OR MORE AXLE
RIGIDBUSES
FOUR OR LESS AXLE
ARTICTOTAL
VEHICLES
CARS OR CAR-
BASED LGV
THREE AXLE
RIGID
TWO AXLE, SIX
TYRE, RIGID
TIME PERIOD
0000 13 0 11 2 0 0 0 0 0 0 0 0 0 001:00 9 0 8 1 0 0 0 0 0 0 0 0 0 002:00 9 0 7 2 0 0 0 0 0 0 0 0 0 003:00 9 0 6 3 0 0 0 0 0 0 0 0 0 004:00 27 0 20 5 0 2 0 0 0 0 0 0 0 005:00 83 2 65 12 2 1 0 0 1 0 0 0 0 006:00 358 4 308 39 2 4 1 0 0 0 0 0 0 007:00 596 7 528 51 2 0 2 0 6 0 0 0 0 008:00 492 3 444 39 2 3 1 0 0 0 0 0 0 009:00 343 3 298 32 0 6 1 0 3 0 0 0 0 010:00 385 7 324 50 1 2 0 0 1 0 0 0 0 011:00 371 3 320 44 0 2 2 0 0 0 0 0 0 012:00 353 3 306 37 1 3 1 1 1 0 0 0 0 013:00 419 4 369 42 0 2 0 0 2 0 0 0 0 014:00 498 6 442 45 0 1 1 0 2 0 0 0 0 115:00 494 9 439 45 1 0 0 0 0 0 0 0 0 016:00 434 19 383 25 1 1 0 0 5 0 0 0 0 017:00 411 8 378 20 1 3 0 0 1 0 0 0 0 018:00 341 8 309 22 0 1 0 0 1 0 0 0 0 019:00 247 3 229 13 0 0 1 0 1 0 0 0 0 020:00 156 4 144 8 0 0 0 0 0 0 0 0 0 021:00 106 1 98 7 0 0 0 0 0 0 0 0 0 022:00 45 0 40 5 0 0 0 0 0 0 0 0 0 023:00 15 0 15 0 0 0 0 0 0 0 0 0 0 007-19 5137 80 4540 452 9 24 8 1 22 0 0 0 0 106-22 6004 92 5319 519 11 28 10 1 23 0 0 0 0 106-00 6064 92 5374 524 11 28 10 1 23 0 0 0 0 100-00 6214 94 5491 549 13 31 10 1 24 0 0 0 0 1
31 March 2014
8 of 58

C0467 Site 1 Location
to Direction Northbound
SEVEN OR MORE AXLE
ARTICFIVE AXLE
ARTIC
SIX OR MORE AXLE
ARTIC
SIX AXLE MULTI-
TRAILER ARTIC
Station Road, Cardiff -- Att to sign post (51.50408°N 3.22790°W)
27 March 2014 02 April 2014
STATION ROAD
LIGHT GOODS
VEHICLES
FIVE OR LESS AXLE
MULTI-TRAILER
ARTICMOTOR-CYCLES
FOUR OR MORE AXLE
RIGIDBUSES
FOUR OR LESS AXLE
ARTICTOTAL
VEHICLES
CARS OR CAR-
BASED LGV
THREE AXLE
RIGID
TWO AXLE, SIX
TYRE, RIGID
TIME PERIOD
0000 10 0 7 3 0 0 0 0 0 0 0 0 0 001:00 4 1 3 0 0 0 0 0 0 0 0 0 0 002:00 6 0 6 0 0 0 0 0 0 0 0 0 0 003:00 5 0 3 2 0 0 0 0 0 0 0 0 0 004:00 30 0 25 5 0 0 0 0 0 0 0 0 0 005:00 99 1 78 13 1 6 0 0 0 0 0 0 0 006:00 369 6 318 41 0 3 1 0 0 0 0 0 0 007:00 580 8 520 42 3 2 1 0 4 0 0 0 0 008:00 464 8 392 52 2 4 1 1 3 0 0 1 0 009:00 365 3 310 49 0 2 0 0 1 0 0 0 0 010:00 358 8 301 41 0 4 1 0 3 0 0 0 0 011:00 408 7 362 37 0 1 1 0 0 0 0 0 0 012:00 398 5 345 41 2 1 0 0 3 0 0 1 0 013:00 379 6 329 37 4 3 0 0 0 0 0 0 0 014:00 460 8 409 36 3 2 0 0 2 0 0 0 0 015:00 487 10 425 43 1 0 3 0 5 0 0 0 0 016:00 519 20 454 38 0 2 2 0 2 0 1 0 0 017:00 458 11 419 22 0 2 0 0 4 0 0 0 0 018:00 361 13 325 17 0 1 2 0 3 0 0 0 0 019:00 269 6 248 13 1 0 0 0 1 0 0 0 0 020:00 177 5 165 5 0 0 0 0 2 0 0 0 0 021:00 125 1 116 8 0 0 0 0 0 0 0 0 0 022:00 42 2 38 2 0 0 0 0 0 0 0 0 0 023:00 21 0 19 2 0 0 0 0 0 0 0 0 0 007-19 5237 107 4591 455 15 24 11 1 30 0 1 2 0 006-22 6177 125 5438 522 16 27 12 1 33 0 1 2 0 006-00 6240 127 5495 526 16 27 12 1 33 0 1 2 0 000-00 6394 129 5617 549 17 33 12 1 33 0 1 2 0 0
01 April 2014
9 of 58

C0467 Site 1 Location
to Direction Northbound
SEVEN OR MORE AXLE
ARTICFIVE AXLE
ARTIC
SIX OR MORE AXLE
ARTIC
SIX AXLE MULTI-
TRAILER ARTIC
Station Road, Cardiff -- Att to sign post (51.50408°N 3.22790°W)
27 March 2014 02 April 2014
STATION ROAD
LIGHT GOODS
VEHICLES
FIVE OR LESS AXLE
MULTI-TRAILER
ARTICMOTOR-CYCLES
FOUR OR MORE AXLE
RIGIDBUSES
FOUR OR LESS AXLE
ARTICTOTAL
VEHICLES
CARS OR CAR-
BASED LGV
THREE AXLE
RIGID
TWO AXLE, SIX
TYRE, RIGID
TIME PERIOD
0000 14 1 12 1 0 0 0 0 0 0 0 0 0 001:00 5 0 5 0 0 0 0 0 0 0 0 0 0 002:00 4 0 4 0 0 0 0 0 0 0 0 0 0 003:00 8 0 7 1 0 0 0 0 0 0 0 0 0 004:00 24 0 22 1 0 1 0 0 0 0 0 0 0 005:00 85 2 70 7 1 4 0 0 1 0 0 0 0 006:00 378 5 331 40 0 2 0 0 0 0 0 0 0 007:00 610 10 546 43 4 2 0 0 5 0 0 0 0 008:00 433 0 370 55 1 0 1 0 6 0 0 0 0 009:00 352 4 302 41 0 2 1 0 2 0 0 0 0 010:00 357 1 306 46 0 2 1 0 1 0 0 0 0 011:00 403 0 367 31 1 2 0 0 2 0 0 0 0 012:00 392 4 340 44 2 1 0 0 1 0 0 0 0 013:00 372 1 325 41 1 1 1 0 1 0 0 1 0 014:00 496 8 440 44 1 0 0 0 2 0 1 0 0 015:00 514 10 452 42 1 1 2 0 6 0 0 0 0 016:00 577 16 527 29 0 1 0 0 4 0 0 0 0 017:00 430 7 392 23 0 2 2 0 4 0 0 0 0 018:00 396 6 366 19 2 0 0 0 1 0 1 1 0 019:00 273 4 249 20 0 0 0 0 0 0 0 0 0 020:00 206 3 191 11 0 0 0 0 0 0 1 0 0 021:00 119 1 107 9 0 1 1 0 0 0 0 0 0 022:00 43 0 40 2 0 0 1 0 0 0 0 0 0 023:00 20 0 19 1 0 0 0 0 0 0 0 0 0 007-19 5332 67 4733 458 13 14 8 0 35 0 2 2 0 006-22 6308 80 5611 538 13 17 9 0 35 0 3 2 0 006-00 6371 80 5670 541 13 17 10 0 35 0 3 2 0 000-00 6511 83 5790 551 14 22 10 0 36 0 3 2 0 0
02 April 2014
10 of 58

C0467 Site 1 Location
to Direction Northbound
SEVEN OR MORE AXLE
ARTICFIVE AXLE
ARTIC
SIX OR MORE AXLE
ARTIC
SIX AXLE MULTI-
TRAILER ARTIC
Station Road, Cardiff -- Att to sign post (51.50408°N 3.22790°W)
27 March 2014 02 April 2014
STATION ROAD
LIGHT GOODS
VEHICLES
FIVE OR LESS AXLE
MULTI-TRAILER
ARTICMOTOR-CYCLES
FOUR OR MORE AXLE
RIGIDBUSES
FOUR OR LESS AXLE
ARTICTOTAL
VEHICLES
CARS OR CAR-
BASED LGV
THREE AXLE
RIGID
TWO AXLE, SIX
TYRE, RIGID
TIME PERIOD
0000 29 0 27 2 0 0 0 0 0 0 0 0 0 001:00 13 0 11 1 0 0 0 0 0 0 0 0 0 002:00 8 0 6 1 0 0 0 0 0 0 0 0 0 003:00 9 0 7 1 0 0 0 0 0 0 0 0 0 004:00 18 0 15 3 0 0 0 0 0 0 0 0 0 005:00 54 1 44 6 1 2 0 0 0 0 0 0 0 006:00 196 3 167 22 1 2 0 0 0 0 0 0 0 007:00 391 6 342 35 2 2 1 0 3 0 0 0 0 008:00 435 5 382 40 2 2 1 0 3 0 0 0 0 009:00 365 5 319 37 1 2 1 0 1 0 0 0 0 010:00 378 6 329 38 1 2 1 0 2 0 0 0 0 011:00 414 4 371 35 1 1 1 0 1 0 0 0 0 012:00 407 5 359 37 2 1 1 0 2 0 0 0 0 013:00 402 5 356 35 1 1 1 0 1 0 0 0 0 014:00 438 6 390 35 1 1 1 0 3 0 0 0 0 015:00 458 8 410 35 1 0 1 0 3 0 0 0 0 016:00 478 11 430 32 1 1 1 0 3 0 0 0 0 017:00 437 10 396 25 0 1 1 0 3 0 0 0 0 018:00 383 7 352 19 0 1 1 0 2 0 0 0 0 019:00 285 4 263 15 0 0 0 0 1 0 0 0 0 020:00 205 3 190 11 0 0 0 0 0 0 0 0 0 021:00 131 2 122 7 0 0 0 0 0 0 0 0 0 022:00 74 1 68 5 0 0 0 0 0 0 0 0 0 023:00 50 1 46 3 0 0 0 0 0 0 0 0 0 007-19 4986 79 4435 404 12 16 11 1 25 0 1 1 0 106-22 5803 90 5177 459 13 19 12 1 27 0 2 2 0 106-00 5927 92 5290 467 13 19 13 1 27 0 2 2 0 100-00 6058 94 5402 482 14 22 13 1 27 0 2 2 0 1
Average Day
11 of 58

C0467 Site 1 Location
to Direction Northbound
SEVEN OR MORE AXLE
ARTICFIVE AXLE
ARTIC
SIX OR MORE AXLE
ARTIC
SIX AXLE MULTI-
TRAILER ARTIC
Station Road, Cardiff -- Att to sign post (51.50408°N 3.22790°W)
27 March 2014 02 April 2014
STATION ROAD
LIGHT GOODS
VEHICLES
FIVE OR LESS AXLE
MULTI-TRAILER
ARTICMOTOR-CYCLES
FOUR OR MORE AXLE
RIGIDBUSES
FOUR OR LESS AXLE
ARTICTOTAL
VEHICLES
CARS OR CAR-
BASED LGV
THREE AXLE
RIGID
TWO AXLE, SIX
TYRE, RIGID
TIME PERIOD
Mon 6214 94 5491 549 13 31 10 1 24 0 0 0 0 1Tue 6394 129 5617 549 17 33 12 1 33 0 1 2 0 0Wed 6511 83 5790 551 14 22 10 0 36 0 3 2 0 0Thu 6465 95 5675 602 18 23 14 4 26 1 3 3 0 1Fri 6631 80 5901 547 17 31 15 0 33 0 4 2 0 1
|Sat 5625 87 5120 352 13 11 18 1 18 0 2 2 0 1|Sun 4564 88 4217 225 6 0 9 0 19 0 0 0 0 0
[--] 6443 96 5695 560 16 28 12 1 30 0 2 2 0 1
[--] 6058 94 5402 482 14 22 13 1 27 0 2 2 0 1
[--] 42404 656 37811 3375 98 151 88 7 189 1 13 11 0 4
Total Vehicles
7 Day Average
5 Day Average
Virtual Week (1)
6214 6394 6511 6465 66315625
4564
6443 6058
0
1000
2000
3000
4000
5000
6000
7000
Mon Tue Wed Thu Fri |Sat |Sun 5 Day Average 7 Day Average
no
. o
f ve
hic
les
Virtual Week (Total Vehicles)
12 of 58

C0467 1
to Northbound
Speed BinsTime 0 10 15 20 25 30 35 40 45 50 55 60 65 30 30 35 35 45 45
Period 9 14 19 24 29 34 39 44 49 54 59 64 129 ACPO ACPO DFT Std
DFT Std
Speed Speed Speed
0000 16 0 0 0 1 8 3 2 2 0 0 0 0 0 7 43.8 4 25 0 0 31.1 36.5 40.301:00 9 0 0 0 0 1 3 4 1 0 0 0 0 0 8 88.9 5 55.6 0 0 34.7 - -02:00 4 0 1 0 0 1 2 0 0 0 0 0 0 0 2 50 0 0 0 0 26.4 - -03:00 3 0 0 0 0 1 0 0 1 0 1 0 0 0 2 66.7 2 66.7 1 33.3 42.4 - -04:00 9 0 0 0 0 2 4 0 3 0 0 0 0 0 7 77.8 3 33.3 0 0 34.4 - -05:00 34 0 0 0 1 8 12 7 5 0 0 1 0 0 25 73.5 13 38.2 1 2.9 34.1 40.3 44.106:00 90 0 0 0 11 28 30 15 5 1 0 0 0 0 51 56.7 21 23.3 1 1.1 31.6 37.1 42.107:00 401 3 8 7 66 194 99 22 1 1 0 0 0 0 123 30.7 24 6 1 0.2 28 32.4 35.308:00 627 2 20 36 197 295 69 8 0 0 0 0 0 0 77 12.3 8 1.3 0 0 25.5 29.3 31.809:00 377 0 17 19 113 157 63 8 0 0 0 0 0 0 71 18.8 8 2.1 0 0 25.9 30.4 33.110:00 353 11 14 24 92 147 61 3 0 0 0 0 0 1 65 18.4 4 1.1 1 0.3 25.4 30.6 32.211:00 359 3 7 35 111 161 37 5 0 0 0 0 0 0 42 11.7 5 1.4 0 0 25 29.1 3212:00 393 1 5 37 151 160 36 2 0 0 1 0 0 0 39 9.9 3 0.8 1 0.3 24.9 28.6 31.513:00 395 1 11 38 132 164 43 5 1 0 0 0 0 0 49 12.4 6 1.5 0 0 25.1 29.5 32.414:00 393 0 2 19 121 201 46 3 1 0 0 0 0 0 50 12.7 4 1 0 0 26.1 29.5 31.815:00 444 0 6 23 122 232 52 7 2 0 0 0 0 0 61 13.7 9 2 0 0 26.1 29.5 3216:00 501 0 5 26 153 253 58 5 1 0 0 0 0 0 64 12.8 6 1.2 0 0 26 29.5 31.817:00 511 2 19 78 149 206 49 6 2 0 0 0 0 0 57 11.2 8 1.6 0 0 24.4 28.9 3218:00 531 2 32 48 166 226 52 4 1 0 0 0 0 0 57 10.7 5 0.9 0 0 24.7 29.1 31.519:00 339 0 13 8 70 177 61 9 1 0 0 0 0 0 71 20.9 10 2.9 0 0 26.8 30.6 33.320:00 295 0 3 9 51 143 71 11 6 1 0 0 0 0 89 30.2 18 6.1 1 0.3 28 32.4 34.921:00 194 0 2 5 34 89 47 15 2 0 0 0 0 0 64 33 17 8.8 0 0 28.3 32.7 35.822:00 124 0 0 5 11 64 30 10 3 1 0 0 0 0 44 35.5 14 11.3 1 0.8 29.2 33.6 36.923:00 63 0 2 0 7 23 14 13 3 1 0 0 0 0 31 49.2 17 27 1 1.6 30.7 37.1 4007-19 5285 25 146 390 1573 2396 665 78 9 1 1 0 0 1 755 14.3 90 1.7 3 0.1 25.6 29.8 32.406-22 6203 25 164 412 1739 2833 874 128 23 3 1 0 0 1 1030 16.6 156 2.5 5 0.1 25.9 30.2 33.106-00 6390 25 166 417 1757 2920 918 151 29 5 1 0 0 1 1105 17.3 187 2.9 7 0.1 26 30.2 33.300-00 6465 25 167 417 1759 2941 942 164 41 5 2 1 0 1 1156 17.9 214 3.3 9 0.1 26.1 30.4 33.6
Mean 95%ile
Location Station Road, Cardiff -- Att to sign post (51.50408°N 3.22790°W)
STATION ROAD Site
Direction27 March 2014 02 April 2014
Total Vehicles
85%ile
DfT (SL2)Speed Limit (PSL)
ACPO (SL1)
27 March 2014
13 of 58
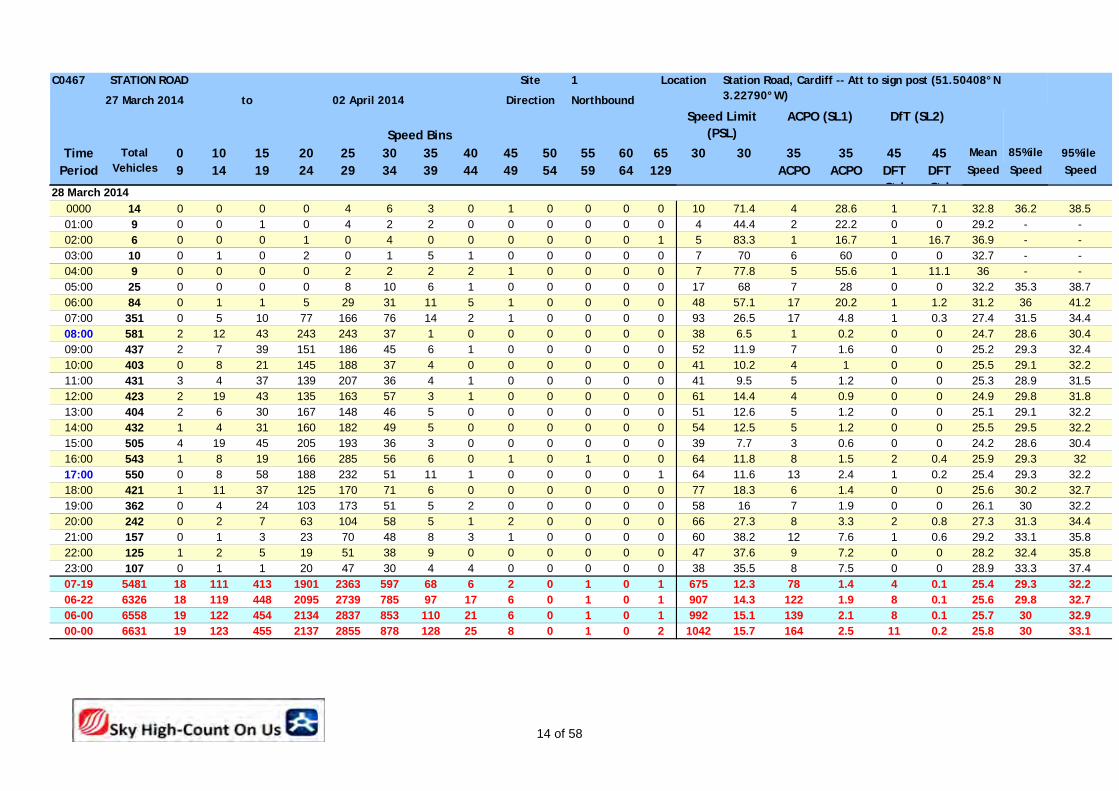
C0467 1
to Northbound
Speed BinsTime 0 10 15 20 25 30 35 40 45 50 55 60 65 30 30 35 35 45 45
Period 9 14 19 24 29 34 39 44 49 54 59 64 129 ACPO ACPO DFT Std
DFT Std
Speed Speed Speed
Mean 95%ile
Location Station Road, Cardiff -- Att to sign post (51.50408°N 3.22790°W)
STATION ROAD Site
Direction27 March 2014 02 April 2014
Total Vehicles
85%ile
DfT (SL2)Speed Limit (PSL)
ACPO (SL1)
0000 14 0 0 0 0 4 6 3 0 1 0 0 0 0 10 71.4 4 28.6 1 7.1 32.8 36.2 38.501:00 9 0 0 1 0 4 2 2 0 0 0 0 0 0 4 44.4 2 22.2 0 0 29.2 - -02:00 6 0 0 0 1 0 4 0 0 0 0 0 0 1 5 83.3 1 16.7 1 16.7 36.9 - -03:00 10 0 1 0 2 0 1 5 1 0 0 0 0 0 7 70 6 60 0 0 32.7 - -04:00 9 0 0 0 0 2 2 2 2 1 0 0 0 0 7 77.8 5 55.6 1 11.1 36 - -05:00 25 0 0 0 0 8 10 6 1 0 0 0 0 0 17 68 7 28 0 0 32.2 35.3 38.706:00 84 0 1 1 5 29 31 11 5 1 0 0 0 0 48 57.1 17 20.2 1 1.2 31.2 36 41.207:00 351 0 5 10 77 166 76 14 2 1 0 0 0 0 93 26.5 17 4.8 1 0.3 27.4 31.5 34.408:00 581 2 12 43 243 243 37 1 0 0 0 0 0 0 38 6.5 1 0.2 0 0 24.7 28.6 30.409:00 437 2 7 39 151 186 45 6 1 0 0 0 0 0 52 11.9 7 1.6 0 0 25.2 29.3 32.410:00 403 0 8 21 145 188 37 4 0 0 0 0 0 0 41 10.2 4 1 0 0 25.5 29.1 32.211:00 431 3 4 37 139 207 36 4 1 0 0 0 0 0 41 9.5 5 1.2 0 0 25.3 28.9 31.512:00 423 2 19 43 135 163 57 3 1 0 0 0 0 0 61 14.4 4 0.9 0 0 24.9 29.8 31.813:00 404 2 6 30 167 148 46 5 0 0 0 0 0 0 51 12.6 5 1.2 0 0 25.1 29.1 32.214:00 432 1 4 31 160 182 49 5 0 0 0 0 0 0 54 12.5 5 1.2 0 0 25.5 29.5 32.215:00 505 4 19 45 205 193 36 3 0 0 0 0 0 0 39 7.7 3 0.6 0 0 24.2 28.6 30.416:00 543 1 8 19 166 285 56 6 0 1 0 1 0 0 64 11.8 8 1.5 2 0.4 25.9 29.3 3217:00 550 0 8 58 188 232 51 11 1 0 0 0 0 1 64 11.6 13 2.4 1 0.2 25.4 29.3 32.218:00 421 1 11 37 125 170 71 6 0 0 0 0 0 0 77 18.3 6 1.4 0 0 25.6 30.2 32.719:00 362 0 4 24 103 173 51 5 2 0 0 0 0 0 58 16 7 1.9 0 0 26.1 30 32.220:00 242 0 2 7 63 104 58 5 1 2 0 0 0 0 66 27.3 8 3.3 2 0.8 27.3 31.3 34.421:00 157 0 1 3 23 70 48 8 3 1 0 0 0 0 60 38.2 12 7.6 1 0.6 29.2 33.1 35.822:00 125 1 2 5 19 51 38 9 0 0 0 0 0 0 47 37.6 9 7.2 0 0 28.2 32.4 35.823:00 107 0 1 1 20 47 30 4 4 0 0 0 0 0 38 35.5 8 7.5 0 0 28.9 33.3 37.407-19 5481 18 111 413 1901 2363 597 68 6 2 0 1 0 1 675 12.3 78 1.4 4 0.1 25.4 29.3 32.206-22 6326 18 119 448 2095 2739 785 97 17 6 0 1 0 1 907 14.3 122 1.9 8 0.1 25.6 29.8 32.706-00 6558 19 122 454 2134 2837 853 110 21 6 0 1 0 1 992 15.1 139 2.1 8 0.1 25.7 30 32.900-00 6631 19 123 455 2137 2855 878 128 25 8 0 1 0 2 1042 15.7 164 2.5 11 0.2 25.8 30 33.1
28 March 2014
14 of 58
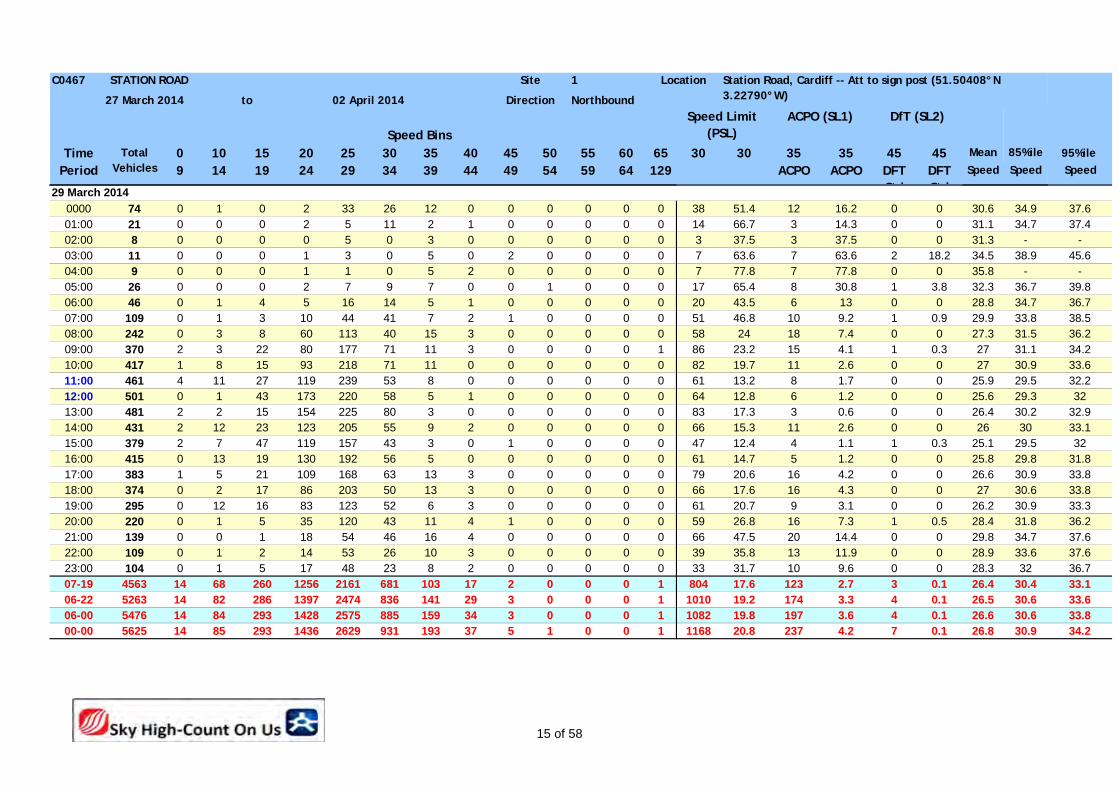
C0467 1
to Northbound
Speed BinsTime 0 10 15 20 25 30 35 40 45 50 55 60 65 30 30 35 35 45 45
Period 9 14 19 24 29 34 39 44 49 54 59 64 129 ACPO ACPO DFT Std
DFT Std
Speed Speed Speed
Mean 95%ile
Location Station Road, Cardiff -- Att to sign post (51.50408°N 3.22790°W)
STATION ROAD Site
Direction27 March 2014 02 April 2014
Total Vehicles
85%ile
DfT (SL2)Speed Limit (PSL)
ACPO (SL1)
0000 74 0 1 0 2 33 26 12 0 0 0 0 0 0 38 51.4 12 16.2 0 0 30.6 34.9 37.601:00 21 0 0 0 2 5 11 2 1 0 0 0 0 0 14 66.7 3 14.3 0 0 31.1 34.7 37.402:00 8 0 0 0 0 5 0 3 0 0 0 0 0 0 3 37.5 3 37.5 0 0 31.3 - -03:00 11 0 0 0 1 3 0 5 0 2 0 0 0 0 7 63.6 7 63.6 2 18.2 34.5 38.9 45.604:00 9 0 0 0 1 1 0 5 2 0 0 0 0 0 7 77.8 7 77.8 0 0 35.8 - -05:00 26 0 0 0 2 7 9 7 0 0 1 0 0 0 17 65.4 8 30.8 1 3.8 32.3 36.7 39.806:00 46 0 1 4 5 16 14 5 1 0 0 0 0 0 20 43.5 6 13 0 0 28.8 34.7 36.707:00 109 0 1 3 10 44 41 7 2 1 0 0 0 0 51 46.8 10 9.2 1 0.9 29.9 33.8 38.508:00 242 0 3 8 60 113 40 15 3 0 0 0 0 0 58 24 18 7.4 0 0 27.3 31.5 36.209:00 370 2 3 22 80 177 71 11 3 0 0 0 0 1 86 23.2 15 4.1 1 0.3 27 31.1 34.210:00 417 1 8 15 93 218 71 11 0 0 0 0 0 0 82 19.7 11 2.6 0 0 27 30.9 33.611:00 461 4 11 27 119 239 53 8 0 0 0 0 0 0 61 13.2 8 1.7 0 0 25.9 29.5 32.212:00 501 0 1 43 173 220 58 5 1 0 0 0 0 0 64 12.8 6 1.2 0 0 25.6 29.3 3213:00 481 2 2 15 154 225 80 3 0 0 0 0 0 0 83 17.3 3 0.6 0 0 26.4 30.2 32.914:00 431 2 12 23 123 205 55 9 2 0 0 0 0 0 66 15.3 11 2.6 0 0 26 30 33.115:00 379 2 7 47 119 157 43 3 0 1 0 0 0 0 47 12.4 4 1.1 1 0.3 25.1 29.5 3216:00 415 0 13 19 130 192 56 5 0 0 0 0 0 0 61 14.7 5 1.2 0 0 25.8 29.8 31.817:00 383 1 5 21 109 168 63 13 3 0 0 0 0 0 79 20.6 16 4.2 0 0 26.6 30.9 33.818:00 374 0 2 17 86 203 50 13 3 0 0 0 0 0 66 17.6 16 4.3 0 0 27 30.6 33.819:00 295 0 12 16 83 123 52 6 3 0 0 0 0 0 61 20.7 9 3.1 0 0 26.2 30.9 33.320:00 220 0 1 5 35 120 43 11 4 1 0 0 0 0 59 26.8 16 7.3 1 0.5 28.4 31.8 36.221:00 139 0 0 1 18 54 46 16 4 0 0 0 0 0 66 47.5 20 14.4 0 0 29.8 34.7 37.622:00 109 0 1 2 14 53 26 10 3 0 0 0 0 0 39 35.8 13 11.9 0 0 28.9 33.6 37.623:00 104 0 1 5 17 48 23 8 2 0 0 0 0 0 33 31.7 10 9.6 0 0 28.3 32 36.707-19 4563 14 68 260 1256 2161 681 103 17 2 0 0 0 1 804 17.6 123 2.7 3 0.1 26.4 30.4 33.106-22 5263 14 82 286 1397 2474 836 141 29 3 0 0 0 1 1010 19.2 174 3.3 4 0.1 26.5 30.6 33.606-00 5476 14 84 293 1428 2575 885 159 34 3 0 0 0 1 1082 19.8 197 3.6 4 0.1 26.6 30.6 33.800-00 5625 14 85 293 1436 2629 931 193 37 5 1 0 0 1 1168 20.8 237 4.2 7 0.1 26.8 30.9 34.2
29 March 2014
15 of 58
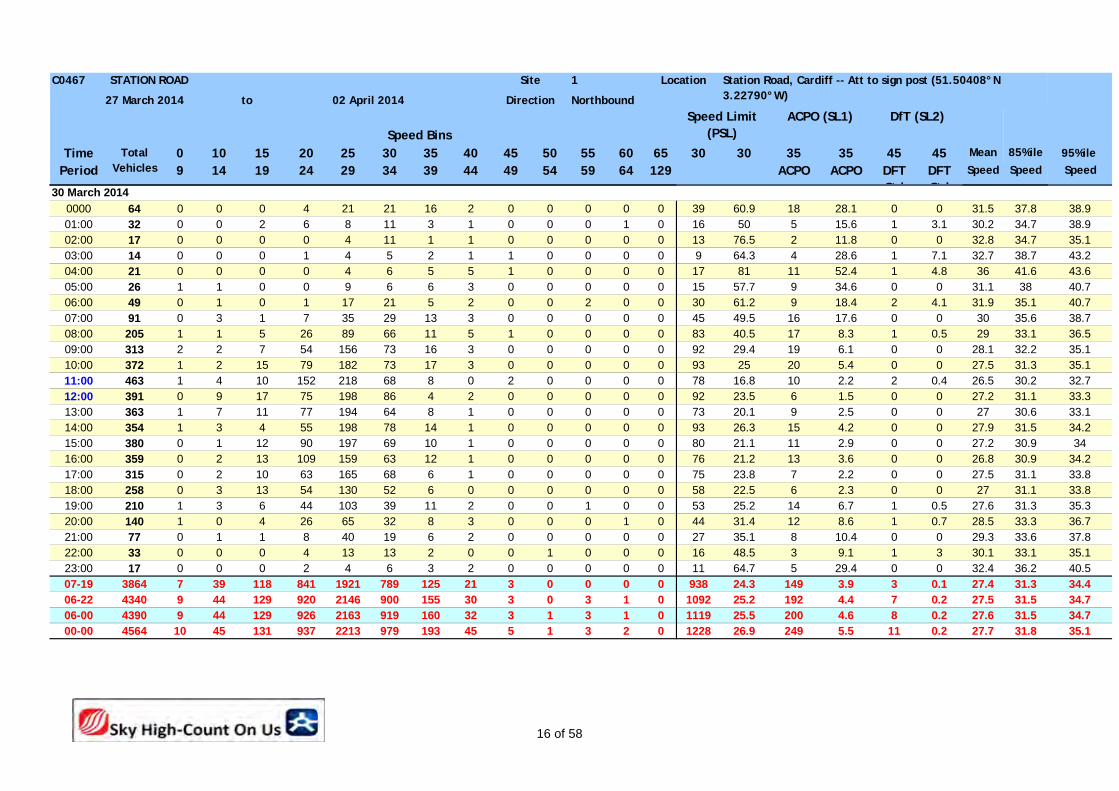
C0467 1
to Northbound
Speed BinsTime 0 10 15 20 25 30 35 40 45 50 55 60 65 30 30 35 35 45 45
Period 9 14 19 24 29 34 39 44 49 54 59 64 129 ACPO ACPO DFT Std
DFT Std
Speed Speed Speed
Mean 95%ile
Location Station Road, Cardiff -- Att to sign post (51.50408°N 3.22790°W)
STATION ROAD Site
Direction27 March 2014 02 April 2014
Total Vehicles
85%ile
DfT (SL2)Speed Limit (PSL)
ACPO (SL1)
0000 64 0 0 0 4 21 21 16 2 0 0 0 0 0 39 60.9 18 28.1 0 0 31.5 37.8 38.901:00 32 0 0 2 6 8 11 3 1 0 0 0 1 0 16 50 5 15.6 1 3.1 30.2 34.7 38.902:00 17 0 0 0 0 4 11 1 1 0 0 0 0 0 13 76.5 2 11.8 0 0 32.8 34.7 35.103:00 14 0 0 0 1 4 5 2 1 1 0 0 0 0 9 64.3 4 28.6 1 7.1 32.7 38.7 43.204:00 21 0 0 0 0 4 6 5 5 1 0 0 0 0 17 81 11 52.4 1 4.8 36 41.6 43.605:00 26 1 1 0 0 9 6 6 3 0 0 0 0 0 15 57.7 9 34.6 0 0 31.1 38 40.706:00 49 0 1 0 1 17 21 5 2 0 0 2 0 0 30 61.2 9 18.4 2 4.1 31.9 35.1 40.707:00 91 0 3 1 7 35 29 13 3 0 0 0 0 0 45 49.5 16 17.6 0 0 30 35.6 38.708:00 205 1 1 5 26 89 66 11 5 1 0 0 0 0 83 40.5 17 8.3 1 0.5 29 33.1 36.509:00 313 2 2 7 54 156 73 16 3 0 0 0 0 0 92 29.4 19 6.1 0 0 28.1 32.2 35.110:00 372 1 2 15 79 182 73 17 3 0 0 0 0 0 93 25 20 5.4 0 0 27.5 31.3 35.111:00 463 1 4 10 152 218 68 8 0 2 0 0 0 0 78 16.8 10 2.2 2 0.4 26.5 30.2 32.712:00 391 0 9 17 75 198 86 4 2 0 0 0 0 0 92 23.5 6 1.5 0 0 27.2 31.1 33.313:00 363 1 7 11 77 194 64 8 1 0 0 0 0 0 73 20.1 9 2.5 0 0 27 30.6 33.114:00 354 1 3 4 55 198 78 14 1 0 0 0 0 0 93 26.3 15 4.2 0 0 27.9 31.5 34.215:00 380 0 1 12 90 197 69 10 1 0 0 0 0 0 80 21.1 11 2.9 0 0 27.2 30.9 3416:00 359 0 2 13 109 159 63 12 1 0 0 0 0 0 76 21.2 13 3.6 0 0 26.8 30.9 34.217:00 315 0 2 10 63 165 68 6 1 0 0 0 0 0 75 23.8 7 2.2 0 0 27.5 31.1 33.818:00 258 0 3 13 54 130 52 6 0 0 0 0 0 0 58 22.5 6 2.3 0 0 27 31.1 33.819:00 210 1 3 6 44 103 39 11 2 0 0 1 0 0 53 25.2 14 6.7 1 0.5 27.6 31.3 35.320:00 140 1 0 4 26 65 32 8 3 0 0 0 1 0 44 31.4 12 8.6 1 0.7 28.5 33.3 36.721:00 77 0 1 1 8 40 19 6 2 0 0 0 0 0 27 35.1 8 10.4 0 0 29.3 33.6 37.822:00 33 0 0 0 4 13 13 2 0 0 1 0 0 0 16 48.5 3 9.1 1 3 30.1 33.1 35.123:00 17 0 0 0 2 4 6 3 2 0 0 0 0 0 11 64.7 5 29.4 0 0 32.4 36.2 40.507-19 3864 7 39 118 841 1921 789 125 21 3 0 0 0 0 938 24.3 149 3.9 3 0.1 27.4 31.3 34.406-22 4340 9 44 129 920 2146 900 155 30 3 0 3 1 0 1092 25.2 192 4.4 7 0.2 27.5 31.5 34.706-00 4390 9 44 129 926 2163 919 160 32 3 1 3 1 0 1119 25.5 200 4.6 8 0.2 27.6 31.5 34.700-00 4564 10 45 131 937 2213 979 193 45 5 1 3 2 0 1228 26.9 249 5.5 11 0.2 27.7 31.8 35.1
30 March 2014
16 of 58
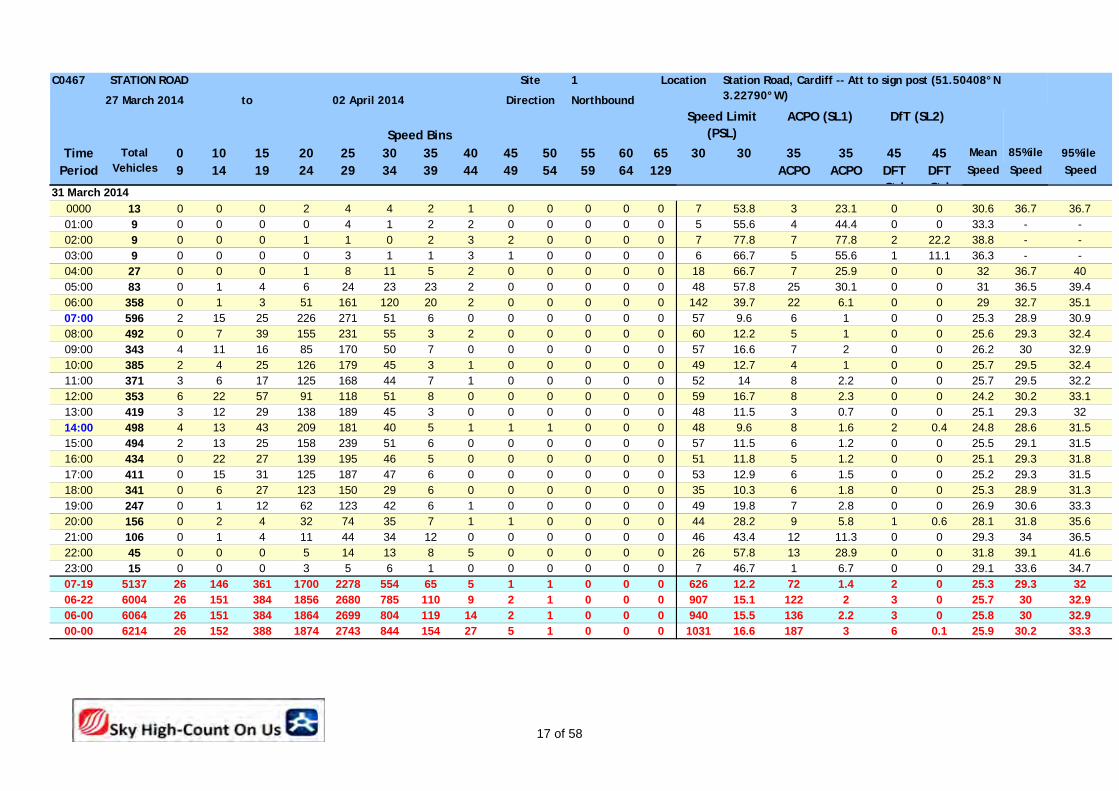
C0467 1
to Northbound
Speed BinsTime 0 10 15 20 25 30 35 40 45 50 55 60 65 30 30 35 35 45 45
Period 9 14 19 24 29 34 39 44 49 54 59 64 129 ACPO ACPO DFT Std
DFT Std
Speed Speed Speed
Mean 95%ile
Location Station Road, Cardiff -- Att to sign post (51.50408°N 3.22790°W)
STATION ROAD Site
Direction27 March 2014 02 April 2014
Total Vehicles
85%ile
DfT (SL2)Speed Limit (PSL)
ACPO (SL1)
0000 13 0 0 0 2 4 4 2 1 0 0 0 0 0 7 53.8 3 23.1 0 0 30.6 36.7 36.701:00 9 0 0 0 0 4 1 2 2 0 0 0 0 0 5 55.6 4 44.4 0 0 33.3 - -02:00 9 0 0 0 1 1 0 2 3 2 0 0 0 0 7 77.8 7 77.8 2 22.2 38.8 - -03:00 9 0 0 0 0 3 1 1 3 1 0 0 0 0 6 66.7 5 55.6 1 11.1 36.3 - -04:00 27 0 0 0 1 8 11 5 2 0 0 0 0 0 18 66.7 7 25.9 0 0 32 36.7 4005:00 83 0 1 4 6 24 23 23 2 0 0 0 0 0 48 57.8 25 30.1 0 0 31 36.5 39.406:00 358 0 1 3 51 161 120 20 2 0 0 0 0 0 142 39.7 22 6.1 0 0 29 32.7 35.107:00 596 2 15 25 226 271 51 6 0 0 0 0 0 0 57 9.6 6 1 0 0 25.3 28.9 30.908:00 492 0 7 39 155 231 55 3 2 0 0 0 0 0 60 12.2 5 1 0 0 25.6 29.3 32.409:00 343 4 11 16 85 170 50 7 0 0 0 0 0 0 57 16.6 7 2 0 0 26.2 30 32.910:00 385 2 4 25 126 179 45 3 1 0 0 0 0 0 49 12.7 4 1 0 0 25.7 29.5 32.411:00 371 3 6 17 125 168 44 7 1 0 0 0 0 0 52 14 8 2.2 0 0 25.7 29.5 32.212:00 353 6 22 57 91 118 51 8 0 0 0 0 0 0 59 16.7 8 2.3 0 0 24.2 30.2 33.113:00 419 3 12 29 138 189 45 3 0 0 0 0 0 0 48 11.5 3 0.7 0 0 25.1 29.3 3214:00 498 4 13 43 209 181 40 5 1 1 1 0 0 0 48 9.6 8 1.6 2 0.4 24.8 28.6 31.515:00 494 2 13 25 158 239 51 6 0 0 0 0 0 0 57 11.5 6 1.2 0 0 25.5 29.1 31.516:00 434 0 22 27 139 195 46 5 0 0 0 0 0 0 51 11.8 5 1.2 0 0 25.1 29.3 31.817:00 411 0 15 31 125 187 47 6 0 0 0 0 0 0 53 12.9 6 1.5 0 0 25.2 29.3 31.518:00 341 0 6 27 123 150 29 6 0 0 0 0 0 0 35 10.3 6 1.8 0 0 25.3 28.9 31.319:00 247 0 1 12 62 123 42 6 1 0 0 0 0 0 49 19.8 7 2.8 0 0 26.9 30.6 33.320:00 156 0 2 4 32 74 35 7 1 1 0 0 0 0 44 28.2 9 5.8 1 0.6 28.1 31.8 35.621:00 106 0 1 4 11 44 34 12 0 0 0 0 0 0 46 43.4 12 11.3 0 0 29.3 34 36.522:00 45 0 0 0 5 14 13 8 5 0 0 0 0 0 26 57.8 13 28.9 0 0 31.8 39.1 41.623:00 15 0 0 0 3 5 6 1 0 0 0 0 0 0 7 46.7 1 6.7 0 0 29.1 33.6 34.707-19 5137 26 146 361 1700 2278 554 65 5 1 1 0 0 0 626 12.2 72 1.4 2 0 25.3 29.3 3206-22 6004 26 151 384 1856 2680 785 110 9 2 1 0 0 0 907 15.1 122 2 3 0 25.7 30 32.906-00 6064 26 151 384 1864 2699 804 119 14 2 1 0 0 0 940 15.5 136 2.2 3 0 25.8 30 32.900-00 6214 26 152 388 1874 2743 844 154 27 5 1 0 0 0 1031 16.6 187 3 6 0.1 25.9 30.2 33.3
31 March 2014
17 of 58
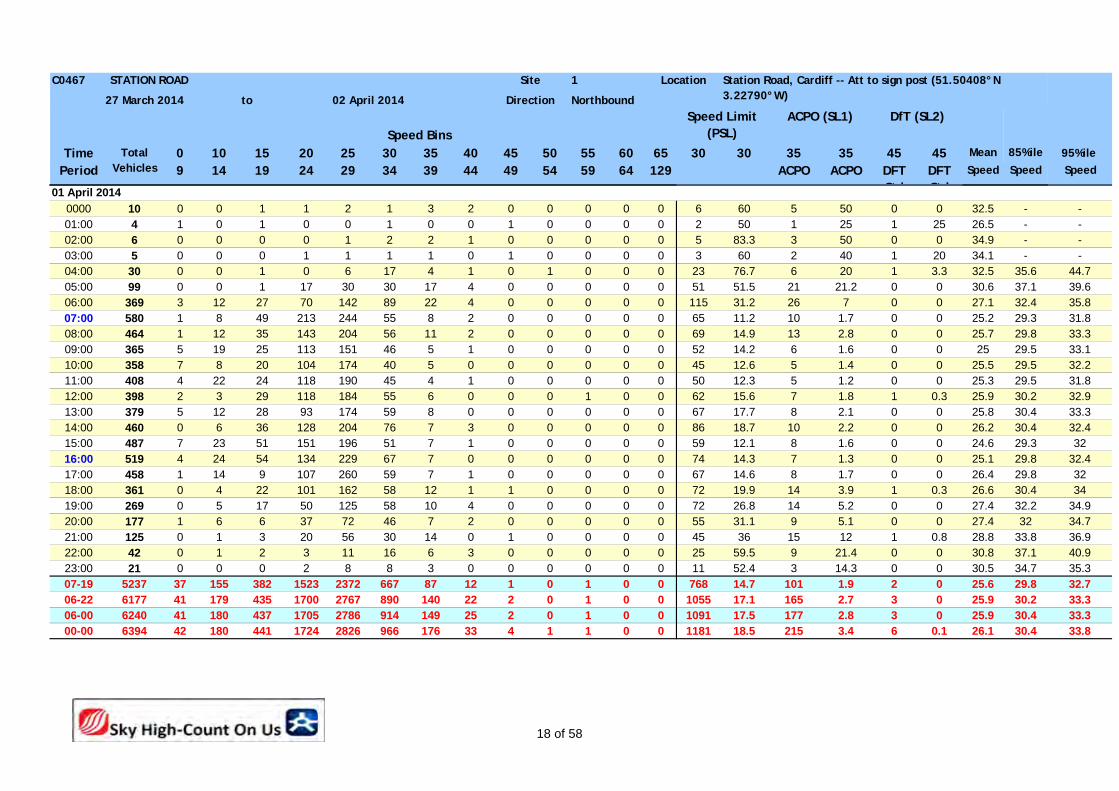
C0467 1
to Northbound
Speed BinsTime 0 10 15 20 25 30 35 40 45 50 55 60 65 30 30 35 35 45 45
Period 9 14 19 24 29 34 39 44 49 54 59 64 129 ACPO ACPO DFT Std
DFT Std
Speed Speed Speed
Mean 95%ile
Location Station Road, Cardiff -- Att to sign post (51.50408°N 3.22790°W)
STATION ROAD Site
Direction27 March 2014 02 April 2014
Total Vehicles
85%ile
DfT (SL2)Speed Limit (PSL)
ACPO (SL1)
0000 10 0 0 1 1 2 1 3 2 0 0 0 0 0 6 60 5 50 0 0 32.5 - -01:00 4 1 0 1 0 0 1 0 0 1 0 0 0 0 2 50 1 25 1 25 26.5 - -02:00 6 0 0 0 0 1 2 2 1 0 0 0 0 0 5 83.3 3 50 0 0 34.9 - -03:00 5 0 0 0 1 1 1 1 0 1 0 0 0 0 3 60 2 40 1 20 34.1 - -04:00 30 0 0 1 0 6 17 4 1 0 1 0 0 0 23 76.7 6 20 1 3.3 32.5 35.6 44.705:00 99 0 0 1 17 30 30 17 4 0 0 0 0 0 51 51.5 21 21.2 0 0 30.6 37.1 39.606:00 369 3 12 27 70 142 89 22 4 0 0 0 0 0 115 31.2 26 7 0 0 27.1 32.4 35.807:00 580 1 8 49 213 244 55 8 2 0 0 0 0 0 65 11.2 10 1.7 0 0 25.2 29.3 31.808:00 464 1 12 35 143 204 56 11 2 0 0 0 0 0 69 14.9 13 2.8 0 0 25.7 29.8 33.309:00 365 5 19 25 113 151 46 5 1 0 0 0 0 0 52 14.2 6 1.6 0 0 25 29.5 33.110:00 358 7 8 20 104 174 40 5 0 0 0 0 0 0 45 12.6 5 1.4 0 0 25.5 29.5 32.211:00 408 4 22 24 118 190 45 4 1 0 0 0 0 0 50 12.3 5 1.2 0 0 25.3 29.5 31.812:00 398 2 3 29 118 184 55 6 0 0 0 1 0 0 62 15.6 7 1.8 1 0.3 25.9 30.2 32.913:00 379 5 12 28 93 174 59 8 0 0 0 0 0 0 67 17.7 8 2.1 0 0 25.8 30.4 33.314:00 460 0 6 36 128 204 76 7 3 0 0 0 0 0 86 18.7 10 2.2 0 0 26.2 30.4 32.415:00 487 7 23 51 151 196 51 7 1 0 0 0 0 0 59 12.1 8 1.6 0 0 24.6 29.3 3216:00 519 4 24 54 134 229 67 7 0 0 0 0 0 0 74 14.3 7 1.3 0 0 25.1 29.8 32.417:00 458 1 14 9 107 260 59 7 1 0 0 0 0 0 67 14.6 8 1.7 0 0 26.4 29.8 3218:00 361 0 4 22 101 162 58 12 1 1 0 0 0 0 72 19.9 14 3.9 1 0.3 26.6 30.4 3419:00 269 0 5 17 50 125 58 10 4 0 0 0 0 0 72 26.8 14 5.2 0 0 27.4 32.2 34.920:00 177 1 6 6 37 72 46 7 2 0 0 0 0 0 55 31.1 9 5.1 0 0 27.4 32 34.721:00 125 0 1 3 20 56 30 14 0 1 0 0 0 0 45 36 15 12 1 0.8 28.8 33.8 36.922:00 42 0 1 2 3 11 16 6 3 0 0 0 0 0 25 59.5 9 21.4 0 0 30.8 37.1 40.923:00 21 0 0 0 2 8 8 3 0 0 0 0 0 0 11 52.4 3 14.3 0 0 30.5 34.7 35.307-19 5237 37 155 382 1523 2372 667 87 12 1 0 1 0 0 768 14.7 101 1.9 2 0 25.6 29.8 32.706-22 6177 41 179 435 1700 2767 890 140 22 2 0 1 0 0 1055 17.1 165 2.7 3 0 25.9 30.2 33.306-00 6240 41 180 437 1705 2786 914 149 25 2 0 1 0 0 1091 17.5 177 2.8 3 0 25.9 30.4 33.300-00 6394 42 180 441 1724 2826 966 176 33 4 1 1 0 0 1181 18.5 215 3.4 6 0.1 26.1 30.4 33.8
01 April 2014
18 of 58
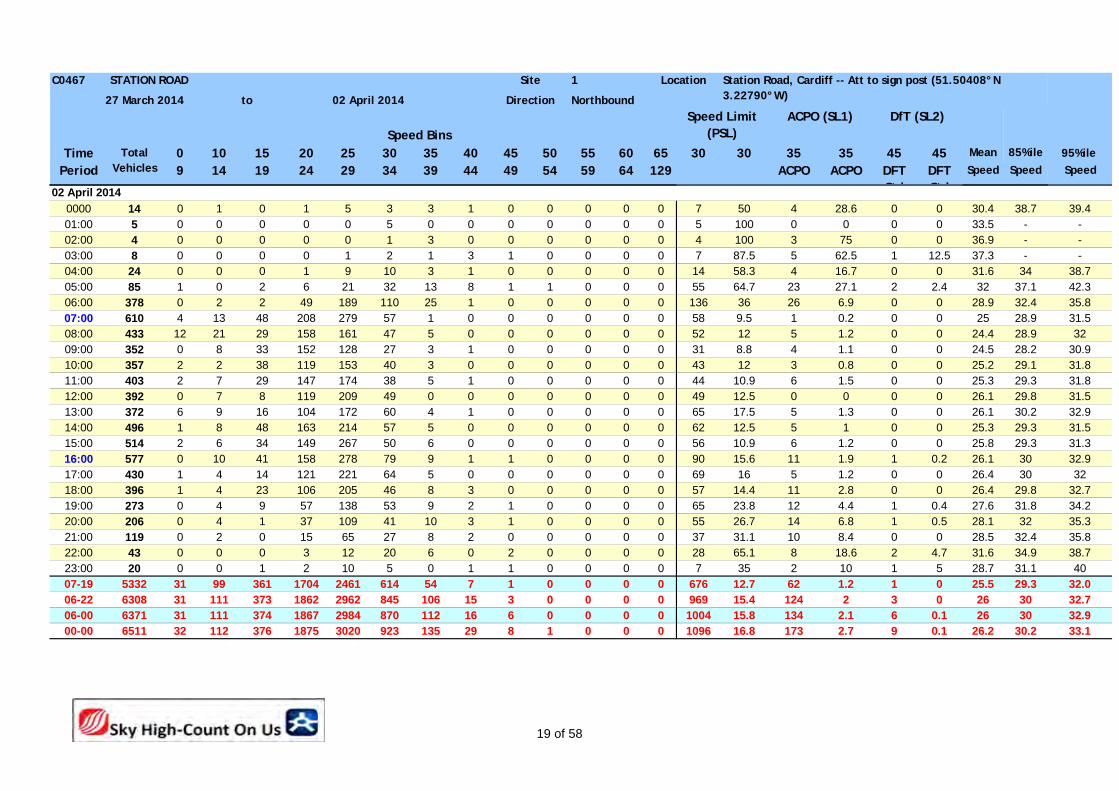
C0467 1
to Northbound
Speed BinsTime 0 10 15 20 25 30 35 40 45 50 55 60 65 30 30 35 35 45 45
Period 9 14 19 24 29 34 39 44 49 54 59 64 129 ACPO ACPO DFT Std
DFT Std
Speed Speed Speed
Mean 95%ile
Location Station Road, Cardiff -- Att to sign post (51.50408°N 3.22790°W)
STATION ROAD Site
Direction27 March 2014 02 April 2014
Total Vehicles
85%ile
DfT (SL2)Speed Limit (PSL)
ACPO (SL1)
0000 14 0 1 0 1 5 3 3 1 0 0 0 0 0 7 50 4 28.6 0 0 30.4 38.7 39.401:00 5 0 0 0 0 0 5 0 0 0 0 0 0 0 5 100 0 0 0 0 33.5 - -02:00 4 0 0 0 0 0 1 3 0 0 0 0 0 0 4 100 3 75 0 0 36.9 - -03:00 8 0 0 0 0 1 2 1 3 1 0 0 0 0 7 87.5 5 62.5 1 12.5 37.3 - -04:00 24 0 0 0 1 9 10 3 1 0 0 0 0 0 14 58.3 4 16.7 0 0 31.6 34 38.705:00 85 1 0 2 6 21 32 13 8 1 1 0 0 0 55 64.7 23 27.1 2 2.4 32 37.1 42.306:00 378 0 2 2 49 189 110 25 1 0 0 0 0 0 136 36 26 6.9 0 0 28.9 32.4 35.807:00 610 4 13 48 208 279 57 1 0 0 0 0 0 0 58 9.5 1 0.2 0 0 25 28.9 31.508:00 433 12 21 29 158 161 47 5 0 0 0 0 0 0 52 12 5 1.2 0 0 24.4 28.9 3209:00 352 0 8 33 152 128 27 3 1 0 0 0 0 0 31 8.8 4 1.1 0 0 24.5 28.2 30.910:00 357 2 2 38 119 153 40 3 0 0 0 0 0 0 43 12 3 0.8 0 0 25.2 29.1 31.811:00 403 2 7 29 147 174 38 5 1 0 0 0 0 0 44 10.9 6 1.5 0 0 25.3 29.3 31.812:00 392 0 7 8 119 209 49 0 0 0 0 0 0 0 49 12.5 0 0 0 0 26.1 29.8 31.513:00 372 6 9 16 104 172 60 4 1 0 0 0 0 0 65 17.5 5 1.3 0 0 26.1 30.2 32.914:00 496 1 8 48 163 214 57 5 0 0 0 0 0 0 62 12.5 5 1 0 0 25.3 29.3 31.515:00 514 2 6 34 149 267 50 6 0 0 0 0 0 0 56 10.9 6 1.2 0 0 25.8 29.3 31.316:00 577 0 10 41 158 278 79 9 1 1 0 0 0 0 90 15.6 11 1.9 1 0.2 26.1 30 32.917:00 430 1 4 14 121 221 64 5 0 0 0 0 0 0 69 16 5 1.2 0 0 26.4 30 3218:00 396 1 4 23 106 205 46 8 3 0 0 0 0 0 57 14.4 11 2.8 0 0 26.4 29.8 32.719:00 273 0 4 9 57 138 53 9 2 1 0 0 0 0 65 23.8 12 4.4 1 0.4 27.6 31.8 34.220:00 206 0 4 1 37 109 41 10 3 1 0 0 0 0 55 26.7 14 6.8 1 0.5 28.1 32 35.321:00 119 0 2 0 15 65 27 8 2 0 0 0 0 0 37 31.1 10 8.4 0 0 28.5 32.4 35.822:00 43 0 0 0 3 12 20 6 0 2 0 0 0 0 28 65.1 8 18.6 2 4.7 31.6 34.9 38.723:00 20 0 0 1 2 10 5 0 1 1 0 0 0 0 7 35 2 10 1 5 28.7 31.1 4007-19 5332 31 99 361 1704 2461 614 54 7 1 0 0 0 0 676 12.7 62 1.2 1 0 25.5 29.3 32.006-22 6308 31 111 373 1862 2962 845 106 15 3 0 0 0 0 969 15.4 124 2 3 0 26 30 32.706-00 6371 31 111 374 1867 2984 870 112 16 6 0 0 0 0 1004 15.8 134 2.1 6 0.1 26 30 32.900-00 6511 32 112 376 1875 3020 923 135 29 8 1 0 0 0 1096 16.8 173 2.7 9 0.1 26.2 30.2 33.1
02 April 2014
19 of 58
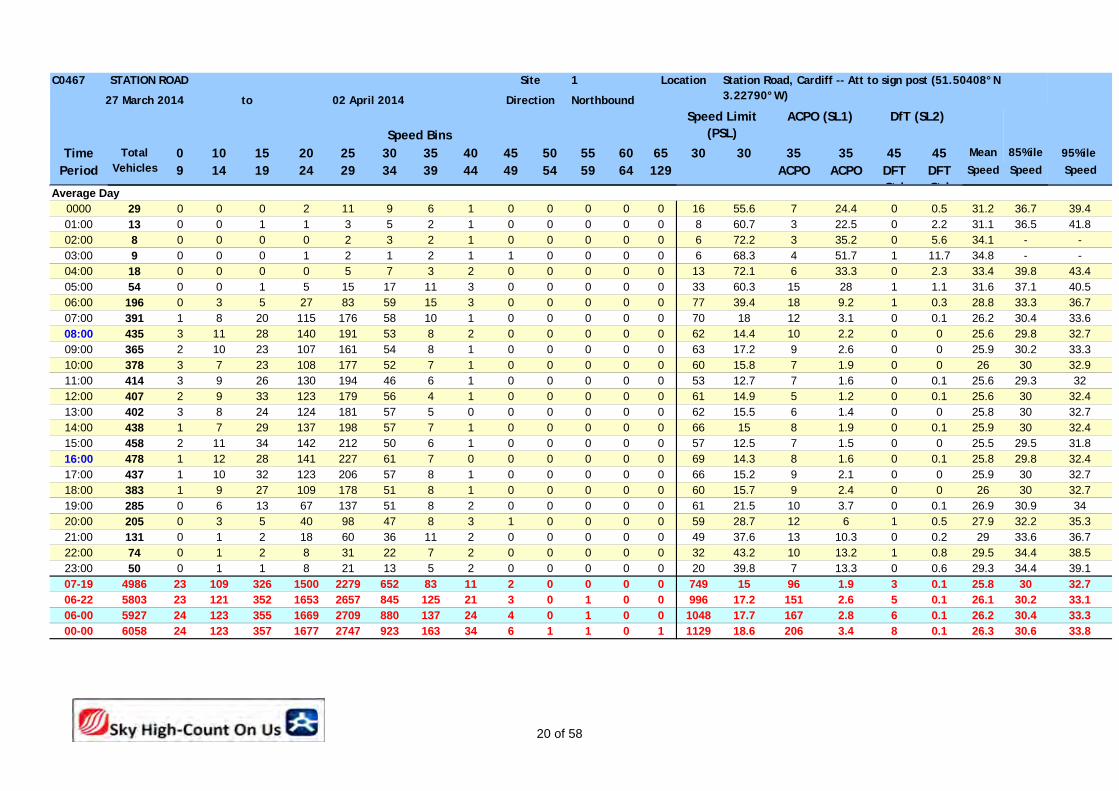
C0467 1
to Northbound
Speed BinsTime 0 10 15 20 25 30 35 40 45 50 55 60 65 30 30 35 35 45 45
Period 9 14 19 24 29 34 39 44 49 54 59 64 129 ACPO ACPO DFT Std
DFT Std
Speed Speed Speed
Mean 95%ile
Location Station Road, Cardiff -- Att to sign post (51.50408°N 3.22790°W)
STATION ROAD Site
Direction27 March 2014 02 April 2014
Total Vehicles
85%ile
DfT (SL2)Speed Limit (PSL)
ACPO (SL1)
Average Day0000 29 0 0 0 2 11 9 6 1 0 0 0 0 0 16 55.6 7 24.4 0 0.5 31.2 36.7 39.401:00 13 0 0 1 1 3 5 2 1 0 0 0 0 0 8 60.7 3 22.5 0 2.2 31.1 36.5 41.802:00 8 0 0 0 0 2 3 2 1 0 0 0 0 0 6 72.2 3 35.2 0 5.6 34.1 - -03:00 9 0 0 0 1 2 1 2 1 1 0 0 0 0 6 68.3 4 51.7 1 11.7 34.8 - -04:00 18 0 0 0 0 5 7 3 2 0 0 0 0 0 13 72.1 6 33.3 0 2.3 33.4 39.8 43.405:00 54 0 0 1 5 15 17 11 3 0 0 0 0 0 33 60.3 15 28 1 1.1 31.6 37.1 40.506:00 196 0 3 5 27 83 59 15 3 0 0 0 0 0 77 39.4 18 9.2 1 0.3 28.8 33.3 36.707:00 391 1 8 20 115 176 58 10 1 0 0 0 0 0 70 18 12 3.1 0 0.1 26.2 30.4 33.608:00 435 3 11 28 140 191 53 8 2 0 0 0 0 0 62 14.4 10 2.2 0 0 25.6 29.8 32.709:00 365 2 10 23 107 161 54 8 1 0 0 0 0 0 63 17.2 9 2.6 0 0 25.9 30.2 33.310:00 378 3 7 23 108 177 52 7 1 0 0 0 0 0 60 15.8 7 1.9 0 0 26 30 32.911:00 414 3 9 26 130 194 46 6 1 0 0 0 0 0 53 12.7 7 1.6 0 0.1 25.6 29.3 3212:00 407 2 9 33 123 179 56 4 1 0 0 0 0 0 61 14.9 5 1.2 0 0.1 25.6 30 32.413:00 402 3 8 24 124 181 57 5 0 0 0 0 0 0 62 15.5 6 1.4 0 0 25.8 30 32.714:00 438 1 7 29 137 198 57 7 1 0 0 0 0 0 66 15 8 1.9 0 0.1 25.9 30 32.415:00 458 2 11 34 142 212 50 6 1 0 0 0 0 0 57 12.5 7 1.5 0 0 25.5 29.5 31.816:00 478 1 12 28 141 227 61 7 0 0 0 0 0 0 69 14.3 8 1.6 0 0.1 25.8 29.8 32.417:00 437 1 10 32 123 206 57 8 1 0 0 0 0 0 66 15.2 9 2.1 0 0 25.9 30 32.718:00 383 1 9 27 109 178 51 8 1 0 0 0 0 0 60 15.7 9 2.4 0 0 26 30 32.719:00 285 0 6 13 67 137 51 8 2 0 0 0 0 0 61 21.5 10 3.7 0 0.1 26.9 30.9 3420:00 205 0 3 5 40 98 47 8 3 1 0 0 0 0 59 28.7 12 6 1 0.5 27.9 32.2 35.321:00 131 0 1 2 18 60 36 11 2 0 0 0 0 0 49 37.6 13 10.3 0 0.2 29 33.6 36.722:00 74 0 1 2 8 31 22 7 2 0 0 0 0 0 32 43.2 10 13.2 1 0.8 29.5 34.4 38.523:00 50 0 1 1 8 21 13 5 2 0 0 0 0 0 20 39.8 7 13.3 0 0.6 29.3 34.4 39.107-19 4986 23 109 326 1500 2279 652 83 11 2 0 0 0 0 749 15 96 1.9 3 0.1 25.8 30 32.706-22 5803 23 121 352 1653 2657 845 125 21 3 0 1 0 0 996 17.2 151 2.6 5 0.1 26.1 30.2 33.106-00 5927 24 123 355 1669 2709 880 137 24 4 0 1 0 0 1048 17.7 167 2.8 6 0.1 26.2 30.4 33.300-00 6058 24 123 357 1677 2747 923 163 34 6 1 1 0 1 1129 18.6 206 3.4 8 0.1 26.3 30.6 33.8
20 of 58

C0467 1
to Northbound
Speed BinsTime 0 10 15 20 25 30 35 40 45 50 55 60 65 30 30 35 35 45 45
Period 9 14 19 24 29 34 39 44 49 54 59 64 129 ACPO ACPO DFT Std
DFT Std
Speed Speed Speed
Mean 95%ile
Location Station Road, Cardiff -- Att to sign post (51.50408°N 3.22790°W)
STATION ROAD Site
Direction27 March 2014 02 April 2014
Total Vehicles
85%ile
DfT (SL2)Speed Limit (PSL)
ACPO (SL1)
Virtual Week (1)Mon 6214 26 152 388 1874 2743 844 154 27 5 1 0 0 0 1031 16.6 187 3 6 0.1 25.9 30.2 33.3Tue 6394 42 180 441 1724 2826 966 176 33 4 1 1 0 0 1181 18.5 215 3.4 6 0.1 26.1 30.4 33.8Wed 6511 32 112 376 1875 3020 923 135 29 8 1 0 0 0 1096 16.8 173 2.7 9 0.1 26.2 30.2 33.1Thu 6465 25 167 417 1759 2941 942 164 41 5 2 1 0 1 1156 17.9 214 3.3 9 0.1 26.1 30.4 33.6Fri 6631 19 123 455 2137 2855 878 128 25 8 0 1 0 2 1042 15.7 164 2.5 11 0.2 25.8 30 33.1
|Sat 5625 14 85 293 1436 2629 931 193 37 5 1 0 0 1 1168 20.8 237 4.2 7 0.1 26.8 30.9 34.2|Sun 4564 10 45 131 937 2213 979 193 45 5 1 3 2 0 1228 26.9 249 5.5 11 0.2 27.7 31.8 35.1
5 Day Average[--] 6443 29 147 415 1874 2877 911 151 31 6 1 1 0 1 1101 17.1 191 3.0 8 0.1 26.0 30.2 33.4
7 Day Average[--] 6058 24 123 357 1677 2747 923 163 34 6 1 1 0 1 1129 18.6 206 3.4 8 0.1 26.3 30.6 33.8
Total Vehicles[--] 42404 168 864 2501 11742 19227 6463 1143 237 40 7 6 2 4 7902 18.6 1439 3.4 59 0.1 26.3 30.6 33.8
16.6 18.5 16.8 17.9 15.720.8
26.9
17.1 18.6
3 3.4 2.7 3.3 2.5 4.2 5.53.0 3.4
0.1 0.1 0.1 0.1 0.2 0.1 0.2 0.1 0.10
10
20
30
40
50
60
70
80
90
100
Mon Tue Wed Thu Fri |Sat |Sun 5 DayAverage
7 DayAverage
%
30
35
45
25.9 26.1 26.2 26.1 25.826.8 27.7
26.0 26.3
30.2 30.4 30.2 30.4 30 30.9 31.830.2 30.6
0
10
20
30
40
Mon Tue Wed Thu Fri |Sat |Sun 5 DayAverage
7 DayAverage
mph
Mean
85%ile
21 of 58

C0467 Site 1 Location
to Direction Southbound
0000 14 0 14 0 0 0 0 0 0 0 0 0 0 001:00 10 0 9 1 0 0 0 0 0 0 0 0 0 002:00 6 0 3 3 0 0 0 0 0 0 0 0 0 003:00 4 0 4 0 0 0 0 0 0 0 0 0 0 004:00 9 1 6 1 0 0 0 0 1 0 0 0 0 005:00 34 2 31 0 0 1 0 0 0 0 0 0 0 006:00 88 2 78 7 0 0 1 0 0 0 0 0 0 007:00 334 14 307 11 0 0 0 1 1 0 0 0 0 008:00 402 17 364 14 1 1 3 1 1 0 0 0 0 009:00 399 9 363 25 0 2 0 0 0 0 0 0 0 010:00 375 3 344 24 1 1 1 1 0 0 0 0 0 011:00 405 5 370 25 1 1 1 1 1 0 0 0 0 012:00 401 3 365 29 0 0 2 1 1 0 0 0 0 013:00 368 1 337 27 0 1 0 0 2 0 0 0 0 014:00 396 6 361 26 1 1 0 0 1 0 0 0 0 015:00 438 1 412 21 0 1 0 0 2 0 0 1 0 016:00 520 13 479 22 0 0 0 1 4 0 1 0 0 017:00 593 10 559 17 2 1 1 0 2 0 0 1 0 018:00 500 3 487 8 1 0 0 0 0 0 0 1 0 019:00 420 4 400 14 0 1 0 0 1 0 0 0 0 020:00 237 3 225 7 0 1 0 0 1 0 0 0 0 021:00 160 4 154 2 0 0 0 0 0 0 0 0 0 022:00 116 3 108 5 0 0 0 0 0 0 0 0 0 023:00 71 1 68 2 0 0 0 0 0 0 0 0 0 007-19 5131 85 4748 249 7 9 8 6 15 0 1 3 0 006-22 6036 98 5605 279 7 11 9 6 17 0 1 3 0 006-00 6223 102 5781 286 7 11 9 6 17 0 1 3 0 000-00 6300 105 5848 291 7 12 9 6 18 0 1 3 0 0
STATION ROAD Station Road, Cardiff -- Att to sign post (51.50408°N 3.22790°W)
27 March 2014 02 April 2014
TIME PERIOD
FIVE OR LESS AXLE
MULTI-TRAILER
ARTIC
SIX AXLE MULTI-
TRAILER ARTIC
SEVEN OR MORE AXLE
ARTIC
TWO AXLE, SIX
TYRE, RIGID
SIX OR MORE AXLE
ARTIC
THREE AXLE
RIGID
FOUR OR MORE AXLE
RIGID
FOUR OR LESS AXLE
ARTIC
CARS OR CAR-
BASED LGV
MOTOR-CYCLES
TOTAL VEHICLES
27 March 2014
FIVE AXLE ARTIC
LIGHT GOODS
VEHICLES BUSES
22 of 58

C0467 Site 1 Location
to Direction Southbound
STATION ROAD Station Road, Cardiff -- Att to sign post (51.50408°N 3.22790°W)
27 March 2014 02 April 2014
TIME PERIOD
FIVE OR LESS AXLE
MULTI-TRAILER
ARTIC
SIX AXLE MULTI-
TRAILER ARTIC
SEVEN OR MORE AXLE
ARTIC
TWO AXLE, SIX
TYRE, RIGID
SIX OR MORE AXLE
ARTIC
THREE AXLE
RIGID
FOUR OR MORE AXLE
RIGID
FOUR OR LESS AXLE
ARTIC
CARS OR CAR-
BASED LGV
MOTOR-CYCLES
TOTAL VEHICLES
FIVE AXLE ARTIC
LIGHT GOODS
VEHICLES BUSES
0000 26 1 22 3 0 0 0 0 0 0 0 0 0 001:00 9 0 8 1 0 0 0 0 0 0 0 0 0 002:00 10 1 9 0 0 0 0 0 0 0 0 0 0 003:00 7 0 7 0 0 0 0 0 0 0 0 0 0 004:00 9 1 7 0 0 0 1 0 0 0 0 0 0 005:00 27 1 23 2 0 1 0 0 0 0 0 0 0 006:00 89 1 75 11 0 1 0 0 0 0 1 0 0 007:00 338 13 307 14 2 1 1 0 0 0 0 0 0 008:00 443 15 401 21 2 3 1 0 0 0 0 0 0 009:00 417 6 378 27 0 2 2 1 0 0 1 0 0 010:00 397 3 364 27 0 2 1 0 0 0 0 0 0 011:00 402 5 364 29 0 1 2 0 1 0 0 0 0 012:00 393 3 358 24 0 1 1 2 3 0 0 1 0 013:00 381 3 348 25 0 1 1 1 1 0 0 1 0 014:00 397 4 366 21 1 2 1 1 1 0 0 0 0 015:00 470 6 446 14 1 1 0 1 1 0 0 0 0 016:00 481 2 459 17 0 1 0 0 0 0 1 1 0 017:00 462 3 433 24 0 1 0 1 0 0 0 0 0 018:00 434 3 413 15 0 0 2 0 0 0 0 1 0 019:00 392 1 379 10 0 0 0 0 2 0 0 0 0 020:00 273 3 261 7 0 0 0 1 1 0 0 0 0 021:00 173 0 166 7 0 0 0 0 0 0 0 0 0 022:00 129 1 123 4 0 0 0 0 1 0 0 0 0 023:00 111 0 107 3 0 1 0 0 0 0 0 0 0 007-19 5015 66 4637 258 6 16 12 7 7 0 2 4 0 006-22 5942 71 5518 293 6 17 12 8 10 0 3 4 0 006-00 6182 72 5748 300 6 18 12 8 11 0 3 4 0 000-00 6270 76 5824 306 6 19 13 8 11 0 3 4 0 0
28 March 2014
23 of 58
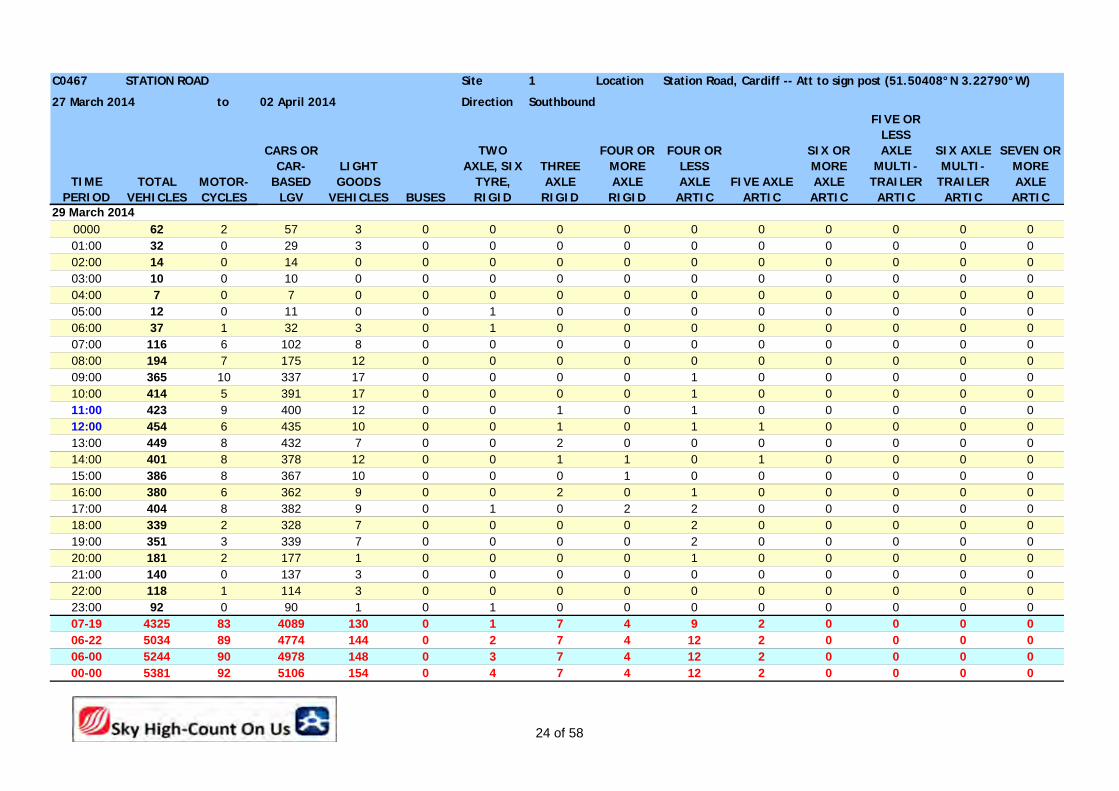
C0467 Site 1 Location
to Direction Southbound
STATION ROAD Station Road, Cardiff -- Att to sign post (51.50408°N 3.22790°W)
27 March 2014 02 April 2014
TIME PERIOD
FIVE OR LESS AXLE
MULTI-TRAILER
ARTIC
SIX AXLE MULTI-
TRAILER ARTIC
SEVEN OR MORE AXLE
ARTIC
TWO AXLE, SIX
TYRE, RIGID
SIX OR MORE AXLE
ARTIC
THREE AXLE
RIGID
FOUR OR MORE AXLE
RIGID
FOUR OR LESS AXLE
ARTIC
CARS OR CAR-
BASED LGV
MOTOR-CYCLES
TOTAL VEHICLES
FIVE AXLE ARTIC
LIGHT GOODS
VEHICLES BUSES
0000 62 2 57 3 0 0 0 0 0 0 0 0 0 001:00 32 0 29 3 0 0 0 0 0 0 0 0 0 002:00 14 0 14 0 0 0 0 0 0 0 0 0 0 003:00 10 0 10 0 0 0 0 0 0 0 0 0 0 004:00 7 0 7 0 0 0 0 0 0 0 0 0 0 005:00 12 0 11 0 0 1 0 0 0 0 0 0 0 006:00 37 1 32 3 0 1 0 0 0 0 0 0 0 007:00 116 6 102 8 0 0 0 0 0 0 0 0 0 008:00 194 7 175 12 0 0 0 0 0 0 0 0 0 009:00 365 10 337 17 0 0 0 0 1 0 0 0 0 010:00 414 5 391 17 0 0 0 0 1 0 0 0 0 011:00 423 9 400 12 0 0 1 0 1 0 0 0 0 012:00 454 6 435 10 0 0 1 0 1 1 0 0 0 013:00 449 8 432 7 0 0 2 0 0 0 0 0 0 014:00 401 8 378 12 0 0 1 1 0 1 0 0 0 015:00 386 8 367 10 0 0 0 1 0 0 0 0 0 016:00 380 6 362 9 0 0 2 0 1 0 0 0 0 017:00 404 8 382 9 0 1 0 2 2 0 0 0 0 018:00 339 2 328 7 0 0 0 0 2 0 0 0 0 019:00 351 3 339 7 0 0 0 0 2 0 0 0 0 020:00 181 2 177 1 0 0 0 0 1 0 0 0 0 021:00 140 0 137 3 0 0 0 0 0 0 0 0 0 022:00 118 1 114 3 0 0 0 0 0 0 0 0 0 023:00 92 0 90 1 0 1 0 0 0 0 0 0 0 007-19 4325 83 4089 130 0 1 7 4 9 2 0 0 0 006-22 5034 89 4774 144 0 2 7 4 12 2 0 0 0 006-00 5244 90 4978 148 0 3 7 4 12 2 0 0 0 000-00 5381 92 5106 154 0 4 7 4 12 2 0 0 0 0
29 March 2014
24 of 58
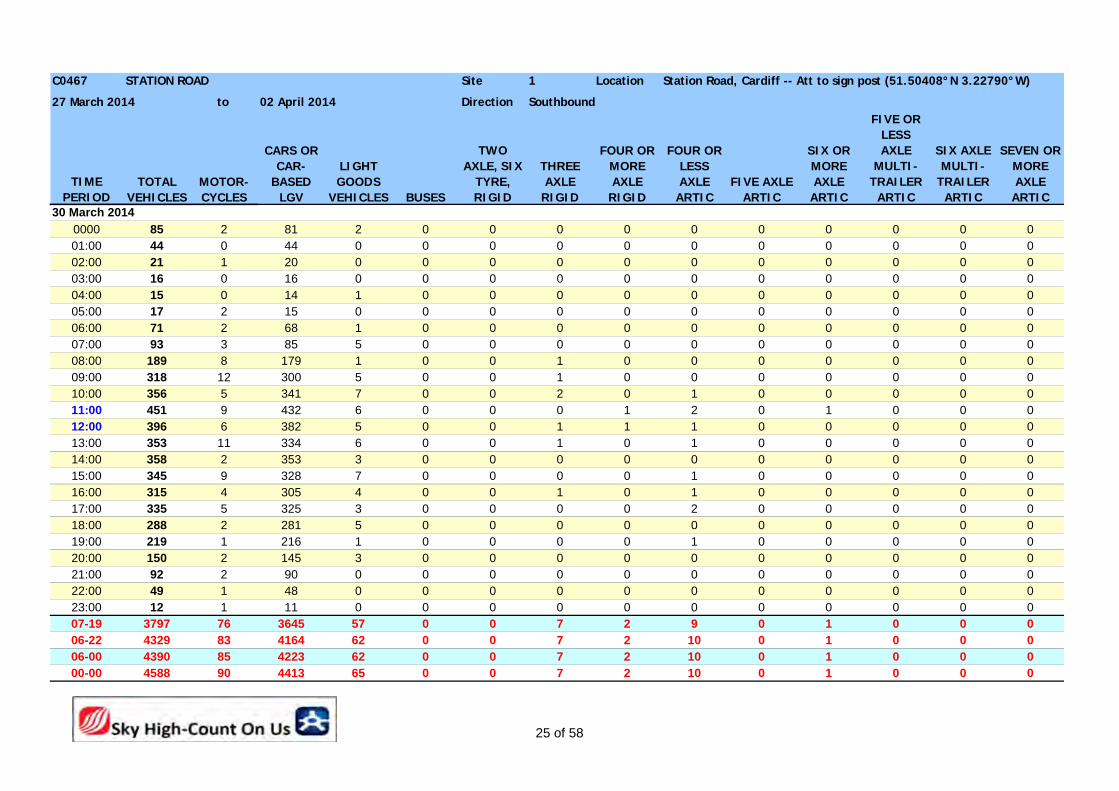
C0467 Site 1 Location
to Direction Southbound
STATION ROAD Station Road, Cardiff -- Att to sign post (51.50408°N 3.22790°W)
27 March 2014 02 April 2014
TIME PERIOD
FIVE OR LESS AXLE
MULTI-TRAILER
ARTIC
SIX AXLE MULTI-
TRAILER ARTIC
SEVEN OR MORE AXLE
ARTIC
TWO AXLE, SIX
TYRE, RIGID
SIX OR MORE AXLE
ARTIC
THREE AXLE
RIGID
FOUR OR MORE AXLE
RIGID
FOUR OR LESS AXLE
ARTIC
CARS OR CAR-
BASED LGV
MOTOR-CYCLES
TOTAL VEHICLES
FIVE AXLE ARTIC
LIGHT GOODS
VEHICLES BUSES
0000 85 2 81 2 0 0 0 0 0 0 0 0 0 001:00 44 0 44 0 0 0 0 0 0 0 0 0 0 002:00 21 1 20 0 0 0 0 0 0 0 0 0 0 003:00 16 0 16 0 0 0 0 0 0 0 0 0 0 004:00 15 0 14 1 0 0 0 0 0 0 0 0 0 005:00 17 2 15 0 0 0 0 0 0 0 0 0 0 006:00 71 2 68 1 0 0 0 0 0 0 0 0 0 007:00 93 3 85 5 0 0 0 0 0 0 0 0 0 008:00 189 8 179 1 0 0 1 0 0 0 0 0 0 009:00 318 12 300 5 0 0 1 0 0 0 0 0 0 010:00 356 5 341 7 0 0 2 0 1 0 0 0 0 011:00 451 9 432 6 0 0 0 1 2 0 1 0 0 012:00 396 6 382 5 0 0 1 1 1 0 0 0 0 013:00 353 11 334 6 0 0 1 0 1 0 0 0 0 014:00 358 2 353 3 0 0 0 0 0 0 0 0 0 015:00 345 9 328 7 0 0 0 0 1 0 0 0 0 016:00 315 4 305 4 0 0 1 0 1 0 0 0 0 017:00 335 5 325 3 0 0 0 0 2 0 0 0 0 018:00 288 2 281 5 0 0 0 0 0 0 0 0 0 019:00 219 1 216 1 0 0 0 0 1 0 0 0 0 020:00 150 2 145 3 0 0 0 0 0 0 0 0 0 021:00 92 2 90 0 0 0 0 0 0 0 0 0 0 022:00 49 1 48 0 0 0 0 0 0 0 0 0 0 023:00 12 1 11 0 0 0 0 0 0 0 0 0 0 007-19 3797 76 3645 57 0 0 7 2 9 0 1 0 0 006-22 4329 83 4164 62 0 0 7 2 10 0 1 0 0 006-00 4390 85 4223 62 0 0 7 2 10 0 1 0 0 000-00 4588 90 4413 65 0 0 7 2 10 0 1 0 0 0
30 March 2014
25 of 58
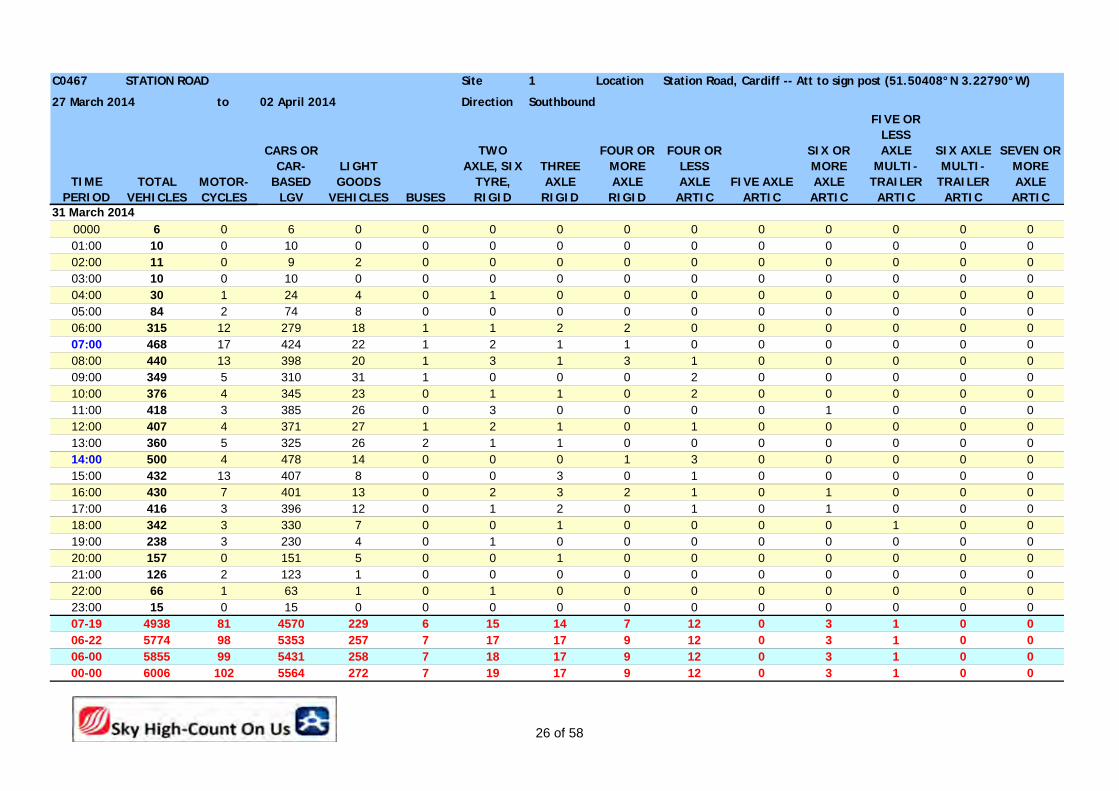
C0467 Site 1 Location
to Direction Southbound
STATION ROAD Station Road, Cardiff -- Att to sign post (51.50408°N 3.22790°W)
27 March 2014 02 April 2014
TIME PERIOD
FIVE OR LESS AXLE
MULTI-TRAILER
ARTIC
SIX AXLE MULTI-
TRAILER ARTIC
SEVEN OR MORE AXLE
ARTIC
TWO AXLE, SIX
TYRE, RIGID
SIX OR MORE AXLE
ARTIC
THREE AXLE
RIGID
FOUR OR MORE AXLE
RIGID
FOUR OR LESS AXLE
ARTIC
CARS OR CAR-
BASED LGV
MOTOR-CYCLES
TOTAL VEHICLES
FIVE AXLE ARTIC
LIGHT GOODS
VEHICLES BUSES
0000 6 0 6 0 0 0 0 0 0 0 0 0 0 001:00 10 0 10 0 0 0 0 0 0 0 0 0 0 002:00 11 0 9 2 0 0 0 0 0 0 0 0 0 003:00 10 0 10 0 0 0 0 0 0 0 0 0 0 004:00 30 1 24 4 0 1 0 0 0 0 0 0 0 005:00 84 2 74 8 0 0 0 0 0 0 0 0 0 006:00 315 12 279 18 1 1 2 2 0 0 0 0 0 007:00 468 17 424 22 1 2 1 1 0 0 0 0 0 008:00 440 13 398 20 1 3 1 3 1 0 0 0 0 009:00 349 5 310 31 1 0 0 0 2 0 0 0 0 010:00 376 4 345 23 0 1 1 0 2 0 0 0 0 011:00 418 3 385 26 0 3 0 0 0 0 1 0 0 012:00 407 4 371 27 1 2 1 0 1 0 0 0 0 013:00 360 5 325 26 2 1 1 0 0 0 0 0 0 014:00 500 4 478 14 0 0 0 1 3 0 0 0 0 015:00 432 13 407 8 0 0 3 0 1 0 0 0 0 016:00 430 7 401 13 0 2 3 2 1 0 1 0 0 017:00 416 3 396 12 0 1 2 0 1 0 1 0 0 018:00 342 3 330 7 0 0 1 0 0 0 0 1 0 019:00 238 3 230 4 0 1 0 0 0 0 0 0 0 020:00 157 0 151 5 0 0 1 0 0 0 0 0 0 021:00 126 2 123 1 0 0 0 0 0 0 0 0 0 022:00 66 1 63 1 0 1 0 0 0 0 0 0 0 023:00 15 0 15 0 0 0 0 0 0 0 0 0 0 007-19 4938 81 4570 229 6 15 14 7 12 0 3 1 0 006-22 5774 98 5353 257 7 17 17 9 12 0 3 1 0 006-00 5855 99 5431 258 7 18 17 9 12 0 3 1 0 000-00 6006 102 5564 272 7 19 17 9 12 0 3 1 0 0
31 March 2014
26 of 58

C0467 Site 1 Location
to Direction Southbound
STATION ROAD Station Road, Cardiff -- Att to sign post (51.50408°N 3.22790°W)
27 March 2014 02 April 2014
TIME PERIOD
FIVE OR LESS AXLE
MULTI-TRAILER
ARTIC
SIX AXLE MULTI-
TRAILER ARTIC
SEVEN OR MORE AXLE
ARTIC
TWO AXLE, SIX
TYRE, RIGID
SIX OR MORE AXLE
ARTIC
THREE AXLE
RIGID
FOUR OR MORE AXLE
RIGID
FOUR OR LESS AXLE
ARTIC
CARS OR CAR-
BASED LGV
MOTOR-CYCLES
TOTAL VEHICLES
FIVE AXLE ARTIC
LIGHT GOODS
VEHICLES BUSES
0000 10 0 9 1 0 0 0 0 0 0 0 0 0 001:00 3 0 3 0 0 0 0 0 0 0 0 0 0 002:00 5 0 5 0 0 0 0 0 0 0 0 0 0 003:00 11 1 7 3 0 0 0 0 0 0 0 0 0 004:00 34 3 27 3 0 1 0 0 0 0 0 0 0 005:00 70 6 57 6 0 1 0 0 0 0 0 0 0 006:00 379 7 349 19 0 1 1 0 2 0 0 0 0 007:00 439 18 396 17 0 4 0 2 1 0 0 0 0 108:00 411 13 364 26 0 2 2 0 4 0 0 0 0 009:00 390 2 360 27 0 0 0 0 0 0 0 0 0 110:00 386 4 353 26 0 0 1 1 0 0 0 1 0 011:00 403 4 367 30 0 0 0 0 2 0 0 0 0 012:00 389 4 360 22 0 1 1 0 1 0 0 0 0 013:00 391 1 363 26 0 0 0 1 0 0 0 0 0 014:00 459 7 433 18 0 0 1 0 0 0 0 0 0 015:00 484 10 442 27 0 0 2 0 1 0 0 2 0 016:00 467 7 437 16 1 2 2 0 2 0 0 0 0 017:00 451 11 427 9 0 1 0 0 3 0 0 0 0 018:00 407 5 390 11 0 0 1 0 0 0 0 0 0 019:00 239 3 228 7 0 0 0 0 1 0 0 0 0 020:00 149 3 144 2 0 0 0 0 0 0 0 0 0 021:00 135 1 129 5 0 0 0 0 0 0 0 0 0 022:00 64 0 61 2 0 1 0 0 0 0 0 0 0 023:00 21 0 19 2 0 0 0 0 0 0 0 0 0 007-19 5077 86 4692 255 1 10 10 4 14 0 0 3 0 206-22 5979 100 5542 288 1 11 11 4 17 0 0 3 0 206-00 6064 100 5622 292 1 12 11 4 17 0 0 3 0 200-00 6197 110 5730 305 1 14 11 4 17 0 0 3 0 2
01 April 2014
27 of 58
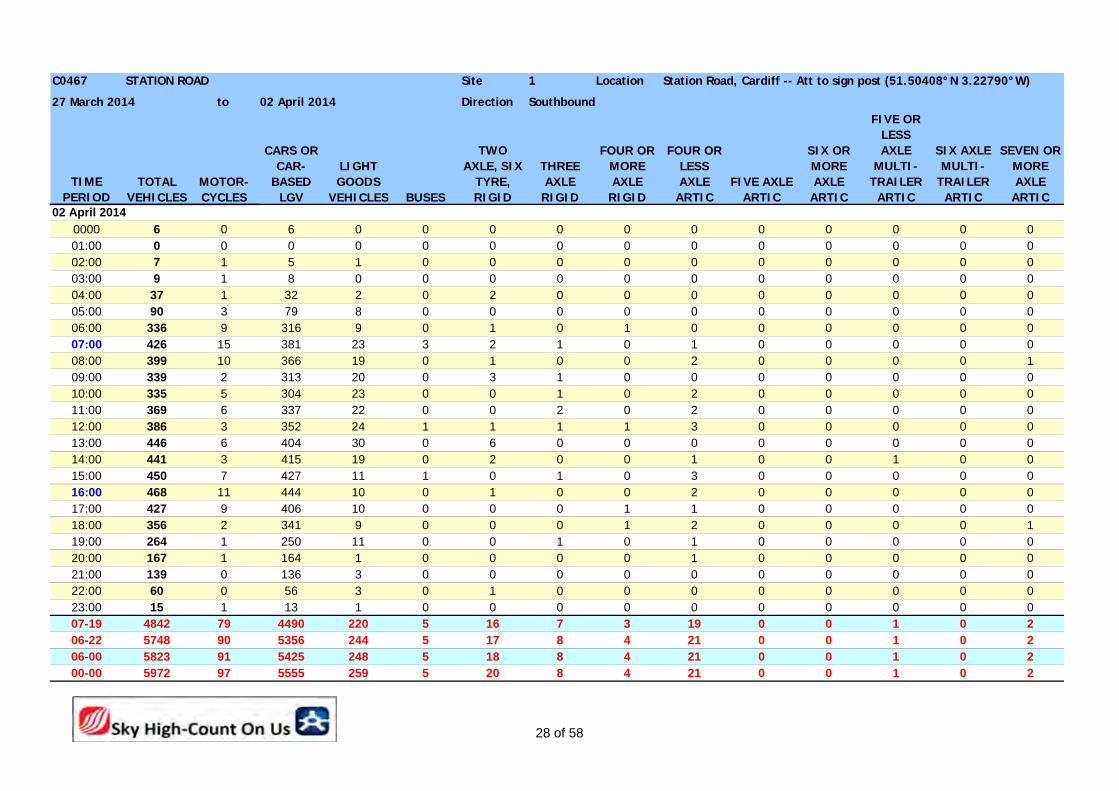
C0467 Site 1 Location
to Direction Southbound
STATION ROAD Station Road, Cardiff -- Att to sign post (51.50408°N 3.22790°W)
27 March 2014 02 April 2014
TIME PERIOD
FIVE OR LESS AXLE
MULTI-TRAILER
ARTIC
SIX AXLE MULTI-
TRAILER ARTIC
SEVEN OR MORE AXLE
ARTIC
TWO AXLE, SIX
TYRE, RIGID
SIX OR MORE AXLE
ARTIC
THREE AXLE
RIGID
FOUR OR MORE AXLE
RIGID
FOUR OR LESS AXLE
ARTIC
CARS OR CAR-
BASED LGV
MOTOR-CYCLES
TOTAL VEHICLES
FIVE AXLE ARTIC
LIGHT GOODS
VEHICLES BUSES
0000 6 0 6 0 0 0 0 0 0 0 0 0 0 001:00 0 0 0 0 0 0 0 0 0 0 0 0 0 002:00 7 1 5 1 0 0 0 0 0 0 0 0 0 003:00 9 1 8 0 0 0 0 0 0 0 0 0 0 004:00 37 1 32 2 0 2 0 0 0 0 0 0 0 005:00 90 3 79 8 0 0 0 0 0 0 0 0 0 006:00 336 9 316 9 0 1 0 1 0 0 0 0 0 007:00 426 15 381 23 3 2 1 0 1 0 0 0 0 008:00 399 10 366 19 0 1 0 0 2 0 0 0 0 109:00 339 2 313 20 0 3 1 0 0 0 0 0 0 010:00 335 5 304 23 0 0 1 0 2 0 0 0 0 011:00 369 6 337 22 0 0 2 0 2 0 0 0 0 012:00 386 3 352 24 1 1 1 1 3 0 0 0 0 013:00 446 6 404 30 0 6 0 0 0 0 0 0 0 014:00 441 3 415 19 0 2 0 0 1 0 0 1 0 015:00 450 7 427 11 1 0 1 0 3 0 0 0 0 016:00 468 11 444 10 0 1 0 0 2 0 0 0 0 017:00 427 9 406 10 0 0 0 1 1 0 0 0 0 018:00 356 2 341 9 0 0 0 1 2 0 0 0 0 119:00 264 1 250 11 0 0 1 0 1 0 0 0 0 020:00 167 1 164 1 0 0 0 0 1 0 0 0 0 021:00 139 0 136 3 0 0 0 0 0 0 0 0 0 022:00 60 0 56 3 0 1 0 0 0 0 0 0 0 023:00 15 1 13 1 0 0 0 0 0 0 0 0 0 007-19 4842 79 4490 220 5 16 7 3 19 0 0 1 0 206-22 5748 90 5356 244 5 17 8 4 21 0 0 1 0 206-00 5823 91 5425 248 5 18 8 4 21 0 0 1 0 200-00 5972 97 5555 259 5 20 8 4 21 0 0 1 0 2
02 April 2014
28 of 58

C0467 Site 1 Location
to Direction Southbound
STATION ROAD Station Road, Cardiff -- Att to sign post (51.50408°N 3.22790°W)
27 March 2014 02 April 2014
TIME PERIOD
FIVE OR LESS AXLE
MULTI-TRAILER
ARTIC
SIX AXLE MULTI-
TRAILER ARTIC
SEVEN OR MORE AXLE
ARTIC
TWO AXLE, SIX
TYRE, RIGID
SIX OR MORE AXLE
ARTIC
THREE AXLE
RIGID
FOUR OR MORE AXLE
RIGID
FOUR OR LESS AXLE
ARTIC
CARS OR CAR-
BASED LGV
MOTOR-CYCLES
TOTAL VEHICLES
FIVE AXLE ARTIC
LIGHT GOODS
VEHICLES BUSES
0000 30 1 28 1 0 0 0 0 0 0 0 0 0 001:00 15 0 15 1 0 0 0 0 0 0 0 0 0 002:00 11 0 9 1 0 0 0 0 0 0 0 0 0 003:00 10 0 9 0 0 0 0 0 0 0 0 0 0 004:00 20 1 17 2 0 1 0 0 0 0 0 0 0 005:00 48 2 41 3 0 1 0 0 0 0 0 0 0 006:00 188 5 171 10 0 1 1 0 0 0 0 0 0 007:00 316 12 286 14 1 1 0 1 0 0 0 0 0 008:00 354 12 321 16 1 1 1 1 1 0 0 0 0 009:00 368 7 337 22 0 1 1 0 0 0 0 0 0 010:00 377 4 349 21 0 1 1 0 1 0 0 0 0 011:00 410 6 379 21 0 1 1 0 1 0 0 0 0 012:00 404 4 375 20 0 1 1 1 2 0 0 0 0 013:00 393 5 363 21 0 1 1 0 1 0 0 0 0 014:00 422 5 398 16 0 1 0 0 1 0 0 0 0 015:00 429 8 404 14 0 0 1 0 1 0 0 0 0 016:00 437 7 412 13 0 1 1 0 2 0 0 0 0 017:00 441 7 418 12 0 1 0 1 2 0 0 0 0 018:00 381 3 367 9 0 0 1 0 1 0 0 0 0 019:00 303 2 292 8 0 0 0 0 1 0 0 0 0 020:00 188 2 181 4 0 0 0 0 1 0 0 0 0 021:00 138 1 134 3 0 0 0 0 0 0 0 0 0 022:00 86 1 82 3 0 0 0 0 0 0 0 0 0 023:00 48 0 46 1 0 0 0 0 0 0 0 0 0 007-19 4732 79 4410 200 4 10 9 5 12 0 1 2 0 106-22 5549 90 5187 224 4 11 10 5 14 0 1 2 0 106-00 5683 91 5315 228 4 11 10 5 14 0 1 2 0 100-00 5816 96 5434 236 4 13 10 5 14 0 1 2 0 1
Average Day
29 of 58

C0467 Site 1 Location
to Direction Southbound
STATION ROAD Station Road, Cardiff -- Att to sign post (51.50408°N 3.22790°W)
27 March 2014 02 April 2014
TIME PERIOD
FIVE OR LESS AXLE
MULTI-TRAILER
ARTIC
SIX AXLE MULTI-
TRAILER ARTIC
SEVEN OR MORE AXLE
ARTIC
TWO AXLE, SIX
TYRE, RIGID
SIX OR MORE AXLE
ARTIC
THREE AXLE
RIGID
FOUR OR MORE AXLE
RIGID
FOUR OR LESS AXLE
ARTIC
CARS OR CAR-
BASED LGV
MOTOR-CYCLES
TOTAL VEHICLES
FIVE AXLE ARTIC
LIGHT GOODS
VEHICLES BUSES
Mon 6006 102 5564 272 7 19 17 9 12 0 3 1 0 0Tue 6197 110 5730 305 1 14 11 4 17 0 0 3 0 2Wed 5972 97 5555 259 5 20 8 4 21 0 0 1 0 2Thu 6300 105 5848 291 7 12 9 6 18 0 1 3 0 0Fri 6270 76 5824 306 6 19 13 8 11 0 3 4 0 0
|Sat 5381 92 5106 154 0 4 7 4 12 2 0 0 0 0|Sun 4588 90 4413 65 0 0 7 2 10 0 1 0 0 0
[--] 6149 98 5704 287 5 17 12 6 16 0 1 2 0 1
[--] 5816 96 5434 236 4 13 10 5 14 0 1 2 0 1
[--] 40714 672 38040 1652 26 88 72 37 101 2 8 12 0 4
Total Vehicles
5 Day Average
7 Day Average
Virtual Week (1)
6006 6197 5972 6300 62705381
4588
6149 5816
0
1000
2000
3000
4000
5000
6000
7000
Mon Tue Wed Thu Fri |Sat |Sun 5 Day Average 7 Day Average
no
. o
f ve
hic
les
Virtual Week (Total Vehicles)
30 of 58

C0467 1
to Southbound
Speed BinsTime 0 10 15 20 25 30 35 40 45 50 55 60 65 30 30 35 35 45 45
Period 9 14 19 24 29 34 39 44 49 54 59 64 129 ACPO ACPO DFT Std
DFT Std
Speed Speed Speed
0000 14 0 0 0 2 6 5 0 1 0 0 0 0 0 6 42.9 1 7.1 0 0 29.7 32.2 32.901:00 10 0 0 0 1 4 2 2 1 0 0 0 0 0 5 50 3 30 0 0 31.1 - -02:00 6 0 0 0 0 4 1 1 0 0 0 0 0 0 2 33.3 1 16.7 0 0 29.8 - -03:00 4 0 0 0 0 2 2 0 0 0 0 0 0 0 2 50 0 0 0 0 29.9 - -04:00 9 0 0 0 1 3 3 2 0 0 0 0 0 0 5 55.6 2 22.2 0 0 31 - -05:00 34 0 2 1 3 8 14 5 0 0 0 1 0 0 20 58.8 6 17.6 1 2.9 30.1 34.9 37.106:00 88 0 0 2 4 40 35 5 2 0 0 0 0 0 42 47.7 7 8 0 0 30.1 33.8 3607:00 334 1 11 15 81 172 47 6 1 0 0 0 0 0 54 16.2 7 2.1 0 0 26.2 30 33.108:00 402 1 6 56 150 163 25 1 0 0 0 0 0 0 26 6.5 1 0.2 0 0 24.2 28 30.209:00 399 0 8 36 207 132 16 0 0 0 0 0 0 0 16 4 0 0 0 0 24 27.3 29.510:00 375 6 11 40 174 121 21 0 0 0 0 0 0 2 23 6.1 2 0.5 2 0.5 23.7 27.5 3011:00 405 0 22 68 183 115 14 3 0 0 0 0 0 0 17 4.2 3 0.7 0 0 23 26.8 29.512:00 401 0 16 59 206 109 10 1 0 0 0 0 0 0 11 2.7 1 0.2 0 0 23.1 26.6 28.613:00 368 0 7 36 183 126 12 4 0 0 0 0 0 0 16 4.3 4 1.1 0 0 24 27.1 29.514:00 396 1 12 25 167 170 20 1 0 0 0 0 0 0 21 5.3 1 0.3 0 0 24.6 28 3015:00 438 1 8 27 212 166 23 1 0 0 0 0 0 0 24 5.5 1 0.2 0 0 24.5 27.7 30.216:00 520 1 32 76 212 161 36 2 0 0 0 0 0 0 38 7.3 2 0.4 0 0 23.5 28.2 30.917:00 593 75 54 89 234 126 12 1 0 0 0 0 0 2 15 2.5 3 0.5 2 0.3 20.5 26.2 28.418:00 500 1 8 47 273 135 34 1 0 0 1 0 0 0 36 7.2 2 0.4 1 0.2 24.1 27.7 30.919:00 420 0 4 20 148 199 46 2 1 0 0 0 0 0 49 11.7 3 0.7 0 0 25.8 29.1 31.820:00 237 0 2 9 48 134 39 5 0 0 0 0 0 0 44 18.6 5 2.1 0 0 26.7 30.2 31.821:00 160 0 1 2 36 81 36 2 1 1 0 0 0 0 40 25 4 2.5 1 0.6 27.5 31.1 33.622:00 116 1 1 5 37 46 19 6 1 0 0 0 0 0 26 22.4 7 6 0 0 26.7 31.1 34.923:00 71 0 0 1 9 35 22 4 0 0 0 0 0 0 26 36.6 4 5.6 0 0 29.2 32.7 34.707-19 5131 87 195 574 2282 1696 270 21 1 0 1 0 0 4 297 5.8 27 0.5 5 0.1 23.6 27.7 30.206-22 6036 87 202 607 2518 2150 426 35 5 1 1 0 0 4 472 7.8 46 0.8 6 0.1 24.1 28.2 30.906-00 6223 88 203 613 2564 2231 467 45 6 1 1 0 0 4 524 8.4 57 0.9 6 0.1 24.2 28.4 31.100-00 6300 88 205 614 2571 2258 494 55 8 1 1 1 0 4 564 9 70 1.1 7 0.1 24.3 28.4 31.3
95%ile
Speed Limit (PSL)
ACPO (SL1)
STATION ROAD Site Location Station Road, Cardiff -- Att to sign post (51.50408°N 3.22790°W)27 March 2014 02 April 2014 Direction
DfT (SL2)
Mean 85%ileTotal Vehicles
27 March 2014
31 of 58
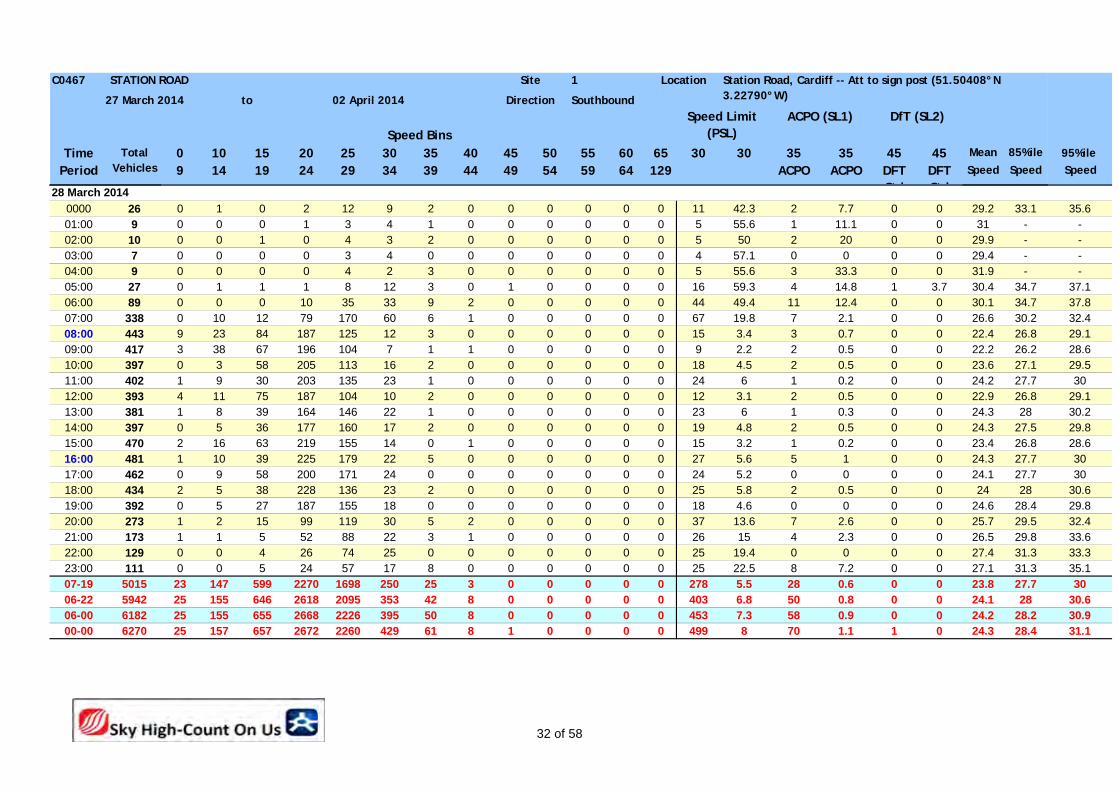
C0467 1
to Southbound
Speed BinsTime 0 10 15 20 25 30 35 40 45 50 55 60 65 30 30 35 35 45 45
Period 9 14 19 24 29 34 39 44 49 54 59 64 129 ACPO ACPO DFT Std
DFT Std
Speed Speed Speed95%ile
Speed Limit (PSL)
ACPO (SL1)
STATION ROAD Site Location Station Road, Cardiff -- Att to sign post (51.50408°N 3.22790°W)27 March 2014 02 April 2014 Direction
DfT (SL2)
Mean 85%ileTotal Vehicles
0000 26 0 1 0 2 12 9 2 0 0 0 0 0 0 11 42.3 2 7.7 0 0 29.2 33.1 35.601:00 9 0 0 0 1 3 4 1 0 0 0 0 0 0 5 55.6 1 11.1 0 0 31 - -02:00 10 0 0 1 0 4 3 2 0 0 0 0 0 0 5 50 2 20 0 0 29.9 - -03:00 7 0 0 0 0 3 4 0 0 0 0 0 0 0 4 57.1 0 0 0 0 29.4 - -04:00 9 0 0 0 0 4 2 3 0 0 0 0 0 0 5 55.6 3 33.3 0 0 31.9 - -05:00 27 0 1 1 1 8 12 3 0 1 0 0 0 0 16 59.3 4 14.8 1 3.7 30.4 34.7 37.106:00 89 0 0 0 10 35 33 9 2 0 0 0 0 0 44 49.4 11 12.4 0 0 30.1 34.7 37.807:00 338 0 10 12 79 170 60 6 1 0 0 0 0 0 67 19.8 7 2.1 0 0 26.6 30.2 32.408:00 443 9 23 84 187 125 12 3 0 0 0 0 0 0 15 3.4 3 0.7 0 0 22.4 26.8 29.109:00 417 3 38 67 196 104 7 1 1 0 0 0 0 0 9 2.2 2 0.5 0 0 22.2 26.2 28.610:00 397 0 3 58 205 113 16 2 0 0 0 0 0 0 18 4.5 2 0.5 0 0 23.6 27.1 29.511:00 402 1 9 30 203 135 23 1 0 0 0 0 0 0 24 6 1 0.2 0 0 24.2 27.7 3012:00 393 4 11 75 187 104 10 2 0 0 0 0 0 0 12 3.1 2 0.5 0 0 22.9 26.8 29.113:00 381 1 8 39 164 146 22 1 0 0 0 0 0 0 23 6 1 0.3 0 0 24.3 28 30.214:00 397 0 5 36 177 160 17 2 0 0 0 0 0 0 19 4.8 2 0.5 0 0 24.3 27.5 29.815:00 470 2 16 63 219 155 14 0 1 0 0 0 0 0 15 3.2 1 0.2 0 0 23.4 26.8 28.616:00 481 1 10 39 225 179 22 5 0 0 0 0 0 0 27 5.6 5 1 0 0 24.3 27.7 3017:00 462 0 9 58 200 171 24 0 0 0 0 0 0 0 24 5.2 0 0 0 0 24.1 27.7 3018:00 434 2 5 38 228 136 23 2 0 0 0 0 0 0 25 5.8 2 0.5 0 0 24 28 30.619:00 392 0 5 27 187 155 18 0 0 0 0 0 0 0 18 4.6 0 0 0 0 24.6 28.4 29.820:00 273 1 2 15 99 119 30 5 2 0 0 0 0 0 37 13.6 7 2.6 0 0 25.7 29.5 32.421:00 173 1 1 5 52 88 22 3 1 0 0 0 0 0 26 15 4 2.3 0 0 26.5 29.8 33.622:00 129 0 0 4 26 74 25 0 0 0 0 0 0 0 25 19.4 0 0 0 0 27.4 31.3 33.323:00 111 0 0 5 24 57 17 8 0 0 0 0 0 0 25 22.5 8 7.2 0 0 27.1 31.3 35.107-19 5015 23 147 599 2270 1698 250 25 3 0 0 0 0 0 278 5.5 28 0.6 0 0 23.8 27.7 3006-22 5942 25 155 646 2618 2095 353 42 8 0 0 0 0 0 403 6.8 50 0.8 0 0 24.1 28 30.606-00 6182 25 155 655 2668 2226 395 50 8 0 0 0 0 0 453 7.3 58 0.9 0 0 24.2 28.2 30.900-00 6270 25 157 657 2672 2260 429 61 8 1 0 0 0 0 499 8 70 1.1 1 0 24.3 28.4 31.1
28 March 2014
32 of 58

C0467 1
to Southbound
Speed BinsTime 0 10 15 20 25 30 35 40 45 50 55 60 65 30 30 35 35 45 45
Period 9 14 19 24 29 34 39 44 49 54 59 64 129 ACPO ACPO DFT Std
DFT Std
Speed Speed Speed95%ile
Speed Limit (PSL)
ACPO (SL1)
STATION ROAD Site Location Station Road, Cardiff -- Att to sign post (51.50408°N 3.22790°W)27 March 2014 02 April 2014 Direction
DfT (SL2)
Mean 85%ileTotal Vehicles
0000 62 0 1 1 10 30 17 3 0 0 0 0 0 0 20 32.3 3 4.8 0 0 28.3 33.1 34.901:00 32 0 0 1 3 11 14 2 1 0 0 0 0 0 17 53.1 3 9.4 0 0 29.9 33.3 3602:00 14 0 0 0 1 5 5 3 0 0 0 0 0 0 8 57.1 3 21.4 0 0 31.4 38 3803:00 10 0 0 0 2 5 3 0 0 0 0 0 0 0 3 30 0 0 0 0 27.7 - -04:00 7 0 0 0 2 0 3 2 0 0 0 0 0 0 5 71.4 2 28.6 0 0 30.8 - -05:00 12 0 0 0 2 3 5 1 1 0 0 0 0 0 7 58.3 2 16.7 0 0 31.2 34.4 36.906:00 37 0 0 1 5 14 11 6 0 0 0 0 0 0 17 45.9 6 16.2 0 0 29.9 34.7 36.707:00 116 0 2 5 18 51 31 9 0 0 0 0 0 0 40 34.5 9 7.8 0 0 28.3 33.3 35.808:00 194 0 5 13 47 98 26 4 1 0 0 0 0 0 31 16 5 2.6 0 0 26.3 30 32.709:00 365 1 8 37 102 181 34 2 0 0 0 0 0 0 36 9.9 2 0.5 0 0 25.3 29.3 31.510:00 414 1 1 17 126 233 35 1 0 0 0 0 0 0 36 8.7 1 0.2 0 0 25.8 28.6 30.611:00 423 3 12 35 189 165 19 0 0 0 0 0 0 0 19 4.5 0 0 0 0 24.2 27.7 29.812:00 454 1 10 49 210 159 22 2 1 0 0 0 0 0 25 5.5 3 0.7 0 0 24.1 27.5 30.213:00 449 3 22 42 162 188 31 1 0 0 0 0 0 0 32 7.1 1 0.2 0 0 24.2 28.4 30.414:00 401 2 5 37 161 168 24 3 1 0 0 0 0 0 28 7 4 1 0 0 24.8 28 30.215:00 386 0 4 42 159 159 20 2 0 0 0 0 0 0 22 5.7 2 0.5 0 0 24.5 27.7 30.216:00 380 1 14 34 135 165 26 4 1 0 0 0 0 0 31 8.2 5 1.3 0 0 24.8 28.4 31.317:00 404 0 8 36 141 184 32 2 0 0 1 0 0 0 35 8.7 3 0.7 1 0.2 25.1 28.6 30.918:00 339 0 2 25 135 152 23 2 0 0 0 0 0 0 25 7.4 2 0.6 0 0 25.1 28.2 30.919:00 351 1 3 14 112 182 31 8 0 0 0 0 0 0 39 11.1 8 2.3 0 0 26.1 29.3 32.220:00 181 0 2 2 33 97 41 6 0 0 0 0 0 0 47 26 6 3.3 0 0 27.7 31.3 33.621:00 140 0 2 2 32 65 32 6 0 1 0 0 0 0 39 27.9 7 5 1 0.7 27.7 31.8 34.222:00 118 0 1 5 21 53 30 7 1 0 0 0 0 0 38 32.2 8 6.8 0 0 27.9 32.4 35.323:00 92 0 0 0 18 47 22 4 1 0 0 0 0 0 27 29.3 5 5.4 0 0 28.4 32.4 34.407-19 4325 12 93 372 1585 1903 323 32 4 0 1 0 0 0 360 8.3 37 0.9 1 0 24.9 28.6 31.106-22 5034 13 100 391 1767 2261 438 58 4 1 1 0 0 0 502 10 64 1.3 2 0 25.2 29.1 31.806-00 5244 13 101 396 1806 2361 490 69 6 1 1 0 0 0 567 10.8 77 1.5 2 0 25.3 29.1 3200-00 5381 13 102 398 1826 2415 537 80 8 1 1 0 0 0 627 11.7 90 1.7 2 0 25.4 29.3 32.4
29 March 2014
33 of 58
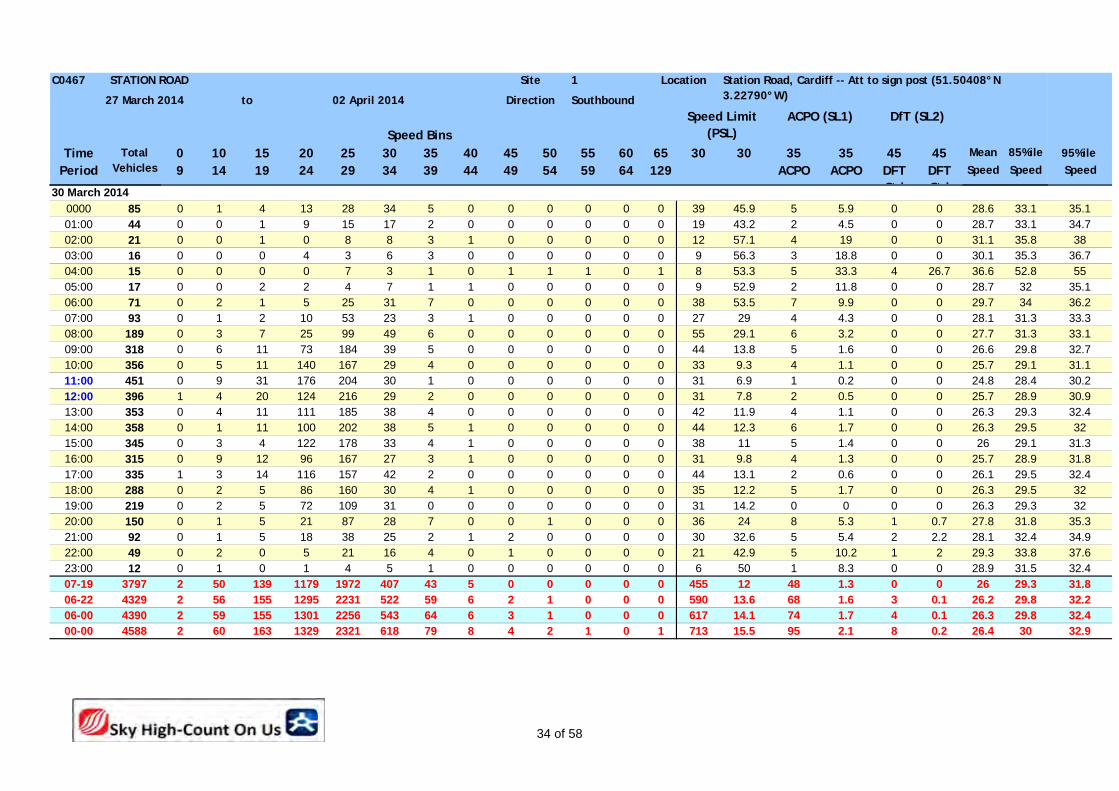
C0467 1
to Southbound
Speed BinsTime 0 10 15 20 25 30 35 40 45 50 55 60 65 30 30 35 35 45 45
Period 9 14 19 24 29 34 39 44 49 54 59 64 129 ACPO ACPO DFT Std
DFT Std
Speed Speed Speed95%ile
Speed Limit (PSL)
ACPO (SL1)
STATION ROAD Site Location Station Road, Cardiff -- Att to sign post (51.50408°N 3.22790°W)27 March 2014 02 April 2014 Direction
DfT (SL2)
Mean 85%ileTotal Vehicles
0000 85 0 1 4 13 28 34 5 0 0 0 0 0 0 39 45.9 5 5.9 0 0 28.6 33.1 35.101:00 44 0 0 1 9 15 17 2 0 0 0 0 0 0 19 43.2 2 4.5 0 0 28.7 33.1 34.702:00 21 0 0 1 0 8 8 3 1 0 0 0 0 0 12 57.1 4 19 0 0 31.1 35.8 3803:00 16 0 0 0 4 3 6 3 0 0 0 0 0 0 9 56.3 3 18.8 0 0 30.1 35.3 36.704:00 15 0 0 0 0 7 3 1 0 1 1 1 0 1 8 53.3 5 33.3 4 26.7 36.6 52.8 5505:00 17 0 0 2 2 4 7 1 1 0 0 0 0 0 9 52.9 2 11.8 0 0 28.7 32 35.106:00 71 0 2 1 5 25 31 7 0 0 0 0 0 0 38 53.5 7 9.9 0 0 29.7 34 36.207:00 93 0 1 2 10 53 23 3 1 0 0 0 0 0 27 29 4 4.3 0 0 28.1 31.3 33.308:00 189 0 3 7 25 99 49 6 0 0 0 0 0 0 55 29.1 6 3.2 0 0 27.7 31.3 33.109:00 318 0 6 11 73 184 39 5 0 0 0 0 0 0 44 13.8 5 1.6 0 0 26.6 29.8 32.710:00 356 0 5 11 140 167 29 4 0 0 0 0 0 0 33 9.3 4 1.1 0 0 25.7 29.1 31.111:00 451 0 9 31 176 204 30 1 0 0 0 0 0 0 31 6.9 1 0.2 0 0 24.8 28.4 30.212:00 396 1 4 20 124 216 29 2 0 0 0 0 0 0 31 7.8 2 0.5 0 0 25.7 28.9 30.913:00 353 0 4 11 111 185 38 4 0 0 0 0 0 0 42 11.9 4 1.1 0 0 26.3 29.3 32.414:00 358 0 1 11 100 202 38 5 1 0 0 0 0 0 44 12.3 6 1.7 0 0 26.3 29.5 3215:00 345 0 3 4 122 178 33 4 1 0 0 0 0 0 38 11 5 1.4 0 0 26 29.1 31.316:00 315 0 9 12 96 167 27 3 1 0 0 0 0 0 31 9.8 4 1.3 0 0 25.7 28.9 31.817:00 335 1 3 14 116 157 42 2 0 0 0 0 0 0 44 13.1 2 0.6 0 0 26.1 29.5 32.418:00 288 0 2 5 86 160 30 4 1 0 0 0 0 0 35 12.2 5 1.7 0 0 26.3 29.5 3219:00 219 0 2 5 72 109 31 0 0 0 0 0 0 0 31 14.2 0 0 0 0 26.3 29.3 3220:00 150 0 1 5 21 87 28 7 0 0 1 0 0 0 36 24 8 5.3 1 0.7 27.8 31.8 35.321:00 92 0 1 5 18 38 25 2 1 2 0 0 0 0 30 32.6 5 5.4 2 2.2 28.1 32.4 34.922:00 49 0 2 0 5 21 16 4 0 1 0 0 0 0 21 42.9 5 10.2 1 2 29.3 33.8 37.623:00 12 0 1 0 1 4 5 1 0 0 0 0 0 0 6 50 1 8.3 0 0 28.9 31.5 32.407-19 3797 2 50 139 1179 1972 407 43 5 0 0 0 0 0 455 12 48 1.3 0 0 26 29.3 31.806-22 4329 2 56 155 1295 2231 522 59 6 2 1 0 0 0 590 13.6 68 1.6 3 0.1 26.2 29.8 32.206-00 4390 2 59 155 1301 2256 543 64 6 3 1 0 0 0 617 14.1 74 1.7 4 0.1 26.3 29.8 32.400-00 4588 2 60 163 1329 2321 618 79 8 4 2 1 0 1 713 15.5 95 2.1 8 0.2 26.4 30 32.9
30 March 2014
34 of 58
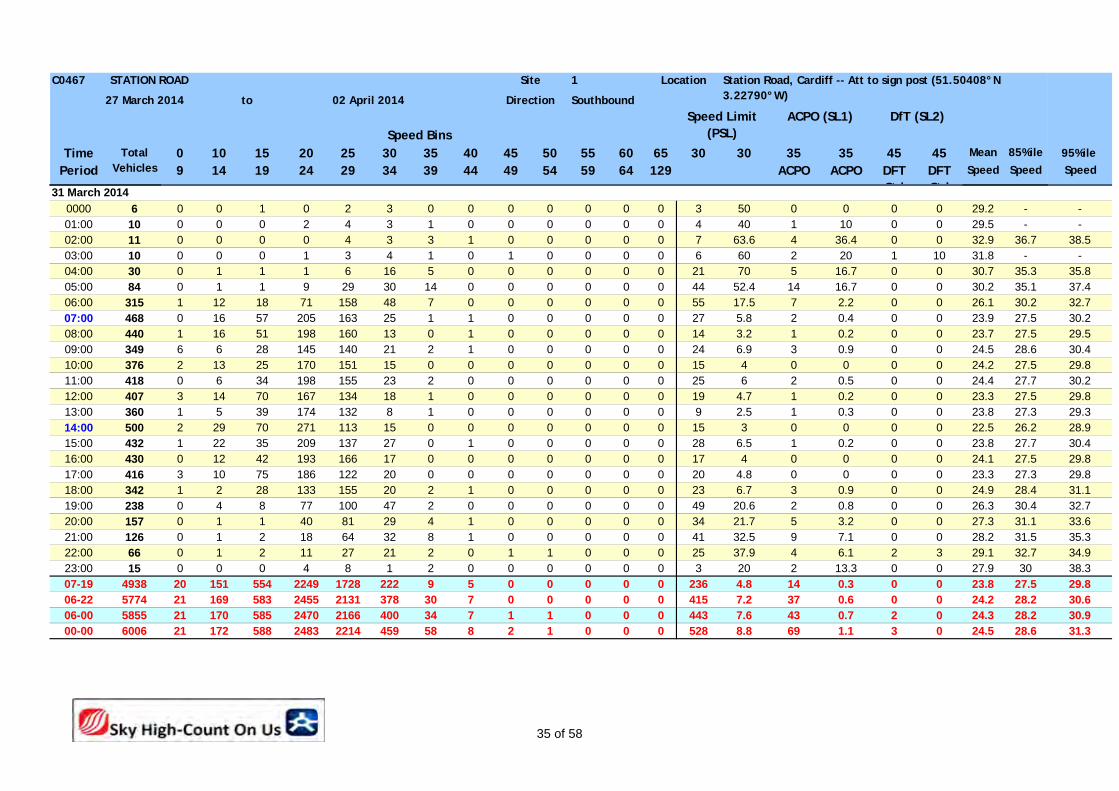
C0467 1
to Southbound
Speed BinsTime 0 10 15 20 25 30 35 40 45 50 55 60 65 30 30 35 35 45 45
Period 9 14 19 24 29 34 39 44 49 54 59 64 129 ACPO ACPO DFT Std
DFT Std
Speed Speed Speed95%ile
Speed Limit (PSL)
ACPO (SL1)
STATION ROAD Site Location Station Road, Cardiff -- Att to sign post (51.50408°N 3.22790°W)27 March 2014 02 April 2014 Direction
DfT (SL2)
Mean 85%ileTotal Vehicles
0000 6 0 0 1 0 2 3 0 0 0 0 0 0 0 3 50 0 0 0 0 29.2 - -01:00 10 0 0 0 2 4 3 1 0 0 0 0 0 0 4 40 1 10 0 0 29.5 - -02:00 11 0 0 0 0 4 3 3 1 0 0 0 0 0 7 63.6 4 36.4 0 0 32.9 36.7 38.503:00 10 0 0 0 1 3 4 1 0 1 0 0 0 0 6 60 2 20 1 10 31.8 - -04:00 30 0 1 1 1 6 16 5 0 0 0 0 0 0 21 70 5 16.7 0 0 30.7 35.3 35.805:00 84 0 1 1 9 29 30 14 0 0 0 0 0 0 44 52.4 14 16.7 0 0 30.2 35.1 37.406:00 315 1 12 18 71 158 48 7 0 0 0 0 0 0 55 17.5 7 2.2 0 0 26.1 30.2 32.707:00 468 0 16 57 205 163 25 1 1 0 0 0 0 0 27 5.8 2 0.4 0 0 23.9 27.5 30.208:00 440 1 16 51 198 160 13 0 1 0 0 0 0 0 14 3.2 1 0.2 0 0 23.7 27.5 29.509:00 349 6 6 28 145 140 21 2 1 0 0 0 0 0 24 6.9 3 0.9 0 0 24.5 28.6 30.410:00 376 2 13 25 170 151 15 0 0 0 0 0 0 0 15 4 0 0 0 0 24.2 27.5 29.811:00 418 0 6 34 198 155 23 2 0 0 0 0 0 0 25 6 2 0.5 0 0 24.4 27.7 30.212:00 407 3 14 70 167 134 18 1 0 0 0 0 0 0 19 4.7 1 0.2 0 0 23.3 27.5 29.813:00 360 1 5 39 174 132 8 1 0 0 0 0 0 0 9 2.5 1 0.3 0 0 23.8 27.3 29.314:00 500 2 29 70 271 113 15 0 0 0 0 0 0 0 15 3 0 0 0 0 22.5 26.2 28.915:00 432 1 22 35 209 137 27 0 1 0 0 0 0 0 28 6.5 1 0.2 0 0 23.8 27.7 30.416:00 430 0 12 42 193 166 17 0 0 0 0 0 0 0 17 4 0 0 0 0 24.1 27.5 29.817:00 416 3 10 75 186 122 20 0 0 0 0 0 0 0 20 4.8 0 0 0 0 23.3 27.3 29.818:00 342 1 2 28 133 155 20 2 1 0 0 0 0 0 23 6.7 3 0.9 0 0 24.9 28.4 31.119:00 238 0 4 8 77 100 47 2 0 0 0 0 0 0 49 20.6 2 0.8 0 0 26.3 30.4 32.720:00 157 0 1 1 40 81 29 4 1 0 0 0 0 0 34 21.7 5 3.2 0 0 27.3 31.1 33.621:00 126 0 1 2 18 64 32 8 1 0 0 0 0 0 41 32.5 9 7.1 0 0 28.2 31.5 35.322:00 66 0 1 2 11 27 21 2 0 1 1 0 0 0 25 37.9 4 6.1 2 3 29.1 32.7 34.923:00 15 0 0 0 4 8 1 2 0 0 0 0 0 0 3 20 2 13.3 0 0 27.9 30 38.307-19 4938 20 151 554 2249 1728 222 9 5 0 0 0 0 0 236 4.8 14 0.3 0 0 23.8 27.5 29.806-22 5774 21 169 583 2455 2131 378 30 7 0 0 0 0 0 415 7.2 37 0.6 0 0 24.2 28.2 30.606-00 5855 21 170 585 2470 2166 400 34 7 1 1 0 0 0 443 7.6 43 0.7 2 0 24.3 28.2 30.900-00 6006 21 172 588 2483 2214 459 58 8 2 1 0 0 0 528 8.8 69 1.1 3 0 24.5 28.6 31.3
31 March 2014
35 of 58
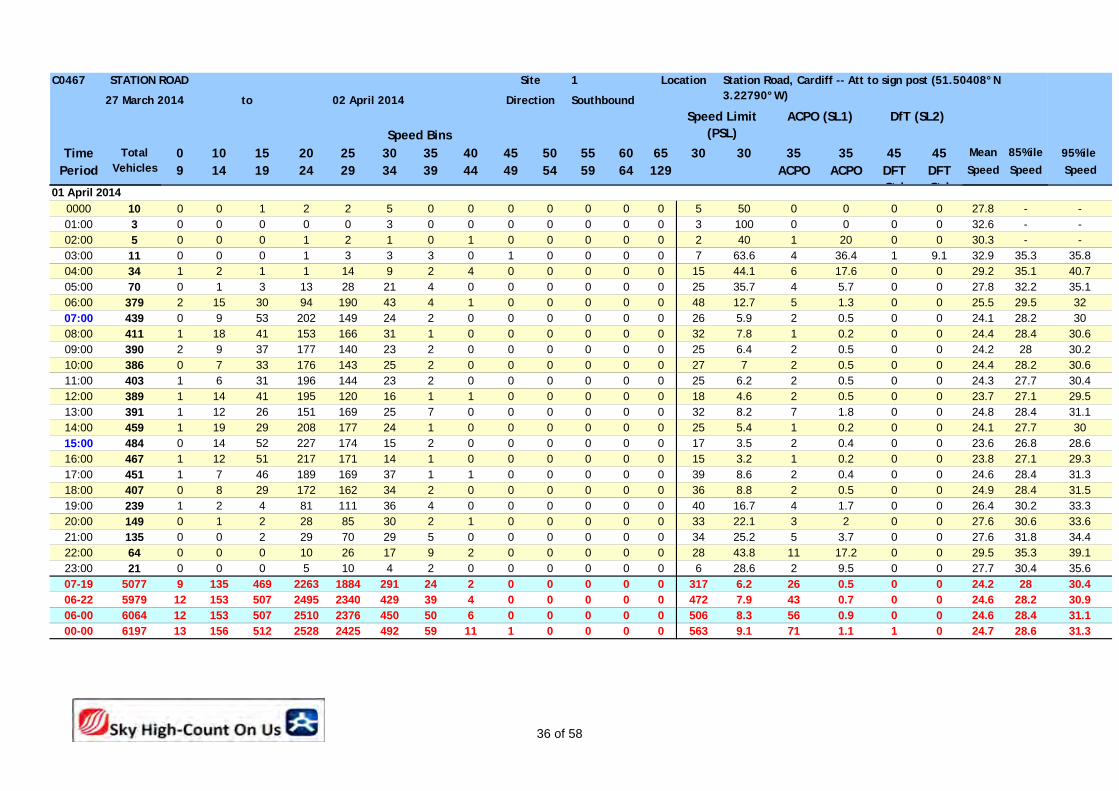
C0467 1
to Southbound
Speed BinsTime 0 10 15 20 25 30 35 40 45 50 55 60 65 30 30 35 35 45 45
Period 9 14 19 24 29 34 39 44 49 54 59 64 129 ACPO ACPO DFT Std
DFT Std
Speed Speed Speed95%ile
Speed Limit (PSL)
ACPO (SL1)
STATION ROAD Site Location Station Road, Cardiff -- Att to sign post (51.50408°N 3.22790°W)27 March 2014 02 April 2014 Direction
DfT (SL2)
Mean 85%ileTotal Vehicles
0000 10 0 0 1 2 2 5 0 0 0 0 0 0 0 5 50 0 0 0 0 27.8 - -01:00 3 0 0 0 0 0 3 0 0 0 0 0 0 0 3 100 0 0 0 0 32.6 - -02:00 5 0 0 0 1 2 1 0 1 0 0 0 0 0 2 40 1 20 0 0 30.3 - -03:00 11 0 0 0 1 3 3 3 0 1 0 0 0 0 7 63.6 4 36.4 1 9.1 32.9 35.3 35.804:00 34 1 2 1 1 14 9 2 4 0 0 0 0 0 15 44.1 6 17.6 0 0 29.2 35.1 40.705:00 70 0 1 3 13 28 21 4 0 0 0 0 0 0 25 35.7 4 5.7 0 0 27.8 32.2 35.106:00 379 2 15 30 94 190 43 4 1 0 0 0 0 0 48 12.7 5 1.3 0 0 25.5 29.5 3207:00 439 0 9 53 202 149 24 2 0 0 0 0 0 0 26 5.9 2 0.5 0 0 24.1 28.2 3008:00 411 1 18 41 153 166 31 1 0 0 0 0 0 0 32 7.8 1 0.2 0 0 24.4 28.4 30.609:00 390 2 9 37 177 140 23 2 0 0 0 0 0 0 25 6.4 2 0.5 0 0 24.2 28 30.210:00 386 0 7 33 176 143 25 2 0 0 0 0 0 0 27 7 2 0.5 0 0 24.4 28.2 30.611:00 403 1 6 31 196 144 23 2 0 0 0 0 0 0 25 6.2 2 0.5 0 0 24.3 27.7 30.412:00 389 1 14 41 195 120 16 1 1 0 0 0 0 0 18 4.6 2 0.5 0 0 23.7 27.1 29.513:00 391 1 12 26 151 169 25 7 0 0 0 0 0 0 32 8.2 7 1.8 0 0 24.8 28.4 31.114:00 459 1 19 29 208 177 24 1 0 0 0 0 0 0 25 5.4 1 0.2 0 0 24.1 27.7 3015:00 484 0 14 52 227 174 15 2 0 0 0 0 0 0 17 3.5 2 0.4 0 0 23.6 26.8 28.616:00 467 1 12 51 217 171 14 1 0 0 0 0 0 0 15 3.2 1 0.2 0 0 23.8 27.1 29.317:00 451 1 7 46 189 169 37 1 1 0 0 0 0 0 39 8.6 2 0.4 0 0 24.6 28.4 31.318:00 407 0 8 29 172 162 34 2 0 0 0 0 0 0 36 8.8 2 0.5 0 0 24.9 28.4 31.519:00 239 1 2 4 81 111 36 4 0 0 0 0 0 0 40 16.7 4 1.7 0 0 26.4 30.2 33.320:00 149 0 1 2 28 85 30 2 1 0 0 0 0 0 33 22.1 3 2 0 0 27.6 30.6 33.621:00 135 0 0 2 29 70 29 5 0 0 0 0 0 0 34 25.2 5 3.7 0 0 27.6 31.8 34.422:00 64 0 0 0 10 26 17 9 2 0 0 0 0 0 28 43.8 11 17.2 0 0 29.5 35.3 39.123:00 21 0 0 0 5 10 4 2 0 0 0 0 0 0 6 28.6 2 9.5 0 0 27.7 30.4 35.607-19 5077 9 135 469 2263 1884 291 24 2 0 0 0 0 0 317 6.2 26 0.5 0 0 24.2 28 30.406-22 5979 12 153 507 2495 2340 429 39 4 0 0 0 0 0 472 7.9 43 0.7 0 0 24.6 28.2 30.906-00 6064 12 153 507 2510 2376 450 50 6 0 0 0 0 0 506 8.3 56 0.9 0 0 24.6 28.4 31.100-00 6197 13 156 512 2528 2425 492 59 11 1 0 0 0 0 563 9.1 71 1.1 1 0 24.7 28.6 31.3
01 April 2014
36 of 58
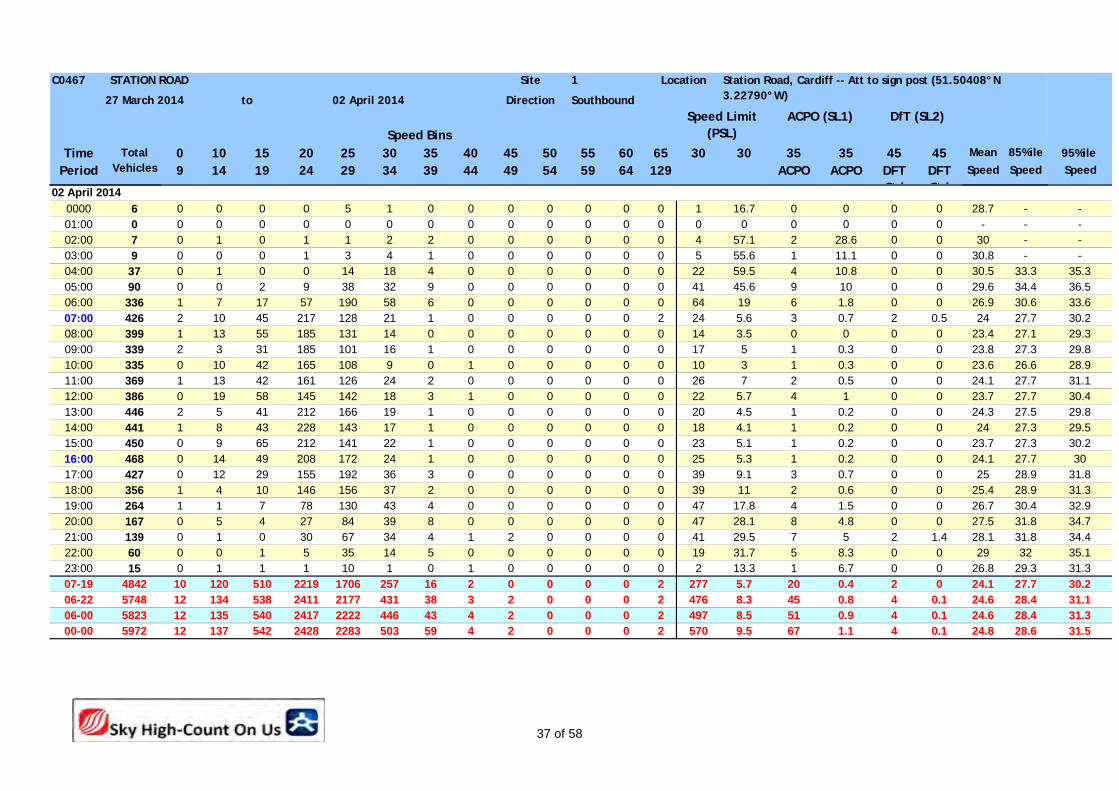
C0467 1
to Southbound
Speed BinsTime 0 10 15 20 25 30 35 40 45 50 55 60 65 30 30 35 35 45 45
Period 9 14 19 24 29 34 39 44 49 54 59 64 129 ACPO ACPO DFT Std
DFT Std
Speed Speed Speed95%ile
Speed Limit (PSL)
ACPO (SL1)
STATION ROAD Site Location Station Road, Cardiff -- Att to sign post (51.50408°N 3.22790°W)27 March 2014 02 April 2014 Direction
DfT (SL2)
Mean 85%ileTotal Vehicles
0000 6 0 0 0 0 5 1 0 0 0 0 0 0 0 1 16.7 0 0 0 0 28.7 - -01:00 0 0 0 0 0 0 0 0 0 0 0 0 0 0 0 0 0 0 0 0 - - -02:00 7 0 1 0 1 1 2 2 0 0 0 0 0 0 4 57.1 2 28.6 0 0 30 - -03:00 9 0 0 0 1 3 4 1 0 0 0 0 0 0 5 55.6 1 11.1 0 0 30.8 - -04:00 37 0 1 0 0 14 18 4 0 0 0 0 0 0 22 59.5 4 10.8 0 0 30.5 33.3 35.305:00 90 0 0 2 9 38 32 9 0 0 0 0 0 0 41 45.6 9 10 0 0 29.6 34.4 36.506:00 336 1 7 17 57 190 58 6 0 0 0 0 0 0 64 19 6 1.8 0 0 26.9 30.6 33.607:00 426 2 10 45 217 128 21 1 0 0 0 0 0 2 24 5.6 3 0.7 2 0.5 24 27.7 30.208:00 399 1 13 55 185 131 14 0 0 0 0 0 0 0 14 3.5 0 0 0 0 23.4 27.1 29.309:00 339 2 3 31 185 101 16 1 0 0 0 0 0 0 17 5 1 0.3 0 0 23.8 27.3 29.810:00 335 0 10 42 165 108 9 0 1 0 0 0 0 0 10 3 1 0.3 0 0 23.6 26.6 28.911:00 369 1 13 42 161 126 24 2 0 0 0 0 0 0 26 7 2 0.5 0 0 24.1 27.7 31.112:00 386 0 19 58 145 142 18 3 1 0 0 0 0 0 22 5.7 4 1 0 0 23.7 27.7 30.413:00 446 2 5 41 212 166 19 1 0 0 0 0 0 0 20 4.5 1 0.2 0 0 24.3 27.5 29.814:00 441 1 8 43 228 143 17 1 0 0 0 0 0 0 18 4.1 1 0.2 0 0 24 27.3 29.515:00 450 0 9 65 212 141 22 1 0 0 0 0 0 0 23 5.1 1 0.2 0 0 23.7 27.3 30.216:00 468 0 14 49 208 172 24 1 0 0 0 0 0 0 25 5.3 1 0.2 0 0 24.1 27.7 3017:00 427 0 12 29 155 192 36 3 0 0 0 0 0 0 39 9.1 3 0.7 0 0 25 28.9 31.818:00 356 1 4 10 146 156 37 2 0 0 0 0 0 0 39 11 2 0.6 0 0 25.4 28.9 31.319:00 264 1 1 7 78 130 43 4 0 0 0 0 0 0 47 17.8 4 1.5 0 0 26.7 30.4 32.920:00 167 0 5 4 27 84 39 8 0 0 0 0 0 0 47 28.1 8 4.8 0 0 27.5 31.8 34.721:00 139 0 1 0 30 67 34 4 1 2 0 0 0 0 41 29.5 7 5 2 1.4 28.1 31.8 34.422:00 60 0 0 1 5 35 14 5 0 0 0 0 0 0 19 31.7 5 8.3 0 0 29 32 35.123:00 15 0 1 1 1 10 1 0 1 0 0 0 0 0 2 13.3 1 6.7 0 0 26.8 29.3 31.307-19 4842 10 120 510 2219 1706 257 16 2 0 0 0 0 2 277 5.7 20 0.4 2 0 24.1 27.7 30.206-22 5748 12 134 538 2411 2177 431 38 3 2 0 0 0 2 476 8.3 45 0.8 4 0.1 24.6 28.4 31.106-00 5823 12 135 540 2417 2222 446 43 4 2 0 0 0 2 497 8.5 51 0.9 4 0.1 24.6 28.4 31.300-00 5972 12 137 542 2428 2283 503 59 4 2 0 0 0 2 570 9.5 67 1.1 4 0.1 24.8 28.6 31.5
02 April 2014
37 of 58
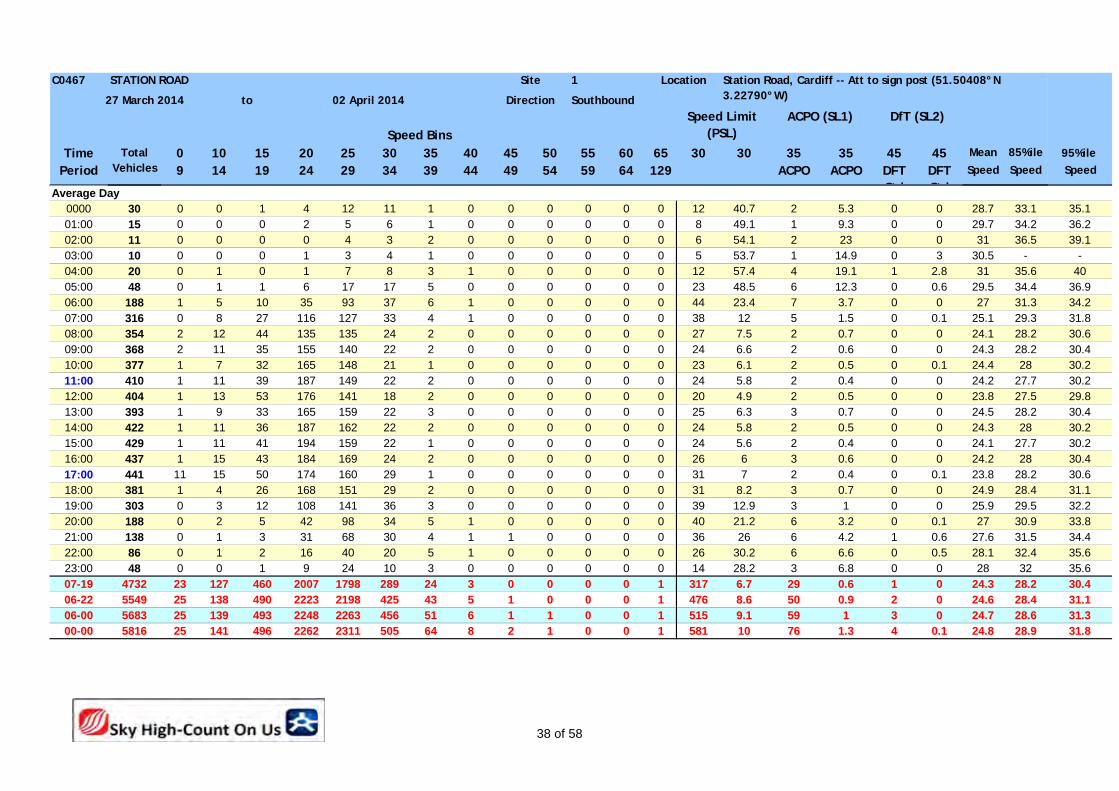
C0467 1
to Southbound
Speed BinsTime 0 10 15 20 25 30 35 40 45 50 55 60 65 30 30 35 35 45 45
Period 9 14 19 24 29 34 39 44 49 54 59 64 129 ACPO ACPO DFT Std
DFT Std
Speed Speed Speed95%ile
Speed Limit (PSL)
ACPO (SL1)
STATION ROAD Site Location Station Road, Cardiff -- Att to sign post (51.50408°N 3.22790°W)27 March 2014 02 April 2014 Direction
DfT (SL2)
Mean 85%ileTotal Vehicles
Average Day0000 30 0 0 1 4 12 11 1 0 0 0 0 0 0 12 40.7 2 5.3 0 0 28.7 33.1 35.101:00 15 0 0 0 2 5 6 1 0 0 0 0 0 0 8 49.1 1 9.3 0 0 29.7 34.2 36.202:00 11 0 0 0 0 4 3 2 0 0 0 0 0 0 6 54.1 2 23 0 0 31 36.5 39.103:00 10 0 0 0 1 3 4 1 0 0 0 0 0 0 5 53.7 1 14.9 0 3 30.5 - -04:00 20 0 1 0 1 7 8 3 1 0 0 0 0 0 12 57.4 4 19.1 1 2.8 31 35.6 4005:00 48 0 1 1 6 17 17 5 0 0 0 0 0 0 23 48.5 6 12.3 0 0.6 29.5 34.4 36.906:00 188 1 5 10 35 93 37 6 1 0 0 0 0 0 44 23.4 7 3.7 0 0 27 31.3 34.207:00 316 0 8 27 116 127 33 4 1 0 0 0 0 0 38 12 5 1.5 0 0.1 25.1 29.3 31.808:00 354 2 12 44 135 135 24 2 0 0 0 0 0 0 27 7.5 2 0.7 0 0 24.1 28.2 30.609:00 368 2 11 35 155 140 22 2 0 0 0 0 0 0 24 6.6 2 0.6 0 0 24.3 28.2 30.410:00 377 1 7 32 165 148 21 1 0 0 0 0 0 0 23 6.1 2 0.5 0 0.1 24.4 28 30.211:00 410 1 11 39 187 149 22 2 0 0 0 0 0 0 24 5.8 2 0.4 0 0 24.2 27.7 30.212:00 404 1 13 53 176 141 18 2 0 0 0 0 0 0 20 4.9 2 0.5 0 0 23.8 27.5 29.813:00 393 1 9 33 165 159 22 3 0 0 0 0 0 0 25 6.3 3 0.7 0 0 24.5 28.2 30.414:00 422 1 11 36 187 162 22 2 0 0 0 0 0 0 24 5.8 2 0.5 0 0 24.3 28 30.215:00 429 1 11 41 194 159 22 1 0 0 0 0 0 0 24 5.6 2 0.4 0 0 24.1 27.7 30.216:00 437 1 15 43 184 169 24 2 0 0 0 0 0 0 26 6 3 0.6 0 0 24.2 28 30.417:00 441 11 15 50 174 160 29 1 0 0 0 0 0 0 31 7 2 0.4 0 0.1 23.8 28.2 30.618:00 381 1 4 26 168 151 29 2 0 0 0 0 0 0 31 8.2 3 0.7 0 0 24.9 28.4 31.119:00 303 0 3 12 108 141 36 3 0 0 0 0 0 0 39 12.9 3 1 0 0 25.9 29.5 32.220:00 188 0 2 5 42 98 34 5 1 0 0 0 0 0 40 21.2 6 3.2 0 0.1 27 30.9 33.821:00 138 0 1 3 31 68 30 4 1 1 0 0 0 0 36 26 6 4.2 1 0.6 27.6 31.5 34.422:00 86 0 1 2 16 40 20 5 1 0 0 0 0 0 26 30.2 6 6.6 0 0.5 28.1 32.4 35.623:00 48 0 0 1 9 24 10 3 0 0 0 0 0 0 14 28.2 3 6.8 0 0 28 32 35.607-19 4732 23 127 460 2007 1798 289 24 3 0 0 0 0 1 317 6.7 29 0.6 1 0 24.3 28.2 30.406-22 5549 25 138 490 2223 2198 425 43 5 1 0 0 0 1 476 8.6 50 0.9 2 0 24.6 28.4 31.106-00 5683 25 139 493 2248 2263 456 51 6 1 1 0 0 1 515 9.1 59 1 3 0 24.7 28.6 31.300-00 5816 25 141 496 2262 2311 505 64 8 2 1 0 0 1 581 10 76 1.3 4 0.1 24.8 28.9 31.8
38 of 58

C0467 1
to Southbound
Speed BinsTime 0 10 15 20 25 30 35 40 45 50 55 60 65 30 30 35 35 45 45
Period 9 14 19 24 29 34 39 44 49 54 59 64 129 ACPO ACPO DFT Std
DFT Std
Speed Speed Speed95%ile
Speed Limit (PSL)
ACPO (SL1)
STATION ROAD Site Location Station Road, Cardiff -- Att to sign post (51.50408°N 3.22790°W)27 March 2014 02 April 2014 Direction
DfT (SL2)
Mean 85%ileTotal Vehicles
Virtual Week (1)Mon 6006 21 172 588 2483 2214 459 58 8 2 1 0 0 0 528 8.8 69 1.1 3 0 24.5 28.6 31.3Tue 6197 13 156 512 2528 2425 492 59 11 1 0 0 0 0 563 9.1 71 1.1 1 0 24.7 28.6 31.3Wed 5972 12 137 542 2428 2283 503 59 4 2 0 0 0 2 570 9.5 67 1.1 4 0.1 24.8 28.6 31.5Thu 6300 88 205 614 2571 2258 494 55 8 1 1 1 0 4 564 9 70 1.1 7 0.1 24.3 28.4 31.3Fri 6270 25 157 657 2672 2260 429 61 8 1 0 0 0 0 499 8 70 1.1 1 0 24.3 28.4 31.1
|Sat 5381 13 102 398 1826 2415 537 80 8 1 1 0 0 0 627 11.7 90 1.7 2 0 25.4 29.3 32.4|Sun 4588 2 60 163 1329 2321 618 79 8 4 2 1 0 1 713 15.5 95 2.1 8 0.2 26.4 30 32.9
5 Day Average[--] 6149 32 165 583 2536 2288 475 58 8 1 0 0 0 1 545 8.9 69 1.1 3 0.1 24.5 28.5 31.3
7 Day Average[--] 5816 25 141 496 2262 2311 505 64 8 2 1 0 0 1 581 10.0 76 1.3 4 0.1 24.8 28.9 31.8
Total Vehicles[--] 40714 174 989 3474 15837 16176 3532 451 55 12 5 2 0 7 4064 10.0 532 1.3 26 0.1 24.8 28.9 31.8
8.8 9.1 9.5 9 811.7
15.5
8.9 10.0
1.1 1.1 1.1 1.1 1.1 1.7 2.1 1.1 1.30 0 0.1 0.1 0 0 0.2 0.1 0.10
10
20
30
40
50
60
70
80
90
100
Mon Tue Wed Thu Fri |Sat |Sun 5 DayAverage
7 DayAverage
%
30
35
45
24.5 24.7 24.8 24.3 24.325.4
26.424.5 24.8
28.6 28.6 28.6 28.4 28.4 29.3 3028.5 28.9
0
10
20
30
40
Mon Tue Wed Thu Fri |Sat |Sun 5 DayAverage
7 DayAverage
mph
Mean
85%ile
39 of 58

C0467 Site 1 Location
to Direction Two-Way
0000 30 0 29 1 0 0 0 0 0 0 0 0 0 001:00 19 0 16 3 0 0 0 0 0 0 0 0 0 002:00 10 1 3 6 0 0 0 0 0 0 0 0 0 003:00 7 0 7 0 0 0 0 0 0 0 0 0 0 004:00 18 1 15 1 0 0 0 0 1 0 0 0 0 005:00 68 2 61 3 0 2 0 0 0 0 0 0 0 006:00 178 4 147 21 1 3 1 0 1 0 0 0 0 007:00 735 25 642 56 2 5 1 1 3 0 0 0 0 008:00 1029 21 914 72 5 2 7 2 5 0 1 0 0 009:00 776 15 682 73 2 2 0 1 1 0 0 0 0 010:00 728 9 654 56 1 6 1 1 0 0 0 0 0 011:00 764 6 682 70 2 1 1 1 1 0 0 0 0 012:00 794 8 699 75 3 2 3 1 3 0 0 0 0 013:00 763 9 676 72 0 1 1 0 3 0 1 0 0 014:00 789 6 705 70 3 1 0 0 2 1 0 1 0 015:00 882 4 810 58 2 1 1 0 4 0 0 2 0 016:00 1021 17 912 81 1 1 0 1 7 0 1 0 0 017:00 1104 29 1008 49 2 2 5 1 7 0 0 1 0 018:00 1031 11 977 33 1 2 2 0 2 0 0 2 0 119:00 759 13 709 32 0 2 0 0 3 0 0 0 0 020:00 532 6 491 30 0 2 0 1 1 0 1 0 0 021:00 354 5 337 12 0 0 0 0 0 0 0 0 0 022:00 240 5 223 12 0 0 0 0 0 0 0 0 0 023:00 134 3 124 7 0 0 0 0 0 0 0 0 0 007-19 10416 160 9361 765 24 26 22 9 38 1 3 6 0 106-22 12239 188 11045 860 25 33 23 10 43 1 4 6 0 106-00 12613 196 11392 879 25 33 23 10 43 1 4 6 0 100-00 12765 200 11523 893 25 35 23 10 44 1 4 6 0 1
TWO AXLE, SIX
TYRE, RIGID
THREE AXLE
RIGID
FOUR OR MORE AXLE
RIGID
FOUR OR LESS AXLE
ARTIC27 March 2014
STATION ROAD Station Road, Cardiff -- Att to sign post (51.50408°N 3.22790°W)
27 March 2014 02 April 2014
TIME PERIOD
TOTAL VEHICLES
FIVE OR LESS AXLE
MULTI-TRAILER
ARTIC
SIX AXLE MULTI-
TRAILER ARTIC
SEVEN OR MORE AXLE
ARTICFIVE AXLE
ARTIC
SIX OR MORE AXLE
ARTICMOTOR-CYCLES
CARS OR CAR-
BASED LGV
LIGHT GOODS
VEHICLES BUSES
40 of 58

C0467 Site 1 Location
to Direction Two-Way
TWO AXLE, SIX
TYRE, RIGID
THREE AXLE
RIGID
FOUR OR MORE AXLE
RIGID
FOUR OR LESS AXLE
ARTIC
STATION ROAD Station Road, Cardiff -- Att to sign post (51.50408°N 3.22790°W)
27 March 2014 02 April 2014
TIME PERIOD
TOTAL VEHICLES
FIVE OR LESS AXLE
MULTI-TRAILER
ARTIC
SIX AXLE MULTI-
TRAILER ARTIC
SEVEN OR MORE AXLE
ARTICFIVE AXLE
ARTIC
SIX OR MORE AXLE
ARTICMOTOR-CYCLES
CARS OR CAR-
BASED LGV
LIGHT GOODS
VEHICLES BUSES
0000 40 1 36 3 0 0 0 0 0 0 0 0 0 001:00 18 0 17 1 0 0 0 0 0 0 0 0 0 002:00 16 1 14 1 0 0 0 0 0 0 0 0 0 003:00 17 1 16 0 0 0 0 0 0 0 0 0 0 004:00 18 1 14 2 0 0 1 0 0 0 0 0 0 005:00 52 1 45 4 0 2 0 0 0 0 0 0 0 006:00 173 2 140 22 1 5 0 0 1 0 2 0 0 007:00 689 17 603 58 4 4 1 0 2 0 0 0 0 008:00 1024 18 924 67 5 6 1 0 3 0 0 0 0 009:00 854 13 765 66 1 5 2 1 0 0 1 0 0 010:00 800 4 709 78 2 2 2 0 3 0 0 0 0 011:00 833 8 751 64 1 3 3 0 2 0 1 0 0 012:00 816 6 726 66 3 2 3 2 6 0 0 1 0 113:00 785 7 705 57 1 4 2 1 5 0 2 1 0 014:00 829 7 738 69 2 4 2 1 6 0 0 0 0 015:00 975 15 895 55 2 3 1 1 3 0 0 0 0 016:00 1024 11 951 53 1 3 2 0 1 0 1 1 0 017:00 1012 18 916 70 0 2 2 1 3 0 0 0 0 018:00 855 9 799 37 0 2 3 0 3 0 0 2 0 019:00 754 2 723 23 0 1 1 0 3 0 0 1 0 020:00 515 6 486 18 0 1 2 1 1 0 0 0 0 021:00 330 3 313 14 0 0 0 0 0 0 0 0 0 022:00 254 4 232 17 0 0 0 0 1 0 0 0 0 023:00 218 1 207 8 0 1 0 0 1 0 0 0 0 007-19 10496 133 9482 740 22 40 24 7 37 0 5 5 0 106-22 12268 146 11144 817 23 47 27 8 42 0 7 6 0 106-00 12740 151 11583 842 23 48 27 8 44 0 7 6 0 100-00 12901 156 11725 853 23 50 28 8 44 0 7 6 0 1
28 March 2014
41 of 58

C0467 Site 1 Location
to Direction Two-Way
TWO AXLE, SIX
TYRE, RIGID
THREE AXLE
RIGID
FOUR OR MORE AXLE
RIGID
FOUR OR LESS AXLE
ARTIC
STATION ROAD Station Road, Cardiff -- Att to sign post (51.50408°N 3.22790°W)
27 March 2014 02 April 2014
TIME PERIOD
TOTAL VEHICLES
FIVE OR LESS AXLE
MULTI-TRAILER
ARTIC
SIX AXLE MULTI-
TRAILER ARTIC
SEVEN OR MORE AXLE
ARTICFIVE AXLE
ARTIC
SIX OR MORE AXLE
ARTICMOTOR-CYCLES
CARS OR CAR-
BASED LGV
LIGHT GOODS
VEHICLES BUSES
0000 136 2 128 6 0 0 0 0 0 0 0 0 0 001:00 53 0 47 6 0 0 0 0 0 0 0 0 0 002:00 22 0 21 1 0 0 0 0 0 0 0 0 0 003:00 21 0 20 1 0 0 0 0 0 0 0 0 0 004:00 16 0 15 1 0 0 0 0 0 0 0 0 0 005:00 38 1 32 4 0 1 0 0 0 0 0 0 0 006:00 83 2 69 9 2 1 0 0 0 0 0 0 0 007:00 225 9 186 26 0 3 1 0 0 0 0 0 0 008:00 436 18 384 30 2 1 0 0 1 0 0 0 0 009:00 735 18 658 50 3 0 3 0 3 0 0 0 0 010:00 831 14 764 48 1 2 1 0 1 0 0 0 0 011:00 884 13 822 41 1 0 3 0 2 0 1 1 0 012:00 955 10 890 46 2 0 2 0 3 1 0 1 0 013:00 930 14 874 37 0 0 4 0 1 0 0 0 0 014:00 832 18 775 30 1 0 3 1 3 1 0 0 0 015:00 765 14 715 31 0 0 1 1 2 0 1 0 0 016:00 795 13 749 27 0 0 2 1 2 0 0 0 0 117:00 787 11 738 30 0 1 2 2 3 0 0 0 0 018:00 713 6 678 24 1 0 1 0 3 0 0 0 0 019:00 646 6 609 25 0 1 1 0 4 0 0 0 0 020:00 401 3 386 9 0 1 0 0 2 0 0 0 0 021:00 279 3 267 8 0 1 0 0 0 0 0 0 0 022:00 227 2 216 7 0 1 1 0 0 0 0 0 0 023:00 196 2 183 9 0 2 0 0 0 0 0 0 0 007-19 8888 158 8233 420 11 7 23 5 24 2 2 2 0 106-22 10297 172 9564 471 13 11 24 5 30 2 2 2 0 106-00 10720 176 9963 487 13 14 25 5 30 2 2 2 0 100-00 11006 179 10226 506 13 15 25 5 30 2 2 2 0 1
29 March 2014
42 of 58

C0467 Site 1 Location
to Direction Two-Way
TWO AXLE, SIX
TYRE, RIGID
THREE AXLE
RIGID
FOUR OR MORE AXLE
RIGID
FOUR OR LESS AXLE
ARTIC
STATION ROAD Station Road, Cardiff -- Att to sign post (51.50408°N 3.22790°W)
27 March 2014 02 April 2014
TIME PERIOD
TOTAL VEHICLES
FIVE OR LESS AXLE
MULTI-TRAILER
ARTIC
SIX AXLE MULTI-
TRAILER ARTIC
SEVEN OR MORE AXLE
ARTICFIVE AXLE
ARTIC
SIX OR MORE AXLE
ARTICMOTOR-CYCLES
CARS OR CAR-
BASED LGV
LIGHT GOODS
VEHICLES BUSES
0000 149 2 140 7 0 0 0 0 0 0 0 0 0 001:00 76 0 72 4 0 0 0 0 0 0 0 0 0 002:00 38 1 36 1 0 0 0 0 0 0 0 0 0 003:00 30 0 29 1 0 0 0 0 0 0 0 0 0 004:00 36 0 30 6 0 0 0 0 0 0 0 0 0 005:00 43 3 38 2 0 0 0 0 0 0 0 0 0 006:00 120 3 110 7 0 0 0 0 0 0 0 0 0 007:00 184 5 169 10 0 0 0 0 0 0 0 0 0 008:00 394 16 362 14 0 0 1 0 1 0 0 0 0 009:00 631 17 593 19 1 0 1 0 0 0 0 0 0 010:00 728 13 684 22 1 0 3 0 5 0 0 0 0 011:00 914 19 859 29 1 0 2 1 2 0 1 0 0 012:00 787 15 746 20 0 0 3 1 2 0 0 0 0 013:00 716 20 668 23 1 0 2 0 2 0 0 0 0 014:00 712 9 682 15 1 0 2 0 3 0 0 0 0 015:00 725 15 685 23 0 0 0 0 2 0 0 0 0 016:00 674 9 636 24 1 0 1 0 3 0 0 0 0 017:00 650 10 620 16 0 0 0 0 4 0 0 0 0 018:00 546 7 520 16 0 0 1 0 2 0 0 0 0 019:00 429 4 408 14 0 0 0 0 3 0 0 0 0 020:00 290 3 275 12 0 0 0 0 0 0 0 0 0 021:00 169 5 161 3 0 0 0 0 0 0 0 0 0 022:00 82 1 79 2 0 0 0 0 0 0 0 0 0 023:00 29 1 28 0 0 0 0 0 0 0 0 0 0 007-19 7661 155 7224 231 6 0 16 2 26 0 1 0 0 006-22 8669 170 8178 267 6 0 16 2 29 0 1 0 0 006-00 8780 172 8285 269 6 0 16 2 29 0 1 0 0 000-00 9152 178 8630 290 6 0 16 2 29 0 1 0 0 0
30 March 2014
43 of 58

C0467 Site 1 Location
to Direction Two-Way
TWO AXLE, SIX
TYRE, RIGID
THREE AXLE
RIGID
FOUR OR MORE AXLE
RIGID
FOUR OR LESS AXLE
ARTIC
STATION ROAD Station Road, Cardiff -- Att to sign post (51.50408°N 3.22790°W)
27 March 2014 02 April 2014
TIME PERIOD
TOTAL VEHICLES
FIVE OR LESS AXLE
MULTI-TRAILER
ARTIC
SIX AXLE MULTI-
TRAILER ARTIC
SEVEN OR MORE AXLE
ARTICFIVE AXLE
ARTIC
SIX OR MORE AXLE
ARTICMOTOR-CYCLES
CARS OR CAR-
BASED LGV
LIGHT GOODS
VEHICLES BUSES
0000 19 0 17 2 0 0 0 0 0 0 0 0 0 001:00 19 0 18 1 0 0 0 0 0 0 0 0 0 002:00 20 0 16 4 0 0 0 0 0 0 0 0 0 003:00 19 0 16 3 0 0 0 0 0 0 0 0 0 004:00 57 1 44 9 0 3 0 0 0 0 0 0 0 005:00 167 4 139 20 2 1 0 0 1 0 0 0 0 006:00 673 16 587 57 3 5 3 2 0 0 0 0 0 007:00 1064 24 952 73 3 2 3 1 6 0 0 0 0 008:00 932 16 842 59 3 6 2 3 1 0 0 0 0 009:00 692 8 608 63 1 6 1 0 5 0 0 0 0 010:00 761 11 669 73 1 3 1 0 3 0 0 0 0 011:00 789 6 705 70 0 5 2 0 0 0 1 0 0 012:00 760 7 677 64 2 5 2 1 2 0 0 0 0 013:00 779 9 694 68 2 3 1 0 2 0 0 0 0 014:00 998 10 920 59 0 1 1 1 5 0 0 0 0 115:00 926 22 846 53 1 0 3 0 1 0 0 0 0 016:00 864 26 784 38 1 3 3 2 6 0 1 0 0 017:00 827 11 774 32 1 4 2 0 2 0 1 0 0 018:00 683 11 639 29 0 1 1 0 1 0 0 1 0 019:00 485 6 459 17 0 1 1 0 1 0 0 0 0 020:00 313 4 295 13 0 0 1 0 0 0 0 0 0 021:00 232 3 221 8 0 0 0 0 0 0 0 0 0 022:00 111 1 103 6 0 1 0 0 0 0 0 0 0 023:00 30 0 30 0 0 0 0 0 0 0 0 0 0 007-19 10075 161 9110 681 15 39 22 8 34 0 3 1 0 106-22 11778 190 10672 776 18 45 27 10 35 0 3 1 0 106-00 11919 191 10805 782 18 46 27 10 35 0 3 1 0 100-00 12220 196 11055 821 20 50 27 10 36 0 3 1 0 1
31 March 2014
44 of 58

C0467 Site 1 Location
to Direction Two-Way
TWO AXLE, SIX
TYRE, RIGID
THREE AXLE
RIGID
FOUR OR MORE AXLE
RIGID
FOUR OR LESS AXLE
ARTIC
STATION ROAD Station Road, Cardiff -- Att to sign post (51.50408°N 3.22790°W)
27 March 2014 02 April 2014
TIME PERIOD
TOTAL VEHICLES
FIVE OR LESS AXLE
MULTI-TRAILER
ARTIC
SIX AXLE MULTI-
TRAILER ARTIC
SEVEN OR MORE AXLE
ARTICFIVE AXLE
ARTIC
SIX OR MORE AXLE
ARTICMOTOR-CYCLES
CARS OR CAR-
BASED LGV
LIGHT GOODS
VEHICLES BUSES
0000 20 0 16 4 0 0 0 0 0 0 0 0 0 001:00 7 1 6 0 0 0 0 0 0 0 0 0 0 002:00 11 0 11 0 0 0 0 0 0 0 0 0 0 003:00 16 1 10 5 0 0 0 0 0 0 0 0 0 004:00 64 3 52 8 0 1 0 0 0 0 0 0 0 005:00 169 7 135 19 1 7 0 0 0 0 0 0 0 006:00 748 13 667 60 0 4 2 0 2 0 0 0 0 007:00 1019 26 916 59 3 6 1 2 5 0 0 0 0 108:00 875 21 756 78 2 6 3 1 7 0 0 1 0 009:00 755 5 670 76 0 2 0 0 1 0 0 0 0 110:00 744 12 654 67 0 4 2 1 3 0 0 1 0 011:00 811 11 729 67 0 1 1 0 2 0 0 0 0 012:00 787 9 705 63 2 2 1 0 4 0 0 1 0 013:00 770 7 692 63 4 3 0 1 0 0 0 0 0 014:00 919 15 842 54 3 2 1 0 2 0 0 0 0 015:00 971 20 867 70 1 0 5 0 6 0 0 2 0 016:00 986 27 891 54 1 4 4 0 4 0 1 0 0 017:00 909 22 846 31 0 3 0 0 7 0 0 0 0 018:00 768 18 715 28 0 1 3 0 3 0 0 0 0 019:00 508 9 476 20 1 0 0 0 2 0 0 0 0 020:00 326 8 309 7 0 0 0 0 2 0 0 0 0 021:00 260 2 245 13 0 0 0 0 0 0 0 0 0 022:00 106 2 99 4 0 1 0 0 0 0 0 0 0 023:00 42 0 38 4 0 0 0 0 0 0 0 0 0 007-19 10314 193 9283 710 16 34 21 5 44 0 1 5 0 206-22 12156 225 10980 810 17 38 23 5 50 0 1 5 0 206-00 12304 227 11117 818 17 39 23 5 50 0 1 5 0 200-00 12591 239 11347 854 18 47 23 5 50 0 1 5 0 2
01 April 2014
45 of 58

C0467 Site 1 Location
to Direction Two-Way
TWO AXLE, SIX
TYRE, RIGID
THREE AXLE
RIGID
FOUR OR MORE AXLE
RIGID
FOUR OR LESS AXLE
ARTIC
STATION ROAD Station Road, Cardiff -- Att to sign post (51.50408°N 3.22790°W)
27 March 2014 02 April 2014
TIME PERIOD
TOTAL VEHICLES
FIVE OR LESS AXLE
MULTI-TRAILER
ARTIC
SIX AXLE MULTI-
TRAILER ARTIC
SEVEN OR MORE AXLE
ARTICFIVE AXLE
ARTIC
SIX OR MORE AXLE
ARTICMOTOR-CYCLES
CARS OR CAR-
BASED LGV
LIGHT GOODS
VEHICLES BUSES
0000 20 1 18 1 0 0 0 0 0 0 0 0 0 001:00 5 0 5 0 0 0 0 0 0 0 0 0 0 002:00 11 1 9 1 0 0 0 0 0 0 0 0 0 003:00 17 1 15 1 0 0 0 0 0 0 0 0 0 004:00 61 1 54 3 0 3 0 0 0 0 0 0 0 005:00 175 5 149 15 1 4 0 0 1 0 0 0 0 006:00 714 14 647 49 0 3 0 1 0 0 0 0 0 007:00 1036 25 927 66 7 4 1 0 6 0 0 0 0 008:00 832 10 736 74 1 1 1 0 8 0 0 0 0 109:00 691 6 615 61 0 5 2 0 2 0 0 0 0 010:00 692 6 610 69 0 2 2 0 3 0 0 0 0 011:00 772 6 704 53 1 2 2 0 4 0 0 0 0 012:00 778 7 692 68 3 2 1 1 4 0 0 0 0 013:00 818 7 729 71 1 7 1 0 1 0 0 1 0 014:00 937 11 855 63 1 2 0 0 3 0 1 1 0 015:00 964 17 879 53 2 1 3 0 9 0 0 0 0 016:00 1045 27 971 39 0 2 0 0 6 0 0 0 0 017:00 857 16 798 33 0 2 2 1 5 0 0 0 0 018:00 752 8 707 28 2 0 0 1 3 0 1 1 0 119:00 537 5 499 31 0 0 1 0 1 0 0 0 0 020:00 373 4 355 12 0 0 0 0 1 0 1 0 0 021:00 258 1 243 12 0 1 1 0 0 0 0 0 0 022:00 103 0 96 5 0 1 1 0 0 0 0 0 0 023:00 35 1 32 2 0 0 0 0 0 0 0 0 0 007-19 10174 146 9223 678 18 30 15 3 54 0 2 3 0 206-22 12056 170 10967 782 18 34 17 4 56 0 3 3 0 206-00 12194 171 11095 789 18 35 18 4 56 0 3 3 0 200-00 12483 180 11345 810 19 42 18 4 57 0 3 3 0 2
02 April 2014
46 of 58
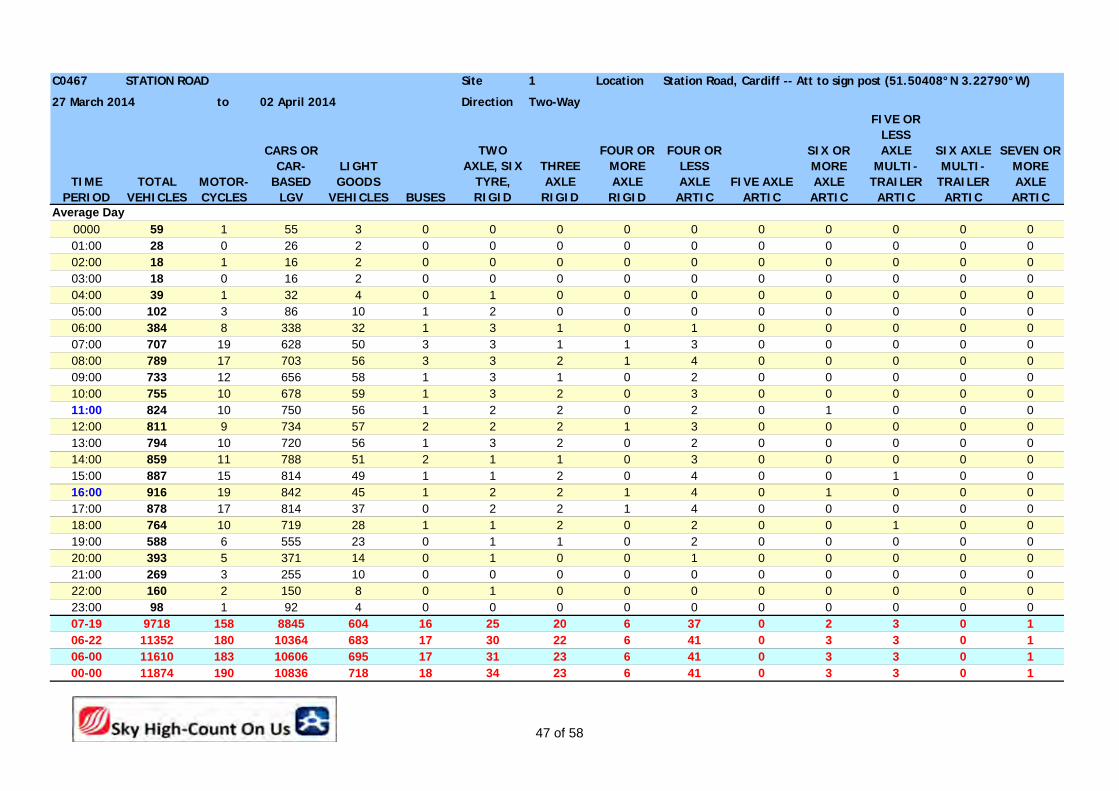
C0467 Site 1 Location
to Direction Two-Way
TWO AXLE, SIX
TYRE, RIGID
THREE AXLE
RIGID
FOUR OR MORE AXLE
RIGID
FOUR OR LESS AXLE
ARTIC
STATION ROAD Station Road, Cardiff -- Att to sign post (51.50408°N 3.22790°W)
27 March 2014 02 April 2014
TIME PERIOD
TOTAL VEHICLES
FIVE OR LESS AXLE
MULTI-TRAILER
ARTIC
SIX AXLE MULTI-
TRAILER ARTIC
SEVEN OR MORE AXLE
ARTICFIVE AXLE
ARTIC
SIX OR MORE AXLE
ARTICMOTOR-CYCLES
CARS OR CAR-
BASED LGV
LIGHT GOODS
VEHICLES BUSES
0000 59 1 55 3 0 0 0 0 0 0 0 0 0 001:00 28 0 26 2 0 0 0 0 0 0 0 0 0 002:00 18 1 16 2 0 0 0 0 0 0 0 0 0 003:00 18 0 16 2 0 0 0 0 0 0 0 0 0 004:00 39 1 32 4 0 1 0 0 0 0 0 0 0 005:00 102 3 86 10 1 2 0 0 0 0 0 0 0 006:00 384 8 338 32 1 3 1 0 1 0 0 0 0 007:00 707 19 628 50 3 3 1 1 3 0 0 0 0 008:00 789 17 703 56 3 3 2 1 4 0 0 0 0 009:00 733 12 656 58 1 3 1 0 2 0 0 0 0 010:00 755 10 678 59 1 3 2 0 3 0 0 0 0 011:00 824 10 750 56 1 2 2 0 2 0 1 0 0 012:00 811 9 734 57 2 2 2 1 3 0 0 0 0 013:00 794 10 720 56 1 3 2 0 2 0 0 0 0 014:00 859 11 788 51 2 1 1 0 3 0 0 0 0 015:00 887 15 814 49 1 1 2 0 4 0 0 1 0 016:00 916 19 842 45 1 2 2 1 4 0 1 0 0 017:00 878 17 814 37 0 2 2 1 4 0 0 0 0 018:00 764 10 719 28 1 1 2 0 2 0 0 1 0 019:00 588 6 555 23 0 1 1 0 2 0 0 0 0 020:00 393 5 371 14 0 1 0 0 1 0 0 0 0 021:00 269 3 255 10 0 0 0 0 0 0 0 0 0 022:00 160 2 150 8 0 1 0 0 0 0 0 0 0 023:00 98 1 92 4 0 0 0 0 0 0 0 0 0 007-19 9718 158 8845 604 16 25 20 6 37 0 2 3 0 106-22 11352 180 10364 683 17 30 22 6 41 0 3 3 0 106-00 11610 183 10606 695 17 31 23 6 41 0 3 3 0 100-00 11874 190 10836 718 18 34 23 6 41 0 3 3 0 1
Average Day
47 of 58
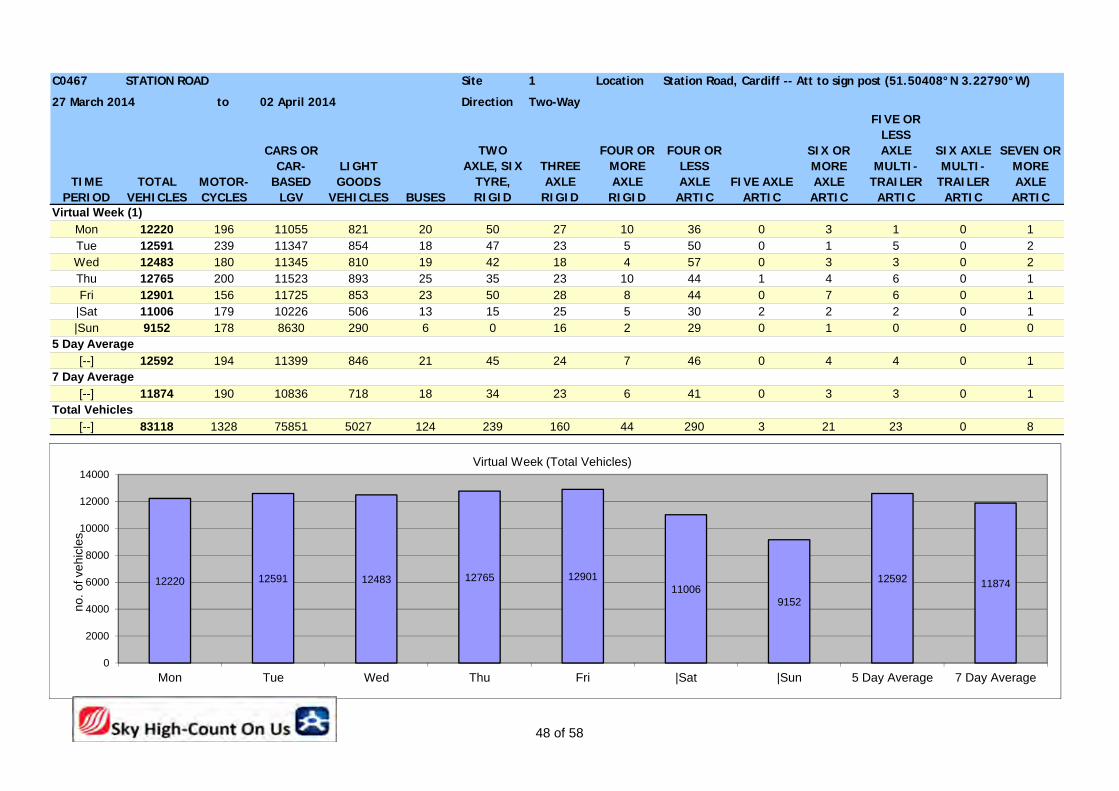
C0467 Site 1 Location
to Direction Two-Way
TWO AXLE, SIX
TYRE, RIGID
THREE AXLE
RIGID
FOUR OR MORE AXLE
RIGID
FOUR OR LESS AXLE
ARTIC
STATION ROAD Station Road, Cardiff -- Att to sign post (51.50408°N 3.22790°W)
27 March 2014 02 April 2014
TIME PERIOD
TOTAL VEHICLES
FIVE OR LESS AXLE
MULTI-TRAILER
ARTIC
SIX AXLE MULTI-
TRAILER ARTIC
SEVEN OR MORE AXLE
ARTICFIVE AXLE
ARTIC
SIX OR MORE AXLE
ARTICMOTOR-CYCLES
CARS OR CAR-
BASED LGV
LIGHT GOODS
VEHICLES BUSES
Mon 12220 196 11055 821 20 50 27 10 36 0 3 1 0 1Tue 12591 239 11347 854 18 47 23 5 50 0 1 5 0 2Wed 12483 180 11345 810 19 42 18 4 57 0 3 3 0 2Thu 12765 200 11523 893 25 35 23 10 44 1 4 6 0 1Fri 12901 156 11725 853 23 50 28 8 44 0 7 6 0 1
|Sat 11006 179 10226 506 13 15 25 5 30 2 2 2 0 1|Sun 9152 178 8630 290 6 0 16 2 29 0 1 0 0 0
[--] 12592 194 11399 846 21 45 24 7 46 0 4 4 0 1
[--] 11874 190 10836 718 18 34 23 6 41 0 3 3 0 1
[--] 83118 1328 75851 5027 124 239 160 44 290 3 21 23 0 8
Total Vehicles
7 Day Average
Virtual Week (1)
5 Day Average
12220 12591 12483 12765 1290111006
9152
12592 11874
0
2000
4000
6000
8000
10000
12000
14000
Mon Tue Wed Thu Fri |Sat |Sun 5 Day Average 7 Day Average
no
. o
f ve
hic
les
Virtual Week (Total Vehicles)
48 of 58
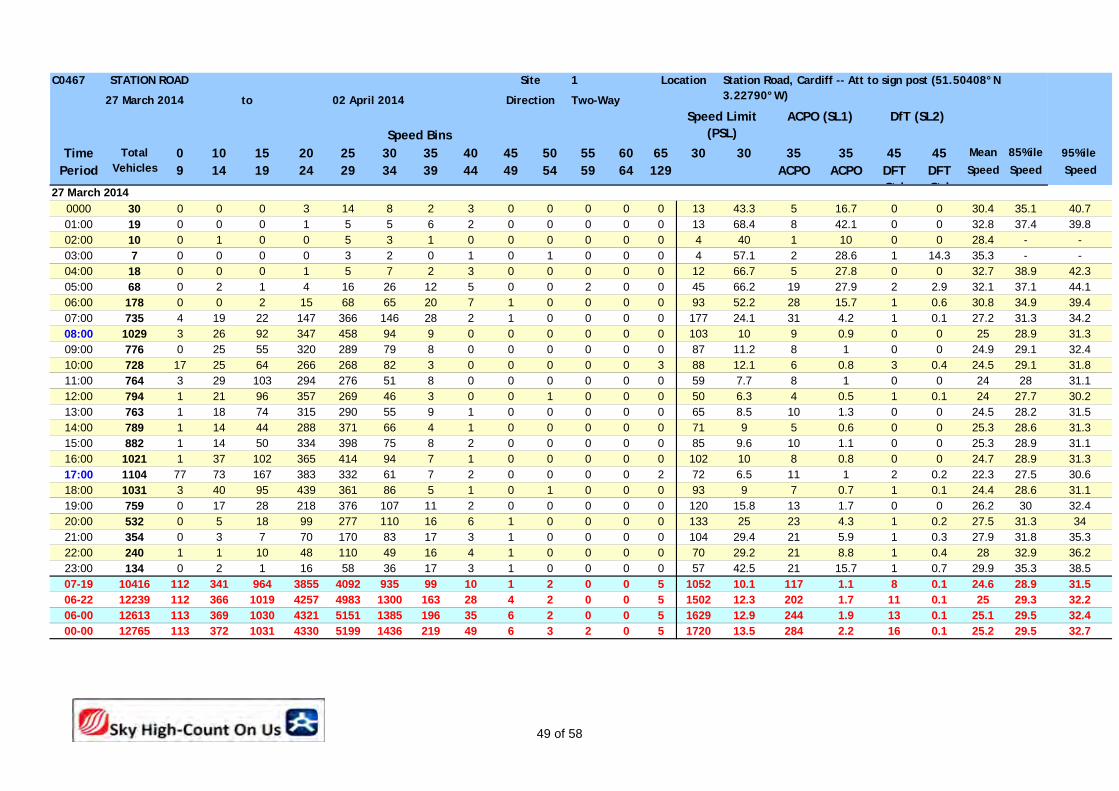
C0467 1
to Two-Way
Speed BinsTime 0 10 15 20 25 30 35 40 45 50 55 60 65 30 30 35 35 45 45
Period 9 14 19 24 29 34 39 44 49 54 59 64 129 ACPO ACPO DFT Std
DFT Std
Speed Speed Speed
0000 30 0 0 0 3 14 8 2 3 0 0 0 0 0 13 43.3 5 16.7 0 0 30.4 35.1 40.701:00 19 0 0 0 1 5 5 6 2 0 0 0 0 0 13 68.4 8 42.1 0 0 32.8 37.4 39.802:00 10 0 1 0 0 5 3 1 0 0 0 0 0 0 4 40 1 10 0 0 28.4 - -03:00 7 0 0 0 0 3 2 0 1 0 1 0 0 0 4 57.1 2 28.6 1 14.3 35.3 - -04:00 18 0 0 0 1 5 7 2 3 0 0 0 0 0 12 66.7 5 27.8 0 0 32.7 38.9 42.305:00 68 0 2 1 4 16 26 12 5 0 0 2 0 0 45 66.2 19 27.9 2 2.9 32.1 37.1 44.106:00 178 0 0 2 15 68 65 20 7 1 0 0 0 0 93 52.2 28 15.7 1 0.6 30.8 34.9 39.407:00 735 4 19 22 147 366 146 28 2 1 0 0 0 0 177 24.1 31 4.2 1 0.1 27.2 31.3 34.208:00 1029 3 26 92 347 458 94 9 0 0 0 0 0 0 103 10 9 0.9 0 0 25 28.9 31.309:00 776 0 25 55 320 289 79 8 0 0 0 0 0 0 87 11.2 8 1 0 0 24.9 29.1 32.410:00 728 17 25 64 266 268 82 3 0 0 0 0 0 3 88 12.1 6 0.8 3 0.4 24.5 29.1 31.811:00 764 3 29 103 294 276 51 8 0 0 0 0 0 0 59 7.7 8 1 0 0 24 28 31.112:00 794 1 21 96 357 269 46 3 0 0 1 0 0 0 50 6.3 4 0.5 1 0.1 24 27.7 30.213:00 763 1 18 74 315 290 55 9 1 0 0 0 0 0 65 8.5 10 1.3 0 0 24.5 28.2 31.514:00 789 1 14 44 288 371 66 4 1 0 0 0 0 0 71 9 5 0.6 0 0 25.3 28.6 31.315:00 882 1 14 50 334 398 75 8 2 0 0 0 0 0 85 9.6 10 1.1 0 0 25.3 28.9 31.116:00 1021 1 37 102 365 414 94 7 1 0 0 0 0 0 102 10 8 0.8 0 0 24.7 28.9 31.317:00 1104 77 73 167 383 332 61 7 2 0 0 0 0 2 72 6.5 11 1 2 0.2 22.3 27.5 30.618:00 1031 3 40 95 439 361 86 5 1 0 1 0 0 0 93 9 7 0.7 1 0.1 24.4 28.6 31.119:00 759 0 17 28 218 376 107 11 2 0 0 0 0 0 120 15.8 13 1.7 0 0 26.2 30 32.420:00 532 0 5 18 99 277 110 16 6 1 0 0 0 0 133 25 23 4.3 1 0.2 27.5 31.3 3421:00 354 0 3 7 70 170 83 17 3 1 0 0 0 0 104 29.4 21 5.9 1 0.3 27.9 31.8 35.322:00 240 1 1 10 48 110 49 16 4 1 0 0 0 0 70 29.2 21 8.8 1 0.4 28 32.9 36.223:00 134 0 2 1 16 58 36 17 3 1 0 0 0 0 57 42.5 21 15.7 1 0.7 29.9 35.3 38.507-19 10416 112 341 964 3855 4092 935 99 10 1 2 0 0 5 1052 10.1 117 1.1 8 0.1 24.6 28.9 31.506-22 12239 112 366 1019 4257 4983 1300 163 28 4 2 0 0 5 1502 12.3 202 1.7 11 0.1 25 29.3 32.206-00 12613 113 369 1030 4321 5151 1385 196 35 6 2 0 0 5 1629 12.9 244 1.9 13 0.1 25.1 29.5 32.400-00 12765 113 372 1031 4330 5199 1436 219 49 6 3 2 0 5 1720 13.5 284 2.2 16 0.1 25.2 29.5 32.7
95%ile
Speed Limit (PSL)
ACPO (SL1)
STATION ROAD Site Location Station Road, Cardiff -- Att to sign post (51.50408°N 3.22790°W)27 March 2014 02 April 2014 Direction
DfT (SL2)
Mean 85%ileTotal Vehicles
27 March 2014
49 of 58
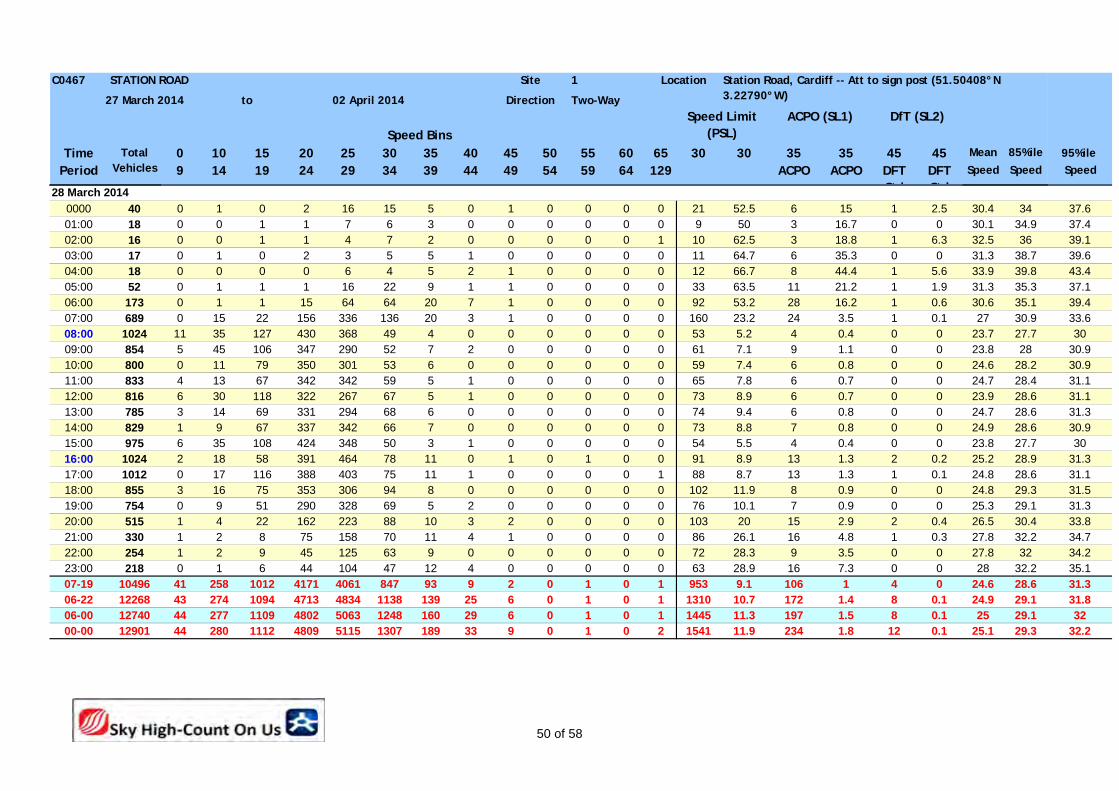
C0467 1
to Two-Way
Speed BinsTime 0 10 15 20 25 30 35 40 45 50 55 60 65 30 30 35 35 45 45
Period 9 14 19 24 29 34 39 44 49 54 59 64 129 ACPO ACPO DFT Std
DFT Std
Speed Speed Speed95%ile
Speed Limit (PSL)
ACPO (SL1)
STATION ROAD Site Location Station Road, Cardiff -- Att to sign post (51.50408°N 3.22790°W)27 March 2014 02 April 2014 Direction
DfT (SL2)
Mean 85%ileTotal Vehicles
0000 40 0 1 0 2 16 15 5 0 1 0 0 0 0 21 52.5 6 15 1 2.5 30.4 34 37.601:00 18 0 0 1 1 7 6 3 0 0 0 0 0 0 9 50 3 16.7 0 0 30.1 34.9 37.402:00 16 0 0 1 1 4 7 2 0 0 0 0 0 1 10 62.5 3 18.8 1 6.3 32.5 36 39.103:00 17 0 1 0 2 3 5 5 1 0 0 0 0 0 11 64.7 6 35.3 0 0 31.3 38.7 39.604:00 18 0 0 0 0 6 4 5 2 1 0 0 0 0 12 66.7 8 44.4 1 5.6 33.9 39.8 43.405:00 52 0 1 1 1 16 22 9 1 1 0 0 0 0 33 63.5 11 21.2 1 1.9 31.3 35.3 37.106:00 173 0 1 1 15 64 64 20 7 1 0 0 0 0 92 53.2 28 16.2 1 0.6 30.6 35.1 39.407:00 689 0 15 22 156 336 136 20 3 1 0 0 0 0 160 23.2 24 3.5 1 0.1 27 30.9 33.608:00 1024 11 35 127 430 368 49 4 0 0 0 0 0 0 53 5.2 4 0.4 0 0 23.7 27.7 3009:00 854 5 45 106 347 290 52 7 2 0 0 0 0 0 61 7.1 9 1.1 0 0 23.8 28 30.910:00 800 0 11 79 350 301 53 6 0 0 0 0 0 0 59 7.4 6 0.8 0 0 24.6 28.2 30.911:00 833 4 13 67 342 342 59 5 1 0 0 0 0 0 65 7.8 6 0.7 0 0 24.7 28.4 31.112:00 816 6 30 118 322 267 67 5 1 0 0 0 0 0 73 8.9 6 0.7 0 0 23.9 28.6 31.113:00 785 3 14 69 331 294 68 6 0 0 0 0 0 0 74 9.4 6 0.8 0 0 24.7 28.6 31.314:00 829 1 9 67 337 342 66 7 0 0 0 0 0 0 73 8.8 7 0.8 0 0 24.9 28.6 30.915:00 975 6 35 108 424 348 50 3 1 0 0 0 0 0 54 5.5 4 0.4 0 0 23.8 27.7 3016:00 1024 2 18 58 391 464 78 11 0 1 0 1 0 0 91 8.9 13 1.3 2 0.2 25.2 28.9 31.317:00 1012 0 17 116 388 403 75 11 1 0 0 0 0 1 88 8.7 13 1.3 1 0.1 24.8 28.6 31.118:00 855 3 16 75 353 306 94 8 0 0 0 0 0 0 102 11.9 8 0.9 0 0 24.8 29.3 31.519:00 754 0 9 51 290 328 69 5 2 0 0 0 0 0 76 10.1 7 0.9 0 0 25.3 29.1 31.320:00 515 1 4 22 162 223 88 10 3 2 0 0 0 0 103 20 15 2.9 2 0.4 26.5 30.4 33.821:00 330 1 2 8 75 158 70 11 4 1 0 0 0 0 86 26.1 16 4.8 1 0.3 27.8 32.2 34.722:00 254 1 2 9 45 125 63 9 0 0 0 0 0 0 72 28.3 9 3.5 0 0 27.8 32 34.223:00 218 0 1 6 44 104 47 12 4 0 0 0 0 0 63 28.9 16 7.3 0 0 28 32.2 35.107-19 10496 41 258 1012 4171 4061 847 93 9 2 0 1 0 1 953 9.1 106 1 4 0 24.6 28.6 31.306-22 12268 43 274 1094 4713 4834 1138 139 25 6 0 1 0 1 1310 10.7 172 1.4 8 0.1 24.9 29.1 31.806-00 12740 44 277 1109 4802 5063 1248 160 29 6 0 1 0 1 1445 11.3 197 1.5 8 0.1 25 29.1 3200-00 12901 44 280 1112 4809 5115 1307 189 33 9 0 1 0 2 1541 11.9 234 1.8 12 0.1 25.1 29.3 32.2
28 March 2014
50 of 58
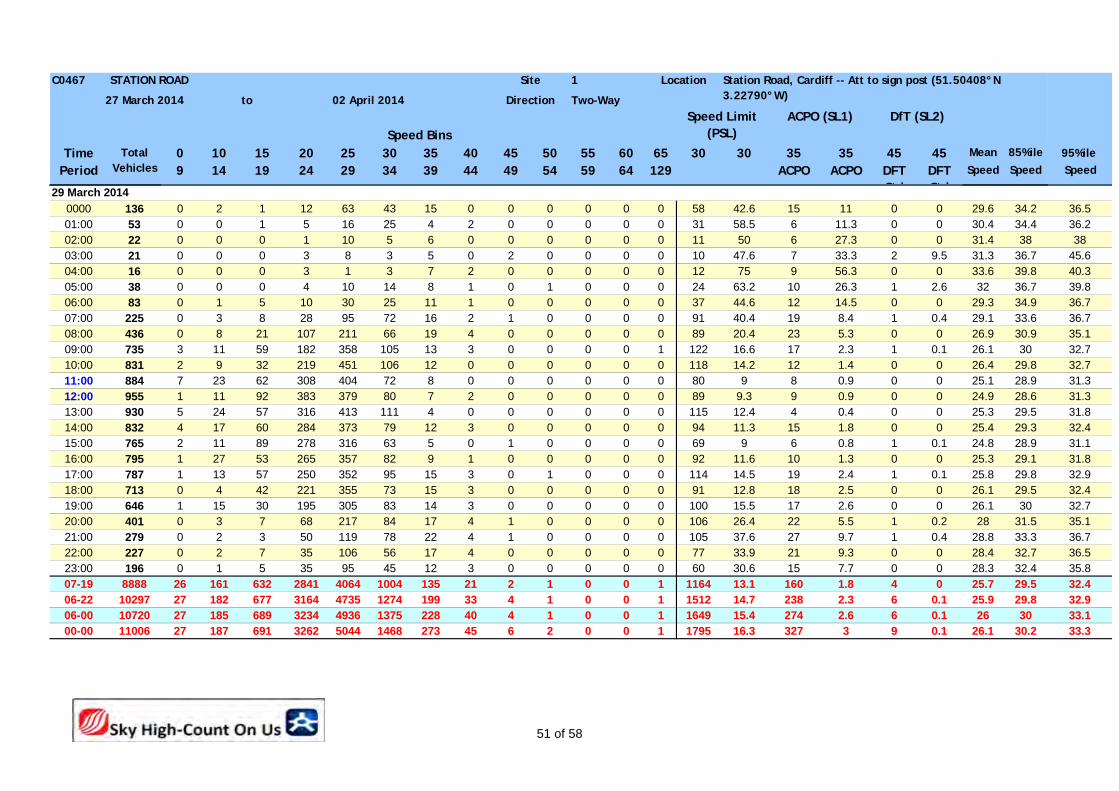
C0467 1
to Two-Way
Speed BinsTime 0 10 15 20 25 30 35 40 45 50 55 60 65 30 30 35 35 45 45
Period 9 14 19 24 29 34 39 44 49 54 59 64 129 ACPO ACPO DFT Std
DFT Std
Speed Speed Speed95%ile
Speed Limit (PSL)
ACPO (SL1)
STATION ROAD Site Location Station Road, Cardiff -- Att to sign post (51.50408°N 3.22790°W)27 March 2014 02 April 2014 Direction
DfT (SL2)
Mean 85%ileTotal Vehicles
0000 136 0 2 1 12 63 43 15 0 0 0 0 0 0 58 42.6 15 11 0 0 29.6 34.2 36.501:00 53 0 0 1 5 16 25 4 2 0 0 0 0 0 31 58.5 6 11.3 0 0 30.4 34.4 36.202:00 22 0 0 0 1 10 5 6 0 0 0 0 0 0 11 50 6 27.3 0 0 31.4 38 3803:00 21 0 0 0 3 8 3 5 0 2 0 0 0 0 10 47.6 7 33.3 2 9.5 31.3 36.7 45.604:00 16 0 0 0 3 1 3 7 2 0 0 0 0 0 12 75 9 56.3 0 0 33.6 39.8 40.305:00 38 0 0 0 4 10 14 8 1 0 1 0 0 0 24 63.2 10 26.3 1 2.6 32 36.7 39.806:00 83 0 1 5 10 30 25 11 1 0 0 0 0 0 37 44.6 12 14.5 0 0 29.3 34.9 36.707:00 225 0 3 8 28 95 72 16 2 1 0 0 0 0 91 40.4 19 8.4 1 0.4 29.1 33.6 36.708:00 436 0 8 21 107 211 66 19 4 0 0 0 0 0 89 20.4 23 5.3 0 0 26.9 30.9 35.109:00 735 3 11 59 182 358 105 13 3 0 0 0 0 1 122 16.6 17 2.3 1 0.1 26.1 30 32.710:00 831 2 9 32 219 451 106 12 0 0 0 0 0 0 118 14.2 12 1.4 0 0 26.4 29.8 32.711:00 884 7 23 62 308 404 72 8 0 0 0 0 0 0 80 9 8 0.9 0 0 25.1 28.9 31.312:00 955 1 11 92 383 379 80 7 2 0 0 0 0 0 89 9.3 9 0.9 0 0 24.9 28.6 31.313:00 930 5 24 57 316 413 111 4 0 0 0 0 0 0 115 12.4 4 0.4 0 0 25.3 29.5 31.814:00 832 4 17 60 284 373 79 12 3 0 0 0 0 0 94 11.3 15 1.8 0 0 25.4 29.3 32.415:00 765 2 11 89 278 316 63 5 0 1 0 0 0 0 69 9 6 0.8 1 0.1 24.8 28.9 31.116:00 795 1 27 53 265 357 82 9 1 0 0 0 0 0 92 11.6 10 1.3 0 0 25.3 29.1 31.817:00 787 1 13 57 250 352 95 15 3 0 1 0 0 0 114 14.5 19 2.4 1 0.1 25.8 29.8 32.918:00 713 0 4 42 221 355 73 15 3 0 0 0 0 0 91 12.8 18 2.5 0 0 26.1 29.5 32.419:00 646 1 15 30 195 305 83 14 3 0 0 0 0 0 100 15.5 17 2.6 0 0 26.1 30 32.720:00 401 0 3 7 68 217 84 17 4 1 0 0 0 0 106 26.4 22 5.5 1 0.2 28 31.5 35.121:00 279 0 2 3 50 119 78 22 4 1 0 0 0 0 105 37.6 27 9.7 1 0.4 28.8 33.3 36.722:00 227 0 2 7 35 106 56 17 4 0 0 0 0 0 77 33.9 21 9.3 0 0 28.4 32.7 36.523:00 196 0 1 5 35 95 45 12 3 0 0 0 0 0 60 30.6 15 7.7 0 0 28.3 32.4 35.807-19 8888 26 161 632 2841 4064 1004 135 21 2 1 0 0 1 1164 13.1 160 1.8 4 0 25.7 29.5 32.406-22 10297 27 182 677 3164 4735 1274 199 33 4 1 0 0 1 1512 14.7 238 2.3 6 0.1 25.9 29.8 32.906-00 10720 27 185 689 3234 4936 1375 228 40 4 1 0 0 1 1649 15.4 274 2.6 6 0.1 26 30 33.100-00 11006 27 187 691 3262 5044 1468 273 45 6 2 0 0 1 1795 16.3 327 3 9 0.1 26.1 30.2 33.3
29 March 2014
51 of 58
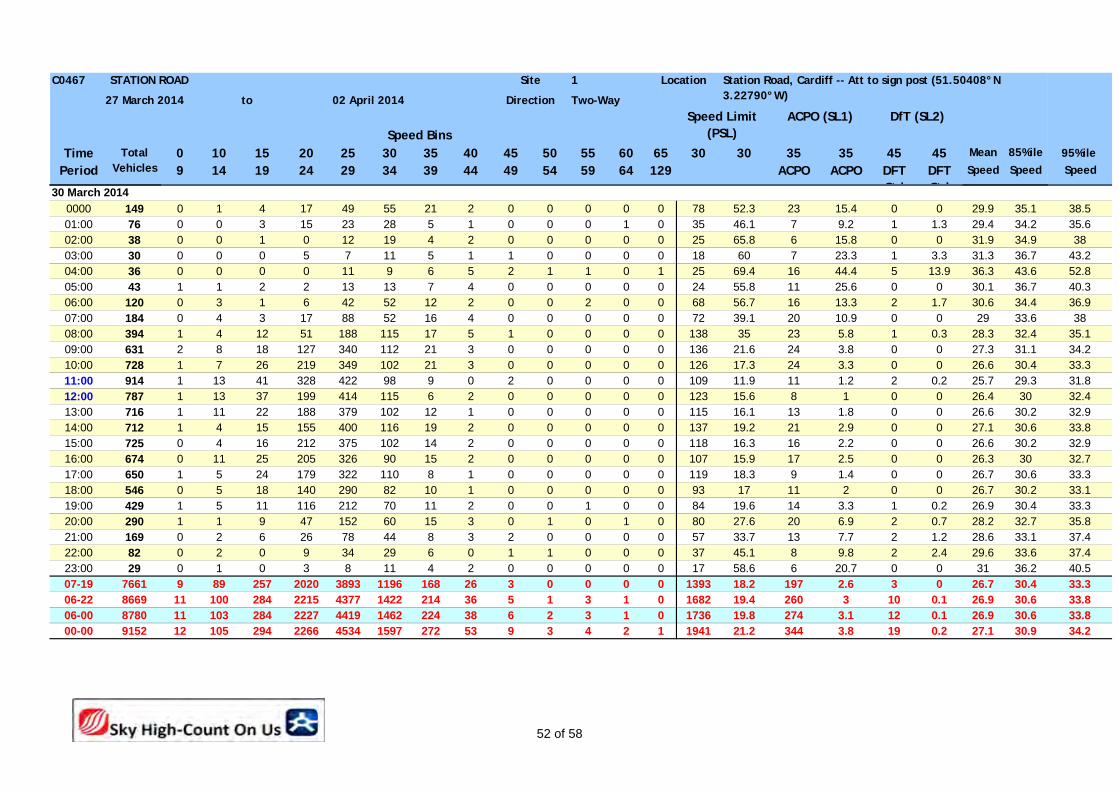
C0467 1
to Two-Way
Speed BinsTime 0 10 15 20 25 30 35 40 45 50 55 60 65 30 30 35 35 45 45
Period 9 14 19 24 29 34 39 44 49 54 59 64 129 ACPO ACPO DFT Std
DFT Std
Speed Speed Speed95%ile
Speed Limit (PSL)
ACPO (SL1)
STATION ROAD Site Location Station Road, Cardiff -- Att to sign post (51.50408°N 3.22790°W)27 March 2014 02 April 2014 Direction
DfT (SL2)
Mean 85%ileTotal Vehicles
0000 149 0 1 4 17 49 55 21 2 0 0 0 0 0 78 52.3 23 15.4 0 0 29.9 35.1 38.501:00 76 0 0 3 15 23 28 5 1 0 0 0 1 0 35 46.1 7 9.2 1 1.3 29.4 34.2 35.602:00 38 0 0 1 0 12 19 4 2 0 0 0 0 0 25 65.8 6 15.8 0 0 31.9 34.9 3803:00 30 0 0 0 5 7 11 5 1 1 0 0 0 0 18 60 7 23.3 1 3.3 31.3 36.7 43.204:00 36 0 0 0 0 11 9 6 5 2 1 1 0 1 25 69.4 16 44.4 5 13.9 36.3 43.6 52.805:00 43 1 1 2 2 13 13 7 4 0 0 0 0 0 24 55.8 11 25.6 0 0 30.1 36.7 40.306:00 120 0 3 1 6 42 52 12 2 0 0 2 0 0 68 56.7 16 13.3 2 1.7 30.6 34.4 36.907:00 184 0 4 3 17 88 52 16 4 0 0 0 0 0 72 39.1 20 10.9 0 0 29 33.6 3808:00 394 1 4 12 51 188 115 17 5 1 0 0 0 0 138 35 23 5.8 1 0.3 28.3 32.4 35.109:00 631 2 8 18 127 340 112 21 3 0 0 0 0 0 136 21.6 24 3.8 0 0 27.3 31.1 34.210:00 728 1 7 26 219 349 102 21 3 0 0 0 0 0 126 17.3 24 3.3 0 0 26.6 30.4 33.311:00 914 1 13 41 328 422 98 9 0 2 0 0 0 0 109 11.9 11 1.2 2 0.2 25.7 29.3 31.812:00 787 1 13 37 199 414 115 6 2 0 0 0 0 0 123 15.6 8 1 0 0 26.4 30 32.413:00 716 1 11 22 188 379 102 12 1 0 0 0 0 0 115 16.1 13 1.8 0 0 26.6 30.2 32.914:00 712 1 4 15 155 400 116 19 2 0 0 0 0 0 137 19.2 21 2.9 0 0 27.1 30.6 33.815:00 725 0 4 16 212 375 102 14 2 0 0 0 0 0 118 16.3 16 2.2 0 0 26.6 30.2 32.916:00 674 0 11 25 205 326 90 15 2 0 0 0 0 0 107 15.9 17 2.5 0 0 26.3 30 32.717:00 650 1 5 24 179 322 110 8 1 0 0 0 0 0 119 18.3 9 1.4 0 0 26.7 30.6 33.318:00 546 0 5 18 140 290 82 10 1 0 0 0 0 0 93 17 11 2 0 0 26.7 30.2 33.119:00 429 1 5 11 116 212 70 11 2 0 0 1 0 0 84 19.6 14 3.3 1 0.2 26.9 30.4 33.320:00 290 1 1 9 47 152 60 15 3 0 1 0 1 0 80 27.6 20 6.9 2 0.7 28.2 32.7 35.821:00 169 0 2 6 26 78 44 8 3 2 0 0 0 0 57 33.7 13 7.7 2 1.2 28.6 33.1 37.422:00 82 0 2 0 9 34 29 6 0 1 1 0 0 0 37 45.1 8 9.8 2 2.4 29.6 33.6 37.423:00 29 0 1 0 3 8 11 4 2 0 0 0 0 0 17 58.6 6 20.7 0 0 31 36.2 40.507-19 7661 9 89 257 2020 3893 1196 168 26 3 0 0 0 0 1393 18.2 197 2.6 3 0 26.7 30.4 33.306-22 8669 11 100 284 2215 4377 1422 214 36 5 1 3 1 0 1682 19.4 260 3 10 0.1 26.9 30.6 33.806-00 8780 11 103 284 2227 4419 1462 224 38 6 2 3 1 0 1736 19.8 274 3.1 12 0.1 26.9 30.6 33.800-00 9152 12 105 294 2266 4534 1597 272 53 9 3 4 2 1 1941 21.2 344 3.8 19 0.2 27.1 30.9 34.2
30 March 2014
52 of 58
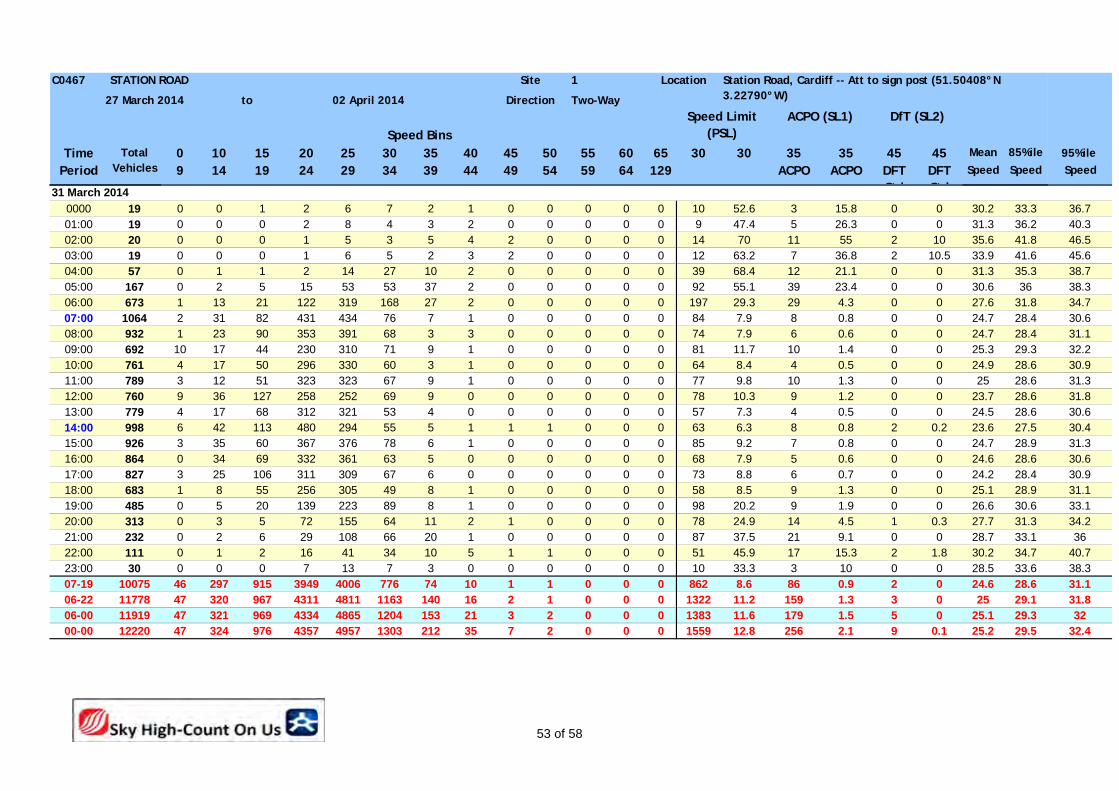
C0467 1
to Two-Way
Speed BinsTime 0 10 15 20 25 30 35 40 45 50 55 60 65 30 30 35 35 45 45
Period 9 14 19 24 29 34 39 44 49 54 59 64 129 ACPO ACPO DFT Std
DFT Std
Speed Speed Speed95%ile
Speed Limit (PSL)
ACPO (SL1)
STATION ROAD Site Location Station Road, Cardiff -- Att to sign post (51.50408°N 3.22790°W)27 March 2014 02 April 2014 Direction
DfT (SL2)
Mean 85%ileTotal Vehicles
0000 19 0 0 1 2 6 7 2 1 0 0 0 0 0 10 52.6 3 15.8 0 0 30.2 33.3 36.701:00 19 0 0 0 2 8 4 3 2 0 0 0 0 0 9 47.4 5 26.3 0 0 31.3 36.2 40.302:00 20 0 0 0 1 5 3 5 4 2 0 0 0 0 14 70 11 55 2 10 35.6 41.8 46.503:00 19 0 0 0 1 6 5 2 3 2 0 0 0 0 12 63.2 7 36.8 2 10.5 33.9 41.6 45.604:00 57 0 1 1 2 14 27 10 2 0 0 0 0 0 39 68.4 12 21.1 0 0 31.3 35.3 38.705:00 167 0 2 5 15 53 53 37 2 0 0 0 0 0 92 55.1 39 23.4 0 0 30.6 36 38.306:00 673 1 13 21 122 319 168 27 2 0 0 0 0 0 197 29.3 29 4.3 0 0 27.6 31.8 34.707:00 1064 2 31 82 431 434 76 7 1 0 0 0 0 0 84 7.9 8 0.8 0 0 24.7 28.4 30.608:00 932 1 23 90 353 391 68 3 3 0 0 0 0 0 74 7.9 6 0.6 0 0 24.7 28.4 31.109:00 692 10 17 44 230 310 71 9 1 0 0 0 0 0 81 11.7 10 1.4 0 0 25.3 29.3 32.210:00 761 4 17 50 296 330 60 3 1 0 0 0 0 0 64 8.4 4 0.5 0 0 24.9 28.6 30.911:00 789 3 12 51 323 323 67 9 1 0 0 0 0 0 77 9.8 10 1.3 0 0 25 28.6 31.312:00 760 9 36 127 258 252 69 9 0 0 0 0 0 0 78 10.3 9 1.2 0 0 23.7 28.6 31.813:00 779 4 17 68 312 321 53 4 0 0 0 0 0 0 57 7.3 4 0.5 0 0 24.5 28.6 30.614:00 998 6 42 113 480 294 55 5 1 1 1 0 0 0 63 6.3 8 0.8 2 0.2 23.6 27.5 30.415:00 926 3 35 60 367 376 78 6 1 0 0 0 0 0 85 9.2 7 0.8 0 0 24.7 28.9 31.316:00 864 0 34 69 332 361 63 5 0 0 0 0 0 0 68 7.9 5 0.6 0 0 24.6 28.6 30.617:00 827 3 25 106 311 309 67 6 0 0 0 0 0 0 73 8.8 6 0.7 0 0 24.2 28.4 30.918:00 683 1 8 55 256 305 49 8 1 0 0 0 0 0 58 8.5 9 1.3 0 0 25.1 28.9 31.119:00 485 0 5 20 139 223 89 8 1 0 0 0 0 0 98 20.2 9 1.9 0 0 26.6 30.6 33.120:00 313 0 3 5 72 155 64 11 2 1 0 0 0 0 78 24.9 14 4.5 1 0.3 27.7 31.3 34.221:00 232 0 2 6 29 108 66 20 1 0 0 0 0 0 87 37.5 21 9.1 0 0 28.7 33.1 3622:00 111 0 1 2 16 41 34 10 5 1 1 0 0 0 51 45.9 17 15.3 2 1.8 30.2 34.7 40.723:00 30 0 0 0 7 13 7 3 0 0 0 0 0 0 10 33.3 3 10 0 0 28.5 33.6 38.307-19 10075 46 297 915 3949 4006 776 74 10 1 1 0 0 0 862 8.6 86 0.9 2 0 24.6 28.6 31.106-22 11778 47 320 967 4311 4811 1163 140 16 2 1 0 0 0 1322 11.2 159 1.3 3 0 25 29.1 31.806-00 11919 47 321 969 4334 4865 1204 153 21 3 2 0 0 0 1383 11.6 179 1.5 5 0 25.1 29.3 3200-00 12220 47 324 976 4357 4957 1303 212 35 7 2 0 0 0 1559 12.8 256 2.1 9 0.1 25.2 29.5 32.4
31 March 2014
53 of 58

C0467 1
to Two-Way
Speed BinsTime 0 10 15 20 25 30 35 40 45 50 55 60 65 30 30 35 35 45 45
Period 9 14 19 24 29 34 39 44 49 54 59 64 129 ACPO ACPO DFT Std
DFT Std
Speed Speed Speed95%ile
Speed Limit (PSL)
ACPO (SL1)
STATION ROAD Site Location Station Road, Cardiff -- Att to sign post (51.50408°N 3.22790°W)27 March 2014 02 April 2014 Direction
DfT (SL2)
Mean 85%ileTotal Vehicles
0000 20 0 0 2 3 4 6 3 2 0 0 0 0 0 11 55 5 25 0 0 30.1 38 40.901:00 7 1 0 1 0 0 4 0 0 1 0 0 0 0 5 71.4 1 14.3 1 14.3 29.1 - -02:00 11 0 0 0 1 3 3 2 2 0 0 0 0 0 7 63.6 4 36.4 0 0 32.8 39.6 40.303:00 16 0 0 0 2 4 4 4 0 2 0 0 0 0 10 62.5 6 37.5 2 12.5 33.3 39.1 47.604:00 64 1 2 2 1 20 26 6 5 0 1 0 0 0 38 59.4 12 18.8 1 1.6 30.7 35.6 42.305:00 169 0 1 4 30 58 51 21 4 0 0 0 0 0 76 45 25 14.8 0 0 29.5 34.7 38.706:00 748 5 27 57 164 332 132 26 5 0 0 0 0 0 163 21.8 31 4.1 0 0 26.3 30.9 34.407:00 1019 1 17 102 415 393 79 10 2 0 0 0 0 0 91 8.9 12 1.2 0 0 24.7 28.9 31.108:00 875 2 30 76 296 370 87 12 2 0 0 0 0 0 101 11.5 14 1.6 0 0 25.1 29.3 31.809:00 755 7 28 62 290 291 69 7 1 0 0 0 0 0 77 10.2 8 1.1 0 0 24.6 28.9 32.210:00 744 7 15 53 280 317 65 7 0 0 0 0 0 0 72 9.7 7 0.9 0 0 24.9 29.1 31.511:00 811 5 28 55 314 334 68 6 1 0 0 0 0 0 75 9.2 7 0.9 0 0 24.8 29.1 31.112:00 787 3 17 70 313 304 71 7 1 0 0 1 0 0 80 10.2 9 1.1 1 0.1 24.8 28.9 3213:00 770 6 24 54 244 343 84 15 0 0 0 0 0 0 99 12.9 15 1.9 0 0 25.3 29.5 32.214:00 919 1 25 65 336 381 100 8 3 0 0 0 0 0 111 12.1 11 1.2 0 0 25.1 29.3 31.515:00 971 7 37 103 378 370 66 9 1 0 0 0 0 0 76 7.8 10 1 0 0 24.1 28.4 30.916:00 986 5 36 105 351 400 81 8 0 0 0 0 0 0 89 9 8 0.8 0 0 24.5 28.6 31.317:00 909 2 21 55 296 429 96 8 2 0 0 0 0 0 106 11.7 10 1.1 0 0 25.5 29.3 31.818:00 768 0 12 51 273 324 92 14 1 1 0 0 0 0 108 14.1 16 2.1 1 0.1 25.7 29.5 32.719:00 508 1 7 21 131 236 94 14 4 0 0 0 0 0 112 22 18 3.5 0 0 26.9 31.3 3420:00 326 1 7 8 65 157 76 9 3 0 0 0 0 0 88 27 12 3.7 0 0 27.5 31.3 34.221:00 260 0 1 5 49 126 59 19 0 1 0 0 0 0 79 30.4 20 7.7 1 0.4 28.2 32.4 3622:00 106 0 1 2 13 37 33 15 5 0 0 0 0 0 53 50 20 18.9 0 0 30 35.6 39.623:00 42 0 0 0 7 18 12 5 0 0 0 0 0 0 17 40.5 5 11.9 0 0 29.1 33.1 35.607-19 10314 46 290 851 3786 4256 958 111 14 1 0 1 0 0 1085 10.5 127 1.2 2 0 24.9 29.1 31.506-22 12156 53 332 942 4195 5107 1319 179 26 2 0 1 0 0 1527 12.6 208 1.7 3 0 25.2 29.3 32.206-00 12304 53 333 944 4215 5162 1364 199 31 2 0 1 0 0 1597 13 233 1.9 3 0 25.3 29.5 32.400-00 12591 55 336 953 4252 5251 1458 235 44 5 1 1 0 0 1744 13.9 286 2.3 7 0.1 25.4 29.8 32.7
01 April 2014
54 of 58
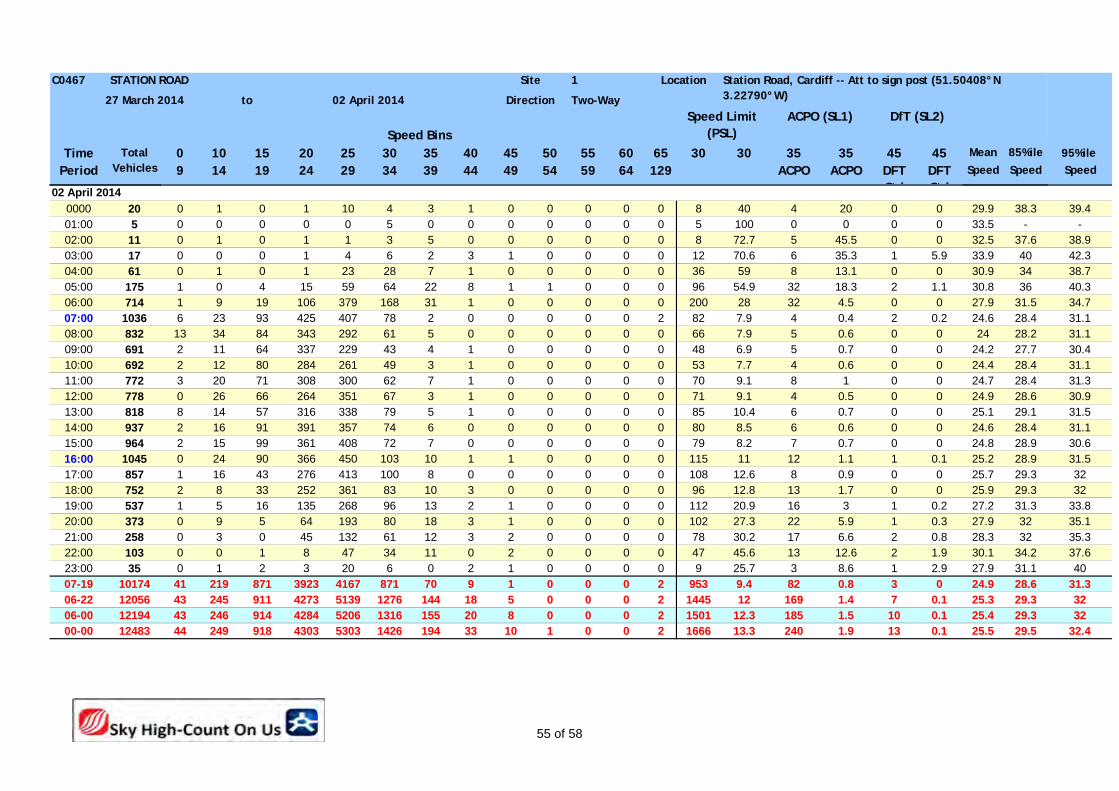
C0467 1
to Two-Way
Speed BinsTime 0 10 15 20 25 30 35 40 45 50 55 60 65 30 30 35 35 45 45
Period 9 14 19 24 29 34 39 44 49 54 59 64 129 ACPO ACPO DFT Std
DFT Std
Speed Speed Speed95%ile
Speed Limit (PSL)
ACPO (SL1)
STATION ROAD Site Location Station Road, Cardiff -- Att to sign post (51.50408°N 3.22790°W)27 March 2014 02 April 2014 Direction
DfT (SL2)
Mean 85%ileTotal Vehicles
0000 20 0 1 0 1 10 4 3 1 0 0 0 0 0 8 40 4 20 0 0 29.9 38.3 39.401:00 5 0 0 0 0 0 5 0 0 0 0 0 0 0 5 100 0 0 0 0 33.5 - -02:00 11 0 1 0 1 1 3 5 0 0 0 0 0 0 8 72.7 5 45.5 0 0 32.5 37.6 38.903:00 17 0 0 0 1 4 6 2 3 1 0 0 0 0 12 70.6 6 35.3 1 5.9 33.9 40 42.304:00 61 0 1 0 1 23 28 7 1 0 0 0 0 0 36 59 8 13.1 0 0 30.9 34 38.705:00 175 1 0 4 15 59 64 22 8 1 1 0 0 0 96 54.9 32 18.3 2 1.1 30.8 36 40.306:00 714 1 9 19 106 379 168 31 1 0 0 0 0 0 200 28 32 4.5 0 0 27.9 31.5 34.707:00 1036 6 23 93 425 407 78 2 0 0 0 0 0 2 82 7.9 4 0.4 2 0.2 24.6 28.4 31.108:00 832 13 34 84 343 292 61 5 0 0 0 0 0 0 66 7.9 5 0.6 0 0 24 28.2 31.109:00 691 2 11 64 337 229 43 4 1 0 0 0 0 0 48 6.9 5 0.7 0 0 24.2 27.7 30.410:00 692 2 12 80 284 261 49 3 1 0 0 0 0 0 53 7.7 4 0.6 0 0 24.4 28.4 31.111:00 772 3 20 71 308 300 62 7 1 0 0 0 0 0 70 9.1 8 1 0 0 24.7 28.4 31.312:00 778 0 26 66 264 351 67 3 1 0 0 0 0 0 71 9.1 4 0.5 0 0 24.9 28.6 30.913:00 818 8 14 57 316 338 79 5 1 0 0 0 0 0 85 10.4 6 0.7 0 0 25.1 29.1 31.514:00 937 2 16 91 391 357 74 6 0 0 0 0 0 0 80 8.5 6 0.6 0 0 24.6 28.4 31.115:00 964 2 15 99 361 408 72 7 0 0 0 0 0 0 79 8.2 7 0.7 0 0 24.8 28.9 30.616:00 1045 0 24 90 366 450 103 10 1 1 0 0 0 0 115 11 12 1.1 1 0.1 25.2 28.9 31.517:00 857 1 16 43 276 413 100 8 0 0 0 0 0 0 108 12.6 8 0.9 0 0 25.7 29.3 3218:00 752 2 8 33 252 361 83 10 3 0 0 0 0 0 96 12.8 13 1.7 0 0 25.9 29.3 3219:00 537 1 5 16 135 268 96 13 2 1 0 0 0 0 112 20.9 16 3 1 0.2 27.2 31.3 33.820:00 373 0 9 5 64 193 80 18 3 1 0 0 0 0 102 27.3 22 5.9 1 0.3 27.9 32 35.121:00 258 0 3 0 45 132 61 12 3 2 0 0 0 0 78 30.2 17 6.6 2 0.8 28.3 32 35.322:00 103 0 0 1 8 47 34 11 0 2 0 0 0 0 47 45.6 13 12.6 2 1.9 30.1 34.2 37.623:00 35 0 1 2 3 20 6 0 2 1 0 0 0 0 9 25.7 3 8.6 1 2.9 27.9 31.1 4007-19 10174 41 219 871 3923 4167 871 70 9 1 0 0 0 2 953 9.4 82 0.8 3 0 24.9 28.6 31.306-22 12056 43 245 911 4273 5139 1276 144 18 5 0 0 0 2 1445 12 169 1.4 7 0.1 25.3 29.3 3206-00 12194 43 246 914 4284 5206 1316 155 20 8 0 0 0 2 1501 12.3 185 1.5 10 0.1 25.4 29.3 3200-00 12483 44 249 918 4303 5303 1426 194 33 10 1 0 0 2 1666 13.3 240 1.9 13 0.1 25.5 29.5 32.4
02 April 2014
55 of 58
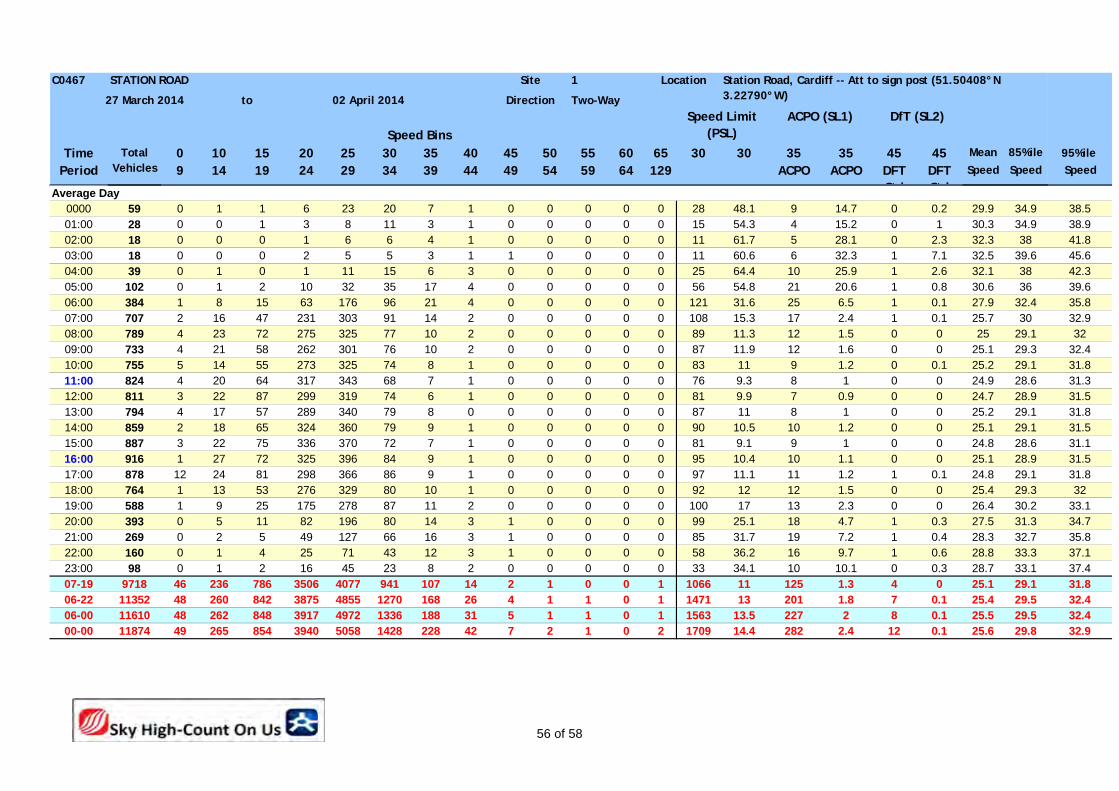
C0467 1
to Two-Way
Speed BinsTime 0 10 15 20 25 30 35 40 45 50 55 60 65 30 30 35 35 45 45
Period 9 14 19 24 29 34 39 44 49 54 59 64 129 ACPO ACPO DFT Std
DFT Std
Speed Speed Speed95%ile
Speed Limit (PSL)
ACPO (SL1)
STATION ROAD Site Location Station Road, Cardiff -- Att to sign post (51.50408°N 3.22790°W)27 March 2014 02 April 2014 Direction
DfT (SL2)
Mean 85%ileTotal Vehicles
Average Day0000 59 0 1 1 6 23 20 7 1 0 0 0 0 0 28 48.1 9 14.7 0 0.2 29.9 34.9 38.501:00 28 0 0 1 3 8 11 3 1 0 0 0 0 0 15 54.3 4 15.2 0 1 30.3 34.9 38.902:00 18 0 0 0 1 6 6 4 1 0 0 0 0 0 11 61.7 5 28.1 0 2.3 32.3 38 41.803:00 18 0 0 0 2 5 5 3 1 1 0 0 0 0 11 60.6 6 32.3 1 7.1 32.5 39.6 45.604:00 39 0 1 0 1 11 15 6 3 0 0 0 0 0 25 64.4 10 25.9 1 2.6 32.1 38 42.305:00 102 0 1 2 10 32 35 17 4 0 0 0 0 0 56 54.8 21 20.6 1 0.8 30.6 36 39.606:00 384 1 8 15 63 176 96 21 4 0 0 0 0 0 121 31.6 25 6.5 1 0.1 27.9 32.4 35.807:00 707 2 16 47 231 303 91 14 2 0 0 0 0 0 108 15.3 17 2.4 1 0.1 25.7 30 32.908:00 789 4 23 72 275 325 77 10 2 0 0 0 0 0 89 11.3 12 1.5 0 0 25 29.1 3209:00 733 4 21 58 262 301 76 10 2 0 0 0 0 0 87 11.9 12 1.6 0 0 25.1 29.3 32.410:00 755 5 14 55 273 325 74 8 1 0 0 0 0 0 83 11 9 1.2 0 0.1 25.2 29.1 31.811:00 824 4 20 64 317 343 68 7 1 0 0 0 0 0 76 9.3 8 1 0 0 24.9 28.6 31.312:00 811 3 22 87 299 319 74 6 1 0 0 0 0 0 81 9.9 7 0.9 0 0 24.7 28.9 31.513:00 794 4 17 57 289 340 79 8 0 0 0 0 0 0 87 11 8 1 0 0 25.2 29.1 31.814:00 859 2 18 65 324 360 79 9 1 0 0 0 0 0 90 10.5 10 1.2 0 0 25.1 29.1 31.515:00 887 3 22 75 336 370 72 7 1 0 0 0 0 0 81 9.1 9 1 0 0 24.8 28.6 31.116:00 916 1 27 72 325 396 84 9 1 0 0 0 0 0 95 10.4 10 1.1 0 0 25.1 28.9 31.517:00 878 12 24 81 298 366 86 9 1 0 0 0 0 0 97 11.1 11 1.2 1 0.1 24.8 29.1 31.818:00 764 1 13 53 276 329 80 10 1 0 0 0 0 0 92 12 12 1.5 0 0 25.4 29.3 3219:00 588 1 9 25 175 278 87 11 2 0 0 0 0 0 100 17 13 2.3 0 0 26.4 30.2 33.120:00 393 0 5 11 82 196 80 14 3 1 0 0 0 0 99 25.1 18 4.7 1 0.3 27.5 31.3 34.721:00 269 0 2 5 49 127 66 16 3 1 0 0 0 0 85 31.7 19 7.2 1 0.4 28.3 32.7 35.822:00 160 0 1 4 25 71 43 12 3 1 0 0 0 0 58 36.2 16 9.7 1 0.6 28.8 33.3 37.123:00 98 0 1 2 16 45 23 8 2 0 0 0 0 0 33 34.1 10 10.1 0 0.3 28.7 33.1 37.407-19 9718 46 236 786 3506 4077 941 107 14 2 1 0 0 1 1066 11 125 1.3 4 0 25.1 29.1 31.806-22 11352 48 260 842 3875 4855 1270 168 26 4 1 1 0 1 1471 13 201 1.8 7 0.1 25.4 29.5 32.406-00 11610 48 262 848 3917 4972 1336 188 31 5 1 1 0 1 1563 13.5 227 2 8 0.1 25.5 29.5 32.400-00 11874 49 265 854 3940 5058 1428 228 42 7 2 1 0 2 1709 14.4 282 2.4 12 0.1 25.6 29.8 32.9
56 of 58
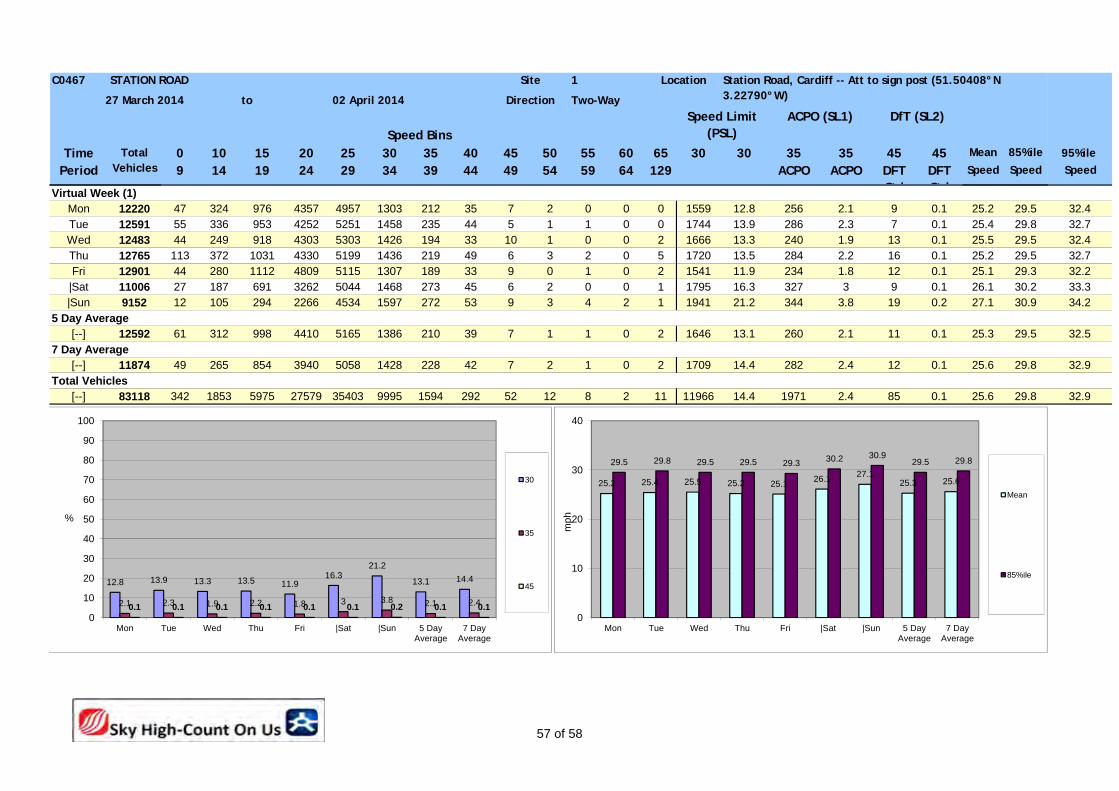
C0467 1
to Two-Way
Speed BinsTime 0 10 15 20 25 30 35 40 45 50 55 60 65 30 30 35 35 45 45
Period 9 14 19 24 29 34 39 44 49 54 59 64 129 ACPO ACPO DFT Std
DFT Std
Speed Speed Speed95%ile
Speed Limit (PSL)
ACPO (SL1)
STATION ROAD Site Location Station Road, Cardiff -- Att to sign post (51.50408°N 3.22790°W)27 March 2014 02 April 2014 Direction
DfT (SL2)
Mean 85%ileTotal Vehicles
Virtual Week (1)Mon 12220 47 324 976 4357 4957 1303 212 35 7 2 0 0 0 1559 12.8 256 2.1 9 0.1 25.2 29.5 32.4Tue 12591 55 336 953 4252 5251 1458 235 44 5 1 1 0 0 1744 13.9 286 2.3 7 0.1 25.4 29.8 32.7Wed 12483 44 249 918 4303 5303 1426 194 33 10 1 0 0 2 1666 13.3 240 1.9 13 0.1 25.5 29.5 32.4Thu 12765 113 372 1031 4330 5199 1436 219 49 6 3 2 0 5 1720 13.5 284 2.2 16 0.1 25.2 29.5 32.7Fri 12901 44 280 1112 4809 5115 1307 189 33 9 0 1 0 2 1541 11.9 234 1.8 12 0.1 25.1 29.3 32.2
|Sat 11006 27 187 691 3262 5044 1468 273 45 6 2 0 0 1 1795 16.3 327 3 9 0.1 26.1 30.2 33.3|Sun 9152 12 105 294 2266 4534 1597 272 53 9 3 4 2 1 1941 21.2 344 3.8 19 0.2 27.1 30.9 34.2
5 Day Average[--] 12592 61 312 998 4410 5165 1386 210 39 7 1 1 0 2 1646 13.1 260 2.1 11 0.1 25.3 29.5 32.5
7 Day Average[--] 11874 49 265 854 3940 5058 1428 228 42 7 2 1 0 2 1709 14.4 282 2.4 12 0.1 25.6 29.8 32.9
Total Vehicles[--] 83118 342 1853 5975 27579 35403 9995 1594 292 52 12 8 2 11 11966 14.4 1971 2.4 85 0.1 25.6 29.8 32.9
12.8 13.9 13.3 13.5 11.916.3
21.2
13.1 14.4
2.1 2.3 1.9 2.2 1.8 3 3.8 2.1 2.40.1 0.1 0.1 0.1 0.1 0.1 0.2 0.1 0.10
10
20
30
40
50
60
70
80
90
100
Mon Tue Wed Thu Fri |Sat |Sun 5 DayAverage
7 DayAverage
%
30
35
45
25.2 25.4 25.5 25.2 25.126.1
27.125.3 25.6
29.5 29.8 29.5 29.5 29.3 30.2 30.929.5 29.8
0
10
20
30
40
Mon Tue Wed Thu Fri |Sat |Sun 5 DayAverage
7 DayAverage
mph
Mean
85%ile
57 of 58
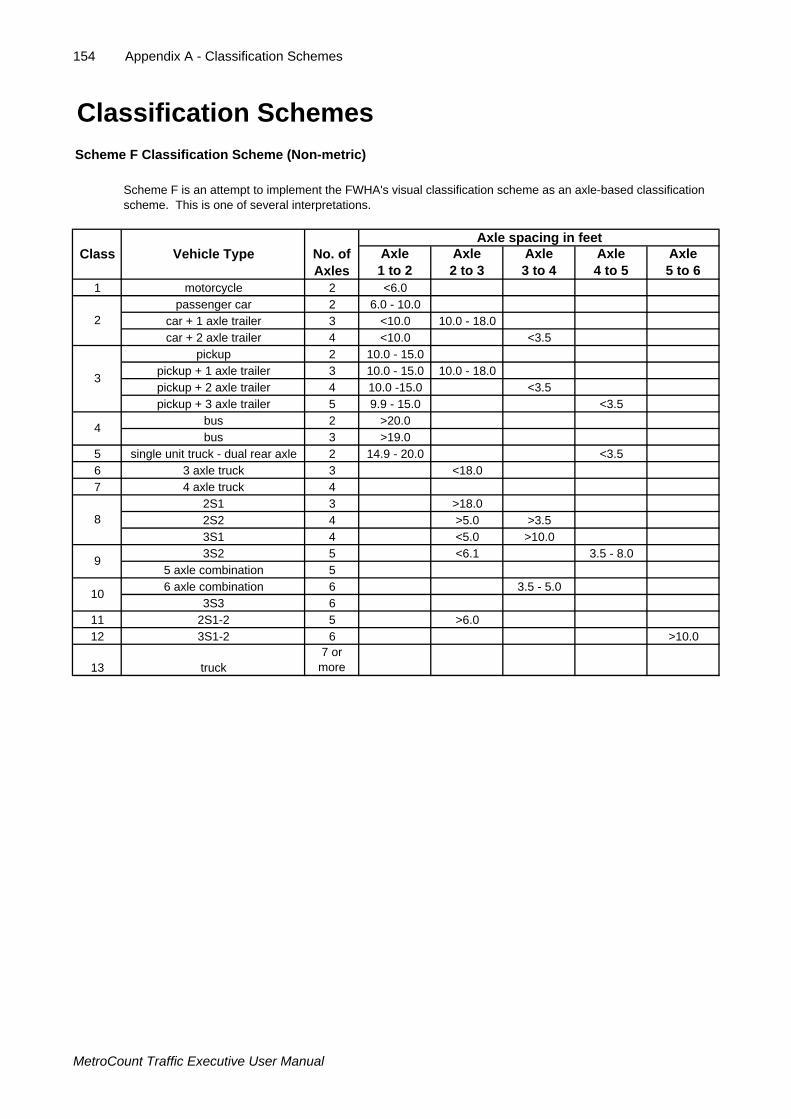
154 Appendix A - Classification Schemes
Classification Schemes
Scheme F Classification Scheme (Non-metric)
Axle spacing in feetAxle 1 to 2
Axle 2 to 3
Axle 3 to 4
Axle 4 to 5
Axle 5 to 6
1 motorcycle 2 <6.0passenger car 2 6.0 - 10.0
car + 1 axle trailer 3 <10.0 10.0 - 18.0car + 2 axle trailer 4 <10.0 <3.5
pickup 2 10.0 - 15.0pickup + 1 axle trailer 3 10.0 - 15.0 10.0 - 18.0pickup + 2 axle trailer 4 10.0 -15.0 <3.5pickup + 3 axle trailer 5 9.9 - 15.0 <3.5
bus 2 >20.0bus 3 >19.0
5 single unit truck - dual rear axle 2 14.9 - 20.0 <3.56 3 axle truck 3 <18.07 4 axle truck 4
2S1 3 >18.02S2 4 >5.0 >3.53S1 4 <5.0 >10.03S2 5 <6.1 3.5 - 8.0
5 axle combination 56 axle combination 6 3.5 - 5.0
3S3 611 2S1-2 5 >6.012 3S1-2 6 >10.0
13 truck7 or
more
Scheme F is an attempt to implement the FWHA's visual classification scheme as an axle-based classification scheme. This is one of several interpretations.
No. of Axles
Vehicle TypeClass
9
10
2
3
4
8
MetroCount Traffic Executive User Manual

APPENDIX D
NTM Traffic Growth
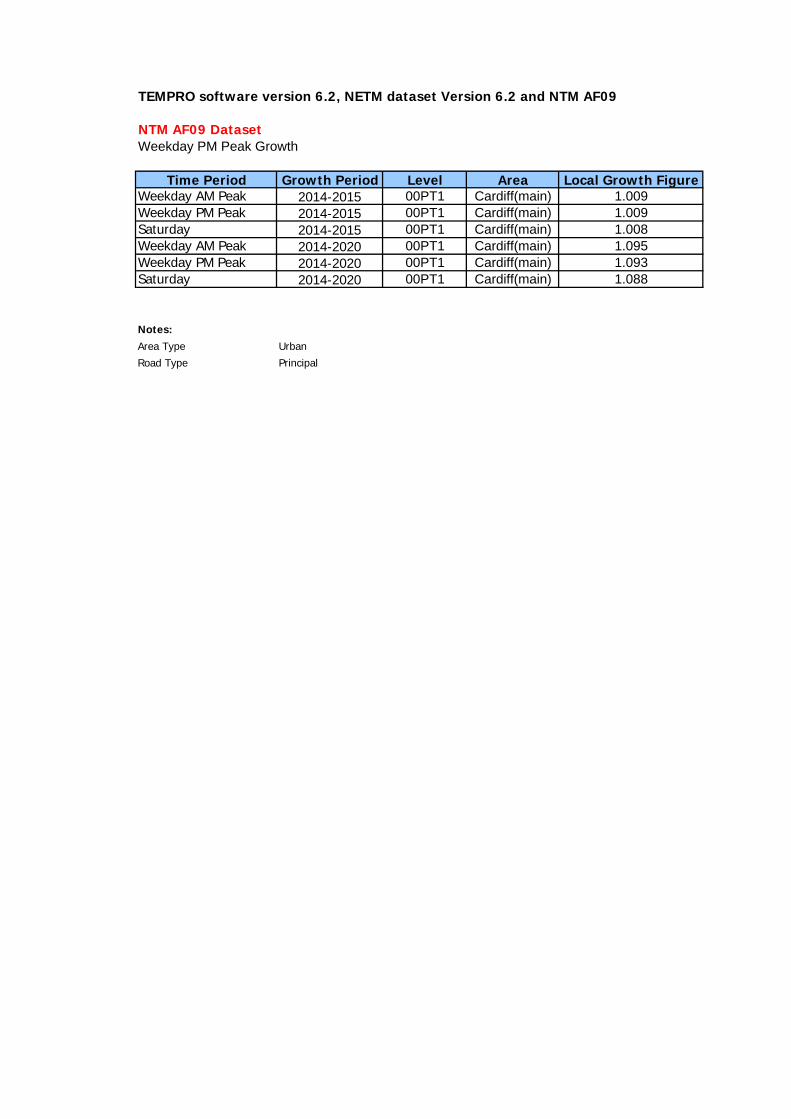
TEMPRO software version 6.2, NETM dataset Version 6.2 and NTM AF09
NTM AF09 DatasetWeekday PM Peak Growth
Time Period Growth Period Level Area Local Growth FigureWeekday AM Peak 2014-2015 00PT1 Cardiff(main) 1.009Weekday PM Peak 2014-2015 00PT1 Cardiff(main) 1.009Saturday 2014-2015 00PT1 Cardiff(main) 1.008Weekday AM Peak 2014-2020 00PT1 Cardiff(main) 1.095Weekday PM Peak 2014-2020 00PT1 Cardiff(main) 1.093Saturday 2014-2020 00PT1 Cardiff(main) 1.088
Notes:Area Type Urban
Road Type Principal

APPENDIX E
TRICS Outputs
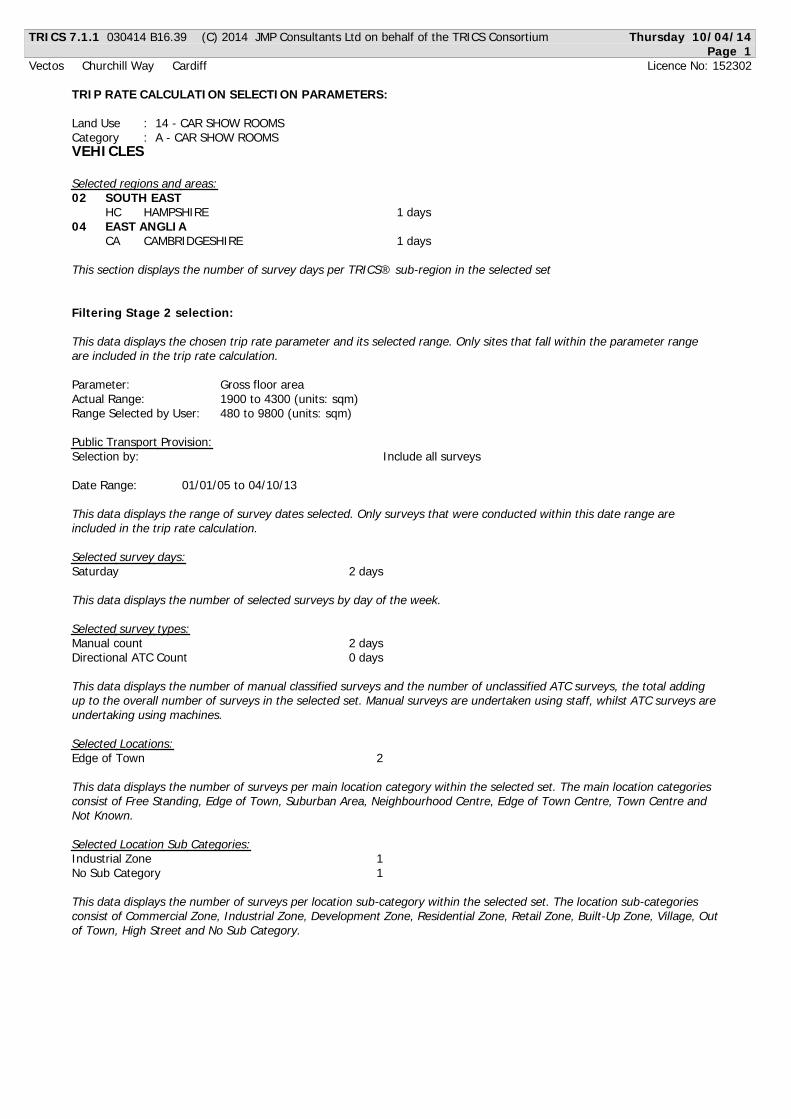
TRICS 7.1.1 030414 B16.39 (C) 2014 JMP Consultants Ltd on behalf of the TRICS Consortium Thursday 10/04/14
Page 1
Vectos Churchill Way Cardiff Licence No: 152302
TRIP RATE CALCULATION SELECTION PARAMETERS:
Land Use : 14 - CAR SHOW ROOMSCategory : A - CAR SHOW ROOMSVEHICLES
Selected regions and areas:
02 SOUTH EAST
HC HAMPSHIRE 1 days04 EAST ANGLIA
CA CAMBRIDGESHIRE 1 days
This section displays the number of survey days per TRICS® sub-region in the selected set
Filtering Stage 2 selection:
This data displays the chosen trip rate parameter and its selected range. Only sites that fall within the parameter range
are included in the trip rate calculation.
Parameter: Gross floor areaActual Range: 1900 to 4300 (units: sqm)Range Selected by User: 480 to 9800 (units: sqm)
Public Transport Provision:Selection by: Include all surveys
Date Range: 01/01/05 to 04/10/13
This data displays the range of survey dates selected. Only surveys that were conducted within this date range are
included in the trip rate calculation.
Selected survey days:
Saturday 2 days
This data displays the number of selected surveys by day of the week.
Selected survey types:
Manual count 2 daysDirectional ATC Count 0 days
This data displays the number of manual classified surveys and the number of unclassified ATC surveys, the total adding
up to the overall number of surveys in the selected set. Manual surveys are undertaken using staff, whilst ATC surveys are
undertaking using machines.
Selected Locations:
Edge of Town 2
This data displays the number of surveys per main location category within the selected set. The main location categories
consist of Free Standing, Edge of Town, Suburban Area, Neighbourhood Centre, Edge of Town Centre, Town Centre and
Not Known.
Selected Location Sub Categories:
Industrial Zone 1No Sub Category 1
This data displays the number of surveys per location sub-category within the selected set. The location sub-categories
consist of Commercial Zone, Industrial Zone, Development Zone, Residential Zone, Retail Zone, Built-Up Zone, Village, Out
of Town, High Street and No Sub Category.
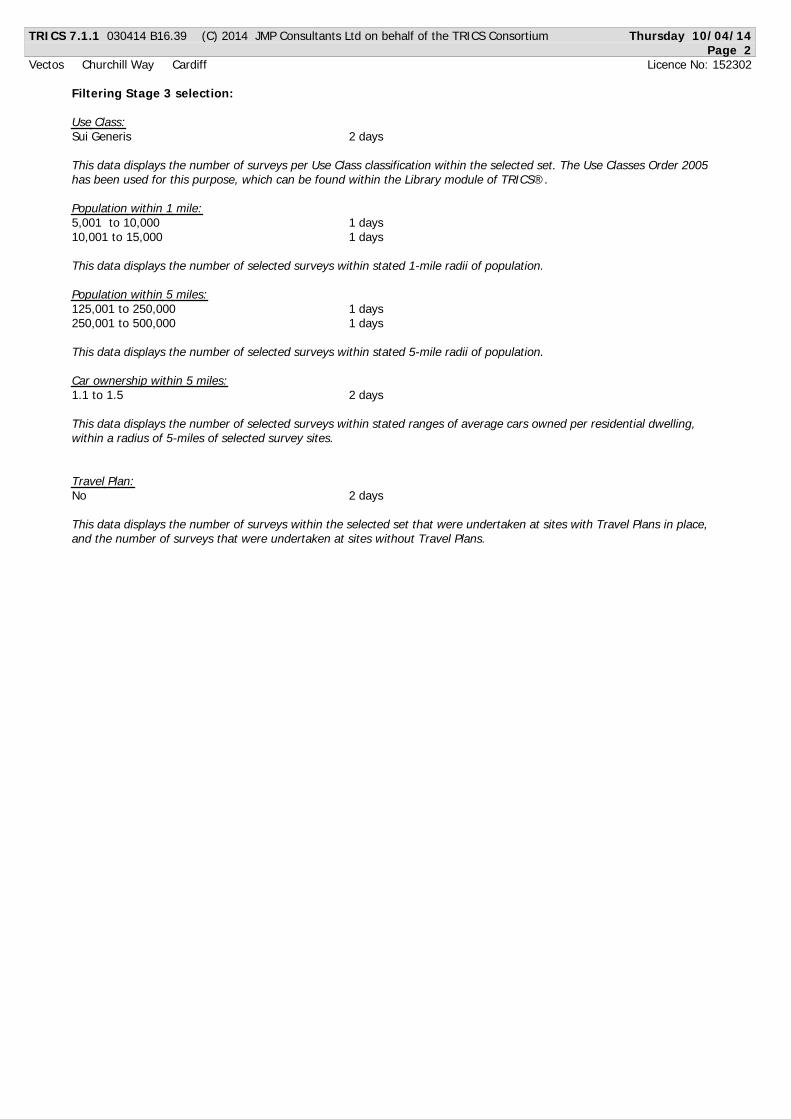
TRICS 7.1.1 030414 B16.39 (C) 2014 JMP Consultants Ltd on behalf of the TRICS Consortium Thursday 10/04/14
Page 2
Vectos Churchill Way Cardiff Licence No: 152302
Filtering Stage 3 selection:
Use Class:
Sui Generis 2 days
This data displays the number of surveys per Use Class classification within the selected set. The Use Classes Order 2005
has been used for this purpose, which can be found within the Library module of TRICS®.
Population within 1 mile:
5,001 to 10,000 1 days10,001 to 15,000 1 days
This data displays the number of selected surveys within stated 1-mile radii of population.
Population within 5 miles:
125,001 to 250,000 1 days250,001 to 500,000 1 days
This data displays the number of selected surveys within stated 5-mile radii of population.
Car ownership within 5 miles:
1.1 to 1.5 2 days
This data displays the number of selected surveys within stated ranges of average cars owned per residential dwelling,
within a radius of 5-miles of selected survey sites.
Travel Plan:
No 2 days
This data displays the number of surveys within the selected set that were undertaken at sites with Travel Plans in place,
and the number of surveys that were undertaken at sites without Travel Plans.
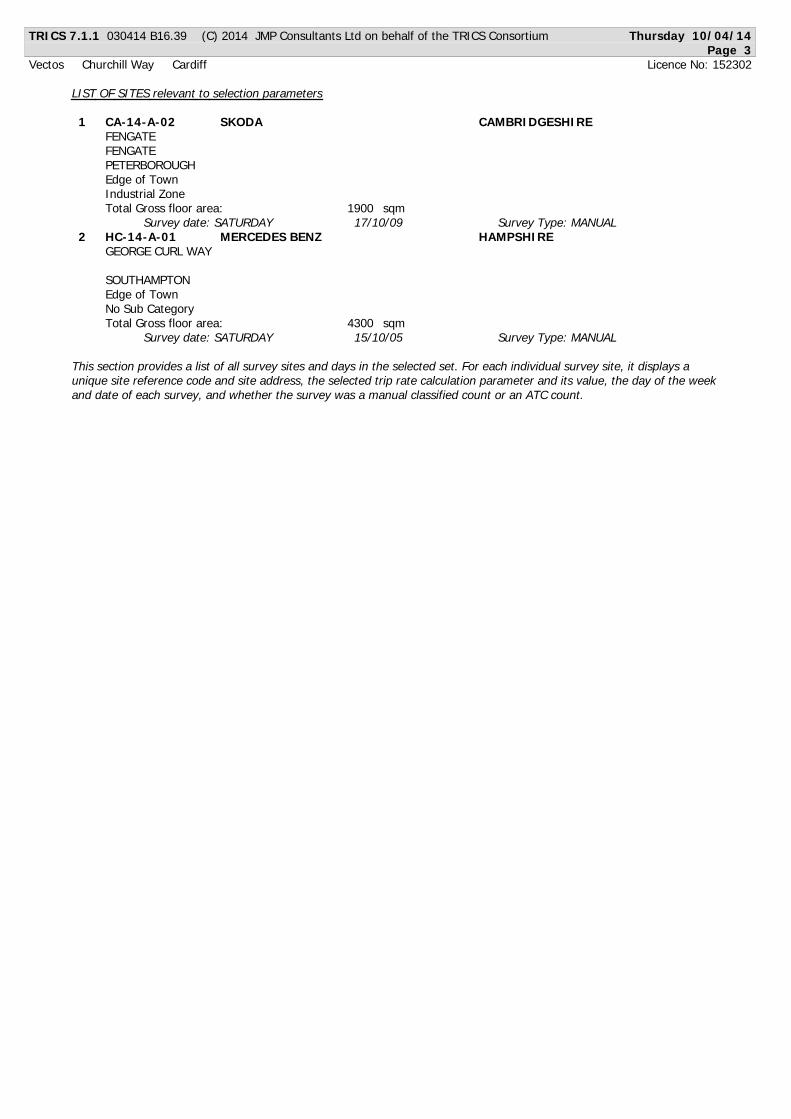
TRICS 7.1.1 030414 B16.39 (C) 2014 JMP Consultants Ltd on behalf of the TRICS Consortium Thursday 10/04/14
Page 3
Vectos Churchill Way Cardiff Licence No: 152302
LIST OF SITES relevant to selection parameters
1 CA-14-A-02 SKODA CAMBRIDGESHIRE
FENGATEFENGATEPETERBOROUGHEdge of TownIndustrial ZoneTotal Gross floor area: 1 9 0 0 sqm
Survey date: SATURDAY 17/10/09 Survey Type: MANUAL
2 HC-14-A-01 MERCEDES BENZ HAMPSHIRE
GEORGE CURL WAY
SOUTHAMPTONEdge of TownNo Sub CategoryTotal Gross floor area: 4 3 0 0 sqm
Survey date: SATURDAY 15/10/05 Survey Type: MANUAL
This section provides a list of all survey sites and days in the selected set. For each individual survey site, it displays a
unique site reference code and site address, the selected trip rate calculation parameter and its value, the day of the week
and date of each survey, and whether the survey was a manual classified count or an ATC count.

TRICS 7.1.1 030414 B16.39 (C) 2014 JMP Consultants Ltd on behalf of the TRICS Consortium Thursday 10/04/14
Page 4
Vectos Churchill Way Cardiff Licence No: 152302
TRIP RATE for Land Use 14 - CAR SHOW ROOMS/A - CAR SHOW ROOMSVEHICLES
Calculation factor: 100 sqm
BOLD print indicates peak (busiest) period
ARRIVALS DEPARTURES TOTALSNo. Ave. Trip No. Ave. Trip No. Ave. Trip
Time Range Days GFA Rate Days GFA Rate Days GFA Rate00:00 - 01:0001:00 - 02:0002:00 - 03:0003:00 - 04:0004:00 - 05:0005:00 - 06:0006:00 - 07:0007:00 - 08:00
2 3100 0.500 2 3100 0.145 2 3100 0.64508:00 - 09:002 3100 0.387 2 3100 0.242 2 3100 0.62909:00 - 10:002 3100 0.371 2 3100 0.387 2 3100 0.75810:00 - 11:002 3100 0.548 2 3100 0.629 2 3100 1.17711:00 - 12:002 3100 0.452 2 3100 0.565 2 3100 1.01712:00 - 13:002 3100 0.339 2 3100 0.435 2 3100 0.77413:00 - 14:002 3100 0.484 2 3100 0.516 2 3100 1.00014:00 - 15:002 3100 0.355 2 3100 0.419 2 3100 0.77415:00 - 16:002 3100 0.274 2 3100 0.387 2 3100 0.66116:00 - 17:002 3100 0.000 2 3100 0.129 2 3100 0.12917:00 - 18:00
18:00 - 19:0019:00 - 20:0020:00 - 21:0021:00 - 22:0022:00 - 23:0023:00 - 24:00
Total Rates: 3.710 3.854 7.564
This section displays the trip rate results based on the selected set of surveys and the selected count type (shown just
above the table). It is split by three main columns, representing arrivals trips, departures trips, and total trips (arrivals plus
departures). Within each of these main columns are three sub-columns. These display the number of survey days where
count data is included (per time period), the average value of the selected trip rate calculation parameter (per time
period), and the trip rate result (per time period). Total trip rates (the sum of the column) are also displayed at the foot of
the table.
To obtain a trip rate, the average (mean) trip rate parameter value (TRP) is first calculated for all selected survey days
that have count data available for the stated time period. The average (mean) number of arrivals, departures or totals
(whichever applies) is also calculated (COUNT) for all selected survey days that have count data available for the stated
time period. Then, the average count is divided by the average trip rate parameter value, and multiplied by the stated
calculation factor (shown just above the table and abbreviated here as FACT). So, the method is: COUNT/TRP*FACT. Trip
rates are then rounded to 3 decimal places.
Parameter summary
Trip rate parameter range selected: 1900 - 4300 (units: sqm)Survey date date range: 01/01/05 - 04/10/13Number of weekdays (Monday-Friday): 0Number of Saturdays: 2Number of Sundays: 0Surveys manually removed from selection: 0
This section displays a quick summary of some of the data filtering selections made by the TRICS® user. The trip rate
calculation parameter range of all selected surveys is displayed first, followed by the range of minimum and maximum
survey dates selected by the user. Then, the total number of selected weekdays and weekend days in the selected set of
surveys are show. Finally, the number of survey days that have been manually removed from the selected set outside of
the standard filtering procedure are displayed.
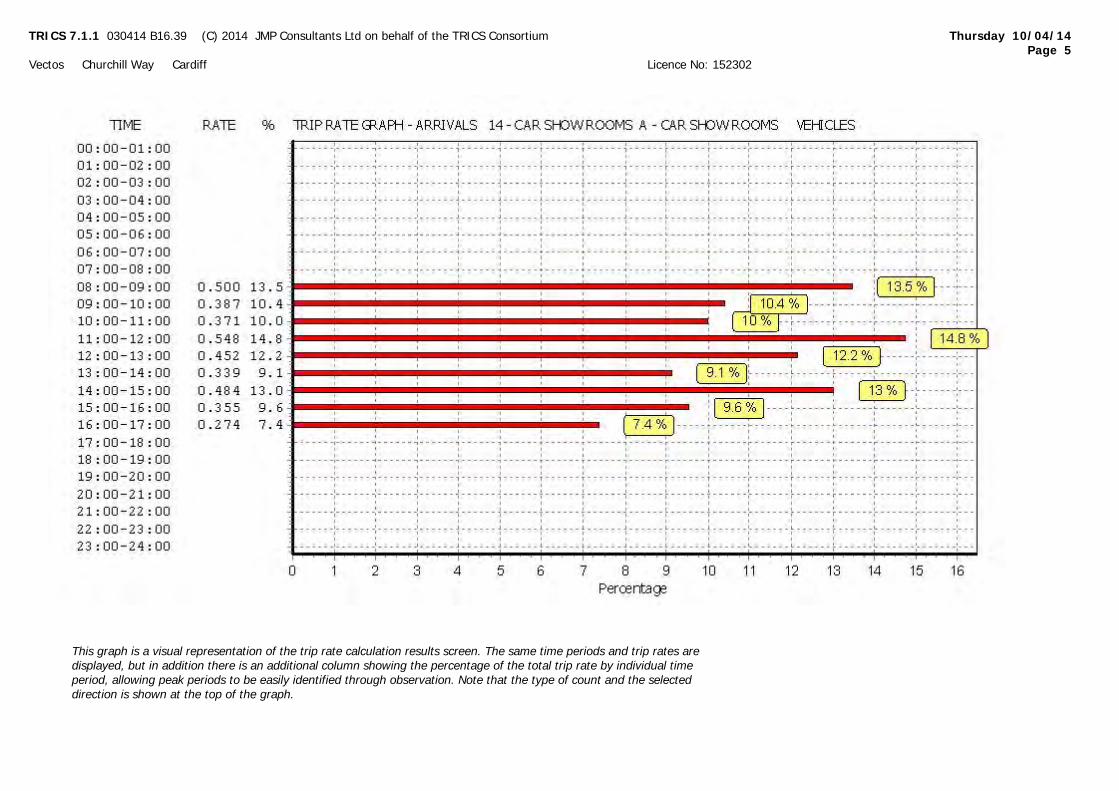
TRICS 7.1.1 030414 B16.39 (C) 2014 JMP Consultants Ltd on behalf of the TRICS Consortium Thursday 10/04/14
Page 5
Vectos Churchill Way Cardiff Licence No: 152302
This graph is a visual representation of the trip rate calculation results screen. The same time periods and trip rates are
displayed, but in addition there is an additional column showing the percentage of the total trip rate by individual time
period, allowing peak periods to be easily identified through observation. Note that the type of count and the selected
direction is shown at the top of the graph.

TRICS 7.1.1 030414 B16.39 (C) 2014 JMP Consultants Ltd on behalf of the TRICS Consortium Thursday 10/04/14
Page 6
Vectos Churchill Way Cardiff Licence No: 152302
This graph is a visual representation of the trip rate calculation results screen. The same time periods and trip rates are
displayed, but in addition there is an additional column showing the percentage of the total trip rate by individual time
period, allowing peak periods to be easily identified through observation. Note that the type of count and the selected
direction is shown at the top of the graph.
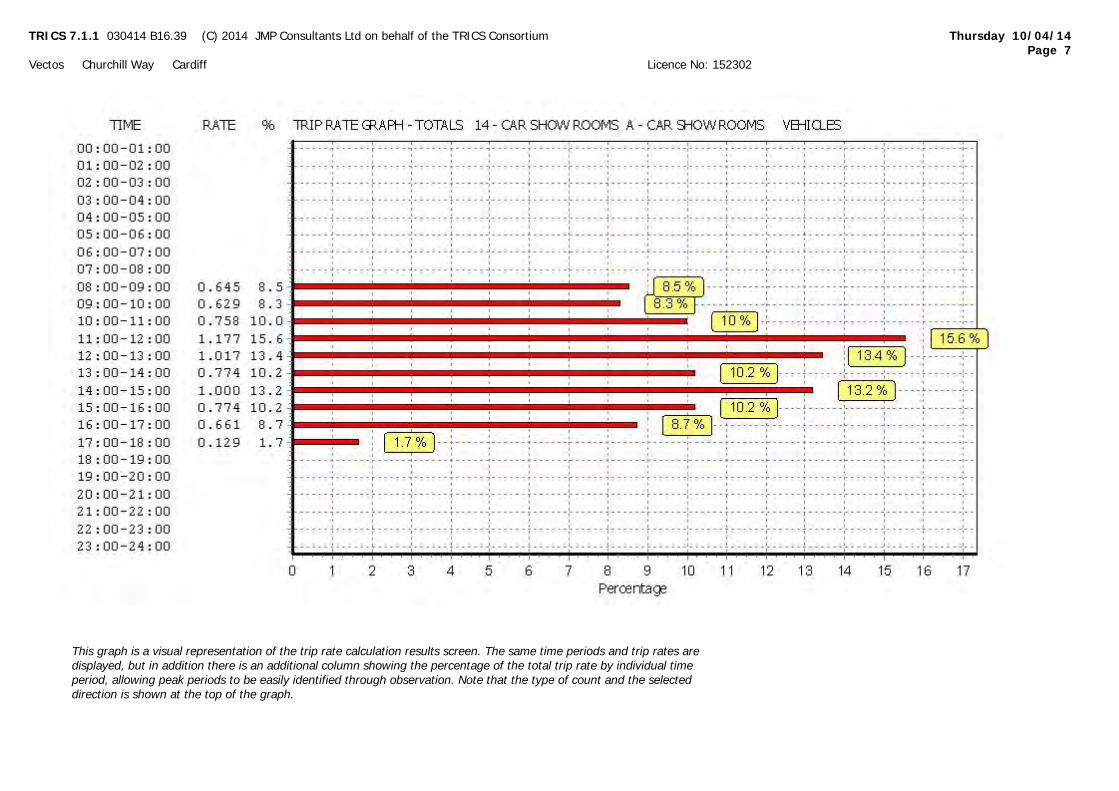
TRICS 7.1.1 030414 B16.39 (C) 2014 JMP Consultants Ltd on behalf of the TRICS Consortium Thursday 10/04/14
Page 7
Vectos Churchill Way Cardiff Licence No: 152302
This graph is a visual representation of the trip rate calculation results screen. The same time periods and trip rates are
displayed, but in addition there is an additional column showing the percentage of the total trip rate by individual time
period, allowing peak periods to be easily identified through observation. Note that the type of count and the selected
direction is shown at the top of the graph.
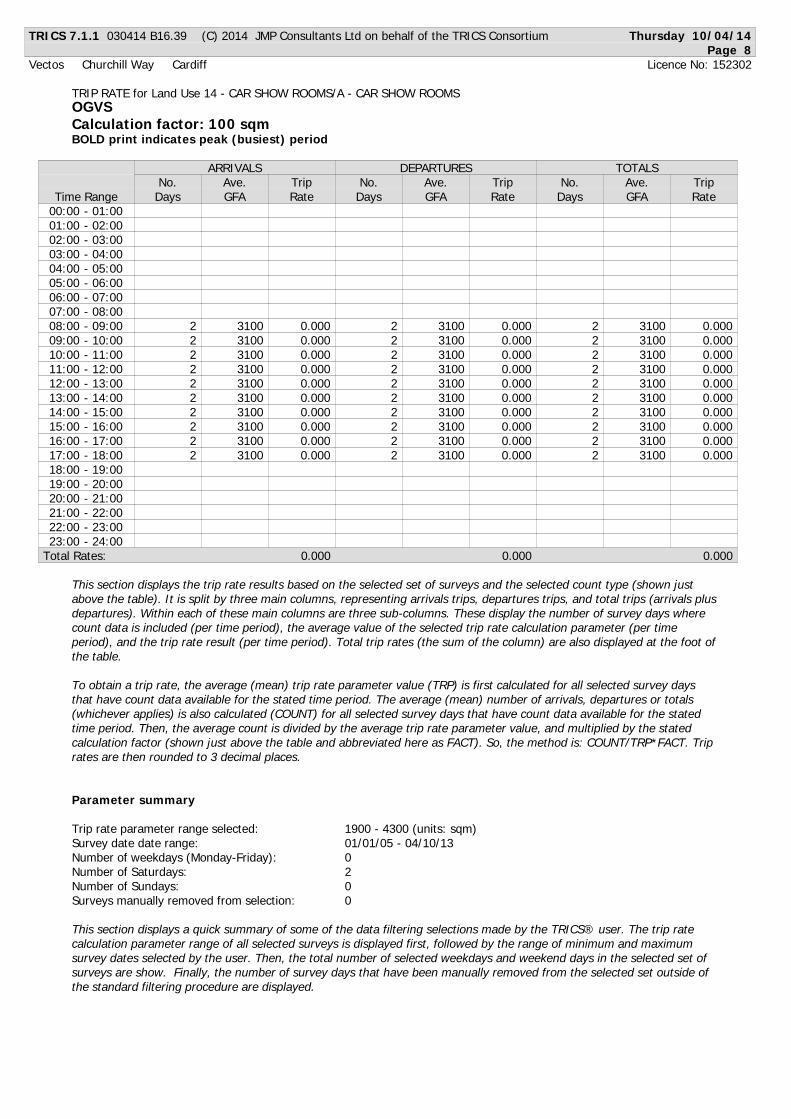
TRICS 7.1.1 030414 B16.39 (C) 2014 JMP Consultants Ltd on behalf of the TRICS Consortium Thursday 10/04/14
Page 8
Vectos Churchill Way Cardiff Licence No: 152302
TRIP RATE for Land Use 14 - CAR SHOW ROOMS/A - CAR SHOW ROOMSOGVS
Calculation factor: 100 sqm
BOLD print indicates peak (busiest) period
ARRIVALS DEPARTURES TOTALSNo. Ave. Trip No. Ave. Trip No. Ave. Trip
Time Range Days GFA Rate Days GFA Rate Days GFA Rate00:00 - 01:0001:00 - 02:0002:00 - 03:0003:00 - 04:0004:00 - 05:0005:00 - 06:0006:00 - 07:0007:00 - 08:00
2 3100 0.000 2 3100 0.000 2 3100 0.00008:00 - 09:002 3100 0.000 2 3100 0.000 2 3100 0.00009:00 - 10:002 3100 0.000 2 3100 0.000 2 3100 0.00010:00 - 11:002 3100 0.000 2 3100 0.000 2 3100 0.00011:00 - 12:002 3100 0.000 2 3100 0.000 2 3100 0.00012:00 - 13:002 3100 0.000 2 3100 0.000 2 3100 0.00013:00 - 14:002 3100 0.000 2 3100 0.000 2 3100 0.00014:00 - 15:002 3100 0.000 2 3100 0.000 2 3100 0.00015:00 - 16:002 3100 0.000 2 3100 0.000 2 3100 0.00016:00 - 17:002 3100 0.000 2 3100 0.000 2 3100 0.00017:00 - 18:00
18:00 - 19:0019:00 - 20:0020:00 - 21:0021:00 - 22:0022:00 - 23:0023:00 - 24:00
Total Rates: 0.000 0.000 0.000
This section displays the trip rate results based on the selected set of surveys and the selected count type (shown just
above the table). It is split by three main columns, representing arrivals trips, departures trips, and total trips (arrivals plus
departures). Within each of these main columns are three sub-columns. These display the number of survey days where
count data is included (per time period), the average value of the selected trip rate calculation parameter (per time
period), and the trip rate result (per time period). Total trip rates (the sum of the column) are also displayed at the foot of
the table.
To obtain a trip rate, the average (mean) trip rate parameter value (TRP) is first calculated for all selected survey days
that have count data available for the stated time period. The average (mean) number of arrivals, departures or totals
(whichever applies) is also calculated (COUNT) for all selected survey days that have count data available for the stated
time period. Then, the average count is divided by the average trip rate parameter value, and multiplied by the stated
calculation factor (shown just above the table and abbreviated here as FACT). So, the method is: COUNT/TRP*FACT. Trip
rates are then rounded to 3 decimal places.
Parameter summary
Trip rate parameter range selected: 1900 - 4300 (units: sqm)Survey date date range: 01/01/05 - 04/10/13Number of weekdays (Monday-Friday): 0Number of Saturdays: 2Number of Sundays: 0Surveys manually removed from selection: 0
This section displays a quick summary of some of the data filtering selections made by the TRICS® user. The trip rate
calculation parameter range of all selected surveys is displayed first, followed by the range of minimum and maximum
survey dates selected by the user. Then, the total number of selected weekdays and weekend days in the selected set of
surveys are show. Finally, the number of survey days that have been manually removed from the selected set outside of
the standard filtering procedure are displayed.

TRICS 7.1.1 030414 B16.39 (C) 2014 JMP Consultants Ltd on behalf of the TRICS Consortium Thursday 10/04/14
Page 9
Vectos Churchill Way Cardiff Licence No: 152302
This graph is a visual representation of the trip rate calculation results screen. The same time periods and trip rates are
displayed, but in addition there is an additional column showing the percentage of the total trip rate by individual time
period, allowing peak periods to be easily identified through observation. Note that the type of count and the selected
direction is shown at the top of the graph.
TRICS 7.1.1 030414 B16.39 (C) 2014 JMP Consultants Ltd on behalf of the TRICS Consortium Thursday 10/04/14
Page 10
Vectos Churchill Way Cardiff Licence No: 152302
This graph is a visual representation of the trip rate calculation results screen. The same time periods and trip rates are
displayed, but in addition there is an additional column showing the percentage of the total trip rate by individual time
period, allowing peak periods to be easily identified through observation. Note that the type of count and the selected
direction is shown at the top of the graph.

TRICS 7.1.1 030414 B16.39 (C) 2014 JMP Consultants Ltd on behalf of the TRICS Consortium Thursday 10/04/14
Page 11
Vectos Churchill Way Cardiff Licence No: 152302
This graph is a visual representation of the trip rate calculation results screen. The same time periods and trip rates are
displayed, but in addition there is an additional column showing the percentage of the total trip rate by individual time
period, allowing peak periods to be easily identified through observation. Note that the type of count and the selected
direction is shown at the top of the graph.

TRICS 7.1.1 030414 B16.39 (C) 2014 JMP Consultants Ltd on behalf of the TRICS Consortium Thursday 10/04/14
Page 12
Vectos Churchill Way Cardiff Licence No: 152302
TRIP RATE for Land Use 14 - CAR SHOW ROOMS/A - CAR SHOW ROOMSPSVS
Calculation factor: 100 sqm
BOLD print indicates peak (busiest) period
ARRIVALS DEPARTURES TOTALSNo. Ave. Trip No. Ave. Trip No. Ave. Trip
Time Range Days GFA Rate Days GFA Rate Days GFA Rate00:00 - 01:0001:00 - 02:0002:00 - 03:0003:00 - 04:0004:00 - 05:0005:00 - 06:0006:00 - 07:0007:00 - 08:00
2 3100 0.000 2 3100 0.000 2 3100 0.00008:00 - 09:002 3100 0.000 2 3100 0.000 2 3100 0.00009:00 - 10:002 3100 0.000 2 3100 0.000 2 3100 0.00010:00 - 11:002 3100 0.000 2 3100 0.000 2 3100 0.00011:00 - 12:002 3100 0.000 2 3100 0.000 2 3100 0.00012:00 - 13:002 3100 0.000 2 3100 0.000 2 3100 0.00013:00 - 14:002 3100 0.000 2 3100 0.000 2 3100 0.00014:00 - 15:002 3100 0.000 2 3100 0.000 2 3100 0.00015:00 - 16:002 3100 0.000 2 3100 0.000 2 3100 0.00016:00 - 17:002 3100 0.000 2 3100 0.000 2 3100 0.00017:00 - 18:00
18:00 - 19:0019:00 - 20:0020:00 - 21:0021:00 - 22:0022:00 - 23:0023:00 - 24:00
Total Rates: 0.000 0.000 0.000
This section displays the trip rate results based on the selected set of surveys and the selected count type (shown just
above the table). It is split by three main columns, representing arrivals trips, departures trips, and total trips (arrivals plus
departures). Within each of these main columns are three sub-columns. These display the number of survey days where
count data is included (per time period), the average value of the selected trip rate calculation parameter (per time
period), and the trip rate result (per time period). Total trip rates (the sum of the column) are also displayed at the foot of
the table.
To obtain a trip rate, the average (mean) trip rate parameter value (TRP) is first calculated for all selected survey days
that have count data available for the stated time period. The average (mean) number of arrivals, departures or totals
(whichever applies) is also calculated (COUNT) for all selected survey days that have count data available for the stated
time period. Then, the average count is divided by the average trip rate parameter value, and multiplied by the stated
calculation factor (shown just above the table and abbreviated here as FACT). So, the method is: COUNT/TRP*FACT. Trip
rates are then rounded to 3 decimal places.
Parameter summary
Trip rate parameter range selected: 1900 - 4300 (units: sqm)Survey date date range: 01/01/05 - 04/10/13Number of weekdays (Monday-Friday): 0Number of Saturdays: 2Number of Sundays: 0Surveys manually removed from selection: 0
This section displays a quick summary of some of the data filtering selections made by the TRICS® user. The trip rate
calculation parameter range of all selected surveys is displayed first, followed by the range of minimum and maximum
survey dates selected by the user. Then, the total number of selected weekdays and weekend days in the selected set of
surveys are show. Finally, the number of survey days that have been manually removed from the selected set outside of
the standard filtering procedure are displayed.

TRICS 7.1.1 030414 B16.39 (C) 2014 JMP Consultants Ltd on behalf of the TRICS Consortium Thursday 10/04/14
Page 13
Vectos Churchill Way Cardiff Licence No: 152302
This graph is a visual representation of the trip rate calculation results screen. The same time periods and trip rates are
displayed, but in addition there is an additional column showing the percentage of the total trip rate by individual time
period, allowing peak periods to be easily identified through observation. Note that the type of count and the selected
direction is shown at the top of the graph.

TRICS 7.1.1 030414 B16.39 (C) 2014 JMP Consultants Ltd on behalf of the TRICS Consortium Thursday 10/04/14
Page 14
Vectos Churchill Way Cardiff Licence No: 152302
This graph is a visual representation of the trip rate calculation results screen. The same time periods and trip rates are
displayed, but in addition there is an additional column showing the percentage of the total trip rate by individual time
period, allowing peak periods to be easily identified through observation. Note that the type of count and the selected
direction is shown at the top of the graph.
TRICS 7.1.1 030414 B16.39 (C) 2014 JMP Consultants Ltd on behalf of the TRICS Consortium Thursday 10/04/14
Page 15
Vectos Churchill Way Cardiff Licence No: 152302
This graph is a visual representation of the trip rate calculation results screen. The same time periods and trip rates are
displayed, but in addition there is an additional column showing the percentage of the total trip rate by individual time
period, allowing peak periods to be easily identified through observation. Note that the type of count and the selected
direction is shown at the top of the graph.

TRICS 7.1.1 030414 B16.39 (C) 2014 JMP Consultants Ltd on behalf of the TRICS Consortium Thursday 10/04/14
Page 16
Vectos Churchill Way Cardiff Licence No: 152302
TRIP RATE for Land Use 14 - CAR SHOW ROOMS/A - CAR SHOW ROOMSCYCLISTS
Calculation factor: 100 sqm
BOLD print indicates peak (busiest) period
ARRIVALS DEPARTURES TOTALSNo. Ave. Trip No. Ave. Trip No. Ave. Trip
Time Range Days GFA Rate Days GFA Rate Days GFA Rate00:00 - 01:0001:00 - 02:0002:00 - 03:0003:00 - 04:0004:00 - 05:0005:00 - 06:0006:00 - 07:0007:00 - 08:00
2 3100 0.000 2 3100 0.000 2 3100 0.00008:00 - 09:002 3100 0.000 2 3100 0.000 2 3100 0.00009:00 - 10:002 3100 0.000 2 3100 0.000 2 3100 0.00010:00 - 11:002 3100 0.000 2 3100 0.000 2 3100 0.00011:00 - 12:002 3100 0.000 2 3100 0.000 2 3100 0.00012:00 - 13:002 3100 0.000 2 3100 0.000 2 3100 0.00013:00 - 14:002 3100 0.000 2 3100 0.000 2 3100 0.00014:00 - 15:002 3100 0.000 2 3100 0.000 2 3100 0.00015:00 - 16:002 3100 0.000 2 3100 0.000 2 3100 0.00016:00 - 17:002 3100 0.000 2 3100 0.000 2 3100 0.00017:00 - 18:00
18:00 - 19:0019:00 - 20:0020:00 - 21:0021:00 - 22:0022:00 - 23:0023:00 - 24:00
Total Rates: 0.000 0.000 0.000
This section displays the trip rate results based on the selected set of surveys and the selected count type (shown just
above the table). It is split by three main columns, representing arrivals trips, departures trips, and total trips (arrivals plus
departures). Within each of these main columns are three sub-columns. These display the number of survey days where
count data is included (per time period), the average value of the selected trip rate calculation parameter (per time
period), and the trip rate result (per time period). Total trip rates (the sum of the column) are also displayed at the foot of
the table.
To obtain a trip rate, the average (mean) trip rate parameter value (TRP) is first calculated for all selected survey days
that have count data available for the stated time period. The average (mean) number of arrivals, departures or totals
(whichever applies) is also calculated (COUNT) for all selected survey days that have count data available for the stated
time period. Then, the average count is divided by the average trip rate parameter value, and multiplied by the stated
calculation factor (shown just above the table and abbreviated here as FACT). So, the method is: COUNT/TRP*FACT. Trip
rates are then rounded to 3 decimal places.
Parameter summary
Trip rate parameter range selected: 1900 - 4300 (units: sqm)Survey date date range: 01/01/05 - 04/10/13Number of weekdays (Monday-Friday): 0Number of Saturdays: 2Number of Sundays: 0Surveys manually removed from selection: 0
This section displays a quick summary of some of the data filtering selections made by the TRICS® user. The trip rate
calculation parameter range of all selected surveys is displayed first, followed by the range of minimum and maximum
survey dates selected by the user. Then, the total number of selected weekdays and weekend days in the selected set of
surveys are show. Finally, the number of survey days that have been manually removed from the selected set outside of
the standard filtering procedure are displayed.

TRICS 7.1.1 030414 B16.39 (C) 2014 JMP Consultants Ltd on behalf of the TRICS Consortium Thursday 10/04/14
Page 17
Vectos Churchill Way Cardiff Licence No: 152302
This graph is a visual representation of the trip rate calculation results screen. The same time periods and trip rates are
displayed, but in addition there is an additional column showing the percentage of the total trip rate by individual time
period, allowing peak periods to be easily identified through observation. Note that the type of count and the selected
direction is shown at the top of the graph.
TRICS 7.1.1 030414 B16.39 (C) 2014 JMP Consultants Ltd on behalf of the TRICS Consortium Thursday 10/04/14
Page 18
Vectos Churchill Way Cardiff Licence No: 152302
This graph is a visual representation of the trip rate calculation results screen. The same time periods and trip rates are
displayed, but in addition there is an additional column showing the percentage of the total trip rate by individual time
period, allowing peak periods to be easily identified through observation. Note that the type of count and the selected
direction is shown at the top of the graph.

TRICS 7.1.1 030414 B16.39 (C) 2014 JMP Consultants Ltd on behalf of the TRICS Consortium Thursday 10/04/14
Page 19
Vectos Churchill Way Cardiff Licence No: 152302
This graph is a visual representation of the trip rate calculation results screen. The same time periods and trip rates are
displayed, but in addition there is an additional column showing the percentage of the total trip rate by individual time
period, allowing peak periods to be easily identified through observation. Note that the type of count and the selected
direction is shown at the top of the graph.

APPENDIX F
PICADY Outputs
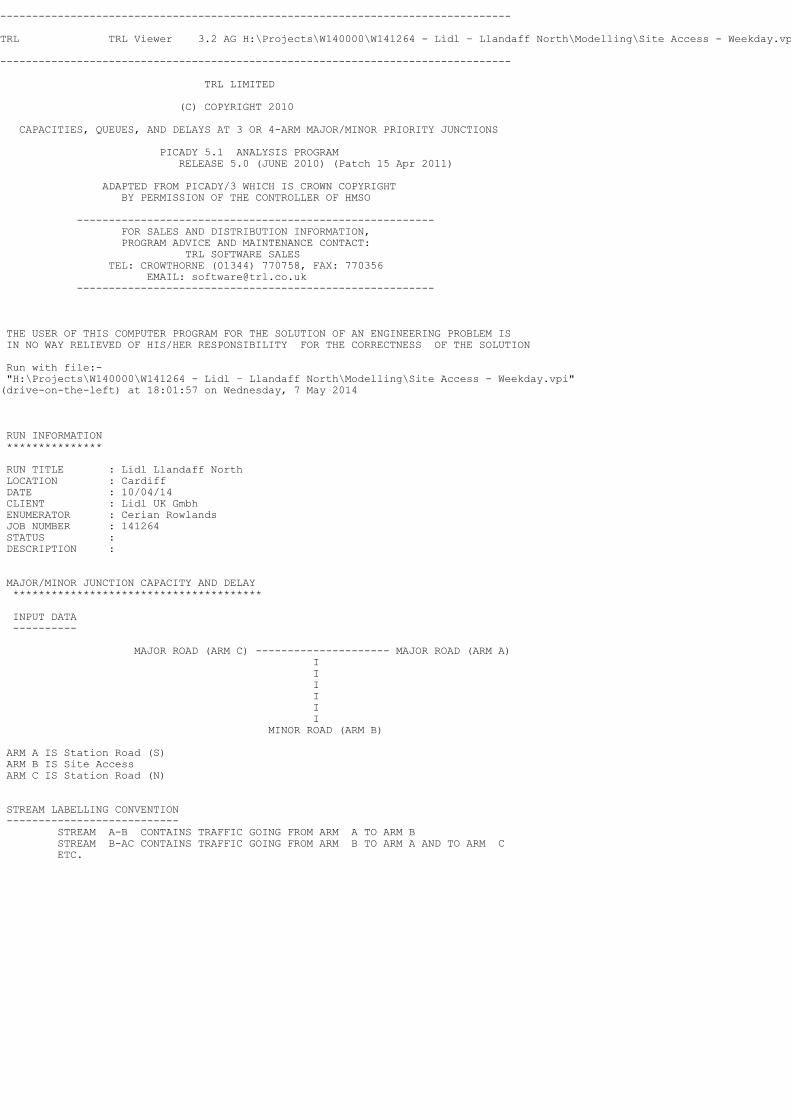
-------------------------------------------------------------------------------- TRL TRL Viewer 3.2 AG H:\Projects\W140000\W141264 - Lidl – Llandaff North\Modelling\Site Access - Weekday.vpo - Page 1 -------------------------------------------------------------------------------- TRL LIMITED (C) COPYRIGHT 2010 CAPACITIES, QUEUES, AND DELAYS AT 3 OR 4-ARM MAJOR/MINOR PRIORITY JUNCTIONS PICADY 5.1 ANALYSIS PROGRAM RELEASE 5.0 (JUNE 2010) (Patch 15 Apr 2011) ADAPTED FROM PICADY/3 WHICH IS CROWN COPYRIGHT BY PERMISSION OF THE CONTROLLER OF HMSO -------------------------------------------------------- FOR SALES AND DISTRIBUTION INFORMATION, PROGRAM ADVICE AND MAINTENANCE CONTACT: TRL SOFTWARE SALES TEL: CROWTHORNE (01344) 770758, FAX: 770356 EMAIL: [email protected] -------------------------------------------------------- THE USER OF THIS COMPUTER PROGRAM FOR THE SOLUTION OF AN ENGINEERING PROBLEM IS IN NO WAY RELIEVED OF HIS/HER RESPONSIBILITY FOR THE CORRECTNESS OF THE SOLUTION Run with file:- "H:\Projects\W140000\W141264 - Lidl – Llandaff North\Modelling\Site Access - Weekday.vpi"(drive-on-the-left) at 18:01:57 on Wednesday, 7 May 2014
RUN INFORMATION *************** RUN TITLE : Lidl Llandaff North LOCATION : Cardiff DATE : 10/04/14 CLIENT : Lidl UK Gmbh ENUMERATOR : Cerian Rowlands JOB NUMBER : 141264 STATUS : DESCRIPTION :
MAJOR/MINOR JUNCTION CAPACITY AND DELAY *************************************** INPUT DATA ---------- MAJOR ROAD (ARM C) --------------------- MAJOR ROAD (ARM A) I I I I I I MINOR ROAD (ARM B) ARM A IS Station Road (S) ARM B IS Site Access ARM C IS Station Road (N)
STREAM LABELLING CONVENTION --------------------------- STREAM A-B CONTAINS TRAFFIC GOING FROM ARM A TO ARM B STREAM B-AC CONTAINS TRAFFIC GOING FROM ARM B TO ARM A AND TO ARM C ETC.

-------------------------------------------------------------------------------- TRL TRL Viewer 3.2 AG H:\Projects\W140000\W141264 - Lidl – Llandaff North\Modelling\Site Access - Weekday.vpo - Page 2 -------------------------------------------------------------------------------- GEOMETRIC DATA -------------- -------------------------------------------------------------------------------------- I DATA ITEM I MINOR ROAD B I -------------------------------------------------------------------------------------- I TOTAL MAJOR ROAD CARRIAGEWAY WIDTH I ( W ) 7.90 M. I I CENTRAL RESERVE WIDTH I (WCR ) 0.00 M. I I I I I MAJOR ROAD RIGHT TURN - WIDTH I (WC-B) 2.20 M. I I - VISIBILITY I (VC-B)153.00 M. I I - BLOCKS TRAFFIC (SPACES) I YES ( 0) I I I I I MINOR ROAD - VISIBILITY TO LEFT I (VB-C) 19.0 M. I I - VISIBILITY TO RIGHT I (VB-A) 15.0 M. I I - LANE 1 WIDTH I (WB-C) - I I - LANE 2 WIDTH I (WB-A) - I I WIDTH AT 0 M FROM JUNCTION I 9.70 M. I I WIDTH AT 5 M FROM JUNCTION I 4.20 M. I I WIDTH AT 10 M FROM JUNCTION I 4.00 M. I I WIDTH AT 15 M FROM JUNCTION I 4.00 M. I I WIDTH AT 20 M FROM JUNCTION I 4.00 M. I I - LENGTH OF FLARED SECTION I DERIVED: 0 PCU I -------------------------------------------------------------------------------------- .SLOPES AND INTERCEPT -------------------- (NB:Streams may be combined, in which case capacity will be adjusted) --------------------------------------------------------- I Intercept For Slope For Opposing Slope For Opposing I I STREAM B-C STREAM A-C STREAM A-B I --------------------------------------------------------- I 0.00 0.00 0.00 I --------------------------------------------------------- * Due to the presence of a flare, data is not available -------------------------------------------------------------------------------------------------- I Intercept For Slope For Opposing Slope For Opposing Slope For Opposing Slope For OpposingI I STREAM B-A STREAM A-C STREAM A-B STREAM C-A STREAM C-B I -------------------------------------------------------------------------------------------------- I 0.00 0.00 0.00 0.00 0.00 I -------------------------------------------------------------------------------------------------- * Due to the presence of a flare, data is not available --------------------------------------------------------- I Intercept For Slope For Opposing Slope For Opposing I I STREAM C-B STREAM A-C STREAM A-B I --------------------------------------------------------- I 662.57 0.24 0.24 I --------------------------------------------------------- (NB These values do not allow for any site specific corrections)
TRAFFIC DEMAND DATA ------------------- ----------------------- I ARM I FLOW SCALE(%) I ----------------------- I A I 100 I I B I 100 I I C I 100 I -----------------------
Demand set: 2020 AM Peak + Development TIME PERIOD BEGINS 07.45 AND ENDS 09.15 LENGTH OF TIME PERIOD - 90 MIN. LENGTH OF TIME SEGMENT - 15 MIN.
DEMAND FLOW PROFILES ARE SYNTHESISED FROM TURNING COUNT DATA ------------------------------------------------------------------------------------ I I NUMBER OF MINUTES FROM START WHEN I RATE OF FLOW (VEH/MIN) I I ARM I FLOW STARTS I TOP OF PEAK I FLOW STOPS I BEFORE I AT TOP I AFTER I I I TO RISE I IS REACHED I FALLING I PEAK I OF PEAK I PEAK I I I I I I I I I ------------------------------------------------------------------------------------ I ARM A I 15.00 I 45.00 I 75.00 I 8.15 I 12.22 I 8.15 I I ARM B I 15.00 I 45.00 I 75.00 I 0.14 I 0.21 I 0.14 I I ARM C I 15.00 I 45.00 I 75.00 I 6.22 I 9.34 I 6.22 I ------------------------------------------------------------------------------------
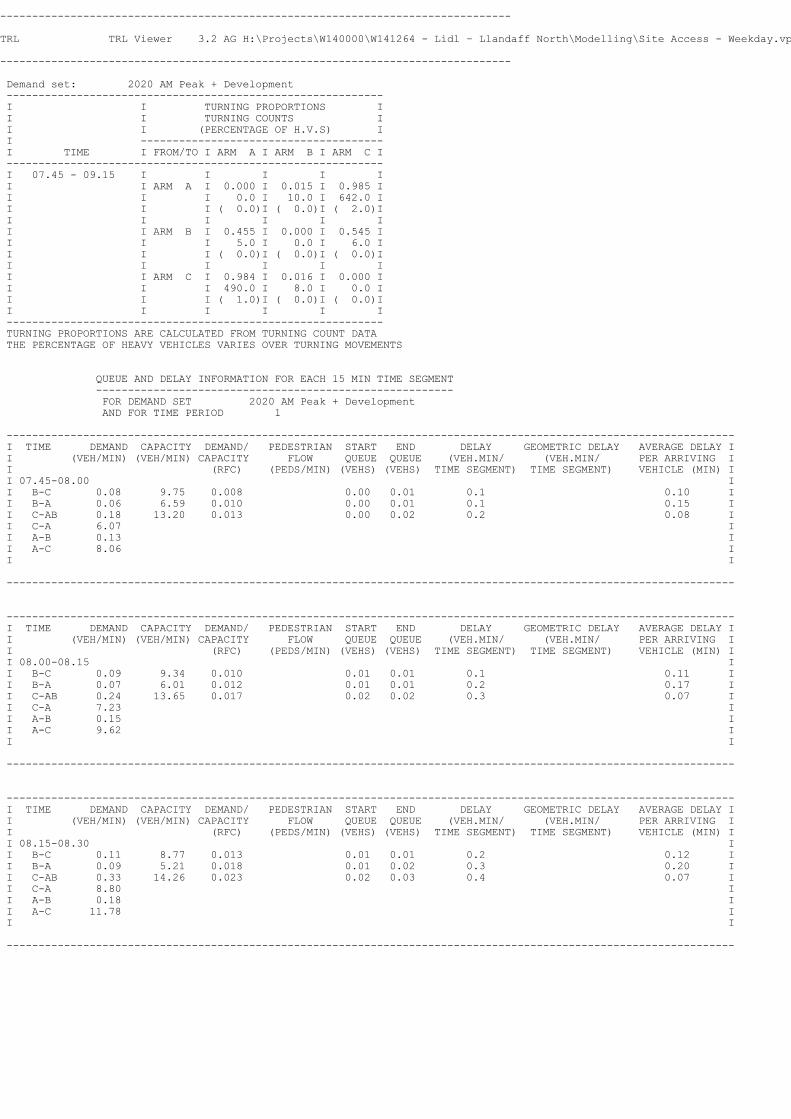
-------------------------------------------------------------------------------- TRL TRL Viewer 3.2 AG H:\Projects\W140000\W141264 - Lidl – Llandaff North\Modelling\Site Access - Weekday.vpo - Page 3 -------------------------------------------------------------------------------- Demand set: 2020 AM Peak + Development ----------------------------------------------------------- I I TURNING PROPORTIONS I I I TURNING COUNTS I I I (PERCENTAGE OF H.V.S) I I -------------------------------------- I TIME I FROM/TO I ARM A I ARM B I ARM C I ----------------------------------------------------------- I 07.45 - 09.15 I I I I I I I ARM A I 0.000 I 0.015 I 0.985 I I I I 0.0 I 10.0 I 642.0 I I I I ( 0.0)I ( 0.0)I ( 2.0)I I I I I I I I I ARM B I 0.455 I 0.000 I 0.545 I I I I 5.0 I 0.0 I 6.0 I I I I ( 0.0)I ( 0.0)I ( 0.0)I I I I I I I I I ARM C I 0.984 I 0.016 I 0.000 I I I I 490.0 I 8.0 I 0.0 I I I I ( 1.0)I ( 0.0)I ( 0.0)I I I I I I I ----------------------------------------------------------- TURNING PROPORTIONS ARE CALCULATED FROM TURNING COUNT DATA THE PERCENTAGE OF HEAVY VEHICLES VARIES OVER TURNING MOVEMENTS
QUEUE AND DELAY INFORMATION FOR EACH 15 MIN TIME SEGMENT -------------------------------------------------------- FOR DEMAND SET 2020 AM Peak + Development AND FOR TIME PERIOD 1
------------------------------------------------------------------------------------------------------------------ I TIME DEMAND CAPACITY DEMAND/ PEDESTRIAN START END DELAY GEOMETRIC DELAY AVERAGE DELAY I I (VEH/MIN) (VEH/MIN) CAPACITY FLOW QUEUE QUEUE (VEH.MIN/ (VEH.MIN/ PER ARRIVING I I (RFC) (PEDS/MIN) (VEHS) (VEHS) TIME SEGMENT) TIME SEGMENT) VEHICLE (MIN) I I 07.45-08.00 I I B-C 0.08 9.75 0.008 0.00 0.01 0.1 0.10 I I B-A 0.06 6.59 0.010 0.00 0.01 0.1 0.15 I I C-AB 0.18 13.20 0.013 0.00 0.02 0.2 0.08 I I C-A 6.07 I I A-B 0.13 I I A-C 8.06 I I I
------------------------------------------------------------------------------------------------------------------
------------------------------------------------------------------------------------------------------------------ I TIME DEMAND CAPACITY DEMAND/ PEDESTRIAN START END DELAY GEOMETRIC DELAY AVERAGE DELAY I I (VEH/MIN) (VEH/MIN) CAPACITY FLOW QUEUE QUEUE (VEH.MIN/ (VEH.MIN/ PER ARRIVING I I (RFC) (PEDS/MIN) (VEHS) (VEHS) TIME SEGMENT) TIME SEGMENT) VEHICLE (MIN) I I 08.00-08.15 I I B-C 0.09 9.34 0.010 0.01 0.01 0.1 0.11 I I B-A 0.07 6.01 0.012 0.01 0.01 0.2 0.17 I I C-AB 0.24 13.65 0.017 0.02 0.02 0.3 0.07 I I C-A 7.23 I I A-B 0.15 I I A-C 9.62 I I I
------------------------------------------------------------------------------------------------------------------
------------------------------------------------------------------------------------------------------------------ I TIME DEMAND CAPACITY DEMAND/ PEDESTRIAN START END DELAY GEOMETRIC DELAY AVERAGE DELAY I I (VEH/MIN) (VEH/MIN) CAPACITY FLOW QUEUE QUEUE (VEH.MIN/ (VEH.MIN/ PER ARRIVING I I (RFC) (PEDS/MIN) (VEHS) (VEHS) TIME SEGMENT) TIME SEGMENT) VEHICLE (MIN) I I 08.15-08.30 I I B-C 0.11 8.77 0.013 0.01 0.01 0.2 0.12 I I B-A 0.09 5.21 0.018 0.01 0.02 0.3 0.20 I I C-AB 0.33 14.26 0.023 0.02 0.03 0.4 0.07 I I C-A 8.80 I I A-B 0.18 I I A-C 11.78 I I I
------------------------------------------------------------------------------------------------------------------

-------------------------------------------------------------------------------- TRL TRL Viewer 3.2 AG H:\Projects\W140000\W141264 - Lidl – Llandaff North\Modelling\Site Access - Weekday.vpo - Page 4 -------------------------------------------------------------------------------- ------------------------------------------------------------------------------------------------------------------ I TIME DEMAND CAPACITY DEMAND/ PEDESTRIAN START END DELAY GEOMETRIC DELAY AVERAGE DELAY I I (VEH/MIN) (VEH/MIN) CAPACITY FLOW QUEUE QUEUE (VEH.MIN/ (VEH.MIN/ PER ARRIVING I I (RFC) (PEDS/MIN) (VEHS) (VEHS) TIME SEGMENT) TIME SEGMENT) VEHICLE (MIN) I I 08.30-08.45 I I B-C 0.11 8.77 0.013 0.01 0.01 0.2 0.12 I I B-A 0.09 5.21 0.018 0.02 0.02 0.3 0.20 I I C-AB 0.33 14.26 0.023 0.03 0.03 0.4 0.07 I I C-A 8.80 I I A-B 0.18 I I A-C 11.78 I I I
------------------------------------------------------------------------------------------------------------------
------------------------------------------------------------------------------------------------------------------ I TIME DEMAND CAPACITY DEMAND/ PEDESTRIAN START END DELAY GEOMETRIC DELAY AVERAGE DELAY I I (VEH/MIN) (VEH/MIN) CAPACITY FLOW QUEUE QUEUE (VEH.MIN/ (VEH.MIN/ PER ARRIVING I I (RFC) (PEDS/MIN) (VEHS) (VEHS) TIME SEGMENT) TIME SEGMENT) VEHICLE (MIN) I I 08.45-09.00 I I B-C 0.09 9.34 0.010 0.01 0.01 0.1 0.11 I I B-A 0.07 6.01 0.012 0.02 0.01 0.2 0.17 I I C-AB 0.24 13.65 0.017 0.03 0.02 0.3 0.07 I I C-A 7.23 I I A-B 0.15 I I A-C 9.62 I I I
------------------------------------------------------------------------------------------------------------------
------------------------------------------------------------------------------------------------------------------ I TIME DEMAND CAPACITY DEMAND/ PEDESTRIAN START END DELAY GEOMETRIC DELAY AVERAGE DELAY I I (VEH/MIN) (VEH/MIN) CAPACITY FLOW QUEUE QUEUE (VEH.MIN/ (VEH.MIN/ PER ARRIVING I I (RFC) (PEDS/MIN) (VEHS) (VEHS) TIME SEGMENT) TIME SEGMENT) VEHICLE (MIN) I I 09.00-09.15 I I B-C 0.08 9.75 0.008 0.01 0.01 0.1 0.10 I I B-A 0.06 6.59 0.010 0.01 0.01 0.1 0.15 I I C-AB 0.18 13.20 0.013 0.02 0.02 0.2 0.08 I I C-A 6.07 I I A-B 0.13 I I A-C 8.06 I I I
------------------------------------------------------------------------------------------------------------------*WARNING* NO MARGINAL ANALYSIS OF CAPACITIES AS MAJOR ROAD BLOCKING MAY OCCUR
QUEUE FOR STREAM B-C ------------------------- TIME NO. OF SEGMENT VEHICLES ENDING IN QUEUE 08.00 0.0 08.15 0.0 08.30 0.0 08.45 0.0 09.00 0.0 09.15 0.0
QUEUE FOR STREAM B-A ------------------------- TIME NO. OF SEGMENT VEHICLES ENDING IN QUEUE 08.00 0.0 08.15 0.0 08.30 0.0 08.45 0.0 09.00 0.0 09.15 0.0
QUEUE FOR STREAM C-AB ------------------------- TIME NO. OF SEGMENT VEHICLES ENDING IN QUEUE 08.00 0.0 08.15 0.0 08.30 0.0 08.45 0.0 09.00 0.0 09.15 0.0

-------------------------------------------------------------------------------- TRL TRL Viewer 3.2 AG H:\Projects\W140000\W141264 - Lidl – Llandaff North\Modelling\Site Access - Weekday.vpo - Page 5 -------------------------------------------------------------------------------- QUEUEING DELAY INFORMATION OVER WHOLE PERIOD -------------------------------------------- --------------------------------------------------------------------------- I STREAM I TOTAL DEMAND I * QUEUEING * I * INCLUSIVE QUEUEING * I I I I * DELAY * I * DELAY * I I I----------------------------------------------------------------I I I (VEH) (VEH/H) I (MIN) (MIN/VEH) I (MIN) (MIN/VEH) I --------------------------------------------------------------------------- I B-C I 8.3 I 5.5 I 0.9 I 0.11 I 0.9 I 0.11 I I B-A I 6.9 I 4.6 I 1.2 I 0.17 I 1.2 I 0.17 I I C-AB I 22.4 I 14.9 I 1.9 I 0.09 I 1.9 I 0.09 I I C-A I 663.1 I 442.0 I I I I I I A-B I 13.8 I 9.2 I I I I I I A-C I 883.7 I 589.1 I I I I I --------------------------------------------------------------------------- I ALL I 1598.0 I 1065.4 I 4.0 I 0.00 I 4.0 I 0.00 I --------------------------------------------------------------------------- * DELAY IS THAT OCCURRING ONLY WITHIN THE TIME PERIOD * INCLUSIVE DELAY INCLUDES DELAY SUFFERED BY VEHICLES WHICH ARE STILL QUEUEING AFTER THE END OF THE TIME PERIOD * THESE WILL ONLY BE SIGNIFICANTLY DIFFERENT IF THERE IS A LARGE QUEUE REMAINING AT THE END OF THE TIME PERIOD. *******END OF RUN******* .SLOPES AND INTERCEPT -------------------- (NB:Streams may be combined, in which case capacity will be adjusted) --------------------------------------------------------- I Intercept For Slope For Opposing Slope For Opposing I I STREAM B-C STREAM A-C STREAM A-B I --------------------------------------------------------- I 0.00 0.00 0.00 I --------------------------------------------------------- * Due to the presence of a flare, data is not available -------------------------------------------------------------------------------------------------- I Intercept For Slope For Opposing Slope For Opposing Slope For Opposing Slope For OpposingI I STREAM B-A STREAM A-C STREAM A-B STREAM C-A STREAM C-B I -------------------------------------------------------------------------------------------------- I 0.00 0.00 0.00 0.00 0.00 I -------------------------------------------------------------------------------------------------- * Due to the presence of a flare, data is not available --------------------------------------------------------- I Intercept For Slope For Opposing Slope For Opposing I I STREAM C-B STREAM A-C STREAM A-B I --------------------------------------------------------- I 662.57 0.24 0.24 I --------------------------------------------------------- (NB These values do not allow for any site specific corrections)
TRAFFIC DEMAND DATA ------------------- ----------------------- I ARM I FLOW SCALE(%) I ----------------------- I A I 100 I I B I 100 I I C I 100 I -----------------------
Demand set: 2020 PM Peak + Development TIME PERIOD BEGINS 15.45 AND ENDS 17.15 LENGTH OF TIME PERIOD - 90 MIN. LENGTH OF TIME SEGMENT - 15 MIN.
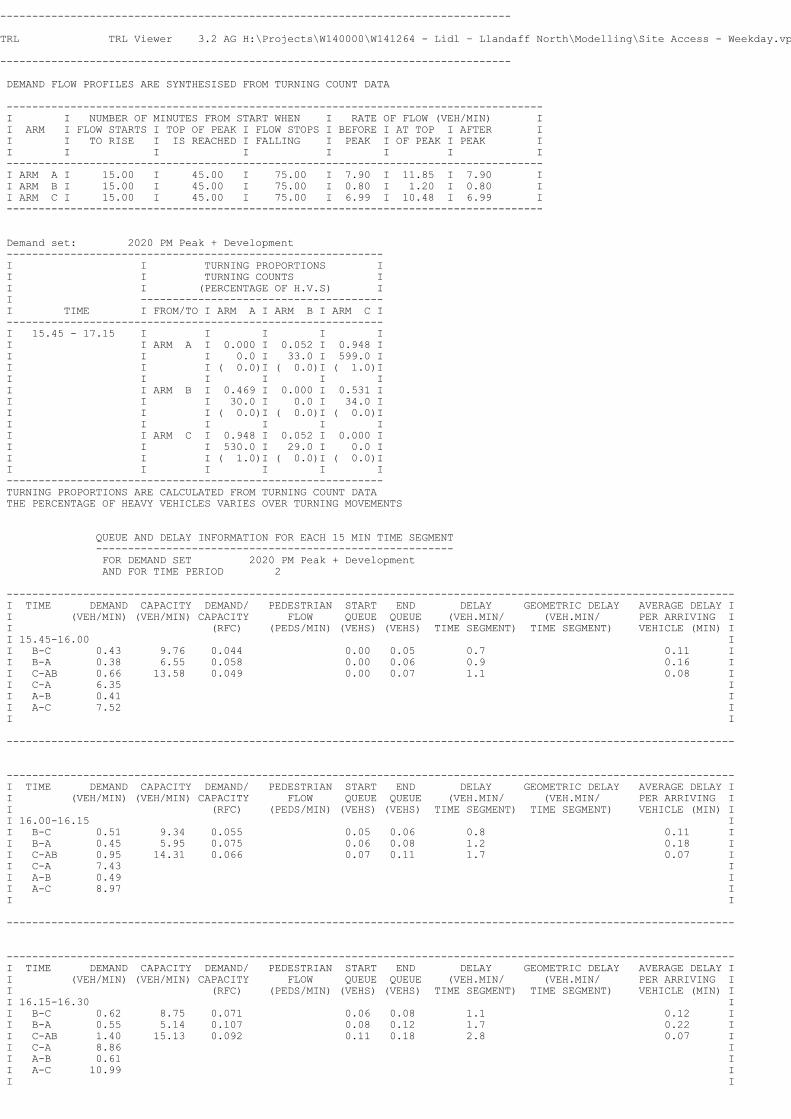
-------------------------------------------------------------------------------- TRL TRL Viewer 3.2 AG H:\Projects\W140000\W141264 - Lidl – Llandaff North\Modelling\Site Access - Weekday.vpo - Page 6 -------------------------------------------------------------------------------- DEMAND FLOW PROFILES ARE SYNTHESISED FROM TURNING COUNT DATA ------------------------------------------------------------------------------------ I I NUMBER OF MINUTES FROM START WHEN I RATE OF FLOW (VEH/MIN) I I ARM I FLOW STARTS I TOP OF PEAK I FLOW STOPS I BEFORE I AT TOP I AFTER I I I TO RISE I IS REACHED I FALLING I PEAK I OF PEAK I PEAK I I I I I I I I I ------------------------------------------------------------------------------------ I ARM A I 15.00 I 45.00 I 75.00 I 7.90 I 11.85 I 7.90 I I ARM B I 15.00 I 45.00 I 75.00 I 0.80 I 1.20 I 0.80 I I ARM C I 15.00 I 45.00 I 75.00 I 6.99 I 10.48 I 6.99 I ------------------------------------------------------------------------------------
Demand set: 2020 PM Peak + Development ----------------------------------------------------------- I I TURNING PROPORTIONS I I I TURNING COUNTS I I I (PERCENTAGE OF H.V.S) I I -------------------------------------- I TIME I FROM/TO I ARM A I ARM B I ARM C I ----------------------------------------------------------- I 15.45 - 17.15 I I I I I I I ARM A I 0.000 I 0.052 I 0.948 I I I I 0.0 I 33.0 I 599.0 I I I I ( 0.0)I ( 0.0)I ( 1.0)I I I I I I I I I ARM B I 0.469 I 0.000 I 0.531 I I I I 30.0 I 0.0 I 34.0 I I I I ( 0.0)I ( 0.0)I ( 0.0)I I I I I I I I I ARM C I 0.948 I 0.052 I 0.000 I I I I 530.0 I 29.0 I 0.0 I I I I ( 1.0)I ( 0.0)I ( 0.0)I I I I I I I ----------------------------------------------------------- TURNING PROPORTIONS ARE CALCULATED FROM TURNING COUNT DATA THE PERCENTAGE OF HEAVY VEHICLES VARIES OVER TURNING MOVEMENTS
QUEUE AND DELAY INFORMATION FOR EACH 15 MIN TIME SEGMENT -------------------------------------------------------- FOR DEMAND SET 2020 PM Peak + Development AND FOR TIME PERIOD 2
------------------------------------------------------------------------------------------------------------------ I TIME DEMAND CAPACITY DEMAND/ PEDESTRIAN START END DELAY GEOMETRIC DELAY AVERAGE DELAY I I (VEH/MIN) (VEH/MIN) CAPACITY FLOW QUEUE QUEUE (VEH.MIN/ (VEH.MIN/ PER ARRIVING I I (RFC) (PEDS/MIN) (VEHS) (VEHS) TIME SEGMENT) TIME SEGMENT) VEHICLE (MIN) I I 15.45-16.00 I I B-C 0.43 9.76 0.044 0.00 0.05 0.7 0.11 I I B-A 0.38 6.55 0.058 0.00 0.06 0.9 0.16 I I C-AB 0.66 13.58 0.049 0.00 0.07 1.1 0.08 I I C-A 6.35 I I A-B 0.41 I I A-C 7.52 I I I
------------------------------------------------------------------------------------------------------------------
------------------------------------------------------------------------------------------------------------------ I TIME DEMAND CAPACITY DEMAND/ PEDESTRIAN START END DELAY GEOMETRIC DELAY AVERAGE DELAY I I (VEH/MIN) (VEH/MIN) CAPACITY FLOW QUEUE QUEUE (VEH.MIN/ (VEH.MIN/ PER ARRIVING I I (RFC) (PEDS/MIN) (VEHS) (VEHS) TIME SEGMENT) TIME SEGMENT) VEHICLE (MIN) I I 16.00-16.15 I I B-C 0.51 9.34 0.055 0.05 0.06 0.8 0.11 I I B-A 0.45 5.95 0.075 0.06 0.08 1.2 0.18 I I C-AB 0.95 14.31 0.066 0.07 0.11 1.7 0.07 I I C-A 7.43 I I A-B 0.49 I I A-C 8.97 I I I
------------------------------------------------------------------------------------------------------------------
------------------------------------------------------------------------------------------------------------------ I TIME DEMAND CAPACITY DEMAND/ PEDESTRIAN START END DELAY GEOMETRIC DELAY AVERAGE DELAY I I (VEH/MIN) (VEH/MIN) CAPACITY FLOW QUEUE QUEUE (VEH.MIN/ (VEH.MIN/ PER ARRIVING I I (RFC) (PEDS/MIN) (VEHS) (VEHS) TIME SEGMENT) TIME SEGMENT) VEHICLE (MIN) I I 16.15-16.30 I I B-C 0.62 8.75 0.071 0.06 0.08 1.1 0.12 I I B-A 0.55 5.14 0.107 0.08 0.12 1.7 0.22 I I C-AB 1.40 15.13 0.092 0.11 0.18 2.8 0.07 I I C-A 8.86 I I A-B 0.61 I I A-C 10.99 I I I
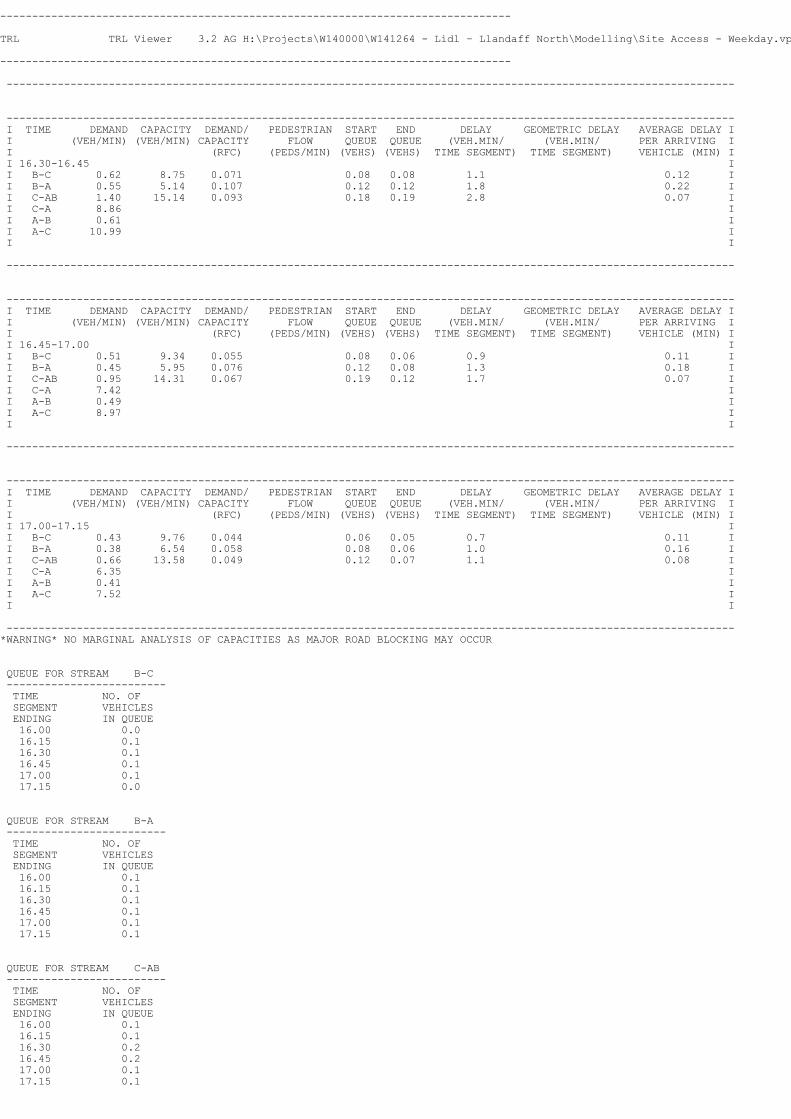
-------------------------------------------------------------------------------- TRL TRL Viewer 3.2 AG H:\Projects\W140000\W141264 - Lidl – Llandaff North\Modelling\Site Access - Weekday.vpo - Page 7 -------------------------------------------------------------------------------- ------------------------------------------------------------------------------------------------------------------
------------------------------------------------------------------------------------------------------------------ I TIME DEMAND CAPACITY DEMAND/ PEDESTRIAN START END DELAY GEOMETRIC DELAY AVERAGE DELAY I I (VEH/MIN) (VEH/MIN) CAPACITY FLOW QUEUE QUEUE (VEH.MIN/ (VEH.MIN/ PER ARRIVING I I (RFC) (PEDS/MIN) (VEHS) (VEHS) TIME SEGMENT) TIME SEGMENT) VEHICLE (MIN) I I 16.30-16.45 I I B-C 0.62 8.75 0.071 0.08 0.08 1.1 0.12 I I B-A 0.55 5.14 0.107 0.12 0.12 1.8 0.22 I I C-AB 1.40 15.14 0.093 0.18 0.19 2.8 0.07 I I C-A 8.86 I I A-B 0.61 I I A-C 10.99 I I I
------------------------------------------------------------------------------------------------------------------
------------------------------------------------------------------------------------------------------------------ I TIME DEMAND CAPACITY DEMAND/ PEDESTRIAN START END DELAY GEOMETRIC DELAY AVERAGE DELAY I I (VEH/MIN) (VEH/MIN) CAPACITY FLOW QUEUE QUEUE (VEH.MIN/ (VEH.MIN/ PER ARRIVING I I (RFC) (PEDS/MIN) (VEHS) (VEHS) TIME SEGMENT) TIME SEGMENT) VEHICLE (MIN) I I 16.45-17.00 I I B-C 0.51 9.34 0.055 0.08 0.06 0.9 0.11 I I B-A 0.45 5.95 0.076 0.12 0.08 1.3 0.18 I I C-AB 0.95 14.31 0.067 0.19 0.12 1.7 0.07 I I C-A 7.42 I I A-B 0.49 I I A-C 8.97 I I I
------------------------------------------------------------------------------------------------------------------
------------------------------------------------------------------------------------------------------------------ I TIME DEMAND CAPACITY DEMAND/ PEDESTRIAN START END DELAY GEOMETRIC DELAY AVERAGE DELAY I I (VEH/MIN) (VEH/MIN) CAPACITY FLOW QUEUE QUEUE (VEH.MIN/ (VEH.MIN/ PER ARRIVING I I (RFC) (PEDS/MIN) (VEHS) (VEHS) TIME SEGMENT) TIME SEGMENT) VEHICLE (MIN) I I 17.00-17.15 I I B-C 0.43 9.76 0.044 0.06 0.05 0.7 0.11 I I B-A 0.38 6.54 0.058 0.08 0.06 1.0 0.16 I I C-AB 0.66 13.58 0.049 0.12 0.07 1.1 0.08 I I C-A 6.35 I I A-B 0.41 I I A-C 7.52 I I I
------------------------------------------------------------------------------------------------------------------*WARNING* NO MARGINAL ANALYSIS OF CAPACITIES AS MAJOR ROAD BLOCKING MAY OCCUR
QUEUE FOR STREAM B-C ------------------------- TIME NO. OF SEGMENT VEHICLES ENDING IN QUEUE 16.00 0.0 16.15 0.1 16.30 0.1 16.45 0.1 17.00 0.1 17.15 0.0
QUEUE FOR STREAM B-A ------------------------- TIME NO. OF SEGMENT VEHICLES ENDING IN QUEUE 16.00 0.1 16.15 0.1 16.30 0.1 16.45 0.1 17.00 0.1 17.15 0.1
QUEUE FOR STREAM C-AB ------------------------- TIME NO. OF SEGMENT VEHICLES ENDING IN QUEUE 16.00 0.1 16.15 0.1 16.30 0.2 16.45 0.2 17.00 0.1 17.15 0.1
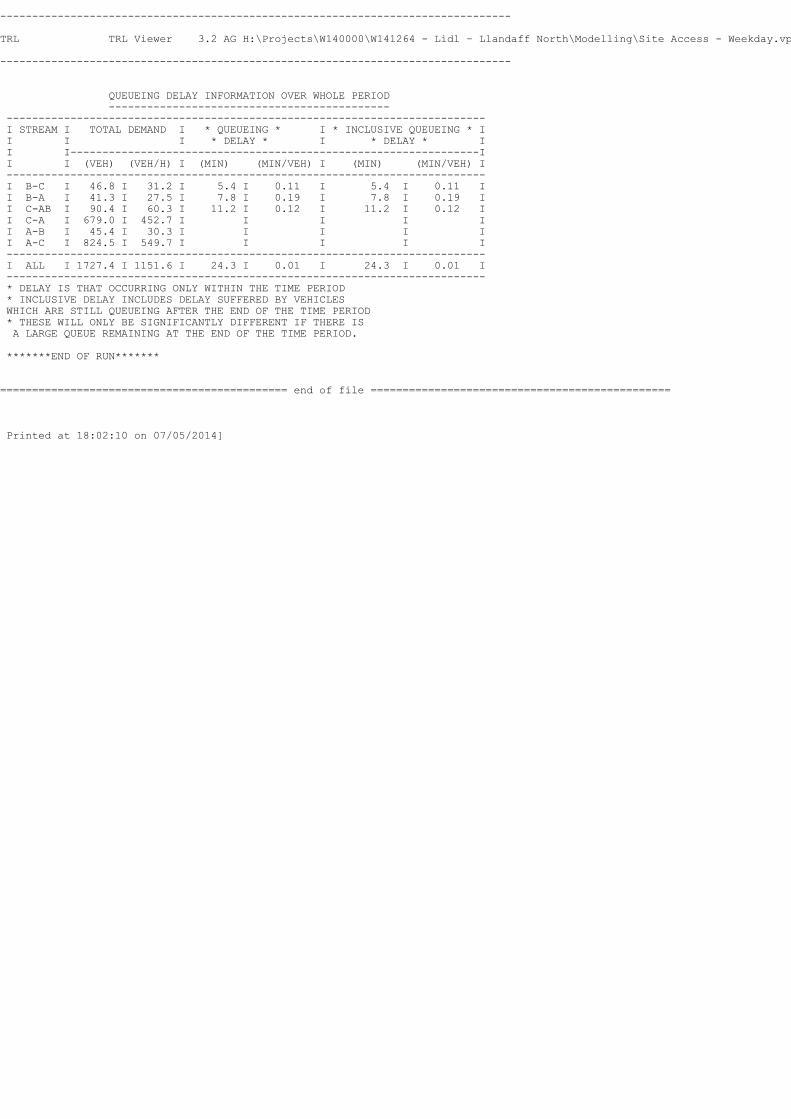
-------------------------------------------------------------------------------- TRL TRL Viewer 3.2 AG H:\Projects\W140000\W141264 - Lidl – Llandaff North\Modelling\Site Access - Weekday.vpo - Page 8 -------------------------------------------------------------------------------- QUEUEING DELAY INFORMATION OVER WHOLE PERIOD -------------------------------------------- --------------------------------------------------------------------------- I STREAM I TOTAL DEMAND I * QUEUEING * I * INCLUSIVE QUEUEING * I I I I * DELAY * I * DELAY * I I I----------------------------------------------------------------I I I (VEH) (VEH/H) I (MIN) (MIN/VEH) I (MIN) (MIN/VEH) I --------------------------------------------------------------------------- I B-C I 46.8 I 31.2 I 5.4 I 0.11 I 5.4 I 0.11 I I B-A I 41.3 I 27.5 I 7.8 I 0.19 I 7.8 I 0.19 I I C-AB I 90.4 I 60.3 I 11.2 I 0.12 I 11.2 I 0.12 I I C-A I 679.0 I 452.7 I I I I I I A-B I 45.4 I 30.3 I I I I I I A-C I 824.5 I 549.7 I I I I I --------------------------------------------------------------------------- I ALL I 1727.4 I 1151.6 I 24.3 I 0.01 I 24.3 I 0.01 I --------------------------------------------------------------------------- * DELAY IS THAT OCCURRING ONLY WITHIN THE TIME PERIOD * INCLUSIVE DELAY INCLUDES DELAY SUFFERED BY VEHICLES WHICH ARE STILL QUEUEING AFTER THE END OF THE TIME PERIOD * THESE WILL ONLY BE SIGNIFICANTLY DIFFERENT IF THERE IS A LARGE QUEUE REMAINING AT THE END OF THE TIME PERIOD. *******END OF RUN******* ============================================= end of file ===============================================
Printed at 18:02:10 on 07/05/2014]

-------------------------------------------------------------------------------- TRL TRL Viewer 3.2 AG H:\Projects\W140000\W141264 - Lidl – Llandaff North\Modelling\Site Access - Saturday.vpo - Page 1 -------------------------------------------------------------------------------- TRL LIMITED (C) COPYRIGHT 2010 CAPACITIES, QUEUES, AND DELAYS AT 3 OR 4-ARM MAJOR/MINOR PRIORITY JUNCTIONS PICADY 5.1 ANALYSIS PROGRAM RELEASE 5.0 (JUNE 2010) (Patch 15 Apr 2011) ADAPTED FROM PICADY/3 WHICH IS CROWN COPYRIGHT BY PERMISSION OF THE CONTROLLER OF HMSO -------------------------------------------------------- FOR SALES AND DISTRIBUTION INFORMATION, PROGRAM ADVICE AND MAINTENANCE CONTACT: TRL SOFTWARE SALES TEL: CROWTHORNE (01344) 770758, FAX: 770356 EMAIL: [email protected] -------------------------------------------------------- THE USER OF THIS COMPUTER PROGRAM FOR THE SOLUTION OF AN ENGINEERING PROBLEM IS IN NO WAY RELIEVED OF HIS/HER RESPONSIBILITY FOR THE CORRECTNESS OF THE SOLUTION Run with file:- "H:\Projects\W140000\W141264 - Lidl – Llandaff North\Modelling\Site Access - Saturday.vpi"(drive-on-the-left) at 18:00:41 on Wednesday, 7 May 2014
RUN INFORMATION *************** RUN TITLE : Lidl Llandaff North LOCATION : Cardiff DATE : 10/04/14 CLIENT : Lidl UK Gmbh ENUMERATOR : Cerian Rowlands JOB NUMBER : 141264 STATUS : DESCRIPTION :
MAJOR/MINOR JUNCTION CAPACITY AND DELAY *************************************** INPUT DATA ---------- MAJOR ROAD (ARM C) --------------------- MAJOR ROAD (ARM A) I I I I I I MINOR ROAD (ARM B) ARM A IS Station Road (S) ARM B IS Site Access ARM C IS Station Road (N)
STREAM LABELLING CONVENTION --------------------------- STREAM A-B CONTAINS TRAFFIC GOING FROM ARM A TO ARM B STREAM B-AC CONTAINS TRAFFIC GOING FROM ARM B TO ARM A AND TO ARM C ETC.
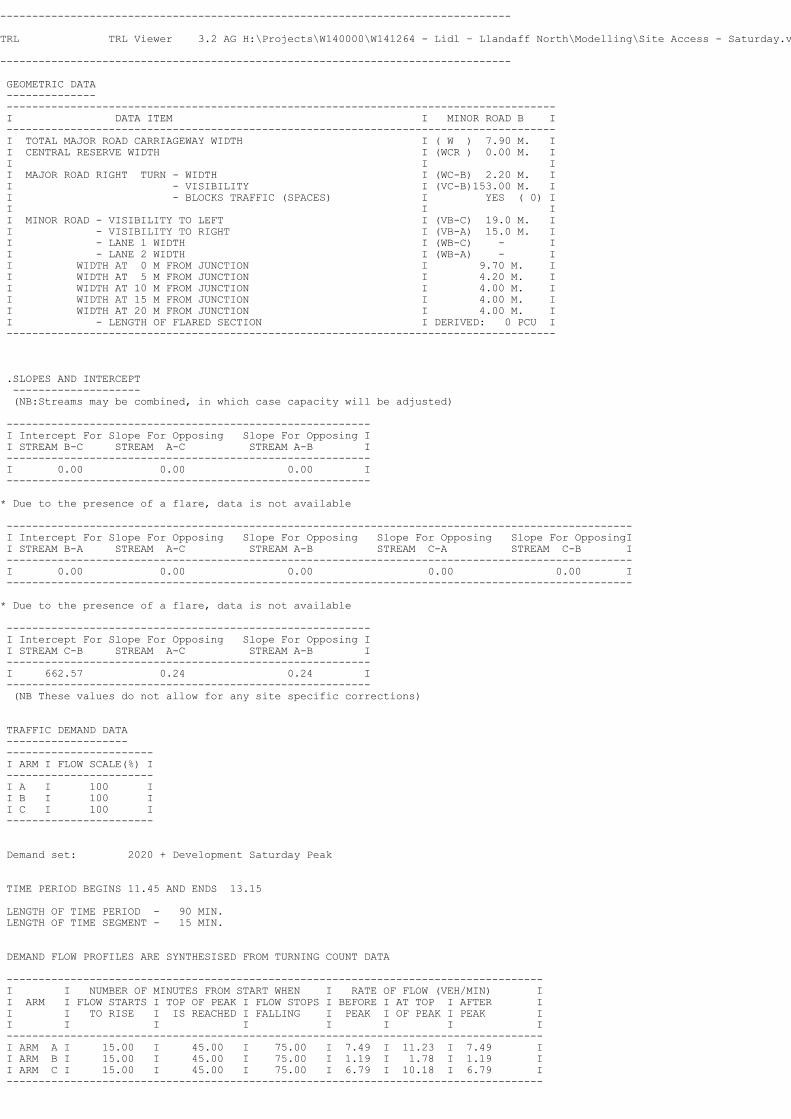
-------------------------------------------------------------------------------- TRL TRL Viewer 3.2 AG H:\Projects\W140000\W141264 - Lidl – Llandaff North\Modelling\Site Access - Saturday.vpo - Page 2 -------------------------------------------------------------------------------- GEOMETRIC DATA -------------- -------------------------------------------------------------------------------------- I DATA ITEM I MINOR ROAD B I -------------------------------------------------------------------------------------- I TOTAL MAJOR ROAD CARRIAGEWAY WIDTH I ( W ) 7.90 M. I I CENTRAL RESERVE WIDTH I (WCR ) 0.00 M. I I I I I MAJOR ROAD RIGHT TURN - WIDTH I (WC-B) 2.20 M. I I - VISIBILITY I (VC-B)153.00 M. I I - BLOCKS TRAFFIC (SPACES) I YES ( 0) I I I I I MINOR ROAD - VISIBILITY TO LEFT I (VB-C) 19.0 M. I I - VISIBILITY TO RIGHT I (VB-A) 15.0 M. I I - LANE 1 WIDTH I (WB-C) - I I - LANE 2 WIDTH I (WB-A) - I I WIDTH AT 0 M FROM JUNCTION I 9.70 M. I I WIDTH AT 5 M FROM JUNCTION I 4.20 M. I I WIDTH AT 10 M FROM JUNCTION I 4.00 M. I I WIDTH AT 15 M FROM JUNCTION I 4.00 M. I I WIDTH AT 20 M FROM JUNCTION I 4.00 M. I I - LENGTH OF FLARED SECTION I DERIVED: 0 PCU I -------------------------------------------------------------------------------------- .SLOPES AND INTERCEPT -------------------- (NB:Streams may be combined, in which case capacity will be adjusted) --------------------------------------------------------- I Intercept For Slope For Opposing Slope For Opposing I I STREAM B-C STREAM A-C STREAM A-B I --------------------------------------------------------- I 0.00 0.00 0.00 I --------------------------------------------------------- * Due to the presence of a flare, data is not available -------------------------------------------------------------------------------------------------- I Intercept For Slope For Opposing Slope For Opposing Slope For Opposing Slope For OpposingI I STREAM B-A STREAM A-C STREAM A-B STREAM C-A STREAM C-B I -------------------------------------------------------------------------------------------------- I 0.00 0.00 0.00 0.00 0.00 I -------------------------------------------------------------------------------------------------- * Due to the presence of a flare, data is not available --------------------------------------------------------- I Intercept For Slope For Opposing Slope For Opposing I I STREAM C-B STREAM A-C STREAM A-B I --------------------------------------------------------- I 662.57 0.24 0.24 I --------------------------------------------------------- (NB These values do not allow for any site specific corrections)
TRAFFIC DEMAND DATA ------------------- ----------------------- I ARM I FLOW SCALE(%) I ----------------------- I A I 100 I I B I 100 I I C I 100 I -----------------------
Demand set: 2020 + Development Saturday Peak TIME PERIOD BEGINS 11.45 AND ENDS 13.15 LENGTH OF TIME PERIOD - 90 MIN. LENGTH OF TIME SEGMENT - 15 MIN.
DEMAND FLOW PROFILES ARE SYNTHESISED FROM TURNING COUNT DATA ------------------------------------------------------------------------------------ I I NUMBER OF MINUTES FROM START WHEN I RATE OF FLOW (VEH/MIN) I I ARM I FLOW STARTS I TOP OF PEAK I FLOW STOPS I BEFORE I AT TOP I AFTER I I I TO RISE I IS REACHED I FALLING I PEAK I OF PEAK I PEAK I I I I I I I I I ------------------------------------------------------------------------------------ I ARM A I 15.00 I 45.00 I 75.00 I 7.49 I 11.23 I 7.49 I I ARM B I 15.00 I 45.00 I 75.00 I 1.19 I 1.78 I 1.19 I I ARM C I 15.00 I 45.00 I 75.00 I 6.79 I 10.18 I 6.79 I ------------------------------------------------------------------------------------

-------------------------------------------------------------------------------- TRL TRL Viewer 3.2 AG H:\Projects\W140000\W141264 - Lidl – Llandaff North\Modelling\Site Access - Saturday.vpo - Page 3 -------------------------------------------------------------------------------- Demand set: 2020 + Development Saturday Peak ----------------------------------------------------------- I I TURNING PROPORTIONS I I I TURNING COUNTS I I I (PERCENTAGE OF H.V.S) I I -------------------------------------- I TIME I FROM/TO I ARM A I ARM B I ARM C I ----------------------------------------------------------- I 11.45 - 13.15 I I I I I I I ARM A I 0.000 I 0.082 I 0.918 I I I I 0.0 I 49.0 I 550.0 I I I I ( 0.0)I ( 0.0)I ( 0.0)I I I I I I I I I ARM B I 0.474 I 0.000 I 0.526 I I I I 45.0 I 0.0 I 50.0 I I I I ( 0.0)I ( 0.0)I ( 0.0)I I I I I I I I I ARM C I 0.917 I 0.083 I 0.000 I I I I 498.0 I 45.0 I 0.0 I I I I ( 1.0)I ( 0.0)I ( 0.0)I I I I I I I ----------------------------------------------------------- TURNING PROPORTIONS ARE CALCULATED FROM TURNING COUNT DATA THE PERCENTAGE OF HEAVY VEHICLES VARIES OVER TURNING MOVEMENTS
QUEUE AND DELAY INFORMATION FOR EACH 15 MIN TIME SEGMENT -------------------------------------------------------- FOR DEMAND SET 2020 + Development Saturday Peak AND FOR TIME PERIOD 1
------------------------------------------------------------------------------------------------------------------ I TIME DEMAND CAPACITY DEMAND/ PEDESTRIAN START END DELAY GEOMETRIC DELAY AVERAGE DELAY I I (VEH/MIN) (VEH/MIN) CAPACITY FLOW QUEUE QUEUE (VEH.MIN/ (VEH.MIN/ PER ARRIVING I I (RFC) (PEDS/MIN) (VEHS) (VEHS) TIME SEGMENT) TIME SEGMENT) VEHICLE (MIN) I I 11.45-12.00 I I B-C 0.63 9.85 0.064 0.00 0.07 1.0 0.11 I I B-A 0.56 6.69 0.084 0.00 0.09 1.3 0.16 I I C-AB 1.03 13.54 0.076 0.00 0.14 2.0 0.08 I I C-A 5.78 I I A-B 0.61 I I A-C 6.90 I I I
------------------------------------------------------------------------------------------------------------------
------------------------------------------------------------------------------------------------------------------ I TIME DEMAND CAPACITY DEMAND/ PEDESTRIAN START END DELAY GEOMETRIC DELAY AVERAGE DELAY I I (VEH/MIN) (VEH/MIN) CAPACITY FLOW QUEUE QUEUE (VEH.MIN/ (VEH.MIN/ PER ARRIVING I I (RFC) (PEDS/MIN) (VEHS) (VEHS) TIME SEGMENT) TIME SEGMENT) VEHICLE (MIN) I I 12.00-12.15 I I B-C 0.75 9.44 0.079 0.07 0.09 1.3 0.11 I I B-A 0.67 6.12 0.110 0.09 0.12 1.8 0.18 I I C-AB 1.40 14.09 0.100 0.14 0.21 3.1 0.08 I I C-A 6.73 I I A-B 0.73 I I A-C 8.24 I I I
------------------------------------------------------------------------------------------------------------------
------------------------------------------------------------------------------------------------------------------ I TIME DEMAND CAPACITY DEMAND/ PEDESTRIAN START END DELAY GEOMETRIC DELAY AVERAGE DELAY I I (VEH/MIN) (VEH/MIN) CAPACITY FLOW QUEUE QUEUE (VEH.MIN/ (VEH.MIN/ PER ARRIVING I I (RFC) (PEDS/MIN) (VEHS) (VEHS) TIME SEGMENT) TIME SEGMENT) VEHICLE (MIN) I I 12.15-12.30 I I B-C 0.92 8.86 0.104 0.09 0.11 1.7 0.13 I I B-A 0.83 5.34 0.155 0.12 0.18 2.6 0.22 I I C-AB 2.05 14.86 0.138 0.21 0.35 5.3 0.08 I I C-A 7.92 I I A-B 0.90 I I A-C 10.09 I I I
------------------------------------------------------------------------------------------------------------------
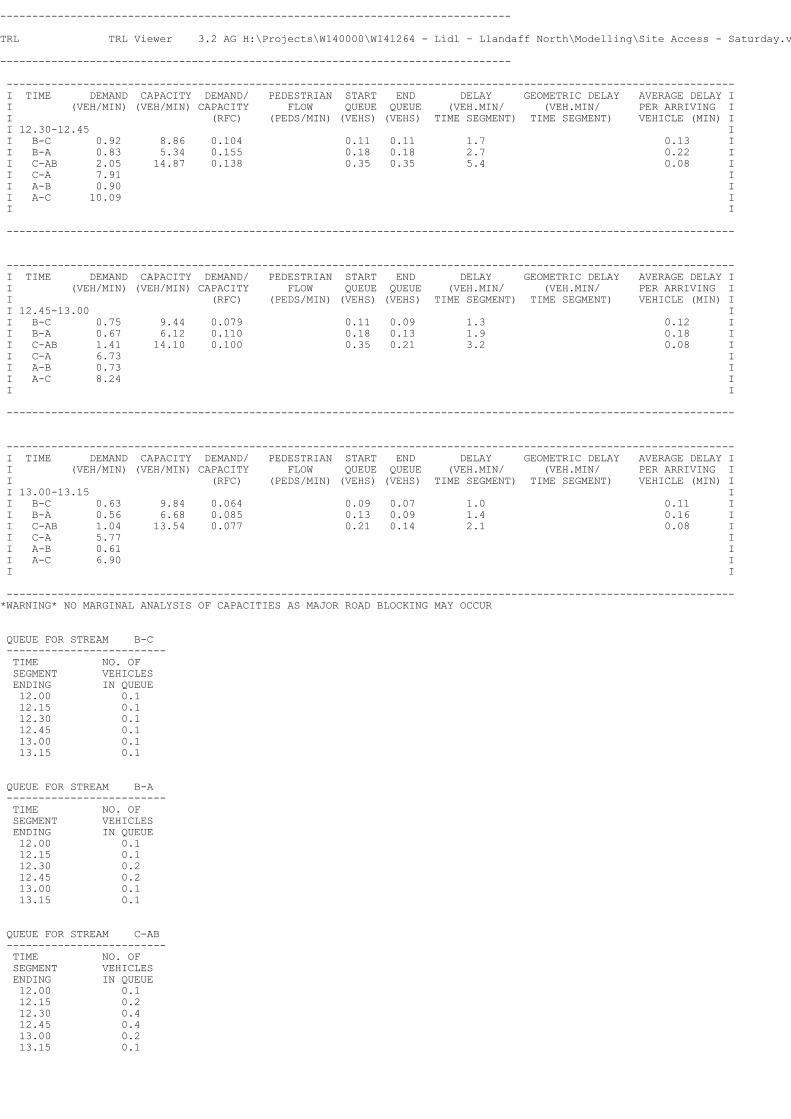
-------------------------------------------------------------------------------- TRL TRL Viewer 3.2 AG H:\Projects\W140000\W141264 - Lidl – Llandaff North\Modelling\Site Access - Saturday.vpo - Page 4 -------------------------------------------------------------------------------- ------------------------------------------------------------------------------------------------------------------ I TIME DEMAND CAPACITY DEMAND/ PEDESTRIAN START END DELAY GEOMETRIC DELAY AVERAGE DELAY I I (VEH/MIN) (VEH/MIN) CAPACITY FLOW QUEUE QUEUE (VEH.MIN/ (VEH.MIN/ PER ARRIVING I I (RFC) (PEDS/MIN) (VEHS) (VEHS) TIME SEGMENT) TIME SEGMENT) VEHICLE (MIN) I I 12.30-12.45 I I B-C 0.92 8.86 0.104 0.11 0.11 1.7 0.13 I I B-A 0.83 5.34 0.155 0.18 0.18 2.7 0.22 I I C-AB 2.05 14.87 0.138 0.35 0.35 5.4 0.08 I I C-A 7.91 I I A-B 0.90 I I A-C 10.09 I I I
------------------------------------------------------------------------------------------------------------------
------------------------------------------------------------------------------------------------------------------ I TIME DEMAND CAPACITY DEMAND/ PEDESTRIAN START END DELAY GEOMETRIC DELAY AVERAGE DELAY I I (VEH/MIN) (VEH/MIN) CAPACITY FLOW QUEUE QUEUE (VEH.MIN/ (VEH.MIN/ PER ARRIVING I I (RFC) (PEDS/MIN) (VEHS) (VEHS) TIME SEGMENT) TIME SEGMENT) VEHICLE (MIN) I I 12.45-13.00 I I B-C 0.75 9.44 0.079 0.11 0.09 1.3 0.12 I I B-A 0.67 6.12 0.110 0.18 0.13 1.9 0.18 I I C-AB 1.41 14.10 0.100 0.35 0.21 3.2 0.08 I I C-A 6.73 I I A-B 0.73 I I A-C 8.24 I I I
------------------------------------------------------------------------------------------------------------------
------------------------------------------------------------------------------------------------------------------ I TIME DEMAND CAPACITY DEMAND/ PEDESTRIAN START END DELAY GEOMETRIC DELAY AVERAGE DELAY I I (VEH/MIN) (VEH/MIN) CAPACITY FLOW QUEUE QUEUE (VEH.MIN/ (VEH.MIN/ PER ARRIVING I I (RFC) (PEDS/MIN) (VEHS) (VEHS) TIME SEGMENT) TIME SEGMENT) VEHICLE (MIN) I I 13.00-13.15 I I B-C 0.63 9.84 0.064 0.09 0.07 1.0 0.11 I I B-A 0.56 6.68 0.085 0.13 0.09 1.4 0.16 I I C-AB 1.04 13.54 0.077 0.21 0.14 2.1 0.08 I I C-A 5.77 I I A-B 0.61 I I A-C 6.90 I I I
------------------------------------------------------------------------------------------------------------------*WARNING* NO MARGINAL ANALYSIS OF CAPACITIES AS MAJOR ROAD BLOCKING MAY OCCUR
QUEUE FOR STREAM B-C ------------------------- TIME NO. OF SEGMENT VEHICLES ENDING IN QUEUE 12.00 0.1 12.15 0.1 12.30 0.1 12.45 0.1 13.00 0.1 13.15 0.1
QUEUE FOR STREAM B-A ------------------------- TIME NO. OF SEGMENT VEHICLES ENDING IN QUEUE 12.00 0.1 12.15 0.1 12.30 0.2 12.45 0.2 13.00 0.1 13.15 0.1
QUEUE FOR STREAM C-AB ------------------------- TIME NO. OF SEGMENT VEHICLES ENDING IN QUEUE 12.00 0.1 12.15 0.2 12.30 0.4 12.45 0.4 13.00 0.2 13.15 0.1

-------------------------------------------------------------------------------- TRL TRL Viewer 3.2 AG H:\Projects\W140000\W141264 - Lidl – Llandaff North\Modelling\Site Access - Saturday.vpo - Page 5 -------------------------------------------------------------------------------- QUEUEING DELAY INFORMATION OVER WHOLE PERIOD -------------------------------------------- --------------------------------------------------------------------------- I STREAM I TOTAL DEMAND I * QUEUEING * I * INCLUSIVE QUEUEING * I I I I * DELAY * I * DELAY * I I I----------------------------------------------------------------I I I (VEH) (VEH/H) I (MIN) (MIN/VEH) I (MIN) (MIN/VEH) I --------------------------------------------------------------------------- I B-C I 68.8 I 45.9 I 8.0 I 0.12 I 8.0 I 0.12 I I B-A I 61.9 I 41.3 I 11.8 I 0.19 I 11.8 I 0.19 I I C-AB I 134.7 I 89.8 I 21.2 I 0.16 I 21.2 I 0.16 I I C-A I 612.7 I 408.5 I I I I I I A-B I 67.4 I 45.0 I I I I I I A-C I 757.0 I 504.7 I I I I I --------------------------------------------------------------------------- I ALL I 1702.6 I 1135.1 I 41.0 I 0.02 I 41.0 I 0.02 I --------------------------------------------------------------------------- * DELAY IS THAT OCCURRING ONLY WITHIN THE TIME PERIOD * INCLUSIVE DELAY INCLUDES DELAY SUFFERED BY VEHICLES WHICH ARE STILL QUEUEING AFTER THE END OF THE TIME PERIOD * THESE WILL ONLY BE SIGNIFICANTLY DIFFERENT IF THERE IS A LARGE QUEUE REMAINING AT THE END OF THE TIME PERIOD. *******END OF RUN******* ============================================= end of file ===============================================
Printed at 18:01:03 on 07/05/2014]