Embed Size (px)
Citation preview

INTERNATIONAL LABOUR OFFICE
19th International Conference of Labour Statisticians
Geneva, 2-11 October 2013
Room Document: 5
Proposals for the statistical definition and measurement of green jobs

2

3
Proposals for the statistical definition and measurement of green jobs1
ILO Department of Statistics
Contents
Chapter1:Introduction.................................................................................................................5
Structure of the report ................................................................................................................................. 7
Chapter2:Definitionofthegreeneconomyandgreenjobsinthecontextofemploymentandenvironmentpolicy.....................................................................................8
National and international efforts to define and measure the green economy and green jobs ...................... 9
Chapter3:Objectivesandusesofstatisticsongreenjobs.............................................12
General requirements and types of user ..................................................................................................... 12
Specific policy issues for which statistics are required ................................................................................. 13
Chapter4:Proposedoperationaldefinitionsofconceptsforthestatisticalmeasurementofgreenjobs.......................................................................................................15
Units of observation and analysis ............................................................................................................... 16
Concept and domain of the environmental sector ...................................................................................... 16
Employment in the environmental sector ................................................................................................... 18
Chapter5:Measurementissuesandconsiderations.......................................................21
Employment in production of environmental outputs ‐ measurement ........................................................ 21
Employment in environmental processes ................................................................................................... 22
Households as producers of environmental goods and services ................................................................... 23
Employment in production units supplying goods and services to the environmental sector ........................ 24
Employment in carbon‐free and energy‐efficient enterprises ...................................................................... 24
1 Prepared by Valentina Stoevska and David Hunter, Senior Statisticians, ILO Department of Statistics.

4
Chapter6:Datacollectionmethods........................................................................................25
Surveys and censuses ................................................................................................................................. 25
Surveying employment in the agriculture and informal sectors ................................................................... 26
Inventories of producers of environmental goods and services ................................................................... 26
Modelling .................................................................................................................................................. 27
Chapter7:Typesofdatatobecollected,statisticalmeasuresandindicatorstobeproduced..........................................................................................................................................28
References.......................................................................................................................................31
APPENDIXI:Existingconceptsanddefinitionsrelatedtothegreeneconomy.......33
APPENDIXII:Somecountrypracticesindefininggreenjobs ......................................... 36
APPENDIXIII:Estimatesofgreenemploymentformselectedcountries..................40
5
Chapter1: Introduction
1. Over the past few years the international community has emphasized the implications of climate changes and environmental degradation for economic and social development, and the importance of shifting toward a green and sustainable economy. The green economy, in its various forms, is seen as providing a response to the multiple crises – climate, food, financial, economic – that the world has been facing in recent years because it provides significant opportunities for job creation and economic growth and as a model for achieving sustainable development. Advocates of this shift to a greener economy point out that, although it may put a financial burden on polluting industries and cause a shift of employment across industries and regions, it will bring new economic activities into being that provide significant opportunities for investment, economic growth and jobs.
2. The concept of the green economy as an important pathway to sustainable development was considered by the United Nations Conference on Sustainable Development (Rio+20 Conference), held in Rio de Janeiro in June 2012. According to the outcome document of the Conference, The future we want,2 the Rio+20 Conference:
- considers the green economy as one of the important tools available for achieving sustainable development (paragraph 56);
- invites governments to improve knowledge and statistical capacity on job trends, developments and constraints and integrate relevant data into national statistics, with the support of relevant United Nations agencies within their mandates (paragraph 62);
- invites the United Nations system, in cooperation with relevant donors and international organizations, to coordinate and provide information methodologies for evaluation of policies on green economy in the context of sustainable development and poverty eradication (paragraph 66);
- resolves to promote access to reliable, relevant and timely data in areas related to the three dimensions of sustainable development3 (paragraph 76).
3. Statistics on production and employment in the green sector of the economy have also been strongly requested by policy departments and businesses to assist in (i) gaining a better understanding of the impact (both costs and benefits) of “greening the economy” and implementing green economy policies on the labour market, and (ii) ensuring that effective policy measures and tools are formulated to respond to this shift to a greener economy. The ILO, in particular, has seen a growing demand for statistical data of green jobs (in terms of the size, composition and contribution of the specific groups of workers and economic units to the green economy) that would enrich existing labour market information at the international and country level. The ILO has already made efforts to measure the number of green jobs in various countries. From this exercise it has become clear that the concept is extremely complex and that:
‐ a standard conceptual framework is required;
‐ practical measurement aspects should not be neglected.
2 The future we want, Outcome document of the United Nations Conference on Sustainable Development, available at http://www.uncsd2012.org/content/documents/727The%20Future%20We%20Want%2019%20June%201230pm.pdf
3 Three dimensions of sustainable development are social, economic and environmental.

6
4. In order to respond to the need for conceptual and practical guidelines on the measurement on green jobs, the ILO Department of Statistics has begun work on draft proposals for a statistical definition of green jobs and associated conceptual guidelines that are a prerequisite for collecting statistics and producing internationally harmonized and comparable data. In developing the definition, consistency with existing standards related to labour statistics and environmental statistic has been a guiding principle.
5. The first draft proposal was discussed by a group of experts at an informal meeting organized by the ILO on 27‐28 November 2012.4 The group was composed of labour statisticians and experts on environmental statistics and the meeting discussed the proposed definition of green jobs, the variables of interest, the measurement approach, the classifications to be used and the valuation principle and made a number of suggestions to clarify the concepts. The draft proposal also benefited from the comments made by many statistical offices on the practicability of the methods and procedures recommended in the proposal.
6. A revised version of the draft conceptual and measurement framework for defining and identifying green jobs was included in the ILO report Sustainable development, decent work and green jobs5 that was prepared for discussion by the 102nd Session of the International Labour Conference in 2013. In its conclusions (paragraph 19) the International Labour Conference stated that the International Labour Office should "carry out research aiming to assist countries and social partners to assess the impact of greening the economy on job creation, job transition and the quality of work, including through the compilation and wide dissemination of reliable statistics".6
7. The conceptual and measurement framework is submitted here in the form of draft guidelines (Appendix IV). In addition to outlining the framework, the guidelines highlight the principal uses of statistics on green jobs and indicate possible sources of data and the type of data and indicators that could be produced, as well as measurement methods. Although further expansion may be required in certain areas, the guidelines should facilitate the development and production of harmonized and comparable data.
8. The Conference may want to discuss:
the importance and feasibility, at the international level, of measuring green jobs;
the suitability and relevance of the proposed statistical definition of green jobs;
the possibility of adopting the draft text as a set of international statistical guidelines;
future steps in developing relevant international statistical standards on this topic.
4 See Technical Expert Consultation on Labour Statistics: Moving towards a statistical definition of green jobs, available at http://www.ilo.org/global/statistics‐and‐databases/meetings‐and‐events/international‐conference‐of‐labour‐statisticians/19/preparatory‐meetings/WCMS_195698/lang‐‐en/index.htm
5 Available at http://www.ilo.org/ilc/ILCSessions/102/reports/reports‐submitted/WCMS_207370/lang‐‐en/index.htm
6 See paragraph 19 (c) of the conclusions, Achieving decent work, green Jobs and sustainable development, in Provisional Record, International Labour Conference, 102nd Session, Geneva, June 2013, available at http://www.ilo.org/ilc/ILCSessions/102/reports/committee‐reports/WCMS_216378/lang‐‐en/index.htm

7
Structure of the report
9. This report, which has been prepared to facilitate the Conference's discussion, is organized as follows:
- Chapters 1 and 2 describe the policy context that is driving the demand for statistics on green jobs and on the green economy generally, with examples of recent national and international developments.
- Chapter 3 discusses the objectives and potential uses of statistics on green jobs.
- Chapter 4 proposes definitions of concepts for the statistical measurement of green jobs and employment in the environmental sector.
- Chapter 5 discusses issues and problems involved in the statistical measurement of employment in the environmental sector and proposes possible measurement methods.
- Chapter 6 discusses data collection issues and potential sources of data.
- Chapter 7 suggests the types of data and indicators that could be produced.
10. An overview of existing concepts and definitions related to the green economy is included as Appendix I. Appendix II contains a description of national practices in defining and measuring green jobs in selected countries. Appendix III presents data on a range of economic variables and on a number of jobs in the environmental goods and services sector in selected countries. Appendix IV includes draft guidelines concerning a statistical definition of employment in the environmental sector.

8
Chapter 2: Definition of the green economy and green jobs in the context of employment and environment policy
11. Before considering what is to be understood by a ‘green job’ it is useful to consider related terms such as ‘green economy’. The concept of green economy and green jobs is relatively new although sustainable development was defined in a 1987 report, Our common future7, prepared by the United Nations Brundtland Commission in 1987.
12. Whilst there has been a great deal of debate in the policy arena about the promotion and measurement of the green economy, the meaning of the term is far from universally consistent. Many organizations have developed their own definitions
13. UNEP, for example, has defined the green economy as "one that results in improved human well‐being and social equity, while significantly reducing environmental risks and ecological scarcities". It is "low carbon, resource efficient and socially inclusive".8 Another definition of the green economy, offered by a group of NGOs, trade union groups and others doing grassroots work on the subject (known as the Green Economy Coalition), defines it succinctly as a "resilient economy that provides a better quality of life for all within the ecological limits of the planet".9
14. Although the precise definition of ‘green’ varies among organizations, there are more similarities than differences in their view of what constitutes a green economy. A common theme is the preservation or restoration of the environment. Most studies also attempt to identify products and services that meet one of several criteria for a green economy. For products and services, most such definitions include:
environmentally friendly and enhancing products and services;
renewable energy products and services;
clean transportation and fuels;
"green" buildings (i.e. buildings that are energy and water efficient, reducing waste and pollution, etc.).
Some definitions also cite the processes by which products and services are produced, including:
energy‐efficient manufacturing, distribution, and construction;
use of high efficiency strategies to reduce energy, materials and water consumption.
15. Various reports have referred to related concepts such as green growth10, green‐collar worker11, low carbon economy, a circular economy, greening economy, transition to greener economies,
7 UN: Our Common Future, 1987, available at http://conspect.nl/pdf/Our_Common_Future‐Brundtland_Report_1987.pdf
8 UNEP: Green economy report, 2011, available at http://www.unep.org/greeneconomy/greeneconomyreport/tabid/29846/default.aspx
9 See http://www.greeneconomycoalition.org/about
10 OECD: Towards green growth: A summary for policy makers, 2011, available at http://www.oecd.org/greengrowth/48012345.pdf
11Andrew Hancock: How green is my occupation classification? An abstract is available on the Labour, Employment and Work in New Zealand website at http://www.victoria.ac.nz/vms/industrial‐relations‐centre/irc‐events/lew‐conference‐welcome/lew‐papers/D5_LEW14_final_paper_‐_Hancock.pdf

9
sustainable development, environmental development, green investments, green skills, green workplace, green labour market, etc. Information about the range of definitions related to the green economy, green growth and green jobs is provided in Appendix I.
16. Words such as ‘green’, ‘environmental’ and ‘sustainable’ are often used interchangeably to describe companies, people or technologies that do "greenish" things. Although they are not synonymous, they are all commonly used to refer to the way in which natural resources are used to produce goods and services. The term 'green jobs' usually refers to people working in ecologically sustainable or environmentally beneficial jobs.
17. Increasingly, the scope of a green economy is seen as going beyond the creation of environmental goods, services and jobs, since it includes the broader dimensions of energy and resource efficiency, poverty eradication, social equity and human well‐being as well. Many approaches have the added dimension of promoting social justice and decent work. As there is no single, agreed definition of the green economy, the discussion of its potential relation to sustainable development continues.
18. The definition of green jobs is also the subject of debate, and there is at present no consensus on the subject among researchers and practitioners. Most take an industry approach, identifying green jobs in industries that are judged to produce green products and services. The ILO and UNEP offer a broader definition in their 2008 report, Green jobs: Towards decent work in a sustainable, low‐carbon world,12 which comprises employment in green sectors as well as green occupations. It also includes employment in parts of economic activities that may not produce green product and services, such as construction, manufacture or transport, which operate in an environmentally friendly manner. Some studies have focused on how different occupations contribute to the greening of the economy, or have sought to define green jobs in terms of specific occupational groups. Most, if not all, of these attempts have certain limitations, in that they use definitions that are either too broad or are focused only on selected industries and/or occupations.
19. Many national governments are developing their own definitions, either to serve as a basis for collecting statistics or for making policy choices. More often than not, however, there is little agreement at the national level as to what is green and what is not green.
20. A further problem is that the practical meaning of many definitions of green job depends on the country and time they are referring to. According to the context, a type of activity may be viewed as contributing towards reducing carbon output or as a normal activity that does not change anything. The way in which the activity is viewed may also change over time. In some cases, researchers may decide that a particular percentage of jobs associated with an activity should be counted as green, but different researchers are likely to make different choices.
21. All these factors underline the importance of developing a standard conceptual framework along with appropriate operational definitions and measurement methods that will facilitate the development and production of harmonized and comparable statistical data.
National and international efforts to define and measure the green economy and green jobs
22. Given the absence of clear statistical definitions and the shortage of comprehensive data, the green economy – and green jobs in particular – remains something of a mystery from the statistical perspective.
12 Available at http://www.ilo.org/empent/units/green‐jobs‐programme/about‐the‐programme/WCMS_158727/lang‐‐en/index.htm

10
23. Statistical agencies around the world are therefore under pressure to produce nationally relevant and internationally comparable statistics to inform the on‐going policy debate on the economic and employment impact of “greening” the economy. The measurement of the positive and negative employment impact of policy interventions aimed at promoting a greener economy, as well as of climate change and environmental degradation, is no simple matter, however.
24. Agencies at the national and international level have responded in a variety of ways to the challenge to provide statistics on sustainable development and on the impact of human activity on the environment. Operational definitions have been developed and applied in a growing number of countries and work is under way to formulate agreed statistical definitions at the national, regional and international level. In the sphere of economic statistics, agencies have collaborated to develop a System of Environmental‐Economic Accounting (SEEA), the most recent version of which was adopted by the UN Statistical Commission at its 43rd session in 2012.13 There are similar initiatives in the related field of energy statistics.
25. The SEEA is a system for organizing statistical data for the derivation of coherent indicators and descriptive statistics to monitor the interactions between the economy and the environment and the state of the environment in order better to inform decision‐making. The SEEA contains the internationally agreed standard concepts, definitions, classifications, accounting rules and tables for producing internationally comparable statistics on the environment and its relationship with the economy. It
defines the environmental activities as well as environmental goods and services sector (EGSS). It states that “EGSS statistics provide indicators of the production of environmental goods, services and technologies; the contribution of this production within the economy as a whole; and the extent of related employment, investment and exports from the sector.” It adds that “EGSS statistics also provide an information base to assess the potential for economic activity and employment to be based on environmentally friendly and more resource efficient activities, and to assess the extent to which the economy is responding to various public policies and initiatives that have this objective in mind”.14 It does not, however, provide guidelines for the measurement of employment in the EGSS.
26. In 2009 the Conference of European Statisticians established the UNECE/Eurostat/OECD Task Force on Measuring Sustainable Development. In its report15 the Task Force has proposed a conceptual framework for statistics and indicators of sustainable development. This framework includes dimensions for human well‐being, capital, and ‘transboundary’ impacts. There are sub‐dimensions for economic, natural, human and social capital, which provide linkages between economic, social and environmental elements. A number of indicators related to labour, such as the employment rate, are included within this framework. The labour‐related indicators included do not, however, allow for the separate identification of employment in environmentally sustainable or ‘green’ jobs.
27. The OECD on its side has established a set of indicators for monitoring progress towards green growth. In its report, Towards green growth: Monitoring progress: OECD Indicators”,16 it
13 See http://unstats.un.org/unsd/statcom/doc12/2012‐8‐EnvAccounting‐E.pdf.
14 System of Environmental‐Economic Accounting – Central Framework, 2012, paras. 4.92 and 4.93. Available at http://unstats.un.org/unsd/envaccounting/White_cover.pdf
15 See Framework and suggested indicators to measure sustainable development, prepared by the Joint UNECE/Eurostat/OECD Task Force on Measuring Sustainable Development, May 2013. Available at http://www.unece.org/fileadmin/DAM/stats/documents/ece/ces/2013/SD_framework_and_indicators_final.pdf
16 Available at http://www.oecd.org/greengrowth/48224574.pdf

11
presents a conceptual framework, a proposal for developing green growth indicators and results for selected indicators derived from OECD databases. However, it contains no specific indicators linking the environment and the labour market.
28. Several national agencies in different countries have endeavoured to estimate the number of persons employed in green jobs, defined in a variety of ways and using a variety of methods of estimation. The earliest of these efforts involved the production of estimates of employment in environmental protection activities based on currently available data sources, with estimates tending to vary each year depending on the data available. Some national estimates are included in Appendix III.
29. National statistical offices, at least in statistically developed countries, are increasingly producing estimates of green jobs or ‘environmental employment’, drawing on data from official establishment surveys. In these cases, data on either the kind of economic activity or the goods and services produced are used together with data on total employment in each establishment to generate a total estimate of employment in green jobs. The data released are classified either according to kind of economic activity or according to ‘environmental domains’ such as ‘waste management’ or ‘renewable energy’, as defined in the SEEA. Estimates tend not to be comparable between countries, however, owing to differences in sources, estimation methods and the definitions of green jobs used.17
30. One of the most comprehensive approaches has been adopted by the US Bureau of Labor Statistics (BLS), which defines green jobs as:
(a) jobs in businesses that produce goods or provide services that benefit the environment or conserve natural resources (outputs), or
(b) jobs in which workers’ duties involve making their establishment’s production processes more environmentally friendly or use fewer natural resources (processes).
The use of these overlapping elements to define green jobs implies two different approaches to statistical measurement: an output approach and a process approach. The definition goes on to define precisely which goods, services or processes are to be considered.18
17 More details about country practices in defining green jobs are presented in Appendix II.
18 Comprehensive information about the BLS approach to the measurement of green jobs can be found on the BLS website, http://www.bls.gov/green/

12
Chapter 3: Objectives and uses of statistics on green jobs
General requirements and types of user
31. The demand for statistical data on green jobs (in terms of the size, composition and contribution of the specific groups of workers and economic units to the green economy) is growing. The statistics are needed (i) to gain a better understanding of the impact of “greening the economy” and implement green economy policies on the labour market, (ii) to ensure that effective policy measures and tools are formulated to respond to the shift to a greener economy, and (iii) as a general measure of progress towards greening the economy.
32. Statistics on green jobs is of interest to a wide variety of users: the general public, media and civil society, decision and policy makers concerned with economic growth, job creation, environmental protection, climate change and sustainability, as well as analysts, experts and advisors, academics, training institutions, government officials and international agencies.
33. Most users are interested in the size of the green economy (in terms of the number of establishments, the number of employees and the total turnover) and in its contribution to economic growth, especially to turnover, employment (number of people employed directly or indirectly, their level of skills and the specialist skills required), value added, investment, exports, etc. The volume and level of employment in green jobs is seen by many as an important indicator of overall progress towards a greener, more environmentally sustainable economy.
34. Some of the specific policy issues on which information is needed relate to (i) job creation and loss, (ii) changes in occupational and skills needs, (iii) organizational restructuring, and (iv) decent work. (See the box in paragraph 41 for a list of potential uses of statistics on green jobs.)
35. Statistics on green jobs will help to answer a number of questions concerning various aspects of environmental, economic and labour market policy, by providing governments with a tool for monitoring the transition to a greener economy, for designing and evaluating environmental and labour market policies and for assessing their positive impact (such as job creation in specific industries, innovation take‐up, market development, export growth) and their negative impact (such as potential job loss in traditional ‘brown’ industries and in the geographic regions where these industries are located).
36. The identification of green economy activities and the measurement of employment in these activities may be used to inform decisions regarding industries that require support in the form of subsidies and access to credit and perhaps some level of protection. Statistical monitoring may also permit an assessment of the extent to which establishments restructure their organization and production processes. It is a necessary precondition for assessing how skills, education and training systems need to adapt to the development of the green economy.
37. The statistics may also help establishments to supervise their own transition and to identify areas where improvements may be made. For these purposes "green jobs", which include a wide and heterogeneous set of jobs, may need to be analysed separately by type of greenness, because each type may reflect an underlying phenomenon that calls for different measures targeting different groups.
38. Another potential use of statistics on green jobs is the creation of labour market projections that take account of anticipated green growth and contraction in less sustainable activities. Such projections could help to minimize risk and uncertainty for providers of training and enable businesses and governments to plan and invest strategically in innovative areas. The resulting information would also be useful for evaluating policy initiatives and the labour

13
market impact of activities related to the protection of the environment and the conservation of natural resources.
39. Different users of statistics on green jobs need different levels of aggregation and different levels of information and description, depending on the purpose and nature of the analysis to be undertaken. In many cases users may require cross‐cutting datasets of environmental statistics; in others they may be interested only in specific topics and themes for purposes of sectoral analysis and policy‐making.
40. Distinguishing between different types of green job is important not only because of their diversity but also because of the different uses to which statistics on green jobs may be put. When the type of green job being analysed is related to the functioning of establishments (e.g., energy efficiency, recycling) the focus may be on particular types of technology and methods of production as well as on the specific skills required. By contrast, when the type of green job being analysed is related to the output of establishments (e.g., production of organic food) the most appropriate factors to be considered may be the characteristics of the outputs produced.
41. In order to provide information on changes over time and on the transition to a low‐carbon economy, the statistics need to be produced at regular intervals.
Specific policy issues for which statistics are required
Job creation and loss
What is the net employment‐creation effect arising from a particular type of investment, climate change policy or environmentally motivated economic stimulus?
What is the overall impact of environmental and economic policies on the labour market?
What is the potential for green employment growth?
What is or will be the employment shifts across and within sectors? Which industries and types of workers are negatively affected?
Changes in occupational and skills needs
What are or will be the transitions in employment patterns across occupations? For which occupations will there be increasing or decreasing demand?
What new occupations are being created? What existing occupations are becoming greener?
What new skills need to be developed? What are the consequences for education and training systems if they are to adapt to the development of new areas of growth and new technologies?
Are there skills bottlenecks? If so, in which sectors and occupations? What are the skills gaps? How many people need to be trained in what skills in the transition to a green economy?
Organizational restructuring
How many establishments restructure their organization and production processes to use less energy, to reduce emissions, to use cleaner technologies and/or to produce green products and services?
What are the consequences of such restructuring for workers?
Decent work
Are newly created green jobs good and decent? Is the transition to the low carbon green economy socially just? Which groups are affected in a positive way, and which groups may be disadvantaged? Are newly created green jobs accessible to all?
Do particular green initiatives have a negative impact on particular social groups, on food security for specific populations and on employment in existing environmentally sustainable economic activities?*
* See, for example, the discussion on the impact of increased production of bio‐fuels on low‐income women in rural areas in Nidhi Tandon: "First casualties of the green economy – Risks and losses for low‐income women", in Development, 2012, No. 55(3), pp. 311‐319.

14
42. All these requirements imply the need not only for a general definition and measurement of total employment in green jobs but also for more detailed information on employment classified by type of environmental activity, type of environmental goods and services, occupation and economic activity (industry).

15
Chapter 4: Proposed operational definitions of concepts for the statistical measurement of green jobs
43. To understand the concept of green jobs that statistics should measure, a useful starting point is the definition that was adopted in the 2008 joint ILO/UNEP report, Green jobs: Towards decent work in a sustainable, low‐carbon world (see paragraph 18). In that report (page 3) green jobs are defined as:
"...work in agricultural, manufacturing, research and development (R&D), administrative and service activities that contribute substantially to preserving or restoring environmental quality. ... Specifically, but not exclusively, this includes jobs that help to protect ecosystems and biodiversity, reduce energy, materials and water consumption through high efficiency strategies, de‐carbonize the economy and minimize or altogether avoid generation of all forms of waste and pollution."
44. While this definition is fairly comprehensive, it seems – perhaps not deliberately – to exclude the possibility that green jobs might exist in activities such as mining, quarrying, transport, construction and energy supply.
45. According to the ILO green jobs have to be not only green but also decent, i.e., jobs that are productive, provide adequate incomes and social protection, respect the rights of workers and give them a say in decisions that will affect their lives. This is reflected in the broader definition currently used by the ILO Green Jobs Programme:
“Jobs are green when they help reduce negative environmental impact ultimately leading to environmentally, economically and socially sustainable enterprises and economies. More precisely green jobs are decent jobs that: ‐ reduce consumption of energy and raw materials ‐ limit greenhouse gas emissions ‐ minimize waste and pollution
‐ protect and restore ecosystems”19
46. This definition is reasonably comprehensive and reflects the main policy goals and issues that statistics on green jobs may need to inform. It highlights the need to capture the decent work dimension as well as the environmental dimension, and it is therefore used as a starting point.
47. Compared to definitions that serve policy purposes, a definition of green jobs for statistical purposes needs to be formulated with sufficient precision to guide the development of operationally viable methodologies for the consistent production of statistics. Moreover, in order to generate statistics that will adequately inform environmental policies as well as labour market, social and economic policies, it is necessary to provide information independently about both the environmental and the decent work dimensions. The ILO therefore proposes to develop statistical standards that will facilitate the production of datasets that include separate statistics on both employment in environmental activities and on decent work. This implies the need for separate definitions for employment in the environmental sector and for decent work.
48. As noted in paragraphs 24 and 25 above, the environmental dimension is here defined with reference to environmental activities as specified in the most recent SEEA, adopted by the
19 See http://www.ilo.org/empent/units/green‐jobs‐programme/lang‐‐en/index.htm

16
United Nations Statistical Commission. The decent work dimension may be measured according to relevant indicators selected from the ILO manual on Decent Work Indicators20.
49. This approach ensures that determining the activities that are environmentally beneficial (or green) is the responsibility of the group of experts in environmental accounts that maintains the SEEA, whilst the measurement of employment, jobs and decent work remains the responsibility of the ILO and its constituents. It also helps to ensure coherence between statistics on green jobs, environmental production and expenditure, and decent work.
50. The SEEA definition of environmental activities covers a similar range of activities to those covered in the ILO Green Jobs Programme, but it also offers specific guidance on the activities that are to be included or excluded. While the SEEA provides a central measurement framework for preparing integrated national accounts for the environment and defines the activities to be counted as environmental, it does not contain guidelines on the measurement of employment in those activities. The advantage of using the concepts described in the SEEA is that there is international agreement on the definitions and classifications to be used.
Units of observation and analysis
51. Two basic units of analysis, the job and the person, are relevant to the measurement of employment in the environmental sector, depending on the objective and measure pursued. Whilst data are likely to be most frequently provided by establishments and households, the usual unit of analysis for green jobs statistics is the job. The job is defined with reference to the latest relevant resolution of the International Conference of Labour Statisticians (ICLS), for example on statistics of employment and work, occupation or working time. According to the most recent draft of the 19th ICLS resolution concerning statistics of work and of the labour force, a job is defined ‘a set of tasks and duties performed, or meant to be performed, by one person for a single economic unit’.
52. A job can be formal or informal and can refer to work in employment or in other forms of work, such as volunteer work, trainee work or work in the production of goods and services for own consumption. Most statistics on green jobs will relate to employment, which refers to activities carried out by persons to produce goods or services mainly to generate income. The conceptual model for statistics on green jobs also allows for the production of green jobs statistics for other forms of work. Multiple job holding occurs both within employment and within other forms of work, and when statistics on green jobs are tabulated with reference to persons they therefore need to refer to one or other of the jobs held by the person.
53. Where the objectives of the statistics include the measurement of how the economy is changing, how establishments re‐structure their organization and production processes and which technologies are used to reduce the environmental impact of the production, the most appropriate unit of observation and analysis is the establishment.
Concept and domain of the environmental sector
54. The environmental sector consists of all economic units that carry out environmental activities, defined in the UN Statistical Commission's System of Environmental‐Economic Accounting Central Framework as those economic activities whose primary purpose is to reduce or
20 Decent Work Indicators: Concepts and definitions, ILO Manual. Available at http://www.ilo.org/wcmsp5/groups/public/‐‐‐dgreports/‐‐‐stat/documents/publication/wcms_183859.pdf

17
eliminate pressures on the environment or to make more efficient use of natural resources21. These activities are grouped into two broad types of environmental activity:
Environmental protection activities are defined as those activities whose primary purpose is the prevention, reduction and elimination of pollution and other forms of degradation of the environment. These activities include, but are not limited to, the prevention, reduction or treatment of waste and wastewater; the prevention, reduction or elimination of air emissions; the treatment and disposal of contaminated soil and groundwater; the prevention or reduction of noise and vibration levels; the protection of biodiversity and landscapes, including their ecological functions; monitoring of the quality of the natural environment (air, water, soil, groundwater); research and development on environmental protection; and the general administration, training and teaching activities oriented towards environmental protection.
Resource management activities are defined as those activities whose primary purpose is preserving and maintaining the stock of natural resources and hence safeguarding against depletion. These activities include, but are not limited to, reducing the withdrawals of natural resources (including through the recovery, reuse, recycling and substitution of natural resources); restoring natural resource stocks (increases or recharges of natural resource stocks); the general management of natural resources (including monitoring, control, surveillance and data collection); and the production of goods and services used to manage or conserve natural resources.
55. The SEEA's Classification of Environmental Activities (CEA) provides detailed descriptions and specifications of the activities to be counted as environmental activities, as well as advice on activities not to be included where there are borderline issues. The CEA is a functional classification used to classify environmental activities, environmental products, and environmental expenditures and other transactions. The broad structure of the CEA is presented below:
Classification of Environmental Activities ‐ Overview of groups and classes22 I. Environmental Protection (EP) 1 Protection of ambient air and climate 2 Waste water management 3 Waste management 4 Protection and remediation of soil, groundwater and surface water 5 Noise and vibration abatement (excluding workplace protection) 6 Protection of biodiversity and landscapes 7 Protection against radiation (excluding external safety) 8 Research and development for environmental protection 9 Other environmental protection activities II. Resource Management (RM) 10 Management of mineral and energy resources 11 Management of timber resources 12 Management of aquatic resources 13 Management of other biological resources (excl. timber and aquatic resources)
21 See http://www.ilo.org/wcmsp5/groups/public/‐‐‐dgreports/‐‐‐stat/documents/presentation/wcms_195746.pdf
22Detailed classes and definitions for activities can be consulted at http://unstats.un.org/unsd/envaccounting/White_cover.pdf

18
14 Management of water resources 15 Research and development activities for resource management 16 Other resource management activities
56. Environmental activities can be carried out by all economic units, as main, secondary or ancillary activities. A distinction is made between (i) specialist producers, (ii) non‐specialist producers, and (iii) own‐account producers of environmental goods and services.
57. These units produce, design and manufacture at least some goods and services for purposes of environmental protection and resource management. The types of environmental goods and services are as follow:
(a) Environmental specific services comprise environmental protection and resource management specific services produced by economic units for sale or own use. Examples of environmental specific services are waste and wastewater management and treatment services and energy and water saving activities.
(b) Environmental sole‐purpose products are goods (durable or non‐durable) or services whose use directly serves an environmental protection or resource management purpose and which have no use except for environmental protection or resource management. Examples of such products and services include catalytic converters, septic tanks (including maintenance services), catalytic converters for vehicles, trash bags, bins, rubbish containers, compost containers and the installation of renewable energy production technologies (e.g. installation of solar panels).
(c) Adapted goods are goods that have been specifically modified to be more “environmentally friendly” or “cleaner” and whose use is therefore beneficial for environmental protection or resource management. Examples of adapted goods include de‐sulphurised fuels, mercury‐free batteries and CFC‐free products.
(d) Environmental technologies are technical processes, installations and equipment (goods) and methods or knowledge (services) whose technical nature or purpose is environmental protection or resource management. Environmental technologies can be classified as either:
‐ end‐of‐pipe (pollution treatment) technologies, or
‐ integrated (pollution prevention) technologies.
The importance of environmental goods and services may vary across industries, countries and over time.
Employment in the environmental sector
58. It is proposed to define employment in environmental activities as follows:
“Persons employed in the environmental sector comprise all persons who, during a set reference period, were employed (in the sense of paragraph X of the resolution on the topic to be adopted by the Nineteenth International Conference of Labour Statisticians) in the production of environmental goods and services. In addition to persons involved in the production of environmental goods and services, this includes workers whose duties involve making their establishment’s production processes more environmentally friendly or more efficient in their use of natural resources.”
59. This definition includes jobs held by persons in an establishment during a given reference period, whether or not it was their main or a secondary job. It includes managers, professionals, technicians, traders and other workers with specific environmental skills, as well as clerical,

19
services and sales workers, plant and machine operators and elementary workers who work in these EGSS establishments.
60. It is proposed to make a distinction between employment in the production of environmental goods and services for consumption by other economic units (employment in production of environmental outputs), on the one hand, and for consumption by the economic unit in which the activity is performed (employment in environmental processes), on the other. The proposed approach (i) takes into account the fact that environmental output not always produced by using environmental processes and technologies, (ii) enables measures of employment in the production of environmental output to be complemented by measures of employment in green processes, (iii) requires different measurement methods. These two components of employment are defined in the draft guidelines.
61. The two components of employment in the environmental sector shed light on different ways of greening enterprises and economies and offer different entry points for policies. Both concepts are useful for analytical and policy‐making purposes, as they refer to different aspects of the ‘greening’ of employment and to different targets for policy‐making.
62. Employment in the production of environmental outputs covers employment within establishments that produce goods and services that benefit environment. These environmental goods and services are not always based on environmentally‐friendly production processes and technologies, however. For example, green buildings or electric cars may be produced by using technologies that have or do not have a negative environmental impact. Employment in environmental processes, on the other hand, may be found in traditionally polluting industries (say, mining or steel production), provided that they are increasing their energy efficiency through new models of organization or that they employ environmentally friendly technologies in their production processes. These changes, though not always driven by environmental concerns, may have a significant positive impact on the environment, even if no environmental goods or services are being produced.
63. Consequently, employment in environmental processes would cover not only employment in companies and institutions that physically produce renewable energy but also employment in companies and institutions that focus on energy‐saving activities.
64. This definition attempts to avoid separating “good and green” economic activities from “not green and bad” economic activities, on the premise that all economic activities can contribute to greening, either by preventing, reducing and eliminating pollution and other forms of degradation of the environment or by making more efficient use of natural resources.
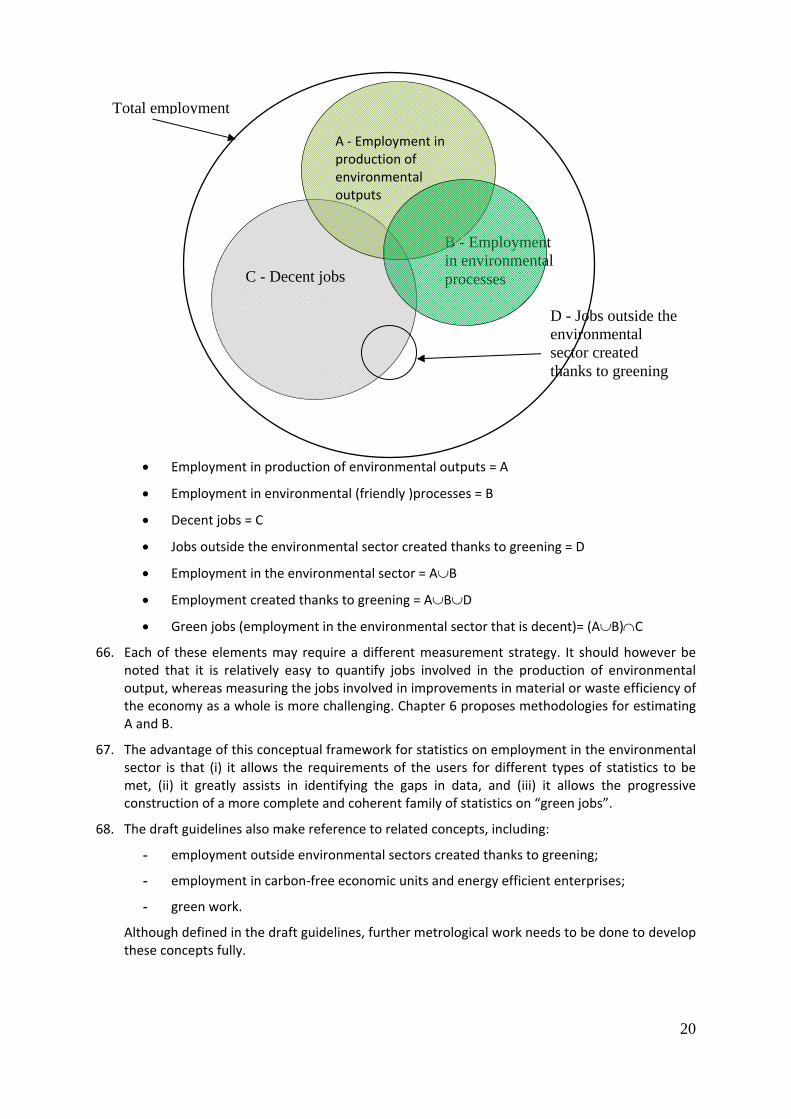
65. The figure below presents the relationship between total employment, employment in the environmental output, employment in environmental processes and decent work.
20
Employment in production of environmental outputs = A
Employment in environmental (friendly )processes = B
Decent jobs = C
Jobs outside the environmental sector created thanks to greening = D
Employment in the environmental sector = AB
Employment created thanks to greening = ABD
Green jobs (employment in the environmental sector that is decent)= (AB)C
66. Each of these elements may require a different measurement strategy. It should however be noted that it is relatively easy to quantify jobs involved in the production of environmental output, whereas measuring the jobs involved in improvements in material or waste efficiency of the economy as a whole is more challenging. Chapter 6 proposes methodologies for estimating A and B.
67. The advantage of this conceptual framework for statistics on employment in the environmental sector is that (i) it allows the requirements of the users for different types of statistics to be met, (ii) it greatly assists in identifying the gaps in data, and (iii) it allows the progressive construction of a more complete and coherent family of statistics on “green jobs”.
68. The draft guidelines also make reference to related concepts, including:
- employment outside environmental sectors created thanks to greening;
- employment in carbon‐free economic units and energy efficient enterprises;
- green work.
Although defined in the draft guidelines, further metrological work needs to be done to develop these concepts fully.
B - Employment in environmental processes C - Decent jobs
A ‐ Employment in production of environmental outputs
D - Jobs outside the environmental sector created thanks to greening
Total employment

21
Chapter 5: Measurement issues and considerations
69. Measurement of employment in the environmental sector must take account of employment from an output perspective (type of goods and services produced for consumption outside the producing unit) as well as from a process perspective (type of goods and services produced for consumption within the producing unit). The concept and measurement of employment in the production of environmental outputs is linked to certain establishment‐related characteristics, while the concept of employment in environmental processes is linked to job‐related characteristics such as skills and tasks.
Employment in production of environmental outputs ‐ measurement
70. For the purposes of measuring employment in production of environmental output, the environmental sector is defined as consisting of those establishments where all or at least some of the goods or services produced belong to the environmental goods and services domain and are designated for consumption outside the establishment.
71. Employment in the production of environmental outputs is not, however, equal to total employment in the establishments producing environmental goods and services to be consumed outside the producing unit. Many producers of environmental goods and services also produce a range of other goods and services. For example, producer of solar panels may also produce some products that have no environmental purpose, and employment in the production of environmental goods and services may therefore be only a relatively small component of their total employment. Consequently, employment in the production of environmental outputs can be measured directly only in specialist environmental establishments whose output is 100 per cent environmental. In establishments where the production of environmental goods and services constitutes only a secondary activity of an establishment (non‐specialist producers) or where, if it is a principal activity, it is combined with secondary activities in the same establishment, employment cannot be measured directly unless the jobs are linked to the type of products produced. Linkage of this kind would be costly and difficult to implement in data collection. In the absence of such information this type of employment can be approximated using, for example, the data on the value of environmental goods and services produced as a proportion of the value of the total production of the establishment.
72. The main reason why employment in production of environmental outputs cannot be measured directly is the absence of information on employment associated with the production at the product code level. Where direct estimates of employment in the production of environmental goods and services cannot be obtained, it can nevertheless be approximated using the information on the share of output (sales) of environmental goods and services in total output (sales). It is necessary first to calculate the value of environmental goods and services produced as a proportion of the value of the total production of the establishment.23 The same proportion can then be applied to total employment in the establishment in order to estimate
23In the event that data on environmental output are not available at the individual enterprise level, the ratios at industry level may be applied. However, using industry‐level data instead of products may overestimate or underestimate the size of the green economy if enterprises within industry produce a mix of green and non‐green products and services. Expert advice could also be used, particularly for industries where the relationship between patterns of employment and the output of environmental goods and services may vary considerably from the average.

22
employment in production of environmental outputs. Thus, if 100 per cent of an establishment’s outputs are environmental goods and services, then 100 per cent of employment in the establishment is included. If 50 per cent of the output is environmental, 50 per cent of employment is included. Whilst this method of measurement does not deal with situations where production of particular types of goods and services might be more or less labour intensive than others, it ensures that the labour inputs of workers in areas such as administration, accounts, information technology, cleaning services and so forth, who contribute indirectly to environmental production, are also counted.
73. For establishments that do not generate revenue (e.g., non‐profit organizations, government agencies, research organizations and new businesses that provide environmental goods and services without generating income), information about the proportion of their employment involved in contributing to the production of environmental goods and services may need to be collected.
74. Total employment in the production of environmental outputs is calculated by adding up the observed or estimated employment at the establishment level.
Employment in environmental processes
75. The second component, employment in environmental processes, requires the collection of data concerning job‐related characteristics such as occupation, the specific tasks and duties undertaken in the jobs and the kind of processes or technologies used.
76. Unfortunately, the occupation on its own is not sufficient to accommodate the requirements of measuring employment in environmental processes. Though a small number of workers employed in occupations such as environmental engineering or refuse sorting may be easily identified because their occupation is entirely environmental, the majority have occupations that involve both environmental and non‐environmental activities. Some tasks and duties are divided in such a way that they are undertaken with environmental processes and technologies while the rest of the work involves non‐environmental processes and technologies. For example, a planning engineer may spend part of his/her time on work associated with installing recycling equipment in the establishment and part on obtaining permission for commercial premises with no distinguishing environmental characteristics .
77. An additional problem is that many workers are involved in the production of environmental goods and services for consumption both within and outside the establishment. In order to measure only the part that is related to production of environmental goods and services for consumption within the establishment, it is necessary to split the hours spent on each component in order to estimate the number of full‐time jobs. An alternative would be to measure employment in environmental processes regardless of intended consumption. A third option is to split the volume of employment, if possible, in proportion to the value of internal and external consumption.
78. The proposal here is to make a distinction between workers that spend less than 50 per cent and those that spend more than 50 per cent of their time on environmental processes. The Conference may wish to consider the possibility of using a different threshold or using the measure of volume of work expressed in terms of hours worked.
79. Employment in environmental processes is more difficult to measure and involves asking questions that are not routinely included in economic censuses and surveys aimed at measuring production. Establishments can, for example, be asked to provide information on the number of workers employed in activities leading to the production of environmental goods and services for consumption within the establishment. Because of the potential increase in respondent
23
burden, information on this component is likely to be collected less frequently than information on employment in the production of environmental outputs.
80. Since the measurement of employment in environmental output and of employment in environmental processes calls for the use of different methods, separate statistics should be produced for each component. The two components cannot however be aggregated, as this would double‐count workers producing goods or services for consumption within the establishment when the establishment also produces environmental goods or services for external consumption.
81. A combined total for employment in environmental activities can be provided for both components when the necessary information is available for the same establishment. For example, if 100 per cent of total output is environmental, then 0 per cent of employment in environmental processes is counted in the combined total. If there are no environmental outputs but 10 per cent of employment is in internal environmental activities, then all of the 10 per cent is included in the combined total. If 70 per cent of an establishment’s outputs are environmental goods and services and 30 per cent of workers are involved in environmental processes but also in production of environmental goods and services, in order to avoid double counting it is necessary to estimate the share of these 30 per cent that is engaged in environmental processes for internal consumption.
Households as producers of environmental goods and services
82. Household units may engage in many environmental protection and resource management activities. Where production is undertaken for sale or where the work is performed by employees of a household, these units can be treated in the same way as any other production unit. Where the production is undertaken by members of the household for the benefit of the household, the labour inputs would be considered as ‘own‐production work’, according to the framework for work statistics proposed in the draft resolution on labour force and work statistics that will be considered at the 19th ICLS. Though the latter could be looked upon as work in environmental processes, it would not be counted as employment.
83. In practice, ‘own‐production work’ in environmental protection and resource management activities may be difficult to measure. It may, nevertheless, be of interest and of some significance in cases where households are commonly engaged, for example in environmental remediation activities. This could be particularly important in countries where large numbers of households are primarily engaged in agricultural production for own consumption.
84. Many households are engaged in agricultural activities, especially in developing countries. For employment in agriculture to be considered as environmental, an agricultural production system must satisfy several conditions to be considered organic:
‐ It must be organic by intent and not by default. Thus, non‐sustainable production systems that do not use synthetic inputs are not considered organic.
‐ The produce must mainly be for sale, not for self‐consumption. This is because the market, through pricing mechanisms and certification requirements, offers the best way to determine whether a product is organic.
‐ The produce must be labelled or otherwise recognized by consumers as organic. Many countries have a national certification system to certify that products have been produced in accordance with organic standards. Non‐certified organic food may be sold in farmers' markets or at the farm‐gate, where the consumer knows where the produce comes from and is therefore be prepared to pay a premium price because it is recognized as organic.

24
Employment in production units supplying goods and services to the environmental sector24
85. Producers that provide components of an environmental technology should be excluded when these components are not used exclusively in environmental technologies, as should activities that entail selling goods already produced (the distributors of the final good). This means that the suppliers of non‐exclusively environmental components and the distributors of environmental technologies and products are outside the scope of the environmental goods and services sector.
86. According to many studies, however, these indirect and induced jobs created in the transition to a low‐carbon economy are extremely relevant for policy‐makers in terms of employment creation and skills needs. Employment in these groups will increase as economies go green. Expanded green production will lead to a higher demand for input, resulting in an increase in indirect jobs in supplier industries.25 It is therefore important to find a way to estimate these jobs (e.g., steelworkers producing steel for windmills – Group D in Figure 1). As tracking the whole economy’s value chain may be a very complex task, quantitative modelling could be a solution for measuring indirect and induced effects. The measurement of this type of employment is discussed in paragraphs 104‐106 below (Modelling).
87. This type of employment is presented as category D in the figure in paragraph 65 above.
Employment in carbon‐free and energy‐efficient enterprises
88. Employment in energy‐efficient enterprises may also be of interest to some users, and for this purpose a threshold needs to be set. The threshold could for instance be set with respect to average energy consumption per person employed, average carbon‐dioxide‐emissions and/or use of natural resources of a certain industry. A decision as to whether a process is more or less environmentally friendly would then be less arbitrary than if there were no benchmark. Because of technological progress, however, the threshold for an environmental process will naturally change over time, and this will make it difficult to compare data on green jobs over time. The same applies to comparability across industries, since thresholds will probably vary between industries as well. The Conference may wish to discuss the criteria for an environmental process as well as the use of thresholds. To make comparisons over time and across industries and countries more meaningful, thresholds could be set in relative term (e.g., top 10 per cent energy‐efficient establishments within an economic activity in terms of energy consumption per person employed).26
24 Jobs outside the environmental sector created as a result of greening (category D in figure in paragraph 65)
25 The increased consumer spending of those in these newly created direct and indirect jobs will also create a number of induced jobs.
26 Other proxies include water consumption, resource consumption and CO2 emission.
25
Chapter 6: Data collection methods
Surveys and censuses
89. Data collection is, of course, an integral and essential part of developing and updating statistics on green jobs. Formal data collection activities should be established, adapted to countries’ national circumstances and reviewed periodically. In most cases the capacity and willingness of agencies to conduct new surveys will be limited by the resources available and the priorities given to policy needs for various statistics.
90. The main sources of information that may be used to assess how many green jobs exist in specific sectors are surveys and censuses of establishments. To optimize resource use it is suggested that, as far as possible, the required data be collected by extending existing surveys rather than by initiating totally new ones. The possibility of incorporating new questions or modules in existing, on‐going or planned surveys should be explored in order to fill the data gaps.
91. Depending on national priorities, data collection could be focused on key economic activities and industries (e.g., the largest in terms of their contribution to the production of environmental goods and services) and/or on those that have the greatest potential to change. Surveys can be limited to some producers rather than to the entire population of the EGSS. A pragmatic approach could be to focus on some resource management subsectors (renewable energy, organic agriculture, ecotourism, sustainable forestry) where clear benchmarks exist (e.g., specific labels).
92. Respondent burden may be minimized by the inclusion in questionnaires of filtering questions that identify possible in‐scope respondents, so that only those establishments that indicate they produce at least one of the selected environmental goods or services would be asked detailed questions on environmental activities.
93. In order to estimate employment in the production of environmental output the questionnaire should include, as a minimum, questions on the type of environmental goods and services produced in the establishments surveyed, the value of or sales revenues from these goods and services and the number of persons employed in the establishment.
94. Information that would allow estimation of employment by each type of environmental output could be obtained by asking respondents in establishments to indicate whether the production of environmental goods or services is their principal or secondary activity, and to provide a list of the environmental goods and services produced indicating the percentage of total turnover associated with each environmental good or service. Respondents could be assisted in identifying environmental goods and services
95. Data collected in this way will include turnover by type of environmental output. For establishments that report that their output is entirely environmental, 100 per cent of employment in the establishment will be counted as employment in environmental activities. For establishments that undertake both environmental and non‐environmental activities, the environmental outputs will be able to be isolated, thereby facilitating allocation of an appropriate proportion of total employment in the establishment to employment in environmental activities.
96. In surveys that aim to collect data on employment both in the production of environmental output and in environmental processes, the questionnaire could include questions on the share of environmental turnover in total turnover and questions that would make it possible to determine the proportion of employees who are directly involved in the production/provision
26
of environmental technologies, goods and services or who carry out environment‐related activities. To avoid double counting a distinction should be made between the time spent on environmental activities for consumption within and outside the establishment
Surveying employment in the agriculture and informal sectors
97. The collection of statistics on employment in the environmental sector may pose a particular challenge in countries with large informal sectors and/or where agriculture, forestry and fishing are widespread activities. Traditional establishment surveys based on business registers are unlikely to be the best option, as these sectors are not normally covered by such registers or are not up to date. More useful sources include household surveys, agricultural censuses and area‐based establishment surveys designed specifically to collect data from small or unregistered economic units, including those in agriculture and the informal sector. For surveys targeting employment in environmental output in agriculture, forestry and fisheries, questions could be included on the use of organic agricultural and forestry practices and/or the use of chemical fertilizers and pesticides during the census reference year.
98. Where workers are involved in both environmental and non‐environmental agricultural activities, employment could be estimated on the basis of the surface area under organic production, the production of organic products or the income generated from the sale of organic products.
99. Compiling information on employment in environmental output in the non‐agricultural informal economy may be more difficult, because respondents and interviewers may have difficulty assessing the extent to which the activities performed or products produced fall within the scope of the environmental sector. Therefore, questions may focus only on selected sectors such as waste collection and ecotourism, where clear benchmarks exist (e.g., specific labels) or which are by their very nature 100 per cent environmental.
100. In an ILO study undertaken in Bangladesh,27 core environment‐related jobs were identified on the basis of the environmental performance of the sector or activity measured against standards, benchmarks, codes and, where possible, compliance with regulations. The jobs were estimated by means of literature review, interviews with experts, sector‐specific studies and investment‐to‐job ratios within individual sectors. These core environment‐related jobs formed the basis for subsequent analysis. To assess the decent work aspect, they were screened to determine whether they provided acceptable working conditions. Data on decent work indicators were gathered from published sources and stakeholder interviews. However, the quality of the information for decent work differed according to the type of environment‐related activity or sector and, overall, this study did not provide an estimate of the share of green jobs that was as reliable as is normally required for official statistics. It does, however, offer an interesting view on how to conduct an evaluation of green jobs in a particular country.
Inventories of producers of environmental goods and services
101. The use of inventories of establishments that produce environmental goods and services, if they are kept up‐to‐date consistently over a prolonged period, is a simple and effective way of assessing how many green jobs exist in specific sectors or regions.
102. Such inventories should contain data on the establishments that produce environmental goods and services and, if possible, on those employing environmental processes. They may also
27 Estimating green jobs in Bangladesh: A GHK report for the ILO, June 2010. Available at http://www.ilo.org/wcmsp5/groups/public/‐‐‐ed_emp/‐‐‐emp_ent/documents/publication/wcms_159433.pdf

27
contain lists of environmental goods and services and technologies. For this purpose, it may be useful to establish standardized lists of environmental goods, services and technologies, based on the SEEA. These lists could not remain constant over time and would need to be updated regularly to take account of the development of new products, services and technologies. Lists of establishments would need to be updated on a regular basis for the same reason.
103. Business registers may contain the information required, but keeping this information up to date is not an easy process. Industry and business associations that bring together businesses working in a common field or using similar technologies can often be a useful source of information. As specialists in their field they will have an insider’s knowledge of the most common processes used, and they may even be willing to survey their members at regular intervals to assess penetration of new processes, goods and services. Patent registers and registers of recipients of clean‐technology venture capital may also provide some information, at least on formal sector establishments engaged in environmental activities.
Modelling
104. In situations where the data are incomplete, and especially where the objective is to estimate both employment within the environmental sector and employment outside the environmental sector created thanks to greening, statistical modelling techniques28 may need to be used (e.g., input‐output analysis and social accounting matrices and other computable general equilibrium models29). Input‐output analysis and social accounting matrices are empirical tools that rely on the construction of a matrix or table listing all subsectors in an economy and detailing how outputs from one sector are used as inputs to others. These models draw on information from national accounts, budget data, flows of funds and labour force and household surveys, as well as from environmental data sources (CO2 emission, water, land use, etc.). Based on assumptions regarding the relationship between economic and environmental variables, employment multipliers could be calculated to estimate direct and indirect employment.
105. Computable general equilibrium models take the work of input‐output analysis and social accounting matrices a step further by simulating full economy responses to exogenous changes. Typically they combine empirical data with a series of economic equations designed to capture the dynamism and complexity of an entire economy comprehensively. In this way they can explore the effects of policies over time on a variety of different macroeconomic parameters, including future employment scenarios. These models allow policy‐makers the opportunity to calculate the long‐term impact of policies.
106. It should be taken into consideration that national statistical offices are not usually responsible for making these types of analysis and judgements about cause‐and‐effect relationships.
28 See ILO: Methodologies for assessing green jobs: Policy brief. Available at http://www.ilo.org/wcmsp5/groups/public/‐‐‐ed_emp/‐‐‐emp_ent/documents/publication/wcms_176462.pdf
29 UNEP promotes a T21 model from the Millennium Institute.

28
Chapter 7: Types of data to be collected, statistical measures and indicators to be produced
107. The transition to a green economy implies a progressive increase in the share of environmental output and employment in the environmental sector. In order to assess whether and how far the green transformation has progressed, information needs to be collected and analysed in a consistent manner on various aspects of the activities of institutions in the economy both within and outside the environmental sector. This includes information on employment, production, value added, exports, imports, innovation, research and development and fiscal schemes and subsidies. Progress can be assessed using indicators such as the share of these sectors in total output, the share of green investment in total investment and the share of environmental employment in total employment.
108. As discussed in Chapter 3, there is a need not only for indicators of progress in general but also for measures that will inform public policy in a wide range of areas. The indicators presented below are proposed as a starting point to promote discussion of the indicators and measures that will be most useful rather than as a final list. These measures will need to be further elaborated as new data become available and as concepts and ideas evolve.
Employment in the environmental sector
109. Employment in the environmental sector (total and by economic activity), expressed in absolute numbers and as a percentage of total employment, is a potential headline indicator of progress towards a green economy. Separate data for employment in production of environmental outputs and for employment in environmental processes would also be of interest. Although the whole economy needs to be involved in the green transformation, there is nonetheless a need to focus on a core of key green industries that characterize a green economy. Their progress should be closely monitored and disaggregation of data by economic activity will facilitate both identification of core industries and monitoring of progress in other industries.
Employment by environmental domain
110. Breaking down employment and turnover (or output) data by the environmental domains specified in the SEEA's Classification of Environmental Activities (i.e. environmental protection and resource management activities) will allow identification of the type of environmental initiatives that are likely to lead to the creation of more jobs, as well as the assessment of relative levels of labour productivity.
Employment by occupation
111. For an assessment of skill levels and requirements in the environmental goods and services sector for its employees relatively detailed data on employment by occupation is required as well as on employment by the level of skills, level of education and specialized skills required. Analysing the level of education and skills required for green jobs will also reveal the potential of the environmental goods and services sector to provide jobs for workers who have a lower level of education or are unemployed. Workers' level of education could also serve as an indicator of the knowledge content of the environmental sector and hence of the development potential of the environmental goods and services sector.
Employment by economic activity
112. The sectoral composition of a national economy very largely determines the challenges posed by – but also the potential for – economic development and environmental sustainability and their likely impact on enterprises and workers. Economic sectors that are directly dependent on natural resources and the climate, or which are major consumers of resources or significant polluters or a combination of both, might be in a position to significantly reduce their
29
environmental impact. Economic units engaged especially in agriculture, forestry, fisheries, energy, resource‐intensive manufacturing, recycling, buildings and transport may have close relationship to environmental sustainability. Many of the environmental policies adopted to date, and also many of the more comprehensive green economy or green growth strategies, focus on these sectors.
Percentage of establishments using green technologies
113. Statistics on the percentage of establishments using green technologies (total and by economic activity) would allow an assessment of general progress towards a greener economy.
Employment by type of green technology used (total and by economic activity)
114. Statistics on employment by type of technologies, processes and methods used for restructuring organization and production processes and for reducing the environmental impact of production will provide important inputs for labour market planning and for an understanding of which technologies are likely to create employment opportunities. Disaggregation by economic activity can be used to evaluate how local labour markets are making the transition to greener activities.
Wages and hours of work
115. While collecting data on employment in the environmental goods and services sector, it could be useful also to collect data on wages and hours of work. This would provide a further insight into the quality of employment in the environmental sector.
Specific vulnerable groups
116. Whenever possible, data on employment in the environmental sector should distinguish between different age groups (especially between youth and adults) and between different levels of education and/or training received. A complementary analysis disaggregated by sex is essential for an understanding of the gender patterns of employment in the environmental goods and services sector, and of the differential impact on males and females of particular environmental initiatives. Some results suggest that women are much less likely than men to work in the environmental sector and are particularly underrepresented in the green occupations that are predicted to grow most strongly.

30
References
Andrew Hancock (2010): How green is my occupation classification? An abstract is available on the Labour, Employment and Work in New Zealand website at http://www.victoria.ac.nz/vms/industrial‐relations‐centre/irc‐events/lew‐conference‐welcome/lew‐papers/D5_LEW14_final_paper_‐_Hancock.pdf
Austria Statistics http://www.statistik.at/web_en/statistics/energy_environment/environment/eco_industries_environmentally_goods_and_services/index.html
Austria Statistics, The Environmental Goods and Services Sector (EGSS) database http://www.statistik.at/web_en/statistics/energy_environment/environment/eco_industries_environmentally_goods_and_services/index.html
Bureau of Labor Statistics US Department of Labor (2012) News Release http://www.bls.gov/news.release/ggqcew.htm
Bureau of Labor Statistics US Department of Labor, Green Technologies and Practices (GTP), http://www.bls.gov/gtp/
DAMWAD (2012), Methodology: Green goods and services in Denmark, http://www.ens.dk/sites/ens.dk/files/info/tal‐kort/statistik‐noegletal/groen‐produktion‐bidrager‐betydeligt‐dansk‐oekonomi/Methodology%20for%20Green%20business%20statistics%202012%20Final.pdf
DAMWAD (2012) Green production in Denmark, and its significance for the Danish economy http://www.ens.dk/sites/ens.dk/files/policy/green‐production‐denmark‐contributes‐significantly‐danish‐economy/Green%20production%20in%20Denmark%20‐%20web%20111212.pdf
ECO Canada. Environmental Statistics (2010). Measuring Green Collar Jobs in British Columbia. http://www.docstoc.com/docs/42797176/Measuring‐Green‐Collar‐Jobs‐in‐British‐Columbia‐‐‐Environmental
Environment Institute of Australia and New Zealand (2009) Who are the Green Collar Workers? Defining and identifying workers in sustainability and the environment
ESCAP http://www.greengrowth.org
Eurostat (2009): Data Collection Handbook on Environmental Goods and Services Sector, Final Draft. http://epp.eurostat.ec.europa.eu/cache/ITY_OFFPUB/KS‐RA‐09‐012/EN/KS‐RA‐09‐012‐EN.PDF
Eurostat Database on Environmental Goods and Services <http://epp.eurostat.ec.europa.eu/statistics_explained/index.php/Environmental_goods_and_services_sector>
Eurostat, Institut de Conseil et d'Etudes en Développement Durable (2007): Environmental Industry Statistics : Employment http://epp.eurostat.ec.europa.eu/portal/page/portal/environmental_accounts/publications/environmental_goods_and_services_sector
Green Economy Coalition http://www.greeneconomycoalition.org/about
GHK (2010) Estimating green jobs in Bangladesh: A GHK report for the ILO http://www.ilo.org/wcmsp5/groups/public/‐‐‐ed_emp/‐‐‐emp_ent/documents/publication/wcms_159433.pdf
Green Jobs in Bangladesh (2008), http://www.ilo.org/wcmsp5/groups/public/‐‐‐asia/‐‐‐ro‐bangkok/documents/meetingdocument/wcms_099401.pdf

31
Icedd for Eurostat (2007) Environmental Industry Statistics, Employment.
ILO, UNEP (2008) Green jobs: Towards decent work in a sustainable, low‐carbon world, http://www.ilo.org/empent/units/green‐jobs‐programme/about‐the‐programme/WCMS_158727/lang‐‐en/index.htm
ILO (2012) Decent Work Indicators: Concepts and definitions, ILO Manual. http://www.ilo.org/wcmsp5/groups/public/‐‐‐dgreports/‐‐‐stat/documents/publication/wcms_183859.pdf
ILO (2012) Moving towards a statistical definition of green jobs, available at http://www.ilo.org/global/statistics‐and‐databases/meetings‐and‐events/international‐conference‐of‐labour‐statisticians/19/preparatory‐meetings/WCMS_195698/lang‐‐en/index.htm
ILO (2013) Methodologies for assessing green jobs: Policy brief. http://www.ilo.org/wcmsp5/groups/public/‐‐‐ed_emp/‐‐‐emp_ent/documents/publication/wcms_176462.pdf
ILO (2013) Sustainable development, decent work and green jobs http://www.ilo.org/ilc/ILCSessions/102/reports/reports‐submitted/WCMS_207370/lang‐‐en/index.htm.
ILO (2013) Achieving decent work, green Jobs and sustainable development, in Provisional Record, International Labour Conference, 102nd Session, Geneva, June 2013 http://www.ilo.org/ilc/ILCSessions/102/reports/committee‐reports/WCMS_216378/lang‐‐en/index.htm
Netherlands Statistics (2011), Green growth in Netherlands, http://www.cbs.nl/NR/rdonlyres/65FA4466‐853C‐4223‐8B69‐7C7872E37DC3/0/2011p44pub.pdf
OECD (2011) Towards green growth: A summary for policy makers, http://www.oecd.org/greengrowth/48012345.pdf
OECD (2012) Towards green growth: Monitoring progress: OECD Indicators, http://www.oecd.org/greengrowth/48224574.pdf
Renner,M., Sweeney,S. , Kubit,J (2009) Green Jobs towards Decent work in sustainable ,low carbon world. UNEP/ILO/ITC/IOE http://www.ilo.org/wcmsp5/groups/public/@ed_emp/@emp_ent/documents/publication/wcms_158727.pdf
Rossum , Maarten van (2012) Economics indicators for the Dutch Environmental Goods and Services Sector, Time series data for 1995‐2009 ,Statistics Netherland ,The Hague 2012, National Accounts Department, http://www.cbs.nl/NR/rdonlyres/6048B589‐C79F‐416E‐A5E2‐BD93E3DCA29C/0/2012EGSSCBSbackground.pdf
Sweden Statistics < http://www.scb.se/Pages/ProductTables____38186.aspx>
Sweden Statistics, System of Environmental and Economic Accounts database http://www.scb.se/MI1301‐EN
System of Environmental‐Economic Accounting – Central Framework, 2012, http://unstats.un.org/unsd/envaccounting/White_cover.pdf
Tandon, Nidhi (2012) First Casualties of the Green Economy – Risks and losses for low‐income women, in Development
UNECE/Eurostat/OECD (2013), Framework and suggested indicators to measure sustainable development,

32
http://www.unece.org/fileadmin/DAM/stats/documents/ece/ces/2013/SD_framework_and_indicators_final.pdf
The future we want (2012), Outcome document of the United Nations Conference on Sustainable Development, available at http://www.uncsd2012.org/content/documents/727The%20Future%20We%20Want%2019%20June%201230pm.pdf
Our Common Future (1987), http://conspect.nl/pdf/Our_Common_Future‐Brundtland_Report_1987.pdf
UNEP (2011) Towards a Green Economy–Pathways to Sustainable Development and Poverty Eradication, http://www.unep.org/greeneconomy/greeneconomyreport/tabid/29846/default.aspx
US National Center for O*NET Development (2009): Greening of the World of Work: Implications for O*NET, SOC and New and Emerging Occupations, http://www.onetcenter.org/dl_files/Green.pdf),(http://www.onetcenter.org/reports/Green.html

33
APPENDIX I: Existing concepts and definitions related to the green economy
Sustainable development
United Nations Brundtland Report30 (1987)
The United Nations Brundtland Report (1987) included what is now one of the most widely recognised definitions: "Sustainable development is development that meets the needs of the present without compromising the ability of future generations to meet their own needs."
According to the same report, the above definition contains within it two key concepts:
the concept of 'needs', in particular the essential needs of the world's poor, to which overriding priority should be given; and
the idea of limitations imposed by the state of technology and social organization on the environment's ability to meet present and future needs. [8]
Green growth
OECD (2011)31
Green growth is about fostering economic growth and development while ensuring that natural assets continue to provide the resources and environmental services on which our well‐being relies. To do this it must catalyse investment and innovation which will underpin sustained growth and give rise to new economic opportunities. (OECD. 2011. Towards Green Growth: Monitoring Progress OECD Indicators)
ESCAP (United Nations Economic and Social Commission for Asia and the Pacific)32
Green growth is environmentally‐sustainable economic progress that fosters low‐carbon, socially inclusive development. It articulates concise and clear entry points and policy approaches for making real gains in eco‐efficiency and transferring to low‐carbon development: synergizing climate action with development goals. Green Growth comprises six, mutually‐reinforcing "Paths", or entry points, through which policy makers can focus interventions: Sustainable Consumption and Production (SCP), Greening Business and the Markets (GBM), Sustainable Infrastructure (SI), Green Tax and Budget Reform (GTBR), Investment in Natural Capital (INC), and Eco‐efficiency Indicators (EEI).
Green economy
Various agencies of the United Nations system have identified green economy as “investment in sectors such as energy efficiency technologies, renewable energy, public transport, sustainable agriculture, environment friendly tourism and sustainable management of natural resources, including ecosystems and biodiversity” aimed at generating new areas of production, quality jobs and an increase in income, while serving to mitigate climate change and protect biodiversity (United Nations).
UNEP (2011)33
30 http://conspect.nl/pdf/Our_Common_Future‐Brundtland_Report_1987.pdf
31 http://www.oecd.org/dataoecd/37/33/48224574.pdf
32 http://www.greengrowth.org
34
The United Nations Environment Programme (UNEP) defines a green economy as one that results in improved human well‐being and social equity, while significantly reducing environmental risks and ecological scarcities. In its simplest expression, a green economy can be thought of as one which is low carbon, resource efficient and socially inclusive. In a green economy, growth in income and employment should be driven by public and private investments that reduce carbon emissions and pollution, enhance energy and resource efficiency, and prevent the loss of biodiversity and ecosystem services. These investments need to be catalysed and supported by targeted public expenditure, policy reforms and regulation changes. The development path should maintain, enhance and, where necessary, rebuild natural capital as a critical economic asset and as a source of public benefits, especially for poor people whose livelihoods and security depend on nature. (UNEP. 2011. Towards a Green Economy – Pathways to Sustainable…)
XVII Meeting of the Forum of Ministers of Environment of Latin America and the Caribbean – held in Panama City, Panama, from 26 to 30 April 2010
This meeting defined a Green Economy as a system of economic activities related to the production, distribution and consumption of goods and services that results in improved human well‐being over the long term, whilst not exposing future generations to significant environmental risks and ecological scarcities. It is environmentally friendly and ecological, and for many groups, it is also socially just.”
UNCTAD
The United Nations Conference on Trade and Development (UNCTAD) defines green economy as a productive process resulting from the improvement of human well‐being and the reduction of inequalities, while limiting the significant scarcity risks at the environmental level for future generations.
Greening the economy
Greening the economy is a strategy under consideration by countries to enhance the quality of life of their citizens and to pursue sustainable development goals. The transformation of traditional economies into green economies is based on making investments in technologies, systems and infrastructures that enhance productive economic activities while optimizing natural resource utilization and minimizing environmental impacts. The objective is to foster investments supporting social and environmental goals that would act as drivers for, instead of barriers to, sustainable economic growth.
Transition to greener economies
Transition to greener economies implies the formulation of an overarching integrated approach that links social, economic and environmental policies and actions designed to ensure sustainable development and poverty eradication. Green growth strategies in developing countries need to be undertaken within this context and should ultimately address major priorities such as: providing basic education, housing and employment; ensuring food security and health coverage; and delivering essential services such as access to modern energy, water, sanitation, waste treatment and transport.
33 http://www.unep.org/greeneconomy/Portals/88/documents/ger/GER_synthesis_en.pdf

35
Green industries/ Environmental Goods and Services Sector (EGSS)
Eurostat Handbook (2009) – Based on OECD/Eurostat definition in 199934
The Environmental Goods and Services Sector (EGSS) includes producers of technologies, goods and services that:
1) Measure, control, restore, prevent, treat, minimize, research and sensitize environmental damages to air, water and soil as well as problems related to waste, noise, biodiversity and landscapes. This includes “cleaner” technologies, goods and services that prevent or minimize pollution.
2) Measure, control, restore, prevent, minimize, research and sensitize resource depletion. This results mainly in resource‐efficient technologies, good and service that minimize the use of natural resources.
Green industry statistics in the Republic of Korea (Lee Jae‐Won from Statistics Korea at the UNEP Workshop, Nov 2011, on Measuring “Green…)
The green industries are defined as those industries that produce goods and services that enhance energy‐ and resource efficiency, reduce greenhouse gases and improve the environment. These are determined on the basis of the green products classification system, for which a concordance table with the classification system of the EGSS has been developed.
Greening of occupations
The US National Center for O*NET Development (2009) 35
“Greening of the World of Work: Implications for O*NET, SOC and New and Emerging Occupations”(2009)
The ‘greening’ of occupations refers to the extent to which green economy activities and technologies increase the demand for existing occupations, shape the work and worker requirements needed for occupational performance, or generate unique work and worker requirements.”
34 http://epp.eurostat.ec.europa.eu/cache/ITY_OFFPUB/KS‐RA‐09‐012/EN/KS‐RA‐09‐012‐EN.PDF
35 http://www.onetcenter.org/dl_files/Green.pdf),(http://www.onetcenter.org/reports/Green.html
36
APPENDIX II: Some country practices in defining green jobs
United States of America36
The U.S Bureau of Labor Statistics has developed a framework and methodology for measuring green jobs based on the type of the production (green production or not.
According to this framework, green jobs are either:
A. Jobs in businesses that produce goods and provide services that benefit the environment or conserve natural resources. These goods and services are sold to customers, and include research and development, installation, and maintenance services. This definition was used in the BLS survey of establishments in industries that produce green goods and services. Green goods and services fall into one or more of five groups:
1. Energy from renewable sources. Electricity, heat, or fuel generated from renewable sources. These energy sources include wind, biomass, geothermal, solar, ocean, hydropower, landfill gas, and municipal solid waste.
2. Energy efficiency. Products and services that improve energy efficiency: Included in this group are energy‐efficient equipment, appliances, buildings, and vehicles, as well as products and services that improve the energy efficiency of buildings and the efficiency of energy storage and distribution, such as Smart Grid technologies.
3. Pollution reduction and removal, greenhouse gas reduction, and recycling and reuse. These are products and services that:
- Reduce or eliminate the creation or release of pollutants or toxic compounds, or remove pollutants or hazardous waste from the environment.
- Reduce greenhouse gas emissions through methods other than renewable energy generation and energy efficiency, such as electricity generated from nuclear sources.
- Reduce or eliminate the creation of waste materials; collect, reuse, remanufacture, recycle, or compost waste materials or wastewater.
4. Natural resources conservation. Products and services that conserve natural resources: Included in this group are products and services related to organic agriculture and sustainable forestry; land management; soil, water, or wildlife conservation; and storm water management.
5. Environmental compliance, education and training, and public awareness. These are products and services that:
- Enforce environmental regulations.
- Provide education and training related to green technologies and practices.
- Increase public awareness of environmental issues.
B. Jobs in which workers’ duties involve making their establishment’s production processes more environmentally friendly or use fewer natural resources. These workers research, develop, maintain, or use technologies and practices to lessen the environmental impact of their establishment, or train the establishment’s workers or contractors in these technologies
36 www.bls.gov/green
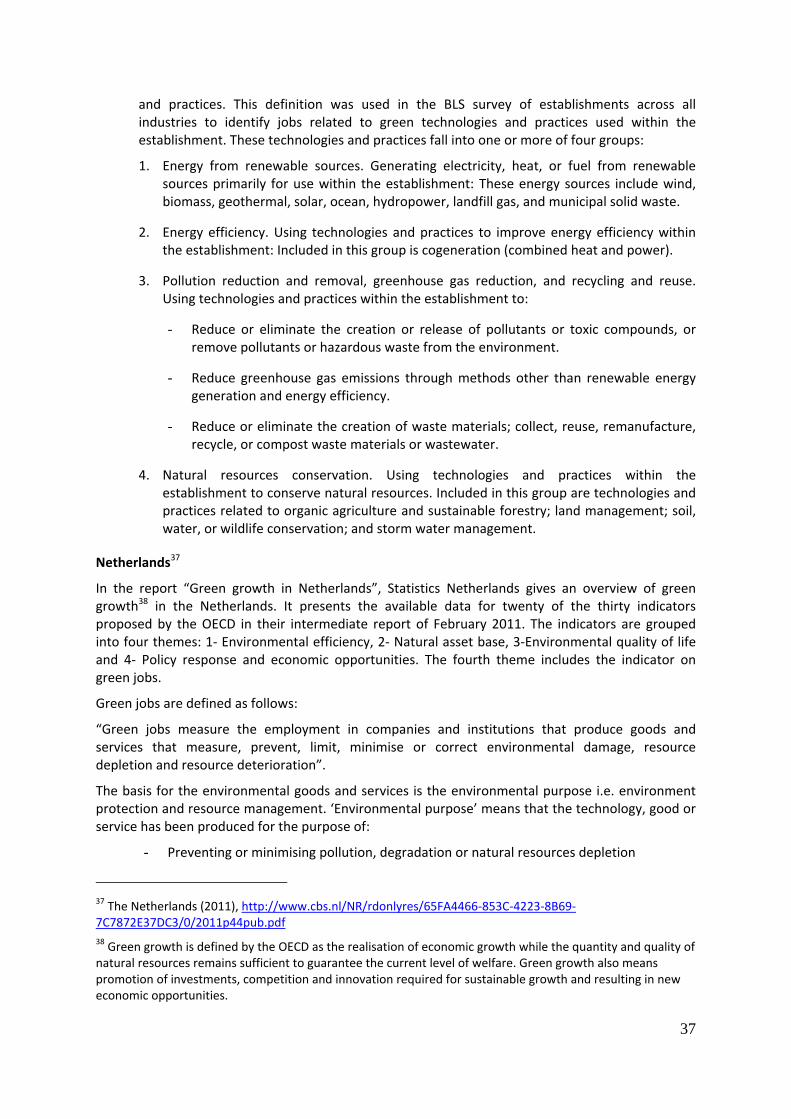
37
and practices. This definition was used in the BLS survey of establishments across all industries to identify jobs related to green technologies and practices used within the establishment. These technologies and practices fall into one or more of four groups:
1. Energy from renewable sources. Generating electricity, heat, or fuel from renewable sources primarily for use within the establishment: These energy sources include wind, biomass, geothermal, solar, ocean, hydropower, landfill gas, and municipal solid waste.
2. Energy efficiency. Using technologies and practices to improve energy efficiency within the establishment: Included in this group is cogeneration (combined heat and power).
3. Pollution reduction and removal, greenhouse gas reduction, and recycling and reuse. Using technologies and practices within the establishment to:
- Reduce or eliminate the creation or release of pollutants or toxic compounds, or remove pollutants or hazardous waste from the environment.
- Reduce greenhouse gas emissions through methods other than renewable energy generation and energy efficiency.
- Reduce or eliminate the creation of waste materials; collect, reuse, remanufacture, recycle, or compost waste materials or wastewater.
4. Natural resources conservation. Using technologies and practices within the establishment to conserve natural resources. Included in this group are technologies and practices related to organic agriculture and sustainable forestry; land management; soil, water, or wildlife conservation; and storm water management.
Netherlands37
In the report “Green growth in Netherlands”, Statistics Netherlands gives an overview of green growth38 in the Netherlands. It presents the available data for twenty of the thirty indicators proposed by the OECD in their intermediate report of February 2011. The indicators are grouped into four themes: 1‐ Environmental efficiency, 2‐ Natural asset base, 3‐Environmental quality of life and 4‐ Policy response and economic opportunities. The fourth theme includes the indicator on green jobs.
Green jobs are defined as follows:
“Green jobs measure the employment in companies and institutions that produce goods and services that measure, prevent, limit, minimise or correct environmental damage, resource depletion and resource deterioration”.
The basis for the environmental goods and services is the environmental purpose i.e. environment protection and resource management. ‘Environmental purpose’ means that the technology, good or service has been produced for the purpose of:
- Preventing or minimising pollution, degradation or natural resources depletion
37 The Netherlands (2011), http://www.cbs.nl/NR/rdonlyres/65FA4466‐853C‐4223‐8B69‐7C7872E37DC3/0/2011p44pub.pdf
38 Green growth is defined by the OECD as the realisation of economic growth while the quantity and quality of natural resources remains sufficient to guarantee the current level of welfare. Green growth also means promotion of investments, competition and innovation required for sustainable growth and resulting in new economic opportunities.

38
- Reducing, eliminating, treating and managing pollution, degradation and natural resources depletion or restoring environmental damage to air, water, waste, noise, biodiversity and landscapes
- Carrying out other activities such as measurement and monitoring, control, research and development, education, training, information and communication related to environmental protection and/or resource management.
The environmental goods and services sector consists of a heterogeneous set of producers of technologies, goods and services that:
- Measure, control, restore, prevent, treat, minimise, research and sensitise environmental damages to air, water and soil as well as problems related to waste, noise, biodiversity and landscapes. This includes ‘cleaner’ technologies, goods and services that prevent or minimise pollution.
- Measure, control, restore, prevent, minimise, research and sensitise resource depletion. This results mainly in resource‐efficient technologies, goods and services that minimise the use of natural resources.
Other aspects of green growth, such as greening production processes which may occur in all industries, are described by other indicators. For example production based greenhouse gas intensity, energy efficiency, surplus of nutrients, material intensity, water use intensity and waste treatment under the theme environmental efficiency and fish inputs and threat to biodiversity under the theme natural asset base.
Australia and New Zealand39
In order to define “Green collar workers”, the Environment Institute of Australia and New Zealand looked at data on occupation by industry and identifed three factors that describe a ‘green collar worker’:
- the skills and responsibilities of the individual, - the industry and nature of the organisation for which they work, and - whether the job and the organisation tend towards the environmental or sustainable
end of the green spectrum.
Based on these criteria and on analysis of the occupational groups defined in the Australian and New Zealand Stansrd Classification of Occupations, they concluded that:
(i) In the first three ANZSCO groups – Managers, Professionals and Technicians, and Trade Workers, green collar workers are usually defined by their specific skills or responsibilities, though they may also be defined by the nature of their organisation.
(ii) In the last five groups, green collar workers are almost always defined by the nature of organisation they work for.
This lead to two types of green collar workers:
i. Managers, professionals and technicians who work in green organisations or who have green skills and responsibilities within other organisations that may not be considered green.
ii. Services, clerical, sales and semi‐skilled workers who work in green organisation
The report, however, does not explicitly specify what constitutes a green organisation.
39 Who are the Green Collar Workers? Defining and identifying workers in sustainability and the environment, Environment Institute of Australia and New Zealand, 2009

39
New Zealand40
Green jobs are jobs that produce goods or provide services that benefit the environment or conserve natural resources through the use of sustainable, environmentally friendly, processes and technologies.
Canada41
Environmental employment is the performance of employment activities that seek to manage the use of, impact on, and enhance the sustainability of the environment. These activities, which could relate to the governance of environmental activities, the supply of environ‐mental products and services, or the development and dissemination of environmental knowledge, may be categorized in any of the following sectors:
a) Environmental protection,
b) Conservation & preservation of natural re‐sources, and
c) Environmental sustainability.
Denmark42
In its reports “Green production in Denmark – and its significance for the Danish economy”, Denmark presents the result of its work to establish new green business statistics on production of environmental technologies, goods and services by Danish enterprises. The green business statistics have been established according to Eurostat’s guidelines. The report is available at http://www.ens.dk/sites/ens.dk/files/policy/green‐production‐denmark‐contributes‐significantly‐danish‐economy/Green%20production%20in%20Denmark%20‐%20web%20111212.pdf
Bangladesh4344
“Green jobs” refers to the direct employment which reduces environmental impact ultimately to the levels that are sustainable. This includes jobs that help to reduce the consumption of energy and raw materials, decarbonize the economy, protect and restore ecosystems and biodiversity, and minimize the production of waste and pollution.
Core environment‐related employment refers to jobs which are sustained by activities that are more environmentally sustainable (as defined by compliance with relevant standards and other performance indicators in the study process) but which have not been ‘filtered’ for decency of work.
40 How green is my occupation classification (2010), http://www.victoria.ac.nz/vms/industrial‐relations‐centre/irc‐events/lew‐conference‐welcome/lew‐papers/D5_LEW14_final_paper_‐_Hancock.pdf
41 ECO Canada. Environmental Statistics. Measuring Green Collar Jobs in British Columbia. (2010), http://www.docstoc.com/docs/42797176/Measuring‐Green‐Collar‐Jobs‐in‐British‐Columbia‐‐‐Environmental
42 DAMWAD (2012), Methodology: Green goods and services in Denmark, http://www.ens.dk/sites/ens.dk/files/info/tal‐kort/statistik‐noegletal/groen‐produktion‐bidrager‐betydeligt‐dansk‐oekonomi/Methodology%20for%20Green%20business%20statistics%202012%20Final.pdf
43 Green Jobs in Bangladesh (2008), http://www.ilo.org/wcmsp5/groups/public/‐‐‐asia/‐‐‐ro‐bangkok/documents/meetingdocument/wcms_099401.pdf
44 Estimating Green Jobs in Bangladesh (2010), http://www.ilo.org/wcmsp5/groups/public/‐‐‐ed_emp/‐‐‐emp_ent/documents/publication/wcms_159433.pdf

40
APPENDIX III: Estimates of green employment form selected countries
This appendix contains examples of estimates of green employment from selected countries that have carried out studies of the sector (Austria, France, Netherlands, Sweden and USA)
Netherlands
In 2009 the EGSS contributed 13.2 billion Euros to the Dutch GDP and 137,000 full‐time equivalents to employment. Total value added equalled 32.4 billion Euros. In 2009 EGSS had a share of 1.6% in total employment in the Netherlands and the contribution to GDP was 2.3 %.
In 2009, the largest share of employment in total EGSS employment belonged to activities related to ‘Insulation” (23 % of total EGSS employment) whose contribution to total EGSS turnover was 15 %. Activities related to ‘Sewerage and refuse disposal services’ were responsible for 28% of total EGSS turnover. Sustainable Energy sector which consist of companies and institutions that have focus on energy saving activities, also played an important role in EGSS with 11% of total EGSS turnover and about 11% of EGSS employment.
Figure 1. Environmental employment and environmental turnover by environmental domain, 2009
Source: Statistics Netherlands (2012)45
France
EGSS employment increased 2.5 percent over the period of 2007‐2009 and EGSS turnover increased 8.4 percent. In 2009 management of energy resources accounted for almost 25% of total employment in EGSS. In terms of turnover, the most important activity was management of water which was responsible for 26.6% of total EGSS turnover.
45 Rossum , Maarten van (2012) : Economics indicators for the Dutch Environmental Goods and Services Sector, Time series data for 1995‐2009 , CSB Netherlands ,The Hague 2012, National Accounts Department available at http://www.cbs.nl/NR/rdonlyres/6048B589‐C79F‐416E‐A5E2‐BD93E3DCA29C/0/2012EGSSCBSbackground.pdf
11.2%
23.8%
28.3%
15.3%
0%
5%
10%
15%
20%
25%
30%
Employment Turnover

41
Figure 2. Environmental employment and environmental turnover by environmental domain, 2009
Source: Eurostat 46
Sweden
From 2003 to 2009 EGSS turnover increased 47.6 per cent while employment increased 13.3 per cent.
Figure 3. EGSS Employment and turnover (2003‐2009)
Source: Statistics Sweden47
46 http://epp.eurostat.ec.europa.eu/portal/page/portal/environment/data/database
47 System of Environmental and Economic Accounts database http://www.scb.se/MI1301‐EN
0%
5%
10%
15%
20%
25%
30%
Employment
Turnover
0
50,000
100,000
150,000
200,000
250,000
300,000
2003 2004 2005 2006 2007 2008 2009
Turnover (million SEK)
Employed, total
Linear (Turnover(million SEK))
Linear (Employed,total)

42
Among all environmental domains, Waste Management in Sweden had the largest number of employees, 15,480 employees out of total 68,972. The second largest environmental domain with almost 21% of employees was Renewable Energy. This sector is responsible for almost 50% of total EGSS turnover.
According to the data about 75 % of the employees were men.
Figure 4. Environmental employment and environmental turnover by environmental domain, 2009
Source: Statistics Sweden48
Austria
Employment in EGSS increased 9.6 per cent between 2008 and 2010 grown. In the same period the turnover in the environmental sectors increased 5.8 per cent.
Figure 5. Share of environmental turnover and environmental employment in total turnover and in total employment, 2008‐2010
48 System of Environmental and Economic Accounts database http://www.scb.se/MI1301‐EN
0%
10%
20%
30%
40%
50%
60%
Turnover
Employment
‐
2.0
4.0
6.0
8.0
10.0
12.0
14.0
2008 2009 2010
Share of environmentalturnover in GDP (nom.)
Share of environmentalemployment in totalemployment

43
Source: Statistics Austria 49
Figure 6 illustrates the distribution of environmental turnover and employment by two main environmental activity categories: Environmental Protection and Resource Management Activities. The data reveal that environmental protection activities are more labour intensive than resource management ones. Environmental Protection Activities accounted for 57.5% % of total employment in EGSS but contributed to 38.6% of EGSS turnover. Resource Management activities were responsible for over 60 per cent of EGSS turnover and over 40 per cent of employment in EGSS.
In 2010, management of energy resources, including renewable energy, heating and energy saving and also minimization of the intake of fossil resources for uses other than energy production, had the largest contribution to the employment and turnover in EGSS (almost 50% of total turnover and 35 % of total employment). Employment in this environmental domain grew 0.6 per cent between 2008 and 2010 and turnover increased 5.1 per cent in the same period.
The second largest environmental domain, in terms of employment, is ‘Protection and remediation of soil, groundwater and surface water ‘with 26.4% of total employment. Employment growth in this sector was 38.7 per cent from 2008 to 2010 and environmental turnover growth of 34.1 per cent happened at the same period.
Figure 6. Turnover and employment in Environmental protection activities and Resource management activities (2010)
Source: Statistics Austria50
Between 2008 and 2010l turnover and employment in EGSS increased more than increases in GDP and in total employment. Environmental Turnover had increased 5.8 per cent and Environmental employment increased 9.6 per cent; while the increase in GDP was only 1.2 per cent and total employment had a negative growth of 0.7 per cent.
49 The Environmental Goods and Services Sector (EGSS database http://www.statistik.at/web_en/statistics/energy_environment/environment/eco_industries_environmentally_goods_and_services/index.html
50 The Environmental Goods and Services Sector (EGSS database http://www.statistik.at/web_en/statistics/energy_environment/environment/eco_industries_environmentally_goods_and_services/index.html
38.6
57.5
61.4
42.5
0%
10%
20%
30%
40%
50%
60%
70%
80%
90%
100%
Environmental turnover Environmental employment
ResoruceManagementActivities
EnvironemtalProtectionActivities

44
Denmark
Around 106,000 employees were involved in green production in 2010. This corresponds to almost 9% of all full‐time employees in all enterprises with at least one full‐time employee. The majority of these employees worked in manufacturing. In 2010, 15% of all employees in manufacturing worked with green production. This was the case for 12% of employees in the agriculture industry and 6% of employees in the service industry.
Table 1: Employment by industries, 2010
Industry Employment, No. of persons Percentage of employees
involved in green production Total In green production
Agriculture 29,300 3,500 12%
Manufacturing, incl. construction and utilities
398,200 55,900 15%
Services 826,900 46,600 6%
Total 1,254,400 106,000 9%
Source: Danish Energy Agency / Ministry of Climate, Energy and Building/Danish Business Authority /
Ministry of Business and Growth/ Danish EPA / Ministry of the Environment51
USA
In 2010, Green Goods and Services employment was 3,129,112 (2.4 % of total employment) of which 2,268,824 jobs were in private sector. Government had 860,300 GGS jobs which was about 4% of total public sector employment. Local government was responsible for the major part of GGS jobs in public sector with 476,500 jobs representing 3.4% of total local government employment. Transportation and warehousing sector had the major GGS employment in local government (228,900 GGs jobs).
In 2010 private industry accounted for 2,268,800 GGS jobs. Manufacturing had the largest share in GGS private sector jobs (20%) which are 4% of manufacturing jobs. Construction industry including construction of plants that produce energy from renewable sources and weatherizing and retrofitting projects that reduce household’s energy consumption, had 372,100 GGS jobs which is correspond to 6.8% of all jobs in construction. Professional, scientific, and technical services is the 3rd largest private industry which accounted for 349,024 jobs which is 4.7% of this industry’s employment. This industry contains engineering and architectural services, computer systems design and management and consulting services.
Administrative and waste services industry which includes waste collection and remediation services, accounted for 319000 jobs, 4.3% of total industry’s employment.
Table 2. Green Goods and Services Employment in public and private sector (2010)
Private and public sector Private sector
GGS employment 3,129,112 2,268,824
Total employment 127,820,442 106,201,232
GGS share in total 2.45% 2.14%
Source: BLS (2012)52
51 http://www.ens.dk/sites/ens.dk/files/policy/green‐production‐denmark‐contributes‐significantly‐danish‐economy/Green%20production%20in%20Denmark%20‐%20web%20111212.pdf

45
According to the US BLS, Green Technologies and Practices survey about 854,700 jobs, representing 0.7 percentage of total U.S. employment, were held by workers who spent more than half of their time involved in green technologies and practices during the survey reference period. The industries with the highest levels of GTP employment included administrative and waste services (151,900) and construction (134,100). GTP employment as a percentage of industry employment ranged from 2.3 per cent in construction to 0.1 per cent in finance and insurance and information. (See table 5.)
Figure 7. Employment for workers spending more than half their time involved in green technologies and practices (GTP employment) by industry, August 2011
a) Industry GTP employment as a percentage of total industry employment
Source: BLS (2012)53
b) Industry GTP employment as a percent of total GTP employment
52 Green Goods and Services News Release, http://www.bls.gov/news.release/ggqcew.htm
53 Green Technologies and Practices (GTP), http://www.bls.gov/gtp/
0.0% 0.5% 1.0% 1.5% 2.0% 2.5%
Total GTP employment, all…
Agriculture, Forestry, Fishing…
Mining, Quarrying, and Oil and…
Utilities
Construction
Manufacturing
Wholesale Trade
Retail Trade
Transportation and Warehousing
Information
Finance and Insurance
Real Estate and Rental and…
Professional, Scientific, and…
Management of Companies…
Administrative and Waste…
Educational Services
Health Care and Social Assistance
Arts, Entertainment, and…
Accommodation and Food…
Other Services (except Public…
Public Administration

46
Source: BLS (2012)54
54 Green Technologies and Practices (GTP), http://www.bls.gov/gtp/
0.0%2.0%4.0%6.0%8.0%10.0%12.0%14.0%16.0%18.0%20.0%