Embed Size (px)
Citation preview
HCV RWE PMOS Statistical Analysis Plan P15-650
Version 1.7
RWE_SAP_BE_2016-11-22_V1-7.docx Page 1 of 47
STATISTICAL ANALYSIS PLAN STUDY P15-650
Version 1.7
22 November 2016
HCV RWE PMOS Statistical Analysis Plan P15-650
Version 1.7
RWE_SAP_BE_2016-11-22_V1-7.docx Page 2 of 47
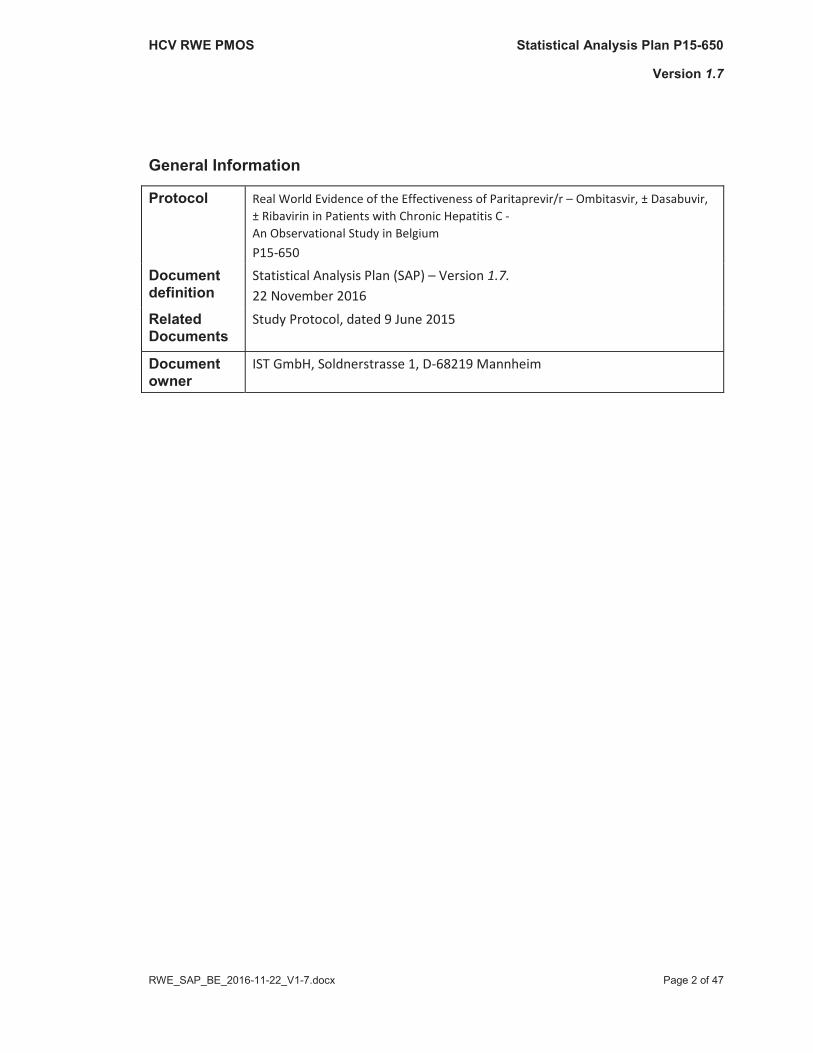
General Information
Protocol Real World Evidence of the Effectiveness of Paritaprevir/r – Ombitasvir, ± Dasabuvir, ± Ribavirin in Patients with Chronic Hepatitis C - An Observational Study in Belgium P15-650
Document definition
Statistical Analysis Plan (SAP) – Version 1.7. 22 November 2016
Related Documents
Study Protocol, dated 9 June 2015
Document owner
IST GmbH, Soldnerstrasse 1, D-68219 Mannheim
HCV RWE PMOS Statistical Analysis Plan P15-650
Version 1.7
RWE_SAP_BE_2016-11-22_V1-7.docx Page 3 of 47
TABLE OF CONTENTS Page
1. INTRODUCTION .........................................................................................................................8
2. STUDY OBJECTIVES ....................................................................................................................8
3. STUDY DESIGN ...........................................................................................................................9
3.1 Overview of Study Design and Dosing Regimen ....................................................9
3.2 Sample Size Calculation ...................................................................................... 10
4. STATISTICAL CONSIDERATIONS AND ANALYTICAL PLAN ........................................................ 11
4.1 Primary and Secondary Parameters ................................................................... 11
4.1.1 Primary Effectiveness Parameter ....................................................................... 11
4.1.2 Secondary Parameters ........................................................................................ 11
4.2 Statistical and Analytical Methods...................................................................... 12
4.2.1 Analysis Populations and Analysis Groups .......................................................... 12
4.2.2 Definition of Baseline and Visit Time Windows .................................................. 17
4.2.3 Handling of missing data ..................................................................................... 20
4.2.4 Site and Researcher Information ........................................................................ 21
4.2.5 Patient Disposition .............................................................................................. 22
4.2.6 Baseline Characteristics ...................................................................................... 23
4.2.6.1 Socio-demographic characteristics ..................................................................... 23
4.2.6.2 CHC disease characteristics ................................................................................ 24
4.2.6.3 CHC treatment history ........................................................................................ 25
4.2.6.4 Co-morbidities and co-infections ........................................................................ 25
4.2.6.5 CHC related and other laboratory data at baseline ............................................ 27
4.2.7 Analyses of the Objectives .................................................................................. 29
4.2.7.1 Primary Effectiveness Variable ........................................................................... 29
HCV RWE PMOS Statistical Analysis Plan P15-650
Version 1.7
RWE_SAP_BE_2016-11-22_V1-7.docx Page 4 of 47
4.2.7.2 Secondary Variables ............................................................................................ 29
4.2.8 Analyses of Safety ............................................................................................... 38
4.2.8.1 Exposure to Study Medication ............................................................................ 38
4.2.8.2 Co-medication ..................................................................................................... 38
4.2.8.3 Adverse Events .................................................................................................... 40
4.2.8.4 Laboratory Data .................................................................................................. 41
4.2.9 Interim Analyses ................................................................................................. 44
4.2.10 Protocol Violations and Deviations ..................................................................... 45
5. DATA QUALITY ASSURANCE ................................................................................................... 45
6. METHODS OF DATA ANALYSIS AND PRESENTATION ............................................................. 46
6.1 Analysis Data Sets ............................................................................................... 46
6.2 SAS Output Format ............................................................................................. 46
7. REFERENCES ........................................................................................................................... 47
HCV RWE PMOS Statistical Analysis Plan P15-650
Version 1.7
RWE_SAP_BE_2016-11-22_V1-7.docx Page 5 of 47
GLOSSARY OF ABBREVIATIONS
AE adverse event APRI AST to platelet ratio index AFP alfa fetoprotein ALT alanine-aminotransferase
AST aspartate-aminotransferase ANCOVA analysis of covariance
BMI body mass index BMQ beliefs medication questionnaire
CA competent authority
CD4 cluster of differentiation 4 CHC chronic hepatitis C
CI confidence interval CNI calcineurin
CP core population CPFSU core population with sufficient follow-up data
CT computer tomography DAA direct-acting antiviral agentDDI drug-drug interactionEC ethics committee
EDC electronic data captureeCRF electronic case report formEMA European Medicines AgencyEoT end of treatment
EQ-5D-5L EuroQol 5 dimension 5 levelFDA Food and Drug Administration
FIB-4 Fibrosis-4 Score/Index-GT gamma-glutamyltransferase
HCC hepatocellular carcinomaHCP health care provider
Hb hemoglobinHbA1c hemoglobin A1c
HBV hepatitis B virus

HCV RWE PMOS Statistical Analysis Plan P15-650
Version 1.7
RWE_SAP_BE_2016-11-22_V1-7.docx Page 6 of 47
GLOSSARY OF ABBREVIATIONS
HCV hepatitis C virusHDL high-density lipoproteinHIV human immunodeficiency virus
HOMA homeostasis model assessmentHVPG hepatic venous pressure gradientICMJE International Committee of Medical Journal Editors
IEC/IRB independent ethics committee/- review boardIgA Immunoglobulin AIgG Immunoglobulin G IgM Immunoglobulin M INN international non-proprietary nameINR international normalized ratioLDL low-density lipoprotein
LLoD lower limit of detectionLLoQ lower limit of quantificationMAH Marketing Authorization Holder
MedDRA Medical Dictionary for Regulatory ActivitiesMLR multiple logistic regressionMRI magnetic resonance imaging
NCP non-core populationNS3/NS4A nonstructural protein 3/nonstructural protein 4A
NS5A nonstructural protein 5ANS5B nonstructural protein 5BOATP organic anion-transporting polypeptide
OLT orthotopic liver transplantPAM-13 Patient Activation Measure 13
paritaprevir/r paritaprevir/ritonavirPCR polymerase chain reactionPCT Porphyria cutanea tarda
pegIFN pegylated interferonPRO patient reported outcomePSP patient support program
PT preferred term
HCV RWE PMOS Statistical Analysis Plan P15-650
Version 1.7
RWE_SAP_BE_2016-11-22_V1-7.docx Page 7 of 47
GLOSSARY OF ABBREVIATIONS
RBV ribavirinRF rheumatoid factor
RNA ribonucleic acidSAE serious adverse eventSAP statistical analysis plan
SD standard deviationSDP study designated physicianSNP single nucleotide polymorphismSOC system organ class
SP safety populationSVR sustained virological response
SVR12 SVR at 12 weeks after EoTSVR24 SVR at 24 weeks after EoT
TAI total activity impairmentTP target population
TWP total work productivity impairmentVAS visual analogue scale
WHO World Health OrganizationWPAI work productivity and activity impairment
WPAI-GH WPAI as general health measureWPAI-SHP WPAI modified for specific health condition
HCV RWE PMOS Statistical Analysis Plan P15-650
Version 1.7
RWE_SAP_BE_2016-11-22_V1-7.docx Page 8 of 47
1. INTRODUCTIONThe interferon-free combination regimen of paritaprevir/r and ombitasvir with or without dasabuvir(ABBVIE REGIMEN) ± ribavirin (RBV) for the treatment of chronic hepatitis C (CHC) has been shown to be safe and effective in randomized controlled clinical trials with strict inclusion and exclusion criteria under well controlled conditions.
The rationale for this observational study is to determine how the efficacy and safety of the ABBVIE REGIMEN as demonstrated in pivotal trials translates into real world everyday clinical settings, which means evaluating its effectiveness. Whereas efficacy can be defined as a measure of the capacity of a treatment to produce the desired effect in a controlled environment, such as in a randomized controlled trial, effectiveness is the extent to which a drug achieves its intended effect in the usual clinical setting. Effectiveness trials typically have limited exclusion criteria and will involve the broader patient populations in routine clinical practice, treated per local label, which might include patients with heterogeneous compliance patterns and patients with significant comorbid conditions and could be used to model and disseminate best practices. Effectiveness research allows for external patient-, provider-, and system-level factors and can therefore be more relevant for health-care decisions by both providers in practice and policy-makers.
This observational study is the first effectiveness research examining the ABBVIE REGIMEN ± RBV, used according to local label, under real world conditions in Belgium in a clinical practice patient population. During the last decade, when dual therapy with pegylated interferon (pegIFN) plus RBV was standard of care for the treatment of CHC, the discovery of predictive factors for virological response and the subsequent development of treatment algorithms marked a milestone in patient care for CHC. As a consequence, treatment could be effectively targeted to patients most likely to respond. Interestingly, many of the now well established predictors of response to pegIFN/RBV and first generation direct acting antivirals (DAAs) in combination with pegIFN/RBV were not predictive of outcome in the development trials of the ABBVIE REGIMEN ± RBV. This observational study may play an important part in bridging the data gaps. It may help identify predictive factors of response that are important in real world treatment settings and thus, could assist in further optimizing treatment with the interferon-free ABBVIE REGIMEN ± RBV in the future.
The label of the ABBVIE REGIMEN ± RBV will vary according to hepatitis C virus (HCV) genotype/subtype and stage of liver disease. It is therefore relevant to understand the pattern of use and outcome in daily clinical practice. In addition, this study will provide data on the impact of adherence on treatment outcomes in everyday settings, which may help treating physicians to improve the management of patients under their care.
The main aim of this observational study is to provide evidence of the effectiveness of the ABBVIE REGIMEN ± RBV in a real world setting across clinical practice patient populations.
2. STUDY OBJECTIVES
The objectives of this study are:
HCV RWE PMOS Statistical Analysis Plan P15-650
Version 1.7
RWE_SAP_BE_2016-11-22_V1-7.docx Page 9 of 47
Primary objective:
1. To describe in routine clinical practice the effectiveness of the interferon-free ABBVIEREGIMEN ± RBV in patients with CHC as evidenced by sustained virological response at12 weeks after end of treatment (SVR12)
Secondary objectives:
2. To provide real world evidence for predictive factors of virological response3. To describe the pattern of real world use of the ABBVIE REGIMEN ± RBV with respect to
different patient and treatment characteristics4. To evaluate the influence of adherence on treatment outcome in routine clinical practice5. To collect information on co-morbidities and concomitant medication in the Belgian
population6. To describe the tolerability of the ABBVIE REGIMEN ± RBV7. To determine the impact of the ABBVIE REGIMEN ± RBV on healthcare resource
utilization8. To evaluate the contribution of the patient support program (PSP) to disease control,
treatment continuation over time, patient satisfaction and PSP utilization9. To assess viral resistance patterns
3. STUDY DESIGN
3.1 Overview of Study Design and Dosing RegimenThis is a prospective, multi-center observational study in adult patients chronically infected with HCV receiving the interferon-free ABBVIE REGIMEN ± RBV.
University centers and outpatient clinics qualified by training and experience in the management of patients with CHC participate in this study.
The prescription of a treatment regimen is at the discretion of the physician in accordance with local clinical practice and label, is made independently from this observational study and precedes the decision to offer the patient the opportunity to participate in this study.
After written informed consent has been obtained, patient data including demographic data, HCV disease characteristics, co-morbidities, co-medication, treatment details, and laboratory assessments as recorded in the patient's medical records (source documentation) aredocumented in the electronic case report form (eCRF). Patients are observed for the duration of the ABBVIE REGIMEN therapy and for up to 24 weeks after treatment completion.
The observational period for patients receiving 12 weeks of ABBVIE REGIMEN is max. 36 weeks (12 weeks treatment and 24 weeks post-treatment observation) and for patients receiving 24 weeks of ABBVIE REGIMEN the observational period is max. 48 weeks (24 weeks treatment and 24 weeks post-treatment observation).
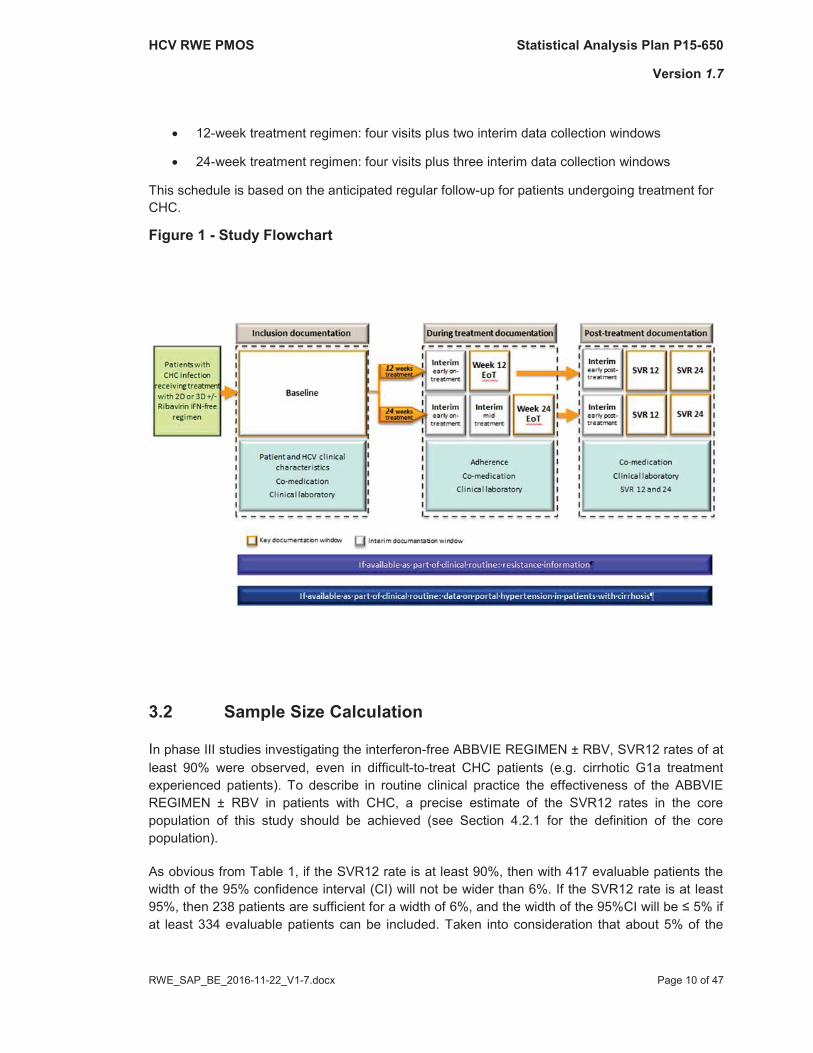
Follow-up visits, treatment, procedures and diagnostic methods follow physicians’ routine clinical practice. The observational study period entails the following data collection schemes, data documented are those closest to the time windows as indicated in Figure 1:
HCV RWE PMOS Statistical Analysis Plan P15-650
Version 1.7
RWE_SAP_BE_2016-11-22_V1-7.docx Page 10 of 47
12-week treatment regimen: four visits plus two interim data collection windows
24-week treatment regimen: four visits plus three interim data collection windows
This schedule is based on the anticipated regular follow-up for patients undergoing treatment for CHC.
Figure 1 - Study Flowchart
3.2 Sample Size Calculation
In phase III studies investigating the interferon-free ABBVIE REGIMEN ± RBV, SVR12 rates of at least 90% were observed, even in difficult-to-treat CHC patients (e.g. cirrhotic G1a treatment experienced patients). To describe in routine clinical practice the effectiveness of the ABBVIE REGIMEN ± RBV in patients with CHC, a precise estimate of the SVR12 rates in the core population of this study should be achieved (see Section 4.2.1 for the definition of the core population).
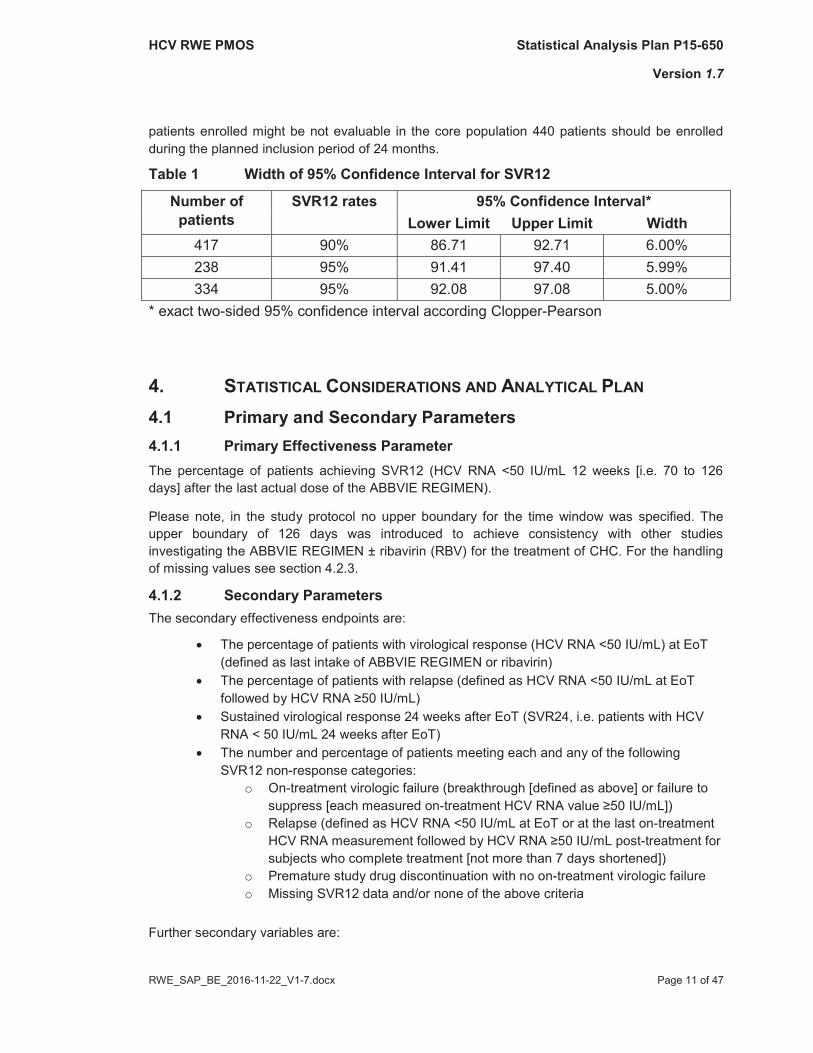
As obvious from Table 1, if the SVR12 rate is at least 90%, then with 417 evaluable patients the width of the 95% confidence interval (CI) will not be wider than 6%. If the SVR12 rate is at least 95%, then 238 patieat least 334 evaluable patients can be included. Taken into consideration that about 5% of the
HCV RWE PMOS Statistical Analysis Plan P15-650
Version 1.7
RWE_SAP_BE_2016-11-22_V1-7.docx Page 11 of 47
patients enrolled might be not evaluable in the core population 440 patients should be enrolled during the planned inclusion period of 24 months.
Table 1 Width of 95% Confidence Interval for SVR12
Number ofpatients
SVR12 rates 95% Confidence Interval*Lower Limit Upper Limit Width
417 90% 86.71 92.71 6.00%238 95% 91.41 97.40 5.99%334 95% 92.08 97.08 5.00%
* exact two-sided 95% confidence interval according Clopper-Pearson
4. STATISTICAL CONSIDERATIONS AND ANALYTICAL PLAN
4.1 Primary and Secondary Parameters4.1.1 Primary Effectiveness ParameterThe percentage of patients achieving SVR12 (HCV RNA <50 IU/mL 12 weeks [i.e. 70 to 126days] after the last actual dose of the ABBVIE REGIMEN).
Please note, in the study protocol no upper boundary for the time window was specified. The upper boundary of 126 days was introduced to achieve consistency with other studies investigating the ABBVIE REGIMEN ± ribavirin (RBV) for the treatment of CHC. For the handling of missing values see section 4.2.3.
4.1.2 Secondary ParametersThe secondary effectiveness endpoints are:
The percentage of patients with virological response (HCV RNA <50 IU/mL) at EoT(defined as last intake of ABBVIE REGIMEN or ribavirin)The percentage of patients with relapse (defined as HCV RNA <50 IU/mL at EoT
Sustained virological response 24 weeks after EoT (SVR24, i.e. patients with HCVRNA < 50 IU/mL 24 weeks after EoT)The number and percentage of patients meeting each and any of the followingSVR12 non-response categories:
o On-treatment virologic failure (breakthrough [defined as above] or failure tosuppress [each measured on-
o Relapse (defined as HCV RNA <50 IU/mL at EoT or at the last on-treatment-treatment for
subjects who complete treatment [not more than 7 days shortened])o Premature study drug discontinuation with no on-treatment virologic failureo Missing SVR12 data and/or none of the above criteria
Further secondary variables are:
HCV RWE PMOS Statistical Analysis Plan P15-650
Version 1.7
RWE_SAP_BE_2016-11-22_V1-7.docx Page 12 of 47
Type of treatment regimen (± Dasabuvir, ± RBV, intended and actual combination, doseand duration)Adherence
o Percentage of the DAA dose taken in relation to the target dose of DAA(cumulative dose taken divided by target dose in percent)
o Percentage of the RBV dose taken in relation to the target dose of RBV(cumulative dose taken divided by target dose in percent)
o Percentage of missed RBV treatment days in relation to the target number ofRBV treatment days
Co-morbidities and concomitant medicationSerious and non-serious adverse events and pregnancy occurrencesPAM-13, BMQ, PSP satisfaction and utilization questionnairesResistant virus variants at post-baseline time points compared to baseline
No data will be imputed for any effectiveness or safety analyses except for the analyses of the HCV RNA endpoints and PRO questionnaires (if applicable). For further details see sections 4.2.3 and 4.2.7.2.3, respectively.
4.2 Statistical and Analytical Methods 4.2.1 Analysis Populations and Analysis GroupsPopulation of Patients Enrolled [EP]
The population of patients enrolled comprises all patients who voluntarily sign and date aninformed consent prior to inclusion into the study and data were captured in the eCRF.
Target Population [TP]
Patients will be included if the following applies:
Age at least 18 yearsConfirmed CHC with genotype 1 and/or 4 only, receiving combination therapy with theinterferon-free ABBVIE REGIMEN ± RBV. The prescribed ABBVIE REGIMEN needs tobe known.Have voluntarily signed and dated an informed consent prior to inclusion into the studyMust not be participating or intending to participate in a concurrent interventionaltherapeutic trial
HCV RWE PMOS Statistical Analysis Plan P15-650
Version 1.7
RWE_SAP_BE_2016-11-22_V1-7.docx Page 13 of 47
Core Population [CP]
The core population is defined as all patients of the target population (TP) (definition see above), who are adequately treated according to the standard of care and within local labelrecommendations for their specific disease characteristics (cirrhotic status, genotype). The following patients will be excluded from the CP:
• Patients with unknown fibrosis status
• Cirrhotic patients with genotype 1a not receiving ribavirin
• Patients with genotype 1 for whom 2DAA instead of 3DAA is prescribed
• Patients with genotype 4 not receiving RBV
Non-Core Population [NCP]
Patients in the TP who are not in the CP.
Core Population with Sufficient Follow-up [CPSFU {12, 24}]
In addition, the core population with sufficient follow-up data regarding SVR12 or SVR24, respectively, is defined as all CP patients,
who have evaluable HCV or >126 days, respectively, after the lastactual dose of the ABBVIE REGIMEN
or a HCV RNA value at the last measurement
or had HCV RNA <50 IU/mL at the last measurement, but no HCV RNA measurementor >126 days, respectively, after the last actual dose of the ABBVIE REGIMEN
due to reasons related to safety (e.g. dropped out due to adverse event) or virologicfailure (e.g. virologic failure such as relapse is reported in the electronic case report form(eCRF) but date and value of the corresponding HCV RNA test is missing).
This means only patients who had virological response at their last on-treatment or post-or >126 days,
respectively, post-treatment for reasons not related to safety or effectiveness (e.g. lost-to-follow-or >126 days,
respectively, post-treatment) will be excluded from this analysis.
Safety population [SP]
The safety population is defined as all enrolled patients who received at least one dose of the ABBVIE REGIMEN. The prescribed ABBVIE REGIMEN needs to be known.
HCV RWE PMOS Statistical Analysis Plan P15-650
Version 1.7
RWE_SAP_BE_2016-11-22_V1-7.docx Page 14 of 47
EP and TP analysis groups
The EP/TP analysis groups are defined according to the patient’s fibrosis status and genotype/subtype and standard summaries are structured as follows:
Total (regardless of cirrhosis status)
(1) Total (regardless of genotype)
(2) G1 (Total)
(3) G1a (including mixed G1 subtypes and patients with G1 unknown subtype)
(4) G1b
(5) G4 (non-G1)
(6) Other/unknown genotype (only for EP)
Patients with cirrhosis
(7) Total (regardless of genotype)
(8) G1 (Total)
(9) G1a (including mixed G1 subtypes and patients with unknown G1 subtype)
(10) G1b
(11) G4 (non-G1)
(12) Other/unknown genotype (only for EP)
Patients without cirrhosis
(13) Total (regardless of genotype)
(14) G1 (Total)
(15) G1a (including mixed G1 subtypes and patients with unknown G1 subtype)
(16) G1b
(17) G4 (non-G1)
(18) Other/unknown genotype (only for EP)
Patients with unknown fibrosis status
(19) Total (regardless of genotype)
(20) G1 (Total)
(21) G1a (including mixed subtypes and patients with unknown subtype)
(22) G1b
(23) G4 (non-G1)
(24) Other/unknown genotype (only for EP)
(HCV genotypes will be combined as follows: G1 [total], G1a*, G1b, G4 [non-G1]. * includes mixed or other G1 subtypes and patients with unknown G1 subtypes.
HCV RWE PMOS Statistical Analysis Plan P15-650
Version 1.7
RWE_SAP_BE_2016-11-22_V1-7.docx Page 15 of 47
Most recent stage of liver fibrosis will be categorized as follows: No cirrhosis/Transition to cirrhosis, Cirrhosis. Only one method should be selected by the physicians to report stage of fibrosis. Nevertheless, if there are multiple answers the following priority will be used:
1. Biopsy,2. Non-invasive,3. Clinical/best guess.
For biopsy as assessment method the respective categories are defined as follows:
“No cirrhosis” is defined by “No fibrosis”, “Mild/minimal fibrosis”, “Moderate fibrosis”“Transition to cirrhosis” is defined by “Advanced Fibrosis”“Cirrhosis” is defined by “Cirrhosis”.)
CP analysis groups and related treatment regimens
The CP analysis groups are defined according to the patient’s fibrosis status and genotype/subtype. The standard summaries by CP analysis groups in the CP and CPSFUpopulation are structured follows (is not specified otherwise):
Total (regardless of cirrhosis status)
(1) Total (regardless of genotype)
(2) G1 (Total)
(3) G1a (including mixed subtypes and patients with unknown subtype)
(4) G1b
(5) G4 (non-G1)
Patients with cirrhosis
(6) Total (regardless of genotype)
(7) G1 (Total)
(8) G1a (including mixed subtypes and patients with unknown subtype)
(9) G1b
(10) G4 (non-G1)
Patients without cirrhosis
(11) Total (regardless of genotype)
(12) G1 (Total)
(13) G1a (including mixed subtypes and patients with unknown subtype)
(14) G1b
(15) G4 (non-G1)
HCV RWE PMOS Statistical Analysis Plan P15-650
Version 1.7
RWE_SAP_BE_2016-11-22_V1-7.docx Page 16 of 47
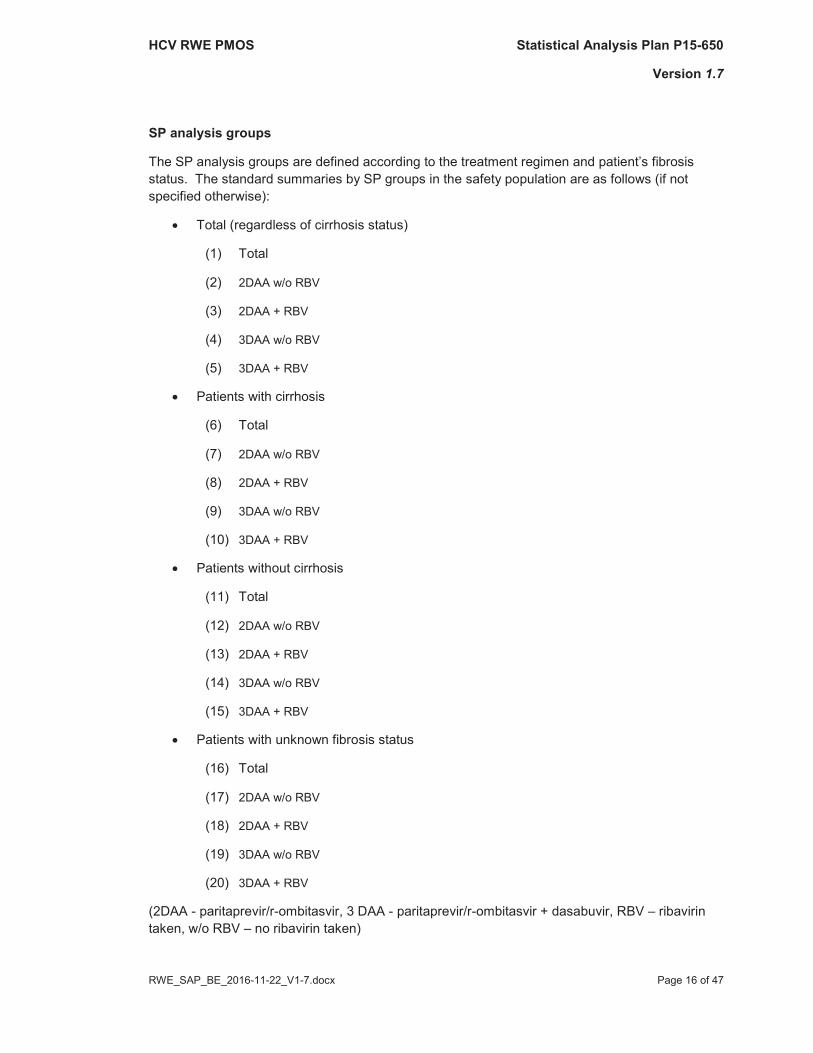
SP analysis groups
The SP analysis groups are defined according to the treatment regimen and patient’s fibrosis status. The standard summaries by SP groups in the safety population are as follows (if not specified otherwise):
Total (regardless of cirrhosis status)
(1) Total
(2) 2DAA w/o RBV
(3) 2DAA + RBV
(4) 3DAA w/o RBV
(5) 3DAA + RBV
Patients with cirrhosis
(6) Total
(7) 2DAA w/o RBV
(8) 2DAA + RBV
(9) 3DAA w/o RBV
(10) 3DAA + RBV
Patients without cirrhosis
(11) Total
(12) 2DAA w/o RBV
(13) 2DAA + RBV
(14) 3DAA w/o RBV
(15) 3DAA + RBV
Patients with unknown fibrosis status
(16) Total
(17) 2DAA w/o RBV
(18) 2DAA + RBV
(19) 3DAA w/o RBV
(20) 3DAA + RBV
(2DAA - paritaprevir/r-ombitasvir, 3 DAA - paritaprevir/r-ombitasvir + dasabuvir, RBV – ribavirin taken, w/o RBV – no ribavirin taken)
HCV RWE PMOS Statistical Analysis Plan P15-650
Version 1.7
RWE_SAP_BE_2016-11-22_V1-7.docx Page 17 of 47
NCP analysis groups
The summary tables for the NCP will only show the data pooled for all patients in the NCP without any subgrouping by genotype and/or fibrosis status.
4.2.2 Definition of Baseline and Visit Time WindowsThis observational study covers three documentation periods, see Figure 1. An overview of data to be collected throughout the study is summarized in Table 2.
HCV RWE PMOS Statistical Analysis Plan P15-650
Version 1.7
RWE_SAP_BE_2016-11-22_V1-7.docx Page 18 of 47
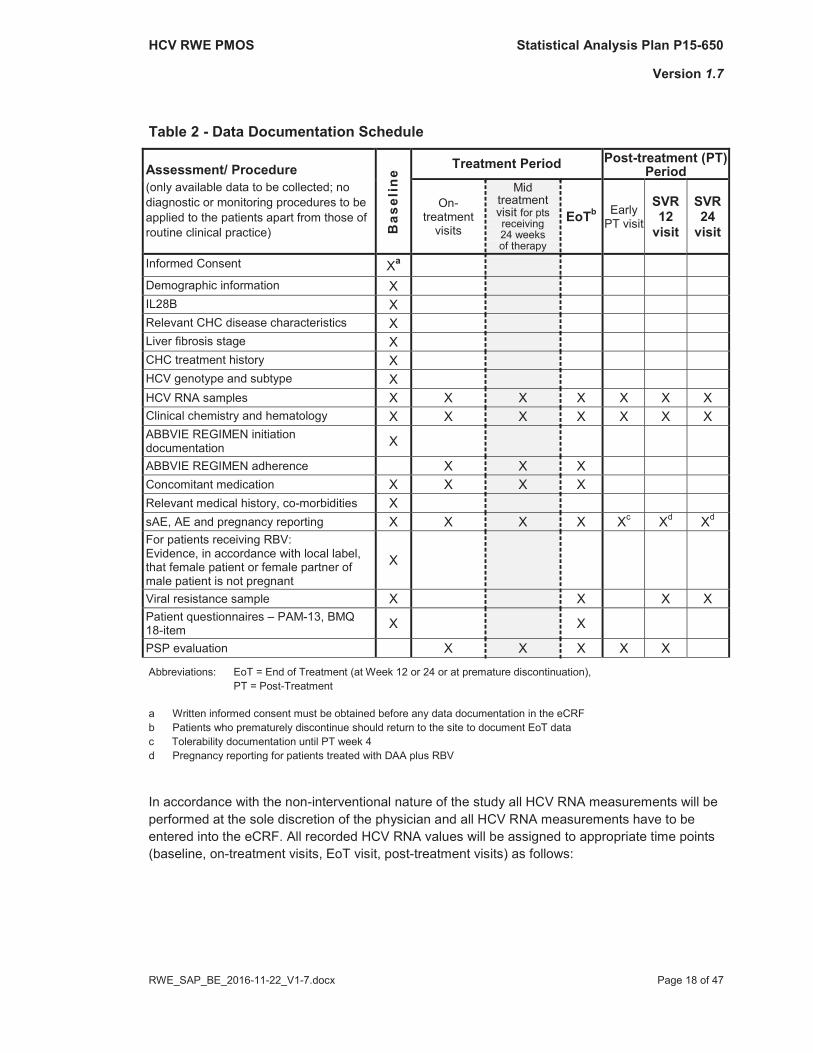
Table 2 - Data Documentation Schedule
Assessment/ Procedure(only available data to be collected; no diagnostic or monitoring procedures to be applied to the patients apart from those of routine clinical practice) B
asel
ine
Treatment Period Post-treatment (PT) Period
On-treatment
visits
Mid treatment visit for pts receiving 24 weeks of therapy
EoTb Early PT visit
SVR12
visit
SVR24
visit
Informed Consent Xa
Demographic information XIL28B XRelevant CHC disease characteristics XLiver fibrosis stage XCHC treatment history XHCV genotype and subtype XHCV RNA samples X X X X X X XClinical chemistry and hematology X X X X X X XABBVIE REGIMEN initiation documentation X
ABBVIE REGIMEN adherence X X XConcomitant medication X X X XRelevant medical history, co-morbidities XsAE, AE and pregnancy reporting X X X X Xc Xd Xd
For patients receiving RBV: Evidence, in accordance with local label, that female patient or female partner of male patient is not pregnant
X
Viral resistance sample X X X XPatient questionnaires – PAM-13, BMQ 18-item X X
PSP evaluation X X X X X
Abbreviations: EoT = End of Treatment (at Week 12 or 24 or at premature discontinuation), PT = Post-Treatment
a Written informed consent must be obtained before any data documentation in the eCRF b Patients who prematurely discontinue should return to the site to document EoT datac Tolerability documentation until PT week 4d Pregnancy reporting for patients treated with DAA plus RBV
In accordance with the non-interventional nature of the study all HCV RNA measurements will be performed at the sole discretion of the physician and all HCV RNA measurements have to be entered into the eCRF. All recorded HCV RNA values will be assigned to appropriate time points (baseline, on-treatment visits, EoT visit, post-treatment visits) as follows:
HCV RWE PMOS Statistical Analysis Plan P15-650
Version 1.7
RWE_SAP_BE_2016-11-22_V1-7.docx Page 19 of 47
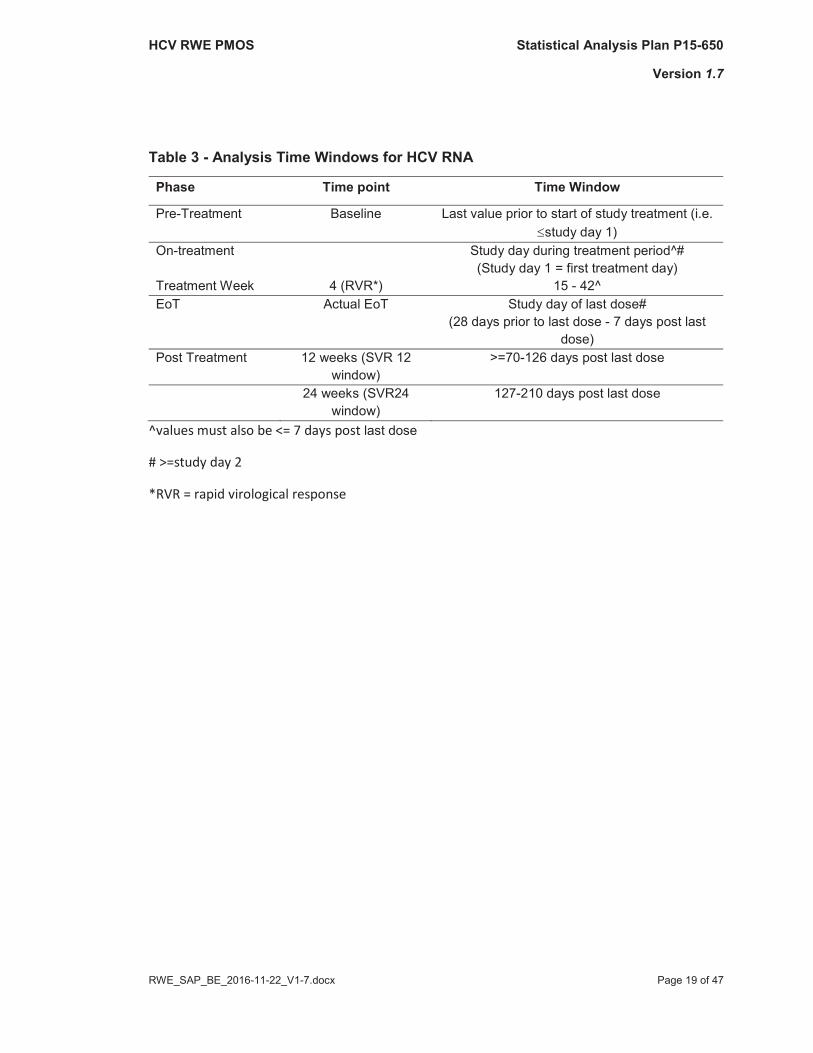
Table 3 - Analysis Time Windows for HCV RNA
Phase Time point Time Window
Pre-Treatment Baseline Last value prior to start of study treatment (i.e. study day 1)
On-treatment Study day during treatment period^#(Study day 1 = first treatment day)
Treatment Week 4 (RVR*) 15 - 42^EoT Actual EoT Study day of last dose#
(28 days prior to last dose - 7 days post last dose)
Post Treatment 12 weeks (SVR 12 window)
>=70-126 days post last dose
24 weeks (SVR24 window)
127-210 days post last dose
^values must also be <= 7 days post last dose
# >=study day 2
*RVR = rapid virological response
HCV RWE PMOS Statistical Analysis Plan P15-650
Version 1.7
RWE_SAP_BE_2016-11-22_V1-7.docx Page 20 of 47
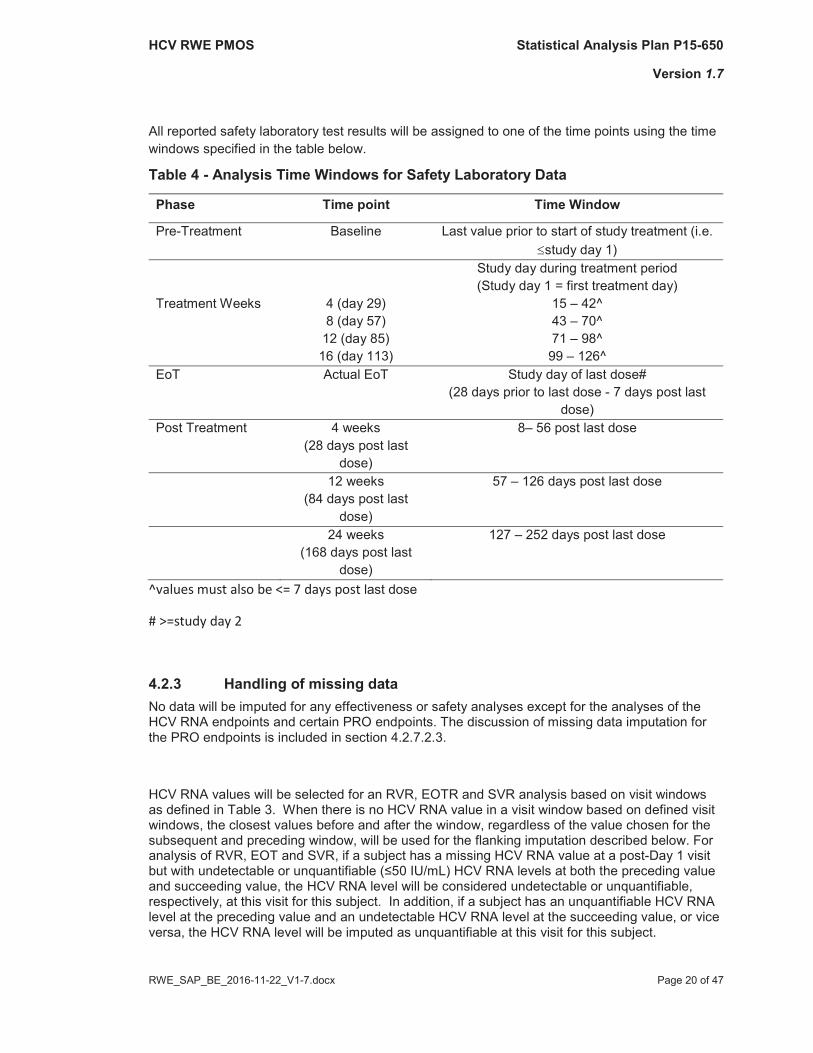
All reported safety laboratory test results will be assigned to one of the time points using the time windows specified in the table below.
Table 4 - Analysis Time Windows for Safety Laboratory Data
Phase Time point Time Window
Pre-Treatment Baseline Last value prior to start of study treatment (i.e. study day 1)
Study day during treatment period(Study day 1 = first treatment day)
Treatment Weeks 4 (day 29) 15 – 42^8 (day 57) 43 – 70^
12 (day 85) 71 – 98^16 (day 113) 99 – 126^
EoT Actual EoT Study day of last dose#(28 days prior to last dose - 7 days post last
dose)Post Treatment 4 weeks
(28 days post last dose)
8– 56 post last dose
12 weeks (84 days post last
dose)
57 – 126 days post last dose
24 weeks(168 days post last
dose)
127 – 252 days post last dose
^values must also be <= 7 days post last dose
# >=study day 2
4.2.3 Handling of missing dataNo data will be imputed for any effectiveness or safety analyses except for the analyses of the HCV RNA endpoints and certain PRO endpoints. The discussion of missing data imputation for the PRO endpoints is included in section 4.2.7.2.3.
HCV RNA values will be selected for an RVR, EOTR and SVR analysis based on visit windows as defined in Table 3. When there is no HCV RNA value in a visit window based on defined visit windows, the closest values before and after the window, regardless of the value chosen for thesubsequent and preceding window, will be used for the flanking imputation described below. For analysis of RVR, EOT and SVR, if a subject has a missing HCV RNA value at a post-Day 1 visit
s at both the preceding value and succeeding value, the HCV RNA level will be considered undetectable or unquantifiable, respectively, at this visit for this subject. In addition, if a subject has an unquantifiable HCV RNA level at the preceding value and an undetectable HCV RNA level at the succeeding value, or vice versa, the HCV RNA level will be imputed as unquantifiable at this visit for this subject.
HCV RWE PMOS Statistical Analysis Plan P15-650
Version 1.7
RWE_SAP_BE_2016-11-22_V1-7.docx Page 21 of 47
For analyses of RVR, subjects still missing a value for the visit after flanking imputation will beimputed as a failure. For EoTR and SVR analysis, if there is no value in the appropriate window after flanking imputation but there is an HCV RNA value after the window, then it will be imputed into the EoTR or SVR window respectively. Subsequent to this flanking imputation, if a subject is missing a value for the visit window associated with the analysis, the subject will be imputed as a visit failure (i.e., not undetectable or unquantifiable).
If a subject starts another treatment for HCV, then all HCV RNA values for this subject measured on or after the start date of the new HCV treatment will be excluded from analyses. The subject will be considered a failure for summaries of viral response at all time points after the start of the new HCV treatment.
Due to the non-interventional nature of this study several different methods for determination of the HCV RNA value can be applied. For the purpose of the statistical analysis, a HCV RNA
if a PCR test was used
is unquantifiable (i.e. detected but below LLoQ) .
4.2.4 Site and Researcher InformationData of the study sites and of the Researcher will be presented in summary tables and listings.
The summary tables for site information will show absolute and relative frequencies for the institution type (private practice/ private hospital, general hospital, academic/ university hospital, other), the type of unit (general population, transplant, drug user, HIV/ HCV co-infection, hepatocellular carcinoma [HCC]), and the site location (urban, rural). Regarding type of unit multiple answers per site are possible.
The principle researcher experience will be summarized by presenting for each therapeutic specialty (hepatology, infectious disease, gastroenterology, internal medicine, transplant, general practitioner) the number and percentage of principle researchers, who have the specific experience. Furthermore, the number and percentage of sites with at least one researcher (i.e. including co-researcher) of the therapeutic specialty concerned and the number of HCV-infected patients typically seen per month at the site (<25, 25-50, 51-75, 76-100, >100), including the patients seen by co-researcher, will be summarized. Note: Multiple therapeutic specialties could be reported per researcher.
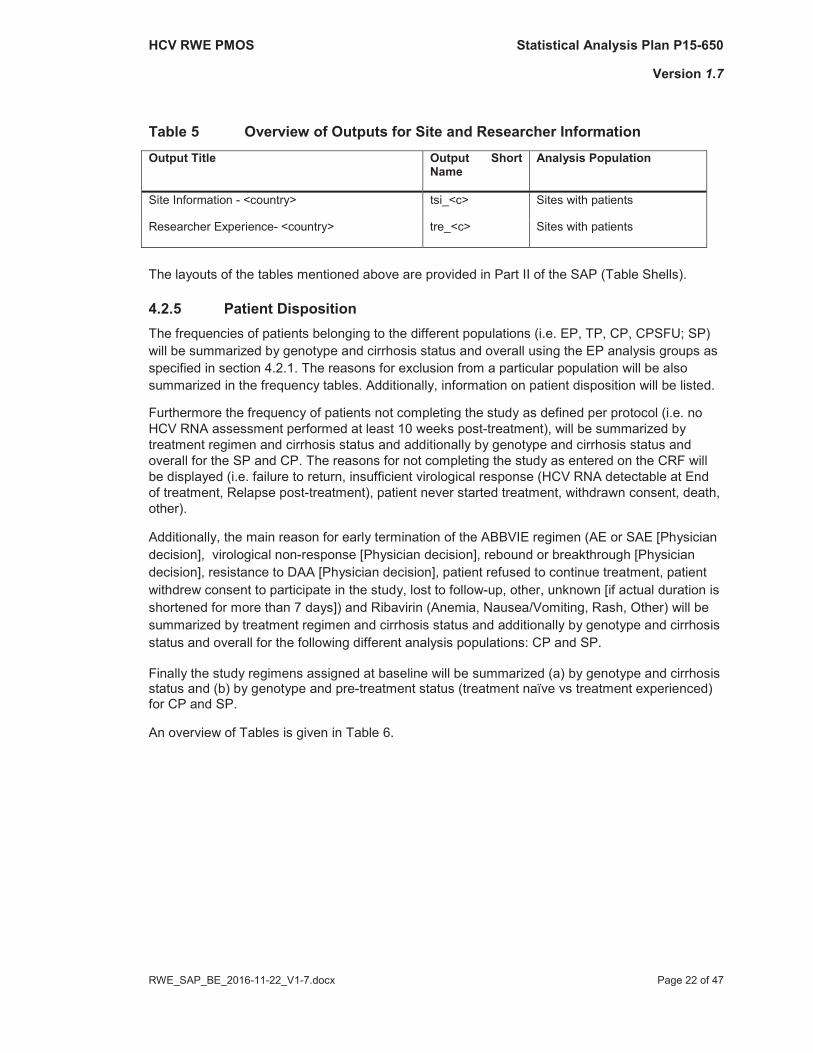
An overview of Tables for site and researcher information is given in Table 5.
HCV RWE PMOS Statistical Analysis Plan P15-650
Version 1.7
RWE_SAP_BE_2016-11-22_V1-7.docx Page 22 of 47
Table 5 Overview of Outputs for Site and Researcher InformationOutput Title Output Short
NameAnalysis Population
Site Information - <country> tsi_<c> Sites with patients
Researcher Experience- <country> tre_<c> Sites with patients
The layouts of the tables mentioned above are provided in Part II of the SAP (Table Shells).
4.2.5 Patient DispositionThe frequencies of patients belonging to the different populations (i.e. EP, TP, CP, CPSFU; SP)will be summarized by genotype and cirrhosis status and overall using the EP analysis groups as specified in section 4.2.1. The reasons for exclusion from a particular population will be also summarized in the frequency tables. Additionally, information on patient disposition will be listed.
Furthermore the frequency of patients not completing the study as defined per protocol (i.e. noHCV RNA assessment performed at least 10 weeks post-treatment), will be summarized by treatment regimen and cirrhosis status and additionally by genotype and cirrhosis status and overall for the SP and CP. The reasons for not completing the study as entered on the CRF will be displayed (i.e. failure to return, insufficient virological response (HCV RNA detectable at End of treatment, Relapse post-treatment), patient never started treatment, withdrawn consent, death, other).
Additionally, the main reason for early termination of the ABBVIE regimen (AE or SAE [Physician decision], virological non-response [Physician decision], rebound or breakthrough [Physician decision], resistance to DAA [Physician decision], patient refused to continue treatment, patient withdrew consent to participate in the study, lost to follow-up, other, unknown [if actual duration is shortened for more than 7 days]) and Ribavirin (Anemia, Nausea/Vomiting, Rash, Other) will be summarized by treatment regimen and cirrhosis status and additionally by genotype and cirrhosis status and overall for the following different analysis populations: CP and SP.
Finally the study regimens assigned at baseline will be summarized (a) by genotype and cirrhosis status and (b) by genotype and pre-treatment status (treatment naïve vs treatment experienced) for CP and SP.
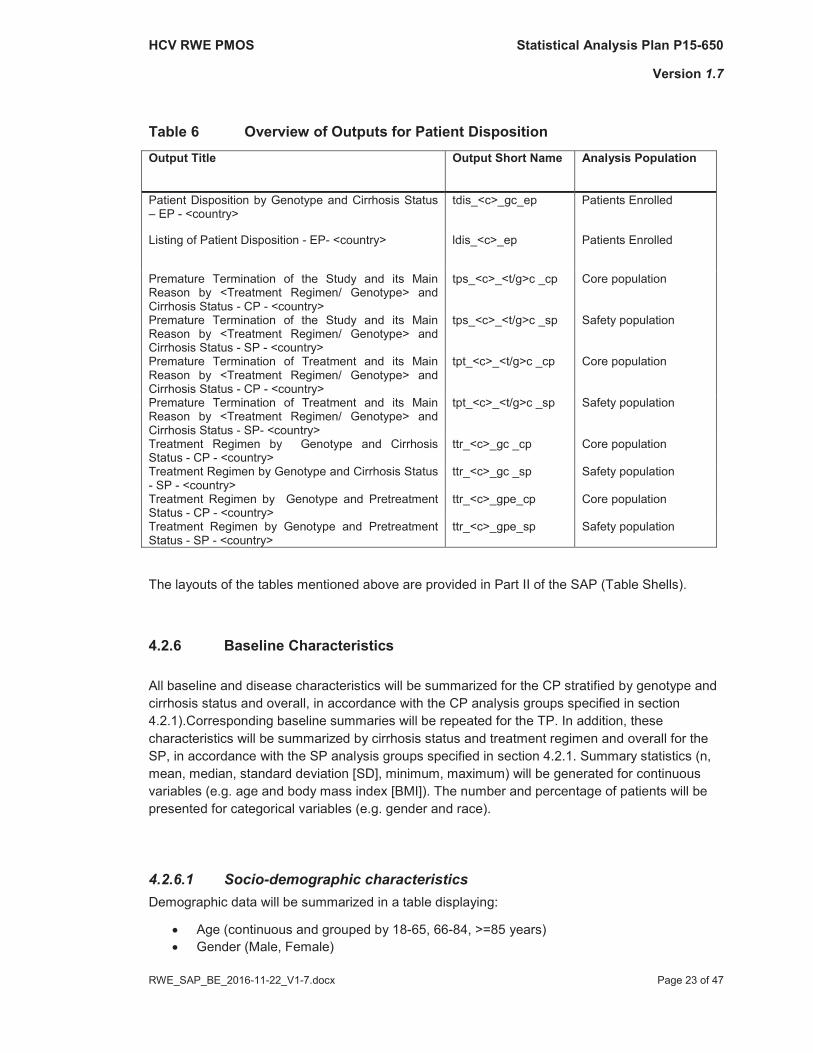
An overview of Tables is given in Table 6.
HCV RWE PMOS Statistical Analysis Plan P15-650
Version 1.7
RWE_SAP_BE_2016-11-22_V1-7.docx Page 23 of 47
Table 6 Overview of Outputs for Patient DispositionOutput Title Output Short Name Analysis Population
Patient Disposition by Genotype and Cirrhosis Status– EP - <country>
tdis_<c>_gc_ep Patients Enrolled
Listing of Patient Disposition - EP- <country> ldis_<c>_ep Patients Enrolled
Premature Termination of the Study and its Main Reason by <Treatment Regimen/ Genotype> and Cirrhosis Status - CP - <country>
tps_<c>_<t/g>c _cp Core population
Premature Termination of the Study and its Main Reason by <Treatment Regimen/ Genotype> and Cirrhosis Status - SP - <country>
tps_<c>_<t/g>c _sp Safety population
Premature Termination of Treatment and its Main Reason by <Treatment Regimen/ Genotype> and Cirrhosis Status - CP - <country>
tpt_<c>_<t/g>c _cp Core population
Premature Termination of Treatment and its Main Reason by <Treatment Regimen/ Genotype> and Cirrhosis Status - SP- <country>
tpt_<c>_<t/g>c _sp Safety population
Treatment Regimen by Genotype and Cirrhosis Status - CP - <country>
ttr_<c>_gc _cp Core population
Treatment Regimen by Genotype and Cirrhosis Status - SP - <country>
ttr_<c>_gc _sp Safety population
Treatment Regimen by Genotype and Pretreatment Status - CP - <country>
ttr_<c>_gpe_cp Core population
Treatment Regimen by Genotype and Pretreatment Status - SP - <country>
ttr_<c>_gpe_sp Safety population
The layouts of the tables mentioned above are provided in Part II of the SAP (Table Shells).
4.2.6 Baseline Characteristics All baseline and disease characteristics will be summarized for the CP stratified by genotype and cirrhosis status and overall, in accordance with the CP analysis groups specified in section 4.2.1).Corresponding baseline summaries will be repeated for the TP. In addition, these characteristics will be summarized by cirrhosis status and treatment regimen and overall for the SP, in accordance with the SP analysis groups specified in section 4.2.1. Summary statistics (n, mean, median, standard deviation [SD], minimum, maximum) will be generated for continuous variables (e.g. age and body mass index [BMI]). The number and percentage of patients will be presented for categorical variables (e.g. gender and race).
4.2.6.1 Socio-demographic characteristicsDemographic data will be summarized in a table displaying:
Age (continuous and grouped by 18-65, 66-84, >=85 years)Gender (Male, Female)
HCV RWE PMOS Statistical Analysis Plan P15-650
Version 1.7
RWE_SAP_BE_2016-11-22_V1-7.docx Page 24 of 47
Race/ Ethnic Origin (White/Caucasian, Black, Asian/Oriental, Native American/American Indian, Other) Interleukin 28B (IL28B) genotype, rs12979860 (CC, CT, TT, Unknown) Interleukin 28B (IL28B) genotype, rs8099917 (TT,TG, GG, Unknown)Height [cm]Weight [kg]BMI [kg/m2]
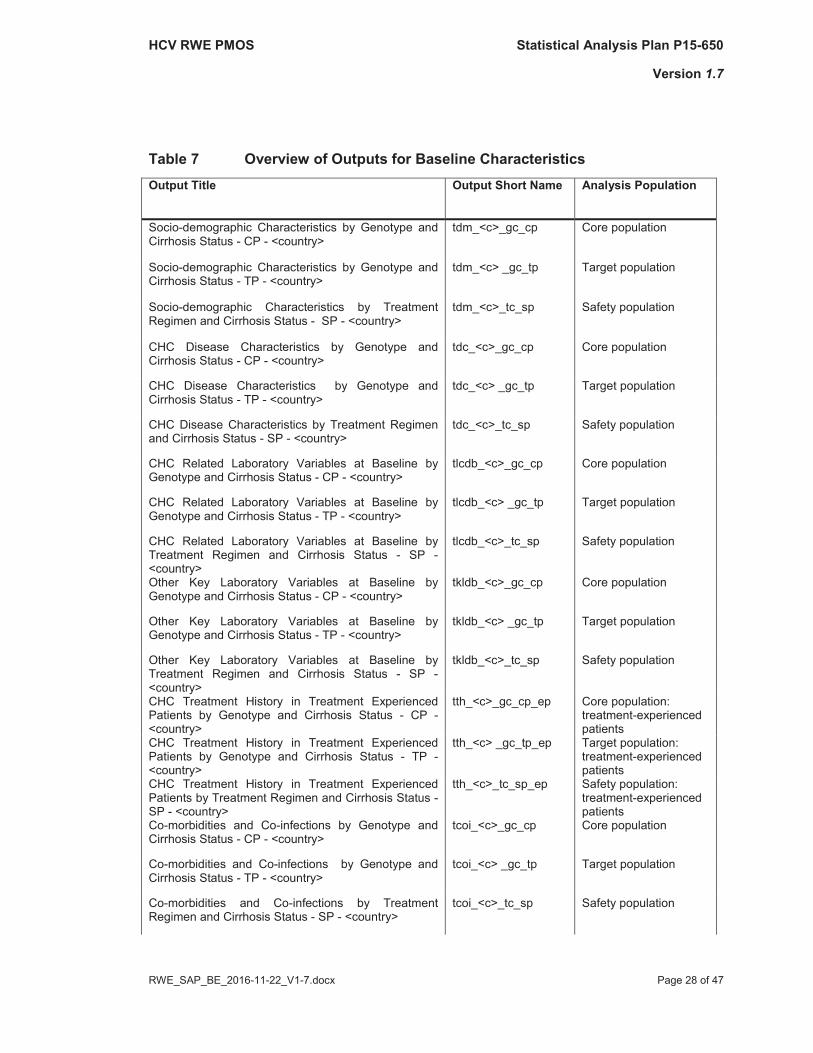
An overview of Tables for site and researcher information is given in Table 7.
4.2.6.2 CHC disease characteristics CHC disease characteristics will be summarized in a table displaying:
Years since diagnosis of HCV infection Mode of HCV Infection (Drug use (i.v.), Drug use (non i.v.), Sexual transmission, Occupational [HCV acquired while doing his/her job, e.g. physicians or nurses], Blood transfusion or transplantation, Perinatal, Contaminated medical device [other than i.v. drug use], Other, Unknown)Pretreatment Status (Naïve, Experienced)HCV Genotype and Subtype (as recorded in the CRF)Most recent stage of liver fibrosis (No cirrhosis, Transition to cirrhosis, Cirrhosis) [Only one method should be selected by the physicians to report stage of fibrosis. Ifnevertheless, there are multiple methods reported, the priority of the results of the assessments is as follows:1. biopsy, 2. non-invasive, 3. clinical/best guess. For biopsy as assessment method the respective categories are defined as follows:
o No cirrhosis is defined by No fibrosis, Mild/minimal fibrosis, Moderate fibrosiso Transition to cirrhosis is defined by Advanced Fibrosiso Cirrhosis is defined by Cirrhosis]
Assessment method for liver fibrosis staging (Biopsy, Non-invasive, Clinical/Best guess)[If multiple answers are ticked, the priority is as follows: biopsy, non-invasive, clinical/best guess.]Time between treatment start and biopsy assessment [months] (continuous)Time since biopsy -6, >6-12, >12-24, >24-60, >60 months) Metavir fibrosis score (0, 1, 2, 3, 4)Ishak fibrosis score (0, 1, 2, 3, 4, 5, 6)Batts/Ludwig fibrosis score (0, 1, 2, 3, 4)Knodell fibrosis score (0, 1, 3, 4)Scheuer fibrosis score (0, 1, 2, 3, 4)Time between treatment start and FibroScan assessment [months] (continuous)
-2, >2-6, >6-12, >12-24, >24 months)FibroScan [kPa] (<8.8, 8.8-<9.6, 9.6-Time between treatment start and ARFI assessment [months] (continuous)Time since ARF -2, >2-6, >6-12, >12-24, >24 months)AFRI [m/s]
HCV RWE PMOS Statistical Analysis Plan P15-650
Version 1.7
RWE_SAP_BE_2016-11-22_V1-7.docx Page 25 of 47
Time between treatment start and FibroTest assessment [months] (continuous)-2, >2-6, >6-12, >12-24, >24
months)Results of FibroTest (<=0.21, 0.22-0.27, 0.28-0.31, 0.32-0.48, 0.49-0.58, 0.59-0.72, 0.73-0.74, >=0.75)Esophageal varices (Yes, No, Unknown)History of liver decompensation (No - never decompensated, Yes - but currently compensated, Yes – still decompensated [including patients with a Child Pugh Score >=7], Current signs/symptoms – Total, Current signs/symptoms – Coagulopathy, Current signs/symptoms – Hyperbilirubinemia, Current signs/symptoms – Hepatic encephalopathy, Current signs/symptoms – Hypo-albuminemia, Current signs/symptoms – Ascites, Current signs/symptoms – Bleeding from esophageal varices [multiple answers are possible])Child Pugh Score (categorized as 5-6, 7-9, 10-15)
An overview of Tables for site and researcher information is given in Table 7.
4.2.6.3 CHC treatment historyFor treatment-experienced patients the most recent prior treatment and the outcome to prior treatment as reported by the investigator in the eCRF (Null response, Partial response, Breakthrough, Relapse, Sustained virological response (SVR) followed by reinfection, Discontinued [and none of the above], Unknown/ None of the above) will be summarized in frequency tables. In addition to the frequency of each medication (IFN alpha, PEG IFN-alpha, IFN NOS, PEG IFN NOS, Ribavirin, DAA), the frequency of the combinations (pegIFN alpha + RBV, pegIFN alpha + RBV + Telaprevir, XXX) will be summarized.
4.2.6.4 Co-morbidities and co-infections
A summary table will present the absolute and relative frequencies of HCV co-infections, CHC related comorbidities and other co-morbidities, in more detail:
HCV Co-infections
o Human immunodeficiency virus (HIV)
o Hepatitis B virus (HBV)
o Tuberculosis
o Schistosomiasis
Liver and/ or CHC related co-morbidities
o Liver transplantation
o Hepatocellular carcinoma
o Steatosis (non-alcoholic)
o Alcoholic liver disease
o Primary biliary cirrhosis
HCV RWE PMOS Statistical Analysis Plan P15-650
Version 1.7
RWE_SAP_BE_2016-11-22_V1-7.docx Page 26 of 47
o Auto-immune hepatitis
o Wilson disease
o Cryoglobulinemia
o Porphyria cutanea tarda (PCT)
o Auto-immune skin disease
Other co-morbidities
o Kidney transplant
o Chronic kidney disease (Mild, Moderate, Severe, Currently on dialysis, Currently not on dialysis)
o Psychiatric disorders (Depression, Bipolar disorder, Schizophrenia, Personality disorder)
o Diabetes mellitus (Type 1, Type 2)
o Insulin resistance
o Metabolic syndrome
o Lipid disorder
o Hyperthyroidism
o Hypothyroidism
o Cardiovascular disease (Myocardial infarction, Angina pectoris, Hypertension, Stroke)
o Immunologically mediated disease
o Hemophilia
o Thalassemia
o Sickle cell anemia
o V. Willebrand disease
o Psychoactive substance dependency (Active injection drug use, Inhalate cocaine, Marihuana/ cannabis, Opiate substitution)
o Other
The patient’s alcohol consumption will be displayed in a further table, i.e.:
Alcohol use (None, Yes – occasional, Yes – regular, Ex-drinker [6 units/drinks per day, none in the last 3 months])Average number of units/drinks per week (if regular alcohol use is reported)
One unit/drink is defined as 10 milliliters (or approximately 8 grams) of pure alcohol and equals: 200 ml of beer or 100 ml of wine or 20 ml of hard liquor. An overview of Tables and Listings for the above mentioned variables is given in Table 7.
HCV RWE PMOS Statistical Analysis Plan P15-650
Version 1.7
RWE_SAP_BE_2016-11-22_V1-7.docx Page 27 of 47
4.2.6.5 CHC related and other laboratory data at baselineThe laboratory data at baseline are the most recent available data prior to first administration of the ABBVIE REGIMEN (including day 1, see Table 4). All reported clinical laboratory test results will be assigned to one of the time points using the time windows specified in the Table 4.
A summary table will show CHC related laboratory data at baseline, i.e. HCV RNA in IU/mL, HCV RNA in log10 IU/mL, and HCV RNA categorized using 400,000, 800,000, 6,000,000 and 10,000,000 as cut-offs, ALT, ALT ratio, AST, AST ratio, APRI, FIB-4. ALT-ratio, AST ratio, APRI and FIB-4 will be calculated as follows:
ALT ratio = ALT value / upper limit of normal (ULN) of local laboratory
AST ratio = AST value / ULN of local laboratory
APRI = 100 x AST [IU/L] / (ULN of AST [IU/L] * Platelets [109/L]) (APRI= aspartate aminotransferase to platelet ratio index [1]; calculated, if laboratory assessments took place within 30 days)
FIB-4 = (Age [years] x AST [IU/L]) / (Platelets [109/L] * Square root of ALT [IU/L]) (FIB-4= Fibrosis 4 index [2]; calculated, if laboratory assessments took place within 30 days)
In addition the following other key laboratory data at baseline will be summarized: -GT, total bilirubin, albumin, creatinine, creatinine clearance (continuous and categorize as Grade 1 [60-<LLN mL/min], Grade 2 [30-<60 mL/min], Grade 3 [15-<30 mL/min], Grade 4 [<15 mL/min]; if LLN is missing 75 mL/min is used), AFP, hemoglobin, platelets, prothrombin time, and INR (if documented instead of prothrombin time). The creatinine clearance will be calculated as follows:
Creatinine clearance [ml/min] = (140-age)*Weight (in kg)*constant/Creatinine (in μmol/L) (constant is 1.23 for men and 1.04 for women; calculated by Cockcroft-Gault-Formula)
A further table CD4 and HIV-RNA test results are displayed for patients with HIV only.
An overview of Tables for the above mentioned variables is given in Table 7.
HCV RWE PMOS Statistical Analysis Plan P15-650
Version 1.7
RWE_SAP_BE_2016-11-22_V1-7.docx Page 28 of 47
Table 7 Overview of Outputs for Baseline CharacteristicsOutput Title Output Short Name Analysis Population
Socio-demographic Characteristics by Genotype and Cirrhosis Status - CP - <country>
tdm_<c>_gc_cp Core population
Socio-demographic Characteristics by Genotype and Cirrhosis Status - TP - <country>
tdm_<c> _gc_tp Target population
Socio-demographic Characteristics by Treatment Regimen and Cirrhosis Status - SP - <country>
tdm_<c>_tc_sp Safety population
CHC Disease Characteristics by Genotype and Cirrhosis Status - CP - <country>
tdc_<c>_gc_cp Core population
CHC Disease Characteristics by Genotype and Cirrhosis Status - TP - <country>
tdc_<c> _gc_tp Target population
CHC Disease Characteristics by Treatment Regimenand Cirrhosis Status - SP - <country>
tdc_<c>_tc_sp Safety population
CHC Related Laboratory Variables at Baseline by Genotype and Cirrhosis Status - CP - <country>
tlcdb_<c>_gc_cp Core population
CHC Related Laboratory Variables at Baseline by Genotype and Cirrhosis Status - TP - <country>
tlcdb_<c> _gc_tp Target population
CHC Related Laboratory Variables at Baseline by Treatment Regimen and Cirrhosis Status - SP -<country>
tlcdb_<c>_tc_sp Safety population
Other Key Laboratory Variables at Baseline by Genotype and Cirrhosis Status - CP - <country>
tkldb_<c>_gc_cp Core population
Other Key Laboratory Variables at Baseline by Genotype and Cirrhosis Status - TP - <country>
tkldb_<c> _gc_tp Target population
Other Key Laboratory Variables at Baseline by Treatment Regimen and Cirrhosis Status - SP -<country>
tkldb_<c>_tc_sp Safety population
CHC Treatment History in Treatment Experienced Patients by Genotype and Cirrhosis Status - CP -<country>
tth_<c>_gc_cp_ep Core population:treatment-experienced patients
CHC Treatment History in Treatment Experienced Patients by Genotype and Cirrhosis Status - TP -<country>
tth_<c> _gc_tp_ep Target population:treatment-experienced patients
CHC Treatment History in Treatment Experienced Patients by Treatment Regimen and Cirrhosis Status -SP - <country>
tth_<c>_tc_sp_ep Safety population:treatment-experienced patients
Co-morbidities and Co-infections by Genotype and Cirrhosis Status - CP - <country>
tcoi_<c>_gc_cp Core population
Co-morbidities and Co-infections by Genotype and Cirrhosis Status - TP - <country>
tcoi_<c> _gc_tp Target population
Co-morbidities and Co-infections by Treatment Regimen and Cirrhosis Status - SP - <country>
tcoi_<c>_tc_sp Safety population
HCV RWE PMOS Statistical Analysis Plan P15-650
Version 1.7
RWE_SAP_BE_2016-11-22_V1-7.docx Page 29 of 47
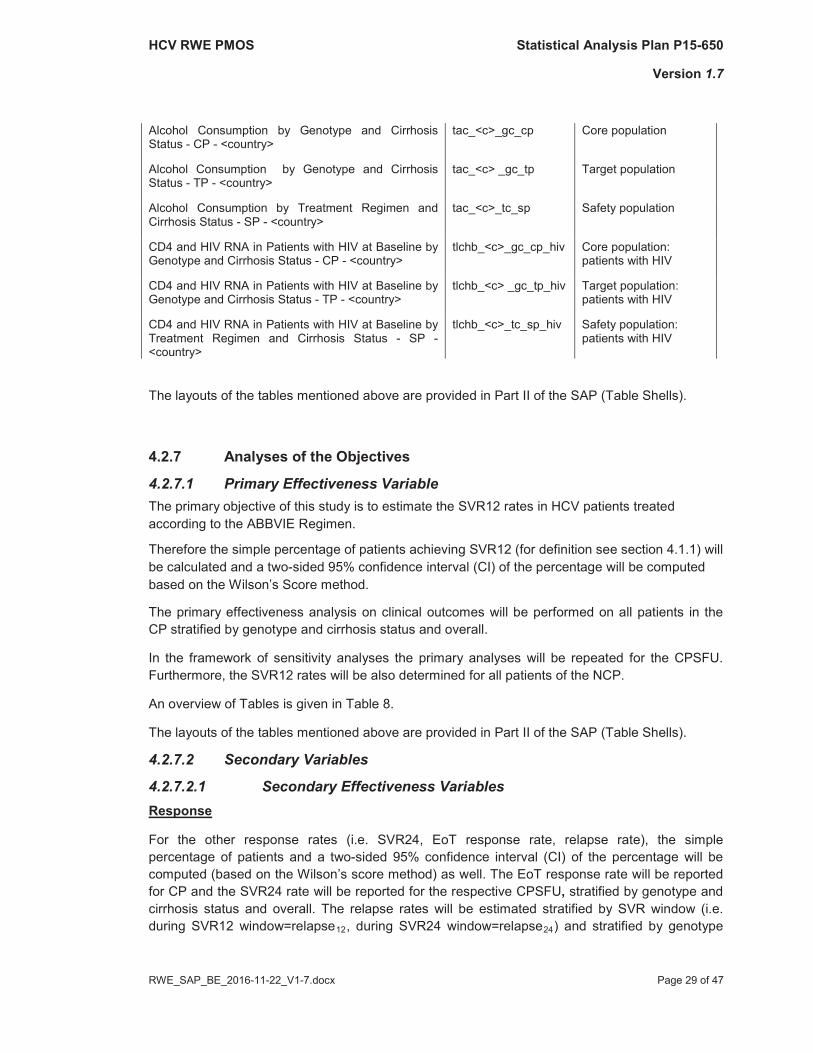
Alcohol Consumption by Genotype and Cirrhosis Status - CP - <country>
tac_<c>_gc_cp Core population
Alcohol Consumption by Genotype and Cirrhosis Status - TP - <country>
tac_<c> _gc_tp Target population
Alcohol Consumption by Treatment Regimen and Cirrhosis Status - SP - <country>
tac_<c>_tc_sp Safety population
CD4 and HIV RNA in Patients with HIV at Baseline by Genotype and Cirrhosis Status - CP - <country>
tlchb_<c>_gc_cp_hiv Core population: patients with HIV
CD4 and HIV RNA in Patients with HIV at Baseline by Genotype and Cirrhosis Status - TP - <country>
tlchb_<c> _gc_tp_hiv Target population:patients with HIV
CD4 and HIV RNA in Patients with HIV at Baseline by Treatment Regimen and Cirrhosis Status - SP -<country>
tlchb_<c>_tc_sp_hiv Safety population: patients with HIV
The layouts of the tables mentioned above are provided in Part II of the SAP (Table Shells).
4.2.7 Analyses of the Objectives
4.2.7.1 Primary Effectiveness VariableThe primary objective of this study is to estimate the SVR12 rates in HCV patients treated according to the ABBVIE Regimen.
Therefore the simple percentage of patients achieving SVR12 (for definition see section 4.1.1) will be calculated and a two-sided 95% confidence interval (CI) of the percentage will be computed based on the Wilson’s Score method.
The primary effectiveness analysis on clinical outcomes will be performed on all patients in the CP stratified by genotype and cirrhosis status and overall.
In the framework of sensitivity analyses the primary analyses will be repeated for the CPSFU.Furthermore, the SVR12 rates will be also determined for all patients of the NCP.
An overview of Tables is given in Table 8.
The layouts of the tables mentioned above are provided in Part II of the SAP (Table Shells).
4.2.7.2 Secondary Variables
4.2.7.2.1 Secondary Effectiveness VariablesResponse
For the other response rates (i.e. SVR24, EoT response rate, relapse rate), the simple percentage of patients and a two-sided 95% confidence interval (CI) of the percentage will be computed (based on the Wilson’s score method) as well. The EoT response rate will be reportedfor CP and the SVR24 rate will be reported for the respective CPSFU, stratified by genotype and cirrhosis status and overall. The relapse rates will be estimated stratified by SVR window (i.e. during SVR12 window=relapse12, during SVR24 window=relapse24) and stratified by genotype
HCV RWE PMOS Statistical Analysis Plan P15-650
Version 1.7
RWE_SAP_BE_2016-11-22_V1-7.docx Page 30 of 47
and cirrhosis status and overall in patients of the CP with EoT response who fulfilled the following criteria:
completed treatment as defined previously,
had at least one HCV RNA measurement >= 70 days post-treatment or was a treatment failure between EoT and 70 days post-treatment.
Viral breakthrough rates [defined as at least one documented HCV RNA <50 IU/mL followed by HCV will be estimated overall and stratified by genotype and cirrhosis status in all patients of the CP, who have at least one undetectable or unquantifiable, on-treatment HCV RNA measurement and at least one on-treatment or EoT measurement thereafter.
Non-ResponseIn another table, the numbers and the percentages of the SVR12 non-responder categories and responder will be summarized for CP patients, overall and stratified by genotype and cirrhosis status. The following SVR12 non-response categories will be considered:
On-treatment virologic failure (breakthrough [defined as at least one documented HCV ] or failure to suppress
[each measured on-Relapse (defined as HCV RNA <50 IU/mL at EoT or at the last on-treatment HCV RNA
-treatment and completed treatment as defined previously)Death and none of the abovePremature study drug discontinuation with no on-treatment virologic failure and none ofthe aboveInsufficient virological response, other than those mentioned above (patients for whom insufficient virological response was reported, or who had HCV RNA >=50 IU/mL post EoT and no HCV RNA test on treatment) and none of the aboveMissing SVR12 data and/or none of the above criteria
Virological response rates and non-response categories will be displayed for patients who completed treatment with AbbVie regimen, as well.
SVR12 (Exploratory Analyses)
Univariate and multiple logistic regression (MLR) methods will be used to investigate the impact of various explanatory covariates (patient and disease characteristics) at baseline on SVR12.
These analyses will be of exploratory nature, data driven, and will be performed for CP population. Univariate logistic regression will be performed first and then backward selection procedures will be applied to generate the final MLR model. A p-value <0.05 will be used for the covariates to stay in the model in a backward elimination step. If the percentage of patients with available data for a variable is lower than 80% of the patient group analyzed, then this variable will not be considered in the MLR analysis.
HCV RWE PMOS Statistical Analysis Plan P15-650
Version 1.7
RWE_SAP_BE_2016-11-22_V1-7.docx Page 31 of 47
The variables to be considered are as follows:
Key demographic information
o Age (continuous)
o Gender (Female [reference], Male)
o Race/ethnic origin (White/Caucasian [reference], Black, Asian/Oriental, Other [allother races]); at least two categories with at least 10% of the patients each haveto exists, so that this variable will be considered
o Weight (continuous)
o BMI (continuous)
o IL28B, rs12979860 (CC [reference], CT or TT); patients with unknown genotypeare excluded from the respective analyses.
CHC disease characteristics
o Years since diagnosis (continuous)
o Mode of CHC infection (Drug use [reference], Other [all other answers excludingunknown], unknown);
o Most recent stage of liver fibrosis (No cirrhosis/Transition to cirrhosis [reference],Cirrhosis; for definition see 4.2.6.2);
HCV RNA level at baseline (log10 IU/mL)
HCV genotype( G1a*, G1b, G4; for definition see section 4.2.6.2)
Type of treating institute (Private Practice / Private Hospital, Academic / UniversityHospital, General Hospital, Other)
Co-infections (every patient not reporting the respective co-infection is considered as nothaving the respective co-infection)
o HIV(No [reference], Yes)
o HBV(No [reference], Yes)
Liver and/or CHC related co-morbidities (every patient not reporting the respective co-morbidity is considered as not having the respective co-morbidity)
o Liver transplantation (No [reference], Yes)
o Steatosis (non-alcoholic) (No [reference], Yes)
o Decompensated liver disease (No [reference], Yes)
Other co-morbidities (every patient not reporting the respective co-morbidity isconsidered as not having the respective co-morbidity)
o Depression (No [reference], Yes)
HCV RWE PMOS Statistical Analysis Plan P15-650
Version 1.7
RWE_SAP_BE_2016-11-22_V1-7.docx Page 32 of 47
o Diabetes mellitus (No [reference], Type 1/Type 2)
o Hypertension (No [reference], Yes)
o Immunologically mediated disease (No [reference], Yes)
o Hypothyroidism (No [reference], Yes)
Alcohol use (None [reference], Yes –occasional, Yes –regular, Exdrinker)
Key clinical chemistry and hematology laboratory variables at baseline
o ALT ratio (continuous, see 4.2.6.5)
o AST ratio (continuous, see 4.2.6.5)
o Platelets [109/L] (continuous)
Prior treatment status (HCV treatment naïve [reference], HCV treatment experienced)
Additionally, an interaction term for cirrhosis status and genotype will be considered. If the most recent stage of liver fibrosis status (No cirrhosis/Transition to cirrhosis vs Cirrhosis), the genotype (G4, G1b vs G1a) or the interaction of both remains in the final model, then additional MLR might be considered for the subgroups concerned, taking into account the treatment regimen (e.g. in cirrhotic G1 patients: RBV vs no RBV and 12 wks vs 24 weeks).
The categories pre-specified above could be modified in the analyses if this is supported by the data (e.g. categories could be combined, if their impact on SVR12 is similar). Furthermore, continuous variables can be replaced by categorical variables.
Adherence
Adherence will be displayed for the CP by genotype and cirrhosis status and for the SP by treatment regimen and cirrhosis status. Summary statistics (n, mean, median, standard deviation [SD], and range) will be generated for continuous variable. Numbers and percentages of patients will be presented for categorical variables.
Adherence to Abbvie regimen (% of target dose [adherence=cumulated number of pillstaken /(initial prescribed number of pills x planned duration)])
o >105%
o >95%-<=105%
o >80%-<=95%
o >50%-<=80%
o <=50%
Adherence to ribavirin (% of target dose [adherence=cumulated dose taken /(initial prescribed dose x planned duration)])
HCV RWE PMOS Statistical Analysis Plan P15-650
Version 1.7
RWE_SAP_BE_2016-11-22_V1-7.docx Page 33 of 47
o >105%
o >95%-<=105%
o >80%-<=95%
o >50%-<=80%
o <=50%
Percentage of actual treatment duration in relation to the target duration of ABBVIE regimen taken
Deviating duration of ABBVIE regimen
o Early discontinuation (actual duration is shortened for more than 7 days)
o Not deviated
o Exceedance (actual duration is prolonged for more than 7 days)
Method used to document adherence (Interview, Diary)
Percentage of actual days with treatment with RBV in relation to the planned duration
Ribavirin earlier discontinued than ABBVIE regimen
Initial dose of Ribavirin
o 1000 mg/day
o 1200 mg/day
o XXX
Cumulative dose of Ribavirin (g)
Dose modifications/termination of RBV [in patients taking RBV, for a patient more than one dose modification and its main reason could be reported, but for each single reason the patient is counted only once] (Total number of patients with lower dose than highestprevious dose [including patients who stopped the treatment earlier] , Anemia, Nausea/Vomiting, Rash, Other [including patients who discontinued ABBVIE regimen earlier, but did not stop the RBV treatment before the ABBVIE regimen])
In addition to the summary statistics of the adherence variables, logistic regression analyses will be performed for the following adherence variables: “adherence to Abbvie regimen” in all patients of the CP, “adherence to ribavirin” in all patients of the CP taking RBV, each categorized as follows: >=95%, >80%-<=95%, <=80% to investigate the additional impact of overall treatment adherence on SVR12. The categories may be changed if they are sparsely filled. Adherence will be included as mandatory covariate in addition to the baseline explanatory variables already mentioned above. Also the same methods will be applied as described above.
An overview of Tables is given in Table 8.
HCV RWE PMOS Statistical Analysis Plan P15-650
Version 1.7
RWE_SAP_BE_2016-11-22_V1-7.docx Page 34 of 47
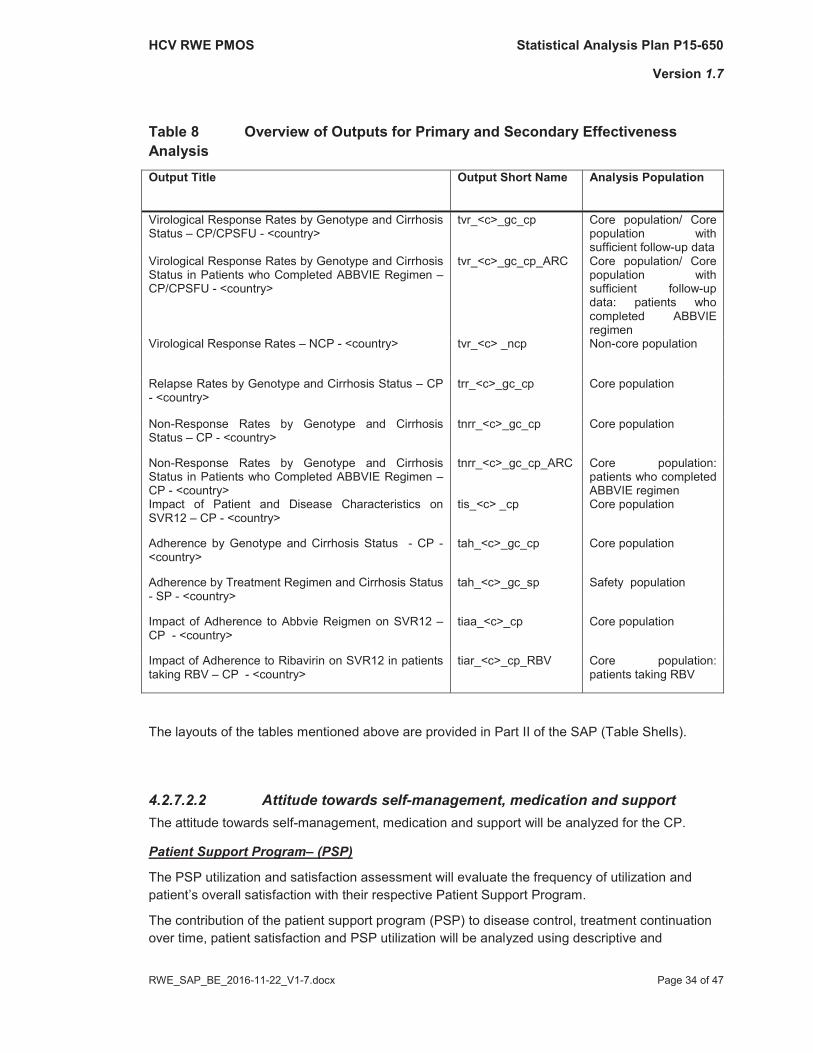
Table 8 Overview of Outputs for Primary and Secondary Effectiveness AnalysisOutput Title Output Short Name Analysis Population
Virological Response Rates by Genotype and Cirrhosis Status – CP/CPSFU - <country>
tvr_<c>_gc_cp Core population/ Core population with sufficient follow-up data
Virological Response Rates by Genotype and Cirrhosis Status in Patients who Completed ABBVIE Regimen –CP/CPSFU - <country>
tvr_<c>_gc_cp_ARC Core population/ Core population with sufficient follow-updata: patients who completed ABBVIE regimen
Virological Response Rates – NCP - <country> tvr_<c> _ncp Non-core population
Relapse Rates by Genotype and Cirrhosis Status – CP - <country>
trr_<c>_gc_cp Core population
Non-Response Rates by Genotype and Cirrhosis Status – CP - <country>
tnrr_<c>_gc_cp Core population
Non-Response Rates by Genotype and Cirrhosis Status in Patients who Completed ABBVIE Regimen –CP - <country>
tnrr_<c>_gc_cp_ARC Core population: patients who completed ABBVIE regimen
Impact of Patient and Disease Characteristics on SVR12 – CP - <country>
tis_<c> _cp Core population
Adherence by Genotype and Cirrhosis Status - CP -<country>
tah_<c>_gc_cp Core population
Adherence by Treatment Regimen and Cirrhosis Status - SP - <country>
tah_<c>_gc_sp Safety population
Impact of Adherence to Abbvie Reigmen on SVR12 –CP - <country>
tiaa_<c>_cp Core population
Impact of Adherence to Ribavirin on SVR12 in patients taking RBV – CP - <country>
tiar_<c>_cp_RBV Core population:patients taking RBV
The layouts of the tables mentioned above are provided in Part II of the SAP (Table Shells).
4.2.7.2.2 Attitude towards self-management, medication and support The attitude towards self-management, medication and support will be analyzed for the CP.
Patient Support Program– (PSP)
The PSP utilization and satisfaction assessment will evaluate the frequency of utilization and patient’s overall satisfaction with their respective Patient Support Program.
The contribution of the patient support program (PSP) to disease control, treatment continuation over time, patient satisfaction and PSP utilization will be analyzed using descriptive and

HCV RWE PMOS Statistical Analysis Plan P15-650
Version 1.7
RWE_SAP_BE_2016-11-22_V1-7.docx Page 35 of 47
exploratory statistical methods. Frequency tables will summarize all corresponding variables of the PSP questionnaires over time stratified by cirrhosis status and treatment regimen.
PSP Utilization Questionnaire
Participation in the Abbvie Patient Support Program (PSP)
o Yes
o No
Utilization of any components from ABBVIE PSP since last visit (Yes,No)
Personal support
Educational and information material
o Printed (Usually daily, Several times per week, Usually once a week, Less than once a week)
o Online (Usually daily, Several times per week, Usually once a week, Less than once a week)
Additional digital and mobile resources
o Web-portal (Usually daily, Several times per week, Usually once a week, Less than once a week)
o Reminders (SMS)
PSP Utilization and Satisfaction Questionnaire
Participation in the Abbvie Patient Support Program (PSP)
o Yes
o No
Utilization of any components from ABBVIE PSP since last visit
o No
o Yes
Satisfaction in general (Very good, Good, Satisfactory, Poor)
Satisfaction (Very good, Good, Satisfactory, Poor)
Address needs(Yes, fully, Yes, mostly, No)
Personal support (Very good, Good, Satisfactory, Poor)
HCV RWE PMOS Statistical Analysis Plan P15-650
Version 1.7
RWE_SAP_BE_2016-11-22_V1-7.docx Page 36 of 47
Educational and information material
o Printed
Frequency of Usage (Usually daily, Several times per week, Usuallyonce a week, Less than once a week)
Satisfaction (Very good, Good, Satisfactory, Poor)
o Online
Frequency of Usage (Usually daily, Several times per week, Usuallyonce a week, Less than once a week)
Satisfaction (Very good, Good, Satisfactory, Poor)
Additional digital and mobile resources
o Web-portal
Frequency of Usage (Usually daily, Several times per week, Usuallyonce a week, Less than once a week)
Satisfaction (Very good, Good, Satisfactory, Poor)
o Reminders (SMS): Satisfaction (Very good, Good, Satisfactory, Poor)
No imputation will be performed for missing items.
In addition, univariate and multiple logistic regression (MLR) analysis will be performed to investigate the association of the use of the PSP, the patient satisfaction variables of the PSP questionnaires with treatment completion. First the use of PSP will be analyzed in all CP patients. The patient satisfaction will only be analyzed in patients who participated in the PSP. The satisfaction categories pre-specified above could be combined in the analyses if this is supported by the data (e.g. very good and good vs satisfactory vs poor). Furthermore, continuous variables can be replaced by categorical variables.
Use of the PSP is defined as taking part in PSP. For all satisfaction variables the worst case before last intake is considered. ‘Poor’ will be used as reference value. Patients will be considered to have completed treatment when the actual duration of the ABBVIE REGIMEN is not shortened for more than 7 days.
If the percentage of patients with available data for a variable is lower than 80% of the patient group analyzed, then this variable will not be considered in the MLR analysis.
These analyses will be of exploratory nature and data driven. Backward selection procedures will be applied to generate the final MLR models. A p-value <0.05 will be used for the covariates to stay in the model in a backward elimination step.
HCV RWE PMOS Statistical Analysis Plan P15-650
Version 1.7
RWE_SAP_BE_2016-11-22_V1-7.docx Page 37 of 47
Patient Activation Measure – (PAM-13)
The Patient Activation Measure (PAM) 13 is a measure used to assess the patient knowledge, skill, and confidence for self-management. The PAM-13 item scale is a measure used to assess the patient knowledge, skill, and confidence for self-management. Each of the 13 items can be answered with one of four possible response options, which are “disagree strongly” (1), “disagree” (2), “agree” (3), “agree strongly” (4).
The scoring will be done by Insignia Health. If there are less than nine items answered, no summary score will be calculated.
A summary table will show descriptive statistics (n, mean, median, SD, minimum and maximum) of the score for baseline and the post-baseline time points, as well as changes from baseline, by cirrhosis status and treatment regimen. In addition, analysis of covariance (ANCOVA) will be applied to investigate the effect of the different ABBVIE REGIMENS (± RBV) by cirrhosis status on the score using the corresponding baseline value as covariate.
Beliefs Medication Questionnaire – (18-item BMQ)
The 18-item BMQ consists of 18 questions used to screen for patients’ beliefs, attitudes and concerns about their medication. The BMQ consists of two sections, the BMQ-Specific and the BMQ-General. The BMQ-Specific section comprises two 5 item subscales assessing the necessity of and the concerns about the prescribed medication for personal use (Specific-Necessity and Specific-Concerns). The BMQ-General section comprises two 4 item subscalesassessing beliefs that medicines are harmful and overused by doctors in general (General-Harm and General-Overuse). The 18 items are rated on a Likert scale from 1=strongly disagree to 5 = strongly agree and the 18 items are summarized into the 4 subscale scores. The total score of each BMQ subscale will be calculated.
If for any of these subscales one single item is missing, the subscale will be calculated as the mean of the remaining items. This corresponds to replacing the missing value by the “average” of the available answers. If more than one item is missing, the respective subscore will be considered as not evaluable.
A summary table will show descriptive statistics (n, mean, median, SD, minimum and maximum) of the four scores for baseline and the post-baseline time points, as well as changes from baseline, by cirrhosis status and treatment regimen. In addition, analysis of covariance (ANCOVA) will be applied to investigate the effect of the different ABBVIE REGIMENS (± RBV ) by cirrhosis status on BMQ endpoints using the corresponding BMQ baseline values as covariates.
HCV RWE PMOS Statistical Analysis Plan P15-650
Version 1.7
RWE_SAP_BE_2016-11-22_V1-7.docx Page 38 of 47
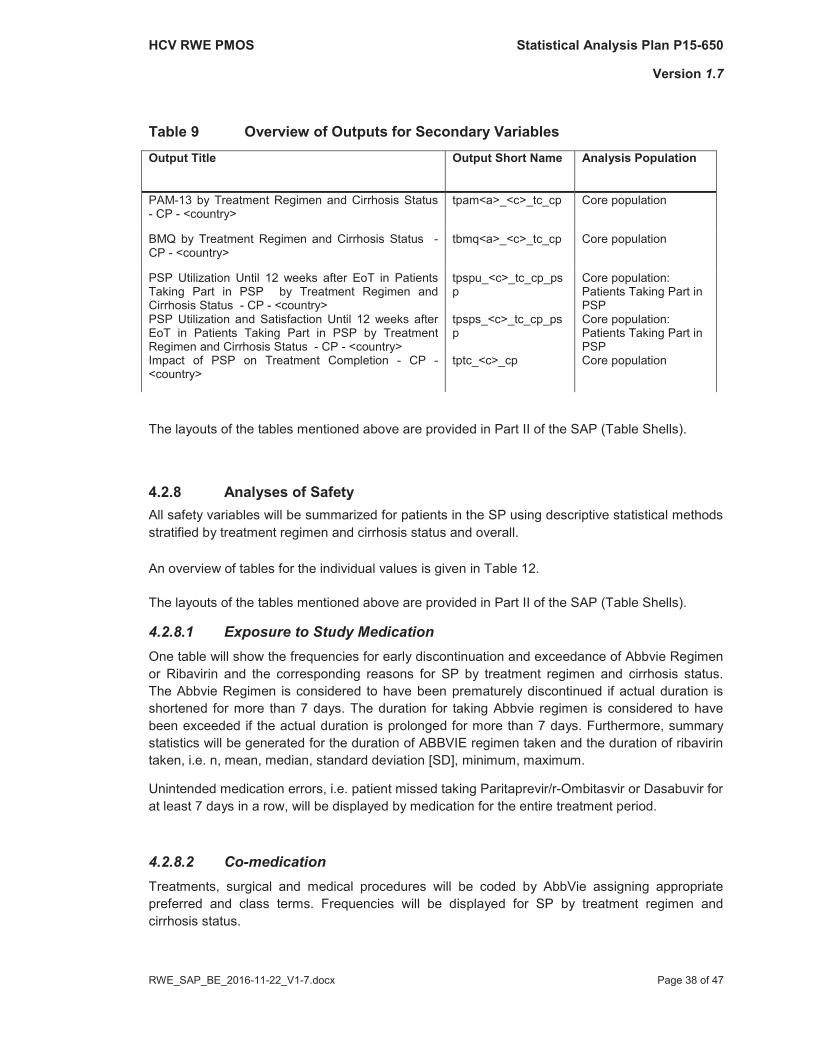
Table 9 Overview of Outputs for Secondary VariablesOutput Title Output Short Name Analysis Population
PAM-13 by Treatment Regimen and Cirrhosis Status - CP - <country>
tpam<a>_<c>_tc_cp Core population
BMQ by Treatment Regimen and Cirrhosis Status -CP - <country>
tbmq<a>_<c>_tc_cp Core population
PSP Utilization Until 12 weeks after EoT in Patients Taking Part in PSP by Treatment Regimen and Cirrhosis Status - CP - <country>
tpspu_<c>_tc_cp_psp
Core population: Patients Taking Part in PSP
PSP Utilization and Satisfaction Until 12 weeks after EoT in Patients Taking Part in PSP by Treatment Regimen and Cirrhosis Status - CP - <country>
tpsps_<c>_tc_cp_psp
Core population: Patients Taking Part in PSP
Impact of PSP on Treatment Completion - CP -<country>
tptc_<c>_cp Core population
The layouts of the tables mentioned above are provided in Part II of the SAP (Table Shells).
4.2.8 Analyses of SafetyAll safety variables will be summarized for patients in the SP using descriptive statistical methods stratified by treatment regimen and cirrhosis status and overall.
An overview of tables for the individual values is given in Table 12.
The layouts of the tables mentioned above are provided in Part II of the SAP (Table Shells).
4.2.8.1 Exposure to Study MedicationOne table will show the frequencies for early discontinuation and exceedance of Abbvie Regimen or Ribavirin and the corresponding reasons for SP by treatment regimen and cirrhosis status.The Abbvie Regimen is considered to have been prematurely discontinued if actual duration is shortened for more than 7 days. The duration for taking Abbvie regimen is considered to have been exceeded if the actual duration is prolonged for more than 7 days. Furthermore, summary statistics will be generated for the duration of ABBVIE regimen taken and the duration of ribavirin taken, i.e. n, mean, median, standard deviation [SD], minimum, maximum.
Unintended medication errors, i.e. patient missed taking Paritaprevir/r-Ombitasvir or Dasabuvir for at least 7 days in a row, will be displayed by medication for the entire treatment period.
4.2.8.2 Co-medicationTreatments, surgical and medical procedures will be coded by AbbVie assigning appropriate preferred and class terms. Frequencies will be displayed for SP by treatment regimen andcirrhosis status.
HCV RWE PMOS Statistical Analysis Plan P15-650
Version 1.7
RWE_SAP_BE_2016-11-22_V1-7.docx Page 39 of 47
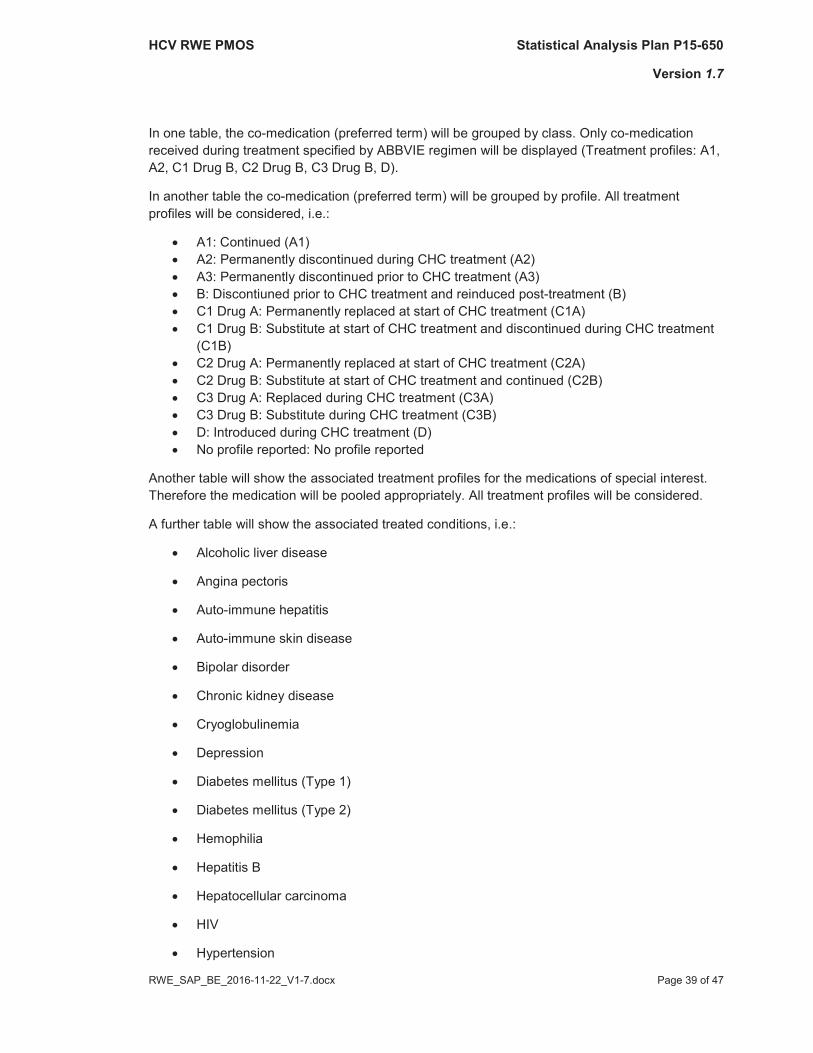
In one table, the co-medication (preferred term) will be grouped by class. Only co-medication received during treatment specified by ABBVIE regimen will be displayed (Treatment profiles: A1, A2, C1 Drug B, C2 Drug B, C3 Drug B, D).
In another table the co-medication (preferred term) will be grouped by profile. All treatment profiles will be considered, i.e.:
A1: Continued (A1)A2: Permanently discontinued during CHC treatment (A2)A3: Permanently discontinued prior to CHC treatment (A3)B: Discontiuned prior to CHC treatment and reinduced post-treatment (B)C1 Drug A: Permanently replaced at start of CHC treatment (C1A)C1 Drug B: Substitute at start of CHC treatment and discontinued during CHC treatment (C1B)C2 Drug A: Permanently replaced at start of CHC treatment (C2A)C2 Drug B: Substitute at start of CHC treatment and continued (C2B)C3 Drug A: Replaced during CHC treatment (C3A)C3 Drug B: Substitute during CHC treatment (C3B)D: Introduced during CHC treatment (D)No profile reported: No profile reported
Another table will show the associated treatment profiles for the medications of special interest. Therefore the medication will be pooled appropriately. All treatment profiles will be considered.
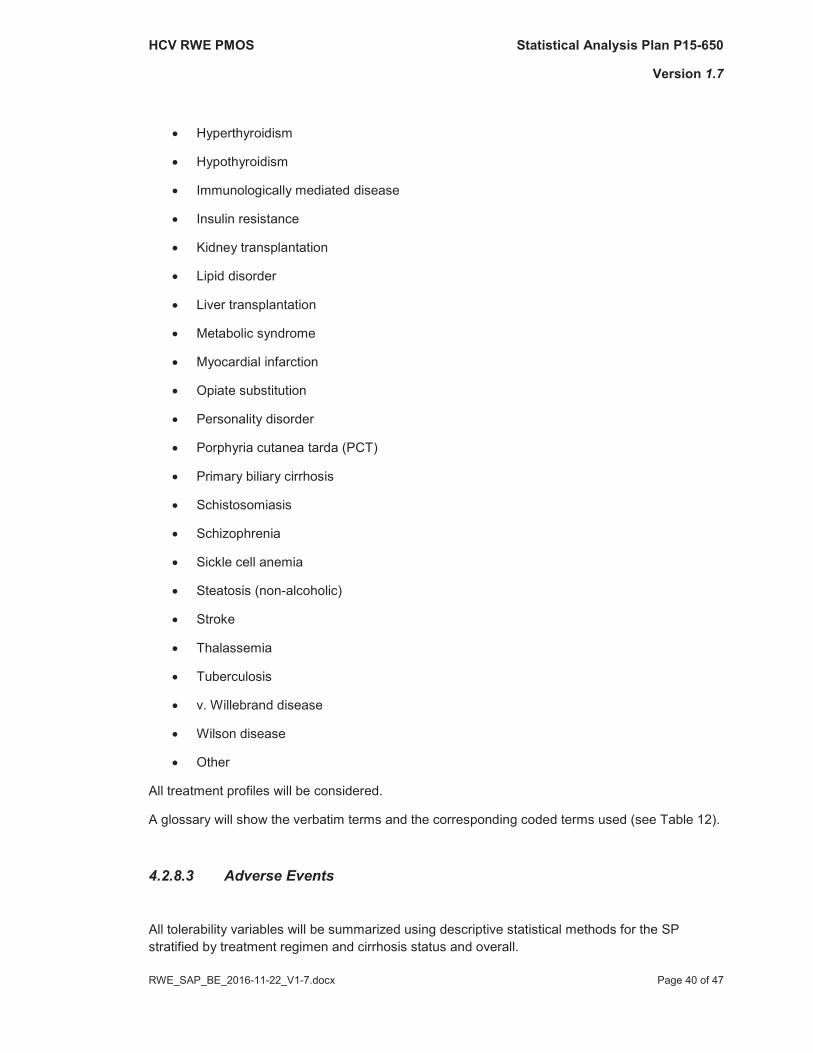
A further table will show the associated treated conditions, i.e.:
Alcoholic liver disease
Angina pectoris
Auto-immune hepatitis
Auto-immune skin disease
Bipolar disorder
Chronic kidney disease
Cryoglobulinemia
Depression
Diabetes mellitus (Type 1)
Diabetes mellitus (Type 2)
Hemophilia
Hepatitis B
Hepatocellular carcinoma
HIV
Hypertension
HCV RWE PMOS Statistical Analysis Plan P15-650
Version 1.7
RWE_SAP_BE_2016-11-22_V1-7.docx Page 40 of 47
Hyperthyroidism
Hypothyroidism
Immunologically mediated disease
Insulin resistance
Kidney transplantation
Lipid disorder
Liver transplantation
Metabolic syndrome
Myocardial infarction
Opiate substitution
Personality disorder
Porphyria cutanea tarda (PCT)
Primary biliary cirrhosis
Schistosomiasis
Schizophrenia
Sickle cell anemia
Steatosis (non-alcoholic)
Stroke
Thalassemia
Tuberculosis
v. Willebrand disease
Wilson disease
Other
All treatment profiles will be considered.
A glossary will show the verbatim terms and the corresponding coded terms used (see Table 12).
4.2.8.3 Adverse Events
All tolerability variables will be summarized using descriptive statistical methods for the SP stratified by treatment regimen and cirrhosis status and overall.
HCV RWE PMOS Statistical Analysis Plan P15-650
Version 1.7
RWE_SAP_BE_2016-11-22_V1-7.docx Page 41 of 47
AEs will be coded using MedDRA. A glossary will show the verbatim terms and the corresponding coded terms used (see Table 12).
The number and percentage of patients with treatment-emergent AEs (i.e. any reported event that begins or worsens in severity after initiation of study drug through 30 days post-study drug dosing including those who are related to the study drug independent of the occurrence and those where the date of onset is missing) will be tabulated by primary MedDRA SOC and PT.
Corresponding summary tables will be provided for all serious treatment-emergent AEs and additional for all non-serious treatment-emergent AEs. In the table of non-serious AEs (that must exclude any SAE) only preferred terms that occurred at a frequency of >=5% in any treatment group will be displayed (no SOCs will be displayed).
The tabulation of the number of patients with treatment-emergent AEs by severity (AEs by severity [mild, moderate, severe], AEs leading to death, AEs leading to hospitalization) andrelationship to study drug will also be provided (ABBVIE Regimen, ribavirin, medication error - paritaprevir/r-ombitasvir, medication error – dasabuvir, ABBVIE Regimen withdrawn, ribavirin withdrawn).
Patients reporting more than one AE for a given MedDRA PT will be counted only once for that term using the most severe incident for the severity summary table and the most related for the relationship summary table. Patients reporting more than one type of event within a SOC will be counted only once for that SOC.
The frequency of pregnancies will be displayed as well.
4.2.8.4 Laboratory DataAll reported clinical laboratory test results will be assigned to one of the time points using the time windows specified in the Table 4. All will be performed for the SP by treatment regimen and cirrhosis status.
Changes from baseline to each post-baseline visit will be summarized descriptively (N, mean, SD, median, minimum, maximum). A summary table will show laboratory hematology. In another table information about clinical chemistry
In a further table CD4 and HIV-RNA are displayed for patients with HIV only by visit. A further table will show the viral resistance.
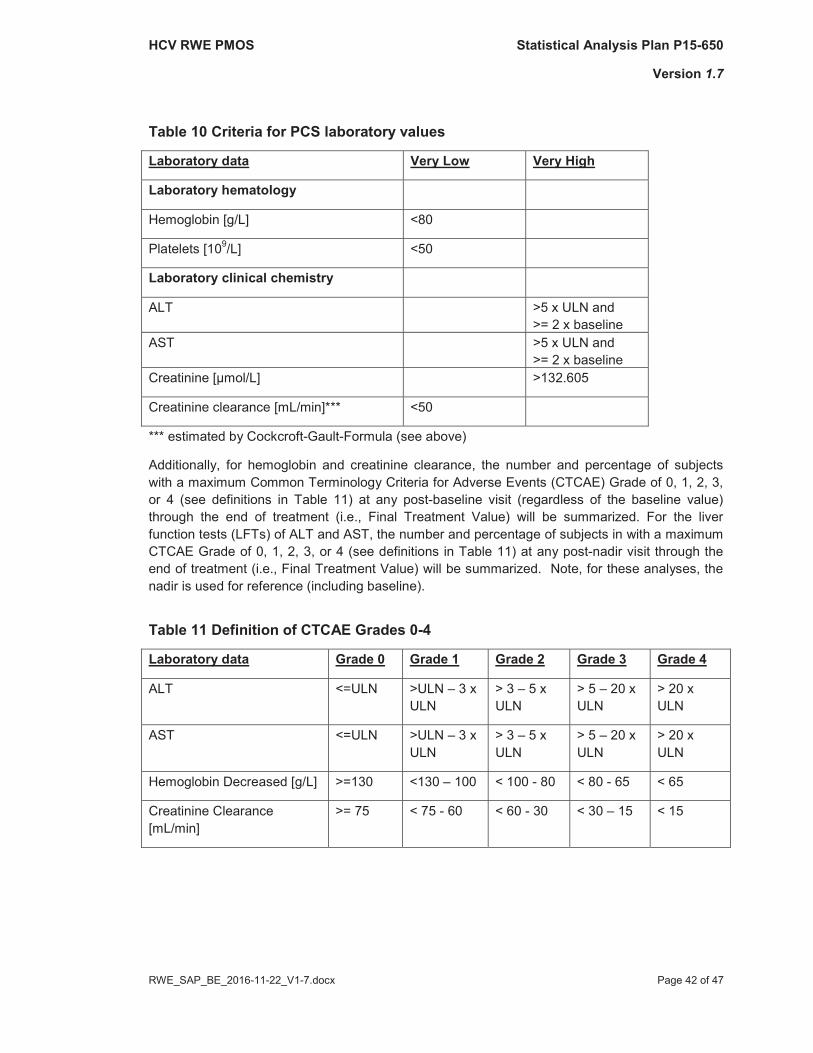
Instead of the shift tables mentioned in the study protocol, the number and percentage of subjects with post-baseline values until EoT meeting the specified criteria for Potentially Clinically Significant (PCS) laboratory values (defined in Table 10) will be summarized. A post-baseline value must be more extreme than the baseline value to be considered a PCS finding.
HCV RWE PMOS Statistical Analysis Plan P15-650
Version 1.7
RWE_SAP_BE_2016-11-22_V1-7.docx Page 42 of 47
Table 10 Criteria for PCS laboratory values
Laboratory data Very Low Very High
Laboratory hematology
Hemoglobin [g/L] <80
Platelets [109/L] <50
Laboratory clinical chemistry
ALT >5 x ULN and >= 2 x baseline
AST >5 x ULN and >= 2 x baseline
Creatinine [μmol/L] >132.605
Creatinine clearance [mL/min]*** <50
*** estimated by Cockcroft-Gault-Formula (see above)
Additionally, for hemoglobin and creatinine clearance, the number and percentage of subjects with a maximum Common Terminology Criteria for Adverse Events (CTCAE) Grade of 0, 1, 2, 3, or 4 (see definitions in Table 11) at any post-baseline visit (regardless of the baseline value) through the end of treatment (i.e., Final Treatment Value) will be summarized. For the liver function tests (LFTs) of ALT and AST, the number and percentage of subjects in with a maximum CTCAE Grade of 0, 1, 2, 3, or 4 (see definitions in Table 11) at any post-nadir visit through the end of treatment (i.e., Final Treatment Value) will be summarized. Note, for these analyses, the nadir is used for reference (including baseline).
Table 11 Definition of CTCAE Grades 0-4
Laboratory data Grade 0 Grade 1 Grade 2 Grade 3 Grade 4
ALT <=ULN >ULN – 3 x ULN
> 3 – 5 x ULN
> 5 – 20 x ULN
> 20 x ULN
AST <=ULN >ULN – 3 x ULN
> 3 – 5 x ULN
> 5 – 20 x ULN
> 20 x ULN
Hemoglobin Decreased [g/L] >=130 <130 – 100 < 100 - 80 < 80 - 65 < 65
Creatinine Clearance[mL/min]
>= 75 < 75 - 60 < 60 - 30 < 30 – 15 < 15
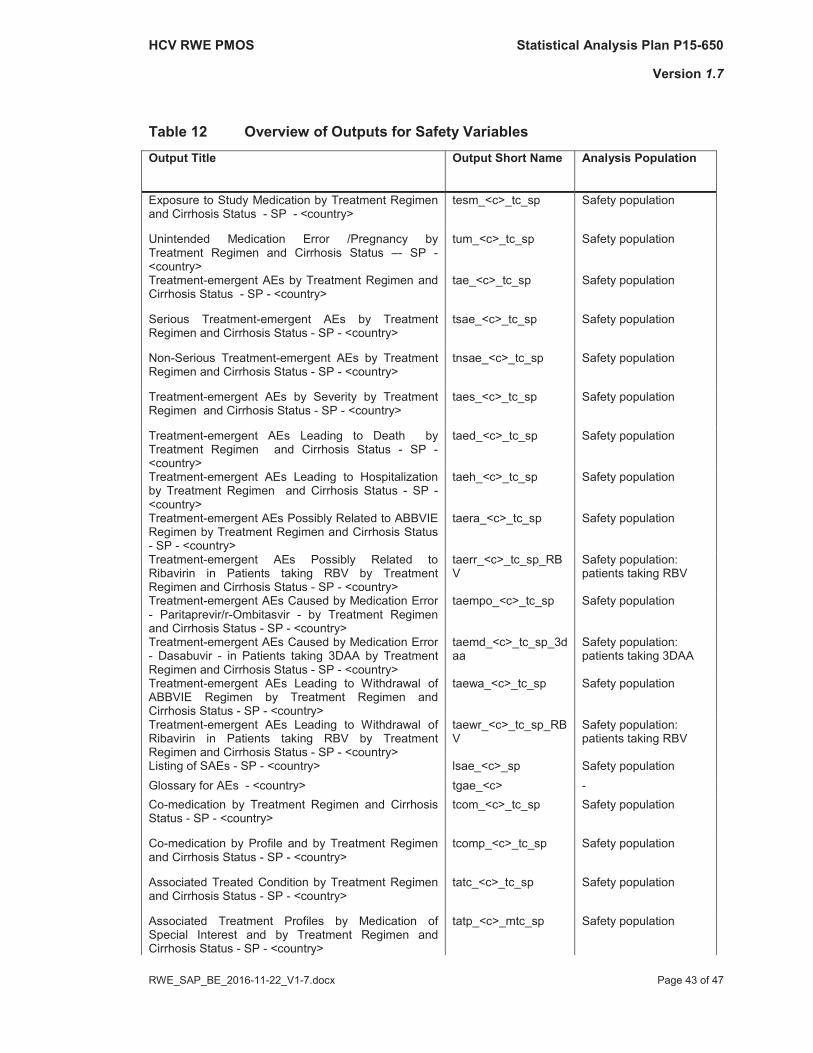
HCV RWE PMOS Statistical Analysis Plan P15-650
Version 1.7
RWE_SAP_BE_2016-11-22_V1-7.docx Page 43 of 47
Table 12 Overview of Outputs for Safety VariablesOutput Title Output Short Name Analysis Population
Exposure to Study Medication by Treatment Regimenand Cirrhosis Status - SP - <country>
tesm_<c>_tc_sp Safety population
Unintended Medication Error /Pregnancy by Treatment Regimen and Cirrhosis Status –- SP - <country>
tum_<c>_tc_sp Safety population
Treatment-emergent AEs by Treatment Regimen and Cirrhosis Status - SP - <country>
tae_<c>_tc_sp Safety population
Serious Treatment-emergent AEs by Treatment Regimen and Cirrhosis Status - SP - <country>
tsae_<c>_tc_sp Safety population
Non-Serious Treatment-emergent AEs by Treatment Regimen and Cirrhosis Status - SP - <country>
tnsae_<c>_tc_sp Safety population
Treatment-emergent AEs by Severity by Treatment Regimen and Cirrhosis Status - SP - <country>
taes_<c>_tc_sp Safety population
Treatment-emergent AEs Leading to Death by Treatment Regimen and Cirrhosis Status - SP - <country>
taed_<c>_tc_sp Safety population
Treatment-emergent AEs Leading to Hospitalization by Treatment Regimen and Cirrhosis Status - SP - <country>
taeh_<c>_tc_sp Safety population
Treatment-emergent AEs Possibly Related to ABBVIE Regimen by Treatment Regimen and Cirrhosis Status - SP - <country>
taera_<c>_tc_sp Safety population
Treatment-emergent AEs Possibly Related to Ribavirin in Patients taking RBV by Treatment Regimen and Cirrhosis Status - SP - <country>
taerr_<c>_tc_sp_RBV
Safety population:patients taking RBV
Treatment-emergent AEs Caused by Medication Error - Paritaprevir/r-Ombitasvir - by Treatment Regimen and Cirrhosis Status - SP - <country>
taempo_<c>_tc_sp Safety population
Treatment-emergent AEs Caused by Medication Error - Dasabuvir - in Patients taking 3DAA by Treatment Regimen and Cirrhosis Status - SP - <country>
taemd_<c>_tc_sp_3daa
Safety population:patients taking 3DAA
Treatment-emergent AEs Leading to Withdrawal of ABBVIE Regimen by Treatment Regimen and Cirrhosis Status - SP - <country>
taewa_<c>_tc_sp Safety population
Treatment-emergent AEs Leading to Withdrawal of Ribavirin in Patients taking RBV by Treatment Regimen and Cirrhosis Status - SP - <country>
taewr_<c>_tc_sp_RBV
Safety population:patients taking RBV
Listing of SAEs - SP - <country> lsae_<c>_sp Safety populationGlossary for AEs - <country> tgae_<c> -Co-medication by Treatment Regimen and Cirrhosis Status - SP - <country>
tcom_<c>_tc_sp Safety population
Co-medication by Profile and by Treatment Regimen and Cirrhosis Status - SP - <country>
tcomp_<c>_tc_sp Safety population
Associated Treated Condition by Treatment Regimen and Cirrhosis Status - SP - <country>
tatc_<c>_tc_sp Safety population
Associated Treatment Profiles by Medication of Special Interest and by Treatment Regimen and Cirrhosis Status - SP - <country>
tatp_<c>_mtc_sp Safety population
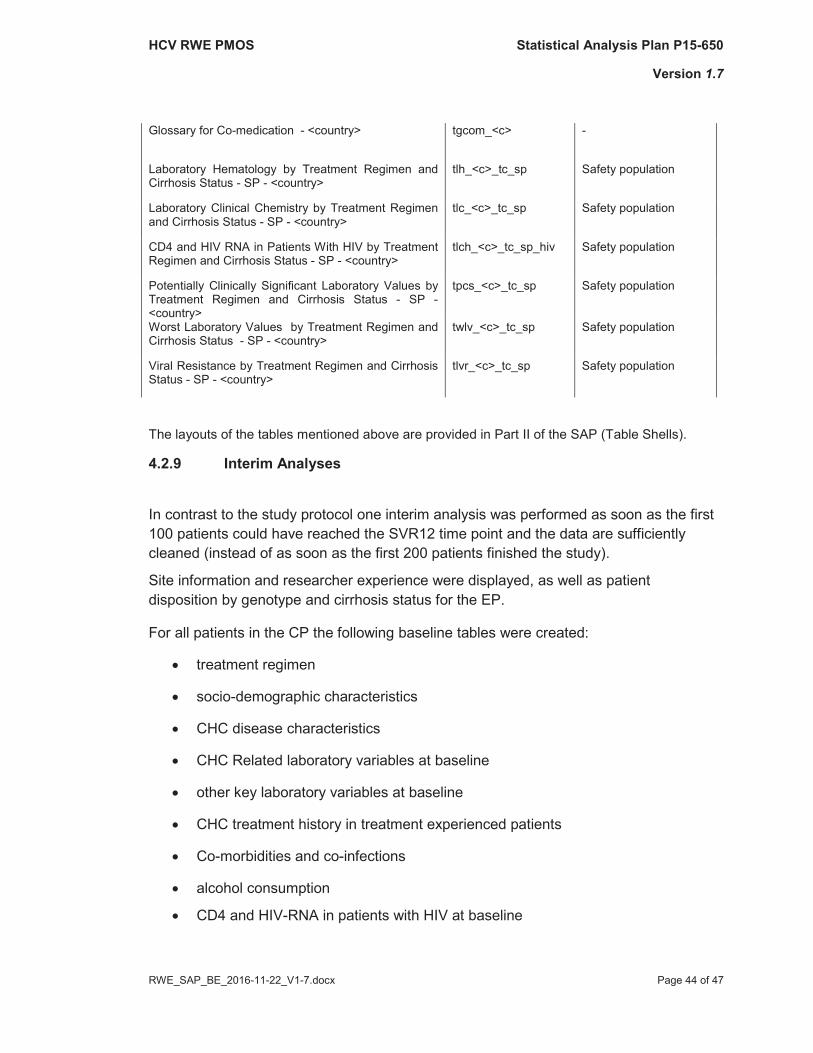
HCV RWE PMOS Statistical Analysis Plan P15-650
Version 1.7
RWE_SAP_BE_2016-11-22_V1-7.docx Page 44 of 47
Glossary for Co-medication - <country> tgcom_<c> -
Laboratory Hematology by Treatment Regimen and Cirrhosis Status - SP - <country>
tlh_<c>_tc_sp Safety population
Laboratory Clinical Chemistry by Treatment Regimen and Cirrhosis Status - SP - <country>
tlc_<c>_tc_sp Safety population
CD4 and HIV RNA in Patients With HIV by Treatment Regimen and Cirrhosis Status - SP - <country>
tlch_<c>_tc_sp_hiv Safety population
Potentially Clinically Significant Laboratory Values by Treatment Regimen and Cirrhosis Status - SP - <country>
tpcs_<c>_tc_sp Safety population
Worst Laboratory Values by Treatment Regimen and Cirrhosis Status - SP - <country>
twlv_<c>_tc_sp Safety population
Viral Resistance by Treatment Regimen and Cirrhosis Status - SP - <country>
tlvr_<c>_tc_sp Safety population
The layouts of the tables mentioned above are provided in Part II of the SAP (Table Shells).
4.2.9 Interim Analyses
In contrast to the study protocol one interim analysis was performed as soon as the first 100 patients could have reached the SVR12 time point and the data are sufficiently cleaned (instead of as soon as the first 200 patients finished the study).
Site information and researcher experience were displayed, as well as patient disposition by genotype and cirrhosis status for the EP.
For all patients in the CP the following baseline tables were created:
treatment regimen
socio-demographic characteristics
CHC disease characteristics
CHC Related laboratory variables at baseline
other key laboratory variables at baseline
CHC treatment history in treatment experienced patients
Co-morbidities and co-infections
alcohol consumption
CD4 and HIV-RNA in patients with HIV at baseline
HCV RWE PMOS Statistical Analysis Plan P15-650
Version 1.7
RWE_SAP_BE_2016-11-22_V1-7.docx Page 45 of 47
Additionally, the CP will be restricted to the patients who could have reached SVR12 time point (i.e. patients with planned treatment duration 12 weeks and DAA treatment start before 01APR2016). The baseline analyses mentioned above and patient disposition were repeated and in addition the following tables will be created:
Premature termination of treatment and its main reason
Virological response rates
Non-response rates were displayed for the CPSFU12. All tables were structured by genotype and cirrhosis status.
The SP was restricted to patients who could have reached SVR12 time point (i.e. patients with planned treatment duration 12 weeks and DAA treatment start before 01APR2016). The following tables will be created for the SP
Treatment-emergent AEs
Serious Treatment-emergent AEs
All tables were structured by treatment regimen and cirrhosis status.
4.2.10 Protocol Violations and Deviations
Enrolled patients who are excluded from the analysis populations will be summarized and the reasons listed (see section 4.2.1).
5. DATA QUALITY ASSURANCE
Data for this study will be recorded in English by each participating center via an electronic data capture (EDC) system using a web-based eCRF.
A comprehensive data validation program utilizing front-end checks in the eCRF will validate the data. Automated checks for data consistency will be implemented, discrepancies need to be solved by the researcher in the eCRF before the module can be completed.
Follow-up on eCRF data for medical plausibility will be done by AbbVie personnel (or their representatives). Queries will be generated in the eCRF for online resolution at the site. The investigator or an authorized member of the investigator's staff will make any necessary data corrections to the eCRF. All change information, including the date and person performing the corrections, will be available via the audit trail, which is part of the EDC system. The principal investigator of each site will finally review the eCRFs for
HCV RWE PMOS Statistical Analysis Plan P15-650
Version 1.7
RWE_SAP_BE_2016-11-22_V1-7.docx Page 46 of 47
completeness and accuracy of available data and provide his or her electronic signature and date to the eCRFs as evidence thereof.
All statistical programs employed in the analysis and reporting of the data will be validated according the standard operating procedures of IST and results will be checked for plausibility.
6. METHODS OF DATA ANALYSIS AND PRESENTATIONAll statistical analyses will be carried out by means of the SAS® package (Version 9.4).
6.1 Analysis Data SetsA value added dataset STRATIFY will be programmed. This will contain derived variables, e.g. analysis populations, treatment regimen and relevant baseline characteristics, needed for the generation of the planned analyses.
A value added dataset SITES will be programmed. This will contain site information and researcher experience needed for the generation of the planned analyses.
Additional value added dataset will be programmed for the primary and secondary endpoints.
6.2 SAS Output Format Detailed descriptions of the SAS outputs are given in Part II of the SAP (Table Shells).
HCV RWE PMOS Statistical Analysis Plan P15-650
Version 1.7
RWE_SAP_BE_2016-11-22_V1-7.docx Page 47 of 47
7. REFERENCES
1. Sterling, R. K., Lissen, E., Clumeck, N., Sola, R., Correa, M. C., Montaner, J., S.Sulkowski, M., Torriani, F. J., Dieterich, D. T., Thomas, D. L., Messinger, D. andNelson, M., Development of a simple noninvasive index to predict significantfibrosis in patients with HIV/HCV coinfection. Hepatology 2006, 43: 1317–1325.
2. Wai C-T, Greenson JK, Fontana RJ, Kalbfleisch JD, Marrero JA, ConjeevaramHS, et al. A simple noninvasive index can predict both significant fibrosis andcirrhosis in patients with chronic hepatitis C. HEPATOLOGY 2003; 38:518-526.
3. EQ-5D-5L User Guide; Basic information on how to use the EQ-5D-5Linstrument. Prepared by Mandy Oemar / Bas Janssen. Version 2.0; October2013
4. Reilly Associates: WPAIScoring. http://www.reillyassociates.net/WPAI Scoring.html. 17.09.2015
5. Zill, J. M., Dwinger, S., Kriston, L., Rohenkohl, A., Härter, M. and Dirmaier, J.,Psychometric evaluation of the German version of the patient activation measure(PAM13), BMC Public Health 2013 , 13:1027
6. Fisk JD, Ritvo PG, Ross L, Haase DA, Marrie TJ, Schlech WF. Measuring thefunctional impact of fatigue: initial validation of the fatigue impact scale. ClinInfect Dis. 1994 Jan;18 Suppl 1:S79-83