Embed Size (px)
Citation preview
PROPOSALS FOR THE REHABILITATION OF GRENADIER POND, WENDIGO CREEK AND ASSOCIATED WETLANDS
PREPARED FOR: CITY OF TORONTO PARKS AND RECREATION DEPARTMENT
PREPARED BY: GARTNER LEE LIMITED
JUNE,1995
EXECUTIVE SUMMARY
As part of the High Park planning study, the City of Toronto put fon\'ard a number of ·proposals for the restoration and management of the Park, including the rehabilitation of the Grenadier Pond system having regard for such matters as water quality and quantity, nutrient loading, sediment quality, and habitat and species djversity among others.
Park users have expressed a growing concern over such issues as the degradation of water and sediment quality,. the abundance of nuisance waterfowl and the loss of habitat for fish and wildlife.
In September of 1993, Gartner Lee Limited was retained by the City of Toronto to prepare a rehabilitation plan for Grenadier Pond, Wendigo Creek and associated wetlands, cOllectively referred to as the pond system.
This study essentially had four objectives:
1. To improve the understanding of the physical chemical and biological conditions in the pond system;
2. To identify and quantify factors which have contributed to changing environmental conditions in the po~d syst.em;
3. To identify options for the rehabilitation of the pond system, within the context of the existing park setting and public uses; and
4. To develop a monitoring program to assess the future effects of the rehabilitation on the pond system.
, The consulting team was assisted by a Technical steering committee which included members from the City of Toronto, Metropolitan Toronto and Region Conservation Authority, Ministry of Natural Resources, Ministry of Environment and Energy, Environment Canada, Toronto Field Naturalists and members of the public.
In meetings with the Parks staff, Natural Environment Work Group and the Technical Resource Group, the following desirable characteristics of the pond were defined:
a) that a more natural balance of plants and animals be restored, such that algae is reduced as well as the overabundant population of Canada Geese and game fish populations and diversity are increas.ed;
b) that water quality be improved in the pond, particularly water clarity and oxygen conditions;
c) that species diversity should be enhanced within the pond system, specifically a greater variety of shoreline vegetation, amphibians and birds; and
d) that recreational opportunities for park users be maintained or enhanced.
1
•
In order to address these concerns, it was important first to define the existing conditions in sufficient d'etailto allow options to be developed from which to provide a framework for the rehabilitation of the pond . . Using "3 combination of existing information and field studies, a context of past and present conditions was developed:
Context
Up until 1853, the pond was a wetland connected with Lake Ontario through a barrier beach. Water and animals were freely exchanged and water levels reflected those in the lake. Northern pike were historically present, likely moving' into the pond to spawn in the spring and moving out to the lake as the water became warmer. The shoreline \\'3S a rich wetland, alive with a variety of plants, frogs, turtles, and a host of water birds.
But with settlement in the area, over the next 100 years the shoreline between the beach and the pond was filled and east-west transportation corridors developed. These actions had a profound effect on the pond resulting in a highly altered shoreline, limited water exchange and loss of wetlands and associated fish and wildlife communities.
How Does Grenadier Pond Get Its Water Todav?
The Grenadier Pond watershed is situated within an area of highly. permeable sands associated with glacial Lake Iroquois. As a result of the generally high permeability of soils in the waterShed, precipitation readily infiltrates and there n~mains a Significant potential for ground water input to the pond despite about a 50% reduction in the surface drainage area over historical conditions.
Previous monitoring programs carried out by the Department of Public Works and the Environment in 1992 indicated that there was a Significant inflow to Grenadier Pond from another source besides the storm flows from developed portion of. the Grenadier Pond watershed.
The water budget analysis undertaken for this study for the Department of Parks and Recreation estimated that ground water, which is clean, cool and flows consistently throughout the year, contributes about 50% of the total water flaw to the pond . -Historically we have calculated the contribution may have been closer to 65% of the total inDow to the pond. Field studies carried out by Gartner Lee in 1993/94 confirm that ground water is actively entering through the sides of the pond but the data suggested that fine sediments may be preventing the full volume from entering. Some further hydrogeological work is needed in this area of study to quantify ground water contributions.
Much of the surface water in the Grenadier Pond watershed is captured and delivered to the pond via an extensive storm sewer system. Two sewers discharge directly to the pond at the north end at Clendenan Avenue and at Valleymede Avenue. Several other storm sewers feed into West Pond (also known as Catfish Pond) which discharges to Grenadier at the south west corner only a short distance from ·the outiet, also in the same corner of the pond.
2
These storm sewers deliver precipitation rapidly to the 'pond. This results in rapid increases in water level within the pond. Water level observations during this study over the fall of 1993 and summer of 1994 noted fluctuations in the order of approximately 30 ern but the increases only lasted several days. Seasonal fluctuations were not observed as would have historically been the condition prior to outlet controls.
Originally, the pond was approximately 1.3 m lower when connected to Lake Ontario. The pond elevation was altered with considerable filling of the shoreline during the construction of the Queensway. We calculate that restoring the connection with the lake would result in a loss of pond area in the order of 40% given the existing of shoreline configuration.
The present size of the pond is 18.9 ha with a maximum depth of 6.S m and mean depth of 2.98 m. The pond flushes, or in other words, the water within the pond is exchanged, roughly 2.76 times per year.
What is the Quality of the Water In Grenadier Pond?
Through existing information and some limited sampling as part of this study we have found significant phosphorus (average 0.2 mg/L) and nitrogen (average 2.38 mg/L) levels within the water column which fuels excessive algal growth. The algal growth eventually dies and settles to the bottom of the pond where it decays and uses up oxygen in the process. As a result, there is no oxygen in the bottom waters over a considerable portion of the year, including winter ana summer. 'rhls is a condition which has been found consistently by all investigators over many years. Hydrogen sulphide, taken. by the Ministry of Environment and Energy in 1994, also appears to be present in the bottom waters at toxic levels.
The cI~y ~'!...~id typicalll: pORin the summer time, largely related to the algal blooms. Secchi disc rea ings (measures 'the distance under water that a disc can be observed) as low as 0.5 m were recorded in this study which appear to be marginally worse than those observed in other years, but that could be a factor related to weather conditions. More frequent and longer term monitoring will assist in determining the average water clarity.
What is the Quality of Sediment in Grenadier Pond?
The sediments of the pond were found by this study to be slightly contaminated with metals, likely related to storm runoff. Few samples were taken and more information would be required to define the extent and quality of the sediments.
What causes the Water Quality Problems in Grenadier Pond?
A significant component of this study was developing a water and nutrient budget to account for the inputs and outputs and identify the most important contributions of each to the pond. We concentrated on phosphorus as it provided significant insight into the mechanisms controlling the pond quality
3
Our results of the sampling and nutrient budget for this study indicate that the pond experiences significant water quality problems due to:
a)
b)
incoming storm water from the watershed (external loads or contributions) which carries with it nutrients (e.g., from fertilizers), metals (e.g. from road runofl), sediment (e.g., from eroding soil) and bacteria (e.g., from pet waste). 'In fact , 25% of the total annual phosphorus loadings come from the storm sewer~;
contributions of nutrients from feces of Canada geese abundant around the shoreline which account for 40% of the phosphorus loadings; and
c) nutrients contained within the bottom sediments · (internal loads) which account for 32% of the total phosphorus loadings.
Therefore, storm water, geese and the sediments within the pond are significant contributors to the observed problems and need to be addressed.
What is the Aguatic Habitat and Fish Community Structure of the Pond?
The fish community in the pond has changed over time with the alterations of connections and habitats. Over 45% of the shoreline now is concrete curb and steep slopes having replaced the former wetland edge. The habitat is poor for species such as largemouth bass and northern pike which were historically very important in the pond. While both species are present in the pond today, their:: populati.Qns are small, and in the case of pike, cannot be sustained without significant habitat impro;ements. Sunfish have gained a foothold in the pond and are competing with the bass for resources.
Are There Anv Wetlands Left Around the Pond?
Only remnant areas of wetland remain around the pond. Small areas at the north and south west of the pond have" limited plant diversity and consequently associated wildlife habitat. Some significant species are present in the pond which can be inco~porated into future wetland development. Aquatic plants (macrophytes) .are limited in the pond, partially because of the slopes and substrates present on the bottom of the pond, but also are influenced by the poor water clarity.
How Do We Fix The Pond? A Framework for Rehabilitation
Based on the findings of this study there is a better understanding of the past and present conditions in the pond associated with water and sediment quality and habitat degradation. From this a planning framework for rehabilitation options was developed to address the conditions. The framework was developed under the headings of:
a) external load reduction; . b) internal load reduction; c) waterfowl control;
4
J
I
d) habitat alteration; e) ·fish community imbalance;
. f) lack of wildlife diversity; and g} human access and education.
A number of actions were found to satisfy more than one requirement, would result in long term correction of the problem, and therefore were selected on that basis. There are a number of options to deal with the internal loading within the pond and this is where the dilemma lies still. More information and investigations are required to determine the best method to deal with the nutrient rich water or sediments. Nevertheless, a recommended proposal for rehabilitation has been outlined, which in part will be confirmed or altered with new information.
The framework has four ma in elements:
1. teductio.n....otnutrient loadings from the watershed through public education and voluntary action., increased infiltration in the watershed to enhance cleaner ground water flow through the pond, as well as end of pipe storm water treatment facilities at the end of the Clendenan ~utfall and West Pond drainage;
2. removal and treatment of sediments within the pond to reduce nutrient loads ffOm the sediment, Improve their consistency to foster plant growth and invertebrates, and enhance the ground water flow to the pond;
3. reduction in nutrient loadings from the large population of Canada Geese resident in the park through the restructuring of the habitat surrounding the pond to eliminate the availability of lawn-water connections; and
4. !.labitat improvements through the restoration of wetland edges and lar.ger wetland blocks and instituting seasonally fluctuating water levels to benefit fish and wildlife.
The.se actions can be carried out within the park setting to provide improvements to the water quality and natural environment of the pond, pond aesthetics and existing recreation activities, ie. fishing, birdwatching, etc.
Feeding of the waterfowl should be discontinued to discourage the presence of the birds at the pond. Some trail relocation will be necessary to accommodate the new habitats and reduce the efiects of people on the wildlife, but in all, the effects on the park user are expected to be minimal.
A~ community education and comm~nications program is a necessary adjunct to the rehabilitation efforts as actions are needed within the watershed as well as in the pond. During the implementation of the investigations and treatments there will be some inconvenience of the park users and there needs to be a spirit of understanding and cooperation fostered to ensure successful completion of the pond system's rehabilitation.
5
Ongoing annual monitoring is essential to document the success of the measures or to apply other actions "to deal with other problems should they arise. It must be understood that lake rehabilitation is not a precise science
in that there are many interactions that take place in the system of which we may only understand a few. Through careful monitoring changes can be observed and corrected to ensure that management is having the desired effect. Demonstration projects will allow us to try certain actions on a small area of the pond prior to implementation at a larger scale and will be useful in persuading both the park user and the regulatory agencies of the value in larger scale application.
It is importan"t to begin the work as soon as pos"sible. Every day that we wait increases the magnitude of the problem and makes it more difficult and more expensive to achieve our { goal of a sustainable aquatic ecosystem in the heart of one of Toronto's greatest resources, /I High Park.
6
TABLE OF CONTENTS
Ex.ecutive Summary
1.0 CONTEXT ...................................................................................................................................... 1
2.0 REVIEW OF PAST AND PRESENT CONDITIONS ............................................................. .4 2.1 Drainage Area Description ............................................................................................... 4 2.2 Hydrology .......................................................................................................................... 7
2.2.1 Ground Water Conoibution ................................................................................. 7
2.2.2 Surface Water Contributions ................................................................ ........... ,. I I 2.2.3 Grenadier Pond Water Levels ........................................................................... 14 2.2.4 Outlet Structure ................................................................................................. 15
2.3 General Limnology ...................................................... ....................................... ............ 16 2.4 Water Quality .................................................. ,., ........................................ ..................... 17
2.4.1 Temperature and Dissolved Oxygen Levels .................................................... 17 2.4.2 Water Clarity .................................................... .................................................. 24 2.4.3 Bacterial Levels ................................................................................................. 25 2.4.4 Nutrient Levels ....... ........................................................................................... 25 2.4.5 Metal Levels ........................... , .......................................................................... 29 2.4.6 Organic Contaminant Levels ...................................................... ...................... 30 2.4.7 Other Parameters ............................................................................. ........ .......... 31 2.4.8 Summary ............................................................................................................ 31
2.5 Sediment Quality ............................................................................................................. 31 2.5.1 Nutrient Levels ... ......................... .............................. ....... ................ ................ . 33 2.5.2 Metal Levels ............................................. ......................................................... 33 2.5.3 Organic Contanlinant Levels ............................................................................ 34
2.6 Water, Suspended Solids and Nutrient Budgets ............................................................ 34 2.6.1 Water Balance ......................................................... ........................................... 34 2.6.2 Suspended Solids ...................................... ................................................ ......... 36 2.6.3 Total Phosphorus .................. ............................................................................. 42 2.6.4 Total Nitrogen ................................................................................................... 43
2.7 Aquatic Habitat ............................................................................................................... 44
2.8 Fish Community .............................................................................................................. 51 2.9 Wetland Vegetation ........................................................................................... .............. S6 2.10 Wildlife ............................................................. ................................. ......... ..................... 60
3.0 ASSESSMENT OF EXISTING CONDITIONS .......................................................... .. .......... 63
4.0 IDENTIFICATION OF ISSUES AND OPPORTUNITIES .................................................... 65 4.1 Opponunities ......................... ,., .......... .... , ............................................ ............................ 67 4.2 Issucs ........ .................................................................................................................. ...... 68
LIST OF FIGURES
2.1 Prescnt and Historical Watershed Boundaries and Surficial Soil Types ........................................ 6 2.2 Sampling Stations, Sewer Outfalls and Bathymetric Contours .................................................... 10 2.3 Drainage Areas Tributary to Grenadier Pond Outlet Sewer .............................................. ............ 12 2.4 Oxygen Profiles for Grenadier Pond. 1983-1994 ........................................................... ............... 18 2.5 Temperature Profiles for Grenadier Pond, 1983-1994 .................................................................. 19 2.6 Generalized Schematic of Water Balance for Grenadier Pond ...................................................... 35 2.7 Generalized Schematic of Contaminant Sources and Pathways for Grenadier Pond ................. . 37 2.8 Onshore and Offshore Habitat. ....................... ...................... ........................................................... 47 2.9 Existing Shoreline Cross Section ...... ............................................................................ .................. 48 2.10 Mar.;hAreas 1994 .......................................... ............................................................. ....... .............. 50 2.11 Historical and Present Wetland and Shoreline Conditions ............................................................ 57 6.1 Grenadier Pond System Rehabilitation Concept Plan ................................................................... 91 6.2a Grenadier Pond System Rehabilitation Concept Plan - Section A-A, South Shoreline ............ 92 6.2b Grenadier Pond System Rehabilitation Concept Plan - Section B-B, East Shoreline ............... 93
LIST OF TABLES
2.1 Ground Water and Surface Water Contributions to Grenadier Pond .............................................. 8 2.2 Summary of Mini-Piezometer Readings - Depth Above / Below Pond Surface
Elevation (m) ...................................................................................................................................... 9 2.3 Summary of Key Outfall Locations (see Figure 2.3) .................................................................... 13 2.4 Summary of Water Level Readings at Grenadier Pond .............................................. ................... 14 2.5 Grenadier Pond Morphometry (from Zimmerman et al.. 1986) .................................................... 16 2.6 Water Quality of Grenadier Pond - Nutrients and Routine Indicator Parameters ....................... 20 2.7 Water Quality of Grenadier Pond - Fecal Coliform, BOD and Metals ........................................ 22 2.8 Sediment Quality for Grenadier Pond. 1992 to 1993 ..................................................................... 32 2.9 Water Balance for Grenadier Pond (Existing Conditions) ............................................................. 34 2.10 Grenadier Pond Mass Balance for Water, Suspended Solids and Nutrients ................................. 38 2.11 Grenadier Pond Mass Balance (% Contributions) ......................................................................... 39 2.12 Estimates of Grenadier Pond Bird Populations and Biomass ........................................................ 41 2.13 Predicted Contributions of Suspended Solids, Phosphorus and Nitrogen from Grenadier
Pond Bird Population ....................................................................................................................... 41 2.14 History of Fish in Grenadier Pond .................................................................................................. 52 5.1 Evaluation of Measures to Address Issues Identified in Grenadier Pond ..................................... 70 5.2. Modelled Results of Phosphorus Reduction Potential within Grenadier Pond ........................... 75 6.1 Future Ground Water and Surface Water Contributions to Grenadier Pond ................................ 98 6.2 Target Fish and Wildlife Species and Their Key Habitat Requirements ..................................... 99 7.1 Implementation Plan of Preferred Options to Address Issues Identified in Grenadier Pond .... 103
APPENDICES
A. Remediation Techniques and Internal Load for Grenadier Pond, Toronto B. Grenadier Pond Sedimentation Control Study
TABLE OF CONTENTS ,o",'d
5.0 OPTIONS FOR REHABILITATION ........................................................................................ 69 5.1 Nutrient Loadings ............................................................................................................ 69
5.1.1 ExtcmalNutrientLoads ..................... .......................... ..................................... 76 5.1.2 Internal Nuttienl Loads .......................................... ........................................... 77
5.2 LackofDissolvedO;ltygen .............................................................................................. 81 5.3 Excess Algal Growth ........................................................................................ .............. 82 5.4 Poor Water Clarity ........................................................................................................... 82 5.5 Abundant Waterfowl ....................................................................... , ............................... 82 5.6 Habitat Alteration ....... .............................................................................................. ....... 83 5.7 Fish Community Imbalance ............................................................................................ 86 5.8 Lack of Wildlife Diversity .............................................................................................. 88 5.9 Human Access and Education ........................................................................................ 89
6.0 PREFERRED FRAMEWORK FOR REHABILITATION ..................................................... 90 6.1 Water Quality .................................................................................................................. 90
6.1.1 Internal Loading Reduction ............................................................................... 90 6.1.2 External Loading Reductions ............ ................................................................ 96
6.2 Fish and Wildlife Habitat and Community Diversity .................................................... 97 6.3 Park User Activities ....................................................................................................... 101
7.0 IMPLEMENTATION PLAN ................................................................................................... 102 7.1 Priorities ....................................................................................................................... .. 102 7.2 Partnerships ................................................................................................................... 107
8.0 MONITORING PROGRAM .................................................................................................... 107 8.1 Project Rationale ........................................................................................................... 107 8.2 Water Quality and Quantity MOnitoring ...................................................................... lOS
8.2.1 Project Rationale .................................................................................. ......... ... 108 8.2.2 Monitoring Practice ......................................................................................... 108
8.3 Sediment Quality Monitoring ............................................................................ ........... 109 8.3.1 Project Rationale .................................................. ............................................ 109 8.3.2 Monitoring Practice ................ ......................................................................... 109
8.4 Fish Monitoring .................................................................................... ............. ............ 109 8.4.1 Project Rationale .............................................................................................. 109 8.4.2 Monitoring PrognuTl ....................................................................................... . 109
8.5 Biomonitoring ................................................................................................................ 110 8.5.1 Project Rationale ....... .............. ......................................................................... 110 8.5.2 Monitoring Program ........................................................................................ 1 10
9.0 COMMUNITY EDUCATION AND INFORMATION ........................................................ 111
10.0 REFERENCES ........................................................................................................................... 113
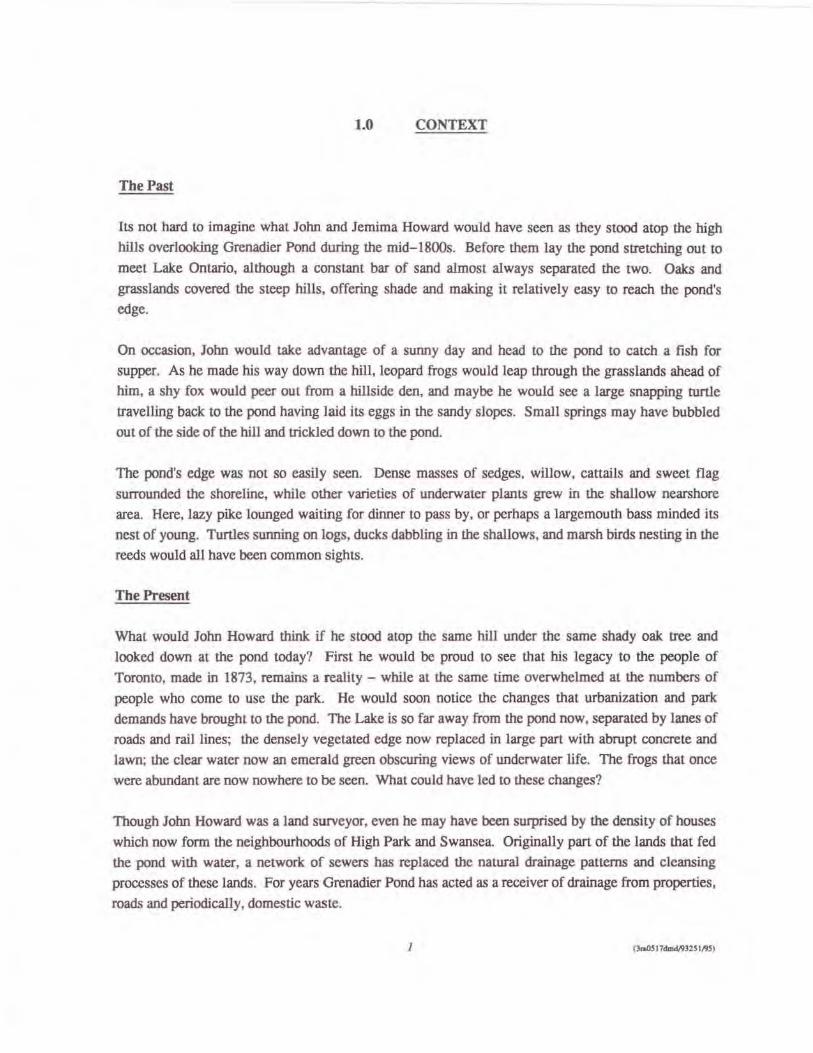
1.0 CONTEXT
The Past
Its not hard to imagine what John and Jemima Howard would have seen as they stood atop the high
hills overlooking Grenadier Pond during the mid-1800s. Before them lay the pond stretching out 10
meet Lake Ontario. although a constant bar of sand almost always separated the two. Oaks and grasslands covered the steep hills, offering shade and making it relatively easy to reach the pond's
edge.
On occasion, John would take advantage of a SWUly day and head to the pond to catch a fish for
supper. As he made his way down the hill. leopard frogs would leap through the grasslands ahead of
him, a shy fox would peer out from a hillside den, and maybe he would see a large snapping turtle travelling back to the pond having laid its eggs in the sandy slopes. Small springs may have bubbled
out of the side of the hill and trickled down to the pond.
The pond's edge was not so easily seen. Dense masses of sedges. willow, cattails and sweet flag
surrounded the shoreline. while other varieties of underwater plants grew in the shallow nearshore
area. Here. lazy pike lounged waiting for dinner [0 pass by. or perhaps a largemouth bass minded its
nest of young. Turtles sUIUling on logs. ducks dabbling in the shallows. and marsh birds nesting in the
reeds would all have been common sights.
The Present
What would John Howard think if he stood atop the same hill under the same shady oak tree and
looked down at the pond today? First he would be proud to see that his legacy to the people of
Toronto. made in 1873. remains a reality - while at the same time overwhelmed at the numbers of
people who come to use the park. He would soon notice the changes that urbanization and park
demands have brought to the pond. The Lake is so far away from the JX>nd now. separated by lanes of
roads and rail lines; the densely vegetated edge now replaced in large part with abrupt concrete and
lawn; the clear water now an emerald green obscuring views of underwater life. The frogs that once
were abundant are now nowhere to be seen. What could have led to these changes?
Though John Howard was a land surveyor, even he may have been surprised by the density of houses
which now form the neighbourhoods of High Park and Swansea. Originally part of the lands that fed
the pond with water, a network of sewers has replaced the natural drainage patterns and cleansing
processes of these lands. For years Grenadier Pond has acted as a receiver of drainage from properties.
roads and periodically. domestic waste.
J
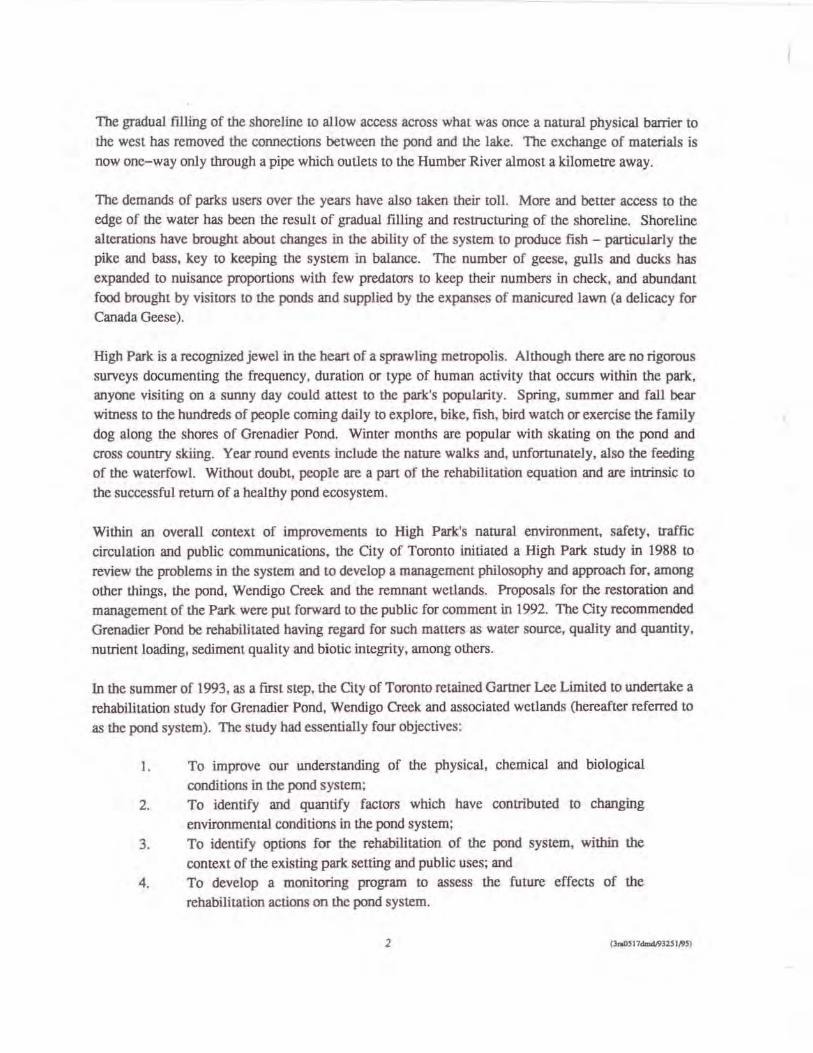
The gradual filling of the shoreline to allow access across what was once a natural physical barrier to the west has removed the connections between the pond and the lake. The exchange of materials is now onc-way only through a pipe which outJets to the Humber River almost a kilometre away.
The demands of parks users over the years have also taken their toll. More and better access to the edge of the water has been the result of gradual filling and restructuring of the shoreline. Shoreline alterations have brought about changes in the ability of the system to produce fish - particularly the pike and bass, key to keeping the system in balance. The number of geese, gulls and ducks has expanded to nuisance proportions with few predators to keep their numbers in check, and abundant food brought by visitors to the ponds and supplied by the expanses of manicured lawn (a delicacy for Canada Geese).
High Park is a recognized jewel in the heart of a sprawling metropolis. Although there arc no rigorous surveys documenting the frequency, duration or type of human activity that occurs within the park. anyone visiting on a sunny day could attest to the park's popularity. Spring, summer and fall bear wimess to the hundreds of people coming daily to explore, bike, fish. bird watch or exercise the family dog along the shores of Grenadier Pond. Winter months arc popular with skating on the pond and cross country skiing. Year round events include the nature walks and. unfonunaleiy. also the feeding of the waterfowl. Without doubt. people arc a part of the rehabilitation equation and are intrinsic to the successful return of a healthy pond ecosystem.
Within an overall context of improvements to High Park's natural environment. safety, traffic circulation and public communications. the City of Toronto initiated a High Park study in 1988 to review the problems in the system and to develop a management philosophy and approach for. among other things, the pond, Wendigo Creek and the remnant wetlands. Proposals for the restoration and management of the Park were put forward to the public for comment in 1992. The City recommended Grenadier Pond be rehabilitated having regard for such matters as water source, quality and quantity. nutrient loading, sediment quality and biotic integrity. among others.
In thc summer of 1993, as a first step, the City of Toronto rctained Garmer Lee Limited to undertake a rehabilitation study for Grenadier Pond. Wendigo Oeck and associated wetlands (hereafter referred to as the pond system). The study had essentially four objectives:
1. To improve our understanding of the physical, chemical and biological conditions in the pond system;
2. To identify and quantify factors which have comributed to changing environmental conditions in the pond system;
3. To identify options for the rehabilitation of the pond system. within the context of the existing park setting and public uses; and
4. To develop a monitoring program to assess the future effects of the rehabilitation actions on the pond system.
1 (ln051 7dmd,111l;!j 11\15)
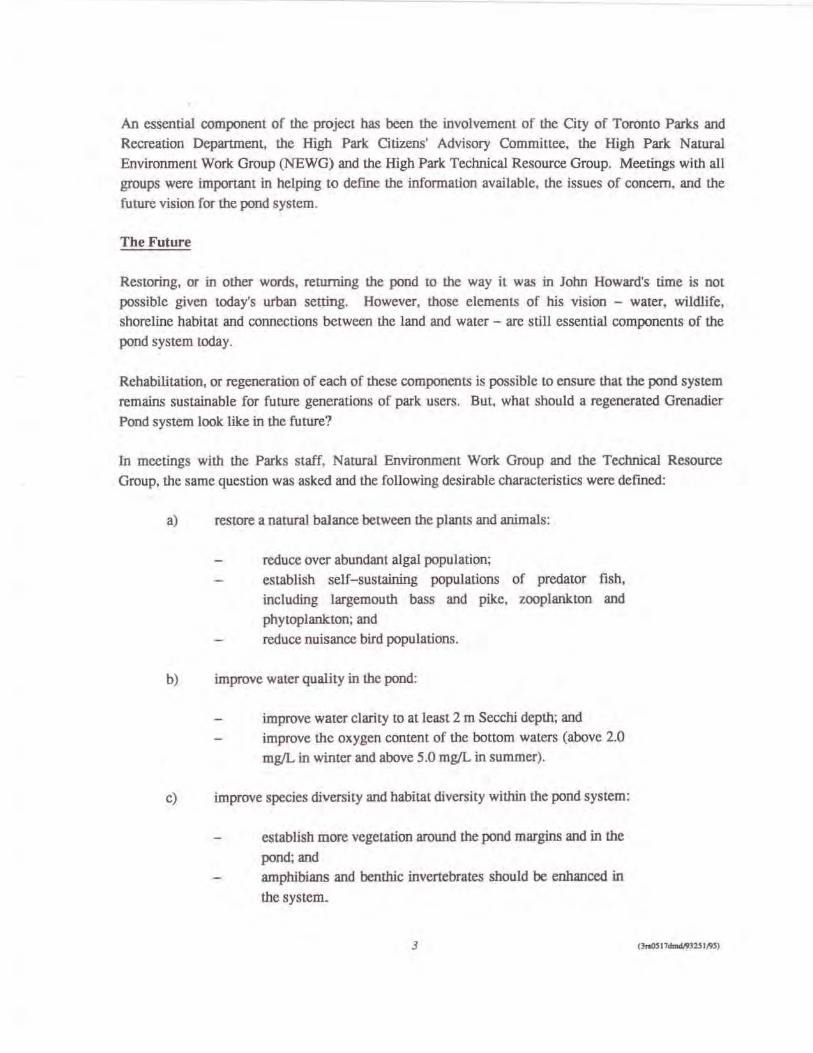
An essential component of the project has been the involvement of the City of Toronto Parks and Recreation Department, the High Park Citizens' Advisory Committee, the High Park Natural Environment Work Group (NEWG) and the High Park Technical Resource Group. Meetings with all groups were imponant in helping to defme the information available, the issues of concern, and the
future vision for the pond system.
The Future
Restoring, or in other words, returning the pond to the way it was in John Howard's time is not possible given today's urban setting. However, those elements of his vision - water, wildlife, shoreline habitat and connections between the land and water - are still essemial components of the pond system today.
Rehabilitation, or regeneration of each of these components is possible to ensure that the pond system remains sustainable for future generations of park users. But, what should a regenerated Grenadier
Pond system look like in the future?
In meetings with the Parks staff, Natural Environment Work Group and the Technica1 Resource Group, the same question was asked and the following desirable characteristics were defmed:
a) restore a natural balance between the plants and animals:
reduce over abundant algal population; establish self-sustaining populations of predator fish, including largemouth bass and pike, zooplankton and
phytoplankton; and reduce nuisance bird populations.
b) improve water quality in the JX)nd:
improve water clarity to at least 2 m Secchi depth; and improve the oxygen content of the bottom waters (above 2.0 mg/L in winter and above 5.0 mg/L in summer).
c) improve species diversity and habitat diversity within the JX)nd system:
establish more vegetation around the JX)nd margins and in the
pond; and amphibians and benthic invertebrates should be enhanced in
the system.
3
As is recognized, people remain a very important component of the Grenadier Pond system. Any of the actions taken to attain the desirable characteristics noted above must also address the effects on the park users, therefore consideration of a fourth characteristic would be:
d) maintain and enhance recreational opponunities for park users.
At closer inspection of the conditions that have been identified as desirable. it is clear that they are not in isolation of each other. Sufficient oxygen, proper food and appropriate habitat are all implicit in maintaining a healthy, thriving fishery. Measures set to improve water quality will automatically
benefit aquatic organisms, but the overall goal of a self-sustaining population would not be mel if appropriate spawning habitat did not also exist. Remediation in one area must, in tum, be supported by cnbancement of other aspects.
Similarly, through water quality improvemcnts, the nutrient levels would be reduced which is often associated with a decline in nuisance algal populations and increased opportunity for macrophytes to become established. These linkages within the aquatic ecosystem should be reflected in the choices made for rehabilitation, as one option WOUld, to some extent, affect many overlapping areas.
Armed with the guidance provided above, the process of developing a framework for rehabilitation of the Grenadier Pond system began. The first stage involved derming the existing conditions along with their historical context. Next, an assessment of how the various present day conditions are interrelated was made. From that assessment. the issues and opportunities around the pond were identified. A
number of options were developed for the J,X>nd system. No one solution will be sufficient to achieve the rehabilitation. While some have a number of alternatives to accomplish the same thing. othcrs have only onc. The recommended framework for rehabilitation presented in the document identifies the need for further data to suppon the rehabilitation, preferred rehabilitation options, and a
monitoring program to measure the effects of the various actions.
2.0 REVIEW OF PAST AND PRESENT CONDITIONS
2.1 DRAINAGE AREA DESCRIPTION
Grenadier Pond is located at the west end of the City of Toronto and adjacent to Lake Ontario. The pond is located within the western boundaries of High Park. On the west side is older residential
dcvelopment within the community of Swansea. Directly south of the pond lies the Queensway arid Lakeshore Boulevard, separating Grenadier Pond from Lake Ontario. Water from the pond exits from the southwest comer and travels via a pipe to the Humber River, eventual1y discharging to Lake
4
I
Ontario. Historically, only a sandy beach bar divided the two water bodies. During periods of high water (e.g. , spring snow melt), it is expected that Lake Ontario waters would flood over the bar and mix with Grenadier Pond. This action would both result in periodic flushing of the pond with lake water as well as seasonally affccting water levels in the pond.
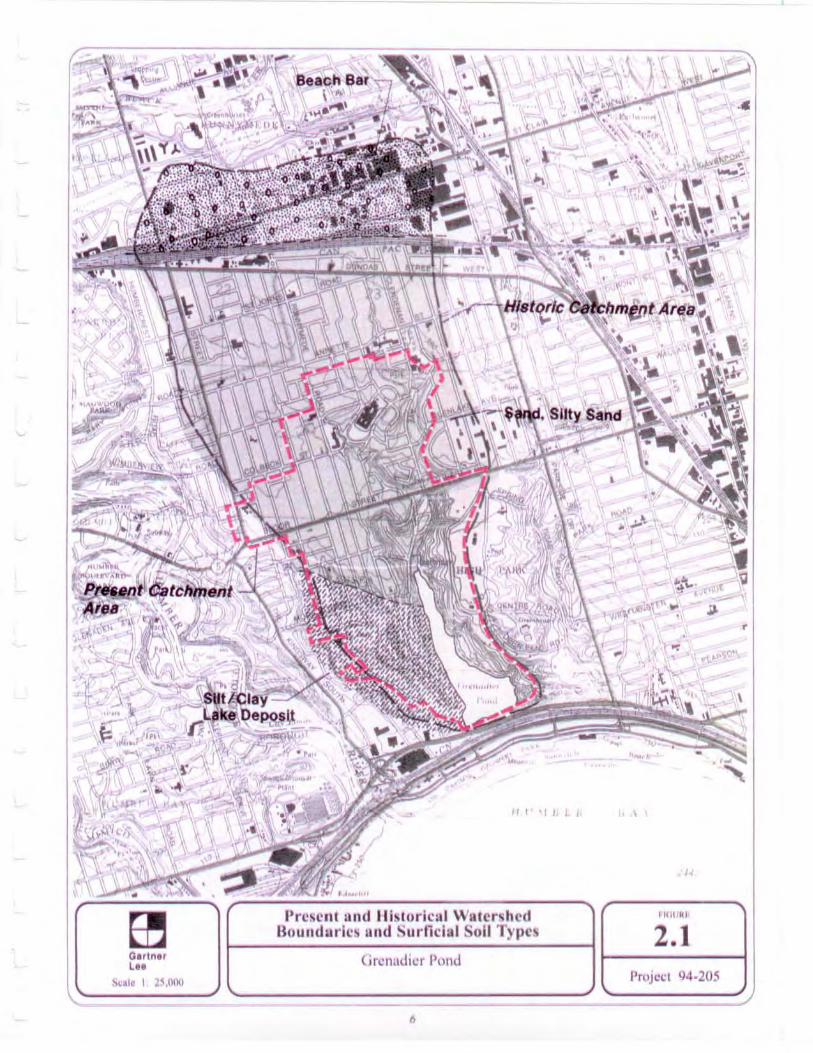
The Grenadier Pond watershed is situated within an area dominated by glacial Lake Iroquois deposits (OMNR, 1980). These deposits are mostly highly IX=rmeable sands and silty sand materials. The upper portion of the historical catchment area, as shown on Figure 2.1, contains a major beach bar
deposit of sand and gravel. The area west of the pond, including most of the drainage area to Catfish Pond, consists of deeper water deposits where less permeable siIty-clay material is dominant. This westerly area has a lower infiltration capacity than the remainder of the basin. These key
physiographic units are shown on Figure 2.1. As a result of the generally high permeability of the catchment, there has been historically high infiltration capacity and is potential for significant ground water input to the pond even today, despite extensive urbanization.
The historical surface catchment area for Grenadier Pond was much larger than the present area. Based on historical mapping sources, it appears that the original drainage area was about 477 ha and extended as far north as Sl. Clair Avenue where the beach bar deposit exists (Figure 2.1). The catchment area has undergone several changes associated with historical development of the area and
separation of combined sewers. The drainage area to Grenadier Pond today is ex.tensively channelized into stann sewers and has been reduced by about 50% from historical conditions to 245 ha based on City of Toronto sewer drawings. The area of most significant change was between Annette Street and St. Clair Avenue where the storm sewer drainage from hard surfaces (about 35% of the area) was diverted out of the catchment during urbanization of these lands. In addition, as building roof areas were typically connected to the storm system, both roof and road runoff were diverted out of the Grenadier Pond watershed. As a result of these changes, the surface water catchment has been
reduced to about half its original size and the annual volume of water dirccted to the pond substantially reduced. The catchment area for ground water has also been affected, but to a lesser extent. (Note that the ground water catchment is larger than the surface water catchment as infiltration outside the surface catchment will still reach Grenadier Pond through the ground water system.) It is expected, however, that much of the ground water flow from the historical catchment as far north as St. Clair Avenue, still moves towards Grenadier Pond since the sandy soil conditions are deep and continuous within the catchment. Although much of the area has storm sewers, these services are relatively shallow and arc not expected to intercept significant amounts of infiltrated water either into the pipe or along service trenches. Similarly, the TIC subway line along Oendenan
Avenue is shallow or at surface in this area and does not intercept ground water flow.
SpeCific analyses for the ground water and surface runoff contributions to Grenadier Pond are discussed in the next sections. These factors are key components of the water balance for the
Grenadier Pond.
.I
,
(hrln.r CO,
~~.I~ , 2~.(1I11I
II! '! I L I
Present Bnd lIislorlcal W8tcr~hcd BoulldHrle~ and Surficial Soil Types
Gn:nlldict Pond
•
\
tk,1111
2.1
2.2 HYDROLOGY
The preparation of a water budget (or balance) is critical to understanding present conditions within
the pond and the effectiveness of rehabilitation measures. Water balance components include
precipitation, evapotranspiration and the annual surplus. The arulUal surplus is further divided into the
proponions of runoff and infiltration which are dependent upon the soil penneability and land usc. To better understand the contributions of ground water and surface water under past and present conditions, a spreadsheet was prepared for the Grenadier Pond watershed to quantify ground water and
surface water sources based on land use and soil type. The data arc further compared 10 empirical data
collected within the study area.
2.2.1 Ground Water Contribution
Prior to this study. there had been limited data to conftrm the potential or quantify the amount of ground water entering into Grenadier Pond either from the side banks or through the base of the pond.
City of Toronto data (1992) on inflow and outflow points at Grenadier Pond showed that only 50% of
the pond outflow could be accounted for at storm sewer inlets. The reports suggest that much of this
difference may be ground water inflow. Through the water budget analysis, we have tried to defme
the relative contribution of ground water to the system.
An average annual evapotranspiration amount of 450 mm per year with an annual surplus of 300 mm
precipitation has bccn assumed in Table 2.1 based on the Clcndenan Avenue meteorological station.
In addition, it has been assumed that any infiltrated water within the catchment will reappear in
Grenadier Pond due to the steep gradients to Wendigo Creek and the pond and generally uniformly
permeable and deep soils. Ground water gradients between Grenadier Pond and Lake Ontario are
generally lower than those in the upper part of the basin. res.ulting in the pond and Wendigo Creek acting as a regional discharge point for ground water.
The percentage of annua1 infiltration (column 4 in Table 2.1) is based on long-tenn modelling of
daily temperature and precipitation data using the moocl WATBUD. This mooel is based on the
HELP infiltration model (U.S. Army Corps of Engineers) and uses soil type and land use
(imperviousness) to determine annual inflltration values. Data in Table 2.1 suggests that the historical
ground water inflow was likely in the order of 30 LIs while it is presently about 15 LIs. The amount
of ground water inflow appears to have decreased significantly while the amount of surface inflow has
decreased only slightly. This is because the increase in surface runoff due to urbanization has been
offsct by the loss of drainage area north of Annette Street. The infiltration percentage in Table 2.1 has
been adjusted between historical and prescnt conditioru to account for the increase in impervious area (roof and road area) for each of the sub-catcbmem areas as compared to undeveloped conditions.
Historically. the ground water inflow was likely about 65% of the total inflow to the pond while it is
in the range of 50% presently.
7