Embed Size (px)
Citation preview

Learner Guide
PROPOSAL PREPARATION USING THE LOGICAL FRAMEWORK APPROACH & PROJECT MONITORING
PART II

VERSION 1. February 2015
ACKNOWLEDGMENTS
This Learning Resource has been produced by the Pacific Research & Evaluation Associates (PREA)
for the Secretariat of the Pacific Community (SPC), through its European Union funded Global
Climate Change Alliance: Pacific Small Island States (GCCA: PSIS) project.
DISCLAIMER
The content of this publication is provided for educational purposes only. No claim is made as to the
accuracy or authenticity of the content. The information in this publication is proved on the basis
that all persons accessing it undertake responsibility for assessing the relevance and accuracy of its
content. No responsibility is taken for any information or services which may appear on any linked
websites. If using any information provided in this manual, please ensure proper acknowledgement
is noted.
Neither PREA nor SPC accepts any liability to any person for the information or advice (or the use of
such information or advice) that is provided in this publication or incorporated into it by reference.
If you have any questions or feedback regarding this resource, please contact Ms Titilia Rabuatoka
on email: [email protected] OR phone: +6793379485
www.prea.com.au

Contents USING THE LEARNER GUIDE .................................................................................................................... 1
Introduction to the Course ................................................................................................................. 1
Learning Objectives ............................................................................................................................. 1
Learner Guide Icons ............................................................................................................................ 1
section 1. The logical framework approach ............................................................................................ 2
The logical framework approach steps ............................................................................................... 2
Step 1. Situation analysis .................................................................................................................... 3
Step 2. Stakeholder analysis ............................................................................................................... 3
Step 3. Problem analysis ..................................................................................................................... 5
How to undertake a problem analysis ............................................................................................ 6
Step 4. Solution analysis ..................................................................................................................... 9
How to undertake a solution analysis ............................................................................................. 9
Step 5. Strategy analysis – selecting the solution ............................................................................. 11
Step 6. Logframe matrix .................................................................................................................... 12
Project description ........................................................................................................................ 13
Assumptions .................................................................................................................................. 13
Indicators ...................................................................................................................................... 15
Source of verification .................................................................................................................... 17
Reviewing the logframe matrix ..................................................................................................... 17
Section 2. Monitoring your project ....................................................................................................... 18
Monitoring plan ................................................................................................................................ 18
Data collection methods ................................................................................................................... 20
Counts ........................................................................................................................................... 20
Questionnaires .............................................................................................................................. 21
Dartboard ...................................................................................................................................... 27
Stories ........................................................................................................................................... 28
Interviews & focus groups ............................................................................................................ 29
Establishing an indicator tracking table ............................................................................................ 30
section 3. detailed project planning ..................................................................................................... 32
Step 7. Timeline ................................................................................................................................ 32

Step 1. Breaking down activities into tasks – The Work Breakdown Structure ............................ 33
Steps 2. Estimating task time & 3.Identify resources ................................................................... 40
Step 4. Organise tasks into a timeline ........................................................................................... 44
Step 5. Determine key milestones ................................................................................................ 50
Step 6. Documenting your timeline in a spreadsheet .................................................................. 51
Step 7. Budget ................................................................................................................................... 52
Step 1. Categorise costs ................................................................................................................ 52
Step 2. Estimate costs ................................................................................................................... 54
Step 3. Allocate source of funding ................................................................................................ 57
Step 4. Adding contingency & currency exchange ........................................................................ 58

Logical Framework Approach Part II – Learner Guide © SPC 2015 1
USING THE LEARNER GUIDE The guide is divided into sections and contains icons to help you navigate through the guide.
Introduction to the Course This course is designed to introduce and/or reinforce knowledge and skills in the application of the
logical framework approach (LFA) as a means to design project proposals for funding assistance in
the area of climate change adaptation.
This training complements and builds on the first round of LFA training (2013‐14) as part of the EU‐
funded, SPC‐administered GCCA: PSIS programme. The learner guide for the first round of training
can be found at http://tinyurl.com/o2cj634.
Learning Objectives The overall learning objectives of the training course is to build participant capacity in proposal
preparation using the logical framework approach, and in project monitoring. More specifically at
the end of this training programme
participants will be able to apply the Logical Framework Approach to develop a robust
logframe matrix
participants will be able to develop an accurate timeline and budget for projects, based on
identifying the tasks and costs to implement activities in the logframe matrix.
participants will be able to develop a monitoring plan and understand how to monitor
projects as they are implemented.
Learner Guide Icons A range of icons are used throughout the body of this guide to signal when you have to do
something such as completing a learning activity or assessment task.
Learning Activities are there to help you reflect on and consolidate your learning.
Readings are provided to guide you to further technical information to allow you to further build upon the learning objectives.

Logical Framework Approach Part II – Learner Guide © SPC 2015 2
SECTION 1. THE LOGICAL FRAMEWORK APPROACH The Logical Framework Approach (LFA) is a project design process based on participation, critical
analysis, strategic thinking, and logic. The LFA has been around for since the 1970s and is used, or is
required, by many donors for funding applications.
The LFA offers one of the best project management tools around, allowing project teams to
communicate amongst each other, and with other stakeholders and funders. Beyond project design,
the LFA can be used for strategic planning, and other tasks where ‘problems’ exist and solutions
need to be identified.
The usefulness of the LFA is only as good as how it has been practised. As such, taking the time to go
through the process in a participatory manner, using critical thinking and logic, produces better
results than a ‘tick the box’ approach.
It is important to differentiate the LFA from the logframe matrix. The logframe matrix is one of the
outputs, or products, of the LFA. So the LFA is a process, based on a sequential steps (see next
section), and the matrix is the output of one step. Many people tend to jump straight to the
logframe matrix, as this is often what the funding agency wants to see. A solid, useful logframe is
built on strong foundations offered by the preceding steps. Jumping straight to the logframe may
result in a flimsy design that will not lead to successful projects.
The logical framework approach steps The LFA, as noted above, is a made up of sequential steps.
1. Situation analysis Describing the current state
2. Stakeholder analysis Identifying stakeholders’ roles and ability to affect the project (positively or negatively)
3. Problem analysis Identifying the core problem, and the causes and effects of the problem
4. Solution analysis Identifying all the potential solutions
5. Strategy analysis Analysing potential solutions and deciding on the best approach
6. Logframe matrix A simple, clear representation of the selected solution that describes the logical thinking between steps (if you do this, then this will happen), and how you will know whether you have been successful (what will show success, and how can I measure/demonstrate this)
7. Timeline The finer detail that builds on the logframe matrix, and identifies tasks, the inputs required, responsibilities, and timeframes
8. Budget Self‐explanatory but never simple! Takes the project plan, and costs it out, so that projects don’t fall short during implementation
Each step builds on the previous. As noted in the introduction, jumping straight to the logframe
matrix means that you have skipped a number of previous steps. Imagine trying to build a house
from the second level, without the foundations, and first level! Quite difficult, and the result would
not be very solid.

Logical Framework Approach Part II – Learner Guide © SPC 2015 3
Step 1. Situation analysis This step is about gathering information on a sector (e.g. water, agriculture, energy, transport,
health etc.) and describing the existing situation. This may involve undertaking desktop research that
reviews recent statistics and reports (e.g. by government departments, universities, donor agencies,
regional and international organisations, NGOs etc.). The situation analysis will provide the context
around the issue of concern. Depending on the information available, such as recent statistics, it may
also provide ‘baseline’ data from which you can measure change against.
Step 2. Stakeholder analysis The stakeholder analysis is about identifying individuals, groups and organisations that those that
are directly targeted by the proposed project, or can affect it (either positively or negatively), and
those that may ultimately benefit from the project’s outcomes.
When identifying stakeholders, it is important to consider potentially marginalised groups, such as
women, the elderly, youth, the disabled and the poor, so that they are represented in the process,
especially if the issue will affect their lives. Assessing how projects impact on gender roles is a key
concern of funding agencies.
Applying a gender lens to project design
Some key questions to ask yourself in the stakeholder consultation phase are:
‐ How are men and women impacted differently by the problem?
‐ How will men and women benefit from the project? Will they face differences in their access to the
benefits?
‐ Are differences expected in roles and responsibilities relating to the project?
‐ Have all stakeholders had an opportunity to provide input to the project design? How will they
continue to input to design, implementation and M&E?
The Pacific Gender and Climate Change Toolkit can assist you in understanding how to apply a
gender lens to your project.
http://www.pacificclimatechange.net/index.php/eresources/documents?task=showCategory&catid
=137
The views of different stakeholders can be documented in a stakeholder matrix (Table 1). This can
inform the project design, to ensure that stakeholders’ interests are accommodated or managed.
A stakeholder map (Figure 1) allows you to plot stakeholders based on their ‘power & interest’ and
this can help you prioritise your level of engagement with them. Interest relates to the stakeholder’s
level of interest in the issue. Power refers to their ability to facilitate or prevent change from
happening.

Logical Framework Approach Part II – Learner Guide © SPC 2015 4
Stakeholders with a high level of power and interest in your project, or the issue of concern, need to
be managed closely. This could involve them being part of a reference group or steering committee.
Other stakeholders may need to be kept satisfied, such as through regular project updates, and the
ability to respond to their issues/concerns as they arise.
Stakeholders with little power or interest do not require much time/effort to be spent on them.
Table 1. Stakeholder matrix
STAKEHOLDER STAKE IN THE ISSUE
(how are they impacted, or how can
they affect the issue)
LEVEL OF ENGAGEMENT WITH
STAKEHOLDER
(based on their influence‐ see
stakeholder map)
Stakeholder 1
Stakeholder 2
Stakeholder …….
Figure 1. Stakeholder map

Logical Framework Approach Part II – Learner Guide © SPC 2015 5
Step 3. Problem analysis The problem analysis is a critical thinking process that identifies the cause‐effect relationship. The
result is commonly known as a ‘problem tree’.
A problem analysis should ideally be undertaken as a participatory process involving those
stakeholders who are knowledgeable about the topic of concern and those that have the greatest
influence on a project’s likely success, including the target group and ultimate beneficiary.
Depending on the relationships between stakeholders, and practicalities, it may be necessary to
undertake several problem analyses with various stakeholders, and for the project team to analyse
these and consolidate them into a single problem tree.
The problem analysis process is as important as the final product (the
problem tree) in that it requires the stakeholders to critically analyse
and reflect on the causes to a specified problem. By having different
stakeholders present, different views and interests can be expressed
and this can be a learning and empowering process for all those that
take part.
The problem tree that is produced should be a robust but simplified
version of reality.
The problem tree cannot be too complicated or it will not be useful as
a guide to tackling the problem.
“In many respects the problem analysis is the most critical stage of project planning, as it then
guides all subsequent analysis and decision‐making on priorities.” (EC, 2004).
In identifying the causes to a problem, it helps to have a basic understanding of behaviour change as
changing an aspect of the human condition is critical to most development issues. Behaviour change
goes beyond providing more knowledge about what to do, or why to do something. Other factors
may have an important role in resistance to change.
The Theory of Planned Behaviour (Ajzen, 1991) describes three critical factors that determine the
likelihood of a desired behaviour taking place. These are:
Personal beliefs A person’s beliefs whether a specific behaviour will have a positive or negative outcome. This will determine whether the person has a positive or negative attitude to the specific behaviour.
Normative beliefs What people who are considered important to a person (e.g. family, peers, leaders) think of a specific behaviour.
Control beliefs The internal and external factors that facilitate or prevent a specific behaviour taking place. This includes infrastructure, laws, or a person’s real or perceived capabilities/skills to undertake the specific behaviour.

Logical Framework Approach Part II – Learner Guide © SPC 2015 6
It is useful to keep these factors in mind when thinking about causes to a problem, in that it may not
just be a ‘lack of knowledge’ that prevents a desired behaviour from taking place, but also norms
and the presence of infrastructure or regulations.
Community‐based social marketing (CBSM; McKenzie‐Mohr, 1999) is a framework to design
behaviour change interventions. CBSM outlines a range of ‘tools’ designed to overcome barriers to
behaviour change. These are also useful to keep in mind in developing the problem tree, solution
tree and the logframe matrix.
For more information on behaviour change, visit:http://www.evaluationtoolbox.net.au/ ‐ look under the ‘behaviour change’ tab http://www.cbsm.com/ http://www.behaviourworksaustralia.org/
How to undertake a problem analysis
The steps to undertake a problem tree are:
1. Get participant agreement on what the core problem is. Once a problem statement has
been settled on, it may need to be rephrased so that it is specific to a target group and place
(who, what, where).
How to write a problem statement
A problem statement should be phrased as a specific negative situation related to the human
condition (development or environmental issue). It should also not be the absence of a solution. For
example, ‘high rates of water‐borne diseases’ is a problem, whereas ‘no rainwater tanks’ is not. The
latter implies providing water tanks on its own will fix the problem.
A problem statement should not be too broad. The problem should be able to be overcome as a
result of your project.
The problem statement now has to achieve the ‘who, what, where’ criteria: ‘high rates of water‐
borne diseases in children under 11 years of age in Salamanca’

Logical Framework Approach Part II – Learner Guide © SPC 2015 7
2. Once the core problem is settled on, the participants identify the hierarchy of causes and effects (see figure 2 below). Causes are placed below the problem, and effects above. Identify the causes. Start with the core problem and ask ‘what is the cause of this’. List each of the possible causes underneath the problem statement. All causes should be worded as negative statements. For each cause identified, again ask ‘what is the cause of this’ and document those sub‐causes underneath. The identification of causes may lead to considerable discussion, and ‘cause statements’ may be moved about as a result. It is important that there is general agreement before moving statements around. If there are two or more causes, these can be placed at the same level. Identifying effects. Start with the core problem and ask ‘what is the effect of this’. Write all the effects of the problem above the core problem. For each effect, again ask ‘what is the effect of this’ and continue to branch upwards The process of identifying causes and effects keeps going until there are no more additions. An example of a problem tree for a water quality‐focussed projects is presented in Figure 3.
Figure 2. Identifying the causes and effects of a core problem
3. Review the problem tree that has been created. Any gaps should be noted and rectified by adding causes or effects. Once this is done, the problem tree needs to be copied onto paper, or into a software package (e.g. DoView ® http://www.doview.com/ . Arrows should be added to connect causes and effects.
1. Read the handout for the Toktoklau case study and identify the broad issue of concern and its context, who the stakeholders are, and what the problem may be.
2. Fill in the missing boxes for causes and effects in the Toktoklau problem tree handout.

Logical Framework Approach Part II – Learner Guide © SPC 2015 8
Figure 3. Example problem tree for a water quality-focussed project

Logical Framework Approach Part II – Learner Guide © SPC 2015 9
Step 4. Solution analysis The solution analysis flows on from the problem analysis, and can be undertaken as part of the same
workshop. It requires flipping negative statements in the problem tree into positive ones to form a
solution tree.
How to undertake a solution analysis
1. Reword negative statements into positive ones. Don’t be afraid to reword the statements as
required so they make sense.
The core problem in the middle of the problem tree gets converted into the core objective
or purpose of the project in the solution tree.
The cause‐effect relationship from the problem tree is converted into a means‐ends
relationship in the solution tree.
For example, the core problem ‘high rates of water‐borne diseases in children under 11
years of age in Salamanca’ gets reworded into the core objective (purpose) ‘Reduced rates
of water‐borne diseases in children under 11 years of age in Salamanca‘. An example of a
solution tree building on the problem tree in Figure 3 is presented in Figure 4.
All of the different branches below the core objective (purpose) are now as a possible
solution pathway that can assist to achieve the core objective. You can also remove certain
pathways if they are not logical.
2. Review the means‐ends relationship. Questions to ask include:
Will the activities lead to the outputs?
Is the purpose achievable? Will the outputs lead to the purpose being achieved?
Are there gaps in the logic? If so, add a step where necessary.
3. Once there is a general agreement on the solution tree, transfer it onto paper or a software
programme.
Fill in the missing boxes, building on the problem tree handout, to complete the means‐end relationship in the Toktoklau solution tree handout.

Logical Framework Approach Part II – Learner Guide © SPC 2015 10
Figure 4. Example solution tree for a water quality-focussed project

Logical Framework Approach Part II – Learner Guide © SPC 2015 11
Step 5. Strategy analysis – selecting the solution The strategy analysis involves selecting the best solution for the documented problem. This may
involve the use of tools like Cost Benefit Analysis to choose which solution pathway(s) from the
solution tree represents the best solution to the problem. This step may also involve reviewing the
solution tree created in the previous step and analysing the different solutions (or means) to achieve
the core objective or purpose. This may involve reviewing the options against a set of criteria. For
example:
The expected contribution of different solutions to the strategic objectives and priorities of
both the project proponent and funding organisation
The complementarity with existing or planned projects
Lessons learnt from previous projects, and reviews of best‐practice
Preferences of key stakeholders, including the target group and project partners
Benefits to the target group, and ultimate beneficiaries
Cost efficiency and technical feasibility of implementation
The sustainability of different approaches (i.e. the likelihood that benefits will be maintained
without further intervention)
Environmental, social and economic impacts.
The strategy analysis will select one or more solution pathways for the project to implement. Mark
or circle the chosen solution pathways on the solution tree. The chosen solution pathways will form
the basis of completing the logframe matrix.
If pathways are not tackled by your project, these can be considered assumptions (which are
discussed in greater detail in the logframe section), which are things that may need to occur beyond
the scope of your project for your core objective to be achieved.
Identify what strategy you would select for the Toktoklau project by circling the pathway(s) on the solution tree handout, and write down what criteria you used to select this strategy.
The ‘Integrated Planning Process, Project Design & Proposal Writing Guide’ by the American Red Cross (2006) explains two tools to guide the selection of strategies‐ see pages 17 & 18. http://ngolearning.org/evanspmclass/Shared%20Documents/RedCrossLogframes.pdf SPREP PACC Technical Report No. 1 ‐ Informing climate‐resilient development: the application of cost‐benefit analysis (CBA) in the PACC programme ‐ Experiences and lessons learned on capacity building https://www.sprep.org/attachments/Publications/CC/PACCTechRep1.pdf SPREP PACC Technical Report no. 2 ‐ Informing climate‐resilient development: the application of cost‐benefit analysis (CBA) in the PACC programme ‐ Experiences and lessons learned in the application of CBA to PACC demonstration projects https://www.sprep.org/attachments/Publications/CC/PACCTechRep2.pdf

Logical Framework Approach Part II – Learner Guide © SPC 2015 12
Step 6. Logframe matrix The logframe matrix displays the key elements of a project design and their relationships to each
other in a way that facilitates project analysis, and guides project implementation and monitoring
and evaluation.
The logframe matrix is generally presented as a table as laid out below (Table 2). The terminology
used in the matrix can differ between organisations but the principle remains the same. It is
therefore important to clarify amongst project partners, funders and other stakeholders the
terminology to be used.
Table 2. Example logframe matrix
Project Description
Indicators Baseline Target Source of verification
Assumptions
Goal
Purpose
Outputs
Activities
Definitions for the project description column
Goal This is the longer term outcome that the project will contribute to. This should reflect national priorities e.g. contribute to national sustainable development strategy…
Purpose This refers to the development outcome the project will achieve. This may include changes in behaviours, knowledge, practices, capacity, enabling environments that the project will achieve. Generally written in the past tense, and use verbs like: decreased, increased, strengthened, enhanced, improved e.g. increased renewable energy production, reduced coastal erosion, enhanced food production etc. The core objective from the solution tree should help guide the purpose statement.
Outputs The products and services a project will deliver. Generally written in the past tense e.g. solar panels installed, coastal revetment constructed, training delivered etc.
Activities The things that are done with the inputs as a means to deliver the outputs, and accomplish the desired outcomes. Generally written in the present tense e.g. install solar panels, train people, develop materials, run workshops etc.
The baseline and target can be split from the indicator

Logical Framework Approach Part II – Learner Guide © SPC 2015 13
In developing a logframe matrix, the following points need to be considered:
The matrix should provide a summary of the project design, and its length will be dictated by
the project’s complexity. It should generally be between one and four pages in length.
If the logframe is too long, the project may not be focussed enough. If the logframe is too
short, it may be missing parts.
The matrix should only describe the main activities. The detailed activities should be
documented separately in an timeline.
The contents of the matrix will be guided by the selected strategy (solution pathways). The higher
level ends (top section of solution tree) will help form the goal. The purpose will be informed by the
middle of the solution tree (purpose). The outputs and activities will be based on the means (chosen
solution pathways in the bottom section of the solution tree).
Elements from the selected strategy may need to be re‐written as they are transferred into the
matrix.
Project description
The contents of the project description column outlines the project’s objectives hierarchy, or the
logic that supports the project. It shows the relationship between a projects activities, outputs,
purpose and goal. This is also known as the vertical logic. It describes, reading from the bottom‐up,
how the project will achieve its ends.
Inputs are generally not included in the project description column. They can sometimes be included
adjacent to the activities (in the indicator column) and a high level summary of the budget may then
be included in the means of verification column.
Assumptions
Assumptions refer to key factors outside the direct control of the project team which must hold true
if the project is to deliver its outputs and achieve its purpose and progress towards the goal. If the
assumptions do not hold true (certain events do not occur), then this may have a negative impact on
the project. Identifying assumptions (or risks) are critical as these may have a strong influence on the
project’s likelihood of success.
Assumptions form part of the vertical logic of the matrix (Figure 5). Note that there are no
assumptions for the ‘goal’ and thus the assumptions column is left blank.

Logical Framework Approach Part II – Learner Guide © SPC 2015 14
Figure 5. The project description and assumption outlines the intervention’s logic
An assumption is worded as a positive statement of a condition that must be met in order for the
project’s purpose to be achieved.
An assumption can also be seen as a risk to the projects if the assumption does not hold true. A risk
is an assumption reworded as a negative statement. A risk matrix can be used to identify which ones
to include as an assumption, or in the risk matrix (Figure 6).
A risk matrix can be used to guide which assumptions need to be included in logframe. This requires
turning assumptions into risks, and including into the matrix those that can be managed, and
excluding those that pose little risk (i.e. those that have a low impact and low probability of
occurring). An example of flipping an assumption into a risk is presented below
Assumption Risk Impact if risk
occurs.
Likelihood of the risk
occurring
Action to take
Solar panels are regularly cleaned of salt and other deposits
Solar panels are not cleaned regularly
High – the efficiency of the panels will be reduced resulting in increased operation of the back‐up generator.
Low‐ a cleaning schedule has been developed and staff trained in how to clean the panels.
What action should you take to reduce the likelihood of the risk happening? What action will you take if the risk does happen?
Note that risks that have a high likelihood of occurring, and have a high impact, should lead to the
project being redesigned, as these are likely to impact the project’s success.
Assumptions have to be carefully specified and worded to allow continuous monitoring.
For example:
If you purchase solar panels (activity)
AND the panels are delivered on time
because there is reliable transport
(assumption) THEN the solar panels
will be installed on time (output)
GOAL
PURPOSE

Logical Framework Approach Part II – Learner Guide © SPC 2015 15
Figure 6. A risk matrix can be used to guide the selection of assumptions
Indicators
Indicators provide a means to assess the project’s progress and success. This is especially important
for the purpose and goal, as these may be interpreted differently by various stakeholders.
One way to think of indicators is to visualise what a successful project would look like, that is, what
conditions would be met if the project was successful.
Indicators need to be closely linked to what you are trying to measure, so that you are confident that
your project’s work was an important factor in the observed result.
Indicators should ideally meet the following criteria.
Valid Does the indicator measure the result?
Precise Do stakeholders agree on exactly what the indicator measures?
Practical, affordable, and simple Is information actually available at reasonable cost? Will it be easy to collect and analyse?
Reliable Is it a consistent measure over time?
Sensitive When the result changes, will it continue to be susceptible to change?
Useful Will the information be useful for decision‐making, accountability, and learning?

Logical Framework Approach Part II – Learner Guide © SPC 2015 16
Identifying valid and reliable indicators for the project’s goal may require careful consideration and
stakeholder input, as the outcomes at the goal level may take time to be achieved. As such, you will
need to identify an indicator(s) that can be measured within the project funding period.
You cannot use indicators from a lower level to demonstrate achievement of a higher level
objective. For example, the indicator for ‘solar panels installed’ (output level) cannot be used as
proof that the purpose (e.g. increased renewable energy generation) has been achieved. In such a
case, the indicator for purpose could be ‘number of kWh generated per day from solar panels’.
There should be more than one indicator selected for each level of the vertical logic, but there
should not be too many. The number of indicators to choose should be guided by the confidence
required to demonstrate achievement of that particular level of the objective hierarchy. Between
two and five indicators is generally sufficient.
Indicators can then be made more specific by identifying baseline and target measures. The
indicator can make reference to the target (and baseline) or these can be separated out from the
indicator and placed in separate columns, either in the logframe, or later on when you develop a
monitoring plan.
Baseline and targets must be specific. This means that they need to specify the quantity of change
expected, the quality of the desired change, and the timeframe in which the desired change is to
occur. You can remember this as QQT (for Quantity, Quality, Timeframe), or SMART (Specific,
Measurable, Achievable, Relevant, Timely).
The targets may be informed by existing strategies or action plans. Targets can be further broken
down into 6‐monthly, annual, or other timeframes so as to determine a measure of progress for the
project (more about this in the monitoring section).
Both quantitative and qualitative indicators should be used where possible. Generally, indicators
are not included for activities.
Quantitative and qualitative data
Quantitative Qualitative
Quantitative refers to numerical data (e.g. number of people trained, number of rain tanks installed etc.). Quantitative methods can reach large number of people, and generally involve a short interaction. The popularity of collecting quantitative data reflects the old adage “that you can’t manage what you can’t measure”.
Qualitative data deal with words or communication (whether that is text, voice, or visual). Qualitative research seeks, amongst other, to find out what people are doing and why they are doing it, or what stops them from changing, and how they see their role and actions in the wider scheme of things. Qualitative methods generally involve a longer personal interaction, and reach a lower number of people. Qualitative evaluation trades off collecting information from few respondents with more in‐depth and quality information.

Logical Framework Approach Part II – Learner Guide © SPC 2015 17
Source of verification
Source of verification refers to where the information for indicators will come from (survey report,
meeting minutes, commissioning documentation, purchase records etc.).
In determining the source of verification, the project team should consider whether appropriate
sources already exist. Where new sources are required, it is important to consider the cost of data
collection, as well as how valid and accurate the data collection process is.
Where indicators relate to a specific change in a condition, baseline data (what is the current state of
things) may be required. This will mean that the means of verification requires both baseline and
post‐project data and data sources. The indicators and sources for the baseline and post project
data may be the same, however you will obviously collect the data at different times in the project.
Complete the logframe matrix for the Toktoklau case study by filling in the missing elements in the handout.
Reviewing the logframe matrix
Once drafted, the logframe matrix should be reviewed to assess the:
Vertical logic ‐ whether the means‐end relationship (column 1) and assumptions (column 4)
makes sense
Horizontal logic –what elements of project design will be measured and how
It is important to remember that the matrix represents broad steps, and not a detailed project plan.
It is also important to remember that the LFA is an iterative process, and the matrix should be
reviewed on a regular basis during the project’s implementation, and changes made accordingly.

Logical Framework Approach Part II – Learner Guide © SPC 2015 18
SECTION 2. MONITORING YOUR PROJECT The logframe matrix provides the foundation for what you need to monitor during the project
implementation to make sure you are on track. Regular monitoring is critical for good project
management, as it allows early detection of issues so that they can be rectified (Figure 7). This is a
process called adaptive management, whereby the implementation learns from experience, and
minor changes, or sometimes major ones, may be made to ensure that the outcomes of the project
have the best chance of being achieved.
A project design should identify how the project will be monitored, as this can influence the overall
budget. It also puts the project on a good footing to be implemented as soon as the funding is
secured.
Figure 7. Monitoring allows continual improvement during the project implementation
Monitoring plan A monitoring plan identifies and defines how monitoring data will be collected, how often, and by
whom (Table 3). It builds on the logframe matrix by providing the project team a more detailed
guide to facilitate the collection of data.
The definitions of the column headings and an example are provided below the monitoring plan.
Monitoring against logframe

Logical Framework Approach Part II – Learner Guide © SPC 2015 19
Table 3. A monitoring plan
Level Indicator Baseline Target Source of verification
Data collection methodology
Frequency of data collection
Person(s) responsible
Goal
Purpose
Output 1
Output 2
Output 3
Level All the contents of the level column are taken from the logframe matrix.
e.g. Purpose: Low rates of water‐borne diseases in children under 11 years of age in Salamanca
Indicator Taken from the logframe matrix. There is also an opportunity to add more indicators if you feel it would help measure success, or change them. If you change or add indicators, make sure this is also reflected in the logframe matrix.
e.g. number of children under 11 years of age from Salamanca presenting at medical clinic with water‐borne diseases
Baseline Refers to the measure before the project is implemented.
e.g. 100 children per year (2014) (presenting at medical clinic with water‐borne diseases)
Target This refers to the change you want to achieve by a certain time (e.g. end of the project).
e.g. 75% reduction from baseline level by 2016
Source of verification This refers to where the information or results will be reported. This is often different from the data collection methodology.
e.g. Mid and end‐of‐project reports, Legislation, Ministry of Health report, reports
Data collection methodology
This refers to the specific process/tool to collect the raw data (that can be reported on in the source of verification). The data collection methodology is where monitoring costs may be attributed to.
e.g. Questionnaires, Water quality testing, Review of clinic admission statistics
Frequency of data collection
This refers to how often the data will be collected. This can differ from how often it will be reported. For example, you may collect data monthly, but only report on it quarterly or annually.
e.g. Monthly
Person(s) responsible This refers to the person(s) responsible for collecting the data, or making sure the
e.g. Monitoring and Evaluation Officer

Logical Framework Approach Part II – Learner Guide © SPC 2015 20
data is reported in the source of verification.
Note that monitoring for the ‘goal’ level can be difficult, as the project will only contribute to
achieving the goal, and this may take some time for outcomes to be visible. Identifying valid and
reliable indicators for the project’s goal may require careful consideration and stakeholder input.
Data collection methods Identifying and/or establishing practical and affordable data collection methods is key to
implementing a useful monitoring plan. Data collection that is difficult to undertake, or requires
specialist skills that are not readily available within the project team, or is expensive, is less likely to
be done.
Remember that data collection does not necessarily mean collecting new data. The first thing to
check is whether someone else (e.g. a government department, or other organisation, such as clinics
or hospitals) is collecting the data you need. In such cases, the project’s role is to access the data
source and report on it.
Collecting new data may be undertaken in a range of ways. Projects should seek to include a range
of data collection methods, including capturing both quantitative and qualitative data. This has a
number of benefits, including avoiding bias, and verifying the results from different means.
A number of data collection methods are presented below.
Counts
Undertaking counts is a useful way to track easily visible outputs and outcomes (e.g. people
attending training or workshops, number of water tanks installed, number of management plans
created, number of mangrove trees growing in a coastal revegetation etc.).
It is useful to develop templates for undertaking counts so that recording of data is undertaken in
the same manner over time and across different people (e.g. Table 4).
Table 4. Example template for recording mangrove regeneration project
Date Location / Site Lat/Long
12 June 2014 Itakaki village, Roanga 19.65 S, 154 W
Number of mangroves <0.5m high per 10m2
4 Notes: yellowish foliage on two of them
Number of mangroves 0.5m to <1m high per 10m2
6
Number of mangroves 1m+ high per 10m2
2 Notes:
Total number of mangroves per 10m2
11 Notes:

Logical Framework Approach Part II – Learner Guide © SPC 2015 21
Forms or templates formally record the data, and provide a ‘paper trail’ for external evaluators if
required. Photographic evidence can also be used to complement recording forms.
Counts obtained during project implementation, and post‐project, can be compared to baseline data
to track the project’s achievements and status.
Water quality testing and other specialised counts
Some monitoring may require specialised equipment or facilities. For example, water quality
improvement projects may require water quality testing to assess the number of households with
access to ‘clean drinking water’ based on meeting national or international standards. Water quality
testing can be undertaken by taking water samples for laboratory analysis, or using more simple
methods such as Hydrogen Sulfide Testing kits (H2S strips), though studies indicate that the accuracy
of the H2S test results can be variable1.
Develop a simple template for counts related to a project of your choice.
Questionnaires
Questionnaires are a common tool to gather data from a large number of people. Questionnaires
can seem easy to prepare, but it is important to put careful thought into designing a good
questionnaire. A good questionnaire can be a powerful tool to inform your evaluation, and a poorly
designed questionnaire can make life difficult for both those that have to complete it, and those that
have to analyse the data.
Timing of questionnaires You should consider what sort of information you want to obtain from your questionnaire at the
project design stage so that you can plan when you deliver questionnaires. For example, you may
need to deliver a baseline questionnaire to obtain data before the project. This will allow you to
compare your results against the baseline state. Different methods to implement questionnaires are
summarised below:
Baseline questionnaire Taken before the project is implemented, either at the project analysis or design stage. Allows comparisons to be made between the baseline and the project’s intervention. You need to consider the sample size to ensure that results are statistically valid. This methodology should be used for larger projects. Can also inform the stakeholder analysis step, problem tree, and strategy analysis.
1 www.who.int/water_sanitation_health/dwq/WSH02.08.pdf
http://onlinelibrary.wiley.com/doi/10.1111/j.1365-3156.2011.02887.x/abstract

Logical Framework Approach Part II – Learner Guide © SPC 2015 22
Post‐questionnaire Allows reporting of changes resulting from a project. This is best accomplished if baseline data already available from a questionnaire, or from other sources. A post‐questionnaire on its own can be used where monitoring resources are limited, but care must be taken in wording questions, and interpreting results.
Retrospective post then pre‐questionnaire
Overcomes some of the constraints of not having baseline data by seeking to capture the pre‐existing condition in the same questionnaire as the post‐project condition. Can be used where monitoring resources are limited.
Delivery formats and delivery methods Questionnaires can be delivered in a variety of formats, including paper‐based, online, and using
‘smartphones’. The delivery method can also differ, such as respondents completing the
questionnaire themselves, or an interviewer (or enumerator) asking questions either face‐to‐face
with the respondent, or over the phone. In such cases, the interviewer writes down answers based
on what respondents say.
The pros and cons of paper‐based and smartphones are summarised below. Large, well‐resourced
projects should consider investing in several smartphones as these will make monitoring easier and
timelier.
Paper‐based questionnaire
Pros Cons
Relatively low‐cost and easy Does not require technology Questionnaire can be left at household for them to fill out in their own time and picked up later.
May need to print out many pages Paper can be easily damaged, lost etc. Data needs to be entered manually, increasing the possibility of data entry errors, and time taken to analyse and obtain results
Smartphone questionnaire
Pros Cons
Does not require carrying around large amounts of paper Changes to questions can easily be made without reprinting lots of questionnaires Allows timely analysis and reporting of results
Access to smartphonesRequires access to an internet connection for uploading data and downloading results (at the end of the day or when all surveys completed) Requires some training to design questionnaires and upload to server and phones

Logical Framework Approach Part II – Learner Guide © SPC 2015 23
Field Task‐ an open source smartphone questionnaire application
Field Task, developed by SMAP Consulting, is a free open source survey questionnaire application for
Android‐based smartphones and tablets. The android device does not need to be connected to a
network when collecting data, which means you can use it in remote areas. Completed
questionnaires are stored on the phone, and can be uploaded once the smartphone gets a network
connection.
Field Task allows you to design questionnaires with both open‐ended (type in answers) and closed
questions (select from a range of possible answers). In addition, you can take photos, record audio,
and record the position where the interview took place using the GPS in the smartphone.
Field Task can be downloaded from the Google Play store. It requires a SMAP Server which stores
the survey templates and collected data. SMAP Server is also open source and can be downloaded
from the SMAP Consulting website [www.smap.com.au]. Alternatively, for a small fee, SMAP can
host your server for you. Training slides for using Field Task are also available from the SMAP
website.
See SMAP Consulting for more on Field Task, including videos and downloads http://smap.com.au/ Field Task training documentation can be downloaded from http://smap.com.au/downloads.shtml
Questionnaire invitation and instructions The questionnaire invitation and instructions should clearly outline why you want people to take
part, and the importance of their participation.
It is important that you have clear instructions at the start of the questionnaire that explains:
the purpose of the questions
who the information is for and how it will be used
the confidentiality of the answers, and any other information regarding ethics, etc.
It is also important to have clear instructions as to how to answer questions. Instructions need to be
provided at the start of each new section that uses a different answering format or response scale.
Things to consider in instructions include whether you want respondents to:
select one answer only
select all that apply
rate the answers
provide a statement to an open‐ended question.

Logical Framework Approach Part II – Learner Guide © SPC 2015 24
Layout The layout of questionnaires is very important if people will be responding to it themselves.
Things to consider include:
Making sure the layout does not look cluttered. Use adequate spacing between questions.
Ensuring the questions are numbered and presented in a logical sequence. Group questions
by topics or themes.
Starting with easier or less controversial questions and finishing with more personal
questions, including demographic details such as age and income.
Using larger or bold font to attract attention to headings or instructions.
Using shading or colour schemes to group similar questions.
Length People generally do not want to take too much out of their day to answer a long questionnaire,
unless there is an incentive to do so. As such it is important that you consider how many questions
you will be asking, and how long it takes to respond to the questionnaire.
The length of the questionnaire will be dictated by the questions you need to have answered. This is
in turn informed by your monitoring plan, which identifies indicators, and data collection methods.
You need to clearly differentiate between information you need versus information you want to
collect.
Ideally, questionnaire should not take longer than 15 to 20 minutes to complete. After that, you may
want to consider providing an incentive to complete the questionnaire (e.g. providing food etc. if
visiting a community).
Wording and types of questions The wording of questions is critical in ensuring you obtain the information required to answer your
questions. This includes:
using language that is appropriate to the audience
using clear, simple questions that avoid ambiguity, double meanings, and jargon,
avoiding leading questions that can lead to bias.
Questions can fall into the following categories:
Open‐ended
question
A question where the respondent creates their own answer. This allows
respondents to think about the question, provide suggestions, or test
their knowledge, but it is harder to analyse.
Close‐ended
question
A question where the respondent has to select their answer from the
range of responses provided. The range of responses can vary from two‐
option answers, to ratings, ranking, or statements.

Logical Framework Approach Part II – Learner Guide © SPC 2015 25
There are several options of close‐ended questions:
Select from a
range of answers
Respondents need to select one, or multiple options (e.g. select top two,
or select all that apply), from a number of independent or unique
answers. This requires you to know the range of relevant choices.
Alternatively, you may add an ‘other’ category with an open field, but
you want to limit the number of people selecting this response, as it
would otherwise make more sense to leave the question as an open‐
ended question.
E.g. What sources of drinking water do you use?
o Bore water o Household water tank o Community water tank o Bottled water o Other (please specify)
Would you make this a select one, or select all that apply?
Two option response
Respondents need to make a defined choice (e.g. YES/NO). Care needs to be taken to make sure that respondents are not left unsure as to how to respond to the question. E.g. If you use bore water, do you always boil it before drinking?
o Yes o No
Asking ‘Do you boil bore water?’ and only providing Yes/No is less clear, as the question does not specify boiling for ‘drinking water’. Bore water may be used for washing and it may not be boiled in such a case.
Rating scale Respondents to select the most appropriate point on a scale. Scales can range from 3 points to 10 points. 5 point scales are the most commonly used. 7‐point scales are becoming more common as they provide respondents with a greater ability to discriminate between choices. Odd‐numbered scale provides a mid‐point (e.g. uncertain or neutral). E.g. How would you rate the quality of the solar water purifier?
Excellent Good Fair Poor
o o o o
E.g. The training workshop provided me with the skills to maintain my rainwater tank.
Strongly agree
Agree Neutral Disagree Strongly disagree
o o o o o

Logical Framework Approach Part II – Learner Guide © SPC 2015 26
Tips on wording questions:
Avoid double‐
barrelled
questions
Double barrelled mean asking the answer for two things in one question.
E.g. “Do you take action to save water and energy?” should be broken
down into two questions, one question about saving water and the other
above saving energy.
Be specific about
the subject of
questions
E.g. “Do you take action to save water?” can be broken down to specific
actions, such as re‐using washing water, taking short showers etc.
The same applies for attitudes and opinions‐ be as specific as possible in
order to obtain the information you want.
Be specific about
timeframes in
questions
E.g. In a questions such as “Have you taken action to save water in recent
months?”, ‘recent months’ may not be specific enough for your evaluation.
It may be best to use more specific timeframes, such as “Since the Water
workshop held in July, have you taken action….”.
Avoid leading or
loaded questions
E.g. “Have you stopped taking long showers?” is likely to lead to most
respondents answering “yes”. Further, a “yes” answer also does not
differentiate between those that were taking long showers, and have since
stopped, and those that have never taken long showers, but did not have
another option to answer.
Analysing responses Once the questionnaire response data is entered into Excel, or similar programme (for paper‐based
questionnaires), the data can be analysed using descriptive statistics (totals, averages etc.). Pivot
tables can be used to analyse and summarise a lot of data quickly. Some online questionnaire
programmes can provide simple descriptive analyses.
Online questionnaires
There are a number of software programs that allow you to develop online questionnaires. Some are
free, others not. Most are relatively easy to use. As with all questionnaires, it is important to pilot
them first to ensure that they make sense and that they work. Examples of online questionnaire
programs:
Survey Monkey [www.surveymonkey.com/]
Opinio [www.objectplanet.com/opinio/]
Survey Gizmo [www.surveygizmo.com/]
Zoomerang [www.zoomerang.com/]
Logical Framework Approach Part II – Learner Guide © SPC 2015 27
Develop a simple questionnaire (baseline or post‐project) related to a project of your choice.
QUESTIONNAIRES http://evaluationtoolbox.net.au/index.php?option=com_content&view=article&id=58&Itemid=154 OR http://tinyurl.com/oqh74cs
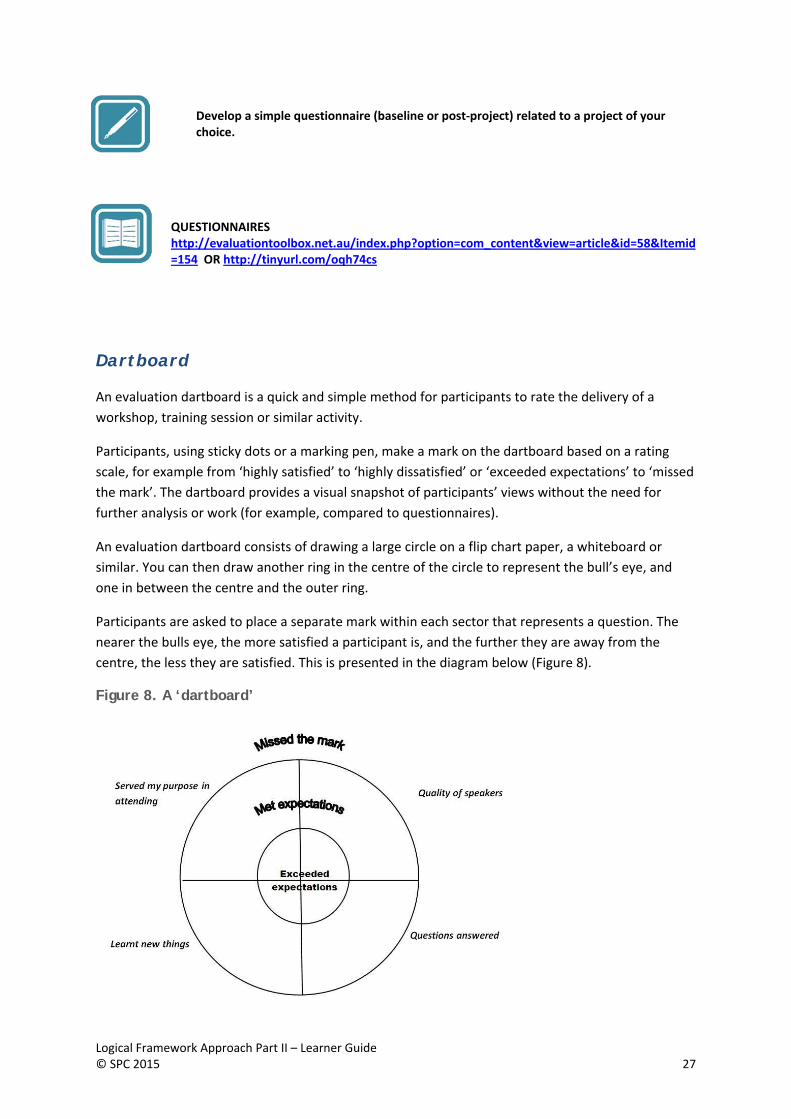
Dartboard
An evaluation dartboard is a quick and simple method for participants to rate the delivery of a
workshop, training session or similar activity.
Participants, using sticky dots or a marking pen, make a mark on the dartboard based on a rating
scale, for example from ‘highly satisfied’ to ‘highly dissatisfied’ or ‘exceeded expectations’ to ‘missed
the mark’. The dartboard provides a visual snapshot of participants’ views without the need for
further analysis or work (for example, compared to questionnaires).
An evaluation dartboard consists of drawing a large circle on a flip chart paper, a whiteboard or
similar. You can then draw another ring in the centre of the circle to represent the bull’s eye, and
one in between the centre and the outer ring.
Participants are asked to place a separate mark within each sector that represents a question. The
nearer the bulls eye, the more satisfied a participant is, and the further they are away from the
centre, the less they are satisfied. This is presented in the diagram below (Figure 8).
Figure 8. A ‘dartboard’

Logical Framework Approach Part II – Learner Guide © SPC 2015 28
A constraint of the dartboard is that it does not provide reasons why people thought aspects were
good, or not. As such, the dartboard can be complemented by asking people to provide notes on
‘what worked well’ and ‘what can be improved’.
Stories
Stories can be a powerful tool to capture how projects impact or change the target group or
beneficiaries, both positively or negatively. Stories can be captured in written format complemented
with photos, or using audio, or video. Stories can capture the emotion that comes from the changes
brought about by a project, which is often lacking in counts and questionnaires. However, capturing
stories takes time, so the number of stories that can be collected is often limited.
Storytelling has a number of benefits including:
Understanding the project from the viewpoint of the participants
Reflects the importance of context and its impact on outcomes
Allows the identification of unintended consequences
Provides a means to engage participants in evaluation.
Capturing stories can be undertaken by developing a few open‐ended questions that respondents
can answer. One such method is called ‘The Most Significant Change’ (MSC). MSC is a participatory
evaluation process that involves the collection of significant change stories at different levels of the
intervention (for example project staff, target group, beneficiaries) and collectively deciding on the
most significant change stories based on selected themes. The themes reflect broad categories, such
as change in capacity to take action, or a change in participation in an activity, as well as lessons
learned.
MSC stories can be collected by project staff, or members of the target group can be trained to
collect stories from their community. This may involve writing down answers, or using audio, or
audio‐visual recording (e.g. using the Field Task application mentioned earlier). Selecting stories
usually involves a hierarchical process, where the lower levels (e.g. those collecting stories from the
‘respondents’ select significant stories for the upper levels to review, and the upper levels select the
most significant ones from the lower levels.

Logical Framework Approach Part II – Learner Guide © SPC 2015 29
Framing a Most Significant Change question
The central part of MSC is an open question to participants, such as: ‘Looking back over the last 6
months, what do you think was the most significant change in the target group’s access to clean
drinking water?’
The question has six parts:
‘Looking back over the last 6 months…’ – It refers to a specific time period.
‘…what do you think was...’ – It asks respondents to exercise their own judgment.
‘…the most significant…’ – It asks respondents to be selective, not to try to comment on everything,
but to focus in and report on one thing.
‘…change…’ – It asks respondents to be more selective, to report a change rather than static aspects
of the situation or something that was present in the previous reporting period.
‘…in the target group’s access to clean drinking water…’ – It asks respondents to be even more
selective, not to report just any change but a change in the target group’s access to clean drinking
water.
MSC http://evaluationtoolbox.net.au/index.php?option=com_content&view=article&id=61&Itemid=157 or http://tinyurl.com/nophmpe
Interviews & focus groups
Interviews and focus groups are qualitative methods of inquiry that use a set of pre‐determined
questions to prompt discussion, and allow for the interviewer to explore particular responses
further.
Interviews generally have an interviewer and one or two respondents at a time. This can be done
face‐to‐face, or via phone.
Focus groups generally have a facilitator, and a note taker. Alternatively, answers can be audio‐
recorded. If an audio‐recording is used, it is important to make sure that it will work, and that
someone can transcribe the recording to text at a later stage.
Analysing interview/focus group notes or transcripts requires you to identify and interpret common,
recurrent and emerging themes.

Logical Framework Approach Part II – Learner Guide © SPC 2015 30
Establishing an indicator tracking table An indicator tracking table builds on the logframe matrix by extending the target column to identify
specific targets at regular stages of a project’s implementation (Table 5). The number, or regularity
of targets, may be based on the length of the project (e.g. greater time between intervals for longer
projects), or the risk‐level associated with the project (e.g. more regular tracking for riskier projects).
Regular monitoring against such targets allows the project’s status to be assessed. If the target is
being achieved, or surpassed, the project may be assessed as progressing to plan. If the target is
being missed, the project may need adaptive management measures, such as identifying why things
may not be working so well, and subsequently modifying activities, or putting more effort or
expenditure in certain areas. Not achieving targets may also signify that the targets were too
optimistic, but take care in revising targets downwards as this may lead to implementation issues
being masked.
Table 5. An indicator tracking table
Level
Indicator
Baseline
Financial Year 2015 Financial Year 2016 Notes
6 month target
6 month target achieved
12 month target
12 month target achieved
18 month target
18 month target achieved
24 month target
24 month target achieved
Goal
Purpose
Output 1
Output 2
Output 3
In the example presented below (Table 6), counts can be used for the output (count of solar water
purifiers installed), purpose (number of children presenting sick) and goal (number of children
failing). Counts can also be used for workshops or training events (e.g. number of people attending,
broken down by age, or sex etc.). A questionnaire can be used to assess the extent to which solar
water purifiers supply the household with drinking water.
It is possible to also add a ‘traffic light’ status to the indicator tracking table by highlighting in green
where you are tracking well (on target or surpasses) and highlighting in red where further work is
needed (where targets are not being achieved). This is demonstrated in the example in Table 6.

Logical Framework Approach Part II – Learner Guide © SPC 2015 31
Table 6. Example indicator tracking with results
Level
Indicator
Baseline
Financial Year 2015
6 month target
6 month target achieved
12 month target
12 month target achieved
Goal
Contribute to improved educational outcomes for primary school children in Akitaki
Test scores+
20% children failing
<5%
Purpose
Reduced rates of water‐borne diseases in children under 11 years of age in Salamanca
Reduction in children under 11yo with water‐borne diseases
+
100 children per year (2014)
> 30% reduction (<70 children)
27% (73 children)
>75% reduction (<35 children)
Output 1
Solar water purifiers installed # households with purifiers installed+
3 (2014) 25 20 50
% purifiers providing >90% of household drinking water needs++
66% (2014) 80% 85% 90%
+ Obtained by count
++ Obtained by questionnaire

Logical Framework Approach Part II – Learner Guide © SPC 2015 32
SECTION 3. DETAILED PROJECT PLANNING
Detailed project planning takes the information from the logframe matrix and builds on this to
identify the specific tasks required to do all the work in the project. Once all the tasks have been
defined, the project team can identify the resources required (staff, equipment, time etc.) and the
costs involved can be quantified. This enables a detailed project plan to be developed, with a clear
understanding of what is achievable within a project’s funding period and funding amount. Detailed
project planning consists of two main steps, developing a timeline and budget.
Step 7. Timeline Most people are familiar with a project timeline that lists project activities and graphically shows
when the activities and tasks will start and finish. A timeline can also be referred to as an activity
schedule or Gantt chart.
A timeline documents all the work that the project must complete to produce all outputs and
achieve the project purpose. The timeline must be detailed enough so that a member of the project
team, project partner or funding agency staff can fully understand what needs to happen in the
project. The timeline will also help the project team estimate how long the project will take to
complete and what resources (staff, contractors, materials, equipment) will be needed to undertake
the work within the project timeframe. The information from the timeline is also crucial to
informing an accurate budget.
The key steps to develop a timeline are listed below. These steps follow a process that will create a
list of project tasks on sticky notes, in a participatory team‐based approach. These are then used to
create timeline on a wall before copying the information into a spreadsheet. Other tools like
Microsoft Project, or the free GanttProject www.ganttproject.biz can also be used instead of Excel to
create your timeline.
It is possible to create your timeline directly in a spreadsheet, however, by skipping the steps below
you are likely to miss important tasks and you reduce your ability to involve the project team to get a
better end result.

Logical Framework Approach Part II – Learner Guide © SPC 2015 33
Steps to create a timeline
1. Breaking down activities into tasks – The Work Breakdown Structure
Activities are broken down into more detailed tasks using a Work Breakdown Structure tool.
2. Estimating task time Estimate how long it will take to complete each task.
3. Identify resources Identify the people (who and how many people, or organisation and position) responsible for delivering specific tasks. Identify what other materials and equipment are required to support the tasks.
4. Organise tasks into a timeline Identify estimated start and end date for each task. Identify task dependencies and what tasks can run concurrently. Create a timeline of tasks and activities.
5. Determine key milestones Identify the key events that provide a measure of progress towards meeting the targets.
6. Documenting your timeline in a spreadsheet
Copy the sticky note timeline into a spreadsheet
Each step will be expanded upon in further detail.
Step 1. Breaking down activities into tasks – The Work Breakdown Structure
The logframe matrix documented a summary of the key high level project activities required to show
how project outputs will be produced. To create the timeline we need break down each activity in
the logframe into smaller manageable tasks.
There are several alternative approaches to identifying detailed project tasks:
Top‐down approach
This is the approach used by the LFA and demonstrated in this guide. Each high activity in the logframe matrix is broken down into smaller tasks. The project team should be able to read the resulting tasks and understand what is required to carry out that piece of work. This includes understanding what resources (staff and equipment) are required, how long the task will take to complete.
Bottom‐up approach
The project team may brainstorm all the tasks they think are required to complete the project. Each task is written on a sticky note. Related tasks are grouped together and these would then correspond to higher level activities or outputs that are then named.
Mixed methods
Project teams can use both approaches to identify the detailed project tasks and compare the outcome before merging the two lists together. The top‐down approach is targeted and time‐efficient. However, using the bottom‐up approach can help identify miscellaneous tasks missed by the top‐down approach.

Logical Framework Approach Part II – Learner Guide © SPC 2015 34
Difference between an Activity and Task For the purpose of developing the timeline, it is useful to be able to differentiate between an activity
and a task.
Activity Task
High level unit of work. Summarises what needs to happen. Groups of activities produce project outputs. Can be broken down into two or more detailed tasks. Examples:
General statement to build something or deliver a key service.
1.1 Conduct household survey
1.2 Install water tank
2.1 Design new road
2.2 Construct new road
Low level unit of work. Clearly describes in detail what needs to be done. Detailed enough to accurately estimate work effort (number of days) to complete the task. Detailed enough to identify what resources (staff, tools, equipment and materials) are needed. Can sometimes be broken down further into multiple sub‐tasks Examples : 1.1.1 Recruit and train survey team 1.1.2 Develop questionnaire 1.1.3 Print questionnaire 1.1.4 Conduct survey 1.1.5 Analyse survey data and write report
For each item in the table, specify if you think it is an activity or a task. Explain your choice. Background context: The 2 year project costs $100,000 and is focused on increasing food security in response to increased drought events.
Item Activity
Task
Explain your answer
Research drought tolerant taro varieties
Run community awareness campaign
Build seedling nursery
Lease land for nursery
Establish drought tolerant agriculture demonstration pilot site
Install water irrigation system for seedlings
Plant taro varieties

Logical Framework Approach Part II – Learner Guide © SPC 2015 35
Introducing the Work Breakdown Structure A Work Breakdown Structure (WBS) is a tool that can help break down the activities into tasks and
where required, smaller sub‐tasks (Figure 9). Follow these steps to help you create a Work
Breakdown Structure.
a) Preparation. Write each of the project outputs and activities from the logframe matrix onto
an individual sticky note or small piece of paper.
b) Laying out. Stick the notes onto a table, whiteboard or wall in a similar layout to that
presented below. Leave some space between each group of activities.
Figure 9. Sample layout for outputs and activity sticky notes
Outputs 1. Water tanks installed
2. New costal road constructed
Activities
1.1 Conduct household survey
1.2 Install water tank
2.1 Road design completed
2.2 Construct new road
c) Review the list of outputs and activities. The logframe matrix contained only a summary of
the key outputs and activities so that it remained short and concise. The timeline needs to
include more detail and it provides an opportunity to add in more outputs and more key
activities if these were not included in the logframe. Add in any additional outputs if they are
needed to more accurately describe what the project will produce. Add in additional
activities if they help describe the key steps required to deliver the output(s).
For example, do you need additional outputs or activities to reflect any knowledge
management products that the project needs to produce (e.g. video documentary, photo
stories, technical guidelines, lessons learnt report, post‐project summary report). Each
knowledge management product could be a separate output, or knowledge management
could be a high level output and each activity could focus on the delivery of each product.
d) Breaking down the activities. Focus on each activity one at a time. Break down the activity
into two, three, four or more smaller tasks that when combined together will represent ALL
the work described by the activity. Write each task down on an individual sticky note and
paste it underneath the activity.
Don’t worry about getting all your tasks in the correct order. Don’t worry about assigning
numbers to your tasks.

Logical Framework Approach Part II – Learner Guide © SPC 2015 36
Need help to break down activities into tasks To help you break down activities into tasks you can use these techniques:
Involve people from different departments who will be doing the work or have done
similar work in the past. These people will have a good idea of the work that is required
to complete the project activities.
Ask the question “What small task needs to happen first to start this activity?”
Review the timeline from a similar project or a project with similar outputs. It may be
possible to copy over and customise relevant tasks (and activities) if they are similar.
Close your eyes and imagine what instructions you would need to tell someone else to
complete an activity. Each of these instructions might become a task, so have someone
else write them down on sticky notes as you speak them out loud.
Is there something that the activity should produce? If so, then then you need a task to
create that ‘thing’.
Is there any design or planning work that needs to be done before you create the
‘thing’? If so, this design / planning becomes a task.
Are there materials or equipment you need to create the ‘thing’? If so, you may need a
task to describe the purchase of these materials and equipment.
Do you need a task to transport materials or outputs? Only include these if they are
significant in terms of time, cost or really critical to the project.
Does the activity need to deliver a service of some kind (e.g. a survey, community
education or water testing)? IF so, think of all the tasks needed to deliver the service.
Do you need to recruit specialised staff or consultants to assist with these activities? If
so recruitment, advertising, interviews and contracting may all become tasks may all
become tasks.
Is there training required? If so you may need tasks to conduct a training needs analysis,
create a training program and another task to create the training resources. Other tasks
might be to book a venue and organise catering, send invitations and confirm
attendance. Some of these are very detailed tasks and you could argue that they are
best rolled up into one main task called ‘organise training’. Of course you will need a
task to ‘conduct the training’.
Ask the question “What small task needs to happen to finish this activity?” Is there a
need for some kind of review, quality control inspection, sign‐off or approval? If so, this
becomes a task too.

Logical Framework Approach Part II – Learner Guide © SPC 2015 37
Below we demonstrate how to create a simple Work Breakdown Structure for an output called
“Birthday cake” (Figure 10).
Figure 10. Simple Example - Baking a cake Work Breakdown Structure
Birthday cake
Find recipe
Buy
ingredients
Bake cake
Find cook book
Search cake
recipes
Select cake recipe
Search for ingredients at home
Write shopping list for missing
ingredients
Travel to
store
Buy ingredients
Prepare cake
Bake cake in
oven
Measure and weigh ingredie
nts
Mix ingredients together
Turn on oven
Place cake in oven
Remove cake from
oven
The baking a cake example shows how the output ‘Birthday cake’ was made by three key activities,
‘Find recipe’, ‘Buy ingredients’ and ‘Bake cake’. Each of these key activities was broken down into
smaller tasks. The ‘Follow cake recipe’ task was broken down into two small sub‐tasks to
demonstrate this process. In a real life project you need to follow some general guidelines and use
your judgement to determine if you need to keep breaking tasks down into smaller sub‐tasks. If we
were baking a real birthday cake there would an activity (and related tasks) to “Decorate the cake”
as well!
Another example of a Work Breakdown Structure is presented below for an example water security
project. Figure 11 below focuses only on one output.
Figure 11. Water security project Work Breakdown Structure
Outputs 1. Water tanks installed
Activities
1.1 Conduct household survey
1.2 Install water tank
Tasks
Recruit and train survey team
Develop survey questions
Print survey Conduct survey
Analyse survey data and write report
Design water tank system
Obtain materials quotes
Purchase materials
Construct tank foundations
Install tanks
Connect tanks to downpipe and pump
1. Place the outputs at the top 2. Place activities under the output
3. Break activity into tasks
4. If needed, break
tasks into sub‐tasks

Logical Framework Approach Part II – Learner Guide © SPC 2015 38
In the example above the output “1. Water tanks installed” had two activities that were taken from
the project’s logframe matrix. The project team broke the first activity “1.1 Conduct household
survey” down into 5 smaller tasks. If all the 5 project tasks are completed, then the related activity
“1.1 Conduct household survey” should also be fully completed. If all tasks shown in the work
breakdown structure are completed then the Output “Water tanks installed” should also be fully
delivered.
If it was a large project involving thousands of households and if it had a complex survey, then the
“Analyse survey data and write report” task might take several weeks to complete and require a
report review process before final sign‐off. If this were the case, then it would make sense to break
the task down into several smaller sub‐tasks, “analyse data”, “write draft report”, “submit report for
review” and “finalise report”.
e) Final checks
Does the WBS pass the 100% rule? The tasks in the WBS should include 100% (ALL) of the work
required by the project to achieve the project purpose documented in the logframe. If it
doesn’t, then go back and add additional tasks and activities.
Avoid duplication. There should be no duplication of work between different tasks or sub‐tasks.
For example, if you had tasks ‘deliver workshop at schools’ and ‘run school education program’,
then there is a high chance, the work in the first task will be also included in the second task.
Including project management and monitoring and evaluation All projects need to conduct project management, monitoring and evaluation. Chances are that
these tasks will be missing from your work breakdown structure. To add these tasks we recommend
you add a new Output called “Project Managed”, “Project Monitored” and “Project Evaluated”. Now
follow the steps of the WBS to break your outputs down into activities and tasks.
Some common activities and to consider are listed in the table below. You are not required to break
all these activities down into smaller tasks unless you feel it is required to estimate the time &
resources required. The purpose of adding these additional outputs is to get you thinking about
what core project functions need to be performed by the project. It may influence how many
project staff you decide to hire to support the project and its activities.
Project Monitored Project Evaluated Project Managed
Conduct a baseline, mid‐point and post‐program survey
Interview beneficiaries
Collect and document photos, stories, outcomes and lessons
Collect technical monitoring data (e.g. water or soil quality testing, crop yields)
Collect the number of people reached / benefiting
Update indicator tracking table
Complete project progress report – what’s working & what needs improving
Create evaluation report(s) mid‐point and end of project
Track expenditure against budget
Track progress against timeline
Track risks in risk matrix
Manage staffing (hiring)
Attend meetings
Produce 3, 6, 12 monthly reports
Financial acquittals / reconciliation
Revise logframe matrix & project design based on M&E
Manage procurement

Logical Framework Approach Part II – Learner Guide © SPC 2015 39
Is my task detailed enough or do I need to break it down into smaller sub-tasks? It can be difficult for new project managers to know when they need to break a task down
further into sub‐tasks. The flowchart below (Figure 12) will help you determine if your tasks are
detailed enough of if you need to break them down again into smaller more detailed sub‐tasks.
Figure 12. Flowchart to identify whether tasks need to be broken down further
At the end of the day use your judgement and common‐sense to decide if you should break tasks
down further into sub‐tasks.

Logical Framework Approach Part II – Learner Guide © SPC 2015 40
Steps 2. Estimating task time & 3.Identify resources
The Work Breakdown Structure tool helped identify all the work (tasks) required by the project. The
work effort and task duration to complete each task must now be estimated.
Difference between Work Effort and Duration.
Work Effort Duration
Number of days one person would need to work to complete the task or activity. The use of machinery (v’s manual labour) will reduce the work effort. The use of experience skilled staff will also reduce the work effort.
Number of calendar work days required to complete a task or activity. Can be less than, greater than or equal to the task work effort depending on influencing factors. Factors influencing the duration include the number of people that can work on a task at the same time; and the need to wait for other people or things to happen before you can complete the task (e.g. waiting for cement to set). Weekends or non‐work days are not included in the duration
Examples One person working full time will take 10 days to install five rain water tanks. The work effort is 10 days. The task duration is also 10 calendar days. Two people working full time will take 5 days each to install five rain water tanks. The work effort is still 10 days (2 people x 5 days each), however the task duration has been reduced to only 5 calendar days. If there is only one worker and they must wait 3 days for a cement slab to set before installing the tanks, then the work effort still remains at 10 days. Waiting for cement to set does not create any additional work for the person employed. The task duration will increase to 13 days with 3 days waiting for the cement to set and 10 days to install the tanks.
How do you estimate work effort? There are many ways to estimate the work effort to complete a task and some of these are outlined
in the table below. Most projects use a combination of subjective (guessing) and empirical (past
experience) to come up with an accurate task duration estimate.

Logical Framework Approach Part II – Learner Guide © SPC 2015 41
Estimation technique
Description
Subjective Relies on guessing and the perception of the person of team doing the estimation. For example, the project team guess that it will take 2 weeks to lay the foundations for a new road, but no‐one is really sure. Two weeks feels about right.
Comparative Based on past projects to produce similar outputs or achieve a similar purpose. For example, a previous project lay the foundation for a new road and it took 20 days work effort for a 5 kilometre road. A new project that needed to create a 5 kilometre road might also require a work effort of 20 days to lay the road foundation.
Empirical Based on real‐life experience and observations from past projects. For example, the project team know from experience that the cargo ship is often delayed by 1 month there is a chance the required equipment will not arrive on the cargo ship.
To assist with estimating the task time, it can be useful to think about what resources (staff,
contractors, equipment and materials) you need to complete the task. These resources will also be
documented as part of this step.
Also remember that the knowledge, skills and experience of that that will work on the project will
also influence the estimation of work effort required to complete a task. Skilled and experienced
staff working on a task will complete the task in less time resulting in less work effort required and a
shorter duration.
What are Resources? Resources refer to anything that your project needs to do work. To keep things simple, we will
categorise project resources into two groups.
1. Equipment, materials, tools and facilities
Examples: Laptop, water quality testing equipment, tractor, bolts, gravel, cement, garden tools,
seeds, monitoring equipment, stationary, solar panels, water tanks, access to office, storage shed
2. Human resources – Staff and contractors
Examples: Administrative staff, project team staff, external contractors and consultants, board
members

Logical Framework Approach Part II – Learner Guide © SPC 2015 42
Putting it into practice – Step to follow to estimate time and identify resources a) Gather your project team together. If possible invite, or consult with other stakeholders
who have experience in conducting the required work.
b) Select a task on the Work Breakdown structure. Discuss the task with your team to estimate
the work effort (number of days work for one person) required to complete the task.
Remember to think back to your past experiences to help you estimate. If you are just
guessing, maybe you need to ask an expert outside of your team.
c) For the same task, estimate the task duration (the number of calendar work days required to
complete the task). Remember this takes into account the number of people working on the
task and if there is any need to wait before, during or after the real work has taken place.
d) Write your work effort (W:) and task duration (D:) estimate down on the sticky note for that
task.
On another sticky note, write down any assumption you made to come up with that
estimated work effort. For example, if you estimate 4 days to construct the concrete
foundation of a building, how many workers are employed? Are you assuming the workers
will use an electric cement mixer or wheelbarrow to mix the concrete? The assumption may
make a big difference in work effort and duration estimated.
e) On the second sticky note also add a list of resources required to complete the task (number
of staff, contractors, materials, equipment, tools etc.)
f) Repeat the above steps for every task or sub‐task on the Work Breakdown Structure
Don’t forget to take photos of your completed work breakdown structure
Figure 13 shows an example Work Breakdown Structure that has been expanded. Firstly, the work
effort and estimated duration for each task is written on every task sticky note. Secondly, new sticky
notes are added below each task to list the assumptions that were made to estimate the work effort
and duration. The staff, contractors, materials and equipment to complete the task are also
documented.

Logical Framework Approach Part II – Learner Guide © SPC 2015 43
Figure 13. Expanded Work Breakdown Structure
Outputs 1. Water tanks installed
Activities 1.1 Conduct household survey
1.2 Install water tank
Tasks
Recruit and train survey team Work effort 2 days Duration 10 days
Develop survey questions Work effort 1 day Duration 1 day
Print survey W: 1 day D: 1 day
Conduct survey W: 9 days D: 4 days
Analyse survey data and write report W: 6 days D: 6 days
Assumptions, staff, Contractors, equipment, materials
Need 3 new staff for 1 month. Advertise on radio for 4 days. Interviews will take 1 day. Training will take 1 day. Need to wait 4 days between interviews and training for Human Resources to complete contract. Project officer Morning tea Training materials
Consultant
Use office printer Admin assistant A4 paper
Survey 63 households. 1 hour per household (7 household per day per survey team member. 21 households per day for whole survey team of 3. 3 days duration + 1 day contingency) Car hire for 3 days plus petrol
Consultant
In the example above, task “Recruit and train survey team” has a work effort of 2 days. This could
be roughly include 1 day to recruit the team (including advertising and interviews) and 1 day to train
the team. The duration for the task is 10 days. The duration is greater than work effort because the
project officer doing the recruitment and training must wait 4 days for the advertising on radio to
complete before conducting the interviews. The training cannot happen straight after the
interviews. The project officer needs to wait 4 days for human resources to approve the contracts
before training can begin. Therefore the task duration is 10 days ( 4 days advertising + 1 day
recruitment + 4 days waiting for contracts + 1 day training = 10 days).

Logical Framework Approach Part II – Learner Guide © SPC 2015 44
Estimate the work effort and duration to complete every task below. Document any assumptions you made. Write a list of resources (staff, contractors, materials and equipment) required to complete the task.
Task Work effort (# of days)
Duration(# of days)
Assumptions Resources
Research drought tolerant taro varieties
Install water irrigation system for seedlings
Plant taro varieties
Write research findings report on drought tolerant crops
Design livelihoods survey for farmers
Clear land for access road to pilot site.
Step 4. Organise tasks into a timeline
The timeline provides a way to visually organise activities and tasks into their sequential order. The
timeline allows project teams to identify what tasks can be run at the same time (concurrently) and
what tasks need to wait for other others tasks to complete before they can start (dependency). Once
activities and tasks are organised in a timeline it is possible to determine how long the project will
run for (the project duration).
Term
Description
Concurrent Describes two or more tasks that can run at the same time. Running tasks concurrently may mean that the project may be completed is less time. Limitations might mean that some tasks that could run concurrently cannot in real life. For example, two tasks for an activity might be to “design a survey” and “recruit new survey team”. In theory, both of these tasks could happen at the same time. However, imagine there is only one project officer allocated to the project. This one person cannot do both tasks at the same time, so the tasks cannot run concurrently.
Dependency Relationship between two or more tasks. The most common dependency is Finish – Start. That indicates that one task cannot start until another task finishes. For example, task “install rainwater tank” cannot start until task “create rainwater tank foundation” has finished.

Logical Framework Approach Part II – Learner Guide © SPC 2015 45
Review the simple baking a cake Work Breakdown Structure (Figure 10) on page 37. Write down two tasks that could occur concurrently. Write down an example of a dependency between two tasks. Explain your choices.
Tasks Explanation
Concurrent
Dependency
Estimating the start-date When pasting an item onto the timeline you need to decide when the item should start.
As a general rule, an item should start at the earliest possible logical date on the timeline.
If the item can run concurrently (at the same time as other items), then the start‐date should be the
same (or close to) the start‐date of the item that it can run concurrently with.
If a dependency exists between items, then the start‐date for the item in question should be after
the end‐date of the related item. The start‐date may be just after the related item’s end‐date, or
there may be a gap in the middle (days or weeks) to allow for a contingency.
Estimating the end-date When pasting an item onto the timeline you need to decide when the item should end. Most of the
focus needs to be on estimating the end‐date for sub‐tasks and tasks. The end‐date for activities
(and task that have sub‐tasks) can be calculated later.
The end‐date for a task is the task start‐date plus the task duration. The task duration was
estimated in the previous step. The task duration did not include weekends or non‐work days, so
these must be added on when calculating the end date. For example, if a task starts on 1 May and
the duration is 20 days, then the end‐date is May 26 as there are three weekends included over the
20 day duration.
The end‐date for a task with sub‐tasks is the latest end‐date of all its related sub‐tasks.
The end‐date for an activity is the latest end‐date of all its related tasks.

Logical Framework Approach Part II – Learner Guide © SPC 2015 46
Estimate the start‐date and end‐date for each of the tasks in the table below. The project start date is Monday 4th of May 2015. Remember to add on weekends where required to calculate the end‐date. Assumption: The survey questions can be developed at the same time that the survey team are being recruited and trained.
Recruit and train survey team Work effort 2 days Duration 10 days
Develop survey questions Work effort 1 day Duration 1 day
Print survey W: 1 day D: 1 day
Conduct survey W: 9 days D: 4 days
Analyse survey data and write report W: 6 days D: 6 days
Activity / Task Start‐date Duration End‐date
Activity 1.1 Conduct household survey 4/5/2015
Recruit and train survey team 10
Develop survey questions 1
Print survey 1
Conduct survey 4
Analyse survey data and write report 6

Logical Framework Approach Part II – Learner Guide © SPC 2015 47
Creating the timeline Follow the steps below to create a timeline for your project. You should do this activity with the
assistance of your project team.
a) Use a whiteboard (or table/wall and sticky notes) to create a template similar to the one
below. Customise the estimated start‐date and end‐date for your project. The length of
your project will help determine the horizontal time intervals. For short projects, you might
use days or weeks. For longer projects (1 – 3 years), you might use months or quarters.
2016 2017
March 2016 April May June … Dec. etc. Jan
Feb
First activity
First task for first activity
b) Review the Work Breakdown Structure. Take what you think should be the first (or next
sequential) activity and paste that onto the timeline in the next blank row. The first activity
will start at the project start‐date.
c) Review all the tasks for the selected activity. Take what you think should be the first (or next
sequential) task for the activity.
d) Estimate the start‐date and end‐date (follow the guidelines given on page 45).
e) Paste the task on the timeline on the next available blank row in line with the estimated task
start date. If the end‐date is beyond the dates taken up by the sticky note on the timeline,
then draw a line across the timeline until the end‐date is reached to show how long the task
runs for.
f) Review the remaining tasks for the selected activity. Stick each task onto a new row of the
timeline in sequential order, using the estimated start‐date and end‐date to locate each
sticky note.
g) If the task has sub‐tasks
i. Review all the sub‐tasks and paste the one that should occur first onto the timeline
in a new row underneath the task. Estimate the sub‐task end‐date. If the end‐date
is beyond the dates taken up by the sticky note on the timeline, then draw a line
across the timeline until the end‐date is reached to show how long the task runs for.
ii. Review the remaining sub‐tasks for the selected task. Stick each sub‐task onto a
new row of the timeline in sequential order.
h) Repeat the above steps for all activities in the Work Breakdown Structure
i) Once all the activity’s tasks and sub‐tasks have been pasted onto the timeline, then the
activity (and tasks with sub‐tasks) end‐dates can be estimated and drawn in.
j) Review the entire timeline with the project team. Are all activities and tasks included? Are
the assumptions that were used to estimate the work effort and duration reliable enough?
Does the order of tasks make sense?

Logical Framework Approach Part II – Learner Guide © SPC 2015 48
Project Duration The project duration can now be calculated by looking at the project start‐date and end‐date on the
timeline. The project end‐date is the end‐date of the last (or latest) activity on the timeline.
You need to check that the project duration and project end‐date are both within the project
funding guidelines. For example, donors may specific that funding will only be provided for 2 years
and that all work must be completed by December 2017.
If your project end‐date or duration falls outside of those guidelines, then you may need to:
Rethink your activity scheduling ‐ Can more tasks be completed concurrently or can they
start earlier?
Rethink the scope of your project ‐ Do less to reduce the time required.
Add more resources to the project – Have more people working on tasks so they can be
completed in a shorter period of time.
Seek additional funding – Additional funding from another donor could support the work
that falls outside of the timeframes specified in the project guidelines.
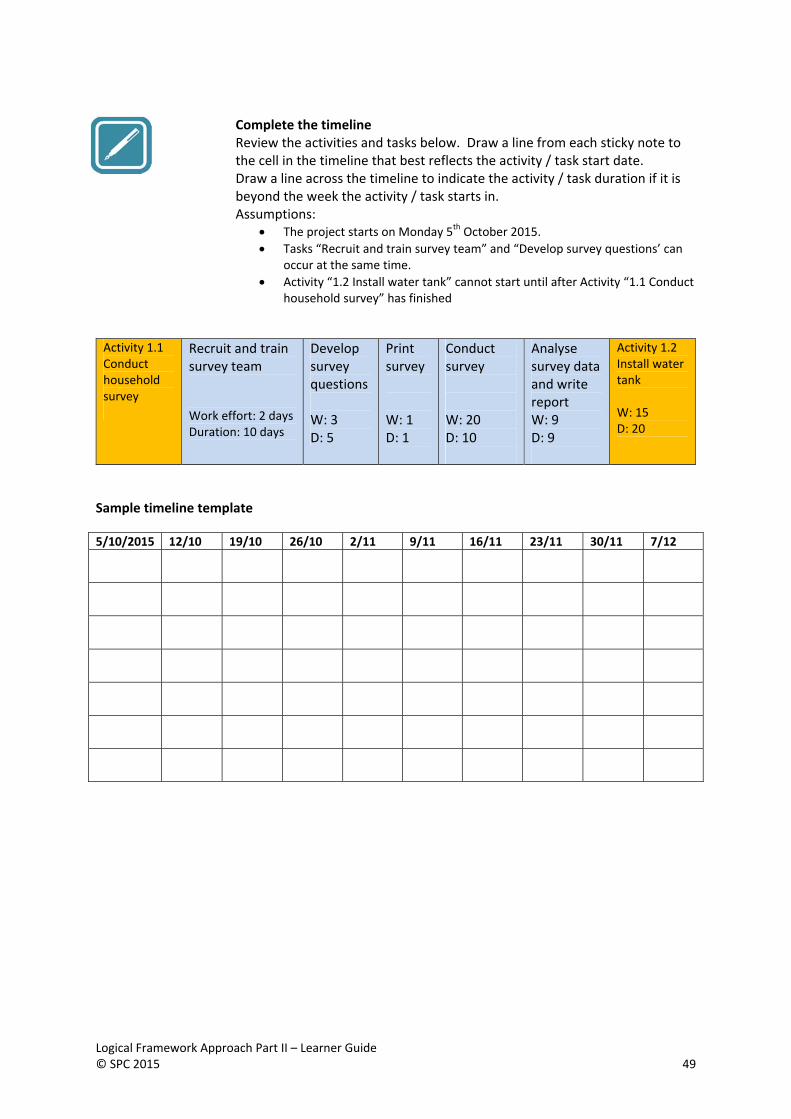
Logical Framework Approach Part II – Learner Guide © SPC 2015 49
Complete the timeline Review the activities and tasks below. Draw a line from each sticky note to the cell in the timeline that best reflects the activity / task start date. Draw a line across the timeline to indicate the activity / task duration if it is beyond the week the activity / task starts in. Assumptions:
The project starts on Monday 5th October 2015.
Tasks “Recruit and train survey team” and “Develop survey questions’ can occur at the same time.
Activity “1.2 Install water tank” cannot start until after Activity “1.1 Conduct household survey” has finished
Activity 1.1 Conduct household survey
Recruit and train survey team Work effort: 2 days Duration: 10 days
Develop survey questions W: 3 D: 5
Print survey W: 1 D: 1
Conduct survey W: 20 D: 10
Analyse survey data and write report W: 9 D: 9
Activity 1.2 Install water tank W: 15 D: 20
Sample timeline template
5/10/2015 12/10 19/10 26/10 2/11 9/11 16/11 23/11 30/11 7/12

Logical Framework Approach Part II – Learner Guide © SPC 2015 50
Step 5. Determine key milestones
Milestones are key points in time on your project timeline that reflect the achievement of an
important activity, output or outcome. A project should have at least three or four milestones. Each
milestone will have:
Milestone number ‐ starting at 1
The achievement – the name of the completed activity or output
The planned completion date ‐ the date that the activity, or output should be completed by
Example Milestones
Milestone 1 Milestone 2 Milestone 3
Survey team trained 20/5/2015
Survey work completed 10/6/2015
Final report submitted 30/3/2015
Milestones are usually documented in funding contracts and project plans. The achievement of a
milestone is sometimes tied to the receipt of the next round of funding. Projects must report on the
progress they have made towards achieving their milestones. Milestone reporting allows the project
team and donors to quickly evaluate if the project is tracking according to the planned schedule or is
running ahead of, or behind schedule.
Follow these steps to creating milestones for the project:
a) Review the project timeline. Select several key project activities or outputs that could be
milestones.
b) Create a new sticky note with the words “Milestone <number>” up the top.
c) Write a description of the milestone underneath followed by the milestone date the
milestone should be achieved by
d) Paste the milestones together at the bottom of the timeline
e) Take photos of your completed timeline for future reference.
Don’t forget to take photos of your completed timeline

Logical Framework Approach Part II – Learner Guide © SPC 2015 51
Step 6. Documenting your timeline in a spreadsheet
Using sticky notes is a great way to work together as a team to think through and create the project
timeline, however, most project proposals will require you to document your timeline electronically
as a spreadsheet, table or Gantt chart. The good news is that all the hard work has been done and it
is a simple exercise to copy your timeline into a spreadsheet or other format.
The simple spreadsheet layout we will use is documented below. A simple Microsoft Excel template
has been prepared to assist you.
2016 2017
Activity / Task Work effort
Duration(days)
Assumptions Resources Oct Nov Dec Jan
Act. 1.1 Build new road
28 65
Conduct land survey 3 5 Few days wait on maps
Surveyor consultant
Secure land lease 2 20 18 days for land‐owner to consider
LeaseProject officer
Purchase equipment 3 30 27 days to deliver
Project officer
Clear land 20 10 2KM per day per bulldozer
2 bulldozers
Follow the steps below to copy the sticky note timeline into a spreadsheet
a) Open the spreadsheet template provided or create your own.
b) Review the sticky note timeline one row at a time.
c) Copy the details for each activity, task or sub‐task into the spreadsheet.
d) The activity or task name should be copied into the first column.
e) The work effort, duration, assumptions and resources get copied over into their respective
columns.
f) Shade or colour cells in the timeline section to indicate the activity task start‐date and
duration. These should reflect where the sticky note was placed on the timeline and where
required, the horizontal line that was drawn to the task end‐date.
g) Enter all the milestones into the Timeline. Identify the task or activity that the milestone
relates to. Scroll across to the end date and in that cell for that task or activity, enter the
milestone details ‘Milestone XX – xxxxxxxxxxxxxxxxxx’.

Logical Framework Approach Part II – Learner Guide © SPC 2015 52
Step 7. Budget A budget documents an estimate of all the project costs. The budget developed as part of the
Logical Framework Approach is called a Resource Schedule and it goes one step further and seeks to
document where the required project funding will come from. A more complex resource schedule
will also indicate what time (year or month) the project funds are required. This information helps
the funding organisation know not just how much funding a project needs, but when the project
needs it.
A thorough understanding of a project’s costs is critical. Funding agencies will be influenced by the
amount and quality of the budget and it may partially drive their decision to invest in the project. In
determining the project budget, it is important to be realistic as an under‐costed project will impact
negatively on the project’s implementation, and likelihood of success. An over‐costed project may
not get funded.
Step 1. Categorise costs
To develop a budget, project teams must be able to review all the project tasks and identify what
budget items are included in those tasks. Examples of budget items include staff salaries, contractor
costs and the cost of materials and equipment.
It can be useful to think about the different types of project costs when identifying items that will go
into the budget. Several high level cost categorise are outlined below that will be used to help
develop the project budget. The donor or funding agency may use different categories, so please
refer to their funding guidelines. Project cost categories:
In‐direct Costs. These are not directly linked to the project, but they are required to help
support the project. These costs are more difficult to identify and estimate. They might
include a percentage of the office building rent or overheads (electricity bill, phone bill,
internet charges) required to keep an office running where the project team work.
Direct Cost. These are costs linked directly to your project. These costs can be identified
easily when looking through the tasks in the timeline. Direct costs can be further broken
down into two sub‐categories:
o Goods. Includes equipment, tools and materials that need to be purchased, leased
or rented. It can also include the transport and shipping of goods.
o Services. Includes the cost of project staff and contractors. Costs to support staff to
do their work can also fall under this sub‐category. For example, staff transport,
vehicle hire, fuel or mobile phone credit. Any sub‐contracted work could also be
included here. For example, ‘H&J building land clearing’.

Logical Framework Approach Part II – Learner Guide © SPC 2015 53
Categorise your costs Review the tasks below taken from a Work Breakdown Structure. Identify at least 5 items that need to be included in the budget. Write the name of each budget item into one of the three columns of the cost category table to reflect the item’s correct cost category. There should be one or more budget items in each cost category.
Recruit and train survey team W: 2 days D: 10 days
Develop survey questions W: 1 day D: 1 day
Print survey W: 1 day D: 1 day
Conduct survey W: 9 days D: 4 days
Need 3 new staff. Project officer Morning tea Training materials
Consultant
Use office printer Admin assistant A4 paper
Survey 63 households in 3 villages Car hire for 3 days plus petrol
Cost categories table
Indirect costs Direct Costs
Goods Services

Logical Framework Approach Part II – Learner Guide © SPC 2015 54
Step 2. Estimate costs
Once the budget items have been identified and categorised they can be costed. Different strategies
may be applied to items in each cost category to help with the estimation process.
Indirect costs. A percentage of an indirect cost can be allocated to the budget item. For
example, if the total electricity bill for the Ministry of Environment office is $2000 per year,
then the project budget may take on 2% or 5% of that cost to represent the use of that
electricity by the project staff. Determining what the percentage of the total indirect cost
should be used requires some judgement. The result must be fair both to the project
(funder) and the organisation that normally pays for the item.
Instead of using a percentage, an indirect cost like rent of office space could use a rate per
desk per year. For example, 2 project staff desks x $500 per year, totalling $1000 per year.
Goods. To estimate the cost of goods we need to identify a number of things:
o Unit of measurement. This describes how we will measure the number or quantity
of items needed. For example, for equipment, for a bulldozer, the unit of
measurement would be ‘per bulldozer’ if the project were buying one, or ‘per
bulldozer per day’ if hiring one. For water pipe, the unit would be ‘per meter of
pipe’. For venue hire, the unit would be ‘per day’. For bricks, the unit might be ‘per
pallet of 50 bricks’.
o Cost per unit. This describes how much each unit of the item costs. For example,
how much is one bulldozer? How much is one day of venue hire? How much is one
pallet containing 50 bricks?
o Quantity required. Describes the number of units required. For example, one
bulldozer. Fix pallets of bricks (each pallet containing 50 bricks)
The total price of budget item is then calculated using the simple formula
Budget item cost = Cost per unit x Quantity Required
Services. Staff and contractor and larger sub‐contracted work can be estimated using the
same technique as the goods. The unit of measurement will likely be days, weeks, months
or years. The unit of work for sub‐contracted work will likely just be the entire job
described in the sub‐contract. For example, the unit of work may be ‘Drill 5 boreholes and
install pumps by JJR Drillers’.
Logical Framework Approach Part II – Learner Guide © SPC 2015 55
Accuracy How accurate does the unit price and quantity required need to be? The answer is ‘it depends’ on
why the budget is being prepared and at what stage the budget is being prepared. Different levels
are detailed are required at the concept note, project proposal and implementation stage.
Concept Note. At the concept note stage you might be able to get away with using your
team’s expertise to estimate the cost based on their past experience and knowledge. The
actual budget expenditure from past projects can also be reviewed and used as a guide in
some cases. For high cost or uncertain items, you may need to call around some service
providers to gain a high level estimate over the phone.
Project Proposal. A more accurate cost estimate is required to ensure your budget contains
all the funding required to support the goods and services to run the project. This may
require your team to phone organisations to obtain or confirm quote estimates. For high
cost or complex budget items you should obtain one or more written quotes.
Implementation. During project implementation, the procurement policy agreed to in the
funding contract should be followed. This may require obtaining three written quotes.
These updated costs should be reflected in the budget and used to monitor and report on
any variance (likely overspending or underspending).
Quote tip
Always request the organisation providing a quote to ensure their quote is valid for a number
months from the quotation date. The number of months should be guided by the time between the
quote date and the date you actually expect to buy the good or service.

Logical Framework Approach Part II – Learner Guide © SPC 2015 56
Cost estimation Estimate the budget cost of the items in the table below. Background information: 100 trees will be planted. A box of 10 trees costs $10. A packet of 25 tree guards costs $20. Two staff will plant the trees over 5 days. Each staff member is normally paid $50 per week. A new shovel costs $10. A contractor will be hired to clear 100 square meters of land to plant the trees for a lump sum price of $500. The combined electricity, telephone costs for the Ministry of Environment office are $3,000 per year. The Ministry has 10 full time staff. The new project will be hiring one project manager for 12 months. A project manager normally gets paid $100 per week. The cost of renting office space for a private business is $10 per week per desk.
Simple budget template
Budget item Unit of Measurement Quantity required
Cost per unit (USD)
Total cost (USD)
Goods
Tree seedlings
Tree guards
Shovel
Services
Project manager
Tree planters
Land clearing contract 100 m
Indirect costs
Office expenses
Office rent
Total project cost
$
Logical Framework Approach Part II – Learner Guide © SPC 2015 57
Step 3. Allocate source of funding
Who pays - Where does the funding come from? Once all the project costs have been estimated, the project team needs to indicate where the
budget funding will come from. The type of project funding being offered will help the project team
make the decision of where project funds will come from. Make sure you read the funding
guidelines to determine if the funding is:
All‐inclusive. The donor agrees to pay all project costs.
Matching funds or co‐contribution required. The donor agrees to pay part of the project
cost, but only if the implementing organisation or another donor also agrees to contribute a
percentage of the total project cost or a percentage of the donor’s funding. For example, if
the donor required a co‐contribution of 50% of the donor’s funding, then for every dollar the
donor gives, the implementing organisation or another donor must also contribute fifty
cents. In some cases both cash and in‐kind contributions can be used to match the donor’s.
Providing a co‐contribution, even if a co‐contribution is not required, demonstrates to the donor
that your Government is committed or has some buy‐in to the project. This can help the donor build
confidence that the Government will make a strong effort to successfully implement the project and
can increase the likelihood of a project being funded.
What will the donor fund, and not fund. Some donors will specify in their guidelines that
they may not fund particular expenditure areas, such as office costs etc. In such a case, make
sure that you allocate these costs as a matching contribution.
Cash vs in-kind co-contribution Co‐contribution can often be made by either a cash or in‐kind contributions.
A Cash co‐contribution refers to a monetary payment made by an organisation.
An In‐kind co‐contribution refers to a project cost that is avoided by the project team
supplying the good or service required free of charge. The value of an in‐kind contribution is
estimated in the same way as a normal good or service cost.
For example, the project needs to hire a car to transport the survey team around the island.
Instead of hiring a care for 2 weeks at $300 per week, the Ministry of Environment agree to
allow the project team to use a Government car for the week at no cost to the project.
Therefore the car‐hire cost of $600 (2 x $300) is an in‐kind contribution given by the
Government. The item still appears on the budget as it is a valid project cost, however the
cost will be allocated to a separate column to indicate it is an in‐kind contribution from the
Government and not funding required from the donor. Use of a Government building to run
a workshop or a staff member’s time (and associated cost) can also be donated to the
project as an in‐kind contribution.
Logical Framework Approach Part II – Learner Guide © SPC 2015 58
In‐kind contributions List some in‐kind contributions that your organisation/Ministry may be able to give for a water and sanitation education project focused on education in schools. List the item and make some assumptions to calculate the in‐kind contribution cost.
Step 4. Adding contingency & currency exchange
In the context of a budget, a contingency is an additional amount of project cost that is added onto
the budget. A budget contingency can be added because there is some uncertainty as to the exact
cost of a budget item. The risk of something going wrong, or not to plan, can also highlight the need
for a contingency to be added. Risks and uncertainty might lead to the project needing to spend
more money than is currently budgeted for, therefore a contingency is added to cover that
additional possible cost.
Where to apply the budget contingency amount?
Budget line item level. A budget contingency can be applied at the budget item level. This
allows the project team to apply a contingency only to the budget items that have a high risk
or high degree of uncertainty. The easiest way to add a contingency to a budget line item is
to increase the estimated ‘cost per unit’. Always review the total line item cost after doing
this to make sure the contingency amount is appropriate. Another way to apply a
contingency is to enter or type a revised total cost including the contingency value in the
“Total cost” column for the line item. In a spreadsheet, the Total cost value would normally
be calculated by a formula.
Total budget project cost. A budget contingency can also be applied to the total budget
project cost. This allows the project team to apply a contingency to the entire budget to
compensate for perceived underestimates, uncertainty in project scope and project delays.
Both approaches. Both of the above approaches can be successfully used together in
moderation.
Whichever approach you take, it is most important to document what contingency has
been added and to justify the contingency in writing to explain why it was added.
How much should the contingency amount be?
A contingency is generally applied as a percentage of either a budget item or total budget cost. The
amount of the contingency generally reflects the level of risk (or uncertainty) that a budget item or
project has. A very short and simple project may have no contingency included. An average project
may have a contingency between 3% and 6% added. A larger or more complex project with many
uncertainties may include a contingency of between 10% and 15%. A contingency for a concept

Logical Framework Approach Part II – Learner Guide © SPC 2015 59
note budget will likely be much higher than the contingency included for a detailed project budget
developed for a project proposal. The decreased contingency amount reflects the decreased level of
uncertainty about the time and cost estimation as more work is put into these estimations when
developing a detailed timeline and budget.
Budget tip
Always make it clear what currency is being used in a budget. Include the currency in the budget
table columns.
Managing multiple currencies Budgets for development projects often need to deal with multiple currencies. There are several
situations where dealing with multiple currencies may be required.
Donor funds are in another currency. The donor may request that a budget be developed using the
local currency. However, the total amount of funding required from the donor needs to be
requested in the foreign currency used by the donor. At the time of project implementation, the
donor will allocate funds to the project in the foreign currency.
Goods or services need to be paid for in foreign currency. Goods and services purchased overseas
may need to be paid for in a foreign currency.
Risk of currency exchange rate fluctuation.
Most currency exchange rates are not fixed and therefore there is a risk that a shift in the exchange
rate will leave your project with less funds than needed to purchase the required goods and services.
Rising local currency. If the local currency rises in relation to the foreign currency between the time
the budget was created and the time the funds are transferred, then your project will receive less
funds (in local currency).
Falling local currency. If the local currency falls in relation to the foreign currency after you have
received your donor funding, then the cost of overseas goods and services you need to buy in
foreign currency will cost more (in local currency).
Exchange rate contingency.
When developing the project budget, review the exchange rate variability between your local
currency and the foreign currency over the past 12 to 24 months. If the exchange rate is fairly
stable, then this is one small sign that there is not a great risk of large fluctuations in the future.
Project teams may still consider applying a small contingency to the exchange rate.
If there is a lot of variation or the trend of the currency is moving in a direction indicating the
weakening of your local currency, then project teams need to factor in a larger contingency to the
exchange rate used in the currency conversion calculations. This may involve estimating what the
exchange rate will be at the time the donor funds are expected to be transferred and using this as
the exchange rate. This rate may be several points above the existing official exchange rate. This

Logical Framework Approach Part II – Learner Guide © SPC 2015 60
exchange rate adjustment is another contingency that needs to be documented in the project
budget.
Always document what the official exchange rate was at the time of performing any currency
conversion for preparing a budget. Write down the source of where the exchange rate came from.
Document both the official exchange rate and the exchange rate used in the budget (with the
contingency included).
If project teams document the exchange rates, contingencies and assumptions made, then there is a
greater chance of the donor being sympathetic to top up funding to meet a shortfall if there is a
large currency fluctuation that exceeds the contingency amount. Do not rely upon this as a strategy
to manage currency fluctuations. Always apply a contingency to the exchange rate.
Adding budget contingency Review the simple budget below and add a 10% contingency to the total building materials cost to allow for uncertainty in the volume of materials needed. Add a 5% contingency to the total project cost to allow for uncertainty in the overall project and it is possible additional work may be needed to secure the building foundations. The project will be funded by Australian Dollars. The existing exchange rate from TOP to AUD is .64 (1 TOP : .64 AUD) . Add a contingency for the exchange rate to increase to .70 and apply this to the adjusted total budget cost. Review the adjusted total project cost in AUD. In total how much additional contingency has been added to the budget?
Simply budget – requires contingency to be added
Budget item Original Cost (TOP $) Adjusted cost (with contingency) (TOP $)
Goods
Building materials cost 100,000
Services
Project manager 40,000 40,000
Builders contract 50,000 50,000
Total project budget cost (TOP)
190,000 TOP TOP
Contingency amount to add TOP
New Project budget total including contingency (TOP)
TOP
Total project budget cost (AUD)
121,600 AUD (exchange rate of .64 used)
AUD (exchange rate with contingency of .70 used)
Exchange rate source: www.xe.com, 18/2/2015. Contingency of +.06 allowed for

Logical Framework Approach Part II – Learner Guide © SPC 2015 61
A final word of caution on contingency
Don’t be afraid to apply a contingency to your budget, but don’t’ use contingency as a work‐around
for laziness in clearly defining your project activities, tasks, times, materials and cost estimates.
Don’t use a budget contingency to be greedy and gain extra funding for your project. If the budget is
too high or the contingency too great, then the donor many not fund the project
Be careful of the multiplier effect. If you add a contingency to a budget item, then add a
contingency to the total budget cost (that includes that increased cost for the budget item) and then
apply a currency exchange rate contingency, then the first contingency amount you added will be
multiplied an additional two times. The total budget amount will also be multiplied one additional
time. The end result is that the actual final total budget including the contingency may end up being
far greater than you originally intended and higher than is needed.
Developing your budget - Putting it into practice A budget template spreadsheet has been provided to assist prepare the project budget. Note that
the budget contains formulas to make the process easier. All cells with formulas have been shaded
in a red colour, so be careful not to type in these cells unless you want to override the formula.
Follow the steps below to create a project budget. These steps summarise all the high level steps
and tasks covered in the budget section:
1. Open the budget template spreadsheet or use an existing budget template normally used by
your team.
2. Customise the template by including any additional donors in the far right hand side columns if
required
3. Decide if the budget will be created in local currency or a foreign currency (as pre the donors
requirements). Include the currency to be used in all cost related all column headings.
4. Review the timeline and focus on one task at a time. Identify the possible budget items by
reviewing the task, the assumptions, staff, materials and equipment listed.
5. Decide if the budget item is a Good, Service or if there are any Indirect costs.
6. Create a new separate budget line item in the appropriate section (Good, Service, indirect cost)
of the budget and enter the name of the budget item in the first column.
7. Enter a value for the ‘Unit of Measurement’, ‘Units required’ and ‘Unit cost’. Where
appropriate, obtain quotes for the unit price of items or make the most accurate estimate with
the input from your project team.
8. For indirect costs, you have two options. Enter the flat rate cost in ‘Cost per unit’ column and
enter 1 in the ‘Quantity required’ column. Alternatively, to apply a percentage of the total
indirect cost, enter the total indirect cost in the ‘Cost per unit’ column and the percentage to be
paid for by project into the ‘Quantity required’ column – Ensure you enter the % following the
number. E.g. 10%
9. Once all the columns key costing columns for the budget line item are completed the total item
cost should be automatically calculated.

Logical Framework Approach Part II – Learner Guide © SPC 2015 62
10. If there is a high degree of uncertainty about a specific line item, then add a contingency amount
and make a note of this in the Comments column. A contingency can be added by either
increasing the Cost per unit or manually entering a larger value in the Total Cost column for
item.
11. When buying goods and services from overseas, don’t forget to convert the foreign currency
amount to the currency used in the budget. Always apply a contingency to the exchange rate
and don’t forget to document the exchange rate details and contingency in the Comments
column.
12. Next decide who will pay for the budget item cost. Enter values in the “Where will the funds
come from” columns to indicate which organisation will pay for the budget item. Will it be the
Government making a cash co‐contribution or in‐kind contribution? Will it be a donor or will the
cost be shared between the Government and donor?
13. If the same budget line item is identified in several tasks, then only include the item once in the
budget. Instead you should update the budget line item by increasing the number of units
required.
14. Continue steps 4 to 10 for each task and sub‐task in the timeline. You can insert new rows in the
budget template as required. If inserting new rows, ensure you copy the formula down to the
new cells created for columns G, O and P.
15. Review the project budget to determine if all the project costs have been captured.
16. Check the value next to “Are all costs covered by a donor or the Government?” down the
bottom of the budget table. If the value is ‘YES’, then you have correctly allocated all the
projects costs to the Government or donors. If the value is ‘NO’, then review the values in
columns O and P to check which budget line items have been under or over allocated in the
“Where will the funds come from” columns. Correct these items until all values match and a
“Yes” is displayed next to “Are all costs covered by a donor or the Government?”
17. The main budget is now complete.
18. You should now apply a contingency percentage to the total project cost. Below the main
budget table, type this value into the orange cell next to “Contingency percentage to apply”.
Don’t forget to justify why you chose that contingency percentage.
19. If required, complete the exchange rate section below the main budget table. Enter in the
exchange rate to convert values from the currency the budget was developed in to the foreign
currency requested by the donor. Enter in the official exchange rate, the date and source where
it was obtained from. Enter in the revised exchange rate that includes a contingency to cater for
possible exchange rate fluctuations.
20. Below the “Apply currency exchange rate” section is a Summary Information table where you
should be able to source all the key budget values to inform a project proposal.
An example budget is presented in Table 6.
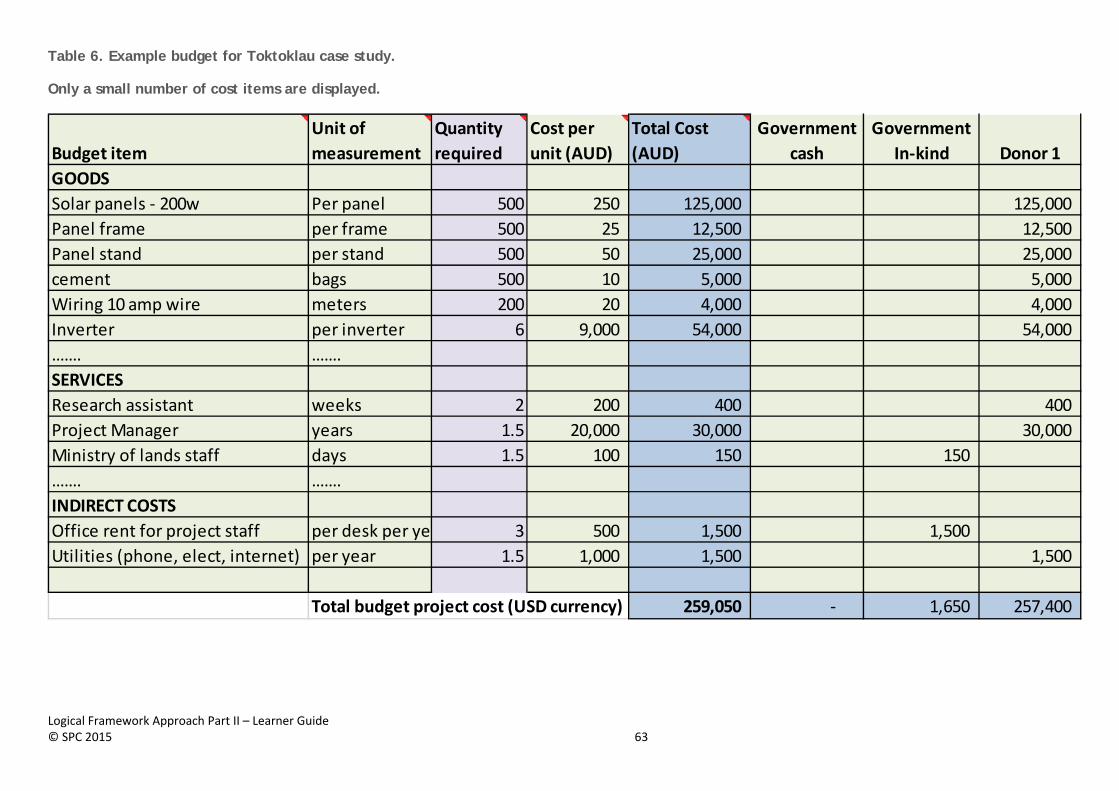
Logical Framework Approach Part II – Learner Guide © SPC 2015 63
Table 6. Example budget for Toktoklau case study.
Only a small number of cost items are displayed.
Budget item
Unit of
measurement
Quantity
required
Cost per
unit (AUD)
Total Cost
(AUD)
Government
cash
Government
In‐kind Donor 1
GOODS
Solar panels ‐ 200w Per panel 500 250 125,000 125,000
Panel frame per frame 500 25 12,500 12,500
Panel stand per stand 500 50 25,000 25,000
cement bags 500 10 5,000 5,000
Wiring 10 amp wire meters 200 20 4,000 4,000
Inverter per inverter 6 9,000 54,000 54,000
……. …….
SERVICES
Research assistant weeks 2 200 400 400
Project Manager years 1.5 20,000 30,000 30,000
Ministry of lands staff days 1.5 100 150 150
……. …….
INDIRECT COSTS
Office rent for project staff per desk per ye 3 500 1,500 1,500
Utilities (phone, elect, internet) per year 1.5 1,000 1,500 1,500
Total budget project cost (USD currency) 259,050 ‐ 1,650 257,400


![[GCCA Caribbean Regional Project]](https://img.pdfslide.us/doc/110x75/6169dc8711a7b741a34c2f1d/gcca-caribbean-regional-project.jpg)