Embed Size (px)
Citation preview
PROPOSAL FOR THE DEVELOPMENT OF A FRAMEWORK FOR A
GLOBALLY RELEVANT WINE SECTOR CLIMATE CHANGE ADAPTATION
STRATEGY
Mark Gishen1*, Antonio R. Graça2, Gregory V. Jones3
1Principal Consultant, Gishen Consulting, 261 Carrington Street, Adelaide SA 5000, Australia
2Head of Research & Development, Sogrape Vinhos, S.A., Aldeia Nova 4430 - 809 Avintes, Portugal 3Director & Professor of Environmental Science and Policy, Division of Business, Communication, and the
Environment, Southern Oregon University, 142 Central Hall, 1250 Siskiyou Blvd., Ashland, OR, 97520, USA
* Corresponding author: Gishen. Email: [email protected]
Abstract
Climate change is impacting wine production in all parts of the world in highly variable ways that may change
the expression of terroir, from rapid loss of viability right through to highly beneficial aspects that increase
suitability. The ability of the wine sector to adapt to climate change is largely constrained in a relatively
consistent manner across the world, with very similar barriers being identified in several countries (Aus,
USA, Por, Ita, Esp). The most important of these include accessibility to meaningful predictive climate data
projections, the capacity and ability to use the predictive data, and the identification of relevant and practical
adaptation response actions. The authors are proposing the development of a simple guide to possible
response actions based on a hazard risk analysis and a control point approach that will incorporate a wide
range of viti-vinicultural climate types and terroirs. The guide will constitute a framework that can be
upgraded as new adaptation options become uncovered through research and practical experience relevant to
each region, thereby allowing individual regions to better define their own relevant adaptation strategies. A
preliminary framework covering a sample section of the value chain will be presented for discussion.
Keywords: climate change, impacts, terroir, adaptation, global framework
INTRODUCTION Climate is arguably the most important determining factor of ‘terroir’ of wine for a given varietal. Climate
change is impacting wine production in all parts of the world in highly variable ways that may change the
expression of terroir, from rapid loss of viability right through to highly beneficial aspects that increase
suitability. An example at one end of such impact is the recent expansions in wine production in the United
Kingdom and Denmark, where previously the climate was relatively inhospitable for wine grape growing.
The impacts of climate change on the wine industry that are already being reported include advancing harvest
dates (Daux et al., 2011; Webb et al., 2011), shifts in vineyard production areas (e.g. removal in some and
planting in others, Fraga et al., 2016), compressed vintages (Fraga et al., 2013; Dunn et al., 2015), increased
hang time (due to decoupling of flavour and sugar ripening, Sadras et al., 2012; Bonada et al., 2015),
increased bushfire risk (Head et al., 2014; Marangon et al., 2016), more heatwaves (Christidis et al., 2014;
Webb et al., 2010), changed vineyard management techniques (Salomé et al., 2016; Webb et al., 2007), and
increased refrigeration need in wineries (Barbaresi et al., 2016; Estrada-Flores and Platt, 2007).
If the wine industry in any part of the world wishes to survive and thrive in the future, it will need to adapt
to the challenges of climate change. Under a changing or changed climate it will be important for individual
producers to decide whether ‘business as usual’ remains a viable and sustainable option, or if changing their
style of wine will allow for improved value through maintaining and enhancing consumer perception of the
new ‘terroir’.
Whilst the range and extent of impacts will be highly variable for each wine growing region across the globe,
it is clear that the ability of the wine sector to adapt to climate change is largely constrained in a relatively
consistent manner across the world. This is because very similar hurdles have been identified in several

countries including Australia1, the United States of America2, Portugal3, Italy4 and Spain5. Underpinning
most of those hurdles is a general lack of easily accessible, understandable and usable climate change
forecasts in a relevant timescale at locally specific resolution, and a clear outline of how they can be used to
decide the most appropriate practical adaptation options that are best suited to the region.
In meeting this challenge, we propose that there is a need for a generalised framework that will be a resource
providing a systematic method for wine producers to know where to find relevant and practical information
about climate change forecasts, evaluate their reliability and use them to assess potential adaptation options.
The framework will aid decision-making through a risk assessment based model that examines both the
probability of occurrence with seriousness of impacts, thus providing an objective basis for decisions within
a chosen strategic mindset (i.e. optimistic, balanced, pessimistic etc.). The framework will also allow for
evaluation of the impact of business decisions (e.g. outsourcing equipment access such as harvesters can lead
to loss of control when rapid need is required) as well as provide for process integration and higher level
evaluation or for drill-down of process activities to understand how they affect overall outcome and simulate
different options.
By investing in the development of a globally relevant framework, a range of benefits will be realised for the
wine industry, including:
● Avoiding replication in planning efforts as well as R&D across countries, tapping into the publicly
available information at the global level
● Reducing the risk (and cost) of mistakes for regions when implementing adaptation options, through
the collation of regionally-relevant adaptation responses
● Increasing the capacity and capability of industry to adapt to climate change
● Creating a standardized approach that allows for comparison between scenarios, locations and
technological options in different regions
MATERIALS AND METHODS A preliminary framework was prepared that has at its heart a flow chart that elicits responses to a standardised
set of aspects to help guide the user towards decisions that can then be developed into a practical action plan.
The framework is based on the HACCP (hazard analysis and critical control point) approach (Pierson and
Corlett, 1992). HACCP systems define process control as a function of critical control points (CCPs), which
are critical to control and monitoring of the process to minimise risks. Being preventive, HACCP is seen as
the most cost-effective approach to process control and, because it focuses on CCPs, it improves the scientific
basis for safety and control processes. The framework we propose is a simple staged system, which can be
tailored by the individual to meet their own perceptions of degree of risk and for their choice of timeframe
of consideration. The stages are described below:
Stage 1 - Identification of key impacts
The first stage guides the user to identify the impacts from climate change that are of relevance to their own
particular region and within the timeframe of their interest. A preliminary generic list (Table 1) was prepared
that allows the user to select the impacts, however this needs to be further expanded along the full production
chain in the full development of the framework that we propose. In this example list, for each process and
impact, a range of needed weather / climate forecast lead-times are proposed to allow for meaningful
adaptation decision-making.
In some process impacts, forecasts are required that have different timeframes, as illustrated by the shaded
cells in Table 1. For example, a successful assessment of water needs requires short-term weather forecasts
to calculate water allocation during a given year’s growth cycle, medium-term weather outlooks to prepare
logistics to counter years of drought or increased pest pressure and long-term climate forecasts to set up
adequate irrigation networks (e.g. pumping, flow, distribution, control, etc.).
1 http://research.wineaustralia.com/research-development/applying-for-funding/ 2 http://www.academicwino.com/2015/10/climate-change-california-wine-somm-journal.html/ 3 http://www.advid.pt/imagens/artigos/13492774081061.pdf 4 http://tinyurl.com/h7wngeg 5 http://www.mdpi.com/2071-1050/7/5/5094/htm
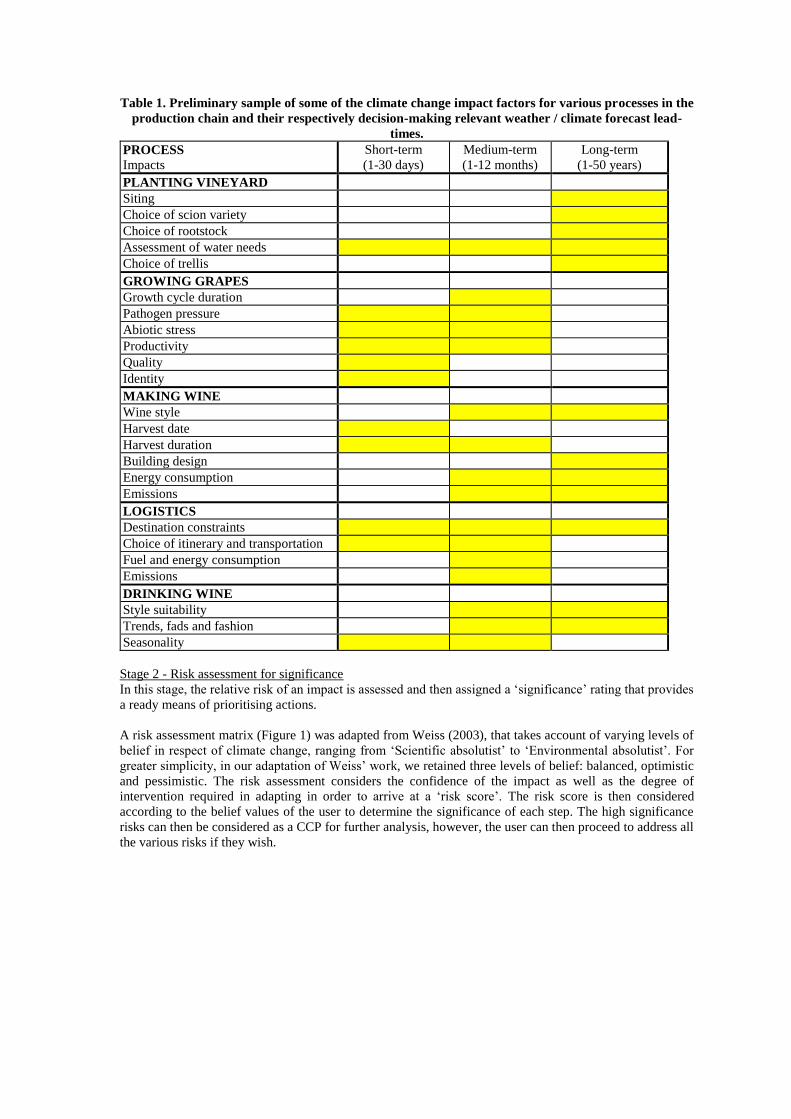
Table 1. Preliminary sample of some of the climate change impact factors for various processes in the
production chain and their respectively decision-making relevant weather / climate forecast lead-
times.
PROCESS Impacts
Short-term
(1-30 days)
Medium-term
(1-12 months)
Long-term
(1-50 years)
PLANTING VINEYARD
Siting
Choice of scion variety
Choice of rootstock
Assessment of water needs
Choice of trellis
GROWING GRAPES
Growth cycle duration
Pathogen pressure
Abiotic stress
Productivity
Quality
Identity
MAKING WINE
Wine style
Harvest date
Harvest duration
Building design
Energy consumption
Emissions
LOGISTICS
Destination constraints
Choice of itinerary and transportation
Fuel and energy consumption
Emissions
DRINKING WINE
Style suitability
Trends, fads and fashion
Seasonality
Stage 2 - Risk assessment for significance
In this stage, the relative risk of an impact is assessed and then assigned a ‘significance’ rating that provides
a ready means of prioritising actions.
A risk assessment matrix (Figure 1) was adapted from Weiss (2003), that takes account of varying levels of
belief in respect of climate change, ranging from ‘Scientific absolutist’ to ‘Environmental absolutist’. For
greater simplicity, in our adaptation of Weiss’ work, we retained three levels of belief: balanced, optimistic
and pessimistic. The risk assessment considers the confidence of the impact as well as the degree of
intervention required in adapting in order to arrive at a ‘risk score’. The risk score is then considered
according to the belief values of the user to determine the significance of each step. The high significance
risks can then be considered as a CCP for further analysis, however, the user can then proceed to address all
the various risks if they wish.
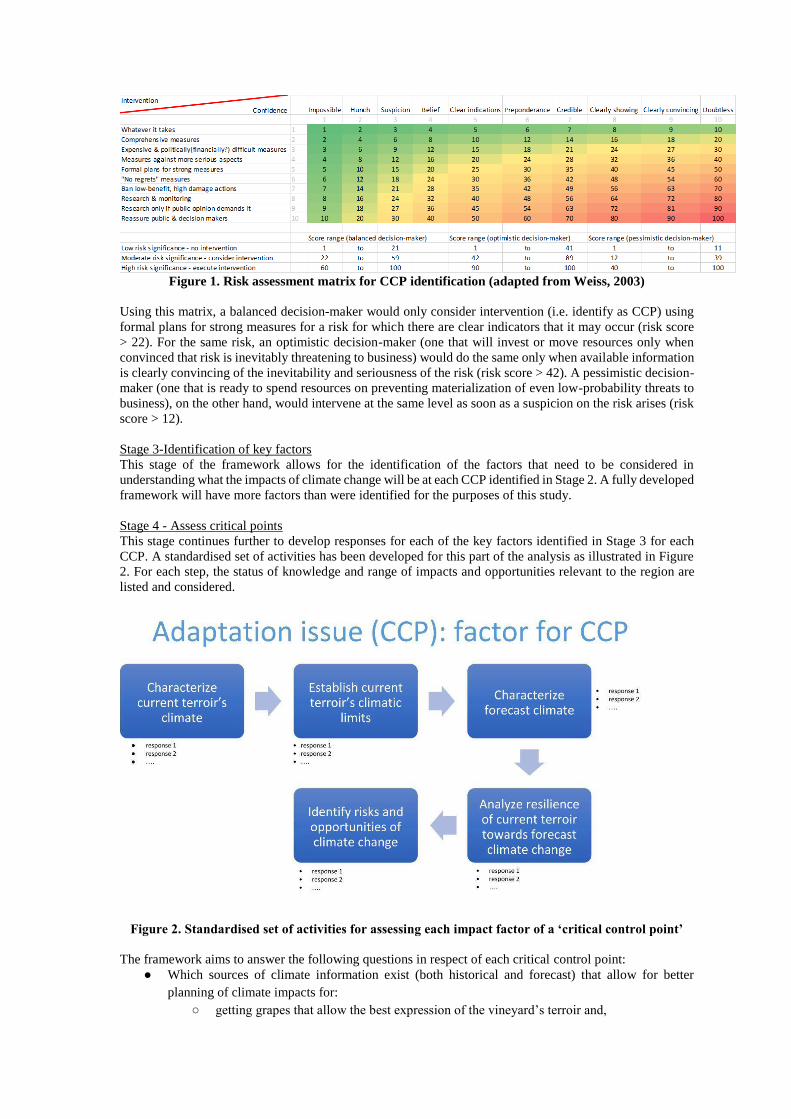
Figure 1. Risk assessment matrix for CCP identification (adapted from Weiss, 2003)
Using this matrix, a balanced decision-maker would only consider intervention (i.e. identify as CCP) using
formal plans for strong measures for a risk for which there are clear indicators that it may occur (risk score
> 22). For the same risk, an optimistic decision-maker (one that will invest or move resources only when
convinced that risk is inevitably threatening to business) would do the same only when available information
is clearly convincing of the inevitability and seriousness of the risk (risk score > 42). A pessimistic decision-
maker (one that is ready to spend resources on preventing materialization of even low-probability threats to
business), on the other hand, would intervene at the same level as soon as a suspicion on the risk arises (risk
score > 12).
Stage 3-Identification of key factors
This stage of the framework allows for the identification of the factors that need to be considered in
understanding what the impacts of climate change will be at each CCP identified in Stage 2. A fully developed
framework will have more factors than were identified for the purposes of this study.
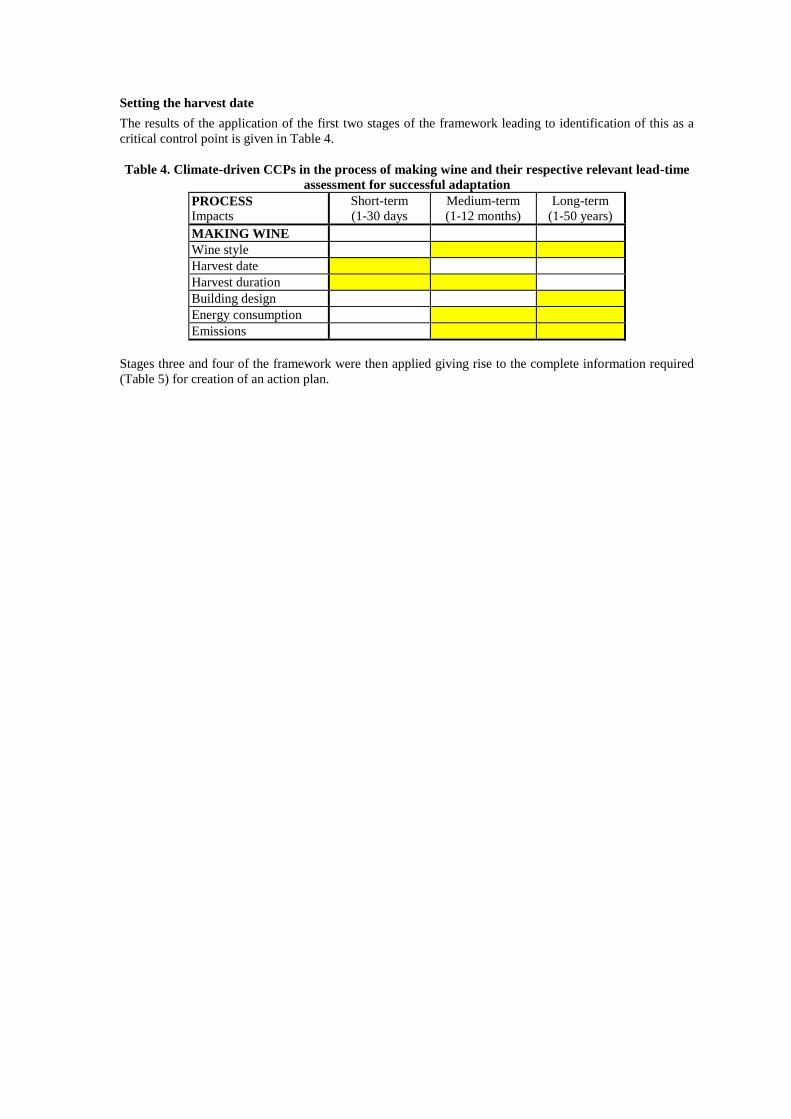
Stage 4 - Assess critical points
This stage continues further to develop responses for each of the key factors identified in Stage 3 for each
CCP. A standardised set of activities has been developed for this part of the analysis as illustrated in Figure
2. For each step, the status of knowledge and range of impacts and opportunities relevant to the region are
listed and considered.
Figure 2. Standardised set of activities for assessing each impact factor of a ‘critical control point’
The framework aims to answer the following questions in respect of each critical control point:
● Which sources of climate information exist (both historical and forecast) that allow for better
planning of climate impacts for:
○ getting grapes that allow the best expression of the vineyard’s terroir and,

○ maximizing operational profitability
● How accessible and easily usable are those sources by the wine industry?
● Which geographical areas in those regions are already covered, which are currently being studied
and which are not yet considered?
Stage 5 - Develop an action plan
Following completion of the first four stages, an action plan for adaptation can be developed, which will
include consideration of the business case for change, as well as identify any missing knowledge and
consequently R&D needs. Developing an action plan was outside the scope of this study, which was intended
to demonstrate the feasibility of the framework approach. The fully developed framework could include a
template action plan for users.
RESULTS AND DISCUSSION In undertaking the analysis it was necessary to limit the scope to a reasonable boundary. Therefore, the work
described here was limited to two critical processes, directly influenced by climate, on two different time-
frames; one long-term (i.e. creation of a new vineyard) and the other mid- to short-term (i.e. setting the
harvest date), in three world wine-growing regions, being (a) Australia and New Zealand (AUS/NZ), (b)
European Union (EU), and (c) North America (USA/CAN). These two “critical control points” were
identified by applying the first two stages of the framework to a generalised process flow of wine production,
and then using the risk matrix for each of the regions within the scope of the study and for an intermediate
degree of belief in climate change.
An important underlying step was to identify the various sources of climate change prediction data and
conduct a preliminary assessment for the three wine-growing regions covered within the scope of the work.
This assessment appears as Appendix 1.
Creation of new vineyard
The results of the application of the first two stages of the framework leading to identification of this as a
critical control point is given in Table 2.
Table 2. Climate-driven CCPs in the process of creating a vineyard and their respective relevant
lead-time assessment for successful adaptation
PROCESS Impacts
Short-term
(1-30 days)
Medium-term
(1-12 months)
Long-term
(1-50 years)
PLANTING VINEYARD
Wines to be made
Siting & terrain preparation
Choice of scion variety
Choice of rootstock
Assessment of water needs
Choice of trellis
Planting density
The process of planting a vineyard is identified as a CCP. According to the level of significance a grower
confers onto this process, the intervention should be reasoned according to the confidence of the perceived
risk. For example, a balanced decision-maker could easily accept that the vineyard’s success will be highly
dependent on the choice of scion variety. In this case, if that choice is perceived as clearly showing risk
towards return on the investment of planting the vineyard, the balanced decision-maker would be open to
execute interventions such as research and monitoring but wary of moving into actual actions before the
perception becomes clearly convincing. A pessimistic decision-maker, however, might go for formal
planning for strong measures, while an optimistic one would only consider action but not execute any at this
stage. The risk assessment matrix, thus provides an objective tool for decision as a function of perceived risk.
Assuming a balanced stance for decision-making, stages three and four of the framework were then applied
giving rise to the complete information required (Table 3) for creation of an action plan.
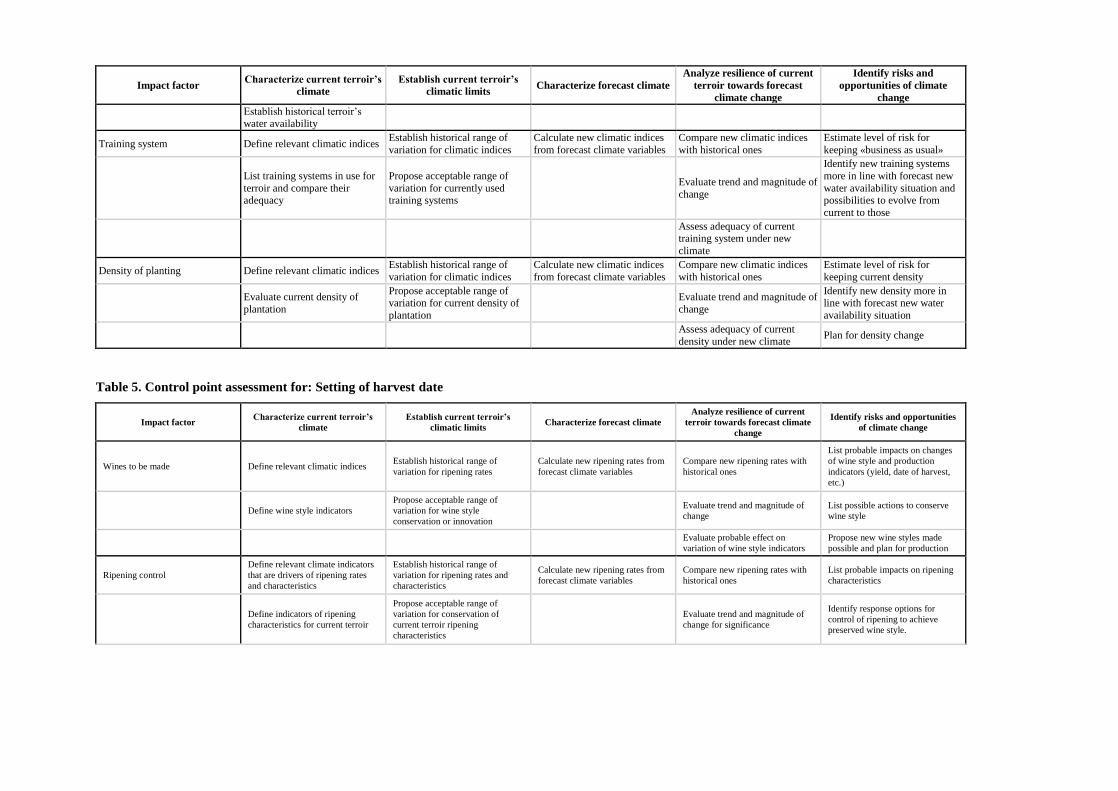
Setting the harvest date
The results of the application of the first two stages of the framework leading to identification of this as a
critical control point is given in Table 4.
Table 4. Climate-driven CCPs in the process of making wine and their respective relevant lead-time
assessment for successful adaptation
PROCESS Impacts
Short-term
(1-30 days
Medium-term
(1-12 months)
Long-term
(1-50 years)
MAKING WINE
Wine style
Harvest date
Harvest duration
Building design
Energy consumption
Emissions
Stages three and four of the framework were then applied giving rise to the complete information required
(Table 5) for creation of an action plan.

Table 3. Control point assessment for: Creation of new vineyard
Impact factor Characterize current terroir’s
climate
Establish current terroir’s
climatic limits Characterize forecast climate
Analyze resilience of current
terroir towards forecast
climate change
Identify risks and
opportunities of climate
change
Wines to be made Define relevant climatic indices Establish historical range of
variation for climatic indices
Calculate new climatic indices
from forecast climate variables
Compare new climatic indices
with historical ones
List probable impacts on changes of wine style and
production indicators (yield,
date of harvest, etc.)
Define wine style indicators
Propose acceptable range of
variation for wine style conservation
Evaluate trend and magnitude of
change
Propose new wine styles made
possible and plan for production
Evaluate probable effect on
variation of wine style
indicators
Terrain preparation Define relevant climatic indices Establish historical range of
variation for climatic indices
Calculate new climatic indices
from forecast climate variables
Compare new climatic indices
with historical ones
List probable impacts on
changes of fertility, water balance and erosion risk
Establish fertility issues
Propose acceptable range of
variation for conservation of current terroir terrain
characteristics
Evaluate trend and magnitude of change
Identify new needs for
irrigation, drainage, deep
fertilization and erosion control.
Establish current water balance Evaluate probable effect on
terrain characteristics Plan for adaptation.
Establish current erosion risk
Identify needs for irrigation,
drainage, deep fertilization and
erosion control
Variety + rootstock Define relevant climatic indices Establish historical range of
variation for climatic indices
Calculate new climatic indices
from forecast climate variables
Compare new climatic indices
with historical ones
List varieties and rootstocks that will be out of their climatic
range
List currently adapted varieties
Propose acceptable range of
variation for conservation of current varieties and rootstocks,
considering their climatic ranges
Evaluate trend and magnitude of change
Identify new varieties and
rootstocks that fit the new
climatic situation
List currently adapted
rootstocks
Evaluate suitability for current
varieties and rootstocks
Water needs Define relevant climatic indices Establish historical range of
variation for climatic indices
Calculate new climatic indices
from forecast climate variables
Compare new climatic indices
with historical ones
Estimate level of risk for
keeping «business as usual»
Establish historical yield series
Propose acceptable range of
variation for water availability
to conserve wine style and historical level of yield
Evaluate trend and magnitude of
change for water availability
Identify new production chains
more in line with forecast new
water availability situation and how to adapt vineyard to them
Evaluate historical water requirements
Assess terroir resilience under new climate
Impact factor Characterize current terroir’s
climate
Establish current terroir’s
climatic limits Characterize forecast climate
Analyze resilience of current
terroir towards forecast
climate change
Identify risks and
opportunities of climate
change
Establish historical terroir’s water availability
Training system Define relevant climatic indices Establish historical range of
variation for climatic indices
Calculate new climatic indices
from forecast climate variables
Compare new climatic indices
with historical ones
Estimate level of risk for
keeping «business as usual»
List training systems in use for
terroir and compare their adequacy
Propose acceptable range of
variation for currently used training systems
Evaluate trend and magnitude of
change
Identify new training systems
more in line with forecast new
water availability situation and possibilities to evolve from
current to those
Assess adequacy of current training system under new
climate
Density of planting Define relevant climatic indices Establish historical range of
variation for climatic indices
Calculate new climatic indices
from forecast climate variables
Compare new climatic indices
with historical ones
Estimate level of risk for
keeping current density
Evaluate current density of
plantation
Propose acceptable range of variation for current density of
plantation
Evaluate trend and magnitude of
change
Identify new density more in line with forecast new water
availability situation
Assess adequacy of current
density under new climate Plan for density change
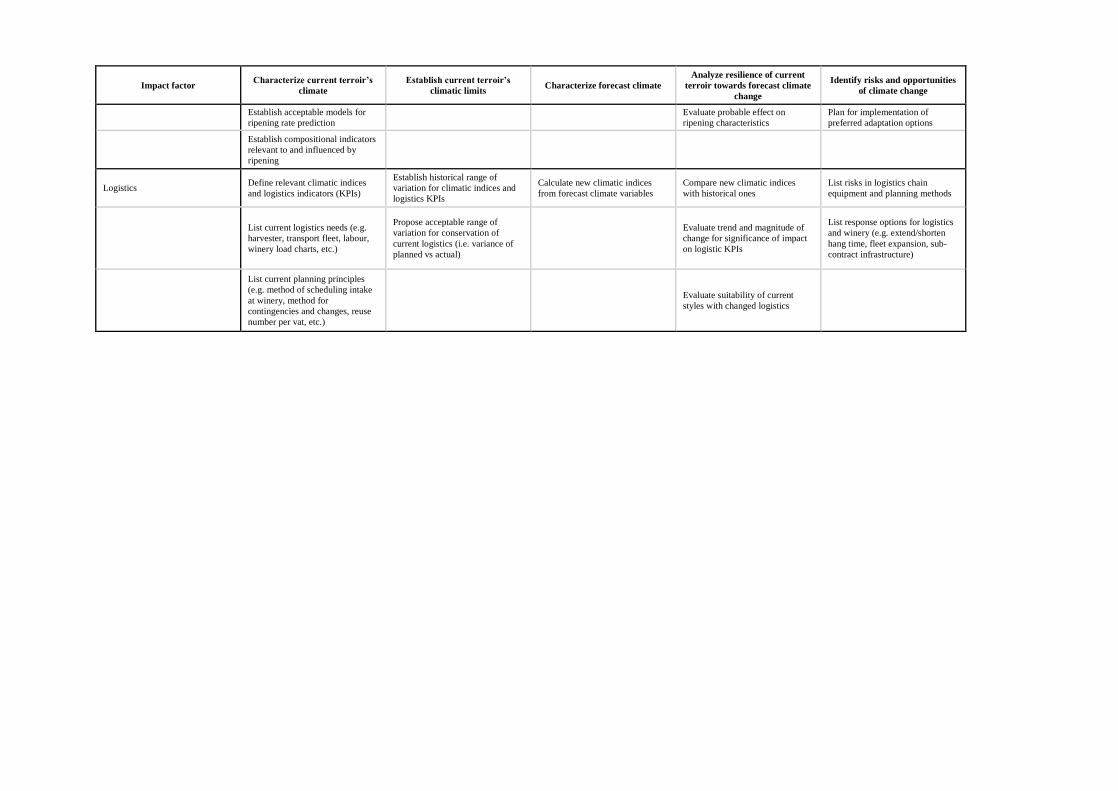
Table 5. Control point assessment for: Setting of harvest date
Impact factor Characterize current terroir’s
climate
Establish current terroir’s
climatic limits Characterize forecast climate
Analyze resilience of current
terroir towards forecast climate
change
Identify risks and opportunities
of climate change
Wines to be made Define relevant climatic indices Establish historical range of
variation for ripening rates
Calculate new ripening rates from
forecast climate variables
Compare new ripening rates with
historical ones
List probable impacts on changes
of wine style and production
indicators (yield, date of harvest,
etc.)
Define wine style indicators
Propose acceptable range of
variation for wine style
conservation or innovation
Evaluate trend and magnitude of
change
List possible actions to conserve
wine style
Evaluate probable effect on
variation of wine style indicators
Propose new wine styles made
possible and plan for production
Ripening control
Define relevant climate indicators
that are drivers of ripening rates
and characteristics
Establish historical range of
variation for ripening rates and
characteristics
Calculate new ripening rates from
forecast climate variables
Compare new ripening rates with
historical ones
List probable impacts on ripening
characteristics
Define indicators of ripening
characteristics for current terroir
Propose acceptable range of
variation for conservation of
current terroir ripening
characteristics
Evaluate trend and magnitude of
change for significance
Identify response options for
control of ripening to achieve
preserved wine style.
Impact factor Characterize current terroir’s
climate
Establish current terroir’s
climatic limits Characterize forecast climate
Analyze resilience of current
terroir towards forecast climate
change
Identify risks and opportunities
of climate change
Establish acceptable models for
ripening rate prediction
Evaluate probable effect on
ripening characteristics
Plan for implementation of
preferred adaptation options
Establish compositional indicators
relevant to and influenced by
ripening
Logistics Define relevant climatic indices
and logistics indicators (KPIs)
Establish historical range of
variation for climatic indices and
logistics KPIs
Calculate new climatic indices
from forecast climate variables
Compare new climatic indices
with historical ones
List risks in logistics chain
equipment and planning methods
List current logistics needs (e.g.
harvester, transport fleet, labour,
winery load charts, etc.)
Propose acceptable range of
variation for conservation of
current logistics (i.e. variance of
planned vs actual)
Evaluate trend and magnitude of
change for significance of impact
on logistic KPIs
List response options for logistics
and winery (e.g. extend/shorten
hang time, fleet expansion, sub-
contract infrastructure)
List current planning principles
(e.g. method of scheduling intake
at winery, method for
contingencies and changes, reuse
number per vat, etc.)
Evaluate suitability of current
styles with changed logistics
A proposal for full development of the framework
The framework used in this study shows promise as a globally-applicable tool, but it would require further
development and refinement to validate the approach beyond the limitations of the scope of this preliminary
study. A large proportion of the background work has been undertaken in this study, and complete expansion
of the framework would be achievable in a relatively short period of time. Such development would need to
involve expert practitioners from the global wine sector in order to ensure complete relevance. There will
also be a need for collation of a large amount of information about climate change data and forecasts from
around the world, and it will be important that collaborators are in a position to ensure that knowledge and
information gaps identified will be addressed in a timely fashion.
Given the need for international collaboration, there will be a requirement for some overall management of
the project at the global industry level, for example the OIV. The authors consider that if sufficient interest
exists from the wine sector to further develop this framework, that they would be prepared to lead a
collaborative proposal to suitable funding and coordinating wine industry organisations. Expressions of
interest and support of industry are sought by the authors.
CONCLUSION A paradox exists today in the wine industry: being dubbed the «canary in the coal mine» of climate change
for several years (Goode, 2012). There is a large corpus of research that has been growing exponentially to
address expected outcomes of climate change, the impacts at different scales and points of the value chain
and mitigation and adaptation strategies together with an increasingly comprehensive set of base data from
remote or more recent times (Ashenfelter & Storchmann, 2016) that focus specifically the grape and wine
industry. Yet, very little is still understood by the wine industry in terms of what climate change is, how it
can be forecast, what uncertainties exist, if and how currently existing forecasts can be used for assessing
risks and to support decision-making. This apparent paradox has been highlighted in a recent paper (Sacchelli
et al., 2016) and seems to stem from inefficient uptake of scientific findings by the socio-economic
community.
At the same time, the climatology science community is busy developing ways of communicating climate
change to farmers and the creation of successful climate services tailor-made for end-users and developed
with them is a major aspect of current ongoing research projects (Brasseur & Gallardo, 2016).
In this work, a preliminary proposed 5-stage framework for developing climate change adaptation plans has
been developed and tested.
The framework uses an HACCP-based approach utilising a novel risk assessment matrix to identify key
control points in wine production process chain which can then be evaluated and addressed for adaptation.
The framework was shown to have promise as a globally-relevant method for developing practical climate
change adaptation plans in the context of conserving terroir or developing new paradigms for the consumer
market. Its global applicability allows for researchers and practitioners to collaborate to locally assess their
own adaptation challenges and opportunities. At a later stage, because of the common framework, local
assessments may be combined in a joint global assessment for the benefit of the wine industry. This global
assessment will be useful to create specific policies upholding wine industry sustainability and to objectively
evaluate the effects of other policies that bear impact on it (water, emissions, biodiversity, trade, etc.).
If sufficient interest from industry exists, then the authors propose a full development of the framework to be
conducted under the auspices of a global wine industry organisation or a consortium of similar peak bodies
in wine producing countries.
LITERATURE CITED
Ashenfelter, O., & Storchmann, K. (2016). The Economics of Wine, Weather, and Climate Change. Review
of Environmental Economics and Policy, rev018.
Barbaresi, A., Dallacasa, F., Torreggiani, D., & Tassinari, P. (2016). Retrofit interventions in non-
conditioned rooms: calibration of an assessment method on a farm winery. Journal of Building
Performance Simulation, 1-14.

Bonada, M., Jeffery, D.W., Petrie, P.R., Moran, M.A. & Sadras, V.O. (2015), Impact of elevated temperature
and water deficit on the chemical and sensory profiles of Barossa Shiraz grapes and wines. Australian
Journal of Grape and Wine Research, 21: 240–253.
Brasseur, G. P., & Gallardo, L. (2016). Climate services: Lessons learned and future prospects. Earth's Future,
4(3), 79-89.
Christidis, N., Jones, G. S., & Stott, P. A. (2015). Dramatically increasing chance of extremely hot summers
since the 2003 European heatwave. Nature Climate Change, 5(1), 46-50.
Daux, V., de Cortazar-Atauri, I. G., Yiou, P., Chuine, I., Garnier, E., Le Roy Ladurie, E., ... & Tardaguila, J.
(2011). An open-database of Grape Harvest dates for climate research: data description and quality
assessment. Climate of the Past Discussions, 7(6).
Dunn, M.R., Lindesay, J.A. & Howden, M. (2015), Spatial and temporal scales of future climate information
for climate change adaptation in viticulture: a case study of User needs in the Australian winegrape
sector. Australian Journal of Grape and Wine Research, 21: 226–239.
Estrada-Flores, S; & Platt, G (2007). Electricity usage in the Australian cold chain, Food Australia, 59: 8;
382-390.
Fraga, H., Malheiro, A. C., Moutinho‐Pereira, J., & Santos, J. A. (2012). An overview of climate change
impacts on European viticulture. Food and Energy Security, 1(2), 94-110.
Fraga, H., Santos, J. A., Malheiro, A. C., Oliveira, A. A., Moutinho‐Pereira, J., & Jones, G. V. (2016).
Climatic suitability of Portuguese grapevine varieties and climate change adaptation. International
Journal of Climatology, 36(1), 1-12.
Goode, J. (2012). Viticulture: Fruity with a hint of drought. Nature, 492(7429), 351-353.
Head, L., Adams, M., McGregor, H. V. & Toole, S. (2014), Climate change and Australia. WIREs Clim
Change, 5: 175–197. doi: 10.1002/wcc.255
Marangon, M., Nesbitt, A., & Milanowski, T. (2016). Global Climate Change and Wine Safety. In Wine
Safety, Consumer Preference, and Human Health (pp. 97-116). Springer International Publishing.
Sacchelli, S., Fabbrizzi, S., & Menghini, S. (2016). Climate change, wine and sustainability: a quantitative
discourse analysis of the international scientific literature. Agriculture and Agricultural Science
Procedia, 8, 167-175.
Sadras, V. O., & Moran, M. A. (2012). Elevated temperature decouples anthocyanins and sugars in berries
of Shiraz and Cabernet Franc. Australian Journal of Grape and Wine Research, 18(2), 115-122.
Salomé, C., Coll, P., Lardo, E., Metay, A., Villenave, C., Marsden, C., & Le Cadre, E. (2016). The soil quality
concept as a framework to assess management practices in vulnerable agroecosystems: A case study in
Mediterranean vineyards. Ecological Indicators, 61, 456-465.
Webb, L. B., Whetton, P. H. & Barlow E. W. R. (2007), Modelled impact of future climate change on the
phenology of winegrapes in Australia. Australian Journal of Grape and Wine Research, 13: 165–175.
Webb , L., Whiting, J., Watt, A., Hill, T., Wigg, F., Dunn, G., Needs, S., & Barlow, E.W.R. (2010). Managing
Grapevines through Severe Heat: A Survey of Growers after the 2009 Summer Heatwave in South-
eastern Australia, Journal of Wine Research, 21 (2-3), 147-165.
Webb, L. B., Whetton, P. H. & Barlow E. W. R. (2011), Observed trends in winegrape maturity in Australia.
Global Change Biology, 17: 2707–2719
Weiss, C. 2003. Scientific Uncertainty and Science-Based Precaution. International Environmental
Agreements: Politics, Law and Economics 3:137-166.
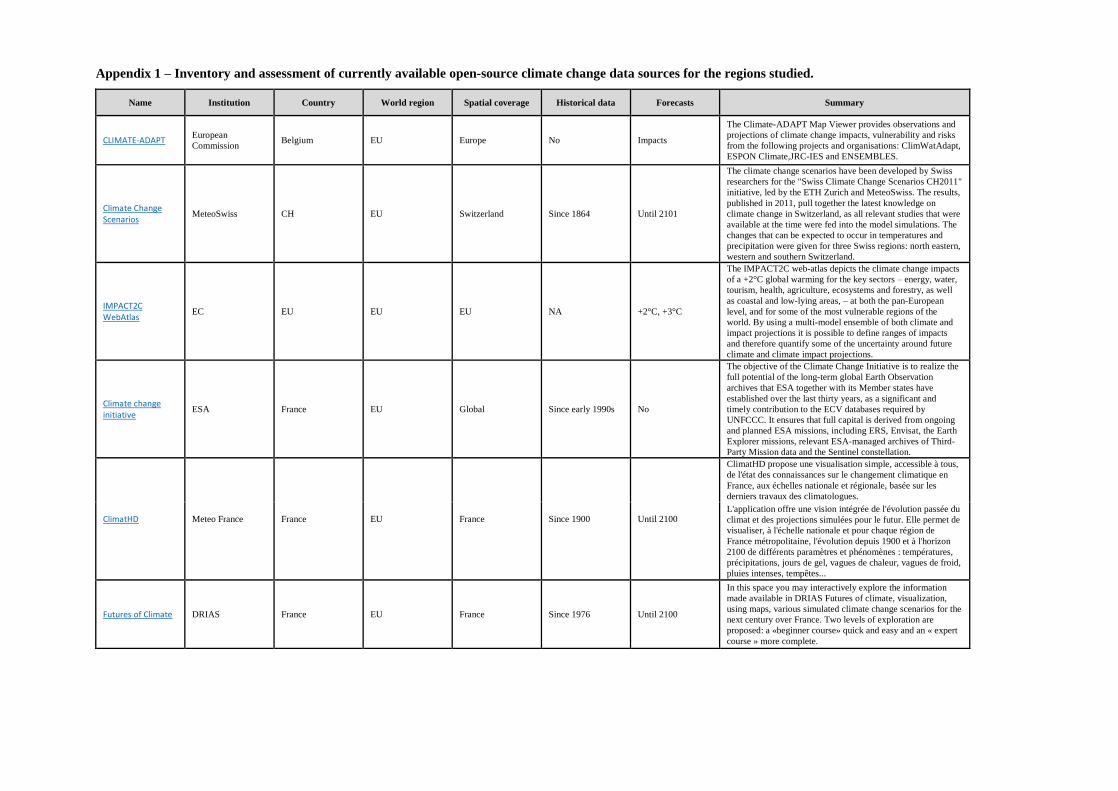
Appendix 1 – Inventory and assessment of currently available open-source climate change data sources for the regions studied.
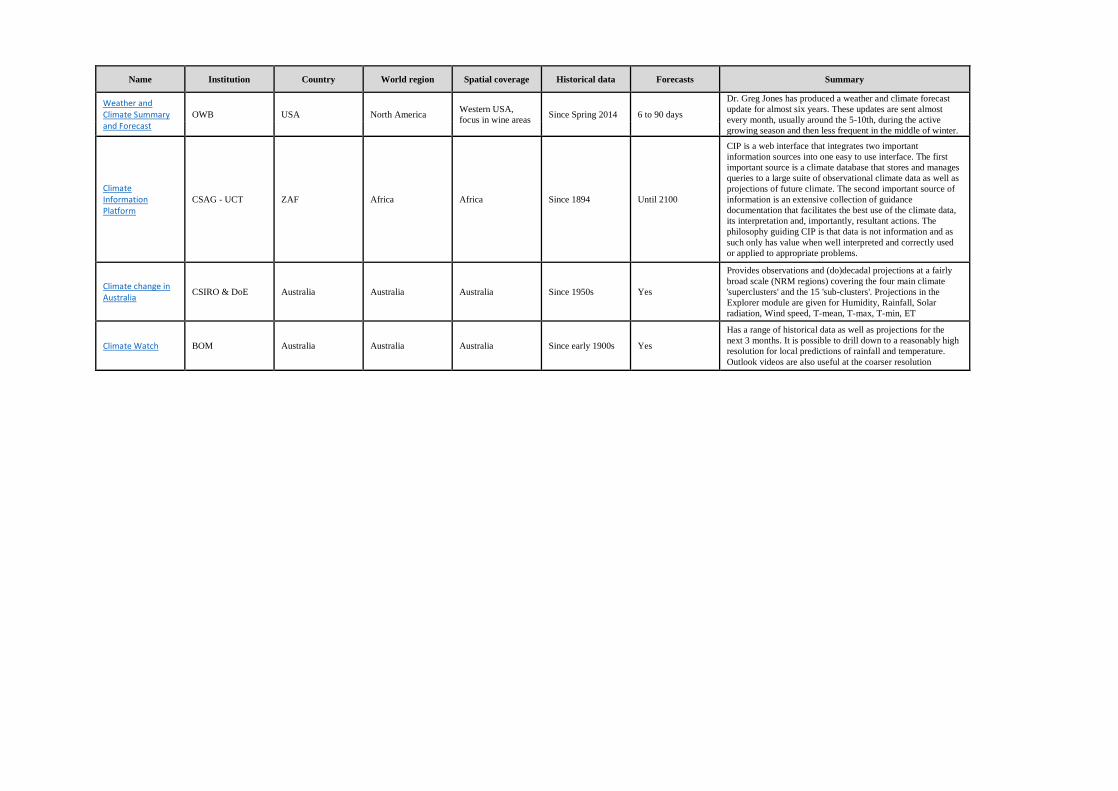
Name Institution Country World region Spatial coverage Historical data Forecasts Summary
CLIMATE-ADAPT
European
Commission Belgium EU Europe No Impacts
The Climate-ADAPT Map Viewer provides observations and
projections of climate change impacts, vulnerability and risks
from the following projects and organisations: ClimWatAdapt,
ESPON Climate,JRC-IES and ENSEMBLES.
Climate Change Scenarios
MeteoSwiss CH EU Switzerland Since 1864 Until 2101
The climate change scenarios have been developed by Swiss
researchers for the "Swiss Climate Change Scenarios CH2011"
initiative, led by the ETH Zurich and MeteoSwiss. The results,
published in 2011, pull together the latest knowledge on
climate change in Switzerland, as all relevant studies that were
available at the time were fed into the model simulations. The
changes that can be expected to occur in temperatures and
precipitation were given for three Swiss regions: north eastern,
western and southern Switzerland.
IMPACT2C WebAtlas
EC EU EU EU NA +2°C, +3°C
The IMPACT2C web-atlas depicts the climate change impacts
of a +2°C global warming for the key sectors – energy, water,
tourism, health, agriculture, ecosystems and forestry, as well
as coastal and low-lying areas, – at both the pan-European
level, and for some of the most vulnerable regions of the
world. By using a multi-model ensemble of both climate and
impact projections it is possible to define ranges of impacts
and therefore quantify some of the uncertainty around future
climate and climate impact projections.
Climate change initiative
ESA France EU Global Since early 1990s No
The objective of the Climate Change Initiative is to realize the
full potential of the long-term global Earth Observation
archives that ESA together with its Member states have
established over the last thirty years, as a significant and
timely contribution to the ECV databases required by
UNFCCC. It ensures that full capital is derived from ongoing
and planned ESA missions, including ERS, Envisat, the Earth
Explorer missions, relevant ESA-managed archives of Third-
Party Mission data and the Sentinel constellation.
ClimatHD Meteo France France EU France Since 1900 Until 2100
ClimatHD propose une visualisation simple, accessible à tous,
de l'état des connaissances sur le changement climatique en
France, aux échelles nationale et régionale, basée sur les
derniers travaux des climatologues.
L'application offre une vision intégrée de l'évolution passée du
climat et des projections simulées pour le futur. Elle permet de
visualiser, à l'échelle nationale et pour chaque région de
France métropolitaine, l'évolution depuis 1900 et à l'horizon
2100 de différents paramètres et phénomènes : températures,
précipitations, jours de gel, vagues de chaleur, vagues de froid,
pluies intenses, tempêtes...
Futures of Climate DRIAS France EU France Since 1976 Until 2100
In this space you may interactively explore the information
made available in DRIAS Futures of climate, visualization,
using maps, various simulated climate change scenarios for the
next century over France. Two levels of exploration are
proposed: a «beginner course» quick and easy and an « expert
course » more complete.

Name Institution Country World region Spatial coverage Historical data Forecasts Summary
German Climate Atlas
Deutscher
Wetterdienst Germany EU Germany Since 1881 Until 2100
The General section of the German Climate Atlas provides
selected weather elements (air temperature, precipitation, etc.)
as well as other parameters which suggest some of the possible
anticipated effects of climate change.
Klimaateffectatlas Nederland
Climate Adaptation
Services Netherlands EU Netherlands No 2050
This interactive tool sets (future) threats of flooding, flooding,
drought and heat stress on the map. You can fill your parish
name and see what is happening in your area. Using the search
option makes it possible to zoom directly to a municipality or
waterway.
Climate explorer KNMI Netherlands EU Global
Some series go as
far back as the year
500 AD
No
The KNMI Climate Explorer is a web application to analysis
climate data statistically. It started in late 1999 as a simple web
page to analyse ENSO teleconnections and has grown over the
years to more than 1TB of climate data and dozens of analysis
tools. The KNMI Climate Explorer is not operational: if it
breaks down it will be fixed during Dutch office hours. Over
the last few years the availability has been pretty good,
although sometimes a few users slow down the system by
doing large computations simultaneously.
The seasonal forecast verification page was supported by the
EU project ENSEMBLES, the rest is an informal KNMI
project.
Much of the observational data is updated monthly. Other data
is updated when needed. More and more data is pulled from
external sites on request, see the link external data.
E-OBS Climate Indices
ECA&D - KNMI Netherlands EU Europe Since 1950 No
For every ECA&D station, a total of 75 indices have been
calculated. Indices data are freely available for non-
commercial research and education: see our data policy for
more details. Each index describes a particular characteristic of
climate change (both changes in the mean and the extremes).
A core set of 26 indices follows the definitions recommended
by the CCl/CLIVAR/JCOMM Expert Team on Climate
Change Detection and Indices (ETCCDI). These indices are
calculated in a similar way for other regions of the world. An
additional set of 49 indices highlights particular characteristics
of climate change in Europe (including snow depth, sunshine
duration, etc.).
Serviços de clima IPMA Portugal EU Portugal Since 1865 Until 2100
Apresentam-se agora os primeiros resultados gráficos deste
projeto para a temperatura e precipitação, correspondentes ao
clima dos últimos 150 anos e ao clima previsto até ao final do
século, identificando as anomalias em relação à normal de
referência 1961-90 e utilizando dois cenários socioeconómicos
contrastantes.
ENSEMBLES Downscaling Portal
Universidad de
Cantabria Spain EU Global Several decades Regional and local
The downscaling portal allows end-users to
calibrate/downscale the coarse model outputs in the region of
interest using historical observed records. The portal includes
public observation datasets (e.g. GSOD) and allows uploading
new historical data (including private datasets, not available
for other users).
Name Institution Country World region Spatial coverage Historical data Forecasts Summary
This Statistical Downscaling portal provides user-friendly web
access to different statistical downscaling techniques and
works transparently with the observations, reanalysis and
global climate simulations (see the common list of variables
available for all models in the portal), obtaining the resulting
outputs in simple formats (e.g., text files).
Servicios climaticos AEMET Spain EU Spain Since 1850 From 3 months to
2100
En este apartado se incluye información climatológica general
sobre valores medios y extremos de las series de datos
climatológicos, productos de vigilancia del clima, predicciones
de rango estacional, y proyecciones de cambio climático para
el siglo XXI para España bajo diferentes escenarios de
emisión.
Decadal forecast MetOffice UK EU Global Validation with
observed values 5 years
Decadal forecasts, also called 'near-term' climate predictions,
range up to a decade ahead. Predictions account for natural
variability and climate change as these are expected to be of
similar size in many parts of the world over this forecast
period. Forecasts are experimental, so at this early stage of
development expert advice is needed to assess the reliability of
regional predictions.
Climate impact indicator toolkit
CLIPC: Climate
Information Portal
for Copernicus
UK EU Europe From climatic
series
Impacts according
to some climate
change scenarios
(i.e. RCP85)
The toolkit allows you to access climate change indicators.
The toolkit presents tools allowing you to explore the available
data and to switch between different indicators and different
climate change and socio-economic scenarios.
The available impact indicators can be selected through the
overarching themes CLIPC focuses on; urban, water and rural
available at the top of the toolkit. The left side of the toolkit
allows you to zoom in and out, select layers, add additional
layers, open a help function, go back to the homepage,
download and save your selection and share you selection.
Forecasts ECMWF UK EU Global No Medium, extended
and long-range
All ECMWF’s operational forecasts aim to assess the most
likely forecast and also the degree of confidence one can have
in that forecast. To do this the Centre carries out an ensemble
of predictions which individually are full descriptions of the
evolution of the weather, but collectively they assess the
likelihood or probability of a range of possible future weather.
GPC Outlooks MetOffice UK EU Global Validation with
observed values 2 to 6 months
Model probabilistic guidance for temperature and rainfall up to
six months ahead. Updated monthly.
Multi-model decadal forecast exchange
MetOffice UK EU Global Validation with
observed values 1 to 5 years
International multi-model decadal forecast exchange.
Currently three variables are included: surface air temperature,
sea-level pressure and precipitation. These are shown as
differences from the 1971-2000 baseline
Forecasts ECMWF UK EU Global Since 1950s 10 days to 13
months
Our Integrated Forecasting System (IFS) provides forecasts for
multiple time ranges.

Name Institution Country World region Spatial coverage Historical data Forecasts Summary
We provide a range of forecast products to address different
user requirements. These present key aspects of the forecast
evolution and the associated uncertainty. Specific products
designed to highlight potential severe weather events include
the Extreme Forecast Index and tropical cyclone activity.
CPC Three-month outlooks
NOAA-NWS USA North America USA Since 1981 0.5 to 12.5 months
The Climate Prediction Center's (CPC) products are
operational predictions of climate variability, real-time
monitoring of climate and the required data bases, and
assessments of the origins of major climate anomalies. The
products cover time scales from a week to seasons, extending
into the future as far as technically feasible, and cover the land,
the ocean, and the atmosphere, extending into the stratosphere.
Flexible forecasts IRI USA North America Global Since 1950 1 to 6 months
Probabilistic seasonal forecasts from multi-model ensembles
through the use of statistical recalibration, based on the
historical performance of those models, provide reliable
information to a wide range of climate risk and decision
making communities, as well as the forecast community. The
flexibility of the full probability distributions allows to deliver
interactive maps and pointwise distributions that become
relevant to user-determined needs.
Global Climate Dashboard
NOAA-NWS USA North America USA Mostly since the
1950s Until 2020
NOAA portal for climate change, climate variability and
climate projection data for the USA. Is integrated with long-
term data sources from NOAA and short- to long-term forecast
data from the Climate Prediction Center.
NW Climate Toolbox
CIRC USA North America USA Short-term 70-90 days
The Pacific Northwest Climate Impacts Research Consortium
(CIRC) is a research organization funded by NOAA to provide
policy makers, resource managers, and fellow researchers with
the best available science covering the changing climate of
Oregon, Washington, Idaho, and western Montana.
Tableau Climate Projection Tool
CIG USA North America Pacific Northwest Varies 2050s to 2080s
The Climate Impacts Group at the University of Washington
provides regional tools for helping to reduce climate risks by
providing robust and reliable information that people can use
when making decisions. CIG provides the fundamental
scientific understanding, data, tools, and guidance decision
makers need to identify and reduce climate risks. This tool
allows users to graphically visualize projected changes in
temperature and precipitation for two future time periods in
three regions in the Pacific Northwest.
Pacific Northwest Climate Maps
CIG USA North America Pacific Northwest Since 1915 2020s to 2040s
Additional tool available from the CIG that provides an
examination of how climate varies from time to time and place
to place across the Pacific Northwest. The tool creates maps
that show climate anomalies – the changes in climate –
associated with different patterns of climate variability
compared to average conditions during 1915-2003.
Cal-Adapt Cal-Adapt USA North America California 1961-1990 Mix of short-term
to 2070-2099
The California Energy Commission developed the Cal-Adapt
Web site to synthesize existing California climate change
scenarios and climate impact research and to encourage its use
in a way that is beneficial for local decision-makers.
ClimateWise ClimateWise USA North America USA Varies Varies
Private organization that has produced a tool and framework to
help local leaders develop “Whole Community” adaptation
strategies to address the impacts of climate change.
Name Institution Country World region Spatial coverage Historical data Forecasts Summary
Weather and Climate Summary and Forecast
OWB USA North America Western USA,
focus in wine areas Since Spring 2014 6 to 90 days
Dr. Greg Jones has produced a weather and climate forecast
update for almost six years. These updates are sent almost
every month, usually around the 5-10th, during the active
growing season and then less frequent in the middle of winter.
Climate Information Platform
CSAG - UCT ZAF Africa Africa Since 1894 Until 2100
CIP is a web interface that integrates two important
information sources into one easy to use interface. The first
important source is a climate database that stores and manages
queries to a large suite of observational climate data as well as
projections of future climate. The second important source of
information is an extensive collection of guidance
documentation that facilitates the best use of the climate data,
its interpretation and, importantly, resultant actions. The
philosophy guiding CIP is that data is not information and as
such only has value when well interpreted and correctly used
or applied to appropriate problems.
Climate change in Australia
CSIRO & DoE Australia Australia Australia Since 1950s Yes
Provides observations and (do)decadal projections at a fairly
broad scale (NRM regions) covering the four main climate
'superclusters' and the 15 'sub-clusters'. Projections in the
Explorer module are given for Humidity, Rainfall, Solar
radiation, Wind speed, T-mean, T-max, T-min, ET
Climate Watch BOM Australia Australia Australia Since early 1900s Yes
Has a range of historical data as well as projections for the
next 3 months. It is possible to drill down to a reasonably high
resolution for local predictions of rainfall and temperature.
Outlook videos are also useful at the coarser resolution