Embed Size (px)
Citation preview
Proposal for Rulemaking Process of Electrical Safety
Regulation for Fuel Cell Vehicle High Voltage Systems
Submitted by the experts from Republic of KoreaSeoul National University
Professor Jaehong [email protected]
May 2008
ELSA-2-5

2
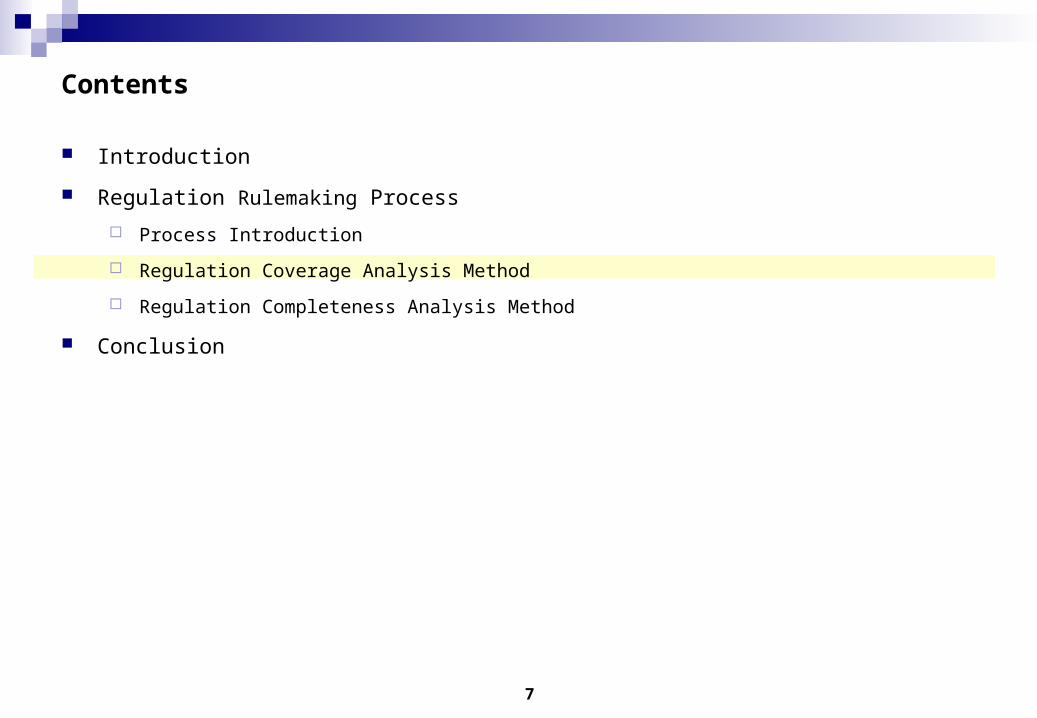
Contents
Introduction
Regulation Rulemaking Process
Process Introduction
Regulation Coverage Analysis Method
Regulation Completeness Analysis Method
Conclusion

3
Introduction
Background Regulations are needed for ensuring safe operation of FCV high voltage system
To prevent fire, explosion, human injuries
Complex system behavior makes it difficult to generate regulation which can prevent all possible
accidents A methodology to check the coverage and completeness of the regulation items is needed
Objective Propose a rulemaking process of electrical safety regulation for fuel cell vehicle high voltage syst
ems Capable of checking coverage, completeness
Capable of suggesting new regulations from existing regulations

4
Contents
Introduction
Regulation Rulemaking Process
Process Introduction
Regulation Coverage Analysis Method
Regulation Completeness Analysis Method
Conclusion

5
Process Introduction
Concept Generate requirement list by brain storming and update the requirements systematically
Use Regulation Coverage Analysis Method to check and improve coverage of regulated areas Use Regulation Completeness Analysis Method to check and improve completeness of requirements
regulationitempool
newregulation
items
newregulation
items
RegulationCoverageAnalysisMethod
RegulationCompleteness
AnalysisMethod
update & merge
update & merge
check
compensate
compensate
brainstormregulation
items
check

6
Process Introduction
Flow chart Generate new requirement item pool
Make an item pool that stores requirement items
Generate requirement items by brainstorming
Check & compensate coverage Use proposed “Regulation Coverage
Analysis Method”
Check & compensate completeness Use proposed “Regulation Complete
ness Analysis Method”
Update requirement item pool Update item pool by adding new requ
irement items
Start
Generate Item Pool
Check & Compensate Coverage(Regulation Coverage Analysis Method)
Update Item Pool
End
Check & Compensate Completeness(Regulation Completeness Analysis Method)
7
Contents
Introduction
Regulation Rulemaking Process
Process Introduction
Regulation Coverage Analysis Method
Regulation Completeness Analysis Method
Conclusion
8
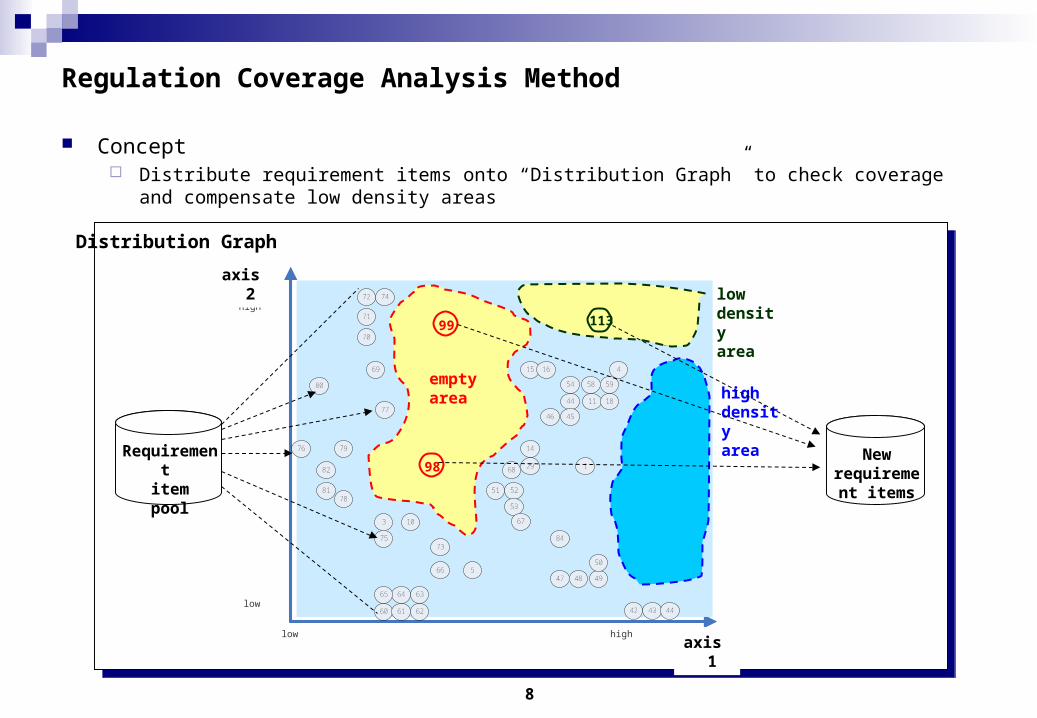
Regulation Coverage Analysis Method
Concept Distribute requirement items onto “Distribution Graph” to check coverage and compensate low
density areas
Distribution Graph
ImportanceImportance
1
Human
2
3
4
5
6
7
8
9
10
11
12
13
14
15 16
17
1819
20
21 22
23 24
2526 27
28
29
30
3132
3334
353639
38
3740
42 43 44
44
4546
47 48 49
50
51 52
53
54
55 56 57
58 59
60 61 62
636465
66
67
68
69
70
71
72
73
74
75
76
77
78
79
80
81
82
83
84
85
86
low
high
axis 2
axis 1low high
highdensityarea
lowdensityarea
emptyarea
Requirement itempool
Newrequirement
items
99 113
98

9
Regulation Coverage Analysis Method (Cont’d)
Step 1: Brainstorm / Generate axis Pool
Step 2: Draw empty Distribution Graphs
Step 3: Categorize items with axes
Step 4: Fill in Distribution Graphs
Step 5: Analyze Distribution Graphs
Step 6: Compensate weak area
Step 1
Step 2
Step 3
Step 4
Step 5
Step 6
Flowchart
Start
Brainstorm / Generate Axis Pool
Draw empty Distribution Graphs
Categorize items with axes
Analyze Distribution Graphs
Is the emptiness/weakness
reasonable?
Compensate weak area
End
Yes
No
Fill in Distribution Graphs

10
Step 1: Brainstorm / Generate Axis Pool START
Brainstorm / Generate Axis Pool
Set 2 Axes /Draw empty Distribution Graph
Categorize items with Analyzing Axes
Find empty/weak area & Analyze
Is the emptiness/weakness
reasonable?
Add more items / Cover the area
END
Yes
No
Fill in Distribution Graph
Brainstorm as many axes as possible which can be used to check the
coverage of requirement items
Add axes into axis pool
Examples of axes Probability of successive accident
Manufacturer-related to user-related
Machine-related to human-related
Low electric current to high electric current
Idle speed to high speed
user
electriccurrent
human
one axis two axes
manufacturer
high
lowmachine

11
Step 2: Draw empty Distribution Graphs START
Brainstorm / Generate Axis Pool
Set 2 Axes /Draw empty Distribution Graph
Categorize items with Analyzing Axes
Find empty/weak area & Analyze
Is the emptiness/weakness
reasonable?
Add more items / Cover the area
END
Yes
No
Fill in Distribution Graph
Select two axes and draw Distribution Graphs
Consider all possible combinations formed by two axes out of axis pool
Select two axes whose combination is meaningful
Example Axis 1: manufacturer-related to user-related
Axis 2: low probability to high probability of accident
Importance
ManufacturerRelated
UserRelated
Importance
12
Step 3: Categorize items with axes START
Brainstorm / Generate Axis Pool
Set 2 Axes /Draw empty Distribution Graph
Categorize items with Analyzing Axes
Find empty/weak area & Analyze
Is the emptiness/weakness
reasonable?
Add more items / Cover the area
END
Yes
No
Fill in Distribution Graph
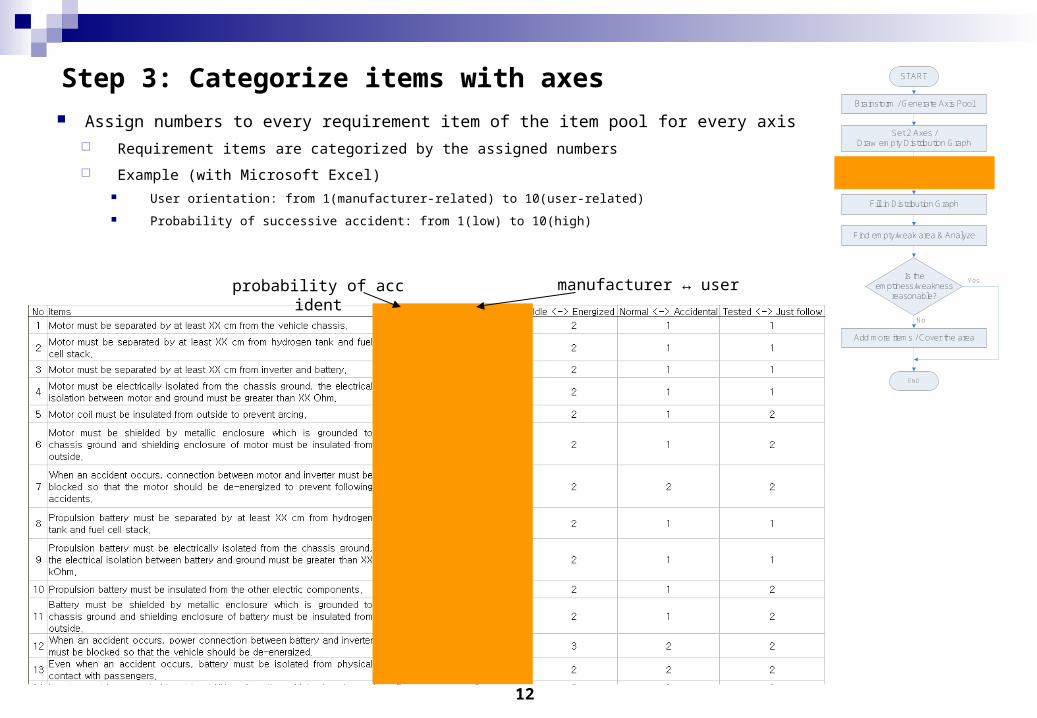
Assign numbers to every requirement item of the item pool for every axis
Requirement items are categorized by the assigned numbers
Example (with Microsoft Excel) User orientation: from 1(manufacturer-related) to 10(user-related)
Probability of successive accident: from 1(low) to 10(high)
probability of accident manufacturer ↔ user
13
Step 4: Fill in Distribution Graphs START
Brainstorm / Generate Axis Pool
Set 2 Axes /Draw empty Distribution Graph
Categorize items with Analyzing Axes
Find empty/weak area & Analyze
Is the emptiness/weakness
reasonable?
Add more items / Cover the area
END
Yes
No
Fill in Distribution Graph
Importance
ManufacturerRelated
UserRelated
Importance
2
1
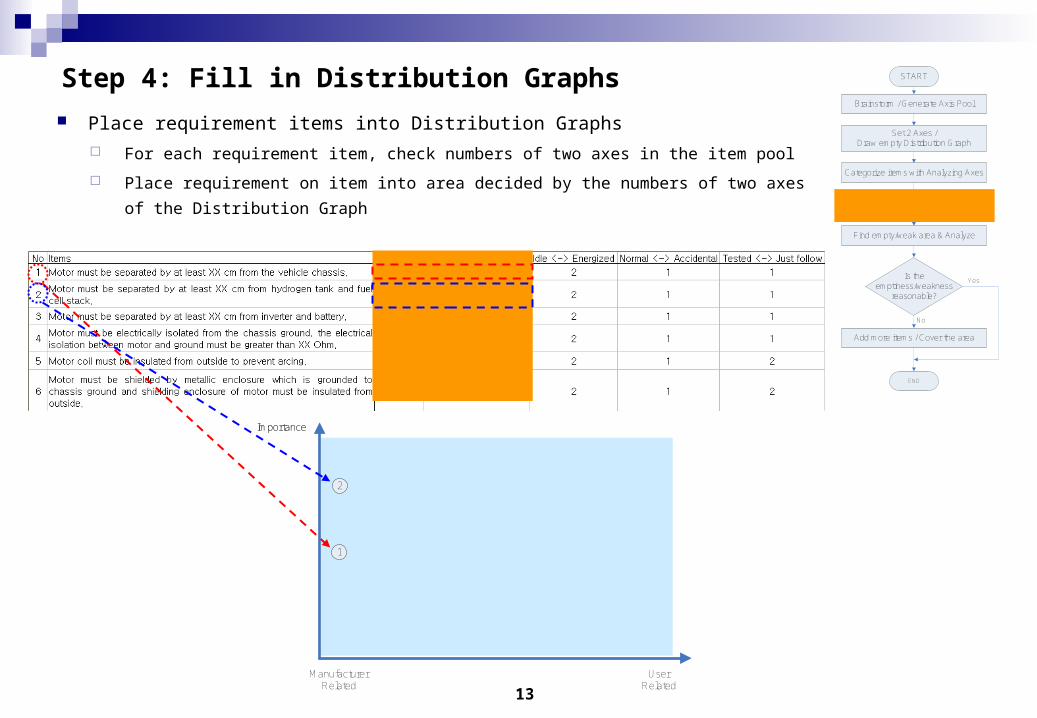
Place requirement items into Distribution Graphs
For each requirement item, check numbers of two axes in the item pool
Place requirement on item into area decided by the numbers of two axes of the
Distribution Graph
14
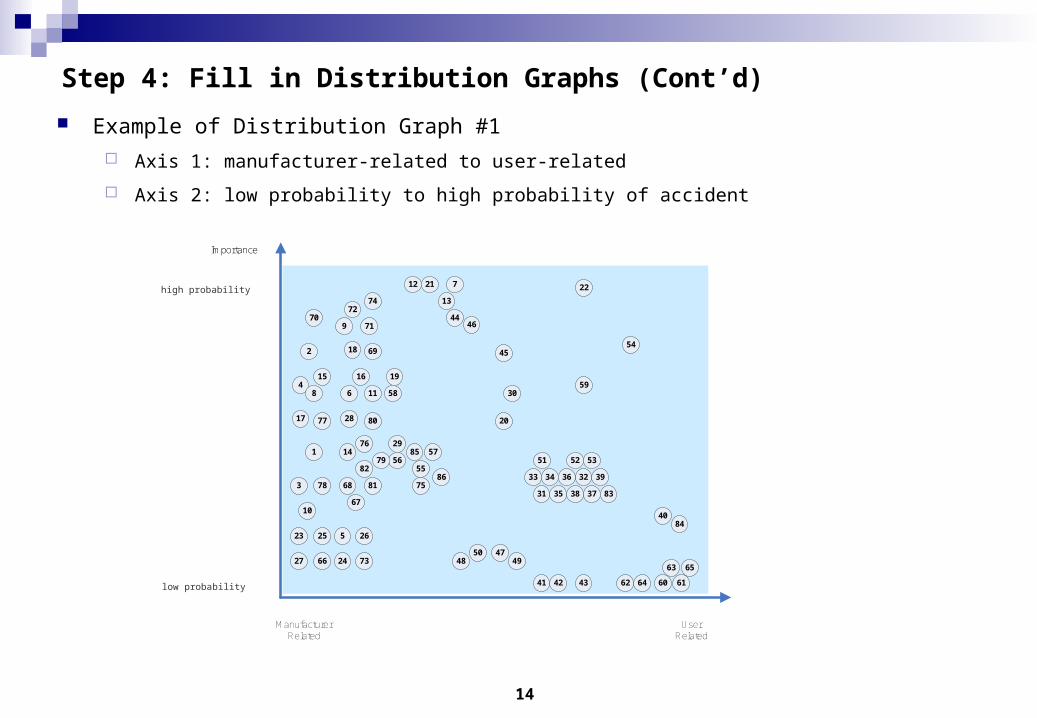
Step 4: Fill in Distribution Graphs (Cont’d)
Example of Distribution Graph #1
Axis 1: manufacturer-related to user-related
Axis 2: low probability to high probability of accident
Importance
ManufacturerRelated
UserRelated
Importance
1
2
3
4
5
6
7
8
9
10
16
17
18
19
20
11
12
13
14
15
21 22
23
24
25 26
27
28
29
30
31
3233 34
35
36
3738
39
40
41 42 43
44
45
46
4748 49
50
51 52 53
54
5556
57
5859
60 6162
63
64
6566
67
68
69
7071
72
73
74
75
76
77
78
79
80
81
82
83
84
85
86
low probability
high probability

15
Step 4: Fill in Distribution Graphs (Cont’d)
ImportanceImportance
1
Human
2
3
4
5
6
7
8
9
10
11
12
13
14
15 16
17
1819
20
21 22
23 24
2526 27
28
29
30
3132
3334
353639
38
3740
42 43 44
44
4546
47 48 49
50
51 52
53
54
55 56 57
58 59
60 61 62
636465
66
67
68
69
70
71
72
73
74
75
76
77
78
79
80
81
82
83
84
85
86
Example of Distribution Graph #2
Axis 1: machine-related to human-related
Axis 2: low probability to high probability of accident
low probability
high probability
machine related human related
16
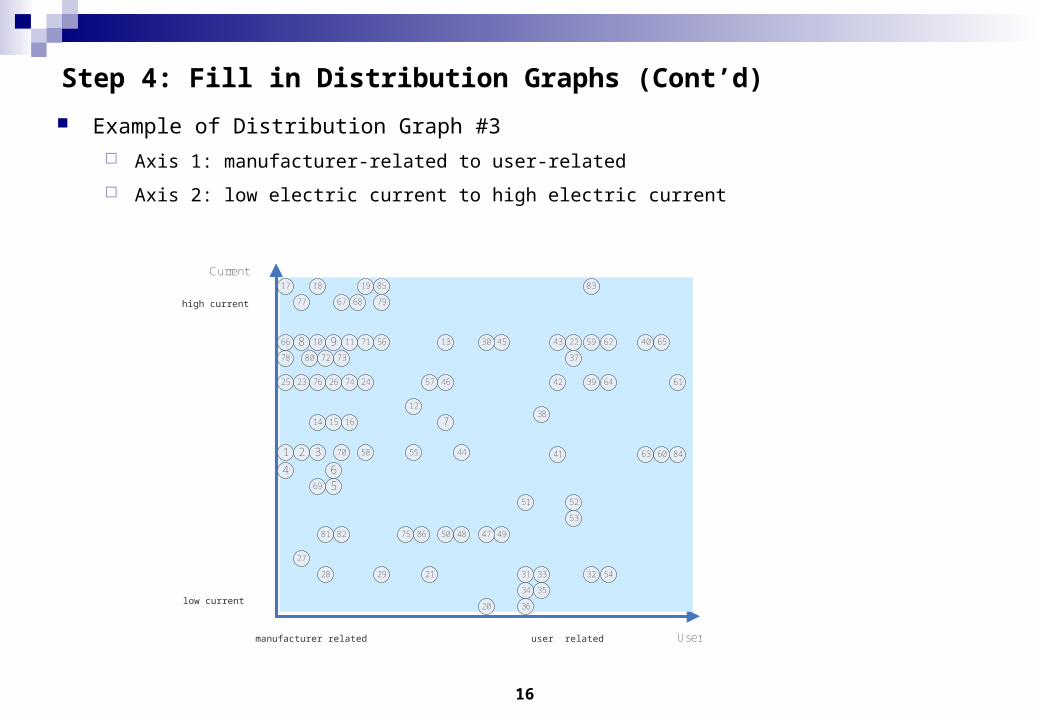
Step 4: Fill in Distribution Graphs (Cont’d)
Example of Distribution Graph #3
Axis 1: manufacturer-related to user-related
Axis 2: low electric current to high electric current
Current
User
43
49
45
41
52
46
44
50 4748
51
54
1 2
25
17
161514
4
12
22
21
11910
18
3
26
5
6
7
23 24
27
13
28
20
8
19
34
33 3231
38
37
36
35
29
30
39
40
42
53
86
85
8458
57
56
55
83
8281
80
79
78
77
76
75
74
7372
71
70
69
6867
66 65
64
63
62
61
60
59
manufacturer related user related
low current
high current
17
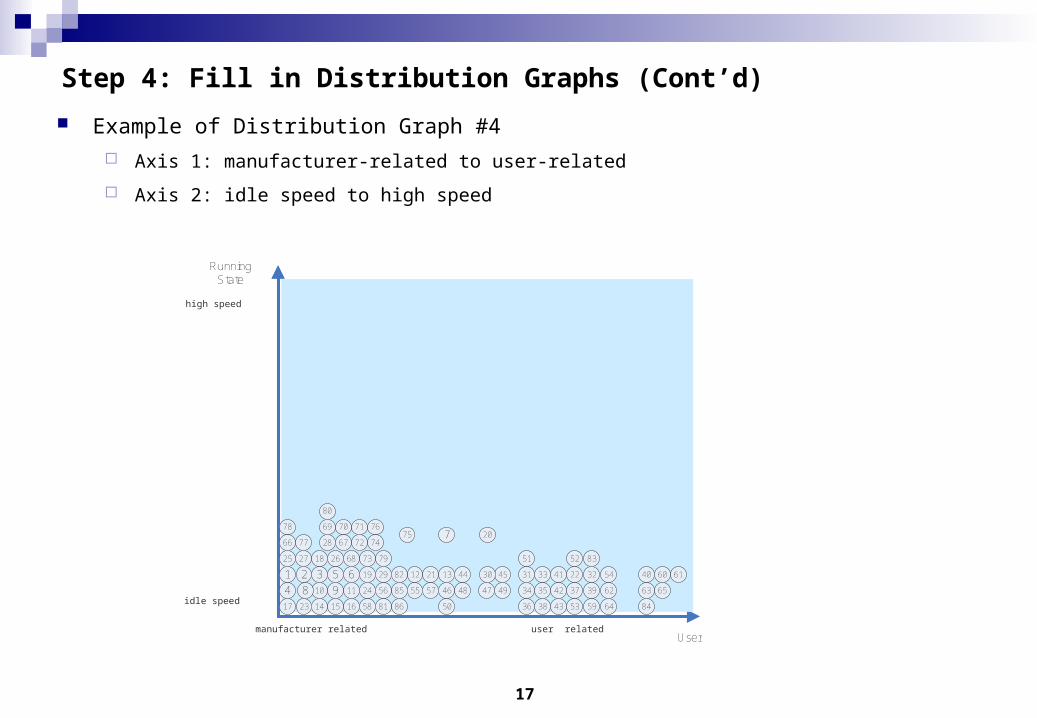
Step 4: Fill in Distribution Graphs (Cont’d)
Example of Distribution Graph #4
Axis 1: manufacturer-related to user-related
Axis 2: idle speed to high speed
RunningState
43
49
45 41
52
46
44
50
4748
51
541 2
25
17 161514
4
12 2221
11910
18
3
26
5 6
7
23
24
27
13
2820
8
19
34
33 3231
38
37
36
35
29 30
User
39
40
42
5386
85
8458
5756 55
83
82
81
80
79
78
77
7675
74
73
72
717069
68
6766
65
64
6362
6160
59
manufacturer related user related
idle speed
high speed

18
Step 4: Fill in Distribution Graphs (Cont’d)
Example of Distribution Graph #5
Axis 1: machine-related to human-related
Axis 2: low electric current to high electric current
Current
7578
76
79
7782
85
80
81
83
84
86
47
50
39
4549
40
48
51
52
46
53
54
55
74
72 73
56
57
58
63
59
60
61
71 62
70
1 2
25
17
16
15
14
412
22
21
11
9
10
18
326
5 6 723 24
2713 28
20
8
19
34
33
32
31
38
37
36
35
29
30
Human
43
42
41
44
64
65 66
6768
69
low current
high current
machine related human related
19
START
Brainstorm / Generate Axis Pool
Set 2 Axes /Draw empty Distribution Graph
Categorize items with Analyzing Axes
Find empty/weak area & Analyze
Is the emptiness/weakness
reasonable?
Add more items / Cover the area
END
Yes
No
Fill in Distribution Graph
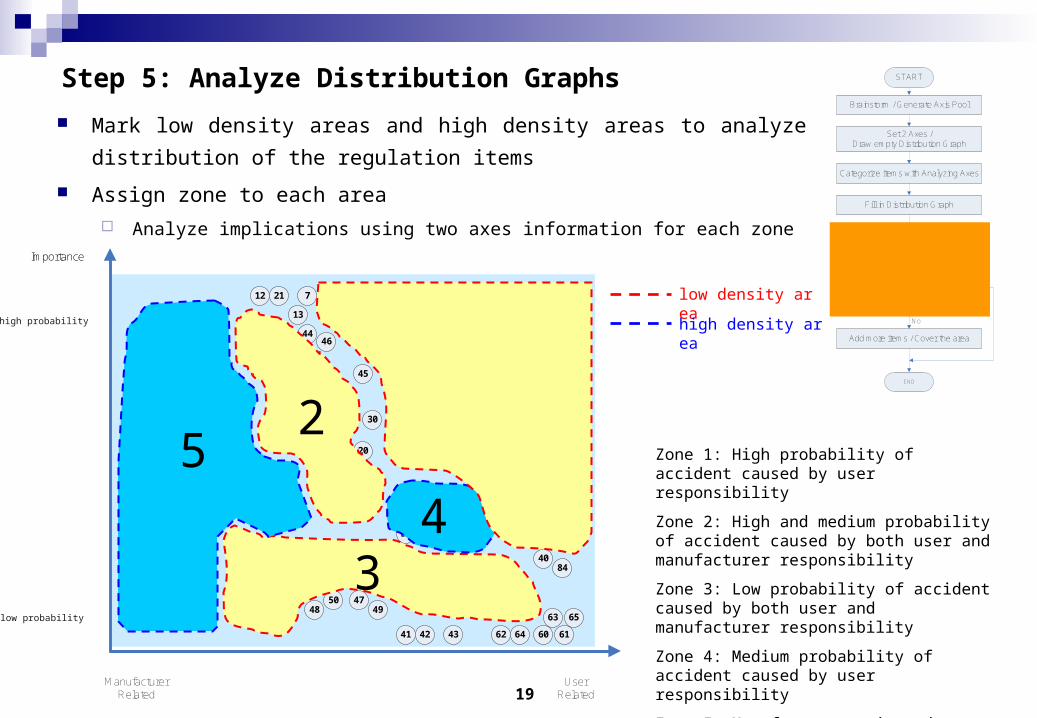
Step 5: Analyze Distribution Graphs
Mark low density areas and high density areas to analyze distribution of the
regulation items
Assign zone to each area
Analyze implications using two axes information for each zoneImportance
ManufacturerRelated
UserRelated
Importance
1
2
3
4
5
6
7
8
9
10
16
17
18
19
20
11
12
13
14
15
21 22
23
24
25 26
27
28
29
30
31
3233 34
35
36
3738
39
40
41 42 43
44
45
46
4748 49
50
51 52 53
54
5556
57
5859
60 6162
63
64
6566
67
68
69
7071
72
73
74
75
76
77
78
79
80
81
82
83
84
85
86
12
3
Zone 1: High probability of accident caused by user responsibility
Zone 2: High and medium probability of accident caused by both user and manufacturer responsibility
Zone 3: Low probability of accident caused by both user and manufacturer responsibility
Zone 4: Medium probability of accident caused by user responsibility
Zone 5: Manufacturer oriented responsibility
54
low density area
high density area
low probability
high probability
20
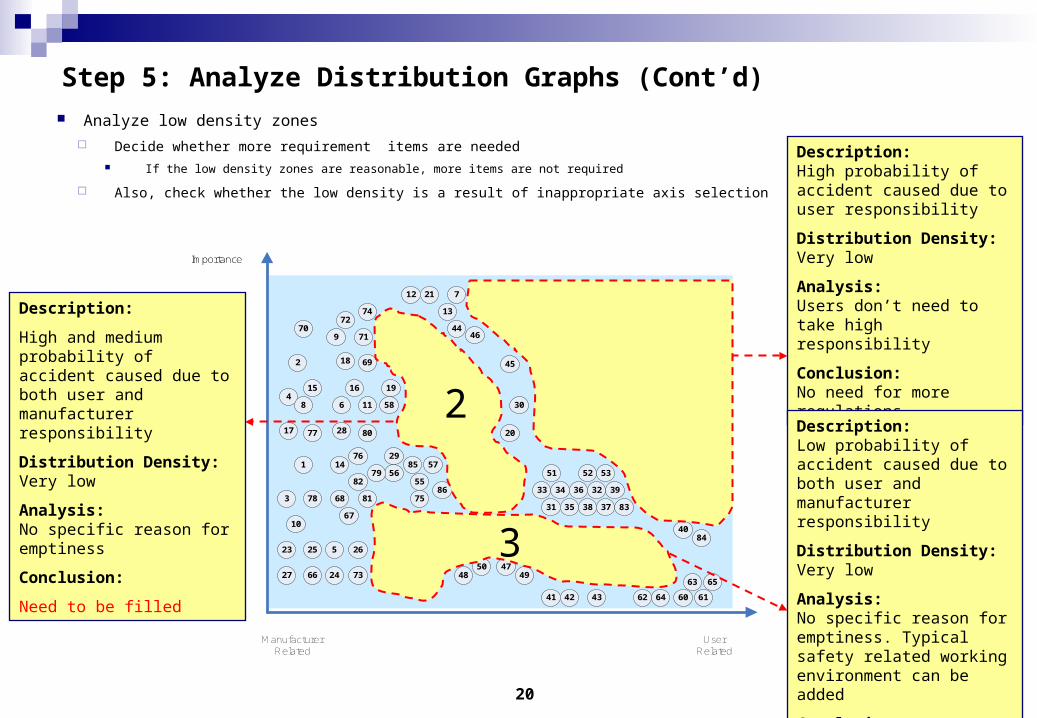
Step 5: Analyze Distribution Graphs (Cont’d)
Description: High probability of accident caused due to user responsibility
Distribution Density:Very low
Analysis:Users don’t need to take high responsibility
Conclusion:No need for more regulations
Importance
ManufacturerRelated
UserRelated
Importance
1
2
3
4
5
6
7
8
9
10
16
17
18
19
20
11
12
13
14
15
21 22
23
24
25 26
27
28
29
30
31
3233 34
35
36
3738
39
40
41 42 43
44
45
46
4748 49
50
51 52 53
54
5556
57
5859
60 6162
63
64
6566
67
68
69
7071
72
73
74
75
76
77
78
79
80
81
82
83
84
85
86
12
3
Description:Low probability of accident caused due to both user and manufacturer responsibility
Distribution Density:Very low
Analysis:No specific reason for emptiness. Typical safety related working environment can be added
Conclusion:Need to be filled
Description:
High and medium probability of accident caused due to both user and manufacturer responsibility
Distribution Density:Very low
Analysis:No specific reason for emptiness
Conclusion:
Need to be filled
Analyze low density zones
Decide whether more requirement items are needed If the low density zones are reasonable, more items are not required
Also, check whether the low density is a result of inappropriate axis selection
21
Step 5: Analyze Distribution Graphs (Cont’d)
Importance
ManufacturerRelated
UserRelated
Importance
1
2
3
4
5
6
7
8
9
10
16
17
18
19
20
11
12
13
14
15
21 22
23
24
25 26
27
28
29
30
31
3233 34
35
36
3738
39
40
41 42 43
44
45
46
4748 49
50
51 52 53
54
5556
57
5859
60 6162
63
64
6566
67
68
69
7071
72
73
74
75
76
77
78
79
80
81
82
83
84
85
86
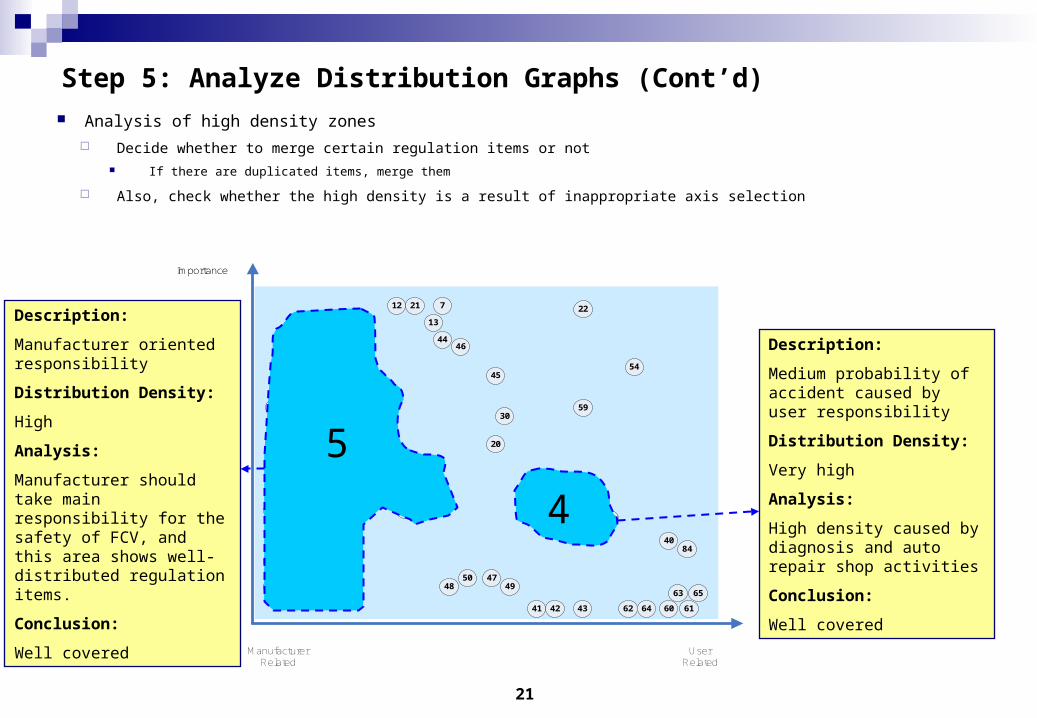
Description:
Manufacturer oriented responsibility
Distribution Density:
High
Analysis:
Manufacturer should take main responsibility for the safety of FCV, and this area shows well-distributed regulation items.
Conclusion:
Well covered
Description:
Medium probability of accident caused by user responsibility
Distribution Density:
Very high
Analysis:
High density caused by diagnosis and auto repair shop activities
Conclusion:
Well covered
5
4
Analysis of high density zones
Decide whether to merge certain regulation items or not If there are duplicated items, merge them
Also, check whether the high density is a result of inappropriate axis selection
22
Importance
ManufacturerRelated
UserRelated
Importance
1
2
3
4
5
6
7
8
9
10
16
17
18
19
20
11
12
13
14
15
21 22
23
24
25 26
27
28
29
30
31
3233 34
35
36
3738
39
40
41 42 43
44
45
46
4748 49
50
51 52 53
54
5556
57
5859
60 6162
63
64
6566
67
68
69
7071
72
73
74
75
76
77
78
79
80
81
82
83
84
85
86
87
88
89
90
91
92
93
94
95
96
9798
99
100
99
Step 6: Compensate weak area START
Brainstorm / Generate Axis Pool
Set 2 Axes /Draw empty Distribution Graph
Categorize items with Analyzing Axes
Find empty/weak area & Analyze
Is the emptiness/weakness
reasonable?
Add more items / Cover the area
END
Yes
No
Fill in Distribution Graph
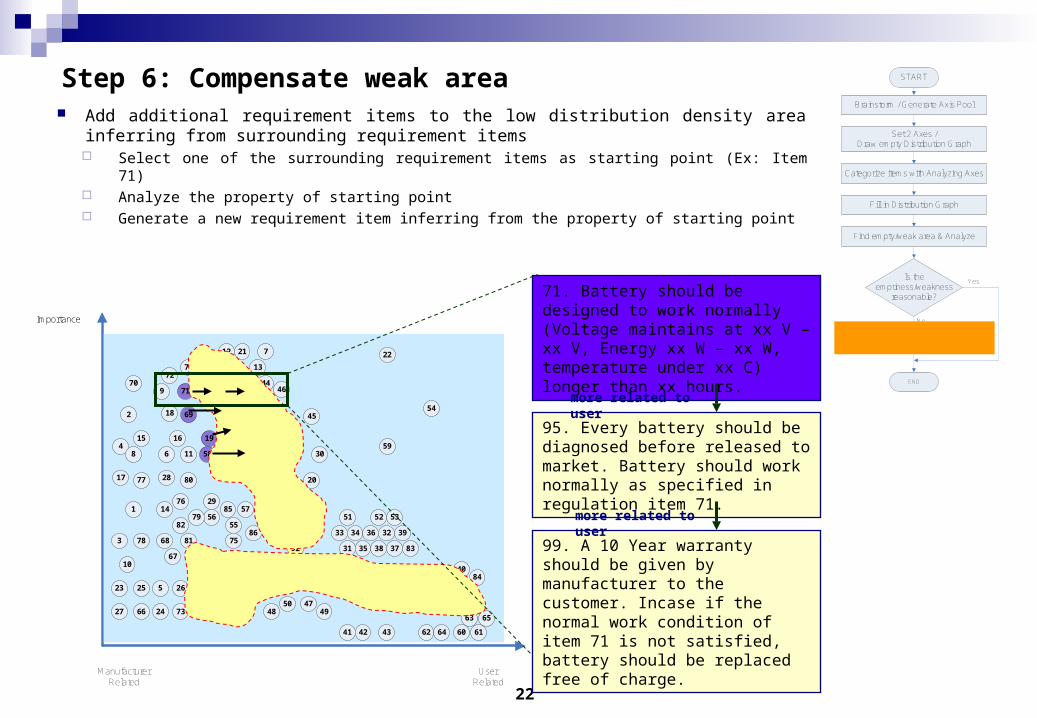
Add additional requirement items to the low distribution density area inferring from surrounding requirement items
Select one of the surrounding requirement items as starting point (Ex: Item 71) Analyze the property of starting point Generate a new requirement item inferring from the property of starting point
71. Battery should be designed to work normally (Voltage maintains at xx V – xx V, Energy xx W – xx W, temperature under xx C) longer than xx hours.
95. Every battery should be diagnosed before released to market. Battery should work normally as specified in regulation item 71.
99. A 10 Year warranty should be given by manufacturer to the customer. Incase if the normal work condition of item 71 is not satisfied, battery should be replaced free of charge.
more related to user
more related to user

23
Result of Regulation Coverage Analysis Method
86 items before process applied 21 items can be added after Regulation Coverage Analysis Method
item pool before process applied item pool after process applied
Items after process applied
Items before process applied
Added Item Poll
24
Contents
Introduction
Regulation Rulemaking Process
Process Introduction
Regulation Coverage Analysis Method
Regulation Completeness Analysis Method
Conclusion

25
Regulation Completeness Analysis Method
Concept Distribute requirement items onto “Completeness Table” to check completeness and add more items
to missing cells
Completeness Table
cellswith small # items
emptycell
Requirement itempool
newrequirement
items
cellswith high #items
Basic Elements
Category
(lowest sub-category)
101101 102102

26
Regulation Completeness Analysis Method
Step 1: Brainstorm/Generate Completeness Category
Step 2: Draw empty Completeness Table
Step 3: Categorize items
Step 4: Fill in Completeness Table
Step 5: Analyze Completeness Table
Step 6: Compensate weak category
Step 1
Step 2
Step 3
Step 4
Step 5
Step 6
Flowchart
START
Brainstorm / Generate Completeness Category
Draw empty Completeness Table
Categorize items
Find empty/weak area & Analyze
Is the emptiness/weakness
reasonable?
Compensate weak category
END
Yes
No
Fill in Completeness Table
27
START
Brainstorm / Generate Completeness Category
Draw empty Completeness Table
Categorize items
Find empty/weak area & Analyze
Is the emptiness/weakness
reasonable?
Compensate weak category
END
Yes
No
Fill in Completeness Table
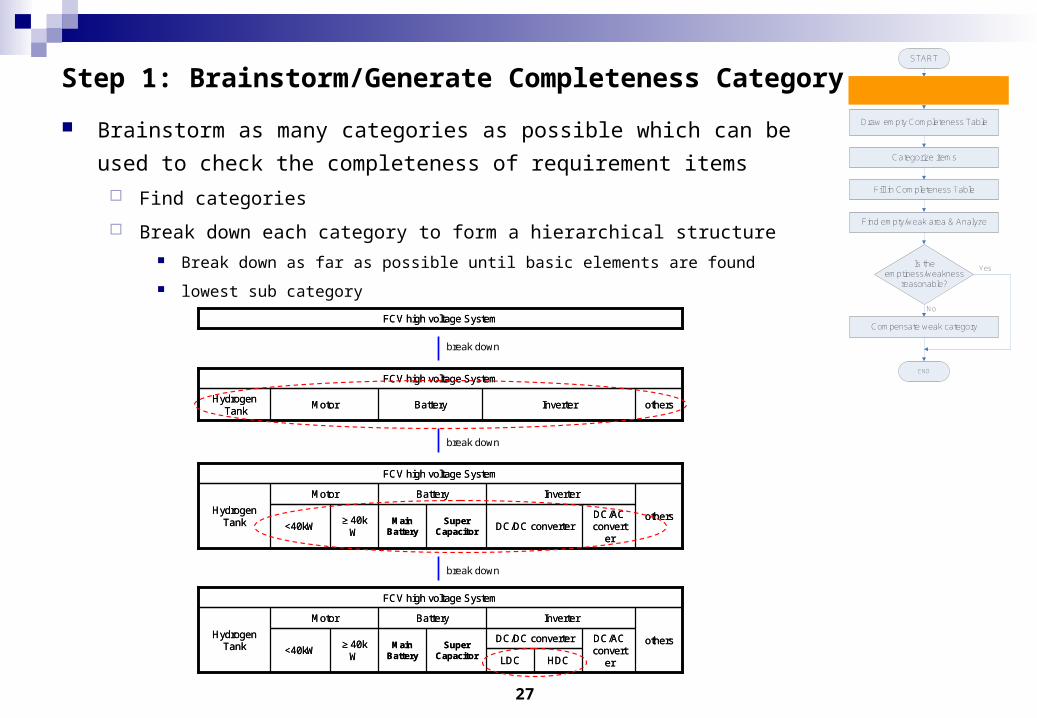
Step 1: Brainstorm/Generate Completeness Category
Brainstorm as many categories as possible which can be used to check t
he completeness of requirement items
Find categories
Break down each category to form a hierarchical structure Break down as far as possible until basic elements are found
lowest sub category
othersInverterBatteryMotorHydrogen
Tank
FCV high voltage System
othersInverterBatteryMotorHydrogen
Tank
FCV high voltage System
≥40kW
DC/AC convert
er
Super Capacitor
othersDC/DC converter
Main Battery<40kW
InverterBatteryMotor
HydrogenTank
FCV high voltage System
≥40kW
DC/AC convert
er
Super Capacitor
othersDC/DC converter
Main Battery<40kW
InverterBatteryMotor
HydrogenTank
FCV high voltage System
≥40kW HDC
DC/AC convert
erLDC
Super Capacitor
othersDC/DC converterMain
Battery<40kW
InverterBatteryMotor
HydrogenTank
FCV high voltage System
≥40kW HDC
DC/AC convert
erLDC
Super Capacitor
othersDC/DC converterMain
Battery<40kW
InverterBatteryMotor
HydrogenTank
FCV high voltage System
FCV high voltage SystemFCV high voltage System
break down
break down
break down

28
Driver Passenger Designer Worker Maintenance Man Hydrogen Battery
Human
User Manufacturer Supply Station Worker
Driver Passenger Designer Worker Maintenance Man Hydrogen Battery
Human
User Manufacturer Supply Station Worker
Step 1: Brainstorm/Generate Completeness Category (Cont’d)
Examples Human FCV high voltage system Insulation Vehicle state
Parking Idleness Driving
Vehicle State
Gloves Shoes Clothes Glass Helmet J acket Equipment case Connector body
Human
Insulation
Vehicle
≥40kW HDC
DC/AC convert
erLDC
Super Capacitor
othersDC/DC converterMain
Battery<40kW
InverterBatteryMotor
HydrogenTank
FCV high voltage System
≥40kW HDC
DC/AC convert
erLDC
Super Capacitor
othersDC/DC converterMain
Battery<40kW
InverterBatteryMotor
HydrogenTank
FCV high voltage System

29
Driver Passenger Designer Worker Maintenance Man Hydrogen Battery
Human
User Manufacturer Supply Station Worker
START
Brainstorm / Generate Completeness Category
Draw empty Completeness Table
Categorize items
Find empty/weak area & Analyze
Is the emptiness/weakness
reasonable?
Compensate weak category
END
Yes
No
Fill in Completeness Table
Step 2: Draw Blank Completeness Table
Select one category and draw Completeness Table
Make cells which can be filled with item numbers Example
Human category All human who could possibly be related to FCV
Place to be filled with item numbers

30
START
Brainstorm / Generate Completeness Category
Draw empty Completeness Table
Categorize items
Find empty/weak area & Analyze
Is the emptiness/weakness
reasonable?
Compensate weak category
END
Yes
No
Fill in Completeness Table
Step 3: Categorize items
Assign numbers to every requirement items of the item pool for every axis
Regulation items are categorized by basic elements
Example (Using Microsoft Excel) Human category
driver, passenger, designer, worker, maintenance man, hydrogen station worker, battery station worker
Human category items
Human category
31
START
Brainstorm / Generate Completeness Category
Draw empty Completeness Table
Categorize items
Find empty/weak area & Analyze
Is the emptiness/weakness
reasonable?
Compensate weak category
END
Yes
No
Fill in Completeness Table
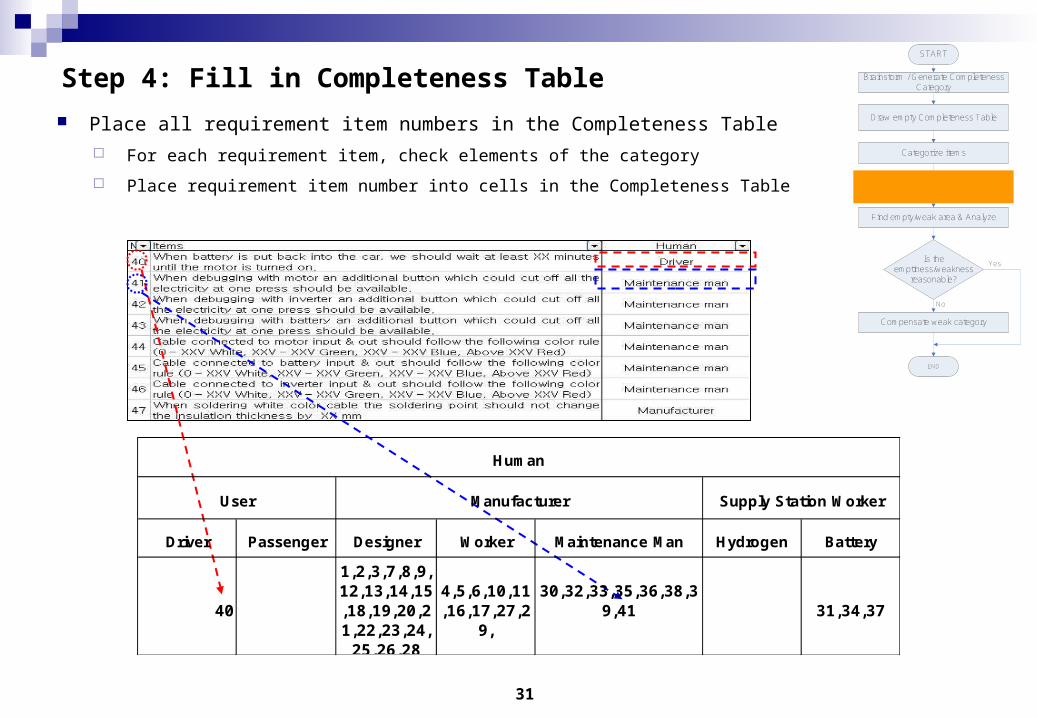
Step 4: Fill in Completeness Table
Place all requirement item numbers in the Completeness Table
For each requirement item, check elements of the category
Place requirement item number into cells in the Completeness Table
Driver Passenger Designer Worker Maintenance Man Hydrogen Battery
40
1,2,3,7,8,9,12,13,14,15,18,19,20,21,22,23,24,25,26,28
4,5,6,10,11,16,17,27,2
9,
30,32,33,35,36,38,39,41 31,34,37
Human
User Manufacturer Supply Station Worker

32
Step 4: Fill in Completeness Table (Cont’d)
Example of Completeness Table #1 Human
User: Driver, Passenger Manufacturer: Designer, Maker, Maintenance man Supply Station Worker: Hydrogen, Battery
Human category
Driver(4)
Passenger(0)
Designer(32)
Worker(26)
Maintenance Man(19)
Hydrogen(2)
Battery(3)
40,54,58,59
1,2,3,7,8,9,12,13,14,15,18,19,20,21,22,23,24,25,26,28,55,56,57,67,68,69,76,77,78,79,80,84
4,5,6,10,11,16,17,27,29,44,45,46,47,48,49,50,66,70,71,72,73,74,75,81,82,83
30,32,33,35,36,38,39,41,42,43,51,52,53,60,61,62,63,64,65
83,84 31,34,37
Human(86)
User(4)
Manufacturer(77)
Supply Station Worker(5)
33
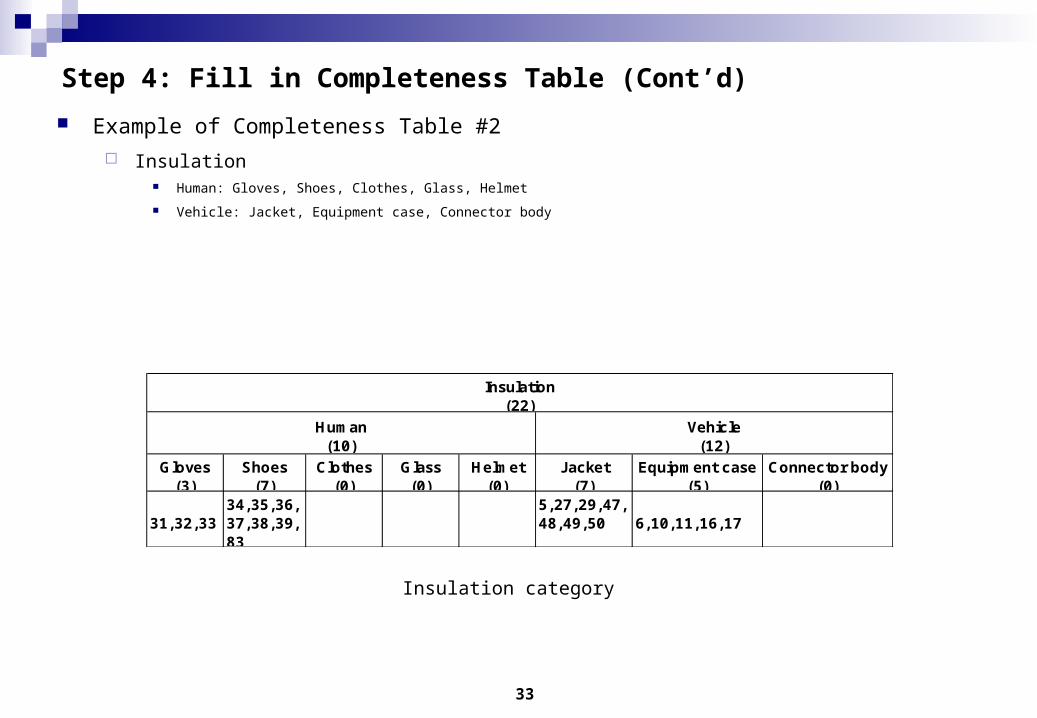
Step 4: Fill in Completeness Table (Cont’d)
Example of Completeness Table #2
Insulation Human: Gloves, Shoes, Clothes, Glass, Helmet
Vehicle: Jacket, Equipment case, Connector body
Insulation category
Gloves(3)
Shoes(7)
Clothes(0)
Glass(0)
Helmet(0)
J acket(7)
Equipment case(5)
Connector body(0)
31,32,3334,35,36,37,38,39,83
5,27,29,47,48,49,50 6,10,11,16,17
Human(10)
Insulation(22)
Vehicle(12)

34
Step 4: Fill in Completeness Table (Cont’d)
Example of Completeness Table #3
FCV system Hydrogen tank. Motor, Battery, Inverter, Chassis, General
FCV system category
14,15,16,33,36,39,42,46,52,57,61,64,73,74,
28
23,24,25,26,27,29,30,47,48,49,50,67,68,76,77,78,79,80,81,82,
86
22,17,18,19,20,21,75,85,59,83,84
1,2,3,5,6,9,40,44,58,66,4,7,12,32,35,38,41,51,5
5,60,63,69,70
8,10,11,13,43,45,53,54,56,62,65,7
1,72,31,34,37
FCV System(86)
Inverter(14)
Chassis(1)
General(21)
Hydrogen Tank(11)
Motor(23)
Battery(16)
35
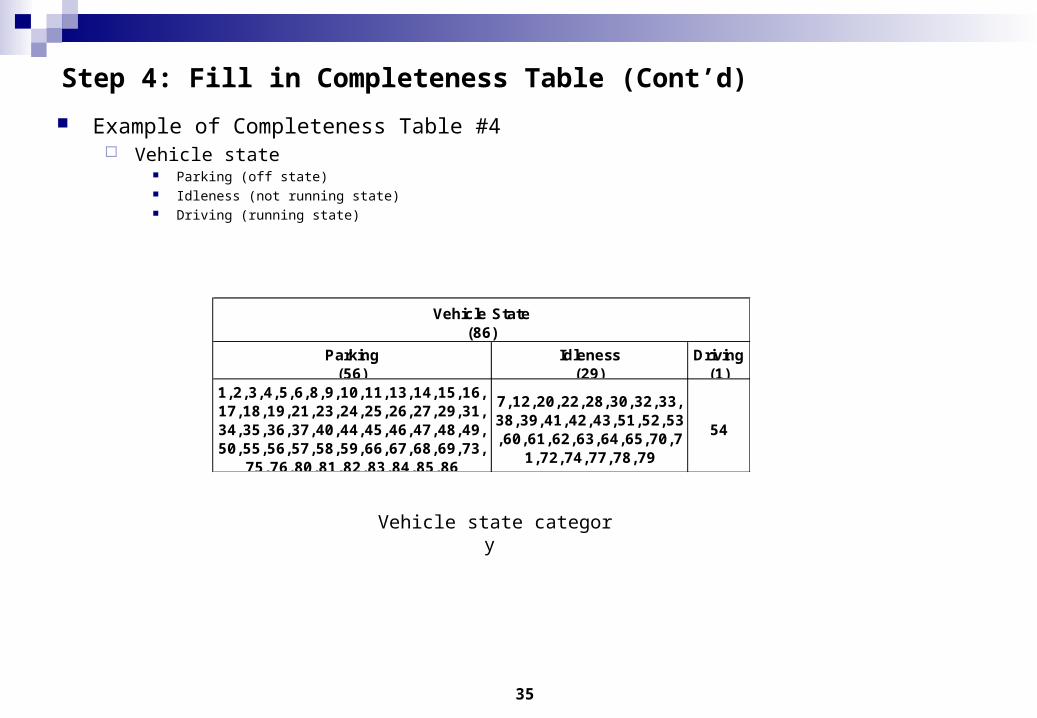
Step 4: Fill in Completeness Table (Cont’d)
Example of Completeness Table #4 Vehicle state
Parking (off state) Idleness (not running state) Driving (running state)
Vehicle state category
Parking(56)
Idleness(29)
Driving(1)
1,2,3,4,5,6,8,9,10,11,13,14,15,16,17,18,19,21,23,24,25,26,27,29,31,34,35,36,37,40,44,45,46,47,48,49,50,55,56,57,58,59,66,67,68,69,73,
75,76,80,81,82,83,84,85,86
7,12,20,22,28,30,32,33,38,39,41,42,43,51,52,53,60,61,62,63,64,65,70,7
1,72,74,77,78,79
54
Vehicle State(86)

36
Driver(4)
Passenger(0)
Designer(32)
Worker(26)
Maintenance Man(19)
Hydrogen(2)
Battery(3)
40,54,58,59
1,2,3,7,8,9,12,13,14,15,18,19,20,21,22,23,24,25,26,28,55,56,57,67,68,69,76,77,78,79,80,84
4,5,6,10,11,16,17,27,29,44,45,46,47,48,49,50,66,70,71,72,73,74,75,81,82,83
30,32,33,35,36,38,39,41,42,43,51,52,53,60,61,62,63,64,65
83,84 31,34,37
Human(86)
User(4)
Manufacturer(77)
Supply Station Worker(5)
START
Brainstorm / Generate Completeness Category
Draw empty Completeness Table
Categorize items
Find empty/weak area & Analyze
Is the emptiness/weakness
reasonable?
Compensate weak category
END
Yes
No
Fill in Completeness Table
Step 5: Analyze Completeness Table Mark blank cells or cells with small number of requirement items to analyze completeness of the requirement items
Check whether it is necessary to add new requirement items
Mark red when needed, blue when not needed
No need to add more items
Passenger does not need to follow any regulation
More items need to be added
Hydrogen and battery supply station workers need more requirement to prevent FCV high voltage accidents

37
START
Brainstorm / Generate Completeness Category
Draw empty Completeness Table
Categorize items
Find empty/weak area & Analyze
Is the emptiness/weakness
reasonable?
Compensate weak category
END
Yes
No
Fill in Completeness Table
Step 6: Compensate weak category Add additional requirement items to empty cells or cells with small amount of requirement items Use similarity to generate new requirement items
Item 35 related to maintenance man can be used to generate new items (101,102) for battery supply station worker
35: Wear insulation shoes when debugging with the motor (Insulation shoes should meet the electrical regulation XXX) new 101: Wear insulation shoes when charging electric vehicle battery (Insulation shoes should meet the electrical regulation XXX) new 102: Wear ESD preventive clothes when charging electric vehicle battery (ESD preventive clothes should meet the electrical regulation XXX)
Driver(4)
Passenger(0)
Designer(32)
Worker(26)
Maintenance Man(19)
Hydrogen(2)
Battery(3)
40,54,58,59
1,2,3,7,8,9,12,13,14,15,18,19,20,21,22,23,24,25,26,28,55,56,57,67,68,69,76,77,78,79,80,84
4,5,6,10,11,16,17,27,29,44,45,46,47,48,49,50,66,70,71,72,73,74,75,81,82,83
30,32,33,35,36,38,39,41,42,43,51,52,53,60,61,62,63,64,65
83,84 31,34,37
Human(86)
User(4)
Manufacturer(77)
Supply Station Worker(5)
101 102
use similarity
use expandability

38
Result of Regulation Completeness Analysis Method
Result of the whole process 86 items before process applied 29 new items added after Regulation Completeness Analysis method
item pool before process applied item pool after process applied
Items after process applied
Items before process applied
Added Item Pool
39
Contents
Introduction
Regulation Rulemaking Process
Process Introduction
Regulation Coverage Analysis Method
Regulation Completeness Analysis Method
Conclusion

40
Conclusion
Conclusion
Rulemaking process of electrical safety regulation
for fuel cell vehicle high voltage systems is proposed
We propose Regulation Coverage Analysis Method
Find regulation missing areas with proposed “Distribution Graph”
Add more requirements by systematic brainstorming
We propose Regulation Completeness Analysis Method
Verify completeness with proposed “Completeness Table”
Add more requirements by inferring from other requirements