Embed Size (px)
Citation preview
PropIndex | Magicbricks
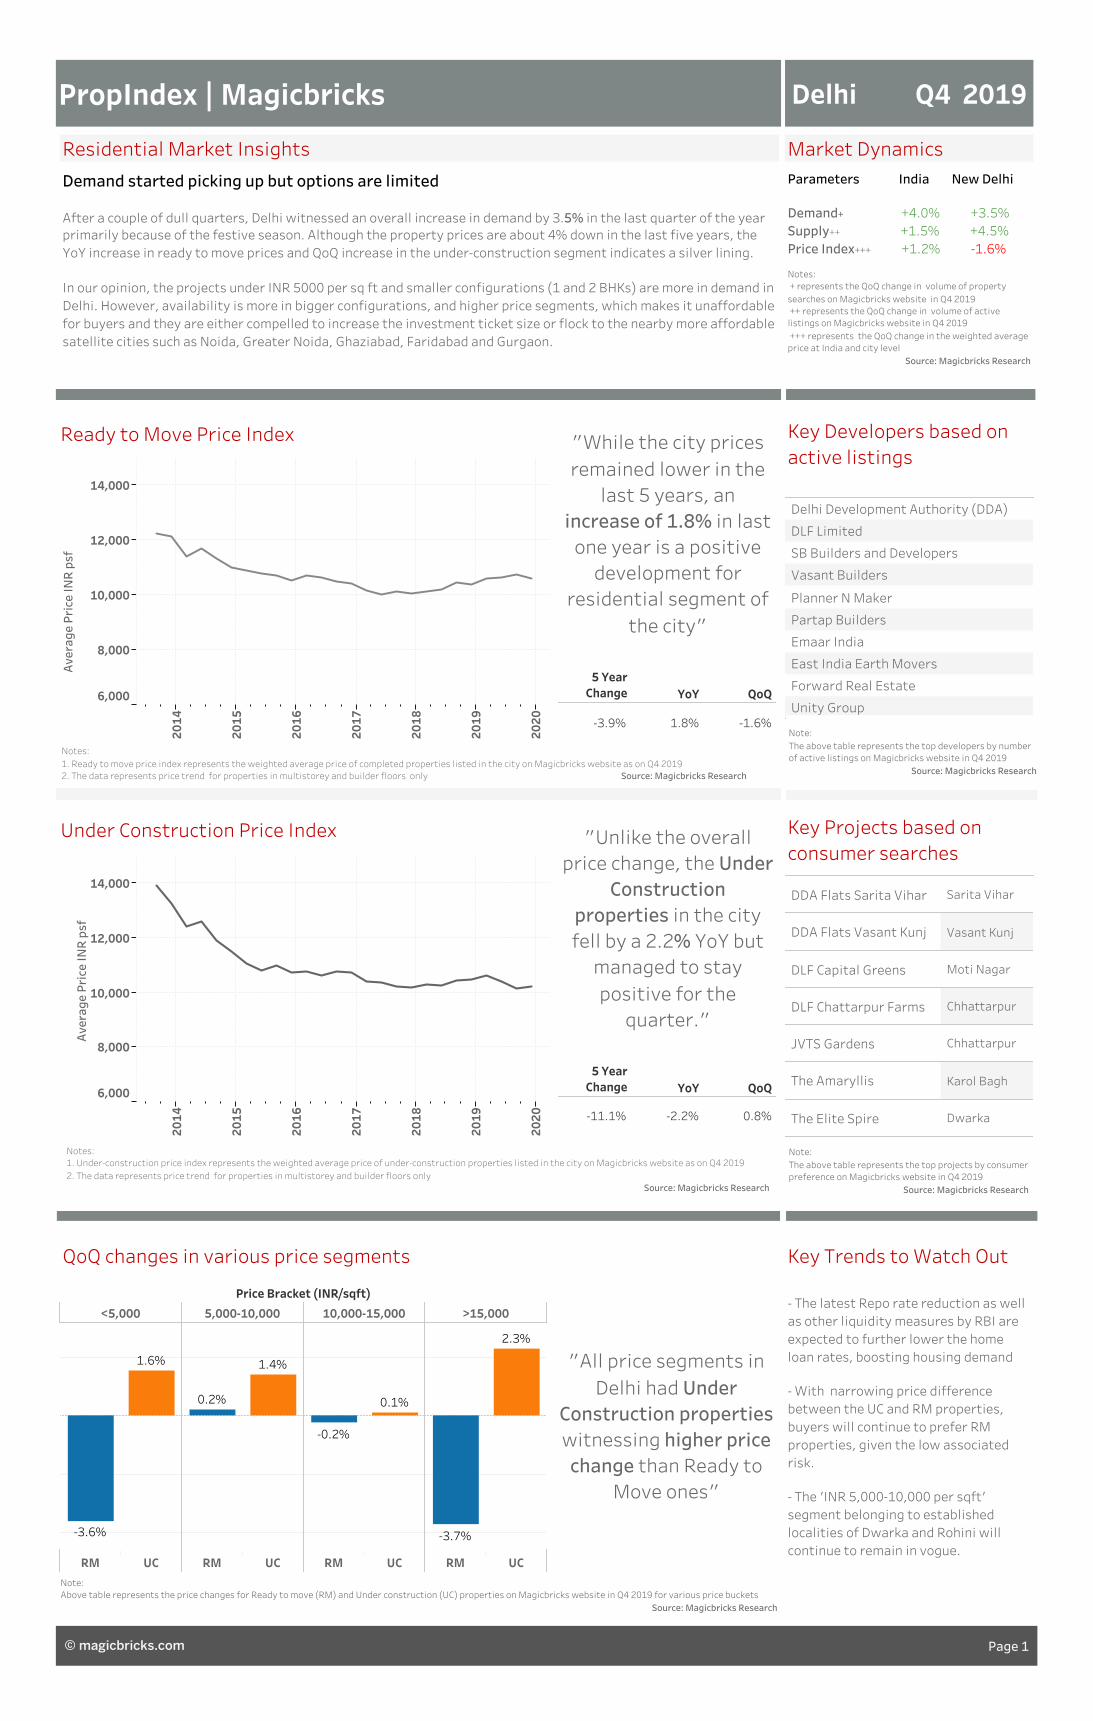
Residential Market Insights
Demand started picking up but options are limited
After a couple of dull quarters, Delhi witnessed an overall increase in demand by 3.5% in the last quarter of the yearprimarily because of the festive season. Although the property prices are about 4% down in the last five years, theYoY increase in ready to move prices and QoQ increase in the under-construction segment indicates a silver lining.
In our opinion, the projects under INR 5000 per sq ft and smaller configurations (1 and 2 BHKs) are more in demand inDelhi. However, availability is more in bigger configurations, and higher price segments, which makes it unaffordablefor buyers and they are either compelled to increase the investment ticket size or flock to the nearby more affordablesatellite cities such as Noida, Greater Noida, Ghaziabad, Faridabad and Gurgaon.
5 YearChange YoY QoQ
-1.6%1.8%-3.9%
5 YearChange YoY QoQ
0.8%-2.2%-11.1%
"Unlike the overallprice change, the Under
Constructionproperties in the cityfell by a 2.2% YoY butmanaged to staypositive for thequarter."
Delhi Q4 2019
Parameters India New Delhi
Demand+ +4.0% +3.5%Supply++ +1.5% +4.5% Price Index+++ +1.2% -1.6%
"While the city pricesremained lower in thelast 5 years, an
increase of 1.8% in lastone year is a positivedevelopment for
residential segment ofthe city"
Notes: + represents the QoQ change in volume of propertysearches on Magicbricks website in Q4 2019 ++ represents the QoQ change in volume of activelistings on Magicbricks website in Q4 2019 +++ represents the QoQ change in the weighted averageprice at India and city level
Source: Magicbricks Research
Key Developers based onactive listings
Delhi Development Authority (DDA)
DLF Limited
SB Builders and Developers
Vasant Builders
Planner N Maker
Partap Builders
Emaar India
East India Earth Movers
Forward Real Estate
Unity Group
Key Projects based onconsumer searches
DDA Flats Sarita Vihar Sarita Vihar
DDA Flats Vasant Kunj Vasant Kunj
DLF Capital Greens Moti Nagar
DLF Chattarpur Farms Chhattarpur
JVTS Gardens Chhattarpur
The Amaryllis Karol Bagh
The Elite Spire Dwarka
Price Bracket (INR/sqft)
<5,000 5,000-10,000 10,000-15,000 >15,000
RM UC RM UC RM UC RM UC
1.6%
-3.6%
1.4%
0.2% 0.1%
-0.2%
2.3%
-3.7%
QoQ changes in various price segments
Market Dynamics
Ready to Move Price Index
Under Construction Price Index
- The latest Repo rate reduction as wellas other liquidity measures by RBI areexpected to further lower the homeloan rates, boosting housing demand
- With narrowing price differencebetween the UC and RM properties,buyers will continue to prefer RMproperties, given the low associatedrisk.
- The 'INR 5,000-10,000 per sqft'segment belonging to establishedlocalities of Dwarka and Rohini willcontinue to remain in vogue.
"All price segments inDelhi had Under
Construction propertieswitnessing higher pricechange than Ready to
Move ones"
Key Trends to Watch Out
2014
2015
2016
2017
2018
2019
2020
6,000
8,000
10,000
12,000
14,000
Avg. Price psf
2014
2015
2016
2017
2018
2019
2020
6,000
8,000
10,000
12,000
14,000
Avg. Price psf
Average Price INR psf
Average Price INR psf
Note:The above table represents the top developers by numberof active listings on Magicbricks website in Q4 2019
Source: Magicbricks Research
Note:The above table represents the top projects by consumerpreference on Magicbricks website in Q4 2019
Source: Magicbricks Research
Notes:1. Ready to move price index represents the weighted average price of completed properties listed in the city on Magicbricks website as on Q4 20192. The data represents price trend for properties in multistorey and builder floors only Source: Magicbricks Research
Notes:1. Under-construction price index represents the weighted average price of under-construction properties listed in the city on Magicbricks website as on Q4 20192. The data represents price trend for properties in multistorey and builder floors only
Source: Magicbricks Research
Note:Above table represents the price changes for Ready to move (RM) and Under construction (UC) properties on Magicbricks website in Q4 2019 for various price buckets
Source: Magicbricks Research
Page 1© magicbricks.com
1 BHK12%
Above 3 BHK11%
3 BHK39%
2 BHK37%
DEMAND
Demand Supply Analysis DELHI Q4 2019
Buyers favouring affordable properties
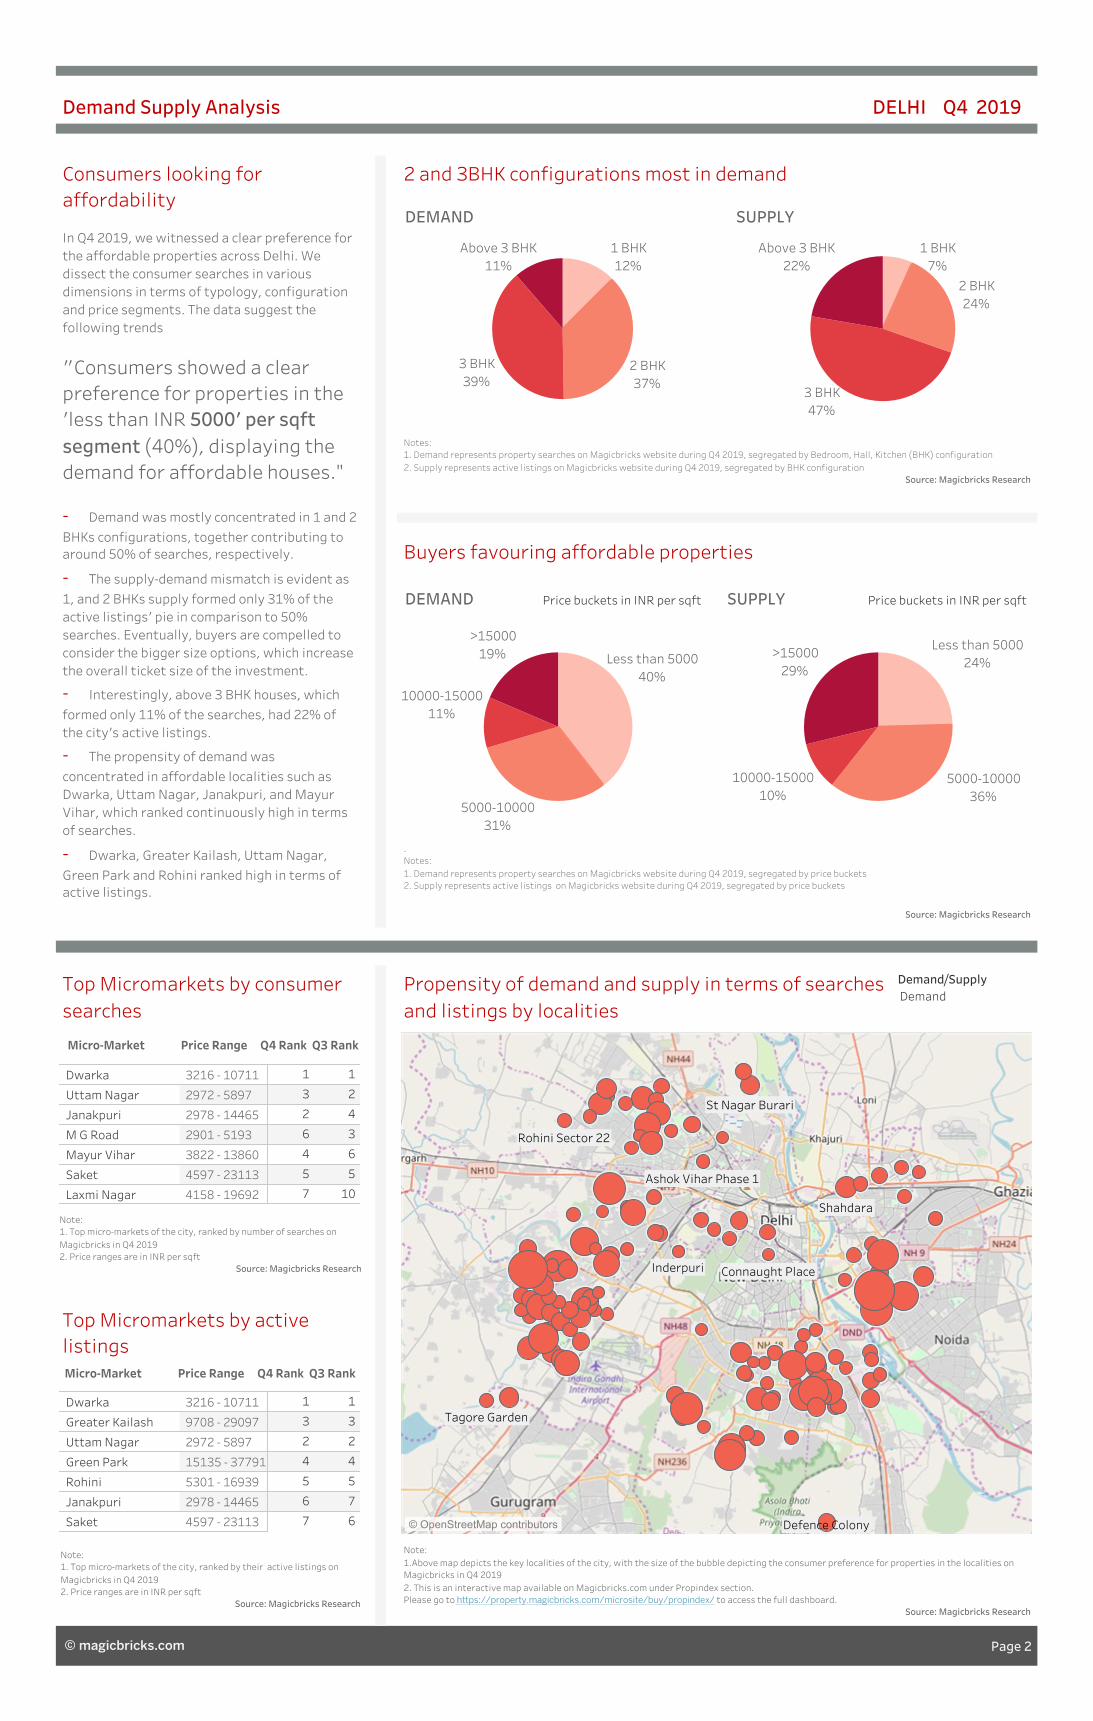
2 and 3BHK configurations most in demandConsumers looking foraffordability
In Q4 2019, we witnessed a clear preference forthe affordable properties across Delhi. Wedissect the consumer searches in variousdimensions in terms of typology, configurationand price segments. The data suggest thefollowing trends
"Consumers showed a clearpreference for properties in the'less than INR 5000' per sqftsegment (40%), displaying thedemand for affordable houses."
- Demand was mostly concentrated in 1 and 2BHKs configurations, together contributing toaround 50% of searches, respectively.
- The supply-demand mismatch is evident as1, and 2 BHKs supply formed only 31% of theactive listings' pie in comparison to 50%searches. Eventually, buyers are compelled toconsider the bigger size options, which increasethe overall ticket size of the investment.
- Interestingly, above 3 BHK houses, whichformed only 11% of the searches, had 22% ofthe city's active listings.
- The propensity of demand wasconcentrated in affordable localities such asDwarka, Uttam Nagar, Janakpuri, and MayurVihar, which ranked continuously high in termsof searches.
- Dwarka, Greater Kailash, Uttam Nagar,Green Park and Rohini ranked high in terms ofactive listings.
Top Micromarkets by consumersearches
Propensity of demand and supply in terms of searchesand listings by localities
1 BHK7%
2 BHK24%
3 BHK47%
Above 3 BHK22%
SUPPLY
5000-1000036%
Less than 500024%
10000-1500010%
>1500029%
SUPPLY Price buckets in INR per sqft
Top Micromarkets by activelistingsa
Less than 500040%
>1500019%
10000-1500011%
5000-1000031%
DEMAND Price buckets in INR per sqft
Notes:1. Demand represents property searches on Magicbricks website during Q4 2019, segregated by Bedroom, Hall, Kitchen (BHK) configuration2. Supply represents active listings on Magicbricks website during Q4 2019, segregated by BHK configuration
Source: Magicbricks Research
.Notes:1. Demand represents property searches on Magicbricks website during Q4 2019, segregated by price buckets2. Supply represents active listings on Magicbricks website during Q4 2019, segregated by price buckets
Source: Magicbricks Research
Note:1.Above map depicts the key localities of the city, with the size of the bubble depicting the consumer preference for properties in the localities onMagicbricks in Q4 20192. This is an interactive map available on Magicbricks.com under Propindex section.Please go to https://property.magicbricks.com/microsite/buy/propindex/ to access the full dashboard.
Source: Magicbricks Research
Note:1. Top micro-markets of the city, ranked by their active listings onMagicbricks in Q4 20192. Price ranges are in INR per sqft
Source: Magicbricks Research
Note:1. Top micro-markets of the city, ranked by number of searches onMagicbricks in Q4 20192. Price ranges are in INR per sqft
Source: Magicbricks Research
Ashok Vihar Phase 1
Connaught Place
Rohini Sector 22
St Nagar Burari
Defence Colony
Tagore Garden
Shahdara
Inderpuri
© OpenStreetMap contributors
Demand/SupplyDemand
Dwarka 3216 - 10711
Uttam Nagar 2972 - 5897
Janakpuri 2978 - 14465
M G Road 2901 - 5193
Mayur Vihar 3822 - 13860
Saket 4597 - 23113
Laxmi Nagar 4158 - 19692
11
23
42
36
64
55
107
Dwarka 3216 - 10711
Greater Kailash 9708 - 29097
Uttam Nagar 2972 - 5897
Green Park 15135 - 37791
Rohini 5301 - 16939
Janakpuri 2978 - 14465
Saket 4597 - 23113
11
33
22
44
55
76
67
Micro-Market Price Range Q4 Rank Q3 Rank
(Price in INR per Sqft)
Micro-Market Price Range Q4 Rank Q3 Rank
Page 2© magicbricks.com
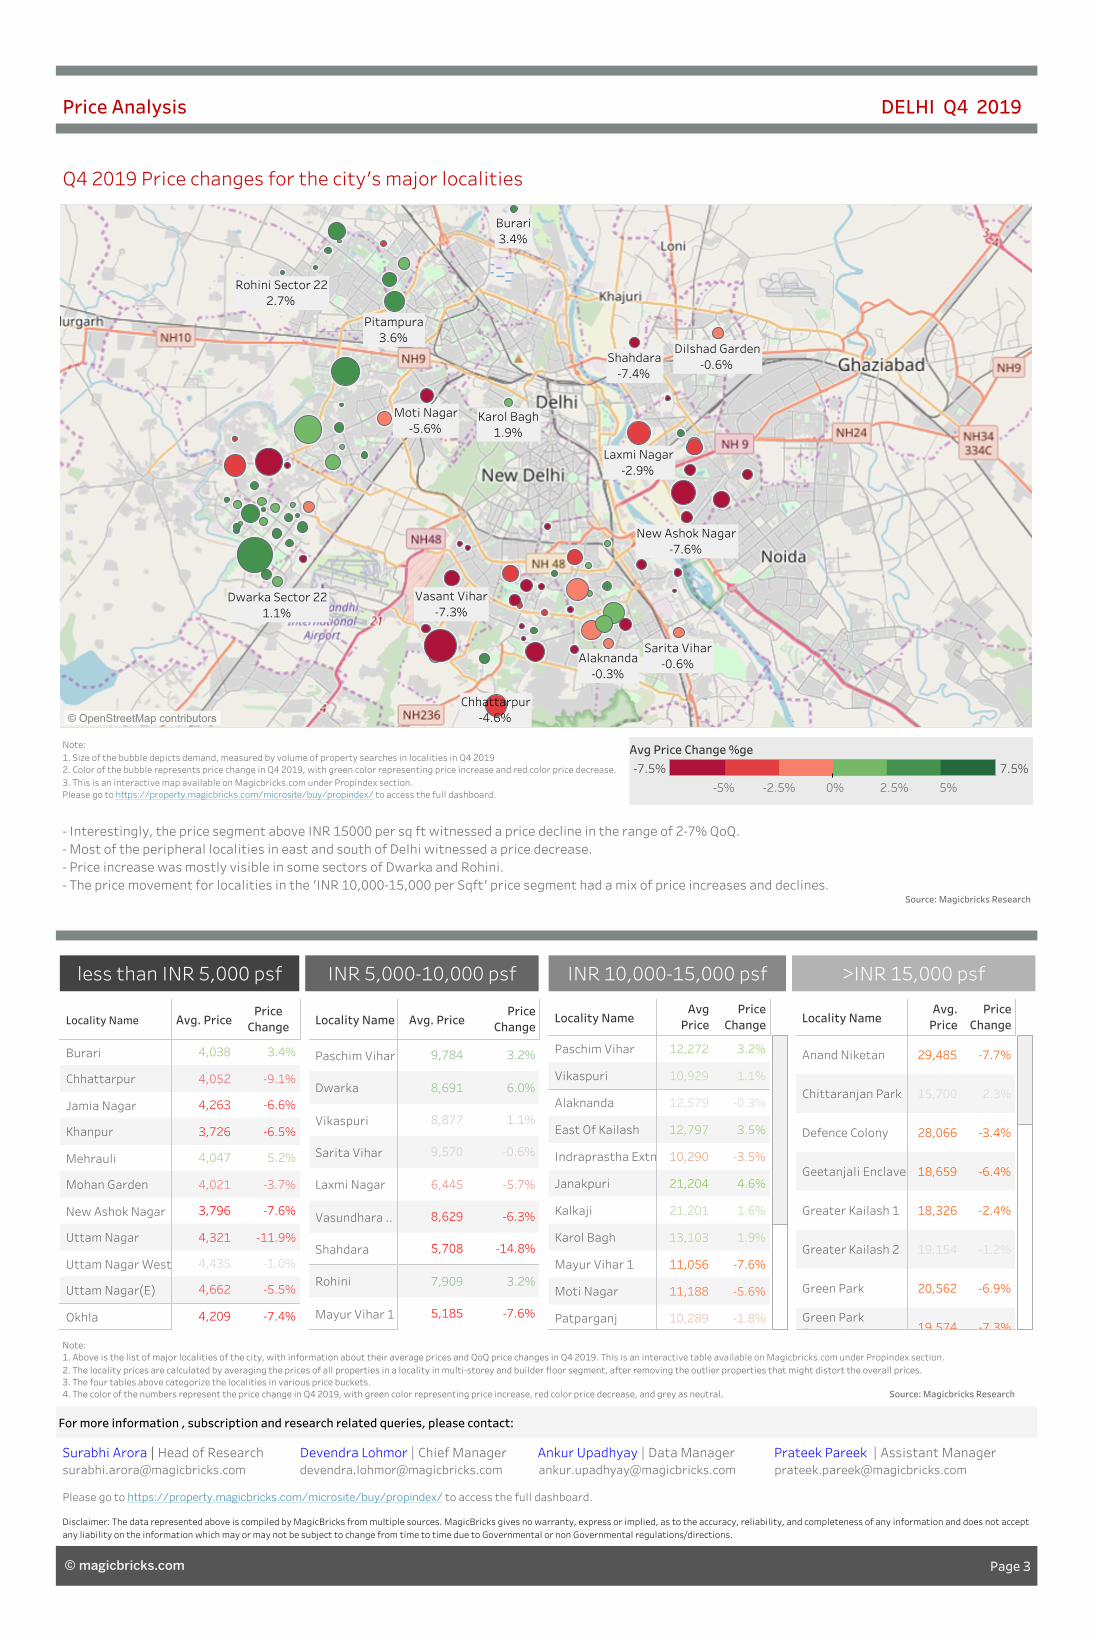
Note:1. Size of the bubble depicts demand, measured by volume of property searches in localities in Q4 20192. Color of the bubble represents price change in Q4 2019, with green color representing price increase and red color price decrease.3. This is an interactive map available on Magicbricks.com under Propindex section.Please go to https://property.magicbricks.com/microsite/buy/propindex/ to access the full dashboard.
Locality Name Avg. PricePriceChange
Burari
Chhattarpur
Jamia Nagar
Khanpur
Mehrauli
Mohan Garden
New Ashok Nagar
Uttam Nagar
Uttam Nagar West
Uttam Nagar(E)
Okhla
-5.5%
-1.0%
-11.9%
-7.6%
-3.7%
5.2%
-6.5%
-6.6%
-9.1%
3.4%
4,662
4,435
4,321
3,796
4,021
4,047
3,726
4,263
4,052
4,038
-7.4%4,209
less than INR 5,000 psf INR 5,000-10,000 psf INR 10,000-15,000 psf >INR 15,000 psf
Price Analysis DELHI Q4 2019
- Interestingly, the price segment above INR 15000 per sq ft witnessed a price decline in the range of 2-7% QoQ.- Most of the peripheral localities in east and south of Delhi witnessed a price decrease.- Price increase was mostly visible in some sectors of Dwarka and Rohini.- The price movement for localities in the 'INR 10,000-15,000 per Sqft' price segment had a mix of price increases and declines.
Source: Magicbricks Research
Dwarka Sector 221.1%
New Ashok Nagar-7.6%
Rohini Sector 222.7%
Dilshad Garden-0.6%
Vasant Vihar-7.3%
Laxmi Nagar-2.9%
Chhattarpur-4.6%
Sarita Vihar-0.6%
Moti Nagar-5.6%
Karol Bagh1.9%
Pitampura3.6%
Alaknanda-0.3%
Shahdara-7.4%
Burari3.4%
© OpenStreetMap contributors
Locality Name Avg. PricePrice
Change
Paschim Vihar
Dwarka
Vikaspuri
Sarita Vihar
Laxmi Nagar
Vasundhara ..
Shahdara
Rohini
Mayur Vihar 1
-14.8%
-6.3%
-5.7%
-0.6%
1.1%
6.0%
3.2%
5,708
8,629
6,445
9,570
8,877
8,691
9,784
-7.6%
3.2%
5,185
7,909
Locality NameAvgPrice
PriceChange
Paschim Vihar
Vikaspuri
Alaknanda
East Of Kailash
Indraprastha Extn
Janakpuri
Kalkaji
Karol Bagh
Mayur Vihar 1
Moti Nagar
Patparganj
1.1%
3.2%
10,929
12,272
-13.2%
-6.5%
3.2%
-1.6%
3.7%
7.2%
-1.8%
-5.6%
-7.6%
1.9%
1.6%
4.6%
-3.5%
3.5%
-0.3%
28,118
13,735
11,564
10,407
14,457
25,187
10,289
11,188
11,056
13,103
21,201
21,204
10,290
12,797
12,579
Locality NameAvg.Price
PriceChange
Anand Niketan
Chittaranjan Park
Defence Colony
Geetanjali Enclave
Greater Kailash 1
Greater Kailash 2
Green Park
Green ParkExtension
-7.3%
-7.6%
2.8%
-6.4%
-6.4%
-4.6%
-6.8%
-3.2%
-5.9%
-7.7%
2.4%
1.1%
-7.3%
1.9%
-3.9%
-5.7%
-7.1%
-7.3%
-6.9%
-1.2%
-2.4%
-6.4%
-3.4%
2.3%
-7.7%
24,997
15,445
16,646
39,590
19,871
20,906
22,666
23,757
23,656
19,374
21,075
16,993
49,901
18,268
22,652
21,327
28,100
19,574
20,562
19,154
18,326
18,659
28,066
15,700
29,485
-7.5% 7.5%
Avg Price Change %ge
Note:1. Above is the list of major localities of the city, with information about their average prices and QoQ price changes in Q4 2019. This is an interactive table available on Magicbricks.com under Propindex section.2. The locality prices are calculated by averaging the prices of all properties in a locality in multi-storey and builder floor segment, after removing the outlier properties that might distort the overall prices.3. The four tables above categorize the localities in various price buckets.4. The color of the numbers represent the price change in Q4 2019, with green color representing price increase, red color price decrease, and grey as neutral. Source: Magicbricks Research
Disclaimer: The data represented above is compiled by MagicBricks from multiple sources. MagicBricks gives no warranty, express or implied, as to the accuracy, reliability, and completeness of any information and does not acceptany liability on the information which may or may not be subject to change from time to time due to Governmental or non Governmental regulations/directions.
Q4 2019 Price changes for the city's major localities
For more information , subscription and research related queries, please contact:
Surabhi Arora | Head of Research Devendra Lohmor | Chief Manager Ankur Upadhyay | Data Manager Prateek Pareek | Assistant [email protected] [email protected] [email protected] [email protected]
Please go to https://property.magicbricks.com/microsite/buy/propindex/ to access the full dashboard.
-5% -2.5% 0% 2.5% 5%
Page 3© magicbricks.com