Embed Size (px)
Citation preview


PropIndex | Magicbricks
Residential Market Insights
Silver line visible in Delhi, prices inch up to 2016 levels
Delhi residential market demand maintained its momentum from the last quarter and grew at 5.4% in Q1 2020,slightly above the growth nationally. The supply of residential properties has seen a decline, with Q1 supplycontracting at 3%, indicating a silver line for a slight price increase in the coming quarters.
Both the Under-Construction (UC) and Ready-to-Move (RM) segments witnessed an overall price stabilization in thequarter, with UC properties in the non-premium segment seeing a price rise, whereas RM properties under the samecategory witnessing a price decline. Due to the demand-supply mismatch, and higher investment ticket size, thedemand for affordable properties continued to move towards the satellite cities of Noida, Greater Noida, Ghaziabadand Faridabad.
5 YearChange YoY QoQ
0.0%-0.1%-2.8%
5 YearChange YoY QoQ
0.0%-3.6%-7.5%
"After a steep fall inprices in the last5 years, the city
witnessed stabilizationin the
Under-Constructionsegment in the last two
quarters."
DelhiJan-Mar 2020
Parameters India New Delhi
Demand+ +5.3% +5.4%Supply++ -0.8% -3.0% Price Index+++ +0.1% -0.0%
"The positive scenariofor the city'sresidential
development is visibleas the price has inchedup to 2016 price levelsin the last fewquarters"
Notes:Above parameters represent QoQ change in Q1 2020 atIndia and city level + volume of property searches ++ volume of active listings +++ change in the weighted average price
Source: Magicbricks Research
Delhi Development Authority
Mitya Infratech
DLF
S B Associates
Shri Laxmi Properties
Partap Builders
Planner N Maker
Vasant Builders
Goyal Builders
GHP Corporation
Mitya Homes Dwarka Mor
DLF Capital Greens Moti Nagar
DLF Chattarpur Farms Chhattarpur
DDA Flats Vasant Kunj Vasant Kunj
Uttam Nagar Floors Uttam Nagar
JVTS Gardens Chhattarpur
J R Designers Floors Rohini
Goyal Builder Floors Uttam Nagar (W)
Freedom Fighter Enc. Saket
Bharat Luxury Homes Uttam Nagar
Average changes in prices for localities in various price segments
Market Dynamics
Ready to Move Price Index
Under Construction Price Index
- City's residential segment likely to bedominated by redevelopment in thenext three years, with the governmentre-developing seven housing coloniesand a World Trade Centre in southDelhi's Nauroji Nagar, Netaji Nagar,and Sarojini Nagar.
- Development of 'East Delhi Hub' atKarkardooma to include construction of1,600 residential units of DDA.
- The upcoming Regional Rapid TransitSystem (RRTS) lines to Meerut, Alwar,and Panipat to ease some pressurefrom the Capital's residential segment.
"Growth in price visiblein the underconstruction
properties, with 3.1%increase in less thanINR 5,000 per sqftsegment"
Key Trends to Watch Out
2014
2015
2016
2017
2018
2019
2020
8,000
10,000
12,000
14,000
16,000
18,000
Avg. Price psf
2014
2015
2016
2017
2018
2019
2020
8,000
10,000
12,000
14,000
16,000
18,000
Avg. Price psf
Price Bracket (INR/sqft)
< 5,000 5,000-10,000 10,000-15,000 > 15,000
RM UC RM UC RM UC RM UC
3.1%
-1.0%
1.1%
-0.4%
0.7%
1.4%
-0.8%-0.5%
Key Projects based on consumersearches
Key Developers based on activelistings
Average Price INR per sqft
Average Price INR per sqft
The above table represents the top developers by share ofactive listings on Magicbricks website in Q1 2020
Source: Magicbricks Research
Note:The above table represents the top projects by consumerpreference on Magicbricks website in Q1 2020
Source: Magicbricks Research
Notes:1. Ready to move price index represents the weighted average price of completed properties on Magicbricks website as on March 20202. The trend line represents the average prices of dominant asset class in each locality of the city. Source: Magicbricks Research
Note:1. Under-construction price index represents the weighted average price of under-construction properties on Magicbricks website as on March 20202. The trend line represents the average prices of dominant asset class in each locality of the city.
Source: Magicbricks Research
Note:Above table represents the price changes for Ready to move (RM) and Under construction (UC) properties for dominant asset classes in each locality under various pricebuckets as on March 2020
Source: Magicbricks Research
Page 1© magicbricks.com
1 BHK13%
3 BHK39%
Above 3 BHK11%
2 BHK37%
DEMAND
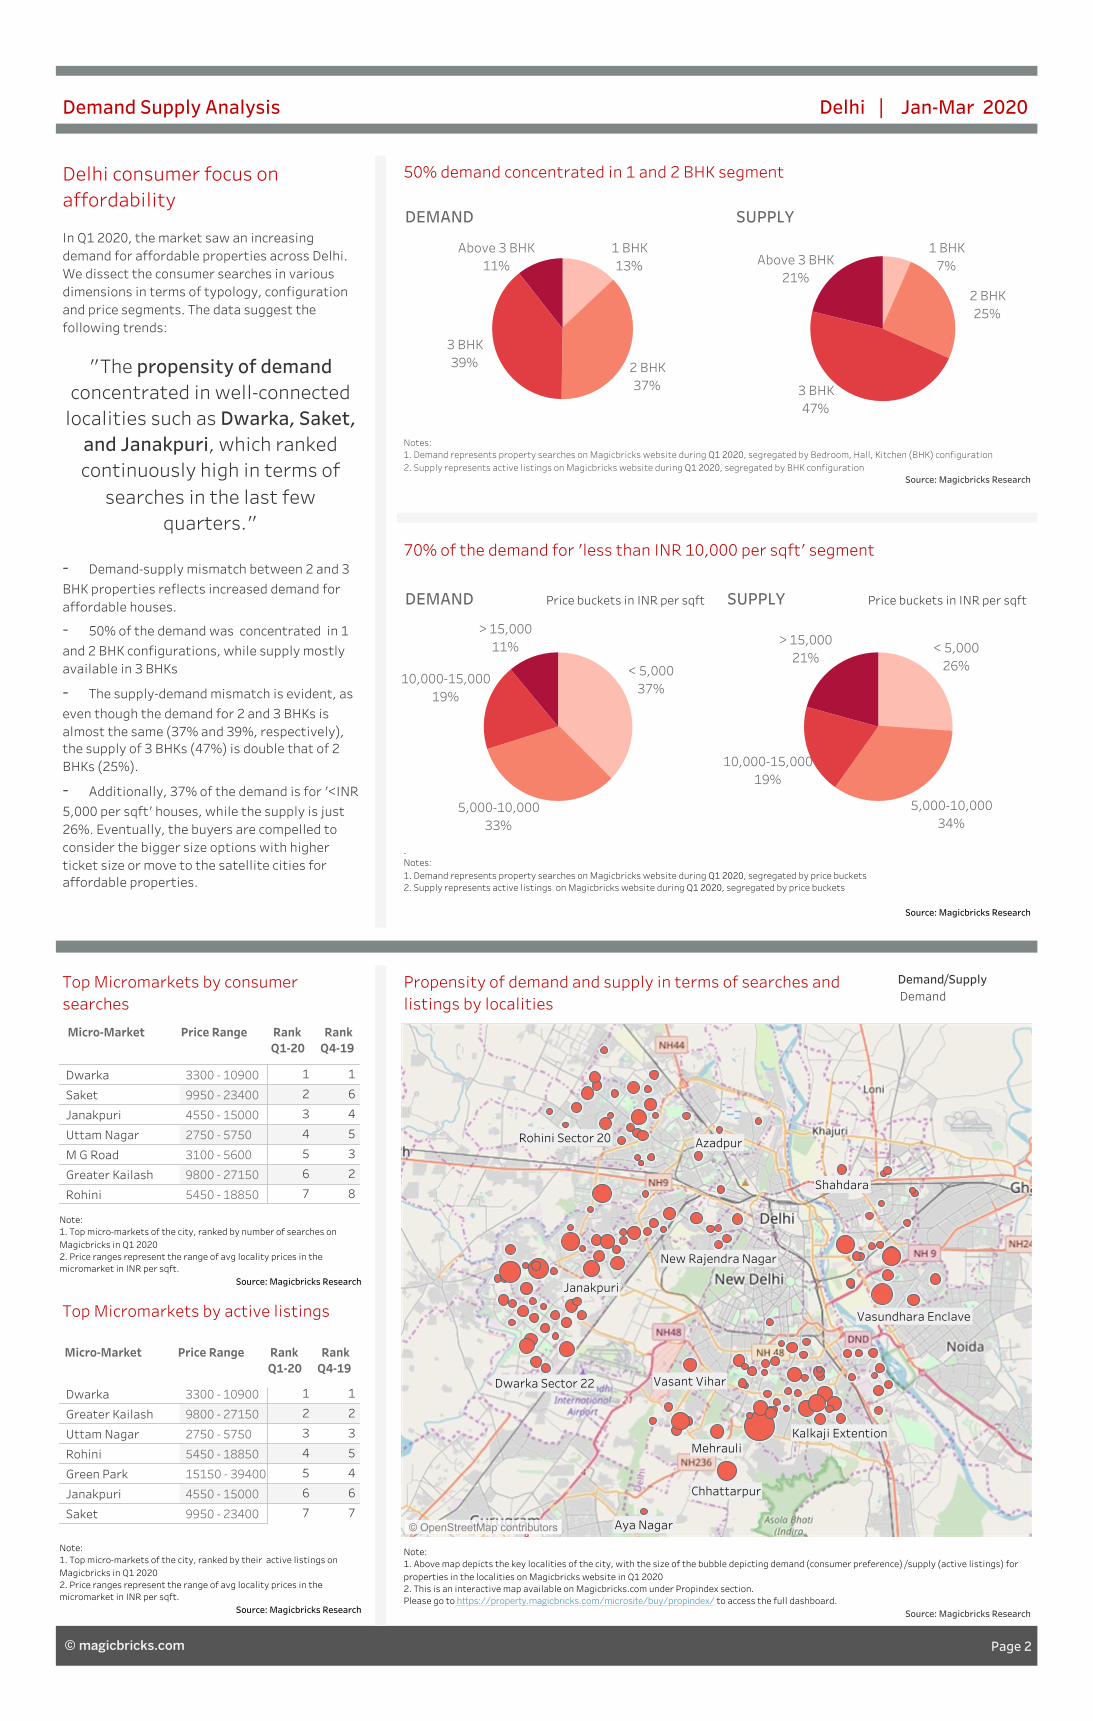
Demand Supply Analysis Delhi | Jan-Mar 2020
70% of the demand for 'less than INR 10,000 per sqft' segment
50% demand concentrated in 1 and 2 BHK segmentDelhi consumer focus onaffordability
In Q1 2020, the market saw an increasingdemand for affordable properties across Delhi.We dissect the consumer searches in variousdimensions in terms of typology, configurationand price segments. The data suggest thefollowing trends:
"The propensity of demandconcentrated in well-connectedlocalities such as Dwarka, Saket,and Janakpuri, which rankedcontinuously high in terms ofsearches in the last few
quarters."
- Demand-supply mismatch between 2 and 3BHK properties reflects increased demand foraffordable houses.
- 50% of the demand was concentrated in 1and 2 BHK configurations, while supply mostlyavailable in 3 BHKs
- The supply-demand mismatch is evident, aseven though the demand for 2 and 3 BHKs isalmost the same (37% and 39%, respectively),the supply of 3 BHKs (47%) is double that of 2BHKs (25%).
- Additionally, 37% of the demand is for '<INR5,000 per sqft' houses, while the supply is just26%. Eventually, the buyers are compelled toconsider the bigger size options with higherticket size or move to the satellite cities foraffordable properties.
Top Micromarkets by consumersearches
Propensity of demand and supply in terms of searches andlistings by localities
1 BHK7%
2 BHK25%
3 BHK47%
Above 3 BHK21%
SUPPLY
10,000-15,00019%
5,000-10,00034%
> 15,00021%
< 5,00026%
SUPPLY Price buckets in INR per sqft
Top Micromarkets by active listings
10,000-15,00019%
5,000-10,00033%
> 15,00011%
< 5,00037%
DEMAND Price buckets in INR per sqft
Notes:1. Demand represents property searches on Magicbricks website during Q1 2020, segregated by Bedroom, Hall, Kitchen (BHK) configuration2. Supply represents active listings on Magicbricks website during Q1 2020, segregated by BHK configuration
Source: Magicbricks Research
.Notes:1. Demand represents property searches on Magicbricks website during Q1 2020, segregated by price buckets2. Supply represents active listings on Magicbricks website during Q1 2020, segregated by price buckets
Source: Magicbricks Research
Note:1. Above map depicts the key localities of the city, with the size of the bubble depicting demand (consumer preference) /supply (active listings) forproperties in the localities on Magicbricks website in Q1 20202. This is an interactive map available on Magicbricks.com under Propindex section.Please go to https://property.magicbricks.com/microsite/buy/propindex/ to access the full dashboard.
Source: Magicbricks Research
Note:1. Top micro-markets of the city, ranked by their active listings onMagicbricks in Q1 20202. Price ranges represent the range of avg locality prices in themicromarket in INR per sqft.
Source: Magicbricks Research
Note:1. Top micro-markets of the city, ranked by number of searches onMagicbricks in Q1 20202. Price ranges represent the range of avg locality prices in themicromarket in INR per sqft.
Source: Magicbricks Research
New Rajendra Nagar
Vasundhara Enclave
Dwarka Sector 22
Kalkaji Extention
Rohini Sector 20
Vasant Vihar
Chhattarpur
Aya Nagar
Janakpuri
Shahdara
Mehrauli
Azadpur
© OpenStreetMap contributors
Demand/SupplyDemand
Dwarka 3300 - 10900
Saket 9950 - 23400
Janakpuri 4550 - 15000
Uttam Nagar 2750 - 5750
M G Road 3100 - 5600
Greater Kailash 9800 - 27150
Rohini 5450 - 18850
11
62
43
54
35
26
87
Dwarka 3300 - 10900
Greater Kailash 9800 - 27150
Uttam Nagar 2750 - 5750
Rohini 5450 - 18850
Green Park 15150 - 39400
Janakpuri 4550 - 15000
Saket 9950 - 23400
11
22
33
54
45
66
77
Micro-Market Price Range Rank Rank Q1-20 Q4-19
(Price in INR per Sqft)
Micro-Market Price Range Rank Rank Q1-20 Q4-19
Page 2© magicbricks.com

Note:1. Size of the bubble depicts demand, measured by volume of property searches in localities in Q1 20202. Color of the bubble represents price change in Q1 2020, with green color representing price increase and red color price decrease.3. This is an interactive map available on Magicbricks.com under Propindex section.Please go to https://property.magicbricks.com/microsite/buy/propindex/ to access the full dashboard.
LocalityAvg.Price
PriceChan..
Khanpur
Madangir
Om Vihar
Govindpuri Main
Chhattarpur
Mehrauli
Burari
Mohan Garden
Matiala
Dwarka Mor
Jamia Nagar
Uttam Nagar
Nawada
Uttam Nagar West
Uttam Nagar East
-7.5%
-0.4%
3.1%
1.8%
2.1%
-7.5%
0.6%
-3.8%
7.0%
-0.3%
-7.5%
-7.5%
4.5%
-4.0%
3.4%
0.9%
4,738
4,663
4,496
4,391
4,378
4,298
4,294
4,278
4,181
4,157
4,091
4,037
3,999
3,788
3,660
3,658
< INR 5,000 psf INR 5,000-10,000 psf INR 10,000-15,000 psf > INR 15,000 psf
Price Analysis Delhi | Jan-Mar 2020
- All price segments witnessed a mix of price increases and declines, with no price segment showing any specific upward or downward trend.- Most of the peripheral localities in west Delhi and pockets of south-east Delhi witnessed a price increase.- The price decline was mostly visible in areas adjoining Gurgaon, including Vasant Kunj, Chattarpur, Mehrauli and Vasant Vihar, reflecting that people havestarted to prefer living in Gurgaon to avoid massive road congestions.
Source: Magicbricks Research
LocalityAvg.Price
PriceChange
Indraprastha Ext
Patparganj
Paschim Vihar
Mayur Vihar
Rajouri Garden
Pitampura
Mayur Vihar 1
Rohini
Jhilmil Colony
Kalkaji
Kirti Nagar
Lajpat Nagar 1
Moti Nagar
Rohini Sector 13
Vivek Vihar
7.5%
5.5%
-2.7%
6.0%
2.2%
-2.5%
-0.8%
0.7%
-4.4%
2.5%
-1.2%
7.5%
1.0%
1.7%
7.5%
7.5%
-4.8%
1.9%
1.7%
5.4%
2.3%
7.5%
0.6%
-0.4%
14,641
14,592
14,544
14,461
14,070
13,600
13,437
13,351
13,212
13,163
13,050
12,746
12,642
12,274
12,224
11,885
11,319
11,300
11,044
10,838
10,341
10,262
10,206
10,118
LocalityAvg.Price
PriceChange
Preet Vihar
Chittaranjan Park
Punjabi Bagh West
Lajpat Nagar
Lajpat Nagar 4
Shivalik
Saket
East Of Kailash
Kailash Colony
Greater Kailash 1
Greater Kailash
Jangpura
Geetanjali Enclave
Greater Kailash 2
Green Park Ext
-2.2%
7.5%
3.2%
1.1%
-5.6%
2.9%
-0.7%
-3.9%
5.3%
-2.5%
-7.5%
-3.9%
5.1%
-6.8%
4.2%
-4.3%
7.5%
-3.0%
6.8%
-0.7%
-5.4%
-4.6%
-7.0%
1.9%
-7.5%
5.1%
-0.5%
-2.5%
3.3%
1.3%
-0.9%
0.7%
-3.0%
-2.9%
-2.8%
1.5%
7.5%
53,155
37,678
31,751
30,731
27,692
27,644
27,626
25,474
22,694
22,325
22,111
21,823
21,728
21,324
21,199
21,079
20,911
20,440
19,914
19,871
19,868
19,829
19,384
19,351
19,133
18,943
18,795
18,247
17,639
16,836
16,221
16,153
15,675
15,526
15,412
15,122
15,081
Note:1. Above is the list of major localities of the city, with information about their average prices and QoQ price changes in Q1 2020. This is an interactive table available on Magicbricks.com under Propindex section.2. The locality prices are calculated by averaging the prices of all properties in a locality in multi-storey and builder floor segment, after removing the outlier properties that might distort the overall prices.3. The four tables above categorize the localities in various price buckets.4. The color of the numbers represent the price change in Q1 2020, with green color representing price increase, red color price decrease, and grey as neutral. Source: Magicbricks Research
Disclaimer: The data represented above is compiled by MagicBricks from multiple sources. MagicBricks gives no warranty, express or implied, as to the accuracy, reliability, and completeness of any information and does not acceptany liability on the information which may or may not be subject to change from time to time due to Governmental or non Governmental regulations/directions.
Q1 2020 Price changes for the city's major localities
LocalityAvg.Price
PriceChange
Palam
Najafgarh
Mahavir Enclave
Shahdara
Laxmi Nagar
Tilak Nagar
Krishna Nagar
Rohini Sector 22
Hari Nagar
Rohini Sector 23
Rohini Sector 25
Dwarka Sector 8
Dilshad Garden
Dwarka Sector 14
Dwarka Sector 13
-5.6%
1.2%
-2.9%
-3.1%
-0.5%
1.1%
3.1%
-1.0%
-1.1%
-0.4%
-1.4%
2.0%
1.2%
0.7%
-0.6%
-0.3%
0.7%
-0.8%
-2.4%
-2.9%
-0.7%
0.7%
2.9%
-7.5%
-2.7%
-7.0%
-2.0%
-0.5%
3.5%
1.0%
-3.7%
6.2%
-7.5%
7.5%
-2.9%
-1.4%
3.4%
-5.6%
5.5%
9,914
9,684
9,677
9,375
9,355
9,209
9,203
9,141
9,105
9,090
9,050
8,989
8,988
8,929
8,851
8,813
8,772
8,685
8,672
8,578
8,511
8,440
8,362
8,150
8,127
7,744
7,714
7,678
7,532
7,334
7,314
6,941
6,240
6,197
6,124
5,661
5,188
5,134
5,086
Surabhi Arora | Head of Research Devendra Lohmor | Chief Manager Ankur Upadhyay | Data Manager Suneet Saxena | Assistant Manager [email protected] [email protected] [email protected] [email protected]
Please go to https://property.magicbricks.com/microsite/buy/propindex/ to access the full dashboard.
For more information and research related queries, please contact:
Dwarka Sector 8-0.5%
Dwarka Sector 22-1.4%
Rohini Sector 226.2%
Vasundhara Enc-0.7%
Chhattarpur-7.5%
Model Town0.7%
Sarita Vihar1.2%
Ashok Vihar-2.7%
Pitampura1.7%
Najafgarh-5.6%
Shahdara-1.4%
Vikaspuri3.1%
Burari-0.3%
© OpenStreetMap contributors
-7.5% 7.5%
-5% -2.5% 0% 2.5% 5%
Page 3© magicbricks.com