Embed Size (px)
Citation preview

Property Rights Protection ofBiotechnology Innovations
Gokhan Ozertan, Bogazici University
H. Alan Love, Texas A&M University
Curtis R. Taylor, Duke University
and
Diana M. Burton, Texas A&M University
January 2002
Keywords: intellectual property, contracts, technology protection system, piracy,
durable goods monopoly, biotechnology
Please address all correspondence to: H. Alan Love, Texas A&M University,
2124 TAMU, College Station, TX 77843-2124, 979-845-3270, [email protected]
The authors wish to thank Richard Woodward, Paul Mitchell and George Davis
for helpful comments. This research was supported by the Texas Agricultural
Experiment Station and a grant from the US Department of Agriculture.

Abstract
Protection of intellectual property embedded in potentially reproducible living
organisms presents some unique and difficult challenges. Biological innovations
like genetically modified (GM) seed are self-replicating, and as a result, represent
a form of durable good with a potential product life extending far into the future.
This gives rise to two problems: the need for copy protection of intellectual
property contained in GM seed, and traditional durable goods price commitment
problems combined with competition between new and reproduced progeny seed.
In this study, we compare contracts with use of biotechnological meth-
ods to protect intellectual property in GM seeds. Specifically, we consider three
regimes: current contracts commonly used in the industry, biotechnological meth-
ods, and long-term contracts. We investigate economic welfare consequences for
farmers, innovators and society of the various intellectural property protection
methods using a two-period framework that permits asymmetric information and
posits a probabilistic enforcement environment for pirating farmers. Results in-
dicate that biotechnological methods yield the highest expected profit for the
biotech firm. An important advantage of such a technology is that all transac-
tion costs related with enforcement and monitoring are eliminated. However, for
farmers, both current and long-term contracts are preferred to implementation of
biotechnical methods. Depending on monitoring costs, long-term contracts may
also be socially preferred to current contracts and biotechnical methods.

1. INTRODUCTION
Development of recombinant DNA techniques to move gene sequences across
living organisms, in conjunction with the landmark US Supreme Court decision
Diamond v. Chakrabarty (447 US 303, 1980) to make human-made microor-
ganisms patentable, has spawned an entirely new product class of genetically
modified (GM) seed. The first commercially produced GM seeds were released
for sale in the US in 1996. Most of these seeds were modified to include insect
or herbicide resistance. Benefits of these GM innovations are not equally valu-
able to all farmers, but depend on each farm’s pest problems. Even so, in 1999,
US farmers planted 57% of soybeans, 65% of cotton and 38% of maize pro-
duction using GM seed containing these innovations (USDA, 2000). Estimates
for bringing a recombinant DNA product to market range between, on average,
ten years and $240 million (Ko, 1992) to approximately six years and about $10
million (Fernandez-Cornejo et al., 1999).
Protection of intellectual property (IP) embedded in potentially repro-
ducible living organisms presents some unique and difficult challenges. Almost
immediately after commercial release of GM seed, intellectual property rights
protection issues arose. Biological innovations like GM seed are self-replicating,
and as a result, represent a form of durable good with a potential product life
extending far into the future. The patent holder of a particular GM modification
becomes a durable goods monopolist. This gives rise to two problems: the need
for copy protection of intellectual property contained in GM seed, and traditional
durable goods price commitment problems combined with competition between
new and reproduced progeny seed (Coase, 1972; Bulow, 1982; and Swan, 1980).
For some species and varieties, these problems are mitigated by natural
1

variations associated with biological reproduction. The degree of variation, and
often degradation in quality, from the parent depends on the species and on the
degree and type of hybridization (Hansen and Knudson, 1996; Stallmann, 1986).
For example, maize progeny seeds have very low production when compared to
original seeds, while progeny seeds from soybeans, wheat and cotton provide
yields closer to the originals. Indeed, under existing law, farmers can and often
do save non-GM progeny seed to plant in the next growing cycle, only purchasing
new seed when productivity falls below a critical level.
In an effort to protect intellectual property contained in patent-protected
GM seed, companies have introduced legally binding contracts, Technology Use
Agreements, (TUA) that assess a technology use fee and prohibit use or sale of
progeny seed for planting (Monsanto, 1996-2000). However, driven by strong
monetary incentives, and perhaps by a tradition of saving progeny seed for pro-
duction in future periods, at least some farmers have chosen to save and use
progeny seed rather than follow contract terms. This practice has come to be
known as ”piracy.”
Piracy can significantly reduce innovator profits and firms have aggres-
sively pursued copiers. Indeed, Monsanto has sued more than 500 farmers for
planting prodeny seed in violation of TUA contracts (Pope, 1999). However,
application of property rights protection to plant agriculture is both expensive
and difficult. Before direct court costs of enforcement, cheaters must be identi-
fied. Farmers are geographically dispersed and tests to identify pirated GM seed
are costly. Further, since plants and seed are subject to natural genetic drift,
it can be hard to identify a patented plant product and define precisely when
copying has occurred. This makes it difficult for patent holders of engineered
2

microorganisms to prove infringement (Lesser, 1990).
Alternatives to enforcement of contracts are biotechnological solutions to
intellectual property rights protection. Perhaps as a response to losses gener-
ated by piracy, biotechnology innovators have developed Technology Protection
Systems (TPS) (Control of.., 1998). These systems generally work by render-
ing progeny GM seed sterile and thus useless to pirating farmers. Hence, TPS
eliminates intellectual property enforcement issues. However, release of sterility-
inducing genetic material, often refered to as ”terminator technology” by its op-
ponents, has caused environmental controversy and several environmental groups
have protested its commercial introduction (Pope, 1999). Possible externalities,
including environmental and ecological damages associated with introducing this
technology, are discussed in Crouch (1998), McHughen (2000), and Ho et al.
(1998). The result is that TPS technology has not been commercially imple-
mented.
In this study, we compare contracts with use of TPS to protect intellec-
tual property in GM seeds. Specifically, we consider three regimes: current TUA
contracts, biological TPS solutions, and long-term contracts. We investigate eco-
nomic welfare consequences for farmers, innovators and society of the various IP
protection methods using a two-period framework that permits asymmetric infor-
mation and posits a probabilistic enforcement environment for pirating farmers.
Results indicate that TPS technology yields the highest expected profit for the
biotech firm. An important advantage of such a technology is that all transac-
tion costs related with enforcement and monitoring are eliminated. However, for
farmers, both current and long-term contracts are preferred to implementation of
TPS technology. Depending on monitoring costs, long-term contracts may also
3

be socially preferred to current TUA contracts and TPS implementation.
1.2 Literature
The unlawful reproduction of patented technologies can diminish the value of
patented technologies through free riding. Copying is particularly easy in com-
puter software, print and film and recording entertainment, most literature focuses
on these industries (Shy and Thisse, 1999; Banerjee, 2000; Chen and Png, 2001;
Liebowitz, 1985; Novos and Waldman, 1984; Takeyama 1994, 1997; and Con-
ner and Rumelt, 1991). Generally, results indicate piracy creates a social welfare
trade-off between increased product utilization on the one hand, and underproduc-
tion of the protected good and reduced incentive to innovate on the other (Novos
and Waldman, 1984). Johnson (1985) discusses two models based on Salop’s
(1979) product differentiation work. In his model, welfare effects of copying
depend on the trade-off between the increase in consumption represented by the
copies versus the reduction in demand for originals. This trade-off hinges on the
supply-elasticity of products developed, and on consumers’ valuation of close
substitutes. Nascimento and Vanhonacker (1988) examine the firm’s pricing de-
cision for durable goods in the presence of reproduction possibilities and find
that while profits are generally higher with full protection against copiers, under
some conditions, partial protection might actually be more profitable. However,
Liebowitz (1985) and Novos and Waldman (1984), find that in durable goods
markets, copying can be viewed as a secondary market that can be used to raise
firm profits by helping to facilitate price discrimination among buyer classes.
The price to those most likely to facilitate pirating can be raised to partially
appropriate pirating rents.
4

Recently, several authors have considered piracy in products that exhibit
network effects (Takeyama 1994, 1997; Conner and Rumelt, 1991; Waldman,
1993; Shy and Thisse, 1999; Banerjee, 2000). Conner and Rumelt (1991), and
Takeyama (1994) find copying may benefit both patent holders and consumers
if network effects are large so that consumers’ valuations of the product in-
crease with the number of other consumers who adopt the product. Shy and
Thisse (1999) analyze software pirates within the context of network effects and
a price-setting duopoly software industry. They find that network effects may
intensify competition as rival firms race for market share. Under strong network
effects, unprotected software is a noncooperative equilibrium. On the other hand,
when network effects are weak, a high-price equilibrium with software protection
arises. Banerjee (2000) considers software piracy in the presence of network ex-
ternalities. In his single-period model, consumers, defined by their valuation of
the software, are uniformly distributed on the unit interval. Contract protections
and technical devices that prohibit copying are considered. Government deter-
mines monitoring and collects penalties and results hinge on government’s policy
choices. The welfare distribution depends on the relative costs of monitoring,
presence of the anti-piracy device and other model parameters. While positive
and negative network effects may play a role in biotechnology innovations, net-
work effects are not considered in our analysis. Positive network externalities
may exist in situations where a threshold usage quantity is necessary to profitably
establish processing, distribution and other facilities. Negative network external-
ities may arise when increased adoption of a particular innovation, like insect
resistance, reduces the effectiveness and profitability for all users by triggering
an adaptation in insects that makes the plant even more vulnerable.
5

Chen and Png (2001) find that innovator changes in price and monitoring
have quantitatively different effects on potential customers. Both policies affect
consumers’ choice of copying and buying. While monitoring reduces copiers’
expected benefits, discouraging copying, reducing price results in consumers
switching from copying to buying and, at the same time, raises noncopiers’ sur-
plus. If the innovation has already been brought to market, society prefers reduc-
ing price to monitoring as a means of protecting intellectual property. Takeyama
(1997) develops a two-period model that analyzes the effects of copying for a
durable goods software monopoly. Copied software is not identical to the orig-
inal, but has a lower quality. Takeyama concludes that Coase time-consistency
(i.e., credible commitment to prices) will be problematic and that the firm may
differentiate copyright and pricing policies across consumer types.
With the exception of Takeyama (1997), theoretical copyright protec-
tion literature has utilized single period models in which consumers can copy a
durable good without first purchasing it. This ignores important dynamic effects
associated with a durable good produced by a monopolist and is inappropriate
for models that include living organisms that can only be reproduced season-
ally. Assuming two types of consumers, Takeyama (1997) uses a two-period
model to investigate software piracy and finds intertemporal price discrimination
plays an important role in determining welfare ramifications of illegal copying.
In Takeyama’s model, however, copiers need not purchase the good, but can
copy in both periods. Many of her results follow from the effects of network
externalities.
This paper is organized as follows. In section 2 we describe our in-
tertemporal model in a principal-agent setting. Section 3 presents the current
6

TUA contract solution. In section 4, the TPS technology solution is analyzed.
Section 5 describes the long-term contract solution where GM seed buyers are
allowed to save progeny for use in the second period. Section 6 compares the
three solutions in terms of biotech firm’s profits. Farmer welfare for the three
solutions is compared in section 7. Section 8 compares expected total social
welfare. Conclusions are presented in section 9.
2. AN INTERTEMPORAL MODEL WITH PIRACY
A biotechnology firm (principal) is assumed to develop genetically modified seed
for sale to farmers (agents). There are two periods, t = 1,2 in the model and δ is
the discount factor, where δε[0, 1]. In period one, farmers must decide whether to
buy one unit of GM seed or one unit of traditional seed. Each farmer’s demand
for seed is completely price inelastic. With traditional seed, farmers have the
option of saving progeny seed for use in coming periods. We normalize both
farmer returns from using traditional seed and the price of traditional seed to
zero.
When farmers buy GM seed, they must pay a technology use fee Pt
and sign contracts (technology use agreements) with the biotech company that:
a) prohibit saving progeny seed, b) institute monitoring requirements, and c) set
penalties for piracy. Risk-neutral farmer agent types are defined by their potential
(or inherent) benefit from using GM seed. The value of GM seed to farmer i
is θi . Each farmer i knows his θi and agents are distributed uniformly on the
unit interval, θ ∼ uniform[0, 1]. Net return from using GM seed is equal to the
farmers’ location on the unit interval less price paid, θi − Pt .Once seed is bought at t=1, the farmer has the option of pirating at t=2.
However, the copied seed may not have the same quality as the originals. Return
7

from using copied seed is equal to αθ, where αε[0, 1]. The parameter can also
be thought of as a biological discount factor, or as biological depreciation (Lim,
1993, p.51).
The biotech firm offers GM seed priced at Pt at the beginning of each
period. The biotech firm is a risk-neutral profit maximizer. The cost of producing
GM seed is normalized to be zero. While the biotech firm does not know each
farmer’s agent type, it does know that farmer returns are uniformly distributed
along the unit interval. Thus, to catch farmers using progeny seed in violation
of their TUA contracts, the firm must monitor farmers who have purchased
GM seed. Monitoring is costly and we assume the biotech firm can commit to
monitor against copiers. In practice, commitment might be achieved by prepaying
a fixed fee for legal staff and inspectors. Monitoring activity is represented in
the model by µ, where µ is 0 for no monitoring and 1 for monitoring. The
cost of monitoring is C(µ) = kµ, where k > 0. When monitored, farmers are
caught with probability ϑε[0, 1]. If a farmer is caught, he loses revenue from
that production period and has to pay a penalty of λεR+, which is collected by
the firm.
With full information, the biotech firm could behave as a monopolist.
If the biotech firm could identify which farmers would pirate in the second
period, no farmer would illegally copy since he would certainly be caught. If
there were no possibility of farmers reselling purchased seed, the biotech firm
could also price discriminate since it would know how each farmer values GM
seed. However, in this asymmetric information model, farmers know at the
beginning of the game that the firm will monitor and the probability of being
caught pirating. The biotech firm does not know whom will pirate, and neither
8

the firm nor farmers know whom will get caught.
When the firm introduces a TPS mechanism like terminator technology
into the GM seed, it controls the quality of progeny seed and can render progeny
seed sterile. Hence, the farmer needs to buy GM seed each period if he wants
GM seed with perfect quality. Introduction of TPS technology allows the biotech
firm to behave as a nondurable goods monopolist.
3. CURRENT CONTRACTS
We identify four groups of farmers separated by their implicit values of GM
seed. High return farmers buy GM seed in both periods, medium-return farmers
buy GM seed in the first period and pirate in the second period, and low-return
farmers wait to buy GM seed until the second period. The last group consists of
traditional farmers who never buy GM seed and use only traditional seed. The
lowest return obtained by a high-return farmer is denoted θH . The lowest return
obtained by a medium-return farmer is θM , and the lowest return obtained by a
low-return farmer is θL. Traditional farmers have implicit returns from GM seed
below θL. This distribution is illustrated in Figure 1.
0 θL θM θH 1
Figure 1. Uniform Distribution of Farmer Returns from GM Seed
Time-consistency requires that the biotech firm make its profit maximiz-
ing decisions so that it has no incentive to revise its production plan. This is
achieved through backward induction, i.e., by determining its optimal decisions
backward in time, starting with the second period. The solution results in a
subgame perfect Nash equilibrium.
9

3.1. Second Period
A farmer has two second-period options if he purchased GM seed in the first
period. A high-type farmer can either buy GM seed again, or copy seed bought
in the first period. If the farmer buys in the second period, expected return will
equal his location on the unit interval θH minus the price paid for GM seed
P2. If the farmer decides to copy, his expected return will equal the expected
benefit from copying, (1 − ϑµ)αθH , less the expected penalty, ϑµλ. The term
(1− ϑµ) reflects the probability of successful piracy and ϑ is the probability of
being caught. To induce high-return farmers to purchase rather than pirate in the
second period, the biotech firm’s pricing and monitoring choices must satisfy the
following incentive compatibility constraint (ICC):
θH − P2 ≥ (1− ϑµ)αθH − ϑµλ (1)
Assuming an interior solution at the optimum, from (1) the second period price
is determined as:
P2 = [1− (1− ϑµ)α]θH + ϑµλ (2)
The individual rationality constraint (IRC ) for low-return farmers gives the
necessary condition for a low-type farmer to buy GM seed:
θL − P2 ≥ 0 (3)
The left side of inequality (3) is the expected return from buying GM seed in the
second period and the right side is return from using traditional seed. Combining
(2) and (3), at equality we can derive the second period price as:
θL = P2 = [1− (1− ϑµ)α]θH + ϑµλ (4)
10

The biotech firm’s second period expected profit is the sum of its sales and net
penalty revenues less monitoring costs:
Π2 =
1
θH
P2dρ+
θM
θL
P2dρ+
θH
θM
ϑµλdρ− kµ (5)
The first two integrals are revenue generated by selling GM seed. The last
integral is revenue received as penalty from caught copiers. Equation (5) can be
expressed as a function of θH and θM after substituting for P2:
maxθH
[(1− (1− ϑµ)α)θH + ϑµλ][1− θH + θM − θL]
+ϑµλ(θH − θM)− kµ (6)
From (4), θL can be expressed as a function of θH . Hence, second-period profit
is a function of θH and θM .
maxθH
(1− θH)[(1− (1− ϑµ)α)θH + ϑµλ]
[θM − (1− (1− ϑµ)α)θH − ϑµλ]
[(1− (1− ϑµ)α)θH − ϑµλ] + (θH − θM)ϑµλ− kµ (7)
In the second period, the biotech firm maximizes profit with respect to
P2, which can be expressed as a function of θH . Solving the FOC for θH as a
function of θM ,α,ϑ, µ, and λ yields the relationship between thresholds for high
and medium return farmer types:
θH =1− 2ϑµλ+ θM2(2− (1− ϑµ)α)
(8)
After substitution into (4), P2 becomes:
P2 = θL =1− α+ αϑµ+ 2ϑµλ+ θM(1− (1− ϑµ)α)
2(2− (1− ϑµ)α)
=1 + θM − 2θH
2(9)
11

3.2. First Period
For medium return farmers’ incentive compatibility constraint to be satisfied,
profit from purchasing GM seed in period 1 and pirating in period 2 must be at
least as large as profit from purchasing traditional seed in period 1 and GM seed
in period 2:
(θM − P1) + δ[(1− ϑµ)αθM − µϑλ] ≥ δ(θM − P2), (10)
where the left side of (10) is the discounted return from the buying-copying
alternative, and the right side is the discounted return from waiting to buy until
the second period. Assuming (10) holds with equality in equilibrium and using
(9), the first-period price can be expressed as a function of θM and θH :
P1 = θM [1 + δ((1− ϑµ)α− 1)]− δϑµλ+ δP2 (11)
In the first period the biotech firm sells GM seed to high and medium-
return farmers. Hence, the firm’s expected profit is:
Π =
1
θM
P1dθ + δΠ∗2 (12)
The first part of (12) is revenue generated from first period seed sales. The sec-
ond part is the discounted optimal profit from optimized (7). The time-consistent
subgame-perfect optimal solution is found by maximizing (12) with respect to θM .
3.3. Current Contract Solution
We assume the biotech firm can commit to monitor so µ = 1 . Also, for
simplicity, we assume α = 1 so progeny seed are identical to orginals. Optimal
12

values for θ∗H , θ∗M , P ∗2 , and P ∗1 are:
θ∗M =1
2+
δϑ
2(4 + 4ϑ− 3δϑ− 4δϑ2) (13)
θ∗H =3− 4ϑλ4(1 + ϑ)
+δϑ
4(1 + ϑ)(4 + 4ϑ− 3δϑ− 4δϑ2) (14)
θ∗L = P∗2 =
3ϑ+ 4ϑλ
4(1 + ϑ)+
δϑ2
4(1 + ϑ)(4 + 4ϑ− 3δϑ− 4δϑ2) (15)
P ∗1 =2 + 2ϑ2 − δ2ϑ2 + 2δ2ϑ4 − 4δϑ2 − 4δϑ3 + 4ϑ
(1 + ϑ)(4 + 4ϑ− 3δϑ− 4δϑ2) − δϑ2λ
1 + ϑ(16)
Profit is maximized by charging P ∗1 and P ∗2 to GM seed buyers defined by
threshold values θ∗H , θ∗M and θ∗L.
LEMMA 1: When α = 1 and µ = 1, a sufficient condition for the IRCs and
ICCs to hold, and hence for θ∗H ≥ θ∗M ≥ θ∗L, is:
1− ϑ(1 + δ)− 2ϑ2(1− δϑ)− 4ϑλ(1 + ϑ(1− δϑ)) + 3δϑ2λ > 0 (17)
Lemma 1 holds when 0 ≤ ϑ ≤ 0.15 and 0 ≤ λ ≤ 1. Proof of Lemma 1 is givenin Appendix A.
Based on inspections conducted under Technology Use Agreements, Mon-
santo concluded that 98 percent of farmers who sign the TUAs comply with
contract terms (Yeager, 1999). This implies that ϑ = 0.02 . In addition, evi-
dence from recent court cases suggests that the penalty typically paid by farmers
caught pirating seed is equal to the technology fee for that crop (Judge Orders..,
2001). This implies a λ value less than or equal to the price charged for GM
seed. These values are consistent with parameter limitations imposed by Lemma
1.
13

PROPOSITION 1: When Lemma 1 holds, θ∗H decreases and θ∗L increases in
both λ and ϑ. Optimal θ∗M does not depend on the penalty for piracy, λ, and rises
with probability of being caught, ϑ. θ∗H , θ∗M and θ∗L all increase in the discount
factor, δ.
Partial proof of Proposition 1 is given in Appendix B. Proposition 1 means that
the minimum return necessary to persuade a farmer to purchase GM seed in
period 1, θ∗M , rises as the probability of being caught pirating in period 2, ϑ,
rises but is independent of the penalty λ. The minimum return to high-type
farmers, θ∗H , falls with increases in the probability of being caught ϑ and penalty
λ, which means that these increases convince more farmers to purchase GM seed
in period 2. Thus, the number of pirates, those farmers with returns between
θ∗H and θ∗M , falls as the probability of being caught and the penalty rise. The
intuition is that the number of pirates falls as cost of pirating rises.
The minimum return that defines the marginal low-type farmer, θ∗L, rises
with increases in the probability of being caught ϑ and penalty λ. This results
follows immediately from θ∗L = P ∗2 , and the biotech firm can charge a higher
price for GM seed in the second period as the expected cost of piracy to the
farmer rises. Equality of the defining minimum return to a low-type farmer who
only buys GM seed in the second period, θ∗L, and the optimal second period price
for GM seed, P ∗2 , results because θ∗L defines this marginal buyer and P ∗2 is the
price that marginal farmer must pay.
Minimum returns to all farmer types rise with the discount factor δ.
As the discount factor rises, the implied discount rate falls. As second period
returns become more important to farmers, implied by a lower discount rate, the
minimum defining return to all farmer types rises. Thus, as θ∗H rises, there are
14

fewer high-type farmers who buy GM seed in both periods. As θ∗L rises, there are
more farmers who buy traditional seed in both periods. The number of farmers
pirating, those with returns between θ∗H and θ∗M , and the number buying GM
seed only in the second period, those with returns between θ∗M and θ∗L , depend
on the relative magnitude of changes in these minimum defining returns θ∗i , even
though all defining returns increase in discount factor δ .
PROPOSITION 2: Under the current contract regime, the biotech firm charges
a higher GM seed price in the first period than in the second period.
See Appendix C. In a durable goods setting, some buyers wait for lower prices in
subsequent periods as they expect the monopolist to ”flood the market” (Tirole,
1988, p.82).
4. TECHNOLOGY PROTECTION SYSTEM
When the biotech firm implements a technology protection system for GM seed,
contracts are no longer necessary as seeds are no longer self-reproducing (α = 0).
There is no need for monitoring (µ = 0) or penalties (λ = 0), since farmers
must buy new GM seed in each period. Hence there are only two types of
farmers: those who buy GM seed and those who use traditional seed. With
TPS technology, farmer i is willing to purchase GM seed when his net return is
greater than zero:
θ − P ≥ 0 (18)
When the biotech firm uses TPS technology, its profit maximization reduces to
a series of single period optimizations in which the biotech firm sets the optimal
price for GM seed at the same level in each period. The biotech firm’s profit
for each period is:
15

Π =
1
θ
Pdθ (19)
Substituting constraint (18) into equation (19) gives:
Π = θ(1− θ) (20)
and profit is maximized at:
θ∗ = P ∗ =1
2(21)
PROPOSITION 3: When TPS is implemented, the biotech firm behaves as
monopolist. The optimal price is equal to 12, and 1
2of farmers purchase GM seed
in each period.
Proof to Proposition 3 is given above. The biotech firm acts as a monopolist and
sets price to sell to the one-half of farmers who have the highest implicit returns
from GM seed.
PROPOSITION 4: When Lemma 1 holds and TPS technology is used, the
price of GM seed is higher than current contract second period price, but less
than first period price under the current contract regime (PCC∗1 ≥ P T∗ ≥ PCC∗2 ).
Partial proof of Proposition 4 is presented in Appendix C. With current contracts,
in the first period the biotech firm charges a price higher than full monopoly price.
These high price sales help to compensate for the loss from seed piracy in the
second period. Additional sales can be obtained in the second period by selling at
a lower than monopoly price, inducing additional low-type farmers who bought
traditional seed in the first period to buy GM seed in the second period.
16

5. LONG-TERM CONTRACTS
As an alternative to current GM seed contracts, biotech firms could write long-
term (LT) contracts. A LT contract gives farmers who buy GM seed in the first
period the right to plant progeny seed in the second period. With LT contracts,
three types of farmers are distinguished. High-type farmers purchase GM seed
in the first period and plant progeny GM seed in the second period; the lowest
return to a high-type farmer is θB. Middle-type farmers use traditional seed in the
first period and buy GM seed for the second period only. LT contracts are offered
in the first period, but seed is offered for sale in the second period. The lowest
return to a middle-type farmer is θA. Low-type farmers buy traditional seed in
both periods. There is no need for monitoring or penalties with LT contracts,
since first period buyers have the right to use the homegrown GM seed in the
second period. Progeny seed are assumed identical to original seed (α = 1).
5.1. Second Period
For medium-return farmers, who purchase GM seed in the second period only,
the return from buying GM seed must be at least as great as using traditional
seed. Hence, the individual rationality constraint is:
θA − P2 ≥ 0. (22)
At the optimum,
θA = P2. (23)
In the second period, the biotech firm’s expected profit is:
Π2 =
θB
θA
P2dθ. (24)
17

After substitutions, equation (24) becomes:
Π2 = P2θB − P2θA. (25)
Biotech firm profit is maximized with respect to P2, giving:
P ∗2 = θA =θB2. (26)
Combining (25) and (26), the optimal second-period profit becomes:
Π2 =θ2B4
(27)
5.2. First Period
For farmers who buy GM seed using LT contracts in the first period, the dis-
counted return from two periods should be at least as great as the discounted
return from using traditional seed in the first period and waiting until the second
period to purchase GM seed. Hence, the incentive compatibility constraint is:
θB − P1 + δθB ≥ δ(θB − P2) (28)
At the optimum, the first-period LT price becomes:
P1 = θB(1 +δ
2). (29)
The biotech firm’s two-period objective is:
Π =
1
θB
P1dρ+ δΠ∗2, (30)
which can be maximized with respect to first-period LT price, P1 to give θ∗B as
a function of δ:
θ∗B =2 + δ
4 + δ. (31)
18

Substituting (31) into (26) and (29) results in optimal prices:
P ∗2 =θ∗B2=
2 + δ
2(4 + δ), (32)
and
P ∗1 = θB(1 +δ
2) =
(2 + δ)2
2(4 + δ). (33)
Hence, the long-term contract price in period 1 is higher than in period 2.
PROPOSITION 5: When LT contracts are available, the second-period GM
price is no greater than the GM seed price when TPS technology is implemented
and the first-period LT contract price is at least as large as the TPS technology
GM seed price, PLT∗1 ≥ P T∗ ≥ PLT∗2 . Further, when the biotech firm uses
current contracts with monitoring and copies are identical to originals (Lemma
1 holds), it charges lower prices in both periods compared with LT contracts
PLT∗1 ≥ PCC∗1 , PLT∗2 ≥ PCC∗2 .
Appendix D demonstrates Proposition 5. The LT contract solution is identical
to the current contract case where seed can be perfectly copied and the biotech
firm does not monitor, but assumes all farmers will pirate and sets it first period
GM price to capture these rents. Since everyone who buys GM seed using a
LT contract in the first period can use progeny seed, the firm would set prices
accordingly. However, under current contracts, the biotech firm’s optimal pricing
makes allowance for the loss imposed by unauthorized copying of GM seed. This
solution is analogous to the durable goods monopoly solution in a two period
model.
19

6. THE BIOTECH FIRM’S EXPECTED PROFIT
In this section, we analyze the distribution of benefits between the biotech firm
and farmers across contract and TPS regimes. The biotech firm’s profit is com-
puted for each case by substituting optimal values for choice variables into total
profit.
6.1. Current Contracts
From (12), (13) and (16), the first-period profit is:
Π1 = (1− θ∗M)P∗1 . (34)
From (5), (13), (14) and (15), the biotech firm’s second-period profit is:
Π2 = P∗2 [(1− θ∗H) + (θ
∗M − θ∗L)] + ϑλ(θ∗H − θ∗M)− k, (35)
where the first term is GM seed sales revenue, the second term is revenue from
catching pirates, and the last term is monitoring cost. Making substitutions, the
present value of profit for both periods is:
Π∗ = Π∗1 + δΠ∗2 =
1+2ϑ+2δϑ+4δϑλ+ϑ2+δ2ϑ4−2δ2ϑ3−2δϑ3−2δ2ϑ2+4δ2ϑ4λ(1+ϑ)(4+4ϑ−3δϑ−4δϑ2)
+4δ2ϑ4λ2+3δ2ϑ3λ2−δ2ϑ3λ−4δϑ3λ−4δϑ3λ2−3δ2ϑ2λ−4δϑ2λ2(1+ϑ)(4+4ϑ−3δϑ−4δϑ2) − δk. (36)
6.2. TPS Technology
From (20) and (21), profit for each period is:
Π∗ = P ∗(1− θ∗) =1
4. (37)
The present value of profit for both periods is:
Π∗ =1 + δ
4. (38)
20
6.3. Long-Term Contracts
From (30), (31) and (33), the biotech firm’s first period profit is:
{Π∗1 = (2 + δ
4 + δ)2, (39)
and, from (27) and (31), the biotech firm’s second-period profit is:
{Π∗2 = (2 + δ
2(4 + δ))2. (40)
Hence, the biotech firm’s discounted total profit is:
Π∗ = Π1∗ + δΠ2∗ =
(2 + δ)2
4(4 + δ). (41)
PROPOSITION 6: The biotech firm prefers to use TPS technology. When TPS
technology is not implemented, the firm prefers LT contracts to current contracts,
ΠT∗ ≥ ΠLT∗ ≥ ΠCC∗. In addition, as the discount factor δ approaches zero, thebiotech firm’s expected LT contract profit approaches its expected profit from
using TPS technology.
See Appendix E. This proposition shows that the biotech firm maximizes profit
by implementing TPS technology, creating a nondurable goods monopoly. When
the discount factor approaches zero, the discount rate approaches infinity and the
future does not matter. In this case, the biotech firm would separately maximize
expected profit in each period under the LT contract regime just as it does under
a TPS technology regime.
Profits from LT contracts are greater than under current contracts because
there is no monitoring cost under long-term contracts. In addition, because the
biotech firm charges for two periods of GM seed use when farmers buy in
the first period, it is able to capture additional rents from farmers who use
21

progeny seed under the LT regime. Under current contracts, the biotech firm
motivates purchase of GM seed in the second period as an alternative to pirating
by lowering PCC∗2 . Under current contracts, the biotech firm only captures
penalties from those pirating farmers that it catches; others use progeny seed
without compensating the biotech firm. Even though the biotech firm charges
a higher price for GM seed in the first period under current contracts, it is
constrained by the cost of alternative farmer actions in the second period.
7. FARMERS’ EXPECTED WELFARE
7.1. Current Contracts
Total farmer welfare is the sum of each farmer’s welfare across farmer types.
Farmers who do not use GM technology have economic welfare normalized to
zero. Second period total farmer welfare for the current contract regime for high-,
medium- and low-type farmers is:
W ∗2 =
1
θ∗H
(ρ− P ∗2 )dρ+θ∗M
θ∗L
(ρ− P ∗2 )dρ+θ∗H
θ∗M
((1− ϑ)ρ− ϑλ)dρ, (42)
W ∗2 =12− θ∗L + θ∗Lθ
∗H − θ∗Lθ
∗M
+(θ∗L)
2
2− ϑ(θ∗H)
2
2− ϑλθ∗H + ϑ
(θ∗M )2
2+ ϑλθ∗M . (43)
In the first period, farmers’ expected welfare is:
W ∗1 =
1
θ∗M
(ρ− P ∗1 )dρ, (44)
W ∗1 =1
2− P ∗1 −
(θ∗M)2
2+ P ∗1 θ
∗M (45)
22

Hence, the present value of total farmer welfare is:
W ∗ = W ∗1 + δW ∗2 =1+δ2− θ∗L + θ∗L(θ
∗H − θ∗M)
−ϑλ(θ∗H − θ∗M)− δP ∗1 (1− θ∗M)− (δ−ϑ)θ∗2M2
+θ∗2L2− ϑθ∗2H
2(46)
7.2. TPS Technology
Under the TPS technology regime, farmers’ welfare is:
W ∗ =
1
12
(ρ− P ∗)dρ = 1
8(47)
for each period. If we consider two periods with discount factor, δ, total farmer
welfare is:
W ∗ =W ∗1 + δW ∗2 =1 + δ
8(48)
7.3. Long-Term Contracts
For the LT contract case, expected welfare for each farmer type is:
W ∗B =
1
θB∗
[(1 + δ)ρ− P ∗1 ]dρ =1 + δ
2− (2 + δ)2(3 + δ)
2(4 + δ)2(49)
W ∗A = (
θ∗AθB∗ρ− P ∗2 )dρ =
(2 + δ)2
8(4 + δ)2(50)
Total welfare for LT contract is:
W ∗ =W ∗B + δW ∗A =1 + δ
2− 3(2 + δ)2
8(4 + δ)(51)
23

7.4. Comparison of Farmers’ Expected Welfare
When farmers’ expected welfare for the three mechanisms are compared, the
following proposition is obtained:
PROPOSITION 7: TPS technology results in lower expected farmers’ wel-
fare compared with both the current contract and LT contract regimes. Current
contracts result in higher expected welfare than LT contracts.
See Proposition 7 in Appendix F.
From the farmers’ point of view, use of TPS technology results in lower
expected welfare compared to current and LT contracts. With TPS technology,
the biotech firm charges the monopoly price in each period and gets maximum
economic rents from farmers in every period. When TPS technology is not
implemented, current contracts provide higher expected farmer welfare, with at
least some farmers benefiting from pirating. Further, under either current or LT
contract regimes, farmers benefit from a lower second period price than in the
monopoly TPS case.
With LT contracts, the biotech firm optimally adjusts its pricing policy
to accommodate farmers planting progeny seed in the second period. Under the
current contract regime, the possibility of piracy imposes an additional pricing
constraint on the biotech firm. In addition, farmer welfare directly benefits from
successful piracy.
8. SOCIAL WELFARE
Total welfare is the sum of the biotech firm’s expected profit and farmers’ ex-
pected welfare.
24

PROPOSITION 8: Implementing TPS technology results in lower expected
total welfare compared to LT contracts. If monitoring cost, k, is greater than
0.097, LT contracts always result in greater expected total welfare compared to
current contracts. If k is less than 0.009, expected total welfare with current
contracts is always greater than expected total welfare with TPS technology.
See Appendix G. While TPS technology results in highest biotech firm (monopoly)
profit, farmer welfare and total welfare are lower. Under both the current contract
and long-term contract regimes, farmers benefit from GM seed durability.
In this model, under current contracts, monitoring cost is fixed and does
not affect the probability of catching pirates nor the penalty. Hence, monitor-
ing cost simply reduces economic welfare by reducing biotech firm profit in the
second period. If monitoring cost is above a critical level, total welfare of the
current contract regime falls below that of long-term contracts. If monitoring
cost is below a critical level, total economic welfare obtainable from the cur-
rent contract regime is greater than that from a TPS regime. However, since
the biotech firm has lower expected profit under both contract regimes when
compared to the TPS case, its investment in research and development for future
products might be lessened, reducing social welfare in the long-run.
9. CONCLUSION
We analyze two contract mechanisms and a biotechnological protection device
for intellectual property contained in biologically reproducible agricultural crops.
A biotech firm sells GM seed to farmers in a two-period model framework with
asymmetric information where the biotech firm can not identify the innovation’s
value to each farmer.
25

From the biotech firm’s perspective, TPS technology clearly results in
highest expected profit, as this regime results in monopoly profit. An important
advantage to the firm of this technology is that enforcement and monitoring costs
are eliminated. Long-term contracts provide the next highest profit level, with
current contracts providing least profit. From the farmer’s perspective, both cur-
rent and LT contracts are preferred to the TPS regime, since these contracts result
in higher expected welfare. Farmers who pirate prefer current contracts, as they
realize benefits from GM seed without paying for it. Depending on monitoring
cost, LT contracts are preferred to current contracts in terms of expected total
welfare. If monitoring cost is high, it sufficiently depresses biotech firm profit
and reduces total welfare. Alternatively, if the number of successful pirates is
large and cost of monitoring is small, then total welfare is maximized under the
current contract regime.
Our results indicate that LT contracts offer a viable alternative to TPS
technology. LT contracts protect intellectual property investments more effec-
tively than do current contracts. Given these results, the question arises as to
why long-term contracts have not been adopted by the industry. One answer
might be that the long-term contract price would be sufficiently high to discour-
age farmers from adopting unproven GM seed technology. Now that GM seed
has been widely adopted and farmers know its value, we expect to see contracts
evolve into longer term instruments.
Interpretation of model results should be done cautiously. First, this is a
stylized model and it may be difficult to generalize all results. Second, when LT
contracts are signed, no monitoring costs are incurred as contracts run the entire
analytical horizon. In a multi-perioid setting, if contract length were less than
26

the time horizon, then monitoring cost would be incurred after the end of the
contract period. Also, this model ignores the possibility of commercial piracy,
where farmers sell GM seed progeny for profit.
Further research might consider the effects of copy quality and contin-
uous monitoring on the optimal contract mechanism. Another extension might
be inclusion of commercial piracy. Commercial piracy represents a significant
roadblock to introducing GM seed in developing countries.
REFERENCES
Banerjee, D., 2000, ”Software Piracy: A Strategic Analysis and Policy Instru-
ments,” Working Paper, Bond University.
Bulow, J., 1982, ”Durable Goods Monopolists,” Journal of Political Economy,
90, 314-332.
Chen, Y. and I. Png, 2001, ”Software Pricing and Copyright: Enforcement
Against End-Users,” Working Paper, National University of Singapore, Avail-
able on-line at: http://www.comp.nus.edu.sg/˜ipng.
Coase, R., 1972, ”Durability and Monopoly,” Journal of Law and Economics,
15, 143-149.
Conner, K. and R. Rumelt, 1991, ”Software Piracy: An Analysis of Protection
Strategies,” Management Science, 37, 125-139.
27
”Control of Plant Gene Expression,” U.S. Patent and Trademark Office. Patent
No: 5,723,765. March 3, 1998.
Crouch, M., 1998, ”How the Terminator Terminates: An Explanation for the
Non-Scientist of a Remarkable Patent for Killing Second Generation Seeds of
Crop Plants,” Available on-line at: http://www.bio.indiana.edu/people/terminator.html.
Fernandez-Cornejo, J., C. Klotz-Ingram and S. Jans, 1999, ”Farm-Level Effects
of Adopting Genetically Engineered Crops in the U.S.A,” Available on-line at:
http://agecon.lib.umn.edu, June 1999.
Hansen, L. and M. Knudson, 1996, ”Property Right Protection of Reproducible
Genetic Material,” Review of Agricultural Economics, 18, 403-414.
Ho, M., H. Meyer and J. Cummins, 1998, ”The Biotechnology Bubble,” The
Ecologist, 28, 146-153.
Johnson, W. R., 1985, ”The Economics of Copying,” Journal of Political Econ-
omy, 93, p. 158-174.
”Judge Orders Canola Farmer to Pay Monsanto 20,000 for Patent Infringe-
ment,” 2001, Agence France Press. Available on-line at: http://www.biotech-
info.net/judge orders.html, May 24, 2001.
Ko, Y., 1992, ”An Economic Analysis of Biotechnology Patent Protection,” Yale
28

Law Journal, 102, 777-804.
Lesser, W., 1990, ”Sector Issues II: Seeds and Plants,” in Strengthening Protec-
tion of Intellectual Property in Developing Countries: A Survey of the Literature.
Washington, DC, World Bank, Discussion Papers 112.
Liebowitz, S., 1985, ”Copying and Indirect Appropriability: Photocopying of
Journals,” Journal of Political Economy, 93, 945-957.
Lim, P., 1993, ”The Privatization of Species: An Economic History of Biotech-
nology and Intellectual Property Rights in Living Organisms,” Ph.D. dissertation,
Stanford, CA: Stanford University.
McHughen, A., 2000, ”Biotechnology and Food, Second Edition,” American
Council on Science and Health, Available on-line at: http://www.acsh.org.
Monsanto, 1996-2000. Technology Use Agreement, St.Louis, MO.
Nascimento, F. and W. Vanhonacker, 1988, ”Optimal Strategic Pricing of Repro-
ducible Consumer Products,” Management Science, 34, 921-937.
Novos, I. and M. Waldman, 1984, ”The Effects of Increased Copyright Protec-
tion: An Analytic Approach,” Journal of Political Economy, 92, 236-246.
Pope, C., 1999, ”The Bad Seeds: How the Biotechnology Industry Packages
29

Nature for Profit,” Sierra, 84, May/June 1999, 18-19.
Salop, S., 1979, ”Monopolistic Competition with Outside Goods,” Bell Journal
of Economics, 10, 141-156.
Shy, O. and J. Thisse, 1999, ”A Strategic Approach to Software Protection,”
Journal of Economics and Management Strategy, 8, 163-190.
Stallmann, J.I., 1986, ”Impacts of the 1930 Plant Patent Act on Private Fruit
Breeding Investment,” Ph.D. Dissertation, East Lansing: Michigan State Univer-
sity, 1986.
Swan, P., 1980, ’Alcoa: The Influence of Recycling on Monopoly Power,” Jour-
nal of Political Economy, 88, 76-90.
Takeyama, L., 1994, ”The Welfare Implications of Unauthorized Reproduction of
Intellectual Property in the Presence of Demand Network Externalities,” Journal
of Industrial Economics, 42, 155-166.
Takeyama, L., 1997, ”The Intertemporal Consequences of Unauthorized Repro-
duction of Intellectual Property,” Journal of Law and Economics, 40, 511-522.
Tirole, J., 1988, The Theory of Industrial Organization, Cambridge, MA: MIT
Press.
30

U.S. Department of Agriculture, 2000, Production Practices for Major Crops in
US Agriculture, 1990-1997. ERS:Statistical Bulletin No. 969, August 2000.
Waldman, M., 1993, ”A New Perspective on Planned Obsolescence,” Quarterly
Journal of Economics, 108, 273-283.
Yeager, P., 1999, ”Monsanto Contracts Demand Too Much,” The Western Pro-
ducer, Available on-line at: http://www.producer.com, April 15, 1999.
APPENDIX A. LEMMA 1
For our model to be valid the following two conditions must be satisfied:
I: Minimum return to a high type farmer should be greater than the minimum
return to a medium-type farmer:
θ∗H ≥ θ∗M (52)
Subtracting equation (13) θ∗M from (14) θ∗H and multiplying through by the (pos-
itive) denominator yields (17).
II: Minimum return to a medium-type farmer should be greater than minimum
return to a low-type farmer:
θ∗M ≥ θ∗L. (53)
Subtracting (15) θ∗L from (13) θ∗M and multiplying through by the (positive)
denominator gives
2 + ϑ(1− ϑ− δ − δϑ(1− ϑ))− 4ϑλ(1 + ϑ− δϑ2) + 3δϑ2λ > 0. (54)
31

This condition is less restrictive than (17), so if equation (17) holds within the
domains of ϑ and δ, regardless of λ, then equation (54) will hold.
d(.)
dδ= −ϑ+ 2ϑ3 + 4ϑ3λ
+3ϑ2λ = −ϑ(1− ϑ(2ϑ+ 4ϑλ+ 3λ)) < 0 (55)
d(.)
dϑ= −1− δ − 4(ϑ+ λ+ 2ϑλ) + 6δϑ(ϑ+ λ+ 2ϑλ)
= −1− δ − 2(ϑ+ λ+ 2ϑλ)(2− 3δϑ) < 0 (56)
d(.)
dλ= −4ϑ− 4ϑ2 + 4ϑ3δ + 3ϑ2δ
= −4ϑ(1− ϑ2δ)− 4ϑ2(1− 34δ) < 0 (57)
When evaluated at maximal parameter values (ϑ = 0.15,λ = 1, δ = 1) , Lemma
1 takes the value 0.05275. Since (17) is monotonically decreasing in model
parameters, any parameter value smaller than its upper limit will result in a
larger positive value for condition (17). This proves Lemma 1.
We further investigate Lemma 1 with the following numeric analysis.
Let δ and λ take 10 values from 0.1 to 1, increasing by 0.1. Let ϑ take 10
values within the interval [0.015, 0.15], increasing by 0.015. This results in
1000 combinations of the three parameters. Equation (17) is calculated for
each combination as well as each θ∗. These simulations result in the following
minimum and maximum values, where all 1000 parameter combinations satisfy
Lemma 1:Lemma1(17) θ∗H θ∗M θ∗L
Max 0.97697 0.73836 0.51847 0.22947
Min 0.05275 0.52246 0.50018 0.01256
32
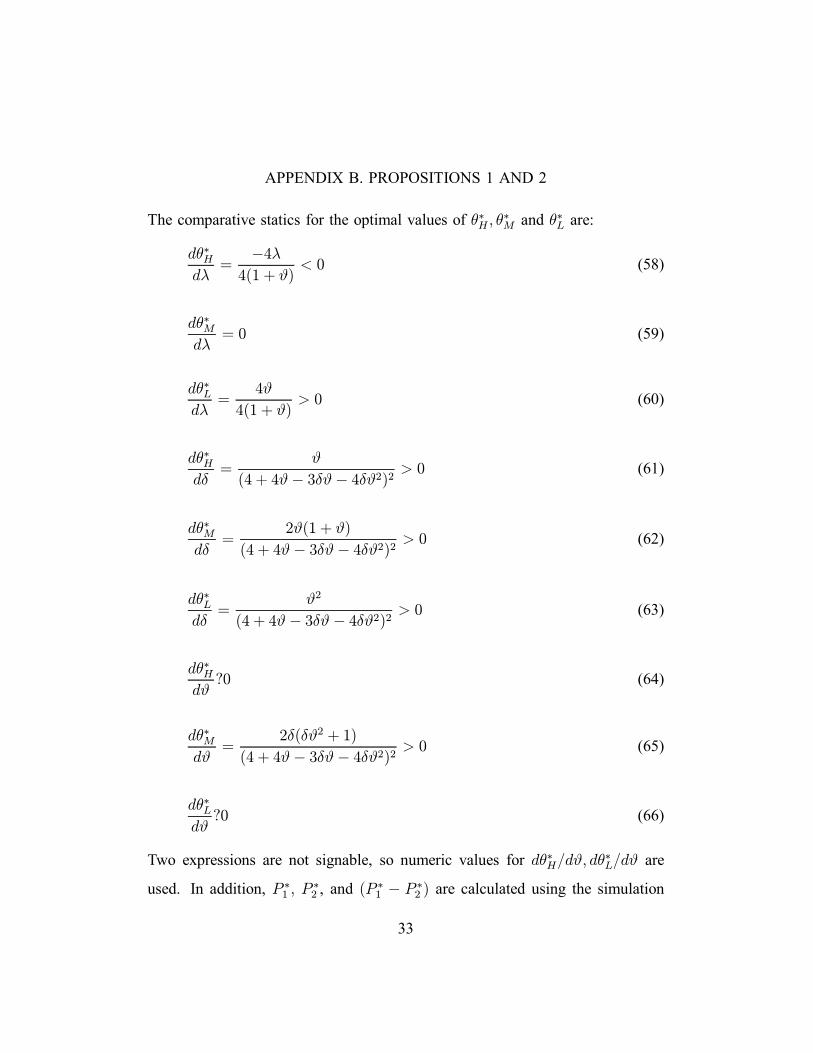
APPENDIX B. PROPOSITIONS 1 AND 2
The comparative statics for the optimal values of θ∗H , θ∗M and θ∗L are:
dθ∗Hdλ
=−4λ
4(1 + ϑ)< 0 (58)
dθ∗Mdλ
= 0 (59)
dθ∗Ldλ
=4ϑ
4(1 + ϑ)> 0 (60)
dθ∗Hdδ
=ϑ
(4 + 4ϑ− 3δϑ− 4δϑ2)2 > 0 (61)
dθ∗Mdδ
=2ϑ(1 + ϑ)
(4 + 4ϑ− 3δϑ− 4δϑ2)2 > 0 (62)
dθ∗Ldδ
=ϑ2
(4 + 4ϑ− 3δϑ− 4δϑ2)2 > 0 (63)
dθ∗Hdϑ?0 (64)
dθ∗Mdϑ
=2δ(δϑ2 + 1)
(4 + 4ϑ− 3δϑ− 4δϑ2)2 > 0 (65)
dθ∗Ldϑ?0 (66)
Two expressions are not signable, so numeric values for dθ∗H/dϑ, dθ∗L/dϑ are
used. In addition, P ∗1 , P ∗2 , and (P ∗1 − P ∗2 ) are calculated using the simulation
33

described in Lemma 1.
dθ∗H/dϑ dθ∗L/dϑ PCC∗1 PCC∗2 PCC∗1 − PCC∗2
Max −12.69587 36.20004 0.53778 0.22947 0.49284
Min −36.06749 13.72633 0.50052 0.01256 0.27359
CC: Current contracts
It is easy to see the signs of the comparative statics from the minimums and the
maximums. For each parameter combination, the difference between the first
and the second period prices for current contracts is always positive.
APPENDIX C. PROPOSITION 4
It can be shown that (P T∗ − PCC∗2 ) is decreasing in all three parameters:
d(PT∗−PCC∗2 )
dϑ= −12+16λ+6δ2ϑ2−24ϑ3δ−40δϑ2+13ϑ4δ2−16δϑ+32ϑλ+24ϑ
(4δϑ2+3δϑ−4ϑ−4)2(1+ϑ)2
−9λδ2ϑ2−56ϑ2λδ−32ϑ3λδ+24λδ2ϑ3+12ϑ2+16λδ2ϑ4−24λδϑ+18ϑ3δ2+16ϑ2λ(4δϑ2+3δϑ−4ϑ−4)2(1+ϑ)2 < 0 (67)
d(P T∗ − PCC∗2 )
dδ= − ϑ2
(4δϑ2 + 3δϑ− 4ϑ− 4)2 < 0 (68)
d(P T∗ − PCC∗2 )
dλ= − ϑ
1 + ϑ< 0. (69)
When evaluated at maximal simulation parameter values (ϑ = 0.15,λ = 1, δ =
1), (P T∗ − PCC∗2 ) takes the value 0.27053. This implies that for any other
parameter combination within their respective domains the difference between
two prices will be a larger positive number.
We cannot provide a similar demonstration for the difference (P T∗ −PCC∗1 ), since derivatives result in alternating signs. Hence, for this case, a
34

numerical simulation is constructed based on the simulation of Lemma 1 values
described in Appendix A.P T∗ − PCC∗1 P T∗ − PCC∗2
Max −0.00052 0.48744
Min −0.03778 0.27053
CC: Current contracts; T: TPS
Calculated values show that price in the TPS case is always less than first period
current contract price but greater than second period current contract price.
APPENDIX D. PROPOSITION 5
For the comparison of prices between LT contracts and TPS, it is obvious that
in the first period, for 0 ≤ δ ≤ 1, the long-term contract price is greater than thefirst period price with TPS, PLT∗1 > P T∗:
(2 + δ)2
2(4 + δ)>1
2. (70)
In the second period, P T∗ > PLT∗2 :
2 + δ
2(4 + δ)<1
2, (71)
which proves the first part of Proposition 5.
For the differences between LT contract prices and current contract prices,
the differences are not signable within parameter domains. Derivatives of the
differences are not monotonic in the model parameters. Hence, numerical simu-
lations are provided for this part of the proposition.PLT∗1 PLT∗2 PCC∗1 PCC∗2
Max 0.90000 0.30000 0.53778 0.22947
Min 0.53780 0.25610 0.50052 0.01256
CC: current contracts, LT: LT contracts
35

LT contract prices are higher than current contract prices in both periods.
APPENDIX E. PROPOSITION 6
From (38) and (41) for LT contracts and TPS technology, it is easy to show that,
for all δ > 0, PiT∗ > PiCC∗
1 + δ
4>(2 + δ)2
4(4 + δ)(72)
Remaining results are shown through numeric simulations as described above.ΠCC∗ ΠT∗ ΠLT∗
Max 0.42639 0.50000 0.45000
Min 0.25116 0.27500 0.26890
CC: current contract, T: TPS, LT: LT contractΠT∗ −ΠCC∗ ΠT∗ −ΠLT∗ ΠLT∗ −ΠCC∗
Max 0.23844 0.05000 0.18844
Min 0.00739 0.00610 0.00129
CC: current contract, T: TPS, LT: LT contract
In the numerical example, cost of monitoring is not included in expected profit
calculation for current contracts. Including the (negative) cost component will
make the current contract profit values smaller. However, even without this
component, current contract profit values are smaller than both LT contract and
TPS profit values. Hence, omission of the cost component does not affect our
results.
APPENDIX F. PROPOSITION 7
From (48) and (51) for LT contracts and TPS technology, it can be easily shown
that for all δ > 0, farmer welfare for long-term contracts is greater than under
36

TPS technology, W T∗ > WLT∗:
1 + δ
2− 3(2 + δ)2
8(4 + δ)>1 + δ
8(73)
Remaining results are demonstrated through numeric simulations as described
above.WCC∗ W T∗ WLT∗
Max 0.61022 0.25000 0.32500
Min 0.15379 0.13750 0.14665
CC: current contract, T: TPS, LT: LT contractWCC∗ −WLT∗ WCC∗ −W T∗ WLT∗ −W T∗
Max 0.28522 0.36022 0.07500
Min 0.00715 0.01629 0.00915
CC: current contract, T: TPS, LT: LT contract
Expected farmer welfare under either current or LT contracts is greater than ex-
pected welfare with TPS technology. Current contracts result in higher expected
farmer welfare compared with LT contracts.
APPENDIX G. PROPOSITION 8
From (38), (41), (48) and (51) for LT contracts and TPS, it can be shown that
for all δ > 0, total welfare under long-term contracts is greater than total welfare
under TPS technology, SWLT∗ > SW T∗:
1 + δ
2− 3(2 + δ)2
8(4 + δ)+(2 + δ)2
4(4 + δ)>3(1 + δ)
8(74)
Remaining results are demonstrated numerically as before:SWCC∗ SW T∗ SWLT∗
Max 0.87179 0.75000 0.77500
Min 0.42141 0.41250 0.41555
37

SWCC∗ − SWLT∗ SWCC∗ − SW T∗ SWLT∗ − SW T∗
Max 0.09679 0.12179 0.02500
Min 0.00586 0.00891 0.00305
CC: current contract, T: TPS, LT: LT contract
Expected total social welfare is the sum of expected firm profit and expected
farmer welfare less monitoring cost. Numbers stated in the table above do not
include monitoring cost. As long as cost of monitoring (k) is less than 0.009,
current contracts result in higher expected social welfare than TPS technology.
Expected social welfare with LT contracts is greater than with TPS technology. If
k is greater than 0.097, LT contracts also result in higher expected social welfare
than current contracts.
38