Embed Size (px)
Citation preview

NIST Technical Note 2132
PROperties of FIre Suppressant SYstems “PROFISSY”
A Spreadsheet Application for Fire-
Suppressant Bottle-Filling Calculations
Marcia L. Huber Eric W. Lemmon
This publication is available free of charge from: https://doi.org/10.6028/NIST.TN.2132
NIST Technical Note 2132
PROperties of FIre Suppressant SYstems “PROFISSY”
A Spreadsheet Application for Fire-Suppressant Bottle-Filling Calculations
Marcia L, Huber Eric W. Lemmon
Applied Chemicals and Materials Division Material Measurement Laboratory
This publication is available free of charge from: https://doi.org/10.6028/NIST.TN.2132
January 2021
U.S. Department of Commerce Wilbur L. Ross, Jr., Secretary
National Institute of Standards and Technology Walter Copan, NIST Director and Undersecretary of Commerce for Standards and Technology

Certain commercial entities, equipment, or materials may be identified in this
document in order to describe an experimental procedure or concept adequately. Such identification is not intended to imply recommendation or endorsement by the National Institute of Standards and Technology, nor is it intended to imply that the entities, materials, or equipment are necessarily the best available for the purpose.
National Institute of Standards and Technology Technical Note 2132 Natl. Inst. Stand. Technol. Tech. Note 2132, 89 pages (January 2021)
CODEN: NTNOEF
This publication is available free of charge from: https://doi.org/10.6028/NIST.TN.2132

i
This publication is available free of charge from: https://doi.org/10.6028/N
IST.TN.2132
Abstract This report summarizes the results of work performed for US Army GVSC by the National Institute of Standards and Technology (NIST), Applied Chemicals and Materials Division on the development of a computer program for fire-suppressant bottle-filling calculations under interagency agreement number 11478007. The work includes the development of an Excel spreadsheet that is to be used with the NIST23 (REFPROP) to provide two bottle-filling calculations (1) given vessel size, mass of agent, mass of pressurizing agent, and filling temperature compute the filling pressure, and the temperature and pressure conditions at which the fluid in the vessel becomes single phase, and (2) given the vessel size, mass of agent, and filling temperature and pressure, compute the mass of pressurizing fluid, and the temperature and pressure conditions at which the fluid in the vessel becomes single phase. The agents include CF3I, R-218, R-125, R-227ea, R-13B1, R-236fa, HFE-7100, Novec 649 (also known as Novec 1230 and FK-5-1-12), R-1233zd(E), R-1336mzz(Z), and R1336-mzz(E). Two pressurizing agents are available, nitrogen and carbon dioxide. There also is an option to include solid sodium bicarbonate powder in the calculations, and the ability to generate tables of conditions in the vessel as a function of temperature summarized with simple graphics. The software is available at https://doi.org/10.18434/mds2-2333
Key words
Filling pressure; fire suppressant; refrigerant; vapor liquid equilibrium.

ii
This publication is available free of charge from: https://doi.org/10.6028/N
IST.TN.2132
Table of Contents
Introduction ..................................................................................................................... 1
Development of Models ................................................................................................... 4
2.1. REFPROP: Pure Fluids ............................................................................................... 4
2.2. REFPROP: Mixtures ................................................................................................... 6
2.2.1. Binary Interaction Parameters for Helmholtz Mixture Models ............................. 7
Filling Calculations ........................................................................................................ 22
Validation ....................................................................................................................... 28
4.1. Filling by Mass Calculations ..................................................................................... 28
4.2. Filling by Pressure Calculations ................................................................................ 36
Conclusions .................................................................................................................... 43
Acknowledgements ........................................................................................................ 44
References .............................................................................................................................. 44 Appendix A. Comparisons with Experimental Data for Pure Fluids…...………………50 A.1. R13B1………..…………………………………………………………………50 A.2 HFE-7100……………………………………………………………………….63 A.3 R-1336mzz(E)…………………………………………………………………..73 Appendix B. Installation and Usage Notes..……………………………………………....81 B.1 Installation………………………………………………………………………81 B.2 Usage Notes……………………………………………………………………..81

iii
This publication is available free of charge from: https://doi.org/10.6028/N
IST.TN.2132
List of Tables
Table 1. List of potential fire-suppressant agents. .................................................................... 4 Table 2. Sources of binary mixture bubble-point data for nitrogen/agent mixtures. ................ 8 Table 3. Binary interaction parameters and selected constants for mixtures nitrogen/halogenated refrigerant. ............................................................................................ 20 Table 4. Binary Interaction parameters estimated with Eq. (10,11) for selected nitrogen/agent mixtures. Component 1 is nitrogen. ........................................................................................ 22 Table 5. Sources of Bottle-Filling Data for Nitrogen/Agent Mixtures. .................................. 29 Table 6. Comparisons of filling by mass calculations for nitrogen/R-13B1 mixtures. .......... 30 Table 7. Comparisons of filling by mass calculations for nitrogen/R-13I1 mixtures. ............ 31 Table 8. Comparisons of filling by mass calculations for nitrogen/R-227ea mixtures. ......... 32 Table 9. Comparisons of filling by mass calculations for nitrogen/R-218 mixtures. ............. 33 Table 10. Comparisons of filling by mass calculations for nitrogen/R-125 mixtures. ........... 34 Table 11. Comparisons of filling by mass calculations for nitrogen/R-236fa mixtures. ........ 35 Table 12. Comparisons of filling by pressure calculations for nitrogen/R-13B1 mixtures. ... 37 Table 13. Comparisons of filling by pressure calculations for nitrogen/R-13I1 mixtures. .... 38 Table 14. Comparisons of filling by pressure calculations for nitrogen/R-227ea mixtures. .. 39 Table 15. Comparisons of filling by pressure calculations for nitrogen/R-218 mixtures. ...... 40 Table 16. Comparisons of filling by pressure calculations for nitrogen/R-125 mixtures. ...... 41 Table 17. Comparisons of filling by pressure calculations for nitrogen/R-236fa mixtures. ... 42
List of Figures
Figure 1. Pressure-temperature conditions for different initial filling conditions. ................... 2 Figure 2. Percentage deviations of calculated and experimental bubble point data for mixtures of N2 and CF3I as a function of mole fraction of nitrogen. ........................................ 9 Figure 3. Percentage deviations of calculated and experimental bubble point data for mixtures of N2 and CF3I as a function of temperature. ........................................................... 10 Figure 4. Percentage deviations of calculated and experimental bubble point data for mixtures of N2 and R-227ea as a function of mole fraction of nitrogen. ................................ 11 Figure 5. Percentage deviations of calculated and experimental bubble point data for mixtures of N2 and R-227ea as a function of temperature. ..................................................... 12 Figure 6. Percentage deviations of calculated and experimental bubble point data for mixtures of N2 and R-13B1 as a function of mole fraction of nitrogen. ................................. 13 Figure 7. Percentage deviations of calculated and experimental bubble point data for mixtures of N2 and R-13B1 as a function of temperature. ...................................................... 14 Figure 8. Percentage deviations of calculated and experimental bubble point data for mixtures of N2 and Novec 649 as a function of mole fraction of nitrogen. ............................ 15 Figure 9. Percentage deviations of calculated and experimental bubble point data for mixtures of N2 and Novec 649 as a function of temperature. ................................................. 16 Figure 10. Predicted (Eq. (10)) vs. observed values of βT for nitrogen/halogenated refrigerant mixtures................................................................................................................................... 18 Figure 11. Predicted (Eq. (11)) vs. observed values of γT for nitrogen/halogenated refrigerant mixtures................................................................................................................................... 19 Figure 12. Comparisons of calculated bubble point pressure and the experimental data of Lim and Kim. [35] .......................................................................................................................... 21

iv
This publication is available free of charge from: https://doi.org/10.6028/N
IST.TN.2132
Figure 13. Filling by Mass Calculation in PROFISSY v0.42 ................................................. 23 Figure 14. Filling by Mass Calculation in PROFISSY v1.0. .................................................. 25 Figure 15. Filling by Pressure Calculation in PROFISSY v1.0. ............................................. 27

1
This publication is available free of charge from: https://doi.org/10.6028/N
IST.TN.2132
Introduction
In the 1990’s NIST was involved with projects involving alternative agents for fire suppressant systems[1, 2]. This work was driven by the adoption of the Montreal Protocol, which banned the production of one of the most common fire suppression agents at the time, known as R-13B1 (CF3Br, also known as Halon 1301). The majority of this research was performed in what was known as the Building and Fire Research Laboratory in Gaithersburg, Maryland. However, for thermophysical property needs, a collaboration with NIST personnel in the Chemical Science and Technology Laboratory in Boulder, Colorado was undertaken.
As part of the research, it was necessary to develop thermodynamic models to calculate the vapor-liquid equilibrium (VLE) and pressure-volume-temperature (PVT) relationships for mixtures of nitrogen and potential replacement agents, in addition to calculations for R-13B1 and nitrogen (for comparison purposes). Of particular interest were calculations concerned with the filling of bottles with a fire suppressant agent and nitrogen pressurization. At that time, the current practice for aircraft fire suppression bottles for in-flight protection was to fill a bottle at room temperature to about halfway with liquid R-13B1 and then pressurize the bottle to about 4.1 MPa [3]. The pressurization is necessary to expel the agent from the bottle forcefully and to facilitate dispersion. Without the nitrogen pressurization, there is only the vapor pressure of the agent in the bottle, which depending on the agent and on the temperature, may not be sufficient to adequately disperse the agent on the fire. It also is useful to know the conditions under which a bottle reaches a “liquid-fill” condition. In a closed vessel, as the temperature is increased the pressure also increases. Depending on the initial filling conditions, it may be possible to encounter conditions where the bottle becomes single phase, with a liquid-like density. If the temperature is further increased, one can enter a region where the pressure increases very rapidly. This is shown in Figure 1, which depicts two different filling conditions for R-227ea pressurized with nitrogen. Case A represents a situation where the container was initially filled at room temperature to about 3 % liquid volume of R-227EA, with an overall density corresponding to a vapor-like condition. As the temperature increases, the pressure increases but there is no sharp increase observed. Case B represents a situation where the container is initially about 50 % liquid full, corresponding to a liquid-like overall density. At about 360 K, the vessel becomes a single phase of liquid-like fluid. Further increases in temperature show a sharp increase in pressure, possibly resulting in unsafe conditions that could result in bottle rupture.

2
This publication is available free of charge from: https://doi.org/10.6028/N
IST.TN.2132
Figure 1. Pressure-temperature conditions for different initial filling conditions.
NIST developed models based on extended corresponding states [4-7] primarily for the calculation of properties of hydrocarbon mixtures, and implemented them in a computer program distributed by NIST that is known as Supertrapp (Super TRAnsport Properties Prediction). [8] This model was adapted for calculations involving refrigerants, using the refrigerant R134a as a reference fluid instead of propane [9, 10]. The property calculations in the Supertrapp model are found with an extended corresponding states model, but the vapor-liquid equilibrium is actually determined from a Peng Robinson [11] mixture model, effectively making it a hybrid of the two models. A specific computer program for providing bottle-filling calculations was developed using the modified Supertrapp model and was called PROFISSY (PROperties of FIre Suppressant SYstems). It was distributed on an informal basis beginning in the early 1990’s and over the years has had additional agents added to it. The most recent version from July 2018 is v0.42, and it contains the potential suppressant agents listed in Table 1, with the exception of R-1336mzz(E). It was never fully documented, and is only briefly described in a conference paper [12].
There is still interest in the calculations provided in PROFISSY, and in adding additional new fluids, such as R-1336mzz(E). The current PROFISSY program has a very crude MS-DOS (Microsoft Disk Operating System) based interface and is increasingly difficult to modify due to the old software used in its development. Addition of a new fluid requires modification of the source code, and the generation (using another old undocumented program at NIST that requires

3
This publication is available free of charge from: https://doi.org/10.6028/N
IST.TN.2132
the use of a 32-bit DOS emulator), of a new property database file (PROFLIB) that is read by the PROFISSY program. This is not sustainable for the future. NIST now has a thermophysical properties database known as REFPROP [13] with state-of-the art models for equations of state for pure fluid properties [14, 15] and Helmholtz-based models for mixtures including the standards for the properties of natural gas mixtures [16]. A historical summary of the evolution of fluids used for refrigeration and the REFPROP program can be found in the review article by McLinden and Huber [17]. The REFPROP program has been widely adopted as a standard in the refrigerants community and is available to the general public as Standard Reference Database 23 and can be obtained from a NIST website [18].
The REFPROP program can be linked with 3rd party applications such as Excel through the use of wrappers. In this work we will replace the PROFISSY program with an Excel spreadsheet that will contain the functionality and fluids in PROFISSY v0.42 but will link with the REFPROP program to obtain thermophysical properties such as VLE and PVT. It is necessary to purchase the REFPROP program (v10, DLL 10.0.0.86 or above) from NIST separately [18] and install it before using the free PROFISSY spreadsheet application described in this document. It also is necessary to replace the HMX.BNC file supplied with REFPROP v10 with the revised file developed in this work, and to include the 3 new fluid files for R-13B1, HFE-7100, and R-1336mzz(E) since these also are not present in the standard REFPROP v10 release. At the time of writing of this document, distribution of the fluid file for R-1336mzz(E) is restricted to the sponsor of this work but will eventually be made available to the general public. Users should contact NIST for updates on the availability of all files that are not in the standard release of REFPROP v10.0. required for proper operation of this spreadsheet.

4
This publication is available free of charge from: https://doi.org/10.6028/N
IST.TN.2132
Table 1. List of potential fire-suppressant agents.
Short name Chemical name
CF3I trifluoroiodomethane R-218 octafluoropropane R-125 pentafluoroethane R-227ea 1,1,1,2,3,3,3-heptafluoropropane R-13B1 trifluorobromomethane R-236fa 1,1,1,3,3,3-hexafluoropropane HFE-7100 methoxy-nonafluorobutane Novec 649a 1,1,1,2,2,4,5,5,5-nonafluoro-4--3-pentanone R-1233zd(E) trans-1-chloro-3,3,3-trifluoroprop-1-ene R-1336mzz(Z) cis-1,1,1,4,4,4-hexafluoro-2-butene R-1336mzz(E) trans-1,1,1,4,4,4-hexafluoro-2-butene
aNovec 649 is also known as Novec 1230 and also FK-5-1-12.
Development of Models
REFPROP provides thermophysical properties for common industrial fluids including cryogens, refrigerants, natural gas fluids, alcohols, and water using equation of state (EOS) models. A complete description of the models in REFPROP is outside of the scope of this document. Here we provide only a very brief description of some EOS models.
2.1. REFPROP: Pure Fluids
An equation of state is an expression that can be used to give the thermodynamic properties of a fluid. The simplest one is the ideal gas equation, P = RT/V, where P is pressure, T is temperature, V is volume, and R is the gas constant. This equation is quite limited and is applicable only to the gas phase. “Cubic” equations of state were developed (they can be expressed as a function that is cubic in volume) in order to represent both gas and liquid phases. The earliest one was by van der Waals [19]:
2/ ( ) /P RT V b a V= − − (1)
where a and b are constant parameters. The ideal gas law has assumptions (1) there are no intermolecular forces and (2) molecules have negligible volume. The a and b parameters are

5
This publication is available free of charge from: https://doi.org/10.6028/N
IST.TN.2132
corrections to address these assumptions- b is an excluded volume, and a is a parameter to account for attractive forces between molecules. While an improvement over the ideal gas law and qualitatively correct, the van der Waals EOS lacks the ability to predict liquid density with reasonable accuracy and many researchers over the years have modified the simple cubic form to address this deficiency. In 1976, the Peng Robinson [11] EOS was introduced and has been widely used by engineers, including to the present day. A review of many of the further developments of EOS based on the Peng Robinson EOS (PR EOS) can be found in Lopez et al.[20] The PR EOS is cubic in volume and has the form
/ ( ) ( ) / [ ( ) ( )]P RT V b a T V V b b V b= − − + + − (2)
where the parameter a is no longer a constant, it is a function of temperature. This EOS is available as an option in REFPROP. One of the modifications of the original PR EOS, which is discussed in the review by Lopes et al. [20], is to include a modification known as a volume translation [21] that is designed to improve the calculations of liquid density. REFPROP also has the ability to perform calculations with a volume-translated EOS. The translation term is a constant as recommended by Pfhol [22]. It may be found by fitting experimental data; however, in REFPROP in general it is determined by using the constant portion of the translation given by Magoulas and Tassios [23].
Cubic EOS, that are expressed as P = f(T, ρ), have proven to be extremely useful. However, if one wants to represent all of the thermodynamic properties of a pure fluid to within the uncertainty of the best experimental data, then an alternative approach is used that is based upon what is called a “fundamental” or Helmholtz-energy based equation of state. Almost all high accuracy, “reference” type equations of state are of the Helmholtz form. These equations are obtained by simultaneously fitting multiple forms of data including the speed of sound, heat capacity, second virial coefficients, heat of vaporization, vapor pressure, saturated liquid and vapor densities, and densities across P,T space. They produce equations that are of very high accuracy and capable of representing the experimental data to within their estimated uncertainty. A few examples of this form of equation of state are described by Lemmon and coworkers. [14, 15, 24-27]. Helmholtz energy EOS express the reduced molar Helmholtz free energy α in terms of a reduced temperature and reduced density and often take the form [27]:
id r( , ) ( ) ( , ),ART
α δ τ α τ α δ τ= = + (3)
( )( , ) exp exp( )exp( )k k k k k k k k kd t d t l d t l mrk k kT N N Nα δ δ τ δ τ δ δ τ δ τ= + − + − −∑ ∑ ∑ (4)

6
This publication is available free of charge from: https://doi.org/10.6028/N
IST.TN.2132
where the αid is the ideal gas (zero-density) contribution, and αr is the residual, or real fluid contribution. The temperature and density are expressed in reduced variables τ = T*/T and δ= ρ/ρ* where T* and ρ* are reducing parameters that often are the critical parameters. The Nk are coefficients obtained by fitting experimental data, and the exponents dk, tk, lk, and mk are also determined by regression. Each summation typically contains 4 to 20 terms, and the index k points to each individual term. When an equation of state is expressed in the form P = f(T, ρ), and one has an expression for Cp0(T), all thermodynamic properties can be computed, but integration is required to obtain caloric properties. An advantage of the Helmholtz form is that all thermodynamic properties can be expressed in terms of derivatives (this allows for more flexibility in the selection of terms), for example
( )/ ( R ) 1 / .rP Tτ
ρ δ α δ= + ∂ ∂ (5)
These equations can be quite complex but allow extremely accurate representation of the thermodynamic surface of a pure fluid. For more information please consult references [27, 28].
2.2. REFPROP: Mixtures
REFPROP has the ability to do calculations with several mixture models. One may select the Peng-Robinson mixture model, but it is restricted to use of the Peng-Robinson EOS for all pure fluids in the mixture. The extension of PR to mixtures is discussed in the original publication [11] and involves the use of mixing rules for the a and b parameters, and a combining rule for the cross term aij,
mix mix1 1 1
andn n n
i j ij i ii j i
a x x a b x b= = =
= =∑∑ ∑ (6)
(1 ) ,ij ij i ja a aς= − (7)
Where ϛij is an empirically determined binary interaction parameter for the binary formed by component i and component j. When experimental data are unavailable, these may be obtained from predictive models. REFPROP includes a predictive scheme [29] for mixtures of alkanes, alkenes, aromatics, napthenes, CO2, N2, H2S and acetylene as well as one for mixtures with hydrogen [30], but does not currently have a built-in predictive scheme for mixures of halocarbons with N2 or CO2. It was observed in the early development of the original PROFISSY that adequate representation of the VLE of such mixtures for bottle-filling purposes was possible with the PR EOS without the use of binary interaction parameters.
The default model for mixtures in REFPROP is a model called a Helmholtz mixing model. One may use any EOS for the pure fluid constituents of the mixture. Lemmon[31] and Tillner-Roth

7
This publication is available free of charge from: https://doi.org/10.6028/N
IST.TN.2132
[32] independently developed mixture models based on finding the Helmholtz energy of the mixture,
1id r excess
1 1 1( ) ln
n n n
mix j j j j j p q pq pqj p q p
x x x x x Fα α α α−
= = = +
= + + + ∑ ∑ ∑ (8)
where the first summation is the contribution from the EOS of each of the constituent pure fluids, the xlnx term accounts for the entropy of mixing, and the second summation represents the departure from ideal mixing. The Fpq are generalizing parameters that relate the behavior of one binary pair with that of another, it multiplies the excess
pqα terms which are empirical functions that
are fit to binary mixture data. The αj and excesspqα terms are not evaluated at the the temperature and
density of the mixture, Tmix and ρmix, but rather at a scaled or reduced temperature and density τ=Tred/Tmix and δ= ρmix/ρred. Mixing rules are used to determine the reducing values Tred and ρred. There are various sets of mixing rules that may be used; references [28, 33] present mixing rules for Helmholtz models. A set of mixing rules that is often used for refrigerant mixtures is [26]
11 1
red red c,1 1 1 1 1 1
andi
n n n n n ni
i j ij i i i j iji i j i i i j ic
x x x T x T x xρ ξ ζρ
−− −
= = = + = = = +
= + = + ∑ ∑ ∑ ∑ ∑∑ (9)
The parameters ζij and ξij are used to define the shapes of the reducing temperature and density curves. These reducing parameters are not the same as the critical parameters of the mixture and may be found by fitting experimental data or from a predictive model. There is a built-in predictive model for refrigerant mixtures [34] in REFPROP. This predictive model was developed with a database of 76 binary pairs comprised of chlorinated and fluorinated refrigerants along with propane, propylene, and CO2 with critical temperatures ranging from 228 K to 487 K, critical pressures from 3.04 MPa to 7.4 MPa, and acentric factors ω ranging from 0 (for CO2) to 0.33. The range of dipole moments μ covered 0 Debye to 2.3 Debye. Nitrogen, (Tc=126.19 K, pc= 3.3958 MPa, ω=0.0372 and μ=0 Debye) due to its low critical temperature, is outside of the range of conditions that this method was developed for, and when one uses REFPROP v10.0 and enters a mixture of any of the agents in this project above with nitrogen, one gets the message “Mixture data have not been fitted for one or more binary pairs in the specified mixture; the mixture is outside the range of the model and calculations will not be made.” We also performed some tests using the predictive scheme given in Ref. [34] for mixtures of nitrogen with halogenated refrigerants, and verified that it is indeed not applicable. Failing to incorporate binary interaction parameters is not an option for mixtures of refrigerants with nitrogen with the Helholtz mixing model. Development of a new procedure, applicable to halogenated refrigerants mixed with nitrogen, is necessary.
2.2.1. Binary Interaction Parameters for Helmholtz Mixture Models
The first step in developing a predictive model for binary interaction parameters for mixtures of agent plus nitrogen is to survey the literature for available data. We again note here that the predictive scheme [34] presently in REFPROP is valid for mixtures of the agents with CO2, so we only focus on mixtures with nitogen here. We performed a literature search to locate vapor-liquid-equilibrium or properties data for mixtures of the agents in Table 1 with nitrogen. We searched the

8
This publication is available free of charge from: https://doi.org/10.6028/N
IST.TN.2132
Web of Science online database, the NIST TDE database, and Google Scholar. The results are given in Table 2. Unfortunately, very few data were found.
Table 2. Sources of binary mixture bubble-point data for nitrogen/agent mixtures.
Mixture Chemical name Reference Nitrogen/CF3I trifluoroiodomethane [35, 36] Nitrogen/R-227ea 1,1,1,2,3,3,3-heptafluoropropane [35] Nitrogen/R-13B1 trifluorobromomethane [35] Nitrogen/Novec 649 1,1,1,2,2,4,5,5,5-nonafluoro-4-
(trifluoromethyl)-3-pentanone [37]
In previous work [38], experimental bubble point data for mixtures of N2/CF3I and N2/R-227ea were fit to obtain binary interaction parameters, given in Table 3. In addition, in this project we fit experimental bubble point data [35, 37] to obtain parameters for N2/R-13B1 and N2/Novec 649; these are also in Table 3. Figures 2-9 show comparisons with available bubble point pressure data for these four mixtures computed with the interaction parameters in Table 3 as a function of composition and temperature with the Helmholtz mixture model available as the default model in REFPROP. In Figures 2-7 the agreement is good; however, we note that the range of composition covered is limited and all data for these three mixtures are from the same source, Ref. [35]. The comparisons for Novec 649 in Figures 8 and 9 cover a much wider range of compositions and reach temperatures near the critical region. The agreement with experimental data is not as good as for the other 3 mixtures. The reason for this is not known.

9
This publication is available free of charge from: https://doi.org/10.6028/N
IST.TN.2132
Figure 2. Percentage deviations of calculated and experimental bubble point data for mixtures of N2 and CF3I as a function of mole fraction of nitrogen.

10
This publication is available free of charge from: https://doi.org/10.6028/N
IST.TN.2132
Figure 3. Percentage deviations of calculated and experimental bubble point data for mixtures of N2 and CF3I as a function of temperature.

11
This publication is available free of charge from: https://doi.org/10.6028/N
IST.TN.2132
Figure 4. Percentage deviations of calculated and experimental bubble point data for mixtures of N2 and R-227ea as a function of mole fraction of nitrogen.

12
This publication is available free of charge from: https://doi.org/10.6028/N
IST.TN.2132
Figure 5. Percentage deviations of calculated and experimental bubble point data for mixtures of N2 and R-227ea as a function of temperature.

13
This publication is available free of charge from: https://doi.org/10.6028/N
IST.TN.2132
Figure 6. Percentage deviations of calculated and experimental bubble point data for mixtures of N2 and R-13B1 as a function of mole fraction of nitrogen.

14
This publication is available free of charge from: https://doi.org/10.6028/N
IST.TN.2132
Figure 7. Percentage deviations of calculated and experimental bubble point data for mixtures of N2 and R-13B1 as a function of temperature.

15
This publication is available free of charge from: https://doi.org/10.6028/N
IST.TN.2132
Figure 8. Percentage deviations of calculated and experimental bubble point data for mixtures of N2 and Novec 649 as a function of mole fraction of nitrogen.

16
This publication is available free of charge from: https://doi.org/10.6028/N
IST.TN.2132
Figure 9. Percentage deviations of calculated and experimental bubble point data for mixtures of N2 and Novec 649 as a function of temperature.
The Helmholtz EOS are considerably more complex than simple cubic equations of state such as the Peng-Robinson EOS, [11] and involve a more complicated model for mixtures. The approach is to apply mixing rules to the Helmholtz energy of the mixture, such as originally described by Lemmon [31, 39] and Tillner-Roth [32]. More recent implementations of Helmholtz energy-based mixture models can be found in references. [16, 33, 40] Bell and Lemmon [38] describe a method for fitting binary interaction parameters for multi-fluid Helmholtz-energy explicit mixture models. We examine that same model here.
We restrict the focus of the predictive procedure to mixtures of the family of halogenated refrigerants with nitrogen. Many of these mixtures were investigated previously [38] and described in terms of two binary interaction parameters denoted as βT,ij and γT,ij in Ref. [38]. In the mixture model, the parameter γT,ij is symmetric; ie γT,ij = γT,ji , however, the β parameter is not symmetric, with βT,ij = 1/ βT,ji. In this work the first component is always nitrogen and the second is the agent. Additionally, one additional set of bubble point data was found, [41] and interaction parameters fit for N2/R-1234yf. For simplicity, in the remainder of this document we will use the notation βT
and γT where the first component is nitrogen and βT= βT,12 and γT = γT,12. Binary interaction parameters obtained from fitting experimental bubble-point pressure data for all nitrogen/halogenated refrigerant pairs are shown in Table 3.

17
This publication is available free of charge from: https://doi.org/10.6028/N
IST.TN.2132
We investigated the dependence of βT and γT as a function of various fluid-specific constants to investigate if there are any obvious trends that could be used to develop a predictive scheme. These are listed in Table 3, and are the critical temperature (Tc), critical pressure (pc), acentric factor (w), molecular weight (MW), normal boiling point (NBP), gas phase dipole moment (Dip), molar density of the saturated liquid at the NBP (ρL,NBP), the number of carbons(NC), number of fluorines (NF), and the number of halogens (NHalo) in the molecule. The fluid-specific constants were obtained from REFPROP. We also initially investigated using the refractive index, parachor, dielectric constant, and radius of gyration since these values may be easily obtained from the DIPPR Database [42]. Unfortunately, some of the fluids of interest are not contained in DIPPR [42] so we did not consider these properties further since in order to be useful in a predictive scheme, they must be readily available for new fluids of interest. However, we note here that the refractive index looked promising for representation of βT and perhaps should be explored in future work. Linear plots of βT and γT as a function of these constants were made. βT did not show a strong dependence on any of the single parameters investigated, while γT demonstrated a fairly good correlation with NBP and to a lesser extent, ρL, NBP, w, Tc, and MW. To further explore any relationships between these constants and the binary interaction parameters, we used symbolic regression software [43] to identify relationships among the binary interaction parameters and the fluid-specific constants listed above. We used all fluids in Table 3 except R-13B1 in the training set to develop a model. R-13B1 was omitted so that it could be used as a test case later. Also, the equation of state for R-13B1 was not yet finalized during the early part of this project. Symbolic regression gives a slate of increasingly more complex models to represent the data, and one must select a model that is a compromise between complexity and adequate fitting to ensure that one is not overfitting. Once again it was difficult to find adequate correlations for βT. The most promising expression is:
F1.22 0.0155 0.0491T cN pβ = − − (10)
where pc is the critical pressure in MPa and NF is the number of fluorine atoms in the molecule. Although this was the best simple model we could identify, the fit was still not very good with a correlation coefficient of 0.91 and an R2 goodness of fit parameter of 0.81. Figure 10 shows a plot of the predicted value of βT obtained from Eq. (10) vs the actual fitted values (observed) given in Table 3, with the dotted line indicating a 1:1 relationship. The values cover a very narrow range from about 0.94 to 1.

18
This publication is available free of charge from: https://doi.org/10.6028/N
IST.TN.2132
Figure 10. Predicted (Eq. (10)) vs. observed values of βT for nitrogen/halogenated refrigerant mixtures.
For γT we found: 20.987 0.00000593T NBPγ = + (11)
where NBP is the normal boiling point in K. This fit had a correlation coefficient of 0.979 and an R2 goodness of fit parameter of 0.957. Figure 11 shows a plot of the predicted value of γT obtained from Eq. (11) vs the observed values given in Table 3. The values again cover a narrow range, somewhat larger than what was found for βT, ranging from about 1.1 to 1.6. The values of γT were slightly less than 1, while the values of βT were slightly larger than 1. Using Eq. (10) and (11) we calculated binary interaction parameters for the fluids in this project that lack experimental bubble point data; these are given in Table 4.

19
This publication is available free of charge from: https://doi.org/10.6028/N
IST.TN.2132
Figure 11. Predicted (Eq. (11)) vs. observed values of γT for nitrogen/halogenated refrigerant mixtures.
As one method of testing the predictive model, Eq.(10) and Eq.(11) were applied to R-13B1 to obtain βT = 0.98692 and γT = 1.26198 and the resulting bubble point pressures calculated and compared with the experimental data of Lim and Kim [35]. These calculations are predictive for R-13B1 since it was not used in the development of Eq. (10) and (11). The results are shown in Figure 12. For comparison, we show comparisons with calculations made with the parameter set βT = 0.96096 and γT = 1.25381 (obtained by fitting the experimental data directly) and results from the old PROFISSY program. The predictive scheme Eq. (10-11) and the PROFISSY model are comparable and show a tendency to predict bubble point pressures that are lower than the experimental values but are within 10 %. The results of using fitted binary interaction parameters are better, to within about 4 % and show little bias.

20
This publication is available free of charge from: https://doi.org/10.6028/N
IST.TN.2132
Table 3. Binary interaction parameters and selected constants for mixtures nitrogen/halogenated refrigerant.
Fluid Formula βT γT Tc
(K) pc
(MPa) w MW NBP
(K) Dip (D)
ρL,NBP
(mol/l) NF NHalo NC
R-12a CCl2F2 0.98851 1.32449 385.12 4.1361 0.179 120.91 243.4 0.51 12.298 2 4 1 R-13a CClF3 0.97523 1.24069 302 3.879 0.172 104.46 191.67 0.51 14.565 3 4 1 R-13I1a CF3I 0.99877 1.30226 396.44 3.953 0.176 195.91 251.29 0.92 11.479 3 4 1 R-13B1b CF3Br 0.96096 1.25381 341.69 3.8 0.174 148.91 215.34 0.65 13.364 3 4 1 R-14a CF4 0.97005 1.10991 227.51 3.75 0.179 88.005 145.1 0 18.217 4 4 1 R-22a CHClF2 0.94217 1.30233 369.3 4.99 0.221 86.468 232.34 1.458 16.297 2 3 1 R-227eaa C3F7H 0.97134 1.40945 374.9 2.925 0.357 170.03 256.81 1.456 9.0828 7 7 3 Novec 649b C6F12O 0.94032 1.6186 441.81 1.869 0.471 316.04 322.202 0.43 4.8315 12 12 6 R-1234yfb C3F4H2 0.9841 1.3361 367.85 3.3822 0.276 114.04 243.665 2.48 11.076 4 4 3
aBinary interaction parameters obtained from Ref. [38]. bBinary interaction parameters obtained in this work.

21
This publication is available free of charge from: https://doi.org/10.6028/N
IST.TN.2132
Figure 12. Comparisons of calculated bubble point pressure and the experimental data of Lim and Kim [35].

22
This publication is available free of charge from: https://doi.org/10.6028/N
IST.TN.2132
Table 4. Binary Interaction parameters estimated with Eq. (10,11) for selected nitrogen/agent mixtures. Component 1 is nitrogen.
Fluid Formula NBP
(K) NF pc
(MPa) βT γT
R-218 C3F8 236.36 8 2.64 0.96638 1.31829 R-125 C2F5H 225.06 5 3.6177 0.96487 1.28737 R-236fa C3F6H2 271.66 6 3.2 0.96988 1.42463 HFE-7100 C5F9H3O 332.96 9 2.228 0.97111 1.64441 R-1233zd(E) C3F3ClH2 291.28 3 3.5826 0.99759 1.49013 R-1336mzz(Z) C4F6H2 306.6 6 2.903 0.98446 1.54444 R-1336mzz(E) C4F6H2 281.02 6 2.779 0.99055 1.45531
Filling Calculations
The original computer program PROFISSY was developed to help fire suppression bottle designers or users obtain pressure-temperature characteristics of the contents of a bottle. It contained two calculations. The first calculation (1) is given the agent mass, vessel volume, fill temperature, and mass of nitrogen, calculate the fill pressure, and then generate a table as a function of temperature that gives the volume percent liquid fill, agent mass in the liquid phase, mass and mole fraction of nitrogen in the liquid phase, total mass of nitrogen in the liquid and the vapor, and the pressure. If the mixture was single phase, that was indicated as well. The second calculation (2) was the same as the first, except the input was agent mass, vessel volume, fill temperature, and the system pressure; the output was the mass of nitrogen in the container, the generation of a table as a function of temperature that gave the volume percent liquid fill, agent mass in the liquid phase, mass and mole fraction of nitrogen in the liquid phase, total mass of nitrogen in the liquid and the vapor, and the pressure. In addition, for both cases, the temperature at which the mixture becomes single phase (sometimes called the liquid-fill temperature, called the bubble point in old PROFISSY) and pressure was computed and displayed. A screen capture from a sample calculation of type (1) is shown in Figure 13. We note here that there are some subtleties around the use of the phrase bubble point temperature. Since the bottle provides a closed system, there is a fixed overall composition. In an example where the bottle initially is filled such that there is a two-phase mixture in the bottle, there will be an initial composition of the liquid phase, at the fill temperature. As the temperature in the bottle is increased, one can reach a point where the mixture becomes single-phase. Depending on the initial conditions, this may be a transition to a liquid state. The bubble-point temperature is defined as the temperature where the first bubble of vapor is formed upon heating mixture of known liquid composition and pressure. When one calculates the temperature and pressure where this closed system becomes liquid phase, it may be a bubble point temperature, but the composition of the liquid is not the same as the composition of the liquid at filling temperature. So, to avoid confusion, it will be called a single-phase temperature and pressure for the closed bottle system.

23
This publication is available free of charge from: https://doi.org/10.6028/N
IST.TN.2132
Figure 13. Filling by Mass Calculation in PROFISSY v0.42

24
This publication is available free of charge from: https://doi.org/10.6028/N
IST.TN.2132
The current project duplicates the functionality of the original PROFISSY and provides the same two calculations. Calculations (1) and (2) are basically temperature-density (TD) “flash” calculations that can be very easily done in REFPROP. REFPROP requires that the initial composition be input in order to perform a flash calculation. The PROFISSY Excel spreadsheet is set up so that at first, the user selects their preferred units, and the fire-suppressant agent. In addition, three new options are added that were not present in the old PROFISSY program. One can now select carbon dioxide or nitrogen as the pressurizing fluid, one can select the mixture model to be used, and one may also include the addition of solid sodium bicarbonate powder (NaHCO3) to the vessel. The dry powder is considered to only take up volume in the cylinder and is not considered to change the thermophysical properties of the agent and pressurizing fluids mixtures. It has a density, ρpow = 2.159 g/cm3 [44]. For calculation (1), the mass of agent mag, the mass of pressurizing fluid mpf, the bottle (container) volume Vb, , optional powder mass mpow, and the filling temperature T are input in the user-preferred units. The units are then converted into the internal units used in the REFPROP program. The initial composition of the system is computed by simple mass balance, and the overall system density ρsyst = total moles (excluding any powder)/Vtotal is computed, where Vtotal = Vb -Vpow, and the powder volume is computed using the powder density, Vpow= mpow/ρpow. REFPROP is then called to perform a temperature-density (TD) flash calculation where the temperature T, overall system density ρsyst and overall composition are input, and the output is the filling pressure pfill as well as the mass fraction of the agent (neglecting any powder) and the overall system density. The Excel spreadsheet uses visual basic code (embedded in the spreadsheet) to access REFPROP and perform calculations. In the spreadsheet, this calculation is provided on the tab labelled “Filling_by_Mass_Calculation”, and a screenshot is given in Fig. 14. In the spreadsheet, user input fields are denoted in blue font, output is in black. The user may select a range of temperatures to generate a table, and the resulting pressure verses temperature curve is displayed in a simple plot. The table output includes T and p, the percent of liquid volume fill, the total mass of agent and pressurizing fluid in the liquid phase, the mass and mole fraction of pressurizing fluid in the liquid phase, and the total mass of pressurizing fluid in the vapor phase. The temperature at which the bottle contents become single phase is indicated in black text and is found from calls to REFPROP with the density and the quality = 0 as input (a DQ flash) where the overall system density and composition are input. A quality of 0 indicates a saturated liquid state, a quality of 1 indicates saturated vapor, and values between 0 and 1 indicate a two-phase mix. A similar call is then made to obtain the pressure at which the contents of the bottle become single phase. The transition may be seen by examination of the plot; sometimes it is very abrupt and indicated by a sharp kink in the curve (see case 2 in Fig. 1). One additional output field is called the stored energy (SE) that is computed at the filling temperature. It is defined as [45]
, ( )SE fill g b liq pow
agent pow press
p V V Vm m m
− −=
+ +, (12)
Where the units of SE are (bar·liter/kg), where pfill,g is the gauge pressure at sea level in bar (pfill,g
= pfill-1), the volumes are in liters, and the masses for the agent, powder, and pressurant (magent, mpow, mpress) are in kg. The units of SE may not be changed. The volume of the liquid in the bottle Vliq is computed at the filling conditions Tfill and pfill.

25
This publication is available free of charge from: https://doi.org/10.6028/N
IST.TN.2132
Figure 14. Filling by Mass Calculation in PROFISSY v1.0.

26
This publication is available free of charge from: https://doi.org/10.6028/N
IST.TN.2132
Calculation (2) is only slightly more complicated than calculation (1). In calculation (2), the mass of agent mag, the bottle (container) volume Vb,, the filling temperature T , optional powder mass mpow, and the filling pressure p are input in the user-preferred units. Again, the units are converted by REFPROP to the internal unit system in REFPROP (K, kPa, mol, liter). The initial composition of the system cannot be directly computed by simple mass balance since the mass of the pressurizing fluid is not known, only the total system pressure is known. In this case an iterative process is needed to determine the initial composition. An initial guess is made for the mass of pressurizing fluid in the system; it is initially set to 5 % of the mass of the agent in the system. This number was selected since it is consistent with experimental measurements [3]. The system composition is computed with this guess, a TD flash is made to compute the system pressure, and the mass of pressurizing fluid is adjusted with a simple Newton’s iteration method until the calculated filling pressure matches the known filling pressure. Once the composition of the system is known, the calculations proceed the same as in case (1). Calculation (2) is provided on the spreadsheet on the tab “Filling_by_Pressure_Calculation” and a sample screen shot is given in Fig. 15.

27
This publication is available free of charge from: https://doi.org/10.6028/N
IST.TN.2132
Figure 15. Filling by Pressure Calculation in PROFISSY v1.0.

28
This publication is available free of charge from: https://doi.org/10.6028/N
IST.TN.2132
Validation
Model validation can be done by comparing with experimental data from bottle-filling experiments. In this type of experiment a container is filled, generally to a level approximately one-half to 2/3 liquid full, and data are presented as a pressure at a given temperature. In order to be useful for this project, the size of the vessel, the mass of the agent, the filling temperature, and either the mass of nitrogen in the container or the total pressure of the vessel at filling must be specified. Then one can compute the overall composition in the bottle and compute the conditions in the bottle at additional temperatures. Table 5 summarizes sources of bottle-filling data that can be used for validating the model. All of the data located is for pressurizing with nitrogen; we could not locate any data for carbon dioxide. Additional data for nitrogen filling was found in Ref. [46] but the data were not presented with enough detail to enable calculations. Yang et al. [3] performed experimental measurements of mixtures of nitrogen with R-227ea, R-13I1, R-13B1, R-218 and R-125 at 1/2 and 2/3 liquid fill at 23 °C, -60 °C, and 150 °C. For the 150 °C runs, the initial mass of nitrogen was not reported in the manuscript, but we recovered the value by iterating on the filling pressure prediction results with the old PROFISSY v0.42 model. Some of these experiments were also reported earlier in Ref. [12]. Yang and Breuel [47] give bottle pressures at three temperatures for mixtures of nitrogen and 13 agents; however since the mass of nitrogen is not provided for most cases, the calculations cannot be repeated here. They do, however, give the amount of nitrogen and agent required to obtain a given pressure at 23 °C and we compare with their data, a single point for each mixture. There also is a single point given in Yang et al. [48] for mixtures of nitrogen with R-227ea, R-125, and R-218.
4.1. Filling by Mass Calculations
Tables 6-11 summarize comparisons of the filling data with predictions from legacy PROFISSY v0.42 and with three models in REFPROP implemented in the present spreadsheet for the filling by mass calculation. For these calculations, the input parameters are the mass of agent and nitrogen, the vessel size, and the filling temperature. The output variable is the filling pressure. The percent deviation in the tables is defined as 100*(pexp-pcal)/pcal. There is not a lot of discussion about the accuracy of the measurements, but in Ref. [12] it is stated that the combined standard uncertainty was less than 0.1 MPa. This would be approximately 1% to 20% at a k = 2 level of uncertainty, depending on the pressure measured. Binary interaction parameters for R-13B1, R-13I1, and R-227EA for the Helmholtz mixture model were obtained by fitting experimental bubble point data and are listed in Table 3. Since there were no bubble point data for mixtures of nitrogen with R-125, R-218, or R-236fa, the predictive scheme of Eqs. 10 and 11 was used to obtain binary interaction parameters; these are given in Table 4. Results with the original Peng Robinson and the translated Peng Robinson (t-PR) models do not include a binary interaction parameter, nor does PROFISSY v0.42. Tables 6-11 summarize bottle-filling calculations for Nitrogen/R-13B1, Nitrogen/R-13I1, Nitrogen/R-227ea, Nitrogen/R-218, Nitrogen/R-125 and Nitrogen/R-236fa mixtures respectively. In general, all of the models have about the same performance, with the original PROFISSY performing the best although there is not a lot of difference considering the uncertainty of the measurements. For R-13B1/nitrogen mixtures all models perform about the same. For R-13I1/nitrogen mixtures, the models have similar performance. All of them

29
This publication is available free of charge from: https://doi.org/10.6028/N
IST.TN.2132
underpredict the pressure at the low temperatures, and overpredict them at the high temperature 423 K. For R-227ea/nitrogen, all of the models do a good job of predicting the pressure and tend to underpredict the pressure. For R-218/nitrogen, all models except the Helmholtz had a tendency to underpredict the pressure. For R-125/nitrogen none of the models showed a trend towards over or underpredicting the pressure except for the Helmholtz that tended to overpredict the pressure. There was only one data point for R-236fa/nitrogen, and all models underpredicted the pressure. There was not a significant difference in performance for the Helmholtz models between the cases where fitted binary interaction parameters were used (R-13B1, R-13I1, R-227ea) and the cases where the predictive scheme was used (R-125, R-218) so we conclude the predictive scheme is adequate for the purpose here. We also note that for these calculations, there appears to be no advantage to using the more complex Helmholtz model; the simpler PR models have similar performance. Although at first disappointing, this is not totally unexpected as the true power of the more complex models lies in their ability to very accurately represent properties of systems where there are large amounts of reliable data that can be used to fit parameters, such as for natural gas systems where a Helmholtz model has been designated as an international standard.[16]. For the systems of interest in this work there are very limited data. For a filling pressure calculation, all models in the PROFISSY spreadsheet can calculate the filling pressure for the fluids investigated to within 15% at a 95% confidence level. Of the fluids investigated, the best results were with R-227ea/nitrogen mixtures, and the worst for R-13I1 mixtures.
Table 5. Sources of Bottle-Filling Data for Nitrogen/Agent Mixtures.
Mixture
Chemical name
Reference
Nitrogen/R-13B1 trifluorobromomethane [3, 12, 47] Nitrogen/R-13I1 trifluoroiodomethane [3, 12, 47] Nitrogen/R-227ea 1,1,1,2,3,3,3-heptafluoropropane [3, 12, 47, 48] Nitrogen/R-218 octafluoropropane [3, 12, 47, 48] Nitrogen/R-125 pentafluoroethane [3, 12, 47, 48] Nitrogen/R-236fa 1,1,1,3,3,3-hexafluoropropane [47]

30
This publication is available free of charge from: https://doi.org/10.6028/N
IST.TN.2132
Table 6. Comparisons of filling by mass calculations for nitrogen/R-13B1 mixtures.
Ref. T, K Mass
Agent, g
Mass N2, g
pexp, MPa
pcal, MPa, A
pcal, MPa, B
pcal, MPa, C
pcal, MPa, D
% Dev., A
% Dev., B
% Dev., C
% Dev., D
[3] 296.15 40.9 0.7 2.89 2.81 2.85 2.82 2.79 2.85 1.46 2.65 3.67 [3] 296.15 40.7 0.6 2.87 2.63 2.66 2.63 2.61 9.13 7.81 8.97 9.94 [3] 296.15 40.9 1.4 4.29 4.06 4.12 4.08 4.02 5.67 4.00 5.16 6.74 [3] 296.15 40.7 1.4 4.29 4.06 4.12 4.08 4.02 5.67 4.04 5.19 6.76 [3, 12] 296.15 54.9 0.7 2.92 2.83 2.92 2.85 2.82 3.18 0.16 2.29 3.68 [3, 12] 296.15 54.8 0.7 2.87 2.83 2.91 2.85 2.82 1.41 -1.54 0.55 1.92 [3, 12] 296.15 54.9 1.4 4.25 4.09 4.24 4.16 4.08 3.91 0.18 2.11 4.16 [3, 12] 296.15 54.9 1.4 4.25 4.09 4.24 4.16 4.08 3.91 0.18 2.11 4.16 [3] 213.15 40.9 0.7 1.04 0.97 1.03 0.96 0.94 7.22 0.66 8.88 10.95 [3] 213.15 40.7 0.6 1 0.84 0.90 0.83 0.82 19.05 10.95 20.10 22.30 [3] 213.15 40.9 1.4 1.95 1.82 1.92 1.80 1.76 7.14 1.43 8.15 10.51 [3] 213.15 40.7 1.4 1.99 1.82 1.92 1.80 1.76 9.34 3.56 10.39 12.79 [3, 12] 213.15 54.9 0.7 1.05 0.98 1.08 0.97 0.94 7.14 -2.39 8.67 11.42 [3, 12] 213.15 54.8 0.7 1.02 0.98 1.08 0.97 0.94 4.08 -5.15 5.58 8.24 [3, 12] 213.15 54.9 1.4 1.94 1.85 1.99 1.83 1.78 4.86 -2.67 6.02 9.06 [3, 12] 213.15 54.9 1.4 1.9 1.85 1.99 1.83 1.78 2.70 -4.68 3.84 6.81 [3] 423.15 34.9 0.62 14.32 14.04 14.35 14.99 14.60 1.99 -0.23 -4.44 -1.92 [3] 423.15 34.9 1.25 17.11 16.9 17.16 17.83 17.29 1.24 -0.30 -4.04 -1.03 [3, 12] 423.15 44.4 0.58 18.92 18.68 19.64 20.19 19.31 1.28 -3.65 -6.28 -2.02 [3, 12] 423.15 45.6 0.61 20.19 19.69 20.80 21.25 20.25 2.54 -2.95 -4.97 -0.31 [3, 12] 423.15 44.4 1.27 22.91 22.84 23.86 24.16 22.96 0.31 -3.96 -5.18 -0.20 [3, 12] 423.15 45.6 1.19 23.22 23.33 24.51 24.70 23.40 -0.47 -5.25 -5.98 -0.79 [47] 296.15 32 1.4 4.17 3.95 3.97 3.95 3.90 5.57 5.06 5.66 6.87 RMS 4.02 4.08 6.32 5.72 BIAS 4.77 0.29 3.28 5.81 AAD 4.81 3.14 5.97 6.36 A: old PROFISSY, v 0.42; B: present model, Helmholtz; C: present model original PR; D: present model, t-PR

31
This publication is available free of charge from: https://doi.org/10.6028/N
IST.TN.2132
Table 7. Comparisons of filling by mass calculations for nitrogen/R-13I1 mixtures.
Ref. T, K Mass
Agent, g
Mass N2, g
pexp, MPa
pcal, MPa, A
pcal, MPa, B
pcal, MPa, C
pcal, MPa, D
% Dev., A
% Dev., B
% Dev., C
% Dev., D
[3] 296.15 54.9 1 2.87 2.56 2.55 2.54 2.47 12.11 12.55 12.99 16.19 [3] 296.15 54.8 1.1 2.87 2.77 2.76 2.74 2.67 3.61 3.99 4.74 7.49 [3] 296.15 54.9 1.6 4.21 3.81 3.81 3.79 3.68 10.50 10.50 11.08 14.40 [3] 296.15 54.8 1.7 4.21 4.02 4.02 3.99 3.88 4.73 4.73 5.51 8.51 [3, 12] 296.15 72.8 0.9 2.77 2.5 2.5 2.49 2.41 10.80 10.80 11.24 14.94 [3, 12] 296.15 72.7 0.9 2.79 2.5 2.5 2.49 2.4 11.60 11.60 12.05 16.25 [3, 12] 296.15 72.8 1.4 4.14 3.64 3.66 3.62 3.49 13.74 13.11 14.36 18.62 [3, 12] 296.15 72.7 1.4 4.16 3.64 3.66 3.62 3.49 14.29 13.66 14.92 19.20 [3] 213.15 54.9 1 1.71 1.42 1.39 1.41 1.37 20.42 23.02 21.28 24.82 [3] 213.15 54.8 1.1 1.71 1.56 1.53 1.55 1.51 9.62 11.76 10.32 13.25 [3] 213.15 54.9 1.6 2.62 2.26 2.22 2.23 2.17 15.93 18.02 17.49 20.74 [3] 213.15 54.8 1.7 2.62 2.39 2.36 2.37 2.3 9.62 11.02 10.55 13.91 [3, 12] 213.15 72.8 0.9 1.6 1.36 1.33 1.35 1.3 17.65 20.30 18.52 23.08 [3, 12] 213.15 72.7 0.9 1.64 1.36 1.33 1.35 1.3 20.59 23.31 21.48 26.15 [3, 12] 213.15 72.8 1.4 2.49 2.11 2.06 2.09 2 18.01 20.87 19.14 24.50 [3, 12] 213.15 72.7 1.4 2.62 2.11 2.06 2.09 2 24.17 27.18 25.36 31.00 [3] 423.15 43.2 0.96 10.38 10.54 10.13 11.15 10.81 -1.52 2.47 -6.91 -3.98 [3] 423.15 43.2 0.92 10.22 10.37 9.96 10.97 10.64 -1.45 2.61 -6.84 -3.95 [3] 423.15 43.2 1.5 12.71 13.03 12.53 13.74 13.24 -2.46 1.44 -7.50 -4.00 [3] 423.15 43.2 1.5 12.92 13.03 12.53 13.74 13.24 -0.84 3.11 -5.97 -2.42 [3, 12] 423.15 57.3 0.85 13.79 14.37 14.51 15.97 14.87 -4.04 -4.96 -13.65 -7.26 [3, 12] 423.15 58.6 0.85 14.42 15.08 15.37 16.77 15.52 -4.38 -6.18 -14.01 -7.09 [3, 12] 423.15 57.3 1.44 17.62 18.38 18.57 19.95 18.45 -4.13 -5.12 -11.68 -4.50 [3, 12] 423.15 58.6 1.32 18.25 18.39 18.75 20.04 18.46 -0.76 -2.67 -8.93 -1.14 [47] 296.15 39 1.9 4.28 4.05 4.03 4 3.93 5.68 6.20 7.00 8.91 RMS 8.66 9.26 12.02 11.64 BIAS 8.14 9.33 6.50 10.70 AAD 9.71 10.85 12.54 13.45 A: old PROFISSY, v 0.42; B: present model, Helmholtz; C: present model original PR; D: present model, t-PR

32
This publication is available free of charge from: https://doi.org/10.6028/N
IST.TN.2132
Table 8. Comparisons of filling by mass calculations for nitrogen/R-227ea mixtures.
Ref. T, K Mass
Agent, g
Mass N2, g
pexp, MPa
pcal, MPa, A
pcal, MPa, B
pcal, MPa, C
pcal, MPa, D
% Dev., A
% Dev., B
% Dev., C
% Dev., D
[3, 12] 296.15 48.7 1.1 2.87 2.76 2.68 2.68 2.7 3.99 7.09 7.09 6.30 [3, 12] 296.15 48.7 1.2 2.98 2.97 2.88 2.88 2.9 0.34 3.47 3.47 2.76 [3, 12] 296.15 48.7 1.8 4.25 4.23 4.12 4.12 4.14 0.47 3.16 3.16 2.66 [3, 12] 296.15 48.7 1.8 4.25 4.23 4.12 4.12 4.14 0.47 3.16 3.16 2.66 [3, 12] 213.15 48.7 1.1 1.66 1.6 1.61 1.52 1.53 3.75 3.11 9.21 8.50 [3, 12] 213.15 48.7 1.2 1.7 1.74 1.75 1.65 1.67 -2.30 -2.86 3.03 1.80 [3, 12] 213.15 48.7 1.8 2.55 2.6 2.61 2.47 2.47 -1.92 -2.30 3.24 3.24 [3, 12] 213.15 48.7 1.8 2.51 2.6 2.61 2.47 2.47 -3.46 -3.83 1.62 1.62 [3, 12] 423.15 38.4 0.96 15.56 14.57 15.35 15.75 15.94 6.79 1.37 -1.21 -2.38 [3, 12] 423.15 39.7 0.94 16.77 15.35 16.43 16.57 16.79 9.25 2.07 1.21 -0.12 [3, 12] 423.15 38.4 1.47 19.19 17.74 18.49 18.74 18.9 8.17 3.79 2.40 1.53 [3, 12] 423.15 39.7 1.48 20.54 18.88 19.99 19.88 20.07 8.79 2.75 3.32 2.34 [3] 296.15 36.5 1.2 2.9 2.82 2.75 2.75 2.76 2.84 5.45 5.45 5.07 [3] 296.15 36.6 1.2 2.93 2.82 2.75 2.75 2.76 3.90 6.55 6.55 6.16 [3] 296.15 36.5 1.9 4.29 4.21 4.1 4.11 4.11 1.90 4.63 4.38 4.38 [3] 296.15 36.6 1.9 4.28 4.21 4.1 4.11 4.11 1.66 4.39 4.14 4.14 [3] 213.15 36.5 1.2 1.69 1.65 1.66 1.59 1.6 2.42 1.81 6.29 5.62 [3] 213.15 36.6 1.2 1.72 1.65 1.66 1.59 1.6 4.24 3.61 8.18 7.50 [3] 213.15 36.5 1.9 2.59 2.59 2.59 2.49 2.5 0.00 0.00 4.02 3.60 [3] 213.15 36.6 1.9 2.58 2.59 2.6 2.49 2.5 -0.39 -0.77 3.61 3.20 [3] 423.15 28.3 0.98 10.7 10.38 10.24 10.92 10.97 3.08 4.49 -2.01 -2.46 [3] 423.15 30.3 0.99 11.25 10.96 10.93 11.69 11.75 2.65 2.93 -3.76 -4.26 [3] 423.15 28.3 1.62 13.58 13.25 12.9 13.73 13.75 2.49 5.27 -1.09 -1.24 [3] 423.15 30.3 1.62 14.43 14 13.72 14.61 14.64 3.07 5.17 -1.23 -1.43 [47] 296.15 26.3 1.8 4.16 3.73 3.64 3.64 3.64 11.53 14.29 14.29 14.29 [48] 297 26.3 1.8 4.16 3.75 3.66 3.66 3.66 10.93 13.66 13.66 13.66 RMS 3.87 4.04 4.22 4.33 BIAS 3.24 2.80 3.20 3.20 AAD 3.26 3.56 3.93 3.43
A: old PROFISSY, v 0.42; B: present model, Helmholtz; C: present model original PR; D: present model, t-PR

33
This publication is available free of charge from: https://doi.org/10.6028/N
IST.TN.2132
Table 9. Comparisons of filling by mass calculations for nitrogen/R-218 mixtures.
Ref. T, K Mass Agent, g
Mass N2, g
pexp, MPa
pcal, MPa, A
pcal, MPa, B
pcal, MPa, C
pcal, MPa, D
% Dev., A
% Dev., B
% Dev., C
% Dev., D
[3] 296.15 33.2 1 2.89 2.68 2.81 2.63 2.62 7.84 2.85 9.89 10.31 [3] 296.15 33.1 1.1 2.89 2.86 3 2.8 2.8 1.05 -3.67 3.21 3.21 [3] 296.15 33.2 1.8 4.27 4.22 4.34 4.06 4.04 1.18 -1.61 5.17 5.69 [3] 296.15 33.1 1.8 4.27 4.22 4.34 4.05 4.04 1.18 -1.61 5.43 5.69 [3, 12] 296.15 44.1 1 2.94 2.73 2.95 2.68 2.67 7.69 -0.34 9.70 10.11 [3, 12] 296.15 44.2 1 2.93 2.73 2.95 2.68 2.67 7.33 -0.68 9.33 9.74 [3, 12] 296.15 44.1 1.6 4.36 3.97 4.17 3.78 3.77 9.82 4.56 15.34 15.65 [3, 12] 296.15 44.2 1.6 4.29 3.97 4.17 3.78 3.77 8.06 2.88 13.49 13.79 [3] 213.15 33.2 1 1.44 1.3 1.48 1.25 1.25 10.77 -2.70 15.20 15.20 [3] 213.15 33.1 1.1 1.43 1.43 1.62 1.37 1.37 0.00 -11.73 4.38 4.38 [3] 213.15 33.2 1.8 2.34 2.29 2.57 2.21 2.2 2.18 -8.95 5.88 6.36 [3] 213.15 33.1 1.8 2.38 2.29 2.57 2.21 2.2 3.93 -7.39 7.69 8.18 [3, 12] 213.15 44.1 1 1.41 1.33 1.59 1.27 1.27 6.02 -11.32 11.02 11.02 [3, 12] 213.15 44.2 1 1.39 1.33 1.59 1.27 1.27 4.51 -12.58 9.45 9.45 [3, 12] 213.15 44.1 1.6 2.32 2.1 2.47 2 1.99 10.48 -6.07 16.00 16.58 [3, 12] 213.15 44.2 1.6 2.3 2.1 2.47 2 1.99 9.52 -6.88 15.00 15.58 [3] 423.15 28.9 0.93 12.13 11.91 11.8 11.89 11.86 1.85 2.80 2.02 2.28 [3] 423.15 29.1 0.88 11.84 11.76 11.67 11.75 11.73 0.68 1.46 0.77 0.94 [3] 423.15 28.9 1.48 14.64 14.46 14.21 14.24 14.18 1.24 3.03 2.81 3.24 [3] 423.15 29.1 1.49 14.73 14.61 14.35 14.37 14.31 0.82 2.65 2.51 2.94 [3, 12] 423.15 37.4 0.84 16.39 16.26 16.17 15.51 15.48 0.80 1.36 5.67 5.88 [3, 12] 423.15 37.3 0.92 16.51 16.66 16.55 15.86 15.83 -0.90 -0.24 4.10 4.30 [3, 12] 423.15 37.4 1.45 20.03 19.98 19.79 18.73 18.63 0.25 1.21 6.94 7.51 [3, 12] 423.15 37.3 1.46 19.99 19.95 19.75 18.72 18.62 0.20 1.22 6.78 7.36 [47] 296.15 26.6 1.7 4.15 3.86 3.92 3.73 3.72 7.51 5.87 11.26 11.56 RMS 3.82 5.24 4.48 4.51 BIAS 4.16 -1.84 7.96 8.28 AAD 4.23 4.23 7.96 8.28 A: old PROFISSY, v 0.42; B: present model, Helmholtz; C: present model original PR; D: present model, t-PR

34
This publication is available free of charge from: https://doi.org/10.6028/N
IST.TN.2132
Table 10. Comparisons of filling by mass calculations for nitrogen/R-125 mixtures.
Ref. T, K Mass Agent, g
Mass N2, g
pexp, MPa
pcal, MPa, A
pcal, MPa, B
pcal, MPa, C
pcal, MPa, D
% Dev., A
% Dev., B
% Dev., C
% Dev., D
[3] 296.15 31.3 0.9 2.78 2.94 3.05 2.94 2.92 -5.44 -8.85 -5.44 -4.79 [3] 296.15 31.1 0.8 2.79 2.76 2.86 2.76 2.74 1.09 -2.45 1.09 1.82 [3] 296.15 31.3 1.6 4.24 4.21 4.39 4.21 4.16 0.71 -3.42 0.71 1.92 [3] 296.15 31.1 1.6 4.23 4.21 4.38 4.21 4.15 0.48 -3.42 0.48 1.93 [3, 12] 296.15 41.9 0.8 2.7 2.78 2.97 2.81 2.78 -2.88 -9.09 -3.91 -2.88 [3, 12] 296.15 41.8 0.8 2.85 2.78 2.97 2.81 2.76 2.52 -4.04 1.42 3.26 [3, 12] 296.15 41.9 1.5 4.18 4.07 4.39 4.12 4.05 2.70 -4.78 1.46 3.21 [3, 12] 296.15 41.8 1.5 4.18 4.07 4.38 4.12 4.05 2.70 -4.57 1.46 3.21 [3] 213.15 31.3 0.9 1.11 1.19 1.38 1.19 1.17 -6.72 -19.57 -6.72 -5.13 [3] 213.15 31.1 0.8 1.11 1.07 1.24 1.06 1.05 3.74 -10.48 4.72 5.71 [3] 213.15 31.3 1.6 2.1 2.06 2.37 2.05 2.01 1.94 -11.39 2.44 4.48 [3] 213.15 31.1 1.6 2.09 2.06 2.36 2.05 2.01 1.46 -11.44 1.95 3.98 [3, 12] 213.15 41.9 0.8 1.08 1.09 1.34 1.08 1.06 -0.92 -19.40 0.00 1.89 [3, 12] 213.15 41.8 0.8 1.1 1.09 1.34 1.08 1.06 0.92 -17.91 1.85 3.77 [3, 12] 213.15 41.9 1.5 2.06 1.98 2.41 1.97 1.93 4.04 -14.52 4.57 6.74 [3, 12] 213.15 41.8 1.5 2.02 1.98 2.41 1.97 1.93 2.02 -16.18 2.54 4.66 [3] 423.15 26.4 0.67 14.45 14.41 14.36 15.19 14.9 0.28 0.63 -4.87 -3.02 [3] 423.15 26.1 0.71 14.35 14.43 14.37 15.17 14.89 -0.55 -0.14 -5.41 -3.63 [3] 423.15 26.4 1.32 17.32 17.56 17.24 18.14 17.72 -1.37 0.46 -4.52 -2.26 [3] 423.15 26.1 1.32 17.2 17.36 17.04 17.93 17.52 -0.92 0.94 -4.07 -1.83 [3, 12] 423.15 34.6 0.61 20.13 20.4 20.51 21.56 20.84 -1.32 -1.85 -6.63 -3.41 [3, 12] 423.15 32.3 0.73 18.87 18.92 18.89 19.98 19.39 -0.26 -0.11 -5.56 -2.68 [3, 12] 423.15 34.6 1.25 24.25 24.71 24.53 25.39 24.41 -1.86 -1.14 -4.49 -0.66 [3, 12] 423.15 32.3 1.37 22.39 22.87 22.52 23.53 22.72 -2.10 -0.58 -4.84 -1.45 [47] 296.15 24.3 1.5 4.21 3.92 3.99 3.88 3.85 7.40 5.51 8.51 9.35 [48] 296 24.3 1.5 4.21 3.91 3.98 3.88 3.84 7.67 5.78 8.51 9.64 RMS 3.19 7.22 4.41 4.12 BIAS 0.59 -5.85 -0.57 1.30 AAD 2.25 6.92 3.59 3.51 A: old PROFISSY, v 0.42; B: present model, Helmholtz; C: present model original PR; D: present model, t-PR

35
This publication is available free of charge from: https://doi.org/10.6028/N
IST.TN.2132
Table 11. Comparisons of filling by mass calculations for nitrogen/R-236fa mixtures.
Ref. T, K Mass Agent, g
Mass N2, g
pexp, MPa
pcal, MPa, A
pcal, MPa, B
pcal, MPa, C
pcal, MPa, D
% Dev., A
% Dev., B
% Dev., C
% Dev., D
[47] 296.15 24.8 1.9 4.27 3.87 3.81 3.76 3.77 10.34 12.07 13.56 13.26 RMS 0.00 0.00 0.00 0.00 BIAS 10.34 12.07 13.56 13.26 AAD 10.34 12.07 13.56 13.26 A: old PROFISSY, v 0.42; B: present model, Helmholtz; C: present model original PR; D: present model, t-PR

36
This publication is available free of charge from: https://doi.org/10.6028/N
IST.TN.2132
4.2. Filling by Pressure Calculations
We can use the same data that is summarized in Table 5 and perform a filling by pressure calculation to test the validity of this calculation. These results are shown in Tables 12-17. For these calculations, the input parameters are the mass of agent and filling pressure, the vessel size, and the filling temperature. The output variable is the mass of the pressurizing fluid (nitrogen, for the data sources in Table 5). The percent deviation in the tables is defined as 100*(mN2,exp-mN2,cal)/mN2,cal. Some of the values are quite large due to the fact that mN2 is a very small number, often on the order of 1 g or smaller, and the experimental values of the mass of nitrogen typically are reported to ±0.1g. Regarding the uncertainty of these experiments, Ref. [48] states a repeatability of 5% for the determination of the amount of nitrogen required to pressurize a vessel to a given pressure and temperature with a fixed amount of agent.
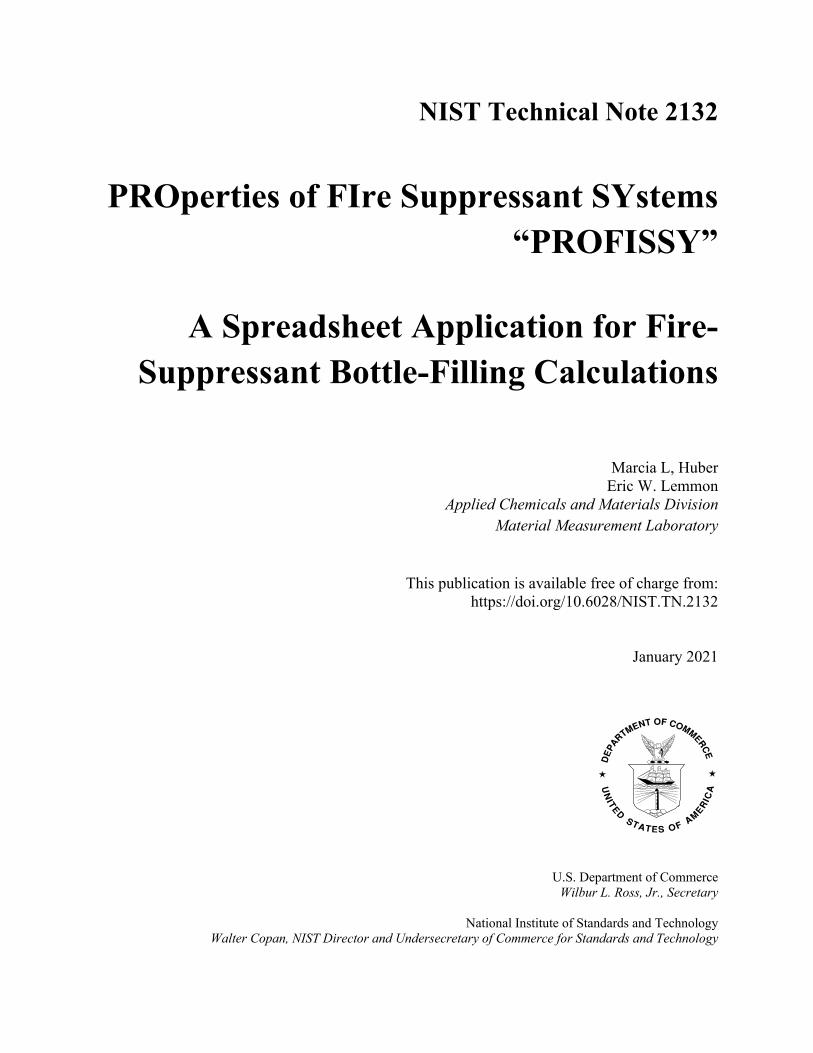
Table 12 shows the results for R-13B1/nitrogen mixtures. At the lowest temperature (213.15 K) up to and including room temperature, all models perform about the same, with all models overpredicting the N2 mass. At the highest temperature, the legacy PROFISSY overpredicts the the nitrogen mass, while the other models underpredict it. As noted earlier, some of the percent deviations at the highest temperature, 423.15 K, are quite large due in part to the amount of nitrogen being a very small number. Table 13 displays the results for CF3I mixtures. The performance of the legacy PROFISSY and the Helmholtz model are similar, overpredicting the nitrogen mass at temperatures from 213 K to room temperature; the two PR models perform slightly worse, particularly at the highest temperature. We note again that the results are a bit misleading due to the small numbers involved and the sensitivity to the number of digits reported for the nitrogen mass. For example, if one compares lines 9 and 10 in Table 13, the agent mass changes from 54.9 g to 54.8 g, the experimental pressure is identical, and the nitrogen mass changes from 1 g to 1.1 g the predicted values between these two lines also differ by about 8%. Table 14 gives results for R-227ea; all models have about the same performance, roughly 10% at a level of k = 2. Table 15 reports comparisons for R-218 mixtures. For unknown reasons, the legacy PROFISSY failed to converge for two points. Otherwise, all models performed about the same. Table 15 gives results for R-125 mixtures. The legacy PROFISSY gave slightly better performance, followed by the Helmholtz model, the t-PR and finally the original PR. For this fluid, the Helmholtz and original PR models showed a bias towards underprediction. There is only one data point for R-236fa, shown in Table 16. All models show about the same performance, with a bias of overpredicting the amount of nitrogen. Across Tables 12-15, the legacy PROFISSY tended to consistently overpredict the nitrogen mass, while the other 3 models did not show a consistent trend. All models had roughly the same performance.
37
This publication is available free of charge from: https://doi.org/10.6028/N
IST.TN.2132
Table 12. Comparisons of filling by pressure calculations for nitrogen/R-13B1 mixtures.
Ref. T, K Mass Agent, g
Mass N2, g
pexp, MPa
mN2,cal, g, A
mN2,cal, g, B
mN2,cal, g, C
mN2,cal, g, D
% Dev., A
% Dev., B
% Dev., C
% Dev., D
[3] 296.15 40.9 0.7 2.89 0.746 0.722 0.741 0.758 -6.17 -3.11 -5.56 -7.64 [3] 296.15 40.7 0.6 2.87 0.735 0.712 0.730 0.747 -18.37 -15.75 -17.86 -19.66 [3] 296.15 40.9 1.4 4.29 1.531 1.492 1.517 1.555 -8.56 -6.18 -7.70 -9.95 [3] 296.15 40.7 1.4 4.29 1.531 1.493 1.518 1.555 -8.56 -6.24 -7.74 -9.98 [3, 12] 296.15 54.9 0.7 2.92 0.749 0.702 0.735 0.757 -6.54 -0.34 -4.77 -7.57 [3, 12] 296.15 54.8 0.7 2.87 0.722 0.677 0.708 0.730 -3.05 3.42 -1.19 -4.09 [3, 12] 296.15 54.9 1.4 4.25 1.487 1.404 1.447 1.494 -5.85 -0.29 -3.24 -6.32 [3, 12] 296.15 54.9 1.4 4.25 1.487 1.404 1.447 1.494 -5.85 -0.29 -3.24 -6.32 [3] 213.15 40.9 0.7 1.04 0.76 0.705 0.769 0.786 -7.89 -0.74 -9.03 -10.94 [3] 213.15 40.7 0.6 1 0.728 0.675 0.737 0.753 -17.58 -11.12 -18.57 -20.27 [3] 213.15 40.9 1.4 1.95 1.504 1.422 1.523 1.559 -6.91 -1.56 -8.05 -10.20 [3] 213.15 40.7 1.4 1.99 1.538 1.456 1.556 1.594 -8.97 -3.82 -10.04 -12.15 [3, 12] 213.15 54.9 0.7 1.05 0.757 0.681 0.768 0.789 -7.53 2.78 -8.80 -11.33 [3, 12] 213.15 54.8 0.7 1.02 0.733 0.659 0.743 0.765 -4.50 6.18 -5.84 -8.44 [3, 12] 213.15 54.9 1.4 1.94 1.471 1.358 1.490 1.536 -4.83 3.09 -6.04 -8.86 [3, 12] 213.15 54.9 1.4 1.9 1.438 1.327 1.457 1.502 -2.64 5.54 -3.93 -6.81 [3] 423.15 34.9 0.62 14.32 0.684 0.612 0.468 0.553 -9.36 1.23 32.55 12.21 [3] 423.15 34.9 1.25 17.11 1.295 1.239 1.093 1.209 -3.47 0.90 14.31 3.39 [3, 12] 423.15 44.4 0.58 18.92 0.622 0.458 0.350 0.504 -6.75 26.74 65.84 15.07 [3, 12] 423.15 45.6 0.61 20.19 0.692 0.510 0.426 0.598 -11.85 19.58 43.31 1.96 [3, 12] 423.15 44.4 1.27 22.91 1.281 1.120 1.057 1.262 -0.86 13.40 20.10 0.66 [3, 12] 423.15 45.6 1.19 23.22 1.174 0.993 0.946 1.157 1.36 19.89 25.80 2.88 [47] 296.15 32 1.4 4.17 1.528 1.518 1.531 1.561 -8.38 -7.79 -8.55 -10.30 RMS 4.43 9.83 20.50 8.40 BIAS -7.09 1.98 3.12 -5.85 AAD 7.21 6.96 14.44 9.00 A: old PROFISSY, v 0.42; B: present model, Helmholtz; C: present model original PR; D: present model, t-PR

38
This publication is available free of charge from: https://doi.org/10.6028/N
IST.TN.2132
Table 13. Comparisons of filling by pressure calculations for nitrogen/R-13I1 mixtures.
Ref. T, K Mass Agent, g
Mass N2, g
pexp, MPa
mN2,cal, g, A
mN2,cal, g, B
mN2,cal, g, C
mN2,cal, g, D
% Dev., A
% Dev., B
% Dev., C
% Dev., D
[3] 296.15 54.9 1 2.87 1.149 1.154 1.161 1.197 -12.97 -13.34 -13.87 -16.46 [3] 296.15 54.8 1.1 2.87 1.149 1.154 1.162 1.197 -4.26 -4.68 -5.34 -8.10 [3] 296.15 54.9 1.6 4.21 1.788 1.786 1.804 1.865 -10.51 -10.41 -11.31 -14.21 [3] 296.15 54.8 1.7 4.21 1.789 1.787 1.805 1.865 -4.97 -4.87 -5.82 -8.85 [3, 12] 296.15 72.8 0.9 2.77 1.018 1.015 1.024 1.068 -11.59 -11.33 -12.11 -15.73 [3, 12] 296.15 72.7 0.9 2.79 1.027 1.024 1.034 1.078 -12.37 -12.11 -12.96 -16.51 [3, 12] 296.15 72.8 1.4 4.14 1.62 1.603 1.625 1.7 -13.58 -12.66 -13.85 -17.65 [3, 12] 296.15 72.7 1.4 4.16 1.621 1.612 1.635 1.71 -13.63 -13.15 -14.37 -18.13 [3] 213.15 54.9 1 1.71 1.206 1.229 1.216 1.252 -17.08 -18.63 -17.76 -20.13 [3] 213.15 54.8 1.1 1.71 1.207 1.229 1.216 1.253 -8.86 -10.50 -9.54 -12.21 [3] 213.15 54.9 1.6 2.62 1.863 1.889 1.88 1.941 -14.12 -15.30 -14.89 -17.57 [3] 213.15 54.8 1.7 2.62 1.864 1.89 1.881 1.942 -8.80 -10.05 -9.62 -12.46 [3, 12] 213.15 72.8 0.9 1.6 1.058 1.086 1.067 1.11 -14.93 -17.13 -15.65 -18.92 [3, 12] 213.15 72.7 0.9 1.64 1.085 1.113 1.094 1.139 -17.05 -19.14 -17.73 -20.98 [3, 12] 213.15 72.8 1.4 2.49 1.654 1.687 1.669 1.741 -15.36 -17.01 -16.12 -19.59 [3, 12] 213.15 72.7 1.4 2.62 1.742 1.775 1.757 1.834 -19.63 -21.13 -20.32 -23.66 [3] 423.15 43.2 0.96 10.38 0.923 1.018 0.793 0.861 4.01 -5.70 21.06 11.50 [3] 423.15 43.2 0.92 10.22 0.887 0.981 0.758 0.825 3.72 -6.22 21.37 11.52 [3] 423.15 43.2 1.5 12.71 1.434 1.539 1.288 1.383 4.60 -2.53 16.46 8.46 [3] 423.15 43.2 1.5 12.92 1.478 1.584 1.332 1.429 1.49 -5.30 12.61 4.97 [3, 12] 423.15 57.3 0.85 13.79 0.76 0.74 0.51 0.667 11.84 14.86 66.67 27.44 [3, 12] 423.15 58.6 0.85 14.42 0.752 0.71 0.497 0.668 13.03 19.72 71.03 27.25 [3, 12] 423.15 57.3 1.44 17.62 1.332 1.307 1.099 1.306 8.11 10.18 31.03 10.26 [3, 12] 423.15 58.6 1.32 18.25 1.301 1.252 1.066 1.287 1.46 5.43 23.83 2.56 [47] 296.15 39 1.9 4.28 2.02 2.033 2.046 1.095 -5.94 -6.54 -7.14 73.52 RMS 9.46 10.22 24.79 21.57 BIAS -6.30 -7.50 1.83 -3.35 AAD 10.16 11.52 19.30 17.54 A: old PROFISSY, v 0.42; B: present model, Helmholtz; C: present model original PR; D: present model, t-PR

39
This publication is available free of charge from: https://doi.org/10.6028/N
IST.TN.2132
Table 14. Comparisons of filling by pressure calculations for nitrogen/R-227ea mixtures.
Ref. T, K Mass Agent, g
Mass N2, g
pexp, MPa
mN2,cal, g, A
mN2,cal, g, B
mN2,cal, g, C
mN2,cal, g, D
% Dev., A
% Dev., B
% Dev., C
% Dev., D
[3, 12] 296.15 48.7 1.1 2.87 1.239 1.279 1.278 1.272 -3.15 -6.18 -6.10 -5.66 [3, 12] 296.15 48.7 1.2 2.98 1.254 1.294 1.292 1.287 -4.31 -7.26 -7.12 -6.76 [3, 12] 296.15 48.7 1.8 4.25 1.939 1.998 1.995 1.992 -2.01 -4.90 -4.76 -4.62 [3, 12] 296.15 48.7 1.8 4.25 1.933 1.992 1.989 1.985 -1.71 -4.62 -4.47 -4.28 [3, 12] 213.15 48.7 1.1 1.66 1.154 1.194 1.193 1.185 -4.68 -7.87 -7.80 -7.17 [3, 12] 213.15 48.7 1.2 1.7 1.206 1.248 1.247 1.238 -0.50 -3.85 -3.77 -3.07 [3, 12] 213.15 48.7 1.8 2.55 1.81 1.867 1.863 1.854 -0.55 -3.59 -3.38 -2.91 [3, 12] 213.15 48.7 1.8 2.51 1.81 1.867 1.863 1.854 -0.55 -3.59 -3.38 -2.91 [3, 12] 423.15 38.4 0.96 15.56 1.228 1.224 1.278 1.273 -2.28 -1.96 -6.10 -5.73 [3, 12] 423.15 39.7 0.94 16.77 1.25 1.246 1.3 1.296 -4.00 -3.69 -7.69 -7.41 [3, 12] 423.15 38.4 1.47 19.19 1.9 1.897 1.977 1.974 0.00 0.16 -3.89 -3.75 [3, 12] 423.15 39.7 1.48 20.54 1.892 1.889 1.969 1.965 0.42 0.58 -3.50 -3.31 [3] 296.15 36.5 1.2 2.9 1.143 1.136 1.204 1.196 -3.76 -3.17 -8.64 -8.03 [3] 296.15 36.6 1.2 2.93 1.171 1.164 1.234 1.225 2.48 3.09 -2.76 -2.04 [3] 296.15 36.5 1.9 4.29 1.767 1.76 1.861 1.852 1.87 2.27 -3.28 -2.81 [3] 296.15 36.6 1.9 4.28 1.739 1.732 1.732 1.831 3.51 3.93 3.93 -1.69 [3] 213.15 36.5 1.2 1.69 1.054 1.095 0.928 0.917 -7.02 -10.50 5.60 6.87 [3] 213.15 36.6 1.2 1.72 1.044 1.065 0.892 0.878 -5.17 -7.04 10.99 12.76 [3] 213.15 36.5 1.9 2.59 1.691 1.777 1.586 1.581 -4.20 -8.84 2.14 2.47 [3] 213.15 36.6 1.9 2.58 1.707 1.772 1.582 1.574 -5.10 -8.58 2.40 2.92 [3] 423.15 28.3 0.98 10.7 1.123 0.995 0.926 0.893 -14.51 -3.52 3.67 7.50 [3] 423.15 30.3 0.99 11.25 1.162 0.994 0.973 0.936 -19.10 -5.43 -3.39 0.43 [3] 423.15 28.3 1.62 13.58 1.693 1.578 1.544 1.518 -13.17 -6.84 -4.79 -3.16 [3] 423.15 30.3 1.62 14.43 1.722 1.56 1.584 1.555 -14.05 -5.13 -6.57 -4.82 [47] 296.15 26.3 1.8 4.16 2.034 2.093 2.092 2.094 -11.50 -14.00 -13.96 -14.04 [48] 297 26.3 1.8 4.16 2.022 2.081 2.079 2.081 -10.98 -13.50 -13.42 -13.50 RMS 5.69 4.43 5.47 5.77 BIAS -4.77 -4.77 -3.46 -2.87 AAD 5.41 5.54 5.67 5.41
A: old PROFISSY, v 0.42; B: present model, Helmholtz; C: present model original PR; D: present model, t-PR

40
This publication is available free of charge from: https://doi.org/10.6028/N
IST.TN.2132
Table 15. Comparisons of filling by pressure calculations for nitrogen/R-218 mixtures.
Ref. T, K Mass Agent, g
Mass N2, g
pexp, MPa
mN2,cal, g, A
mN2,cal, g, B
mN2,cal, g, C
mN2,cal, g, D
% Dev., A
% Dev., B
% Dev., C
% Dev., D
[3] 296.15 33.2 1 2.89 1.115 1.043 1.147 1.15 -10.31 -4.12 -12.82 -13.04 [3] 296.15 33.1 1.1 2.89 1.116 1.044 1.148 1.15 -1.43 5.36 -4.18 -4.35 [3] 296.15 33.2 1.8 4.27 1.828 1.763 1.921 1.929 -1.53 2.10 -6.30 -6.69 [3] 296.15 33.1 1.8 4.27 1.829 1.764 1.921 1.929 -1.59 2.04 -6.30 -6.69 [3, 12] 296.15 44.1 1 2.94 failed 0.997 1.143 1.145 failed 0.30 -12.51 -12.66 [3, 12] 296.15 44.2 1 2.93 failed 0.991 1.138 1.139 failed 0.91 -12.13 -12.20 [3, 12] 296.15 44.1 1.6 4.36 1.806 1.698 1.915 1.923 -11.41 -5.77 -16.45 -16.80 [3, 12] 296.15 44.2 1.6 4.29 1.768 1.661 1.877 1.884 -9.50 -3.67 -14.76 -15.07 [3] 213.15 33.2 1 1.44 1.11 0.971 1.154 1.156 -9.91 2.99 -13.34 -13.49 [3] 213.15 33.1 1.1 1.43 1.102 0.965 1.146 1.148 -0.18 13.99 -4.01 -4.18 [3] 213.15 33.2 1.8 2.34 1.838 1.627 1.912 1.92 -2.07 10.63 -5.86 -6.25 [3] 213.15 33.1 1.8 2.38 1.871 1.658 1.947 1.955 -3.79 8.56 -7.55 -7.93 [3, 12] 213.15 44.1 1 1.41 1.061 0.879 1.116 1.117 -5.75 13.77 -10.39 -10.47 [3, 12] 213.15 44.2 1 1.39 1.041 0.865 1.099 1.1 -3.94 15.61 -9.01 -9.09 [3, 12] 213.15 44.1 1.6 2.32 1.777 1.497 1.869 1.875 -9.96 6.88 -14.39 -14.67 [3, 12] 213.15 44.2 1.6 2.3 1.761 1.482 1.852 1.858 -9.14 7.96 -13.61 -13.89 [3] 423.15 28.9 0.93 12.13 0.98 1.007 0.988 0.995 -5.10 -7.65 -5.87 -6.53 [3] 423.15 29.1 0.88 11.84 0.897 0.921 0.9 0.906 -1.90 -4.45 -2.22 -2.87 [3] 423.15 28.9 1.48 14.64 1.518 1.576 1.57 1.588 -2.50 -6.09 -5.73 -6.80 [3] 423.15 29.1 1.49 14.73 1.516 1.574 1.57 1.588 -1.72 -5.34 -5.10 -6.17 [3, 12] 423.15 37.4 0.84 16.39 0.862 0.878 1.01 1.018 -2.55 -4.33 -16.83 -17.49 [3, 12] 423.15 37.3 0.92 16.51 0.895 0.913 1.045 1.054 2.79 0.77 -11.96 -12.71 [3, 12] 423.15 37.4 1.45 20.03 1.458 1.489 1.687 1.712 -0.55 -2.62 -14.05 -15.30 [3, 12] 423.15 37.3 1.46 19.99 1.466 1.498 1.692 1.718 -0.41 -2.54 -13.71 -15.02 [47] 296.15 26.6 1.7 4.15 1.868 1.831 1.95 1.959 -8.99 -7.15 -12.82 -13.22 RMS 4.01 6.95 4.27 4.27 BIAS -4.41 1.53 -10.08 -10.54 AAD 4.65 5.82 10.08 10.54 A: old PROFISSY, v 0.42; B: present model, Helmholtz; C: present model original PR; D: present model, t-PR Statistics exclude calculations that failed to converge

41
This publication is available free of charge from: https://doi.org/10.6028/N
IST.TN.2132
Table 16. Comparisons of filling by pressure calculations for nitrogen/R-125 mixtures.
Ref. T, K Mass Agent, g
Mass N2, g
pexp, MPa
mN2,cal, g, A
mN2,cal, g, B
mN2,cal, g, C
mN2,cal, g, D
% Dev., A
% Dev., B
% Dev., C
% Dev., D
[3] 296.15 31.3 0.9 2.78 0.81 0.757 0.81 0.823 11.11 18.89 11.11 9.36 [3] 296.15 31.1 0.8 2.79 0.816 0.763 0.816 0.829 -1.96 4.85 -1.96 -3.50 [3] 296.15 31.3 1.6 4.24 1.615 1.522 1.618 1.648 -0.93 5.12 -1.11 -2.91 [3] 296.15 31.1 1.6 4.23 1.61 1.518 1.613 1.643 -0.62 5.40 -0.81 -2.62 [3, 12] 296.15 41.9 0.8 2.7 0.755 0.668 0.743 0.758 5.96 19.76 7.67 5.54 [3, 12] 296.15 41.8 0.8 2.85 0.836 0.741 0.823 0.841 -4.31 7.96 -2.79 -4.88 [3, 12] 296.15 41.9 1.5 4.18 1.559 1.396 1.533 1.57 -3.78 7.45 -2.15 -4.46 [3, 12] 296.15 41.8 1.5 4.18 1.559 1.397 1.534 1.57 -3.78 7.37 -2.22 -4.46 [3] 213.15 31.3 0.9 1.11 0.835 0.711 0.84 0.853 7.78 26.58 7.14 5.51 [3] 213.15 31.1 0.8 1.11 0.835 0.712 0.84 0.853 -4.19 12.36 -4.76 -6.21 [3] 213.15 31.3 1.6 2.1 1.631 1.408 1.643 1.673 -1.90 13.64 -2.62 -4.36 [3] 213.15 31.1 1.6 2.09 1.623 1.403 1.636 1.665 -1.42 14.04 -2.20 -3.90 [3, 12] 213.15 41.9 0.8 1.08 0.794 0.632 0.799 0.815 0.76 26.58 0.13 -1.84 [3, 12] 213.15 41.8 0.8 1.1 0.81 0.645 0.815 0.831 -1.23 24.03 -1.84 -3.73 [3, 12] 213.15 41.9 1.5 2.06 1.562 1.265 1.572 1.609 -3.97 18.58 -4.58 -6.77 [3, 12] 213.15 41.8 1.5 2.02 1.53 1.24 1.541 1.576 -1.96 20.97 -2.66 -4.82 [3] 423.15 26.4 0.67 14.45 0.679 0.69 0.503 0.564 -1.33 -2.90 33.20 18.79 [3] 423.15 26.1 0.71 14.35 0.693 0.706 0.522 0.582 2.45 0.57 36.02 21.99 [3] 423.15 26.4 1.32 17.32 1.271 1.338 1.143 1.229 3.86 -1.35 15.49 7.40 [3] 423.15 26.1 1.32 17.2 1.287 1.355 1.162 1.247 2.56 -2.58 13.60 5.85 [3, 12] 423.15 34.6 0.61 20.13 0.568 0.546 0.36 0.478 7.39 11.72 69.44 27.62 [3, 12] 423.15 32.3 0.73 18.87 0.722 0.727 0.523 0.627 1.11 0.41 39.58 16.43 [3, 12] 423.15 34.6 1.25 24.25 1.184 1.207 1.063 1.222 5.57 3.56 17.59 2.29 [3, 12] 423.15 32.3 1.37 22.39 1.295 1.347 1.169 1.308 5.79 1.71 17.19 4.74 [47] 296.15 24.3 1.5 4.21 1.635 1.626 1.692 1.717 -8.26 -7.75 -11.35 -12.64 [48] 296 24.3 1.5 4.21 1.671 1.63 1.696 1.722 -10.23 -7.98 -11.56 -12.89 RMS 4.96 9.98 18.20 10.06 BIAS 0.17 8.81 8.29 1.75 AAD 3.76 10.65 12.37 7.71 A: old PROFISSY, v 0.42; B: present model, Helmholtz; C: present model original PR; D: present model, t-PR

42
This publication is available free of charge from: https://doi.org/10.6028/N
IST.TN.2132
Table 17. Comparisons of filling by pressure calculations for nitrogen/R-236fa mixtures.
Ref. T, K Mass Agent, g
Mass N2, g
pexp, MPa
mN2,cal, g, A
mN2,cal, g, B
mN2,cal, g, C
mN2,cal, g, D
% Dev., A
% Dev., B
% Dev., C
% Dev., D
[47] 296.15 24.8 1.9 4.27 2.107 2.144 2.177 2.174 -9.82 -11.38 -12.72 -12.60 RMS 0.00 0.00 0.00 0.00 BIAS -9.82 -11.38 -12.72 -12.60 AAD 9.82 11.38 -12.72 12.60 A: old PROFISSY, v 0.42; B: present model, Helmholtz; C: present model original PR; D: present model, t-PR

43
This publication is available free of charge from: https://doi.org/10.6028/N
IST.TN.2132
Conclusions
A program for bottle filling calculations for eleven fire-suppressant agents was developed. The agents include R-13I1, R-218, R-125, R-227ea, R-13B1, R-236fa, HFE-7100, Novec 649 (also known as Novec 1230 and FK-5-1-12)), R-1233zd(E), R-1336mzz(Z), and R1336-mzz(E)). The program is contained in an Excel spreadsheet, called PROFISSY v1.0. It replaces an unsupported earlier DOS program also known as PROFISSY, with the latest legacy version being 0.42. The new program is more sustainable than the previous one since it relies on a NIST Standard reference database, REFPROP (NIST SRD 23) for property calculations, and it is in a more modern format. The new program reproduces the functionality of the older program and has additional features such as the ability to pressurize with carbon dioxide in addition to nitrogen, and the ability to add solid sodium bicarbonate powder to the calculations. One may also add new fluids as long as they are compatible with REFPROP. There are two main calculations, provided as Excel worksheets, that allow (A) calculations to fill by mass (the user provides the mass of agent and the mass of pressurizing fluid, the vessel volume, and the filling temperature) and (B) calculations to fill by pressure (the user provides the agent mass, the filling pressure, the vessel volume, and the filling temperature). The output includes the conditions at filling, the conditions where the vessel may become single phase, and the ability to generate tables at a series of temperatures. We hope that this work provides a useful tool for researchers involved in the search for environmentally friendly, yet effective fire suppressant systems.
44
This publication is available free of charge from: https://doi.org/10.6028/N
IST.TN.2132
Acknowledgements
The authors thank Prof. Ryo Akasaka of Kyushu Sangyo University, Fukuoka, Japan for sharing his preliminary data sets and the equation of state for R-1336mzz(E). We also thank Dr. Kehui Gao of Xi’an Jiaotong University, Xi’an Shaanxi, China for her preliminary equation of state for R-13B1, and Dr. Yong Zhou of Xi’an Jiaotong University, Xi’an Shaanxi, China for his preliminary equation of state for HFE-7100. In addition, we thank Prof. C. Kondou of Nagasaki University, Nagasaki, Japan for providing a preliminary model for the surface tension of R-1336mzz(E) based on her unpublished preliminary experimental data. We thank our NIST colleague Dr. Ian Bell for providing interaction parameters for mixtures of nitrogen with R1234yf and Novec 649. We thank Dr. Steven Hodges, USARMY Futures Command, for many helpful comments and recommendations. Finally, we thank the US Army GVSC for providing funding for this project under interagency agreement number 11478007.
References
[1] Grosshandler, WL, Gann, RG, Pitts, WM (Eds.) (1994) NIST Special Publication
861, Evaluation of alternative in-flight fire suppressants for full-scale testing in simulated aircraft engine nacelles and dry bays (US Department of Commerce, Washington, DC).
[2] Gann, RG (Ed.) (1995) NIST Special Publication 890, Fire Suppression System Performance of Alternative Agents in Aircraft Engine and Dry Bay Laboratory Simulations (US Department of Commerce, Washington, DC), Vol. I,II.
[3] Yang JC, Vazques I, Boyer CI, Huber ML, Weber L (1997) Measured and predicted thermodynamic properties of selected halon alternative/nitrogen mixtures. Int J Refrig 20(2):96-105.
[4] Ely JF (1984) Application of the Extended Corresponding States Model to Hydrocarbon Mixtures. Proceedings of the 63rd Annual Gas Processors Association Meeting, pp 9-22.
[5] Ely JF , Hanley HJM (1981) Prediction of transport properties. 1. Viscosity of fluids and mixtures. Ind Eng Chem Fundam 20(4):323-332.
[6] Ely JF , Hanley HJM (1983) Prediction of transport properties. 2. Thermal conductivity of pure fluids and mixtures. Ind Eng Chem Fundam 22(1):90-97.
[7] Ely JF , Magee JW (1989) Experimental Measurement and Prediction of Thermophysical Property Data of Carbon Dioxide Rich Mixtures. Proceedings of the 68th GPA Annual Convention, pp 89-99.
[8] Huber ML (2007) NIST Thermophysical Properties of Hydrocarbon Mixtures, NIST4, (SuperTRAPP), v3.2.1National Institute of Standards and Technology, Gaithersburg, MD)
[9] Huber ML , Ely JF (1992) Prediction of the Viscosity of Refrigerants and Refrigerant Mixtures. Fluid Phase Equilib 80:239-248.
[10] Huber ML , Ely JF (1992) Prediction of the Thermal Conductivity of Refrigerants and Refrigerant Mixtures. Fluid Phase Equilib 80:249-261.
[11] Peng D-Y , Robinson DB (1976) A new Two-Constant Equation of State. Ind Eng Chem Fundam 15(1):59-64.

45
This publication is available free of charge from: https://doi.org/10.6028/N
IST.TN.2132
[12] Yang JC, Huber ML, Boyer CI (1995) A model for calculating alternative agent/nitrogen thermodynamic properties. Halon Options Technical Working Conference, May 9-11.
[13] Lemmon EW, Bell IH, Huber ML, McLinden MO (2018) NIST Standard Reference Database 23, NIST Reference Fluid Thermodynamic and Transport Properties Database (REFPROP): Version 10.0 (Standard Reference Data Program, National Institute of Standards and Technology, Gaithersburg, MD)
[14] Lemmon EW, McLinden MO, Wagner W (2009) Thermodynamic Properties of Propane. III. A Reference Equation of State for Temperatures from the Melting Line to 650 K and Pressures up to 1000 MPa. J Chem Eng Data 54:3141-3180.
[15] Lemmon EW , Span R (2015) Thermodynamic Properties of R‑227ea, R‑365mfc, R‑115, and R-13I1. J Chem Eng Data 60:3745-3758. https://doi.org/DOI: 10.1021/acs.jced.5b00684
[16] Kunz O , Wagner W (2012) The GERG-2008 Wide-Range Equation of State for Natural Gases and Other Mixtures: An Expansion of GERG-2004. J Chem Eng Data 57(11):3032-3091. https://doi.org/10.1021/je300655b
[17] McLinden MO , Huber ML (2020) (R)Evolution of Refrigerants. J Chem Eng Data 65(9):4176-4193. https://doi.org/https://doi.org/10.1021/acs.jced.0c00338
[18] https://www.nist.gov/srd/refprop [19] van der Waals JD (1873) De Continuiteit van den Gas-En Vloeisoftoestand. (Doctoral
Thesis, Hoogeschool te Leiden, Leiden). Available at [20] Lopez-Echeverry JS, Reif-Acherman S, Araujo-Lopez E (2017) Peng-Robinson
equation of state: 40 years through cubics. Fluid Phase Equilib 447:39-71. https://doi.org/10.1016/j.fluid.2017.05.007
[21] Péneloux A, Rauzy E, Fréze R (1982) A consistent correction for Redlich-Kwong-Soave volumes. Fluid Phase Equilib 8:7-23. https://doi.org/10.1016/0378-3812(82)80002-2
[22] Pfohl O (1999) Evaluation of an improved volume translation for the prediction ofhydrocarbon volumetric properties. Fluid Phase Equilib 163:157-159.
[23] Magoulas K , Tassios D (1990) Thermophysical properties of n-Alkanes from C1 to C20 and their prediction for higher ones. Fluid Phase Equilib 56:119-140. https://doi.org/https://doi.org/10.1016/0378-3812(90)85098-U
[24] McLinden MO, Perkins RA, Lemmon EW, Fortin TJ (2015) Thermodynamic Properties of 1,1,1,2,2,4,5,5,5-Nonafluoro-4-(trifluoromethyl)-3-pentanone: Vapor Pressure, (p, rho, T) Behavior, and Speed of Sound Measurements, and an Equation of State. J Chem Eng Data 60:3646-3659.
[25] Lemmon EW , Span R (2006) Short Fundamental Equations of State for 20 Industrial Fluids. J Chem Eng Data 51:785-850.
[26] Lemmon EW , Jacobsen RT (2004) Equations of State for Mixtures of R-32, R-125, R-134a, R-143a, and R-152a. J Phys Chem Ref Data 33(2):593-620.
[27] Lemmon EW , Jacobsen RT (2005) A New Functional Form and New Fitting Techniques for Equations of State with Application to Pentafluoroethane (HFC-125). J Phys Chem Ref Data 34(1):69-108. https://doi.org/https://aip.scitation.org/doi/10.1063/1.1797813
[28] Span R (2000) Multiparameter Equations of State (Springer, Berlin, Germany).

46
This publication is available free of charge from: https://doi.org/10.6028/N
IST.TN.2132
[29] Nishiumi H, Arai T, Takeuchi K (1988) Generalization of the binary interaction parameter of the Peng-Robinson equation of state by component family. Fluid Phase Equilib 42:43-62. https://doi.org/https://doi.org/10.1016/0378-3812(88)80049-9
[30] Valderrama JO , Reyes LR (1983) Vapor-liquid equilibrium of hydrogen-containing mixtures. Fluid Phase Equilib 13:195-202. https://doi.org/https://doi.org/10.1016/0378-3812(83)80094-6
[31] Lemmon EW (1996) A generalized model for the prediction of the thermodynamic properties of mixtures including vapor-liquid equilibrium. (PhD Thesis, Mechanical Engineering Dept., University of Idaho, Moscow, ID).
[32] Tillner-Roth R (1993) Die thermodynamischen Eigenschaften von R 152a, R 134a und ihren Gemischen-Messungen und Fundamentalgleichungen. (Institut für Thermodynamik, Universität Hannover, Germany).
[33] Kunz O, Klimeck R, Wagner W, Jaeschke M (2007) The GERG-2004 wide-range equation of stet for natural gases and other mixtures. GERG Technical Monograph 15, https://wwwgergeu/wp-content/uploads/2019/10/TM15pdf.
[34] Lemmon EW , McLinden MO (2001) Method for estimating mixture equation of state parameters. IIF-IIR Commission B1, (Paderborn, Germany).
[35] Lim JS , Kim JD (1997) Vapor-liquid equilibria of the binary systems nitrogen plus bromotrifluoromethane, plus bromochlorodifluoromethane, plus 1,1,1,2,3,3,3-heptafluoropropane, and plus trifluoroidomethane from 293.2 to 313.2 K and 30 to 100 bar. J Chem Eng Data 42(1):112-115. https://doi.org/10.1021/je960239o
[36] Chen L (2015) Investigation on the feasability of Trifluoroiodomethane (CF3I) for application in gas-insulated lines. (Cardiff University, Wales, UK). Available at
[37] Linnemann M , Vrabec J (2017) Vapor−Liquid Equilibria of Nitrogen + Diethyl Ether and Nitrogen +1,1,1,2,2,4,5,5,5-Nonafluoro-4-(trifluoromethyl)-3-pentanone by Experiment, Peng−Robinson and PC-SAFT Equations of State. J Chem Eng Data 62:2110-2114. https://doi.org/DOI: 10.1021/acs.jced.7b00217
[38] Bell IH , Lemmon EW (2016) Automatic fitting of binary interaction paramters for multi-fluid Helmholtz-energy-explicit mixture models. J Chem Eng Data 61(11):3752-3760. https://doi.org/https://pubs.acs.org/doi/10.1021/acs.jced.6b00257
[39] Lemmon EW , Jacobsen RT (1999) A Generalized Model for the Thermodynamic Properties of Mixtures. Int J Thermophys 20:825-835.
[40] Gernert GJ (2013) A new Helmholtz energy model for humid gases and CCS mixtures. (PhD Thesis, Ruhr-Universität Bochum, Germany). Available at
[41] Kochenburger TM, Gomse D, Tratschitt I, Zimmermann A, Grohmann S (2017) Vapor-liquid and vapor-liquid-liquid equilibrium measurements and correlation of the binary mixtures 2,3,3,3-tetrafluoroprop-1-ene (R1234yf) + (tetrafluoromethane (R14), trifluoromethane (R23), octafluoropropane (R218), nitrogen (R728) and argon (R740)) and ethane (R170) + trifluoromethane (R23). Fluid Phase Equilib 450:13-23. https://doi.org/10.1016/j.fluid.2017.07.002
[42] (2016) DIPPR DIADEM Professional, Version 8.1.0, Sponsor version (May 2016) (Brigham Young University,
[43] EUREQA Formulize (Nutonian Inc., Cambridge MA, USA) [44] Chemicals C (Sodium Bicarbonate. Available at
https://cameochemicals.noaa.gov/chemical/21013.

47
This publication is available free of charge from: https://doi.org/10.6028/N
IST.TN.2132
[45] (2020) personal communication to M. Huber from S. Hodges, US Army Futures Command.
[46] Chai Kao C-P , Miller RN (2001) Determination of nitrogen solubility in superpressurized HFC227ea, HFC236fa and HFC 125. Halon Options Technical Working Conference, pp 226-234.
[47] Yang JC , Breuel BD (1994) Chapter 2, Thermodynamic Properties of Alternative Agents, in NIST Special Publication 861, Evaluation of alternative in-flight fire suppressants for full-scale testing in simulated aircraft engine nacelles and dry bays. eds Grosshandler WL, Gann RG, & Pitts WM (US Department of Commerce, Washington, DC).
[48] Yang JC, Breuel BD, Grosshandler WL (1993) Solubilities of nitrogen and Freon-23 in alternatives halon replacement agents. Halon Alternatives Technical Working Conference, pp 105-114.
[49] McDonald RA, Shrader SA, Stull DR (1959) Vapor Pressures and Freezing Points of 30 Organics. J Chem Eng Data 4(4):311-313.
[50] Perel'shtein II , Aleshin YP (1971) Experimental Study of the Thermodynamic Properties of Freon 13B1. Teplofiz Svoistva Vesh Mater 4:50-64.
[51] Kuznetsov AP, Egorov AV, Los LV (1972) Thermodynamic Analysis of Phase Equilibriums of a Binary Mixture of Refrigerants (F-22-F-13V1). Kholod Tekh Tekhnol 15:66-69.
[52] Takagi T , Teranishi H (1986) Ultrasonic Speed in Liquid Phase of Bromotrifluoromethane (R13B1) under High Pressures. J Chem Eng Data 31(3):291-293.
[53] Okano T, Uematsu M, Watanabe K (1987) Compression factor and vapor pressure of bromotrifluoromethane in th temperature range 245-393 K at pressures up to 12 MPa. Int J Thermophys 8(2):217-229.
[54] Kleiber M (1994) Vapor-liquid equilibria of binary refrigerant mixtures containing propylene or R134a. Fluid Phase Equilib 92:149-194.
[55] Geller ZI, Nikul'shin RK, Zatvornitskii YG (1969) Densities of brominated freons. Zh Prikl Khim 42(5):1121-1125.
[56] Geller VZ, Porichanskii EG, Svetlichnyi PI, El'kin YG (1980) Density of some liquid Freons at the saturation line. Kholod Tekhn:42-44.
[57] Solov'ev GV, Shavandrin AM, Chashkin YP (1981) Refrigerants 23 and 13B1. Density of Saturated Liquid and Vapor. Heat of Vaporization and Heat Capacity of the Saturated Liquid. Tablyzyi Rekomendovannyikh Spravochnyikh Dannyikh:29-81.
[58] Takaishi Y , Oguchi K (1984) Nippon Reito Kyokai Ronbunshu:25-28. [59] Higashi Y, Uematsu M, Watanabe K (1985) Measurements of the Vapor-liquid
Coexistence Curve and Determination of the Critical Parameters for Refrigerant 13B1. Bull JSME 28:2660-2666.
[60] Eiseman BJ (1952) Pressure-Volume-Temperature Properties of the Freon Compounds. Refrig Eng 60:496-503.
[61] El'kin YG (1980) Experimental Investigation of The Thermal Properties of Some Freons of the Methane Type at Low Temperatures. (Grozny Petroleum Institute, Grozny, USSR). Available at
[62] Takahashi M, Yokoyama C, Takahashi S (1987) Viscosities of Gaseous R13B1, R142b, and R152a. J Chem Eng Data 32(1):98-103.
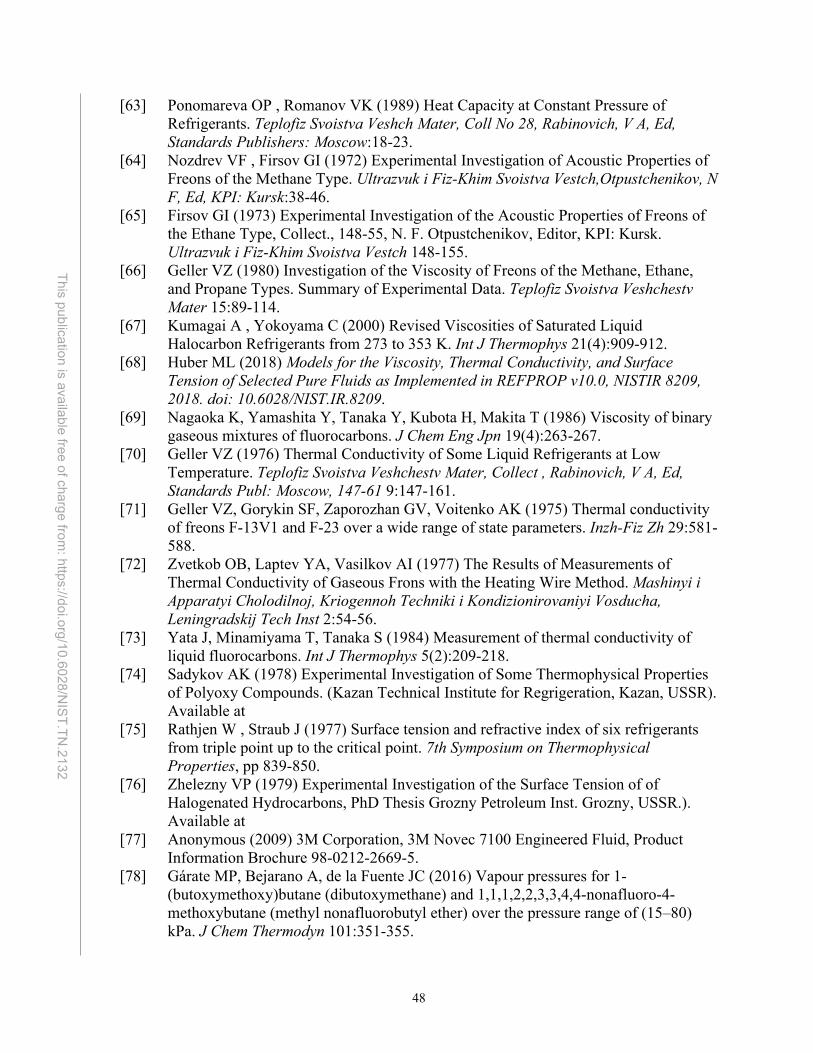
48
This publication is available free of charge from: https://doi.org/10.6028/N
IST.TN.2132
[63] Ponomareva OP , Romanov VK (1989) Heat Capacity at Constant Pressure of Refrigerants. Teplofiz Svoistva Veshch Mater, Coll No 28, Rabinovich, V A, Ed, Standards Publishers: Moscow:18-23.
[64] Nozdrev VF , Firsov GI (1972) Experimental Investigation of Acoustic Properties of Freons of the Methane Type. Ultrazvuk i Fiz-Khim Svoistva Vestch,Otpustchenikov, N F, Ed, KPI: Kursk:38-46.
[65] Firsov GI (1973) Experimental Investigation of the Acoustic Properties of Freons of the Ethane Type, Collect., 148-55, N. F. Otpustchenikov, Editor, KPI: Kursk. Ultrazvuk i Fiz-Khim Svoistva Vestch 148-155.
[66] Geller VZ (1980) Investigation of the Viscosity of Freons of the Methane, Ethane, and Propane Types. Summary of Experimental Data. Teplofiz Svoistva Veshchestv Mater 15:89-114.
[67] Kumagai A , Yokoyama C (2000) Revised Viscosities of Saturated Liquid Halocarbon Refrigerants from 273 to 353 K. Int J Thermophys 21(4):909-912.
[68] Huber ML (2018) Models for the Viscosity, Thermal Conductivity, and Surface Tension of Selected Pure Fluids as Implemented in REFPROP v10.0, NISTIR 8209, 2018. doi: 10.6028/NIST.IR.8209.
[69] Nagaoka K, Yamashita Y, Tanaka Y, Kubota H, Makita T (1986) Viscosity of binary gaseous mixtures of fluorocarbons. J Chem Eng Jpn 19(4):263-267.
[70] Geller VZ (1976) Thermal Conductivity of Some Liquid Refrigerants at Low Temperature. Teplofiz Svoistva Veshchestv Mater, Collect , Rabinovich, V A, Ed, Standards Publ: Moscow, 147-61 9:147-161.
[71] Geller VZ, Gorykin SF, Zaporozhan GV, Voitenko AK (1975) Thermal conductivity of freons F-13V1 and F-23 over a wide range of state parameters. Inzh-Fiz Zh 29:581-588.
[72] Zvetkob OB, Laptev YA, Vasilkov AI (1977) The Results of Measurements of Thermal Conductivity of Gaseous Frons with the Heating Wire Method. Mashinyi i Apparatyi Cholodilnoj, Kriogennoh Techniki i Kondizionirovaniyi Vosducha, Leningradskij Tech Inst 2:54-56.
[73] Yata J, Minamiyama T, Tanaka S (1984) Measurement of thermal conductivity of liquid fluorocarbons. Int J Thermophys 5(2):209-218.
[74] Sadykov AK (1978) Experimental Investigation of Some Thermophysical Properties of Polyoxy Compounds. (Kazan Technical Institute for Regrigeration, Kazan, USSR). Available at
[75] Rathjen W , Straub J (1977) Surface tension and refractive index of six refrigerants from triple point up to the critical point. 7th Symposium on Thermophysical Properties, pp 839-850.
[76] Zhelezny VP (1979) Experimental Investigation of the Surface Tension of of Halogenated Hydrocarbons, PhD Thesis Grozny Petroleum Inst. Grozny, USSR.). Available at
[77] Anonymous (2009) 3M Corporation, 3M Novec 7100 Engineered Fluid, Product Information Brochure 98-0212-2669-5.
[78] Gárate MP, Bejarano A, de la Fuente JC (2016) Vapour pressures for 1-(butoxymethoxy)butane (dibutoxymethane) and 1,1,1,2,2,3,3,4,4-nonafluoro-4-methoxybutane (methyl nonafluorobutyl ether) over the pressure range of (15–80) kPa. J Chem Thermodyn 101:351-355.

49
This publication is available free of charge from: https://doi.org/10.6028/N
IST.TN.2132
[79] An B, Duan Y, Tan L, Yang Z (2015) Vapor Pressure of HFE 7100. J Chem Eng Data 60:1206-1210.
[80] Marchionni G, Maccone P, Pezzin G (2002) Thermodynamic and other physical properties of several hydrofluoro-compounds. J Fluorine Chem 118:149-155.
[81] An B, Duan Y, Yang F, Yang Z (2015) pvT Property of HFE 7100 in the Gaseous Phase. J Chem Eng Data 60:3289-3295.
[82] Rausch MH, Kretschmer L, Will S, Leipertz A, Fröba AP (2015) Density, Surface Tension, and Kinematic Viscosity of Hydrofluoroethers HFE-7000, HFE-7100, HFE-7200, HFE-7300, and HFE-7500. J Chem Eng Data 60(12):3759-3765.
[83] Muñoz-Rujas N, Aguilar F, Bazile J-P, Montero EA (2016) Liquid density of mixtures Methyl nonafluorobutyl ether (HFE-7100) þ 2-propanol at pressures up to 140 MPa and temperatures from 298.15 K to 393.15 K. Fluid Phase Equilib 429:281-292.
[84] Piñeiro MM, Bessières D, Legido JL, Saint-Guirons H (2003) PrT Measurements of Nonafluorobutyl Methyl Ether and Nonafluorobutyl Ethyl Ether between 283.15 and 323.15 K at Pressures up to 40 MPa. Int J Thermophys 24(5):1265-1276.
[85] Zheng Y, Wei Z, Song X (2016) Measurements of isobaric heat capacities for HFE-7000 and HFE-7100 at different temperatures and pressures. Fluid Phase Equilib 425:335-341.
[86] Piñeiro MM, Plantier F, Bessières D, Legido JL, Daridon JL (2004) High-pressure speed of sound measurements in methyl nonafluorobutyl ether and ethyl nonafluorobutyl ether. Fluid Phase Equilib 222-223:297-302.
[87] Hu X, Meng X, Wei K, Li W, Wu J (2015) Compressed Liquid Viscosity Measurements of HFE-7000, HFE-7100, HFE-7200, and HFE-7500 at Temperatures from (253 to 373) K and Pressures up to 30 MPa. J Chem Eng Data 60:3562-3570.
[88] Kho YW, Conrad DC, Knutson BL (2003) Phase equilibria and thermophysical properties of carbon dioxide-expanded fluorinated solvents. Fluid Phase Equilib 206:179-193.
[89] Chung TH, Ajlan L, Lee LL, Starling KE (1988) Generalized multiparameter correlation for nonpolar and polar fluid transport properties. Ind Eng Chem Res 27:671-679.
[90] Tanaka K, Ishikawa J, Kontomaris KK (2017) Thermodynamic properties of HFO-1336mzz(E) (trans-1,1,1,4,4,4-hexafluoro-2-butene) at saturation conditions. Int J Refrig 82:283-287.
[91] Raabe G (2015) Molecular Simulation Studies on the Vapor-Liquid Equilibria of the cis- and trans-HCFO-1233zd and the cis- and trans-HFO-1336mzz. J Chem Eng Data 60:2412-2419.
[92] Tanaka K, Ishikawa J, Kontomaris KK (2017) pρT Property of HFO-1336mzz(E) (trans-1,1,1,4,4,4-Hexafluoro-2-butene). J Chem Eng Data 62:2450-2453.
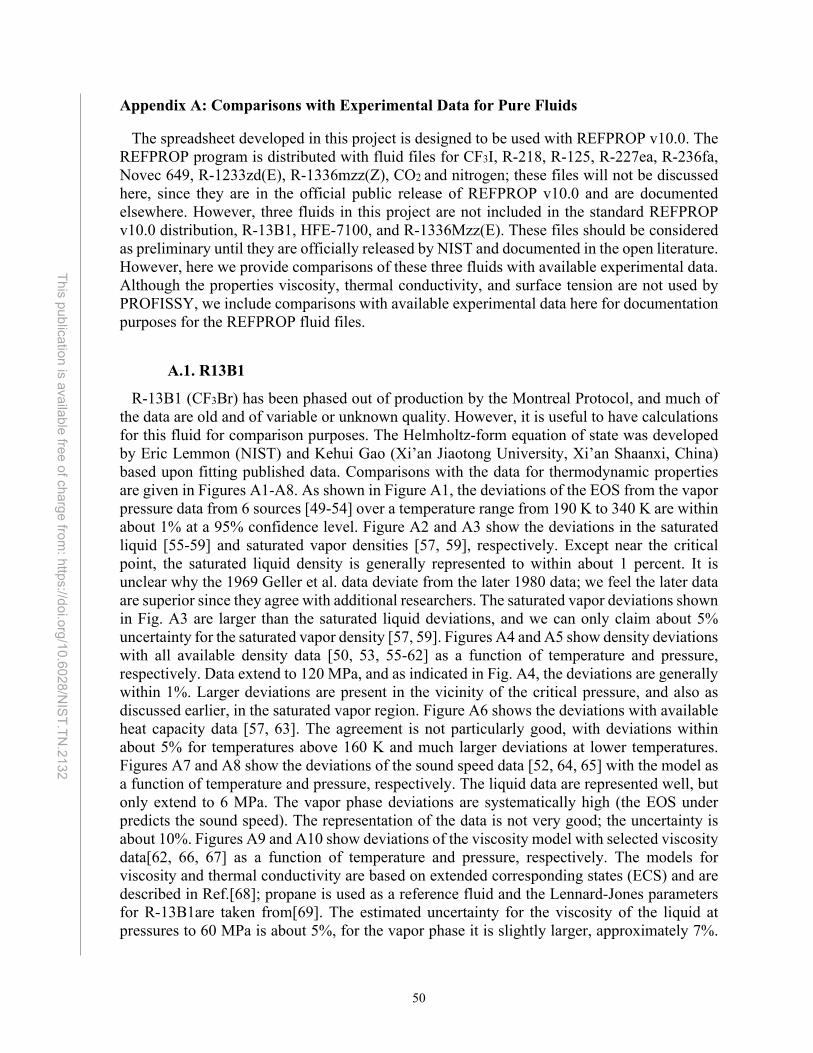
50
This publication is available free of charge from: https://doi.org/10.6028/N
IST.TN.2132
Appendix A: Comparisons with Experimental Data for Pure Fluids
The spreadsheet developed in this project is designed to be used with REFPROP v10.0. The REFPROP program is distributed with fluid files for CF3I, R-218, R-125, R-227ea, R-236fa, Novec 649, R-1233zd(E), R-1336mzz(Z), CO2 and nitrogen; these files will not be discussed here, since they are in the official public release of REFPROP v10.0 and are documented elsewhere. However, three fluids in this project are not included in the standard REFPROP v10.0 distribution, R-13B1, HFE-7100, and R-1336Mzz(E). These files should be considered as preliminary until they are officially released by NIST and documented in the open literature. However, here we provide comparisons of these three fluids with available experimental data. Although the properties viscosity, thermal conductivity, and surface tension are not used by PROFISSY, we include comparisons with available experimental data here for documentation purposes for the REFPROP fluid files.
A.1. R13B1
R-13B1 (CF3Br) has been phased out of production by the Montreal Protocol, and much of the data are old and of variable or unknown quality. However, it is useful to have calculations for this fluid for comparison purposes. The Helmholtz-form equation of state was developed by Eric Lemmon (NIST) and Kehui Gao (Xi’an Jiaotong University, Xi’an Shaanxi, China) based upon fitting published data. Comparisons with the data for thermodynamic properties are given in Figures A1-A8. As shown in Figure A1, the deviations of the EOS from the vapor pressure data from 6 sources [49-54] over a temperature range from 190 K to 340 K are within about 1% at a 95% confidence level. Figure A2 and A3 show the deviations in the saturated liquid [55-59] and saturated vapor densities [57, 59], respectively. Except near the critical point, the saturated liquid density is generally represented to within about 1 percent. It is unclear why the 1969 Geller et al. data deviate from the later 1980 data; we feel the later data are superior since they agree with additional researchers. The saturated vapor deviations shown in Fig. A3 are larger than the saturated liquid deviations, and we can only claim about 5% uncertainty for the saturated vapor density [57, 59]. Figures A4 and A5 show density deviations with all available density data [50, 53, 55-62] as a function of temperature and pressure, respectively. Data extend to 120 MPa, and as indicated in Fig. A4, the deviations are generally within 1%. Larger deviations are present in the vicinity of the critical pressure, and also as discussed earlier, in the saturated vapor region. Figure A6 shows the deviations with available heat capacity data [57, 63]. The agreement is not particularly good, with deviations within about 5% for temperatures above 160 K and much larger deviations at lower temperatures. Figures A7 and A8 show the deviations of the sound speed data [52, 64, 65] with the model as a function of temperature and pressure, respectively. The liquid data are represented well, but only extend to 6 MPa. The vapor phase deviations are systematically high (the EOS under predicts the sound speed). The representation of the data is not very good; the uncertainty is about 10%. Figures A9 and A10 show deviations of the viscosity model with selected viscosity data[62, 66, 67] as a function of temperature and pressure, respectively. The models for viscosity and thermal conductivity are based on extended corresponding states (ECS) and are described in Ref.[68]; propane is used as a reference fluid and the Lennard-Jones parameters for R-13B1are taken from[69]. The estimated uncertainty for the viscosity of the liquid at pressures to 60 MPa is about 5%, for the vapor phase it is slightly larger, approximately 7%.

51
This publication is available free of charge from: https://doi.org/10.6028/N
IST.TN.2132
Similarly, the deviations with selected thermal conductivity data[70-74] are shown in Fig. A11 and A12. The liquid phase is generally represented to within 3% at pressures to 60 MPa. The saturated vapor data of Zvetkob et al.[72] are represented to within 4%; however the supercritical data and near critical data of Geller et al.[71] show larger deviations; in this region the estimated uncertainty is 15%. A dedicated thermal conductivity model, rather than an ECS model may be better able to capture the variation of supercritical thermal conductivity. Finally, Fig. A13 shows the deviations of the surface tension model (described in[68] with the data of Rathjen and Straub[75] and with the limited data of Zhelezny[76]. At temperatures below 310 K, the estimated uncertainty is 2%.
Figure A1. Deviations for vapor pressure for R-13B1.

52
This publication is available free of charge from: https://doi.org/10.6028/N
IST.TN.2132
Figure A2. Deviations for saturated liquid density for R-13B1.

53
This publication is available free of charge from: https://doi.org/10.6028/N
IST.TN.2132
Figure A3. Deviations for saturated vapor density for R-13B1.

54
This publication is available free of charge from: https://doi.org/10.6028/N
IST.TN.2132
Figure A4. Deviations for all density points for R-13B1 as a function of temperature.
55
This publication is available free of charge from: https://doi.org/10.6028/N
IST.TN.2132
Figure A5. Deviations for all density points for R-13B1 as a function of pressure.
56
This publication is available free of charge from: https://doi.org/10.6028/N
IST.TN.2132
Figure A6. Deviations for heat capacity for R-13B1 as a function of temperature.

57
This publication is available free of charge from: https://doi.org/10.6028/N
IST.TN.2132
Figure A7. Deviations for speed of sound for R-13B1 as a function of temperature.

58
This publication is available free of charge from: https://doi.org/10.6028/N
IST.TN.2132
Figure A8. Deviations for speed of sound for R-13B1 as a function of pressure.

59
This publication is available free of charge from: https://doi.org/10.6028/N
IST.TN.2132
Figure A9. Deviations for Viscosity of R-13B1 as a function of temperature.

60
This publication is available free of charge from: https://doi.org/10.6028/N
IST.TN.2132
Figure A10. Deviations for Viscosity of R-13B1 as a function of pressure.

61
This publication is available free of charge from: https://doi.org/10.6028/N
IST.TN.2132
Figure A11. Deviations for Thermal Conductivity of R-13B1 as a function of temperature.

62
This publication is available free of charge from: https://doi.org/10.6028/N
IST.TN.2132
Figure A12. Deviations for Thermal Conductivity of R-13B1 as a function of pressure.

63
This publication is available free of charge from: https://doi.org/10.6028/N
IST.TN.2132
Figure A13. Deviations for Surface Tension of R-13B1 as a function of temperature. A.2 HFE-7100
HFE-7100, 1-methoxy-1,1,2,2,3,3,4,4,4-nonafluorobutane, is a highly fluorinated ether with a low GWP, zero ODP, nonflammable, and low toxicity. It also is known as RE-449mccc. It actually is a mix of two inseparable isomers (CF3)2CFCF2OCH3 (CAS 163702-08-7) and CF3CF2CF2CF2OCH3 (CAS 163702-07-6)[77]. The REFPROP file treats it as the pure fluid, not a mixture of isomers. The Helmholtz-form equation of state was developed by Eric Lemmon (NIST) and Yong Zhou of Xi’an Jiaotong University, Xi’an Shaanxi, China and is based upon fitting published data. Comparisons with the data for thermodynamic properties are given in Figures A14-A19. As shown in Figure A14, the deviations of the EOS from the vapor pressure data from 4 literature sources [78-81] source over a temperature range from 300 K to 432 K are within about 0.4% at a 95% confidence, and higher at lower temperatures. The normal boiling point for this fluid is 332.96 K from the EOS. Figure A15 and A16 show the deviations in the density as a function of temperature and pressure respectively. The data of Rausch et al.[82] are for the saturated liquid, the 2015 data of An et al.[81] are in the vapor phase, and all other data are for the liquid phase. The data of Munoz-Rujas et al.[83] cover a wide range of conditions extending to 140 MPa for temperatures from 298 K to 393 K. The data of Pineiro et al. [84] at 288.15 K appear to be systematically lower than the other data in this set as well as the other data sets and we suspect the data for this particular isotherm is in error. We estimate that the uncertainty of the density in the liquid phase is 0.2 % for pressures up to 140 MPa for temperatures from 273 K to 393 K. For the vapor phase the estimated

64
This publication is available free of charge from: https://doi.org/10.6028/N
IST.TN.2132
uncertainty is higher, about 3 % for 363 K to 431 K for pressures up to 0.9 MPa. Figure A17 shows the deviations with available heat capacity data. The agreement is very poor, on the order of 20 %. The temperature dependence seems much too strong compared to another similar HFE, RE-347mcc (1,1,1,2,2,3,3-Heptafluoro-3-methoxypropane). In addition, we had access to proprietary manufacturer data that also differed greatly from the data of Zheng et al. [85] and agrees with the EOS to within about 2%. We feel the Zheng et al.[85] data are in error and did not use them in the fitting process. The fitting procedure can use speed of sound data instead of heat capacity data if heat capacity data are unavailable; in this case there are speed of sound data [86]. Figures A18 and A19 show the deviations of the speed of sound data of Pineiro et al.[86] as a function of temperature and pressure. Based on comparisons with this data set, the estimated uncertainty for liquid phase speed of sound is 0.7 % for temperatures from 283 K to 323 K, and pressures up to 100 MPa. Figures A20 and A21 show the deviations between experimental viscosity data [82, 87, 88] and the model developed in this work. The models for viscosity and thermal conductivity are based on extended corresponding states (ECS) and are described in Ref. [68]; propane is used as a reference fluid and the Lennard-Jones parameters for HFE-7100 are found using the method of Chung et al.[89]. We primarily used the measurements of Hu et al.[87] that cover the liquid phase at pressures to 30 MPa. The data of Rausch et al.[82] appear to have a systematic offset of about 5 %. The estimated uncertainty for viscosity in the liquid phase at pressures up to 30 MPa is 3%. We were unable to locate measurement in the gas phase and estimate the uncertainty to be 20%. The thermal conductivity was fit to limited atmospheric pressure, proprietary data from the manufacturer. The estimated uncertainty of the thermal conductivity is 3% at temperatures from 223 K to 323 K at atmospheric pressure. The surface tension was fit to the data of Rausch et al.[82] and deviations are shown in Figure A22. The estimated uncertainty of the surface tension model is 1.5% at temperatures up to 373 K.

65
This publication is available free of charge from: https://doi.org/10.6028/N
IST.TN.2132
Figure A14. Deviations for vapor pressure for HFE-7100.

66
This publication is available free of charge from: https://doi.org/10.6028/N
IST.TN.2132
Figure A15. Deviations for density for HFE-7100 as a function of temperature.

67
This publication is available free of charge from: https://doi.org/10.6028/N
IST.TN.2132
Figure A16. Deviations for density for HFE-7100 as a function of pressure.

68
This publication is available free of charge from: https://doi.org/10.6028/N
IST.TN.2132
Figure A17. Deviations for heat capacity for HFE-7100 as a function of temperature.

69
This publication is available free of charge from: https://doi.org/10.6028/N
IST.TN.2132
Figure A18. Deviations for speed of sound for HFE-7100 as a function of temperature.

70
This publication is available free of charge from: https://doi.org/10.6028/N
IST.TN.2132
Figure A19. Deviations for speed of sound for HFE-7100 as a function of pressure.

71
This publication is available free of charge from: https://doi.org/10.6028/N
IST.TN.2132
Figure A20. Deviations for viscosity of HFE-7100 as a function of temperature.

72
This publication is available free of charge from: https://doi.org/10.6028/N
IST.TN.2132
Figure A21. Deviations for viscosity of HFE-7100 as a function of pressure.

73
This publication is available free of charge from: https://doi.org/10.6028/N
IST.TN.2132
Figure A22. Deviations for surface tension of HFE-7100 as a function of temperature. A.3 R-1336mzz(E)
R-1336mzz(E), also called HFO-1336mzz(E), trans-1,1,1,4,4,4-hexafluoro-2-butene) is a relatively new fluid that is a candidate as a possible replacement fluid for R245fa due to its low GWP and high thermal stability[90]. Very few property data (experimental or simulation) on this fluid have been published to date; we located only three studies in the open literature [90-92]. The Helmholtz-form equation of state was developed by Prof. Ryo Akasaka of Kyushu Sangyo University, Fukuoka, Japan and is based upon unpublished data. In figures A23-A29 we provide comparisons with all available thermodynamic data, including the unpublished data used in the development of the equation. Figure A23 shows the deviations of the EOS from the vapor pressure data which cover the temperature range from 287 K to the critical temperature (~ 403 K)[90]. At a 95% confidence level, the estimated uncertainty is 0.25% for this range. Figure B24 shows the deviations with saturated liquid and vapor density. The saturated liquid and vapor density are represented to within about 2%. Figures A25 and A26 show the deviations in the density as a function of temperature and pressure, respectively. A wide range of conditions is covered from 310 K to 523 K at pressures up to 102 MPa. The uncertainty is about 3% up to ~50 MPa, at higher pressures the uncertainty is up to 5%. Figure A27 shows the deviations with available ideal-gas heat capacity data, and the data agree to

74
This publication is available free of charge from: https://doi.org/10.6028/N
IST.TN.2132
within 2%. Figures A28 and A29 show the deviations of the sound speed data with the model as a function of temperature and pressure, respectively. The equation is in excellent agreement with the data, with an estimated uncertainty of 0.04%; however, the data cover a very limited range of conditions (303 K to 393 K, pressures up to 0.9 MPa). The correlation for surface tension was provided by C. Kondou of Nagasaki University, Japan and is based on her preliminary unpublished data. It has an uncertainty of about 2% for temperatures less than 340 K.
Figure A23. Deviations for vapor pressure for R-1336mzz(E).

75
This publication is available free of charge from: https://doi.org/10.6028/N
IST.TN.2132
Figure A24. Deviations for saturated density for R-1336mzz(E) as a function of temperature.

76
This publication is available free of charge from: https://doi.org/10.6028/N
IST.TN.2132
Figure A25. Deviations for density for R-1336mzz(E) as a function of temperature.

77
This publication is available free of charge from: https://doi.org/10.6028/N
IST.TN.2132
Figure A26. Deviations for density for R-1336mzz(E) as a function of pressure.

78
This publication is available free of charge from: https://doi.org/10.6028/N
IST.TN.2132
Figure A27. Deviations for heat capacity for R-1336mzz(E) as a function of temperature.

79
This publication is available free of charge from: https://doi.org/10.6028/N
IST.TN.2132
Figure A28. Deviations for speed of sound for R-1336mzz(E) as a function of temperature.

80
This publication is available free of charge from: https://doi.org/10.6028/N
IST.TN.2132
Figure A29. Deviations for speed of sound for R-1336mzz(E) as a function of pressure.

81
This publication is available free of charge from: https://doi.org/10.6028/N
IST.TN.2132
Appendix B. Installation and Usage Notes
The Excel spreadsheet for PROFISSY is available at https://doi.org/10.18434/mds2-2333
B.1 Installation
In order to use the Excel spreadsheet described in this document, PROFISSY.xlsm, one must first obtain and install REFPROP v10.0 or later. This program may be obtained from NIST at the website https://www.nist.gov/srd/refprop This program is designed to be run on Windows systems, the installer will create the appropriate directories for the program. Please do not change the default installation path; the program will be installed here
C:\Program Files (x86)\REFPROP After the REFPROP program is installed, these additional files that can be obtained from https://doi.org/10.18434/mds2-2333 must be placed in the listed directories:
Files: R13B1.fld, HFE7100.fld and HMX.BNC Place in directory C:\Program Files (x86)\REFPROP\FLUIDS Please check with NIST on availability of fluid file R1336mZZE.fld. At the time of this writing distribution is limited and it is not included in the zip file. You will need administrative rights to place files in this directory. Files: REFPROP.DLL Place in directory C:\Program Files (x86)\REFPROP You will need administrative rights to place files in this directory. The spreadsheet PROFISSY.xlsm may be placed in any directory, and we recommend placing it in a different directory than REFPROP, perhaps in your documents area or other area that does not require administrative rights to access.
Note: If you have an official version of REFPROP later than 10.0 you may use the HMX.BNC and REFPROP.DLL files provided in your installation package and the fluids files provided.
B.2 Usage Notes
To run the program double click on the PROFISSY.xlsm. A yellow warning may be displayed stating “SECURITY WARNING Macros have been disabled.” Click “Enable Content”. Then select either the sheet Filling_by_Mass_Calculation, or Filling_by_Pressure_Calculation. Select an agent and a pressurizing fluid from the drop-down menus. Select units by clicking on the unit and select from the drop-down menu. Select a model from the drop-down menu. Fill in numbers for the fields in blue, then click on the Click to Calculate button. You may examine Figures 14 and 15 for sample cases to check your numbers.

82
This publication is available free of charge from: https://doi.org/10.6028/N
IST.TN.2132
Users may add new fluids provided that a REFPROP compatible fluid file is available. Go to the sheet in PROFISSY.xlsm that is labelled “Fluids”. Insert the chemical name, a synonym, and the agent name in any line after row 10. The name in the agent field must match the name of the fluid file, ie enter MyFluid in column D for a fluid file with the name MyFluid.fld. Place the fluid file in the directory C:\Program Files (x86)\REFPROP\FLUIDS. You will need administrative access to do this. In order to use the Helmholtz model, you must also modify the HMX.BNC file and provide binary interaction parameters for a mixture with nitrogen. Eq. (10,11) may be used to compute estimates if data are unavailable for fitting. The PR and t-PR models may be used without estimating binary interaction parameters, although performance may be improved if values are provided.