Embed Size (px)
Citation preview
VARIATION IN THE LOCAL STRUCTURE AND
PROPERTIES OF PAPER
Baohua Shen
A thesis submitted in confomity with the requirement for the
Degree of Master of Applied Science
Department of Chemical Engineering and Applied Chemistry
University of Toronto
O Copyright by Baohua Shen, 2000
National Library I*l of Canada Bibliothèque nationale du Canada
Acquisitions and Acquisitions et Bibliographie Services services bibliographiques
395 Wellington Street 395, rue Wellington Ottawa ON K1A ON4 ûitawaON K1AON4 Canada Canada
The author has granted a non- L'auteur a accordé une licence non exclusive licence allowing the exclusive permettant à la National L i b r q of Canada to Bibliothèque nationale du Canada de reproduce, Ioan, distniute or seil reproduire, prêter, distribuer ou copies of this thesis in microform, vendre des copies de cette thèse sous paper or electronic formats. la forme de microfiche/film, de
reproduction sur papier ou sur format électronique.
The author retains ownership of the L'auteur conserve la propriété du copyright in this thesis. Neither the droit d' auteur qui protège cette thèse. thesis nor substantial extracts fiom it Ni la thèse ni des extraits substantiels may be printed or otherwise de celle-ci ne doivent être imprimés reproduced without the author's ou autrement reproduits sans son permission. autorisation.
VARIATION IN THE LOCAL STRUCTURE AND PROPERTIES OF PAPER
Baohua Shen
A thesis submitted in conformity with the requirement for the Degree olMaster of Applied Science
Department of Chemical Engineering and Applied Chemist- University of Toronto
June 30.3000
The rupture of paper is controlled not by the mean strength. but by the
minimum strength regions in the sheet. In order to fully understand which aspect of
structure controls these weak regions and their cffect on the local strength of paper. an
effort was made to correlate variations in two microstructural features (fibre
orientation and bonded area) of the sheet with the variability of local properties. The
objective of this study was to identify if the structure varied significantly from point
to point and to attempt to correlate the structural features of paper with properties in a
deterministic way. By using a new analytical method for the estimation of fibre
orientation, a relatively strong correlation was observed between local variation in
mean fibre orientation and the local strength of paper. By considering tibre orientation
and bonding simultaneously, a relative strength mode1 was developed in this study in
order to improve the correlation between local tende strength and local structure.

ACKNOWLEDGEMENT
My work would not have been possible without the help and support of a great many
individuals. First and foremost I am indebted to my supervisors. Professor Mark T.
Kortschot and Professor Raymond H. Kwong for taking me on as an international
student. 1 appreciate their guidance. financial support and encouragement throughout the
course of my study. Working with them has been a great pleasure.
1 am grateful to the Paper Machine Consortium for financial suppon for this work.
I would like to th& al1 my friends at the Pulp & Paper Centre and also my colleagues in
the department for their advice and assistance in performing my experiments and for
making my time in the departrnent so enjoyable. Special thanks to Doctor Sanjiv Sinha
for his cooperative and constructive advice in my research. My appreciation also goes to
Kecheng Li. Haihui Lin, Xington Liu. Wei Ding. Imran, Shiang Law. Steve Hu. Afsaneh.
and Ryo Okada, for al1 their helpful discussions and encouragement.
Finally 1 appreciate my farnily. my parents and my sister. for their spiritual support and
great help at every nim throughout my Iife. To them 1 dedicate this thesis.
TABLE OF CONTENTS
Abstract
Acknowledgement
Table of Contents
List of Figures
List of Tables
Nomenclature
I Introduction
1.1 Background Overview
1.2 Hypothesis and Objectives of This Thesis
II Literature Review
S. 1 Introduction
2.2 Mesostructural Variables
2.2.1 Grammage
2.2.2 Local Fibre Orientation
2.2.2.1 Introduction
2.2.2.2 Fibre Orientation Measurement
2.2.2.3 Local Gradient Function
2.2.3 Relative Bonded Area
2.2.3.1 Introduction
2.2.3.2 Relative Bonded Area Mesurement
2.2.3.3 Bonding Index Theo. and Irnplernentation
iii
III Theoretical
Introduction
Grarnmage
Fibre Orientation Factor
3.3.1 Introduction
3.3.2 General Theory
3.3.3 Local Dominant Fibre Orientation Analysis
Relative Bonded Area
3.4.1 Introduction
3 -4.2 General Theory
3.4.3 Implementation
Relative Strength Model
IV Experimental Procedure
Preparation of Paper Specimens
Methodo logy
Grammage Measurement
Fibre Orientation Measurement
Relative Bonded Area Measurement
Microtensile Testing
V Results and Discussion
5.1 Introduction
5.2 Grammage
5.3 Relative Bonded Area
5 -3.1 Local Variations in Bonding
5.3.2 Global Variations in Bonding
5.4 Fibre Orientation
5.4.1 Local Variations in Fibre Orientation
5 A.2 Globai Variations
5.4.3 Global Images
5.5 Breaking Length Mode!
5.6 S u m a r y and Discussion
VI Conclusions and Recommendations
6.1 Conclusions
6.2 Recommendations
Reference
Appendix
Appendix A--Image Systems
Appendix B--Local Fibre Orientation MATLAB Program
Appendix C--Global Fibre Orientation MATLAB Program
Appendix D-----dNoise Macro-program
LIST OF FIGURES
Window, Siibrone and Zone 14
Transmitted Light vs. Grammage for Krafr-piilp Hundsheels 23
Bonding Index T i Tc vs. Grammage for Krnfr-pdp Handsheeis 24
The Specimen 33
Local Dominant Gradient Orientation Quiver Plot of'TMP Neivsprint
1452-26-2 (MD) in ?mm x 2mm zone 38
Local Dominant Grndienl Orienrurion Polur Nor of TMP :Vewsprinr
1452-26-2 (MD) in 2mm x Zmm zone
Microtensile testirtg
Broken and Pulled-out fibres crossing the fàiliire (ine diring the
rupture event 49
Methodology 58
Video Beia- Radiography 59
Histogram of the Threshold 60
Microtensile Specimen 60
Erample of the Calibration Ciine 62
Local Optical Meusurement 64
Microtensile Testing Machine 65
Breaking Load vs. Grammage for TMP Newsprint 1452-26-2 (CD) 68
Breuking Loud vs. Grammoge for Krafiplilp Handsheeis 68
5 3 Breaking Length vs. Grammage jbr 1432-26-2 (CD)
5.4 Breaking Length vs. Grammage for KM-pulp Handsheets
5 5 TI T, vs. Grammage for Kraj-pirlp Handsheets
5.6 TIT, vs. Grammage for T W ?iervsprinr 1452-26-2
5.7 Breaking Length vs. ( T/ T,, ) for Krofi-pulp Handshee fs
5.8 Breaking Length vs. (T / T.) for TMP :Veivsprint 1452-26-2 (CD)
5.9 Breaking Length YS. (T I T, ) for Handsheers wirh changing i w pressure
5.10 Breaking Stress vs. Coherence90 for Krafi-pttlp Hmclsheers
5.1 1 BrnC90 vs. Grammage for Kra$-prdp Handshee rs
5.12 SitrnC90vs. Grammagefor TMPiVewsprint 1452-26-2
5.1 3 C, vs. Grammage for Krafi-prlp Handsheers
5.14 C, vs. Grammagefor TMPA;eivsprinr 1452-26-2
5.15 Breaking Length vs. SumC90 for the same Hundsheet specimens as those
in Figure j. 10. birr bnsed on rhe new metltodfor local fibre orientarion
andysis
5.1 6 Breaking Lengrh vs. Cm for rhe same Handsheef specimens as those in
Figure 5. IO. but based on the neiv method for local fibre orientation
analysis
5.17 Breaking Length vs. SirmC90 for Kraft-ptrlp Handsheets
5.1 8 Breaking Length vs. Cpp for Krafi-pulp Handsheets
vii
5.1 9 Breaking Length vs. SurnC90 for TMP Neivsprinr 1 JZ-26-.? (CD)
5.20 Breaking Length vs. C, for 1452-26-17 (CD)
5.2 1 Breaking Length vs. SirmC90 for 1.152-26-2
5.22 Breaking Length vs. C, fir TMP !Veivsprint 1452-26-2
5.23 Breuking Length vs. SumC90 for I4 .U 1 7-4
5.24 Breaking Length vs. C, for TMP ivewsprinr 1 -lZ- 1 7-4
5-25 Global Imuge for Orienied Hundsheets (the new merhod developed in
this study)
5.26 Global [mage for Oriented Handsheets IFIR)
5.27 Global Image for 1.152-1 7-4 (the new method developed in this stirdy)
5.28 Global Imuge for TMP Neivsprint l4.Z- 1 7-4 (FIR)
5.29 Breaking Length vs. C, jor T W Xewsprini 1 4.U- I 7-4
5.3 0 Breaking Length (Exp.) vs. Predicred Breaking Lengh for 1 -lZ-26-?
5.3 1 Breaking Length (Erp.) vs. Predicred Breaking Length for 1452-1 W
5.32 Breaking Lengfh vs. C h for TMP Newsprini 1452-26-2 (CD)

LIST OF TABLES
2.1 Techniques icred to detect local grammage
3.2 Fibre Orientation Measrirement
2.3 Relutive Bonded Area Measrrremeni
Ag) the distribution of density gradient magnitudes at window j
&-y. Y the average density in a window about the location (x .y )
a l the associated dominant gradient orientation at window j, defined by
Equation 2.8. a, E [O. A]
the dominant gradient orientation for each subzone. a E [O.IT]
the size of the domain of the operator
the subzone size. N = 1Opi.wl x 1Opixd = 2 x 2windows
the local coherence of subzone
the sum of the square of the projections in a subzone (Equation 2.10)
the scattering coefficient of a sheet (Equation 2.12)
the scattering coefficient of the fibres in a completely unbonded state
(Equation 2.12)
the light transmission in each specimen
the mean value of light transmission for al1 specimens with the same
@-as
TI Tg the local bonding index
& force per unit width at failure. hV/m
Fb breaking force of the specimen. 1V
T breaking length of the specimen. km
w the width of the specimen. mm (Equation 3.1 )
- g the mean grammage over the entire zone
cc, the coefficient of variation of grammage
L fibre length. m
- L the average fibre length. m
of interest. k g / m 2
Lr the total length of projection on the ,Y-ais of N,, ( Equation 3 3). m
h(L) the probability density of the fibre length (L)
0 the local dominant fibre orientation (Equation 3.3 and 3.1 3)
g(@) the probability density of the fibre orientation ( 8 )
4 a dimensionless function of fibre length and other fibre. matrix and
specimen properties (Equation 3.3)
strain applied to the specimen
Poission 's ratio of the specimen
Young's modulus of the fibre. X , h "
the area of cross-section of the fibre. rn'
the fibre volume fraction in a rectangular plate with three dimensions
a, b and c
SrrmC90 the mean fibre orientation with respect to the tensile avis in the entire
region of interest
Cm the fibre orientation factor (Equation 3.1 1)
4, the fibre length factor (Equation 3.12)
the number of fibres crossing the failure line that take the load at
failure and then break
the number of fibres crossing the failure line that pull out intact due to
pnor bond breakage and hence cany no load at failure
the number of the fibres spanning the failure line
finite-span tensile strength of the strip expressed as breaking length if
no bond breakage had occurred. km
zero-span breaking length of the sheet. km
mean fibre strength. N / m2 (Equation 3 20)
mean force applied along the fibre avis and across the failure line
required to pull a fibre from the sheet. N
dimensionless function (Equation 3 20)
perimeter of the cross-section of fibres, rn
critical value of fibre length when the force for fibre pull out equates
to the force for fibre breakage crossing the failure line. m
RBA relative bonded area of the sheet
density of the fibre, g / m 3
acceleration due to gravity. m/s2
shear strength of the inter-fibre bonds. 1V / m'
average tensile strength in a fibre of length L, cross-section P. average
area of the cross-section -4 , . .V 1 m'
xiii
CHAPTER ONE
INTRODUCTION
1.1 BACKGROUND
Uniformity of the physical properties of paper continues to be one of the most
serious quality issues in today's paper rnills. However. because of the paper
manufacturing process itself, defects cm never be eliminated completely from paper.
Catastrophic failure may occur around weak regions if paper cannot tolerate the
stresses induced by modem high-speed printing processes. Current quality control in
the paper industry includes online monitoring of paper weight. thickness. water
content, opacity. gloss. etc. The resulting large-scale "average" profiles can often be
controlled effectively with today's technologies. On the other hand. to detect and
controI features with sizes from several microns to a few centimetres remains the
industry's biggest challenge. However. even within this range. the structure of paper
c m be described in many different ways. depending on the scale of inspection [l].
On the microstnictural level. which is from lpn to IOmm. paper is a vast
network of ribbon-like cellulosic fibres bonded together by hydrogen bonds. In this
sense, paper is porous and inhomogeneous. The microstructure of the sheet is defined
by a set of variables including fibre morphology and the details of local fibre
comectedness and distribution. A primary goal of paper physics is the prediction of
the mechanical properties of the sheet, such as tensile strength and modulus, in terms
of microstructural features. However, in previous studies, a lot of simplification and
idealization was applied in these predictions to make the problem solvable. Also, the
rneasurement of many microstnictural features, such as fibre orientation and interfibre
bond strength over a wide range of conditions, is often difficult.
Recent studies [2] have found that "the rupture of paper is controlled not by
the mean strength, but by the minimum strength regions in the sheet". and suggested
that these "minimum strength regions" can be described by the mesostrucrure of
paper. Physically, when examined with the naked eye. paper appean more like a
continuum. and a different kind of non-uniformity from that on the microstnictural
level emerges. Looking through a sheet of paper under light reveals a variation in
opacity that corresponds to the variation in local grammage. This kind of non-
unifomity on the square millimeter scale can be considered to be the rnesostrzrctzrre
of paper: it originates from the non-uniform distribution of fibres during the forming
process. Therefore the prediction of strength, printability and appearance (opacity) of
paper on this scale is critical.
A systematic structural hierarchy of paper was built up by Kortschot [l]. in
his work the mesostmcture is characterized by such structural features as local
variations in grammage, Jibre orientation and bonded area, etc., at the millimeter
scde. Note that although the grammage, fibre orientation and bonding are the
elements of the microstructure, the variations of these features cm be described as
mesostnictural variables.
Wong et al. attempted to correlate the strength of the sheet directly to the
grarnmage variation [3]. In this case, grarnmage was treated as the only variable. and
the sheet was considered to be a homogeneous film with varying thickness. The
results showed that grarnmage alone is not sufficient for predicting failure. and the
incorporation of other mesostnictural variables. such as variability in mean local fibre
orientation and bonded area. was suggested.
Quite a lot work bas been done to relate the global variations in fibre
orientation and bonding property to paper strength and stiffness. However. few
studies have focused on the variations in local structural pararneters and their effect
on local properties. Thus. in this research, an effort was made to correlate not only
local grammage, but also variations in the local rnean fibre orientation and bonded
area with the variability in local properties at the millimeter scale, and funher to
predict the stress, strain or strength field when a tensile load is imposed on the paper
sheet.
1.2 HYPOTHESIS AND OBJECTIVES OF THE THESIS
This study was founded on the hypothesis that there are significant local
variations in structure that can affect local properties in a deterministic way. The local
structural variations studied here include variations in grarnmage, fibre orientation
and relative bonded area (RBA). In this work. microtensile specimens with
2mm x 2mm testing zone were used to obtain the local breaking length. Mean
grammage, mean fibre orientation and mean RBA were computed for each specimen,
and a cornparison between these structural parameters and local mechanical
propenies was made.
There are three objectives of this thesis: first. to develop algorithms for local
fibre orientation evaluation; second. to conelate three major microstructural features
(grarnmage. fibre orientation and bonded area) of the sheet with the variability of
local properties; third, to make a prediction of sheet failure using relative strength
models based on measurable local structural properties. Unfortunately. due to the
difficulty in characterizhg local variations in boned area. the improvement based on
the relative strength mode1 which was developed in this study is trivial.
CHAPTER TWO
LITERATURE REVIEW
Sheet strength is a function of two factors: pulp fibre properties. such as
individual fibre strength; and sheet structure, such as grammage distribution. fibre
orientation distribution and fibre-fibre bond strengtli. In order to produce sheets with
desired properties and to diagnose paper machine performance. the relationship
beiween these structural variables and sheet strength must be derived. Several
models, for example. the Page equation [JI or the Kallmes-Bernier-Perez mode1 [j],
have related the failure to sheet structure by treating paper as a bonded random
network of natural cellulosic fibres which is defined on the rnicrostructural Ievel.
There have not been many studies dealing with tensile strength on the mesosirztctural
Ievel. Therefore, this study concentrates on the effect of local structural variables at
the millimeter scale (the mesostructural level). An effort is made to establish whether
or not local variations in relative bonded area and fibre orientation are significant
enough to affect local properties and M e r to build up a mode1 relating the local
structure to paper failure.
2.2 MESOTRUCTURAL VARIABLES
In Kortschot's paper [Il . the term bmesostructure' (lmm to IOcm) was used to
describe those intermediate aspects of structure which exist between the
microstructure ( l p to IOmm) and the macrostructure (5mm to 30m). In paper,
mesostructural features cm be defined at the millimeter scale, including the local
variations in grammage, fibre orientation and bonding, etc. Although fibre orientation
and RBA are acnially microstructural elements, the point-to-point variations in their
local mean values can be considered as mesostructural variables [ I l .
It is well known that the inhomogeneous structure of paper at this level is
caused by flocculation of higher consistency furnishes in a papemaking suspension.
An overview of forming physics was provided by Norman [6 ] .
The study of local vanability in paper on the mesostructural level is an
essential element in monitoring the quality of papcr production due to the effect of
formation variations on mechanical properties and the small-scale dimensional
stability problems such as cockling or bagging. These local variations in dimensional
stability are often caused by local variations of quantities such as grammage,
anisotropy, and dominant fibre orientation [7][8]. There have been some studies
relating the mesosmicture to cockling or the stress-strain properties of paper
[2][3][9][10][11]. However, a complete understanding of which aspect of structure at
this level controls these properties has not been obtained.
In previous work. the effect of structure. such as grammage. fibre orientation,
or bonded area, on paper strength focused on global variations instead of local ones.
Here. global variation means a variation in structural properties obtained over the
whole sheet. for example by changing wet pressure to change drgree of bonding.
There have been few studies of the effect of local variations in structure on the local
properties in a sheet with variable local structure. In this study. three aspects of
mesostructure are considered: local variations in grammage. fibre orientation and
bonding.
2.2.1 Grarnmage
Because it is extremely significant for optical and printing properties,
grammage variation in the sheet has received the most attention. Certainly. its effect
on mechanical properties has been well studied.
From previous studies of Nonnan and Dodson et al. [ 121 [ 1 31, it is known that
breaking length is reduced as grammage variability increases. The decrease in
strength with increasing variability in local grarnmage bas been explained by the
'weakest link concept' [13][14]. Nonnan considered the strength of the weakest part
in specimen as the tensile strength of standard tensile strength of a sheet [13]. The
coefficient of variation of grammage (CV) is widely used to characterize the
uniformity of formation, and is calculated over square zones of a finite size.
Generally speaking, the CV of grarnmage of a sheet decreases with an increase in the
size of the inspection zones, and the rate of decrease is governed by the fibre
geometry as well as the paper formation [ l j ] . Recent work by Wong et al. [3]
attempted to relate the strength directly to the grammage variation. treating the sheet
as a homogeneous film, and only considering local grammage variation at the
millimeter scale. However. the results showed that the grarnmage alone is not
sufficient for modelling local failure and other structural variables need to be
considered.
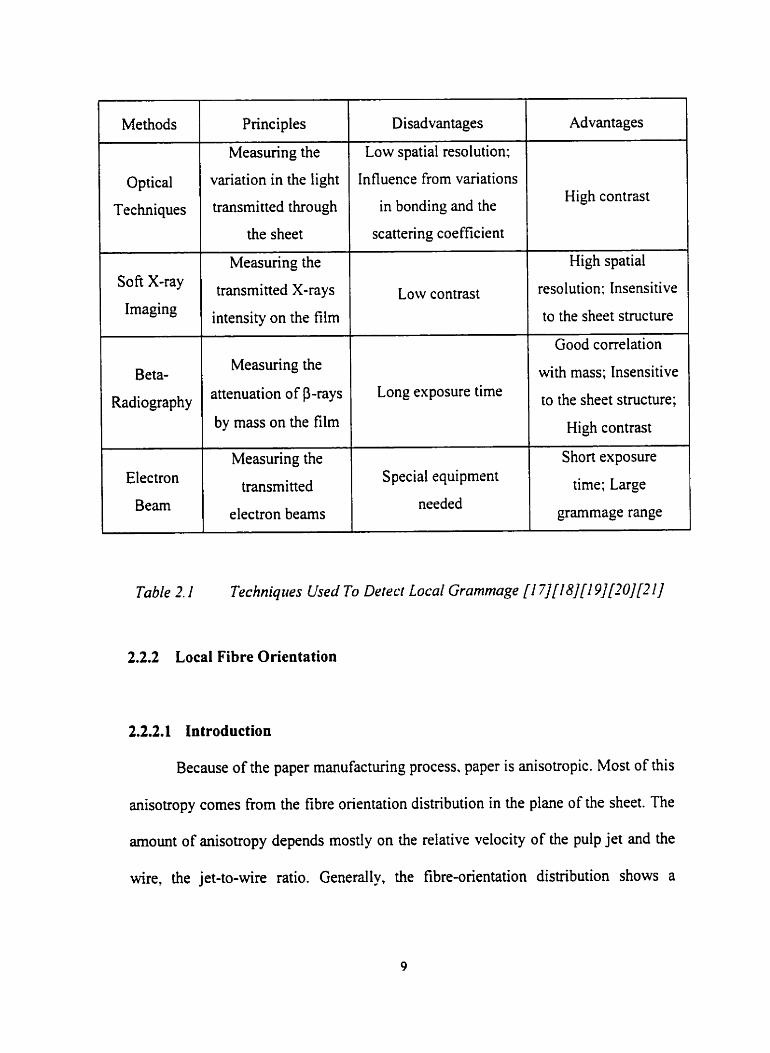
A background survey of rneasurements for grammage variations can be found
in Norman's paper [16]. Table 2.1 gives a summary of the advantages and
disadvantages of the various detection methods. In this study. video beta-radiography
(VBR) was chosen over other methods because of a strong correlation between grey
level and grarnmage. good contrat and insensitivity to the effect of other structural
variations in a sheet.
Methods l-- Optical
Techniques
Soft X-ray
Imaging
Beta-
Radiography
Elec tron
Beam
Principles
Measuring the
variation in the light
transmitted through
the sheet
Measuring the
transrnitted X-rays
intensity on the film -- -
Measuring the
attenuation of P-rays
by mass on the film
Measuring the
transmitted
electron bearns
Disadvantages
Low spatial resolution;
Influence from variations
in bonding and the
scattering coefficient
Low contrast
Long exposure time
Special equipment
needed
Advantages
High contrast
High spatial
resolution: Insensitive
to the sheet structure --
Good correlation
with mass; Insensitive
to the sheet structure;
Hi& contrast
Short exposure
time; Large
grammage range
2.2.2 Local Fibre Orientation
2.2.2.1 Introduction
Because of the paper manufacturing process. paper is anisotropic. Most of rhis
anisotropy cornes fiorn the fibre orientation distribution in the plane of the sheet. The
amount of anisotropy depends mostly on the relative velocity of the pulp jet and the
wire, the jet-to-wire ratio. Generally, the fibre-orientation distribution shows a
maximum in the direction parallel to the wire velocity, the machine direction (MD).
and a minimum in the direction orthogonal to this velocity. the cross-machine
direction (CD). This fibre orientation distribution is an important factor affecting the
physical properties of paper sheets [22] .
In order to control anisotropy, the paper industry requires accurate methods
for detemining the fibre orientation distribution and its effect on physical properties.
Image analysis techniques used to extract information about paper local structure
have rarely been employed in the pulp and paper industry due to high cost and
complicated techniques required. However, the techniques are powemil engineering
tools for the extraction of paper mesostructural properties. Our interest in the
variability of paper is concemed with the variance of averages measured in finite
inspection zones, in other words. on mesostructural level. Therefore, this study
focuses on exploring application of image analysis methods to paper formation
evaluation, especially fibre orientation investigation.
2.2.2.2 Fibre Orientation Measurement
Various techniques have been proposed for measurine fibre orientation but.
except for the measurement of the orientation of dyed fibres, they are al1 indirect. It is
dificult to analyze quantitatively the relationship between the measured anisotropy
and the actuai fibre orientation. A background survey of the various methods for fibre
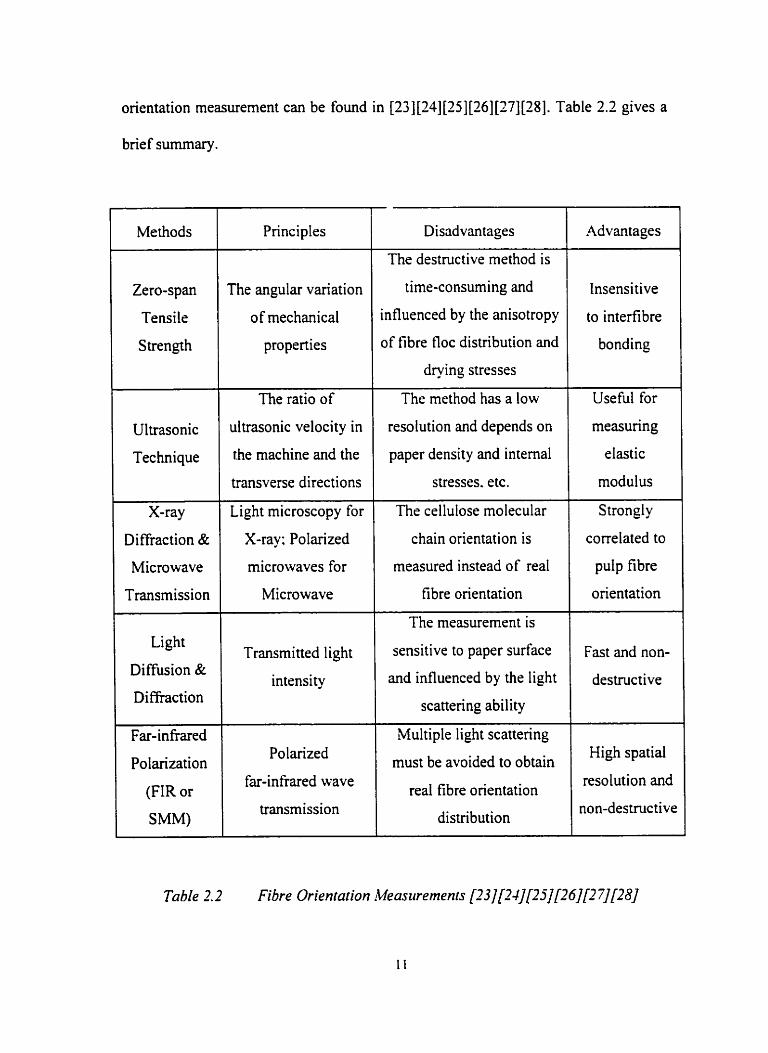
orientation measurement c m be found in [23][24][25][26][27][28]. Table 2.2 gives a
brief summary.
Methods
Zero-span
Tensile
S trength
Ultrasonic
Technique
X-ray
Diffraction &
Microwave
Transmission
Light
Diffùsion &
Diffraction
Far-infiared
Polarization
(FIR or
SMM)
The angular variation
of mechanical
properties
The ratio of
ultrasonic velocity in
the machine and the
transverse directions
Light microscopy for
X-ray : Polarized
microwaves for
Microwave
Transmitted light
intensity
Polarized
far - inhed wave
transmission
Disadvantages
The destructive method is
time-consuming and
influenced by the anisotropy
of fibre floc distribution and
drying stresses
The method has a low
resolution and depends on
paper density and intemal
stresses, etc.
The celluIose moleculat
chain orientation is
measured instead of real
fibre orientation - - - -
The measurement is
sensitive to paper surface
and influenced by the light
scattering ability . - - - - - - . .
Multiple light scattering
rnust be avoided to obtain
real fibre orientation
distribution
Advantages
Insensitive
to interfibre
bonding
Usehl for
measuring
modulus
S trongly
correlated to
pulp fibre
orientation
Fast and non-
destructive
High spatial
resolution and
non-destmctive
Table 2.2 Fibre Orientation Measurernents [23][24][2jl[26][2 7][28]
Scharscanski and Dodson [29] recently proposed a new method for analyzing
anisotropy in paper from greylevel images obtained by P-radiography. It provides
insight into the problem of characterizing anisotropy and local density gradient
variability of a stochastic planar structure. for instance. paper. However. the
methodology was used only for the estimate of local anisotropy of grarnmage
gradients [2][3][29]. In this study, a new method for characterizing local fibre
orientation was developed based on Scharscanski and Dodson's theory [29]. By
measuring the direction corresponding to the mavimum density gradient. and the
magnitude of that gradient. a measure of mean local fibre orientation can be obtained.
To further confirm the new method developed in this study. the results for the
global images are cornpared with those obtained from a polarized far-infiared (FIR)
wave transmission measurement [27][28]. The FIR characterization technique is
based on the observation of the dichroic behaviour of paper in far-infrared. The
underlying principle is that minimum transmission occurs when the fibres are mostly
oriented parallel to the plane of polarization of the beam and hence the angle where
a i s minimum is observed indicates the dominant fibre orientation in the sheet
[27][28]. The main advantages of the method are that it is nondestructive and highly
reproducible.
2.2.2.3 Local Gradient Function - Scharcanski and Dodson's Theory [29]
Considering paper as a planar stochastic structure with random variables,
Scharcanski and Dodson used a locoi gradient jrnction to describe the anisotropy
features of the paper. Through computation of the local gradient as a rneasure of mass
variation, both global and local unifomity and anisotropy of texture, such as paper,
can be extracted. By using the local dominant orientation and the degree of
agreement between the orientation of gradients and this local dominant orientation,
defined as coherence, the local anisotropy of the paper can be quantified [29]. The
method for local fibre orientation developed in this study is based on Scharcanski and
Dodson's theory. Thus, here we give a bief review of the original theory.
For the measurement of the mass variation in paper, a digitized radiograph of
a paper sample can be used as a digital image. This image c m be descnbed as a set of
pixels arranged into a matrix. Each pixel is assigned a gray level corresponding to its
grammage. The columns and rows of the digital radiograph c m be viewed as
grammage readings along CD and MD axes respectively.
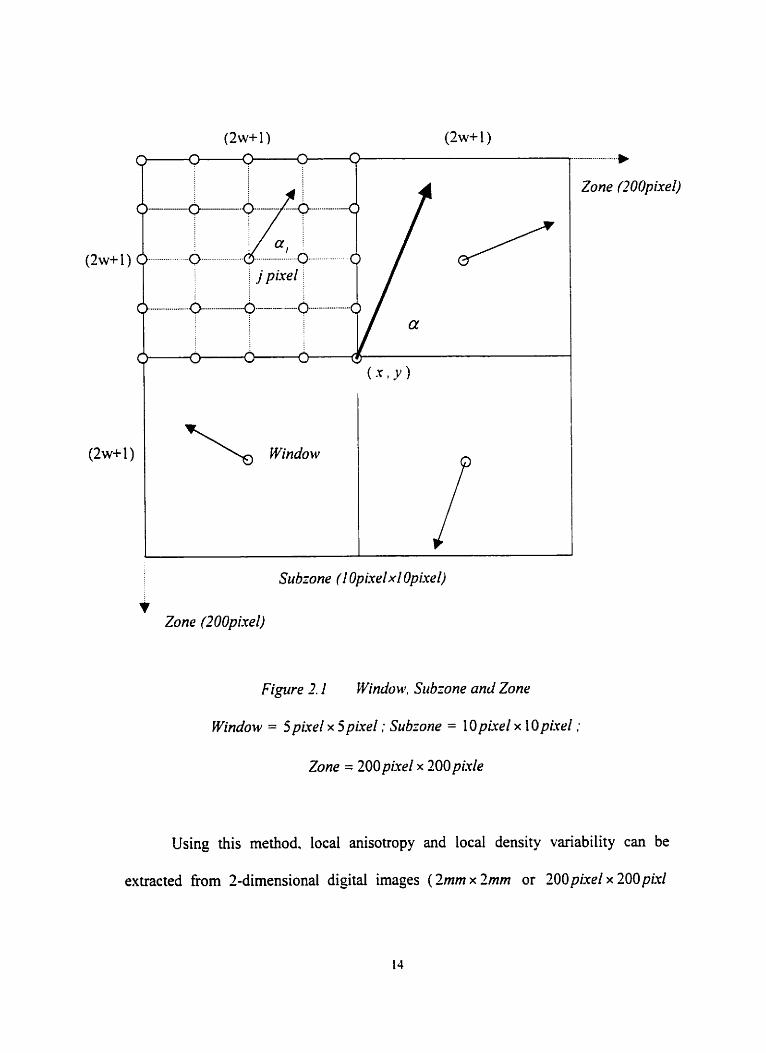
By averaging each window ( 5 p i x e l x 5 p k e l ) over the subzone
(10pireZx 10pixel). the subzone dominant orientation and its magnitude can be
calculated. Local dominant gradient orientation and local coherence can be obtained
by averaging each subzone over the entire zone size (200pLrel x 200pixel). Fig. 2.1
gives the relationship among window? subzone and zone.
\ Window
v Zone (200pixeZ)
Figirre 2.1 Window. Szibrone and Zone
Window = Spixel x SpixeZ ; Subzone = 10pLrel x lOpLre1;
Zone = 200pirel x 200pixle
...- ---....-........ + Zone IZOUpixel)
Using this method. local anisotropy and local density variability can be
extracted fiom 2-dimensional digital images ( 2mm x 2mm or 200 pixel x 200 pixl
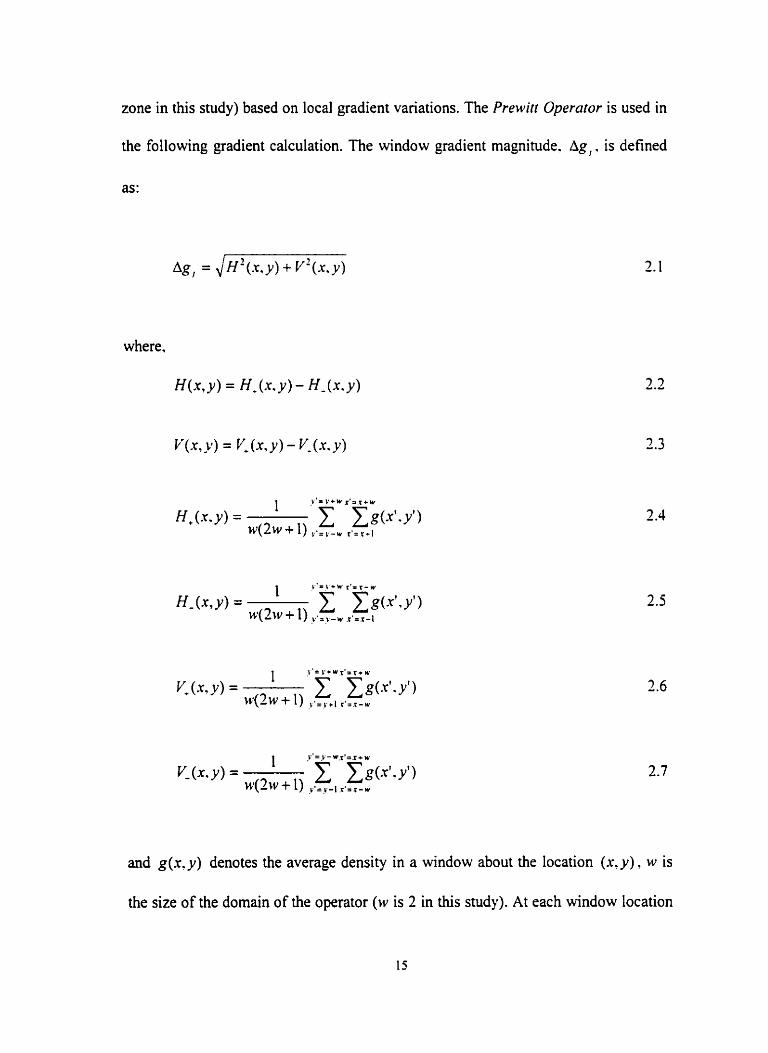
zone in this study) based on local gradient variations. The Prewitt Operator is used in
the following gradient calculation. The window gradient magnitude. Ag, . is defined
as:
Y (x, y ) = v+ (x, y) - v- (.Y. y)
1 ~ ' ~ Y + w . ~ ' I ~ + w
H+ (x. y) = z &(-rt-y') w(2w + 1) ,.;, -, ,.; ,,,
Y+ (x. y) = C - Cg(x'.y) iv(2 w + 1) ,.; ,, , ,+. r-,
and g(x. y ) denotes the average density in a window about the location (x, y ) . rv is
the size of the domain of the operator (IV is 2 in this study). At each window location
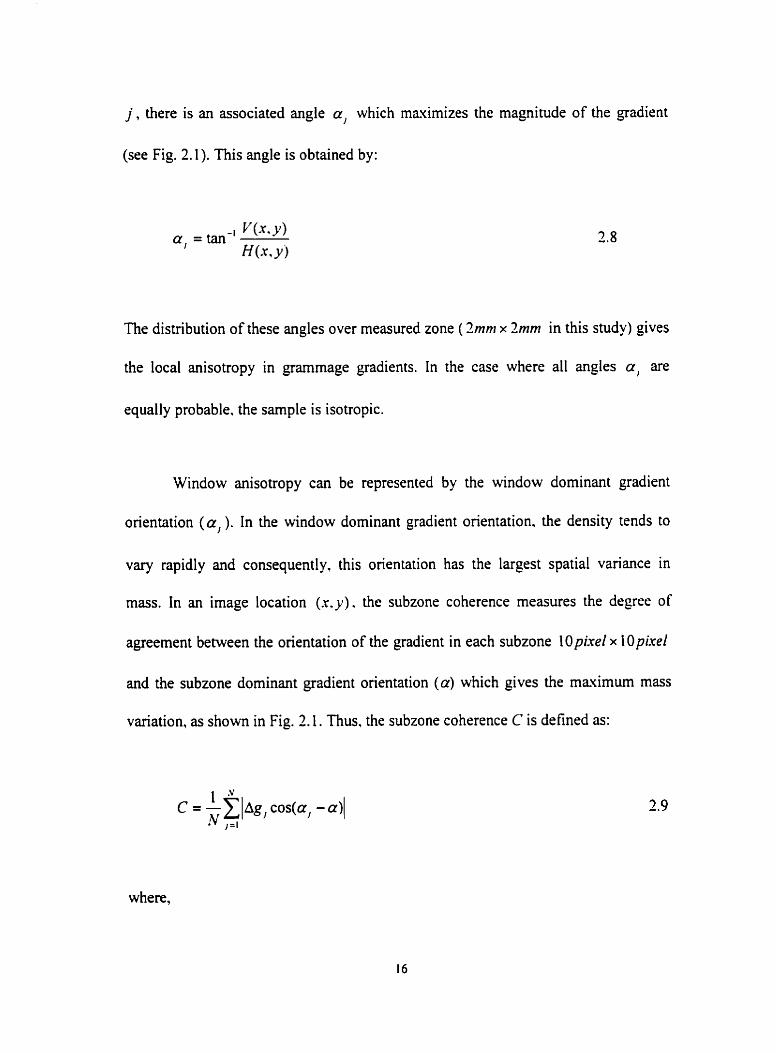
j, there is an associated angle a, which mauimizes the magnitude of the gradient
(see Fig. 2.1). This angle is obtained by:
The distribution of these angles over rneasured zone ( 2mm x Zmm in this study) gives
the local anisotropy in grammage gradients. In the case where al1 angles a, are
equally probable. the sample is isotropie.
Window anisotropy can be represented by the window dominant gradient
orientation (a, ). In the window dominant gradient orientation. the density tends to
vary rapidly and consequently. this orientation has the largest spatial variance in
mas . In an image location ( x - y ) . the subzone coherence measures the degree of
agreement between the orientation of the gradient in each subzone 1 Opixel x 1 Opixel
and the subzone dominant gradient orientation (a) which gives the maximum mass
variation, as shown in Fig. 2.1. Thus, the subzone coherence C is defined as:
where,
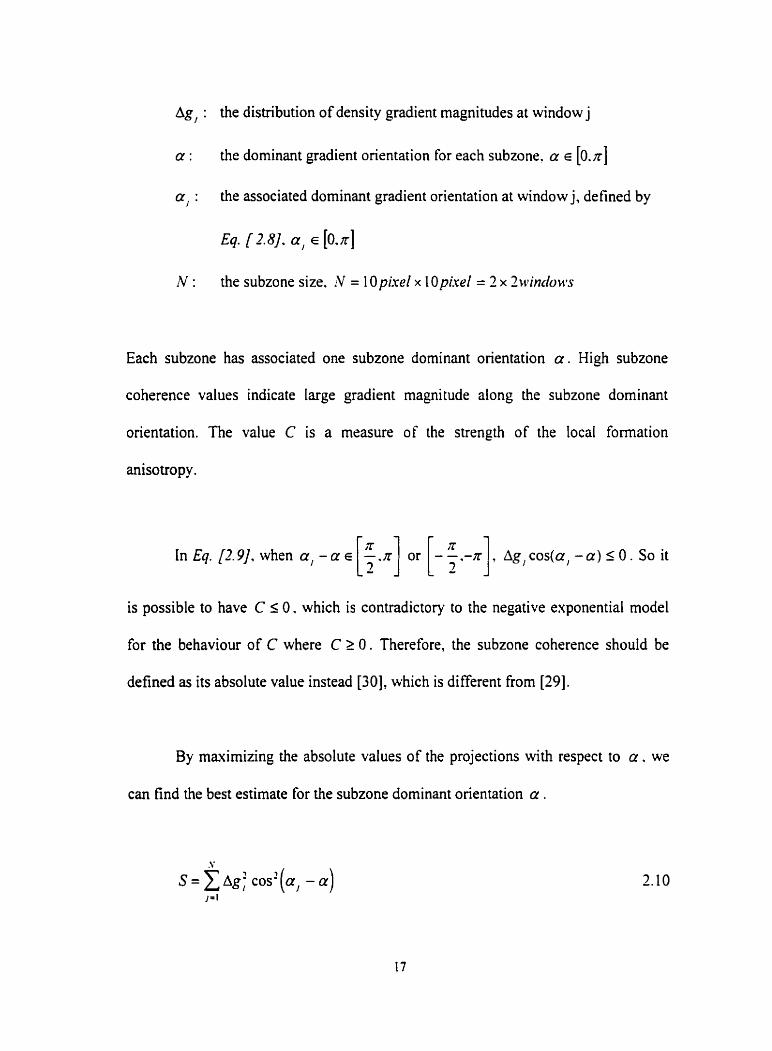
Ag : the distribution of density gradient magnitudes at window j
a : the dominant gradient orientation for each subzone. cr E [0.n]
a, : the associated dominant gradient orientation at window j, defined by
Eq. [2.8]. a, E [O.IT]
N : the subzone size. !V = 1 Opixel x 1 Opirel = 2 x Z\rindu\t~
Each subzone has associated one subzone dominant orientation a . High subzone
coherence values indicate large gradient magnitude along the subzone dominant
orientation. The value C is a mcasure of the strength of the local formation
anisotropy .
InEq.[2.9].when a , - a e [i - . x ] or [ -- 2 .-n] Y ~ g , cos(a, -a) 5 O . Sa it
is possible to have C ' O . which is contradictory to the negative exponential mode1
for the behaviour of C where C 2 0 . Therefore, the subzone coherence shouId be
defined as its absolute value instead [30], which is different fiom [29].
By maximizing the absolute values of the projections with respect to a . we
can find the best estimate for the subzone dominant orientation a .
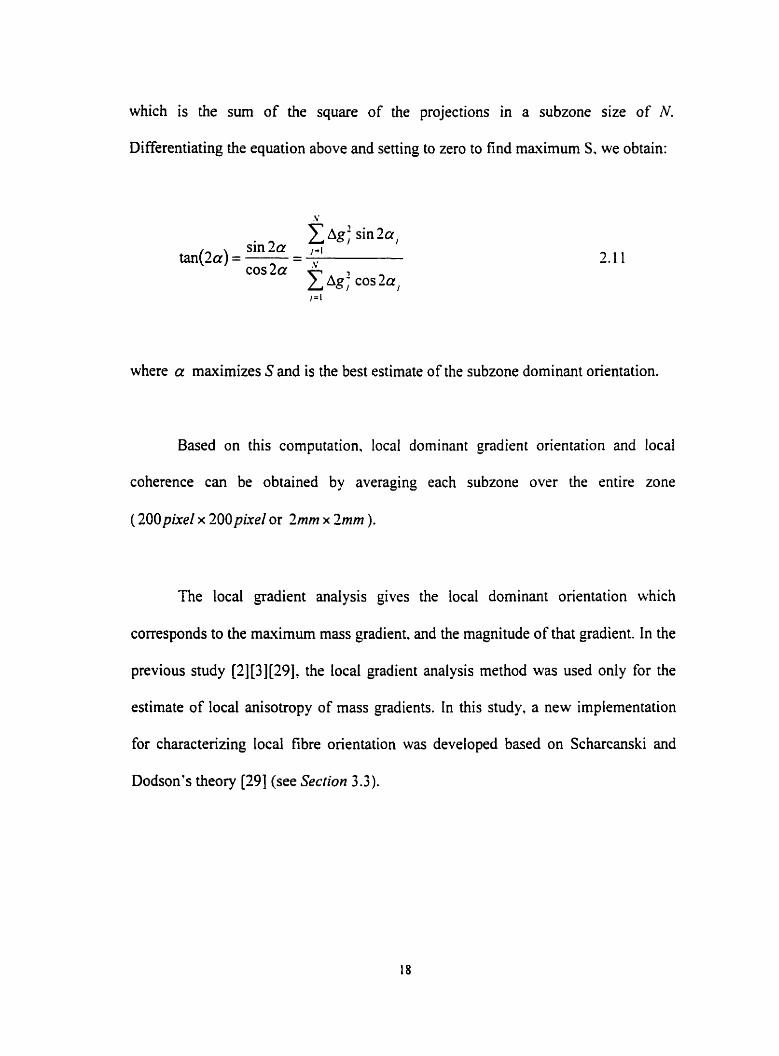
which is the sum of the square of the projections in a subzone size of N.
Differentiating the equation above and sening to zero to find maximum S. we obtain:
.V
sin 2a
cos 2a C A~ j cos 2a,
where a maximizes S and is the best estimate of the subzone dominant orientation.
Based on this computation. local dominant gradient orientation and local
coherence can be obtained by averaging each subzone over the entire zone
(200pixel x 200pixel or Zmm x 2mm ).
The local gradient analysis gives the local dominant orientation which
corresponds to the maximum mass gradient. and the magnitude of that gradient. In the
previous study [2][3][29]' the local gradient analysis method was used only for the
estimate of local anisotropy of mass gradients. In this study. a new irnplernentation
for characterizing local fibre orientation was developed based on Scharcanski and
Dodson's theory [29] (see Section 3.3).
2.2.3 Relative Bonded Area
2.2.3.1 Introduction
The properties of paper depend on both the arrangement and the properties of
the building blocks. i.e.. fibres. In this sense. paper is really 'an engineered stochastic
structure' [15] rather than a material. Thus the structure and properties of the bonded
region affect almost al1 of the mechanical. optical, thermal and electrical properties
[31]. Certainly. bonding is one of the critical factors which determine the weak
regions in the sheet [32]. Therefore. in order to increase the minimum local strength
of the sheet. first of all. we need to improve our Fundamental understanding of the
effect of bonded regions on the fibre network. Although many studies have attempted
to relate bonding to mechanical properties, such as sheet strength. there have been
few studies of the effect of local bonded area on the local properties within a single
sarnple and no studies of the point to point variation of bonded area. Therefore, this
work focused on local variation in bonded area and its effect on local tensile strength
of microtensile specimen. Hence, a sensitive method to evaluate this variable local
structure is necessary.
Bonded area is usually described in terms of the fraction of the fibre surface
that is bonded to other fibres. i.e., the relative bonded area or RBA. The usual method
for calculating RBA begins with the assumption that portions of a fibre not bonded to
another fibre scatter light, while the bonded portions (baving no interface with air) do
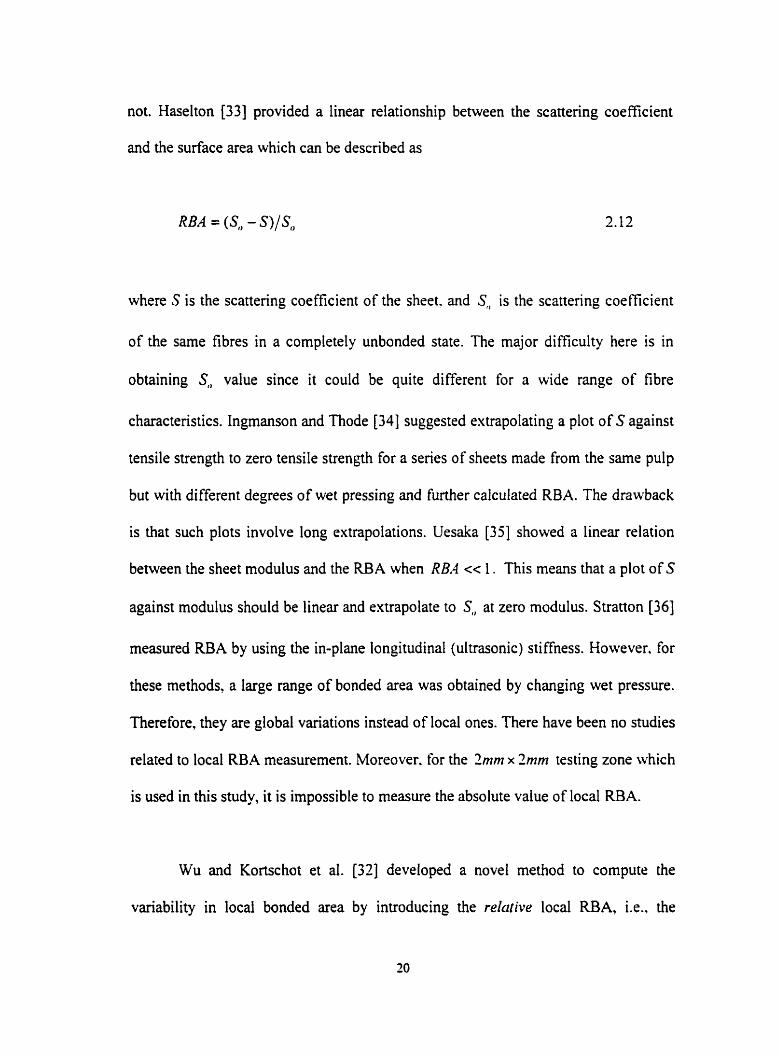
not. Haselton [33] provided a linear relationship between the scattering coefficient
and the surface area which c m be described as
RBA = (S,, - S)/S,
where S is the scattering coefficient of the sheet. and Sr, is the scattering coefficient
of the same fibres in a completely unbonded state. The major difficulty here is in
obtaining S, value since it could be quite different for a wide range of fibre
characteristics. Ingmanson and Thode [34] suggested extrapolating a plot of S against
tensile strength to zero tensile strength for a series of sheets made from the same pulp
but with different degrees of wet pressing and further calculated RBA. The drawback
is that such plots involve long extrapolations. Uesaka [35] showed a linear relation
between the sheet modulus and the RBA when RBA cc 1. This means that a plot of S
against rnodulus should be linear and extrapolate to S,, at zero modulus. Stratton [36]
measured RBA by using the in-plane longitudinal (ultrasonic) stiffness. However. for
these methods, a large range of bonded area was obtained by changing wet pressure.
Therefore, they are global variations instead of local ones. There have been no studies
related to local RBA rneasurernent. Moreover. for the 7mm x 2mm testing zone which
is used in this study, it is impossible to rneasure the absolute value of local M A .
Wu and Kortschot et al. [32] developed a novel method to compute the
variability in local bonded area by introducing the relative local M A , Le.. the
bonding index (TJT' ), instead of an absolute value of RBA. A detailed review can
be fowid in Section 2.2.3.3.
2.2.3.2 Relative Bonded Area Measurement
Methods Principles
Direct
Microscopie
Observation
Light and electron
microscopy over
the cross-section
of paper
Gas Adsorption &
Optical Scattering
methods
Measurernent of the
surface area of the
constituent fibres
Digitizing method
1 Analysis of
1 photomicrographs of
sheet cross-section
1 on a digitizer
Disadvantages
Destructive, affected
by surface fibres and
difficult to get clear
images of paper
Time-consuming and
limited by several
assumptions
Difficult to identifi
bonded areas,
time-consuming and
destructive
Advantages
Direct
observation of
the nature of
fibre-fibre bonds
Non-destruc tive
measurement
Analysis of
interna1 fibre
network
geometry
Table 7 3 Relative Bonded Area Measlrrernent [3 v[38][39]
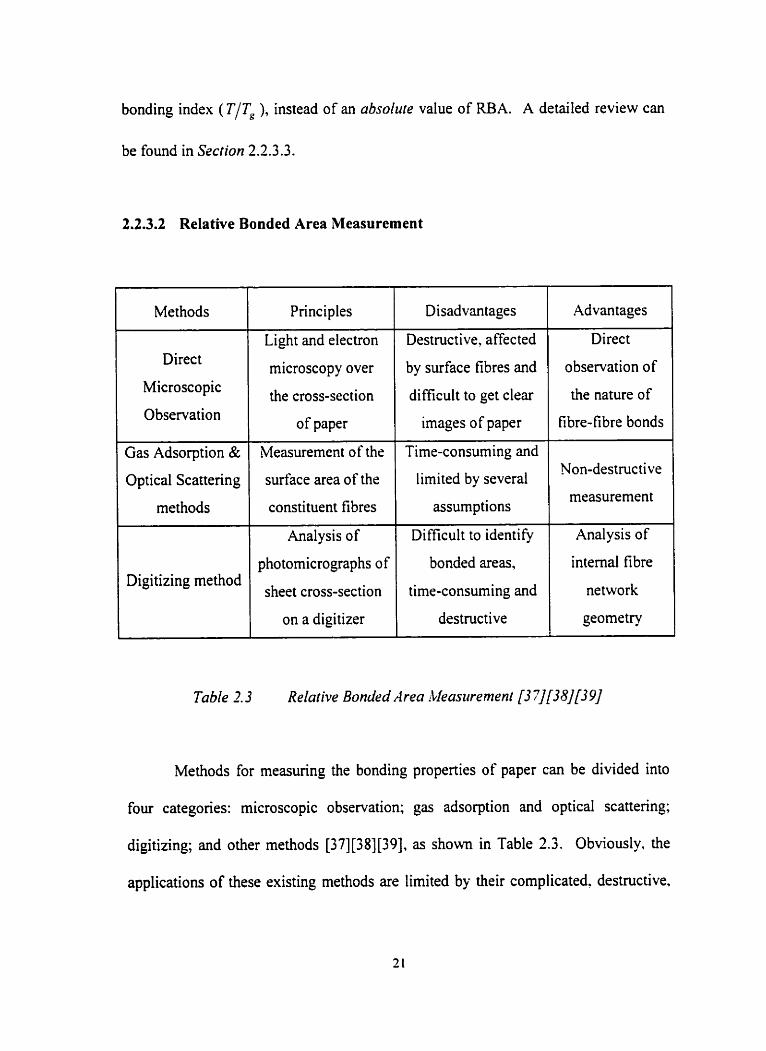
Methods for rneasuring the bonding properties of paper can be divided into
four categories: rnicroscopic observation; gas adsorption and optical scattering;
digitizing; and other methods [37][38][39], as shown in Table 2.3. Obviously. the
applications of these existing methods are limited by their complicated, destructive.
or time-consuming measurernents. To investigate local variations in bonded area
instead of global variations, Wu and Kortschot's method [32] was adopted in this
study by using a high quality image acquisition system. The local bonded area
measurement is based on a simple comparison of local grammage (obtained by P-
radiography) and local light transmission within a single sample.
2.2.3.3 Bonding Index Theory and Implementation 1321
Wu and Kortschot et al. [32] simplified the problem of characterizing bonding
by using a relative value of local RBA. tenned the bonding index, instead of an
absolute value of RBA. On the basis of cornparisons within a single sarnple of paper.
the bonding index provides a suitable estimation of local RBA. In this study. the locul
bonding index [32] has been determined and cornpared to the local strength for sheets
with constant grammage. Also. the results of global variations in bonding index
obtained by changing wet pressure for handsheets are presented in this study to
further confinri the method.
The bonding index measurement is based on a comparison of local grammage
(obtained by P-radiography) and local light transmission [ X I . The underlying
principle is that more poorly bonded regions permit less light transmission than
highly bonded regions with equivalent grammage. Therefore. for the regions with the
sarne grammage. the ratio of P-ray to optical transmission cm be directly interpreted
as the relative Iocd bonded area, referred to as the bonding indes (T /T , ) in this
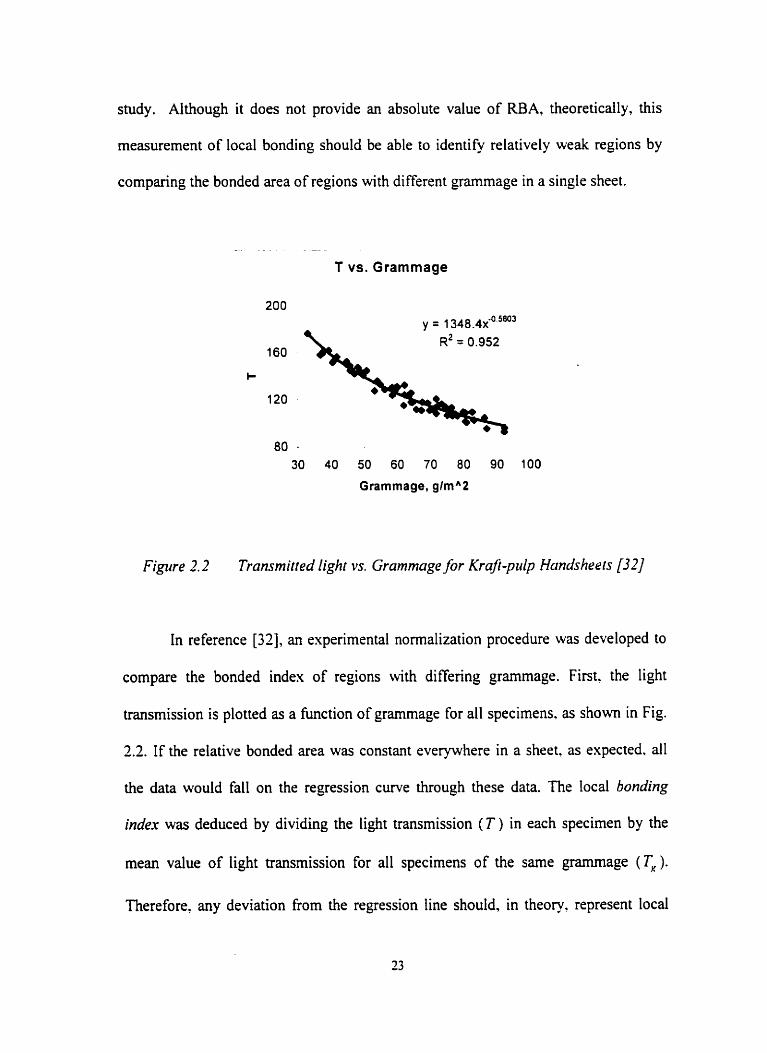
study. Although it does not provide an absolute value of RBA, theoretically, this
measurement of local bonding should be able to identify relatively weak regions by
comparing the bonded area of regions with different grammage in a single sheet.
- - . .
T vs. Grammage
Grammage, gimA2
Figure 2.2 Transmitted light vs. Grammage for Krafi-pitlp Handsheets [32]
In reference [32], an experimental normalkation procedure was developed to
compare the bonded index of regions with differing grammage. Fint, the light
transmission is plotted as a function of grammage for al1 specimens. as s h o w in Fig.
2.2. If the relative bonded area was constant everywhere in a sheet. as expected. al1
the data would fdl on the regression curve through these data. The local bonding
index was deduced by dividing the light transmission ( T ) in each specirnen by the
mean value of light transmission for d l specimens of the same grammage (T,).
Therefore, any deviation fiom the regression line should, in theory, represent local
fluctuations in bonded area.
TlTg vs. Grammage
30 40 50 60 70 80 90 100
Grammage, glmA2
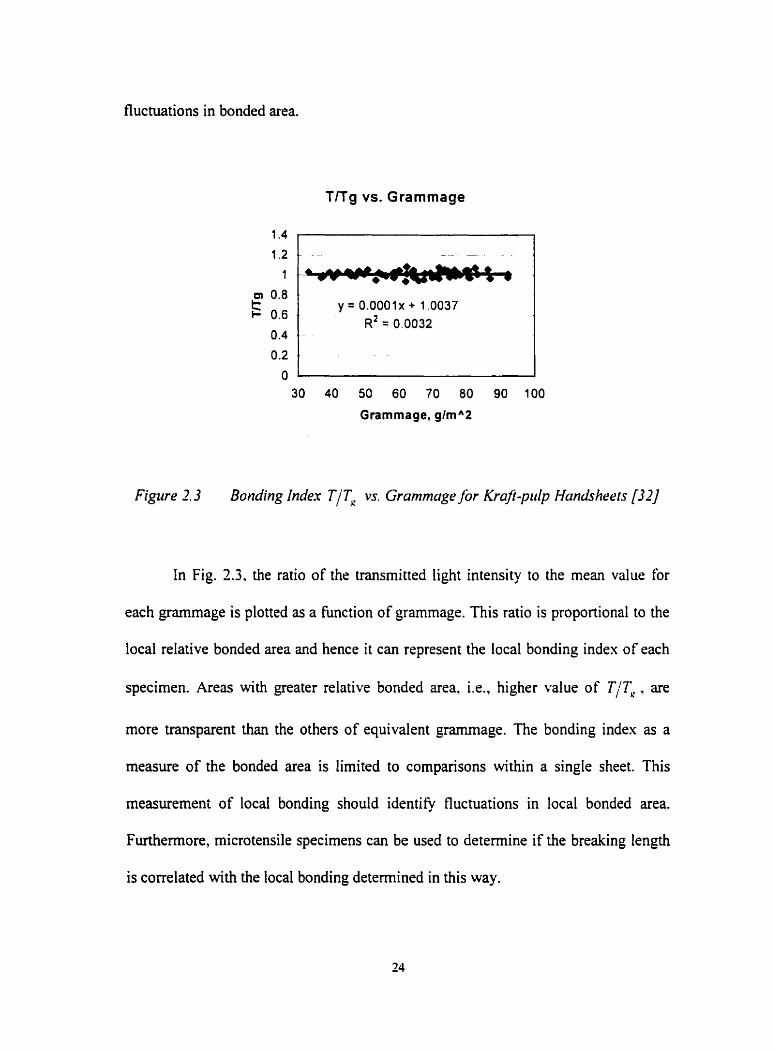
Figure 2.3 Bonding Index TI T, vs. Grammage for Krafr - p d p Handshee ts [L? ]
In Fig. 2.3. the ratio of the transmitted light intensity to the mean value for
each grammage is ploned as a function of grammage. This ratio is proportional to the
local relative bonded area and hence it can represent the local bonding index of each
specimen. Areas with greater relative bonded area. i.e., higher value of T/T, . are
more transparent than the others of equivalent grarnrnage. The bonding index as a
measure of the bonded area is limited to cornparisons within a single sheet. This
measuremeni of local bonding should identiQ fluctuations in local bonded area.
Furthemore, microtensile specimens c m be used to determine if the breaking Iength
is correlated with the local bonding determined in this way.
2.3 STRENGTH MODELS
Paper is a bonded random network of natural ceilulosic fibres. Because of its
inhomogeneous structure. it is difficult for paper scientists to predict paper failure.
The mechanisrn of failure depends on the balance between the strength of the fibres
and the strength of the fibre-fibre bonds. Failure is usually initiated by bond failure in
weakly bonded paper and by fibre failure in strongly bonded paper [40][41]. In oiher
words, the nwnber of broken fibres across the failure line of the sheet is greater than
the number of fibres pulled out for a strongly bonded sheet; whereas, fibre pull out
dominates in weakly bonded sheet [42].
Many attempts have been made to predict the tensile strength of paper from its
structure by means of a closed-form network model [42]. The pioneering research of
Cox [43] providcd the first micromechanical structural mode1 of paper in 1932. The
model considered paper as a network of continuous fibres randomly distributed in a
two-dimensionai planai- mat with a known angular distribution fwiction. Based on this
concept of an ideal paper sheet, the Cox model accounted for the cffect of fibre
orientation on the stifiess and strength of paper. Since then. the Cox model has been
cited extensively by both paper scientists and composite material researchers. Severai
variations of the Cox-type models have been developed. A cornprehensive review of
these closed-form network models for the tensile strength of paper can be found in
Jayaraman and Kortschot's paper [42]. Here we only give a brief sumrnary.
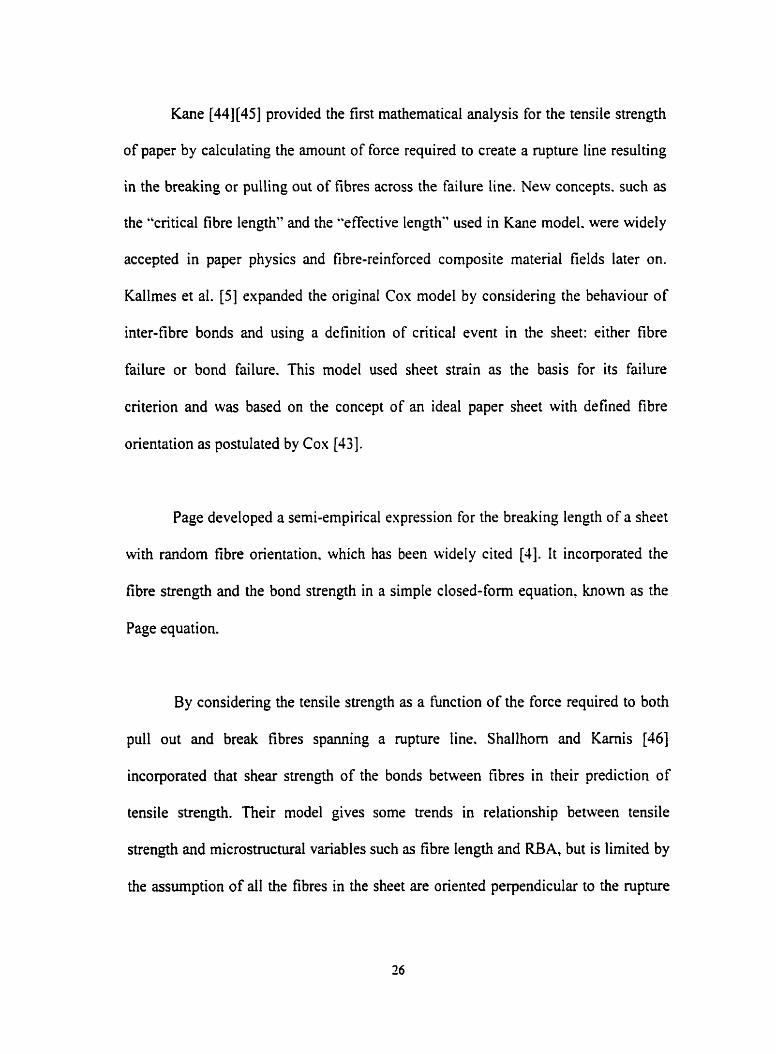
Kane [44][45] provided the fint mathematical analysis for the tensile strength
of paper by calculating the amount of force required to create a rupture line resulting
in the breaking or pulling out of fibres across the failure line. New concepts. such as
the "critical fibre length" and the "effective length" used in Kane model. were widely
accepted in paper physics and fibre-reinforced composite material fields later on.
Kallmes et al. [ 5 ] expanded the original Cox model by considering the behaviour of
inter-fibre bonds and using a definition of critical event in the sheet: either fibre
failure or bond failure, This model used sheet strain as the basis for its failure
critenon and was based on the concept of an ideal paper sheet with defined fibre
orientation as postulated by Cox [43].
Page developed a semi-empirical expression for the breaking length of a sheet
with random fibre orientation. which has been widely cited [JI. It incorporated the
fibre strength and the bond strength in a simple closed-form equation. known as the
Page equation.
By considering the tensile strength as a function of the force required to bodi
pull out and break fibres spanning a rupture line. Shallhom and K m i s [46]
incorporated that shear strength of the bonds between fibres in their prediction of
tensile strength. Their model gives some trends in relationship between tensile
strength and microstructural variables such as fibre length and RBA, but is limited by
the assumption of dl the fibres in the sheet are oriented perpendicular to the rupture
line. Most recently, Karenlampi [47][48] expanded models for changed distribution
of fibre properties by means of statistical simulation.
These models al1 use a simplified microstmcture and assume that the fibres
are ideal by ignoring the effect of curl or crimps. Although the simplification of the
microstructure and idealization of fibre and bond properties was applied to make the
problem solvable, it is the major limitation of the existing network models. Also. a
compiete test of these models is quite difficult since it requires the measurement of
many micromechanical parameten, such as fibre. bond and sheet properties over a
wide range of conditions. In particular, the interfibre bond strength and relative
bonded area are not~riously difficult to measure. As a result. it is exceedingly
difficult to produce quantitative predictions for tensile strength as a function of the
structural variables of paper. Therefore. the applications of these models in material
engineering fields are limited.
However, the theory together with the present models can be used to predict
trends associated with changes in the distribution of fibre properties. such as fibre
orientation and bond properties. The theory can be verified experimentally through
such treatments, and can hirther improve our understanding of the origin of the
properties of paper. In this snidy. based on the experimental results from both global
and local variations in paper structure, we intend to analyze the effect of the local
structural properties on the tensile strength and develop the existing models to predict
the tensile strength of paper so that different kinds of distributions of structural
properties may then be inserted.
In this study. the fundarnental work of Cm is applied to explore the effect of
fibre orientation on the tensile strength. The study of RBA is based on the Kane
theor). and the Page eqziation which have been widely accepted to predict tensile
strength of a sheet by including the fibre strength and the bond strength in a simple
closed form equation. The expanded implemcntations of these theories are introduced
in Section 3.3 and Sectiori 3.4 respectively.
CHAPTER THREE
THEORETECAL
3.1 INTRODUCTION
In this study, an effort is made to develop a correlation beiween breaking
length and local structural variations in grammage. fibre orientation and RBA at the
millimetre scale. The quantitative correlation between these local structural variations
and local mechanical properties. such as tensile strength. has not been studied
previously. Since these structural factors cannot be varied independently in
experirnents. a comprehensive mode1 which includes al1 the three variables is
necessary to predict the local strength. Therefore. in our study, the paper strength
modelling concentrates on predicting relative changes in breaking Iengrh based on
changes in local grammage. local fibre orientation and local RB.4. Eventually. we
intend to make a prediction of sheet failure using relative strength models based on
these local structural properties. In short, we expect to build up such relationships as:
Predicted Tensile Strengfh = f (grammage. fibre orientation. R&4)
3.2 GRAMMAGE
The effect of grammage on mechanical properties has been recognized for a
long time. Obviously, force per unit width at failure. P, (hV/m). should increase as
grammage increases, which can be described as
6, P, = - a: Grammage IV
where, F, is breaking force, N ; i v is the width of the specimen. mm. As a
standardized measure of tensile strength, breaking length (km) can be calculated as
F, Mt - Breaking Length = - 9.8 x g
where. g is the mean grammage over the entire zone of interest for each specimen.
kg/m2 . Through dividing by the grammage value. the trivial effect of compaction is
factored out of the calculation of strength, and the force is nonnalized by the cross-
sectional area of load bearing fibres.
From previous studies. it is known that breaking length is reduced as
grarnmage variability, i.e., the coefficient of variation of grarnmage (CV, )? increases
[12][13]. In order to minimize the zone size of specimens so that al1 aspects of
structure would be constant over the zone, microtensile specimens with a
2mm x 2mm testing zone were used in this study instead of standard tensile testing
sarnples. The square millimetre scale was believed to be most appropriate primarily
because it is of the same order of magnitude as the fibre length [20][49]. Therefore.
the distribution of grammage cm be regarded as unifonn and the mean values c m be
used over the zone,
3.3 FIBRE ORIENTATION FACTOR
3.3.1 Introduction
Many attempts have been made to incorporate the fibre orientation factor in
paper strength models (see Section 2.3). In this study. by using Cox's theory for fibre
onentation factor and a new measurement (see Secrion 4.4), local variations in Ebre
onentation on the mesostructural level are quantified. Furthemore. the relationship
between local tensile strength and local fibre orientation is investigated. Variations in
global fibre orientation are examined by cornparing specimens cut from machine
made paper in the MD to CD directions. In the case of specimens for al1 along CD or
MD direction within a single machine made paper, or for a random handsheet. point-
to-point variations in the local orientation are examined.
In order to compare fibre orientation to strength, the focus of this study was to
characterize fibre orientation in a way reiating orientation to the sheet strength
directly. Many attempts have been made to model this relationship. The fundamental
point of Cox theory as well as the improved theories is to calculate the force sustained
by the fibres across a scan line. The Cox model was derived for an ideal paper using a
force formulation and was based on several assumptions. which are discussed in
Jayaraman and Kortschot's paper [QI. A modified Cox theory, introduced by
Kallmes and Perez [50] and Kallmes et al. [SI is developed below. The specific
approach used in this study is based on work done by Jayaraman and Kortschot [42].
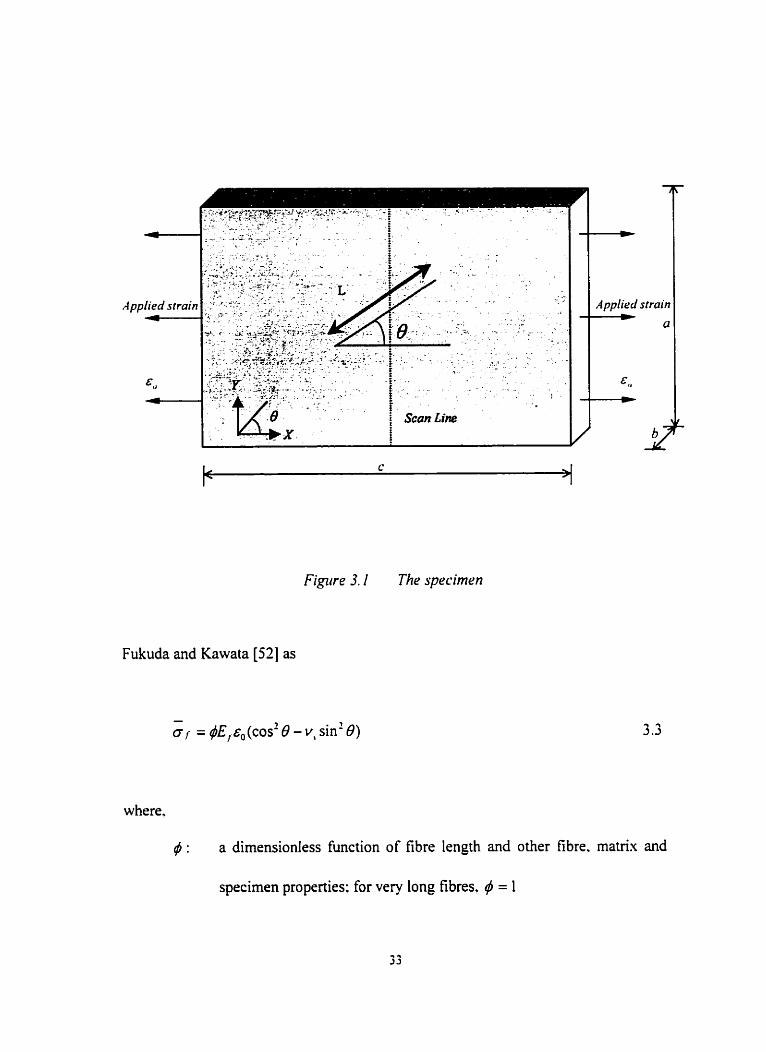
3.3.2 General Theory 15 11
The specimen is in the shape of a tbin. rectangular plate with dimensions a, b
and c. where dimension c is parallel to the ,l'-ais direction as show in Fig. 3.1. The
fibre orientation is defined as the angle between the axial direction of the fibre and
the X-auis direction, O . N straight fibres are bonded together and dispersed in the
specimen with a fibre volume Fraction V, . The independent probability density
hnctions. h(L) and g(B) , represent the statistical variation in the length and
orientation of the fibres respectively. Applied load on the specimen is parallel to the
X-axis direction with strain. E,, . Here the strain is underlying sheet strain including
the total süains of specimen together with strain in fibre. Based on this definition, the
average axial stress in a fibre of Iength L and orientation 0 in the specimen is given by
A pplied strain strain
a
Figure 3.1 The specimcn
Fukuda and Kawata [52] as
- a, = 4 ~ , q,(cos2 8 - V , sin' 8 )
where,
4 : a dimensionless function of fibre length and other fibre. matrix and
specimen properties: for very long fibres. 4 = 1
E, : Young's modulus of the fibre. N / m 2
E,, : strain appIied to the specimen
u, : Poisson's ratio of the specimen
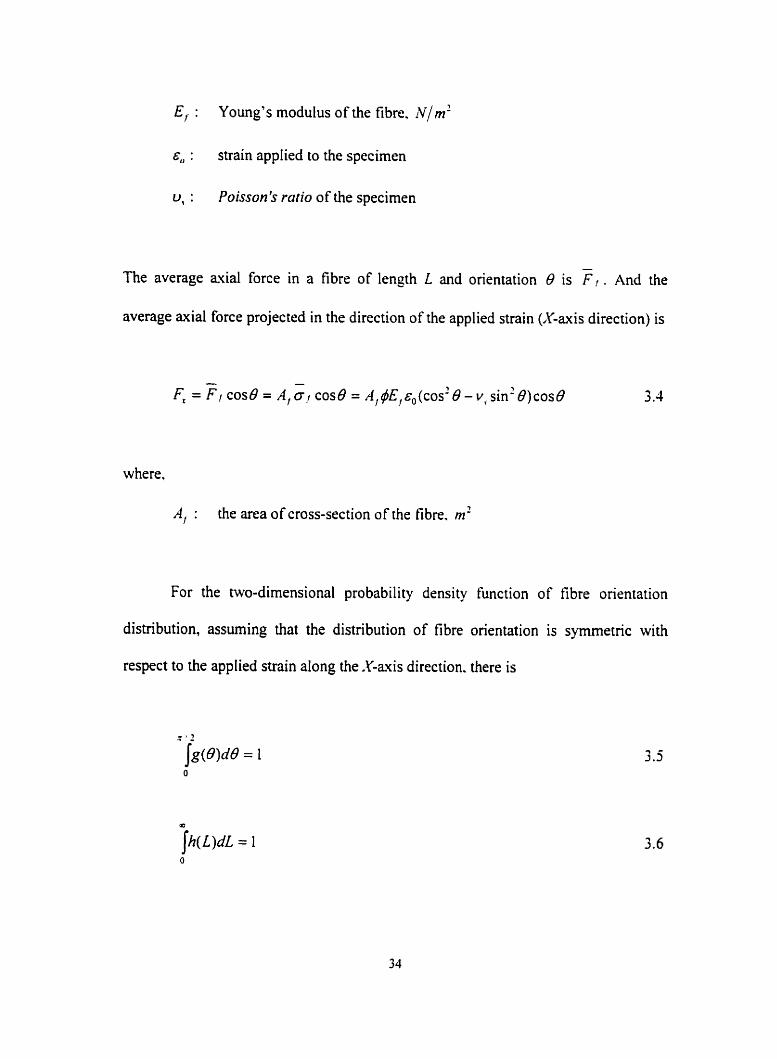
The average axial force in a fibre of length L and orientation 0 is F, . And the
average axial force projected in the direction of the applied strain (X-axis direction) is
where.
A, : the area of cross-section of the fibre. rn'
For the two-dimensional probability density function of fibre orientation
distribution, assuming that the distribution of fibre orientation is symmetric with
respect to the applied strain along the .Y-auis direction. there is
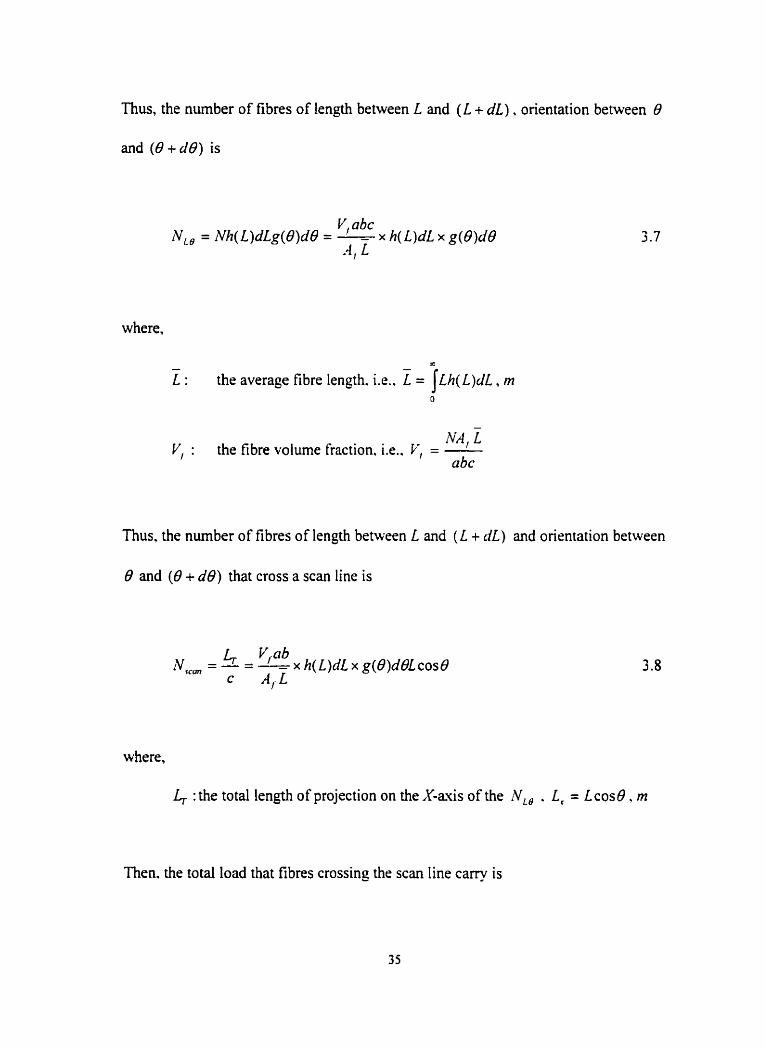
Thus, the number of fibres of length between L and (L + dL) , orientation between 0
and (O + d0) is
Y, abc N,, = Nh(L)dLg(B)d0 = - - x h( L)dL x g(8)dO
A, L
where,
- L :
v, :
the average fibre length. i.e.. = [ ~ h ( L)& , m O
NA, L the fibre volume fraction. i.e.. V, = -
abc
Thus, the number of fibres of length between L and ( L + dL) and orientation between
0 and (0 + dB) that cross a scan line is
where,
4 :the total length of projection on the X-mis of the NLa . L, = LcosB . m
Then. the total load that fibres crossing the scan Iine cary is
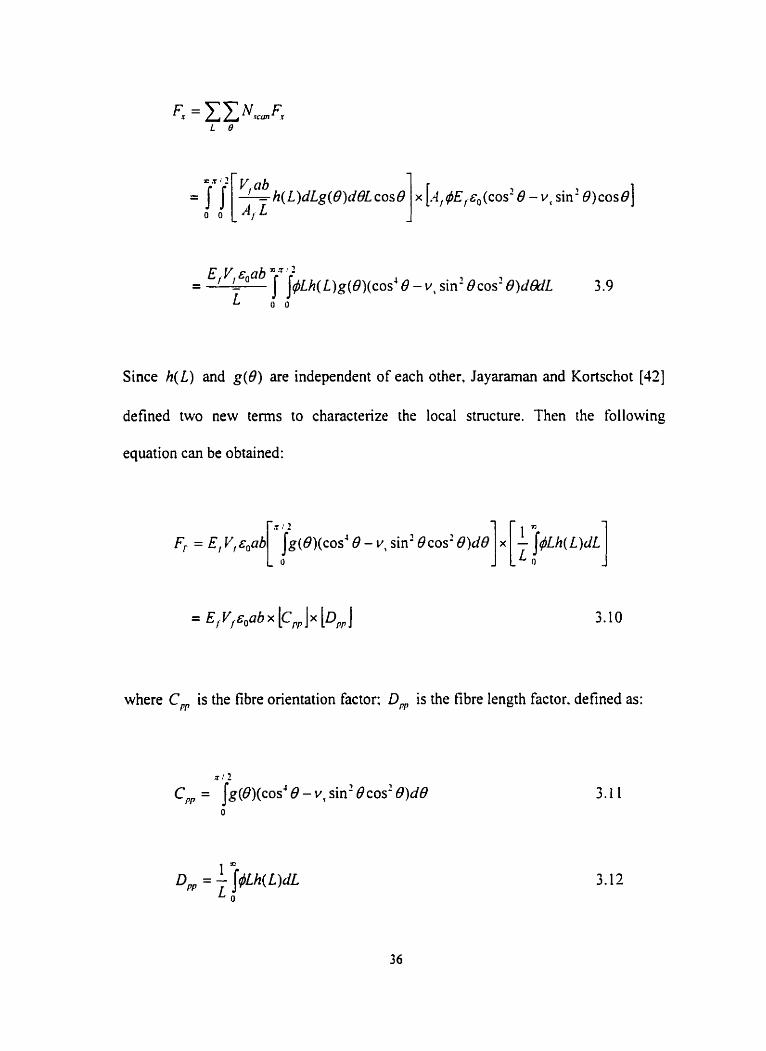
= [ [ [ ~ h ( L ) d i g ( 6 ) d 8 L x [A,&, ro(cai2 8 - v, sin' B ~ C O S B ] 1
Since h(L) and g(B) are independent of each other, Jayaraman and Kortschot [42]
defined two new tems to characterize the local structure. Then the following
equation can be obtained:
where C, is the fibre orientation factor: D, is the fibre length factor. defined as:
In the limiting cases, if al1 the fibres in the specimen are aligned with the X-
mis, i.e., for al1 fibres: B equals 0, Eq. i3 .1 I] leads to
CPP = I
For a sheet with randomly orientated fibres. the value of C, is 113 [43][51]. The
values of Poisson ratio ( v, ) are discussed in Section 3.3.3.
Based on the mechanical interpretation (see Eq. [3.11]). C, is the single
parameter characterizing g(B) which should be best correlated to strength. Therefore,
C, introduced here was to build up a proportional correlation between fibre
orientation and paper strength for the relative strength model developed in this study
(see Secrion 3 3).
The calculation of fibre length factor Dm is very complicated since the
microstructural dimensions and shear modulus of matrix need to be computed. In this
study, since h(L) will not Vary from specimen to specimen. D, is assumed to be
constant from point to point. Therefore. only the proportional relationship between
breaking length and fibre orientation factor CPp is used in the relative strength model.
3.3.3 Local Dominant Fibre Orientation Analysis, SumC90 and C,
A new method developed in this study to characterize the local fibre
orientation is based on an analysis of the mass variation. As introduced in Section
2.2.2.3, from the grammage map for each specimen, local gradient and local
dominant orientation are analyzed based on the Scharscanski and Dodson's theory
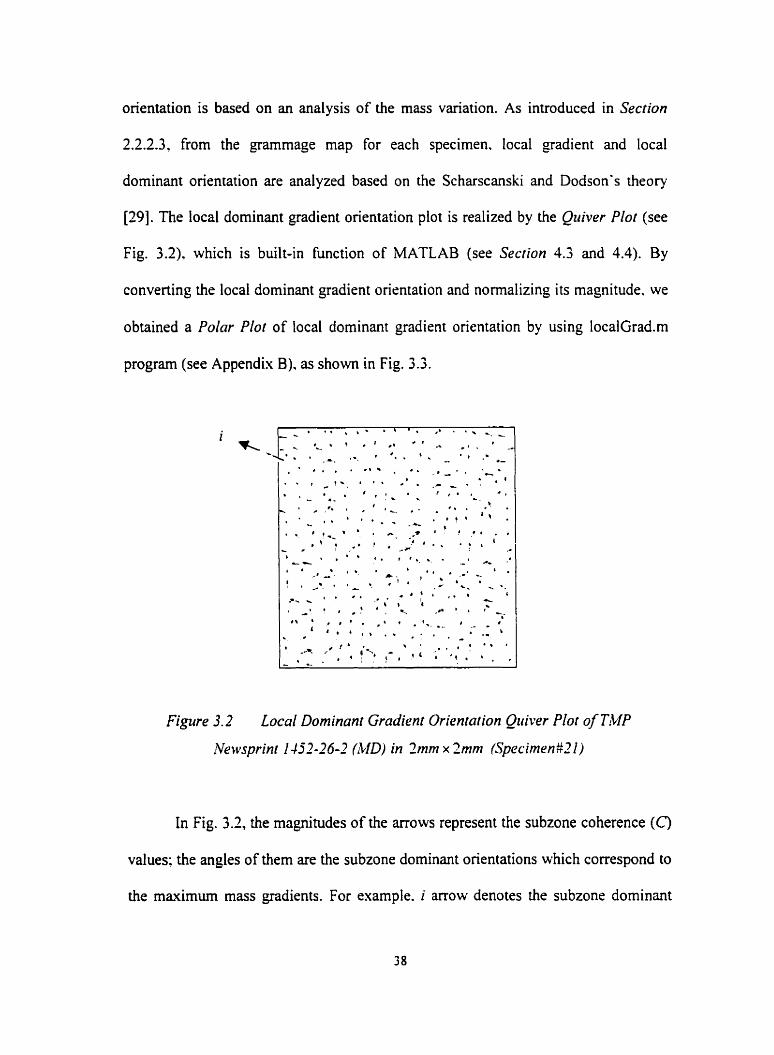
[29]. The local dominant gradient orientation plot is realized by the Qitiver Plot (see
Fig. 3.2). which is built-in function of MATLAB (see Section 4.3 and 4.4). By
converting the local dominant gradient orientation and normalizing its magnitude. we
obtained a Polar Plot o f local dominant gradient orientation by using 1ocalGrad.m
program (see Appendix B). as shown in Fig. 3.3.
i c' A . --. '.. . . . - *- . . , . e s * . * . - ' - ' C-
Figure 3.2 Local Dominant Gradient Orientation Qiiiver Plot of TMP
In Fig. 3.2, the magnitudes of the arrows represent the subzone coherence (C)
values: the angles of them are the subzone dominant orientations which correspond to
the maximum mass gradients. For example. i mow denotes the subzone dominant
orientation and its lengdi gives the magnitude along that direction.
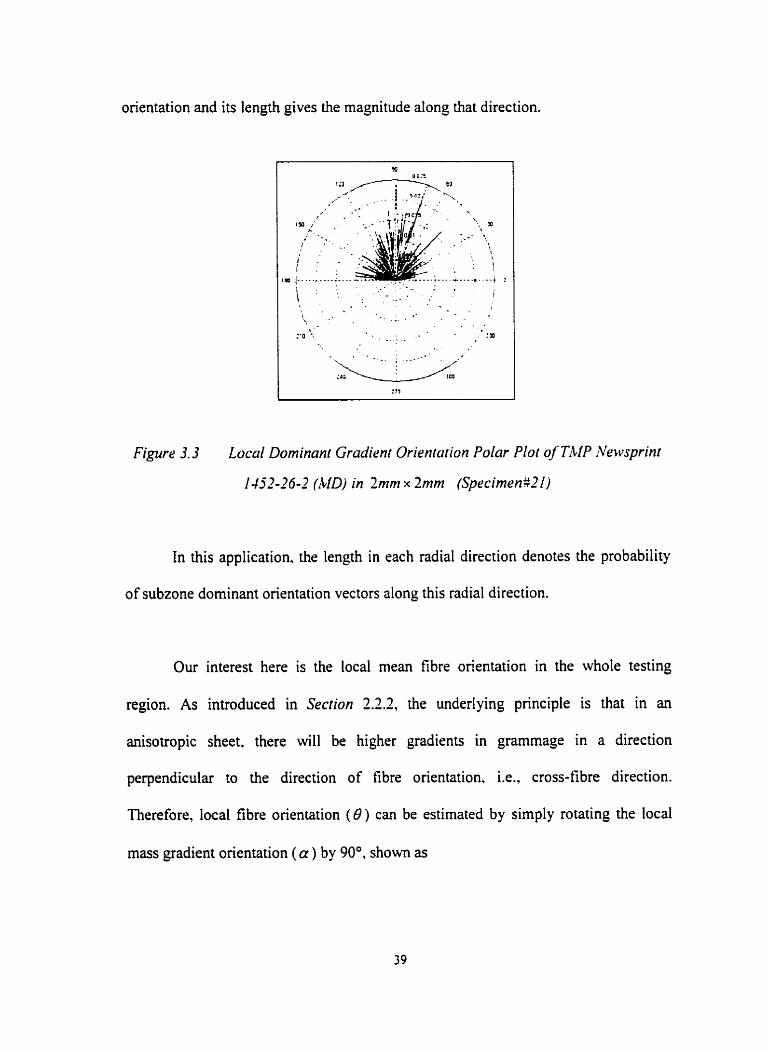
Figure 3.3 Local Dominant Gradienr Orientution Polar Plot of TUP .nlewsprinr
I./j?-26-2 (MD) in Zmm x 2mm (Specimen32 2)
In this application, the length in each radial direction denotes the probability
of subzone dominant orientation vectors along this radial direction.
Our interest here is the local mean fibre orientation in the whole testing
region. As introduced in Section 2.2.2, the underlying principle is that in an
anisotropic sheet, there will be higher gradients in grarnmage in a direction
perpendicular to the direction of fibre orientation. i.e.. cross-fibre direction.
Therefore, local fibre orientation ( O ) can be estimated by simply rotating the local
mass gradient orientation (a) by 90°, shown as
StrmC90 is defined is a simple surnmation with respect to the direction of applied
tensile stress. In the Polar Plot of Local Dominant Orientation (see Fig. 3.4), SumC90
is described as the sum of the projection of each point on the plot on 90" direction. In
other words, it can be computed by the sum of the projections of each arrow, for
example i, in the Quiver Plof of Local Dominant Orientation (see Fig 3.2) on 90" and
is then normalized over the entire zone. The cornputation of SzimC90 can be realized
by using MATLAB program (see Appendix B). Based on this definition. SzrmC90
represents the mean fibre orientation with respect to the tensile avis in the entire
region of interest and the results measured in this way have been compared to the
local tensile strength in a microtensile specimen.
In Eq. [3. If]. the probability density of the fibre orientation, g(B), can be
approximated as the probability of local dominant gradient (mass) orientation. which
equals the radius along a on the Plolar Plot of Local Dominant Orientation (see Fig.
?r /T 3.3). Then, by summation from - - to - over the testing zone instead of the integral
2 2
in Eq. [3.11], the fibre orientation factor C, is obtained for each specimen. The
computation of C,, is realized by using MATLAB prograrn (see Appendix B).
SumC90 is a simple sum of the projections of local dominant gradient
orientation on 90". i.e., the mean fibre orientation with respect to the tensile axis in
the entire zone. Whereas, based on mechanical interpretation in Cox Theory. C, is
defined as the theoretical contribution of fibre orientation distribution to tensile
strength.
In the limiting case of a specimen with unidirectional orientation along the
testing direction (see Fig 3.4). i.e.. 4 = O" a, = 90" for al1 fibres. then SumC90 = 1 ,
C, = 1 . On the other hand, if all the fibres are transverse to the testing direction,
theoretically SumC90 = O , C, = O.
As introduced in Section 3.3.2. D,, can be treated as a constant since ihere
should be no significant difference in h(L) from specimen to specimen. Therefore.
D, is not considered as a structural variable. From Eq. [3. IO], we can get the
relationship as:
where. T is the breaking Iength of a specimen.
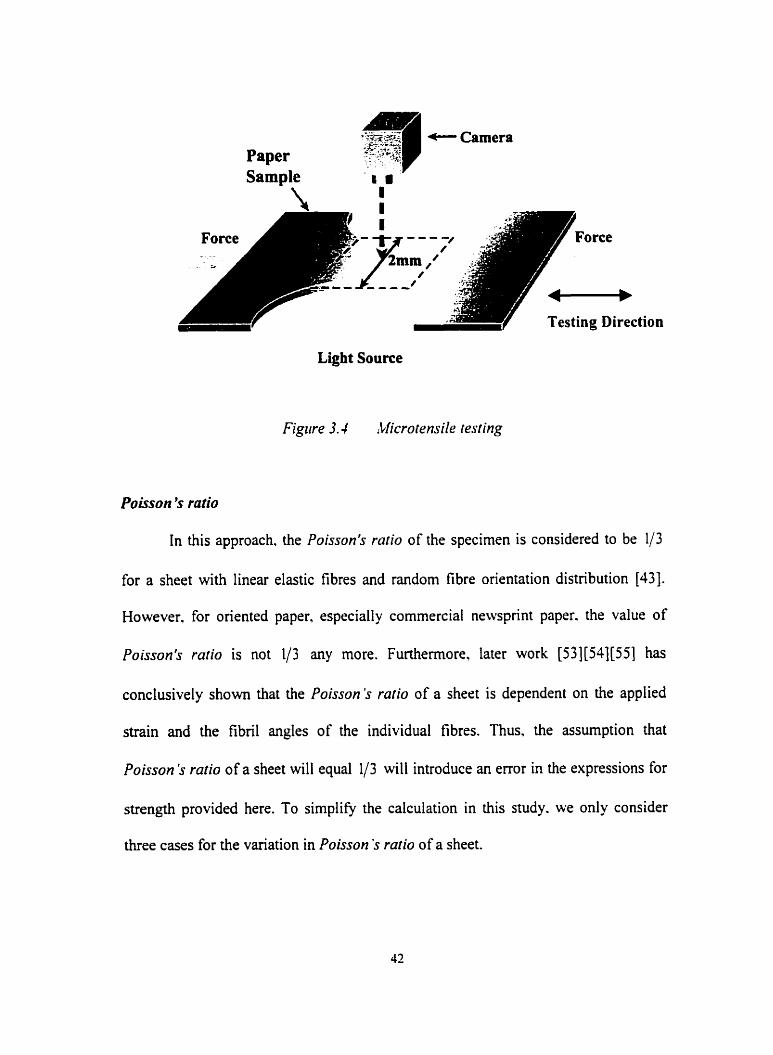
Paper Sample P m
I
Testing Direction
Light Source
Figure 3.4 Microtensile resting
Poisson 's ratio
In this approach. the Poisson's ratio of the specimen is considered to be 113
for a sheet with linear elastic fibres and random fibre orientation distribution [43].
However, for oriented paper, especially commercial newsprint paper. the value of
Poisson's ratio is not 113 any more. Furthermore. later work [53][54][55] has
conclusively s h o w that the Poisson's ratio of a sheet is dependent on the applied
strain and the f ibd angles of the individual fibres. Thus. the assumption that
Poisson's ratio of a sheet will equal 113 will introduce an error in the expressions for
strength provided here. To simpliQ the calculation in this study. we only consider
three cases for the variation in Poisson S ratio of a sheet.
1. In the case of regular handsheets, since random fibre orientation distribution
can be assumed, as a general principle, the variation in Poisson's ratio is
ignored and taken as a constant value of 113.
2. In the case of machine made paper on the CD direction which corresponds to
SumC9O = O theoretically, the Poisson S ratio is assumed to be O.
3. In the case of machine made paper on the MD direction which corresponds to
SumC90 = 1 theoretically, the Poisson 's ratio is also taken as 113 .
3.4 RELATIVE BONDED AREA
3.4.1 Introduction
The mechanism of failure depends on the balance between the strength of the
fibres and the strength of fibre-fibre bonds. Thus RBA is an important variable to
predict the strength and the stress-strain behaviour of paper. Based on the bonding
index theory (see Section 2.2.3), local variations in bonding have been represented.
By combining the Page equation and Kane theory. a relationship between local tensile
strength and local RBA is built up. In this study, the mean bonding index ( T/T, )
over the entire testing zone (2mm x 2mm ) is used to represent local RBA value for
each specimen. Global variations in RBA were obtained by changing wet pressure for
handsheets.
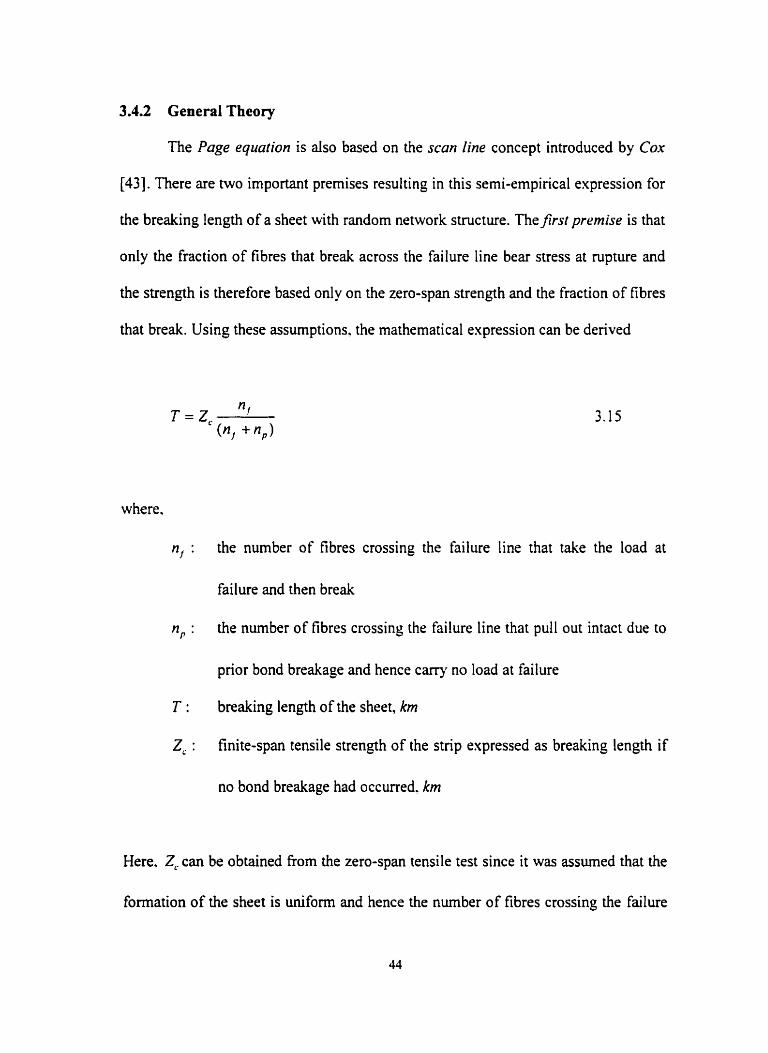
3.4.2 General Theory
The Page equation is also based on the scan Zine concept introduced by Cox
[43]. There are two important premises resulting in this semi-empirical expression for
the breaking !en@ of a sheet with random network structure. Thejirst premise is that
only the fraction of fibres that break across the failure line bear stress at rupture and
the strength is therefore based only on the zero-span strength and the fraction of fibres
that break. Using these assumptions. the mathematical expression c m be derived
where.
n, : the nurnber of fibres crossing the failure line that take the load at
failure and then break
n, : the nurnber of fibres crossing the failure line that pull out intact due to
p ior bond breakage and hence cany no load at failure
T : breaking length of the sheet, km
2, : finite-span tensile strength of the strip expressed as breaking length if
no bond breakage had occurred. km
Here. Z, can be obtained fiom the zero-span tensile test since it was assumed that the
formation of the sheet is uniform and hence the number of fibres crossing the failure
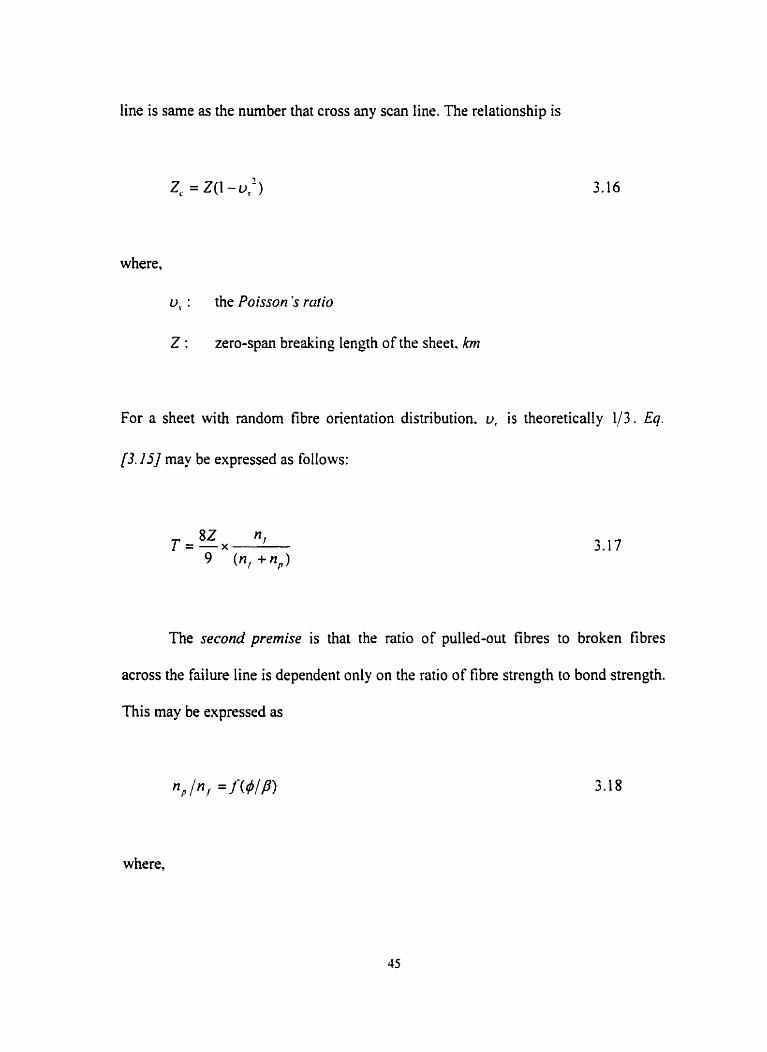
line is same as the nurnber that cross any scan line. The relationship is
where,
O,. : the Poisson S ratio
Z : zero-span breaking length of the sheet. km
For a sheet with random fibre orientation distribution. v, is theoretically 113. Eq.
l3. l j] may be expressed as follows:
The second premise is that the ratio of pulled-out fibres to broken fibres
across the failure line is dependent only on the ratio of fibre strength to bond strength.
This may be expressed as
whe re,
: mean fibre strength, ~ l m '
f l : mean force applied along the fibre âuis and across the Failure line
required to pull a fibre from the sheet, N
f : dirnensioniess Function
Here, p is a function of the relative bonded area of a sheet ( M A ) . the bond strength
per unit area, and fibre length. Assuming that al1 fibre-to-fibre bonds act cooperately
along the length of a fibre. the bond strength /? is given by:
where,
r, : shear strength of the inter-fibre bonds. iV / m'
P : penmeter of the cross-section of fibres. m
L : length of the fibre. and hence L/4 is the mean pulled length. m
RBA : reIative bonded area of the sheet
nirough some assumptions and simplifications [4]. the Page eqz~ation can be finally
defined as
where,
P :
5 :
A,. :
density of the fibre. g/m'
acceleration due to gravity. m/s2
average area of the cross-section of fibres. rn'
The Page eq~iafion is semi-empirical and based on the theory of zero-span
strength and two important premises. Although these are the major limitations of the
equation. it has been proven remarkably effective in predicting experîmental trends of
tensile strength of paper by including fibre strength and bond strength in a simple
closed form equation.
3.4.3 Implementation
From the de finition of n, and n, in the Page eqtiurion, we can define
where.
of : average tensile strength in a fibre of length L, cross-section P, average
area of the cross-section A, . N / m'
n, : the number of the fibres spanning the failure line, n, = n, + n,
Here, the total number of fibres crossing the failure line. n,. includes broken fibres
and pulled-out fibres. The paper model considered here is a thin, randomly oriented,
fibre-reinforced network structure. The tensile failure Ioad for the sheets is obtained
by surnrning the force required to either break or pull out the fibres crossing the
line. In Page equation. a proportional relationship was built up between
and (A) . In order to combine RBA with fibre orientation factor (C, ) in one
equation. a direct relationship between breaking length and local RBA (T/TK ) was
expected. Thus, different from Puge rquation. Kane throry [45] was applied in the
later sections. We consider that fibres across the failure line break or pull out
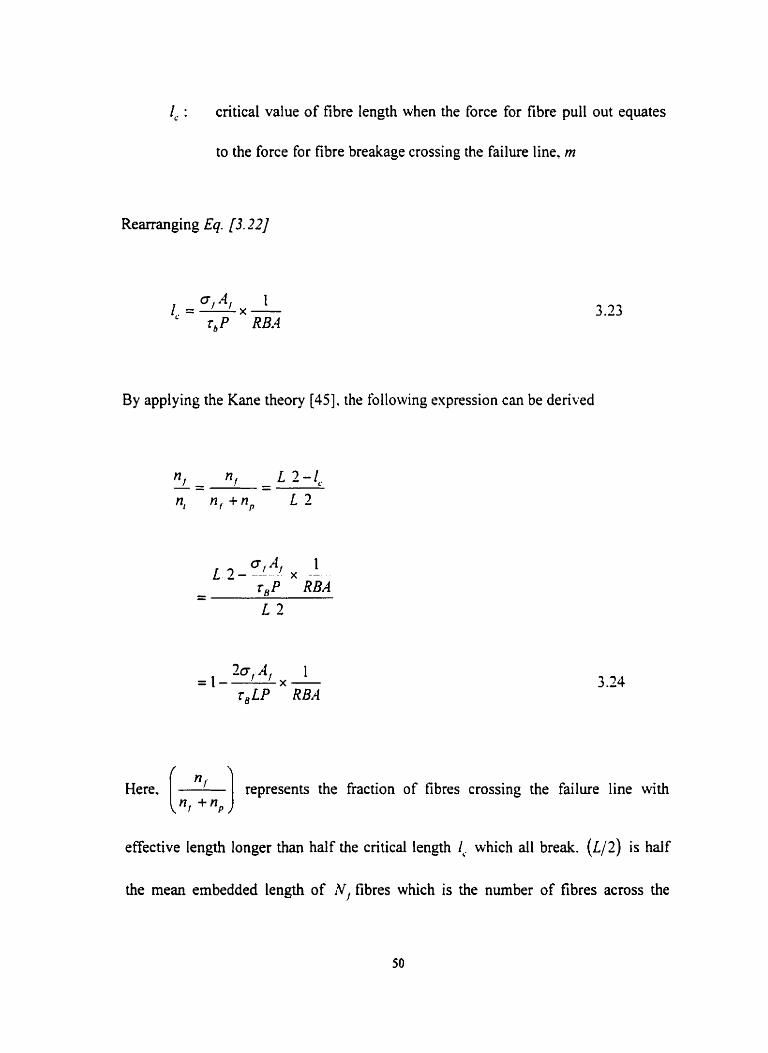
depending on their embedded length 1 [44][45]. In the case of the failure due to fibre
pull out. the fibre embedded length is less than half the critical length. 1'. . ! is the
critical value of fibre length when the force for fibre pull out equates to the force for
fibre breakage crossing the failure line. Fibres will break when the embedded length
is greater than half the critical length. For weakly bonded sheets. al1 the fibres
crossing the failure line will pull out; while for strongly bonded sheets. both fibre
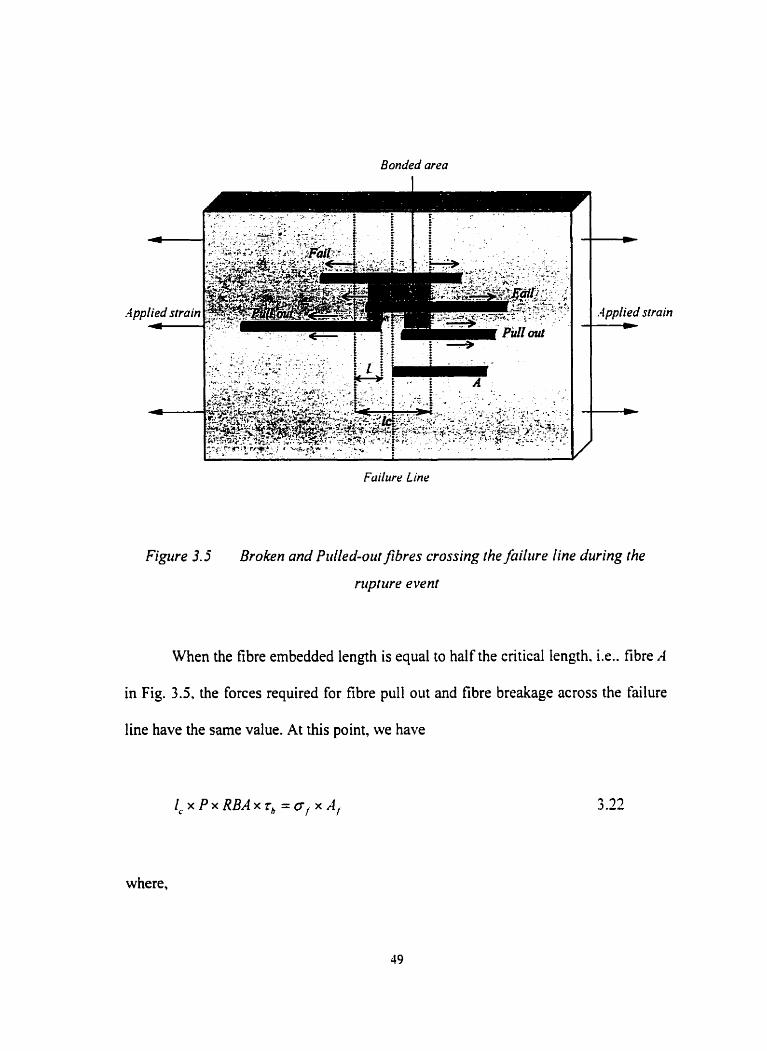
breaks and pullouts can occur. Fig. 3.5 gives the physical interpretation of the theory.
Bonded area
Figare 3.5 Broken and Puiled-out fibres crossing the faii~rre line durhg the
rirptzrre event
When the fibre embedded length is equal to half the critical length. Le.. fibre A
in Fig. 3.5. the forces required for fibre pull out and fibre breakage across the failure
line have the same value. At this point, we have
where,
1, : critical value of fibre length when the force for fibre pull out equates
to the force for fibre breakage crossing the failure line, rn
Rearranging Eq. [3.22]
By applying the Kane theory [45]. the following expression cm be derived
1 L 2 - ! ' * --
- - r,P RBA L 2
Herc. (k) reprerents the fiaction of fibres cmrsing the failure line with
effective length longer than half the cntical length (. which al1 break. ( ~ 1 2 ) is half
the mean embedded length of N, fibres which is the number of fibres across the
failure line. Then mathematically, ( L :&') cm be regarded as the haction of fibres
with the embedded length longer than half the critical length which is equal to
tensile strength of paper:
[3.17] and Eq. [3.74]. we arrived at final çquation for the
In this new approach. there are several assumptions built into the theoretical result:
1) The approach is based on a thin. randomly oriented. fibre-reinforced network
structure with a Poisson's ratio of 113 . "A scan line" perpendicular to the
direction of applied load is introduced into this structural model. And the
uniform structure is obtained by assuming that the number of fibres crossing
any scan line, e.g.. the failure line. is approximately the same and al1 the
bonds act cooperatively along the length of a fibre.
2) Only the fnction of fibres that break across the failure line bear stress at
rupture and the strength of the sheet is therefore dependent only on the zero-
span strength and the fraction of fibres that break. This came fiom the fint
premise of the Page equation.
3) The number of fibres perpendicular to the failure line is only considered here
to contribute to the tensile strength of paper. Thus. the effect of fibre
orientation on the tensile strength of paper is not fully taken into account.
Thus in this study. the implementation of Page's and Kane's theories is
limited to only two cases: the fibres that carry load at the instant of failure and break
across the failure line; the fibres that pull out due to bond breakage and therefore
carry no load at failure. However. in real sheets. especially for weakly bonded sheets.
there are a certain percentage of fibres that carry load at the instant of rupture but
subsequently pull out at failure. Furthemore. this kind of theoies is based on a "scan
line" mode1 that assume the number of fibres crossing any line in the sheet transverse
to the direction of applied load is approximately the sarne and al1 fibre-to-fibre bonds
act cooperatively along the length of a fibre. In this case. the effect of fibre
imperfections. such as microcompressions, curls and crimps. was ignored. However,
in real sheets. this kind of microstmctural features changes the stress-strain behaviour
of the fibre. These are the major limitations of this study.
From this approach. we intend to correlate the relationship between the tensile
strength of paper and RBA. Then. from Eq. [3.2j]. we have
k T K (1--)
RBA
Here, k (k > O) is a fùnction of the microstructural parameters, i.e.. [%\,
and the fibre and bond properties. Le.
impact of local structural variations
(5). Çince this study mainly focuses on the
in fibre orientation and RBA on the tensile
strength of paper, an effort is made to correlate these two local structural properties
with the local tensile strength in a single sheet and k can be treated as a constant. As a
result, instead of an absolute correlation between the tensile strength and local RBA,
a proportional relationship referred to Eq. [3.?6] is obtained.
3.5 RELATIVE STRENGTH MODEL
In this study. the problem of modelling local bonding and local fibre
orientation simultaneously can be simplified by cornbining Eq. [3.14] and Eq. [3.26].
From
then, we have the final expression for the tensile strength or breaking length:
k T Cpp( l - - ) or
RBA
k Breaking Length oc CJ1- -)
RBA
Here, to simpliQ
constant value. it
measurement and calculation. k is considered as an unknown
can be calculated by plotting (5) against (&) uith the
m;tuimum correlation coefficient value. Tnus. we have
Predicted Brenking Length = rnC, - - (l R P A )
where. m is an unknown constant. The cornparison between the experimental data and
theoretical results is obtained by plotting Breaking Length (Exp.) vs. Predicled
Breaking Length. Again. since we intend to correlate the variability in local tensile
strength to local structural features of the sheet. the absolute value of RBA or
breaking length is not required. Thus. the local bonding index ( T/T, ) is used instead
of local RBA and the calculation of m is ignored in this study. The Eq. [3.28] may be
simpli fied:
Predicted Breaking Length or Cpp (I -&)
Based on this sirnplified equation, the computaiion of Predicted Breaking Length is
introduced in Section 5 .S.

CHAPTER FOUR
EXPERIMENTAL PROCEDURE
4.1 PREPARATION OF PAPER SPECIMENS
Standard handsheet specirnens used in this study were made from softwood
Kraft pulp (Aspen) according to CPPA Standard C4. There was one modification in
the procedure: in order to control the formation of the sheets. flocculation was
increased from standard isotropie handsheets (no settling time) by introducing a two-
minute senling time before drainage of water from the handsheet maker.
By modifying CPPA Standard C4, which involves wet pressing the sheets at
400psi, handsheet specimens with changing wet pressure were prepared fiom
softwood Kraft pulp (Aspen) at a series of pressing pressures (300psi. 400psi. and
500psi) to change the global mean bonded areas.
Handsheets with local orientations were obtained from softwood Kraft pulp
(Aspen) by stirring the water and introducing vortices, just before draining the
handsheet maker. The images of oriented handsheets were analyzed by both the new
method developed in this study for the estimation of fibre orientation (see Section 3.3
and Section 4.4) and the polarized far-infrared wave transmission rneasurement (FIR)
method [2 71 [28].
Two kinds of TMP Newsprint (1452-26-2 and 1452-1 7-4) machine made
paper were used in this study. The specirnens were cut along the cross-machine
direction (CD) and machine direction (MD) respectively by using Lab made micro-
tensile sample cutter with the testing zone of h m x h m .
4.2 METHODOLOGY
In Fig. 4.1. the methodology of this study is presented.
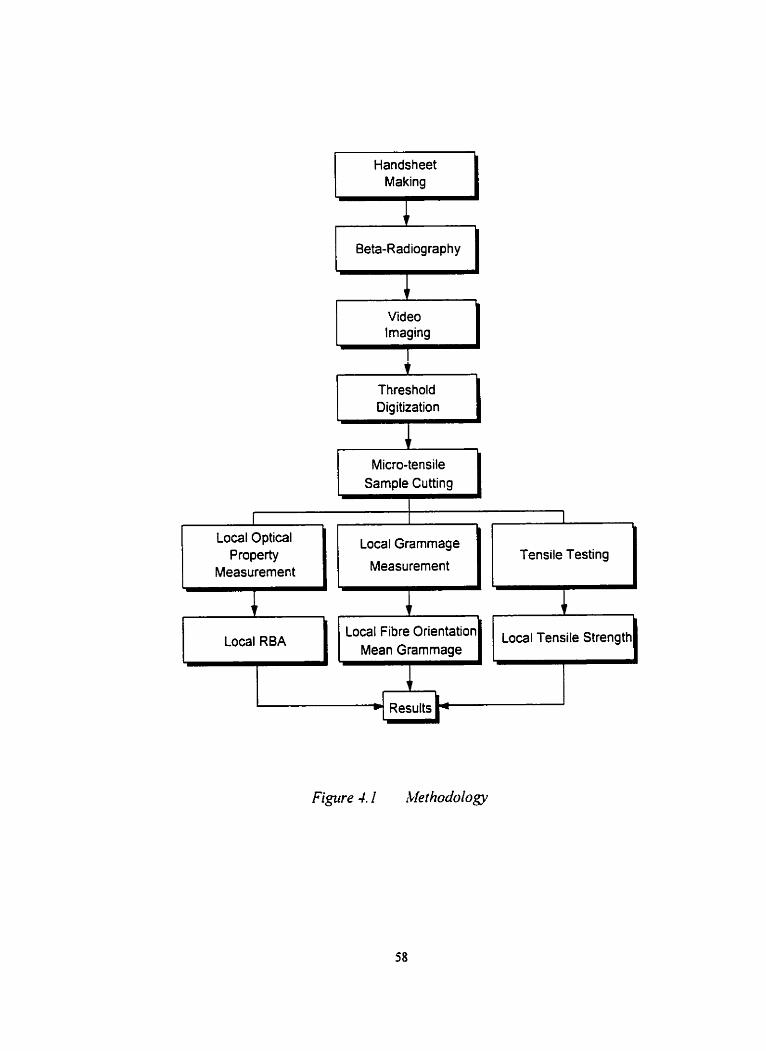
Handsheet Making
Beta-Radiography
Video Imaging
Threshold
Micro-tensile Sarnple Cutting I
Local Optical l Local Grammage Property
Measurement Measurement I l l Local Fibre Orientation
Local RBA Mean Grammage 1
/ Tensile Testing
Local Tensile Strength î Figure 4.1 ~\.lerhodology
4.3 GRAMMAGE MEASUREMENT
- Source 7-\
Dig itiza fion &
Ca/ibration
Figure 4.2 Video Bera- Rndiography
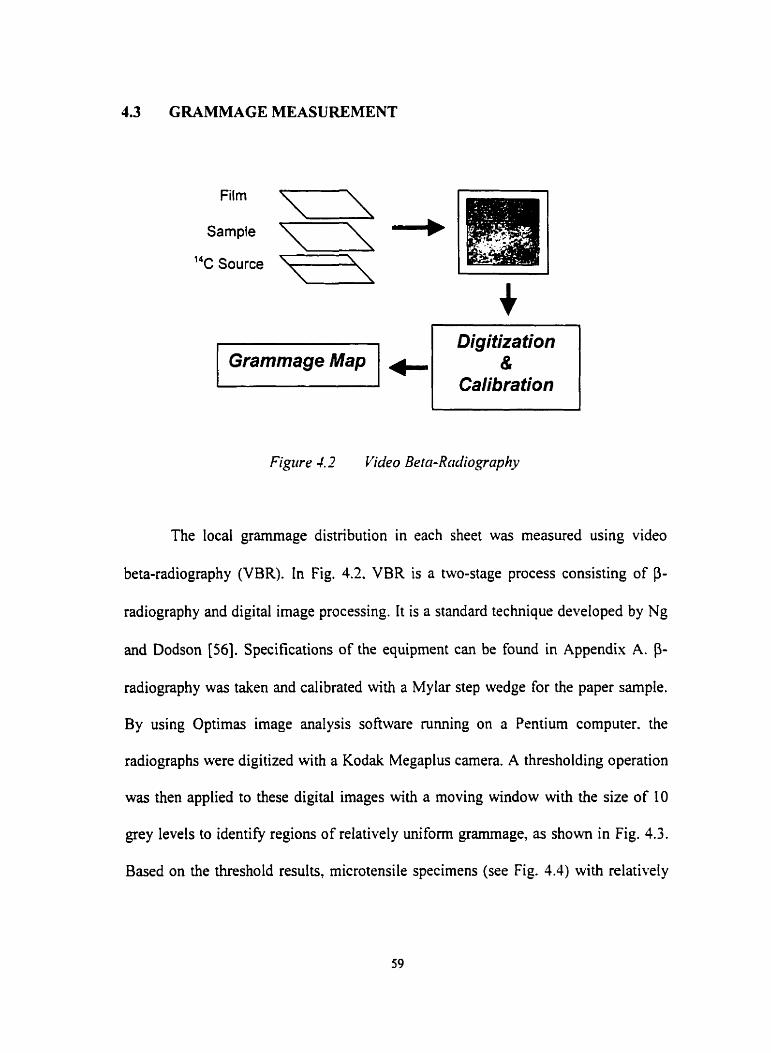
The local grammage distribution in each sheet was measured using video
beta-radiography (VBR). In Fig. 4.2. VBR is a two-stage process consisting of P-
radiography and digital image processing. it is a standard technique developed by Ng
and Dodson [56]. Specifications of the equipment can be found in Appendix A. B-
radiography was taken and calibrated with a Mylar step wedge for the paper sample.
By using Optimas image analysis software ninning on a Pentium cornputer. the
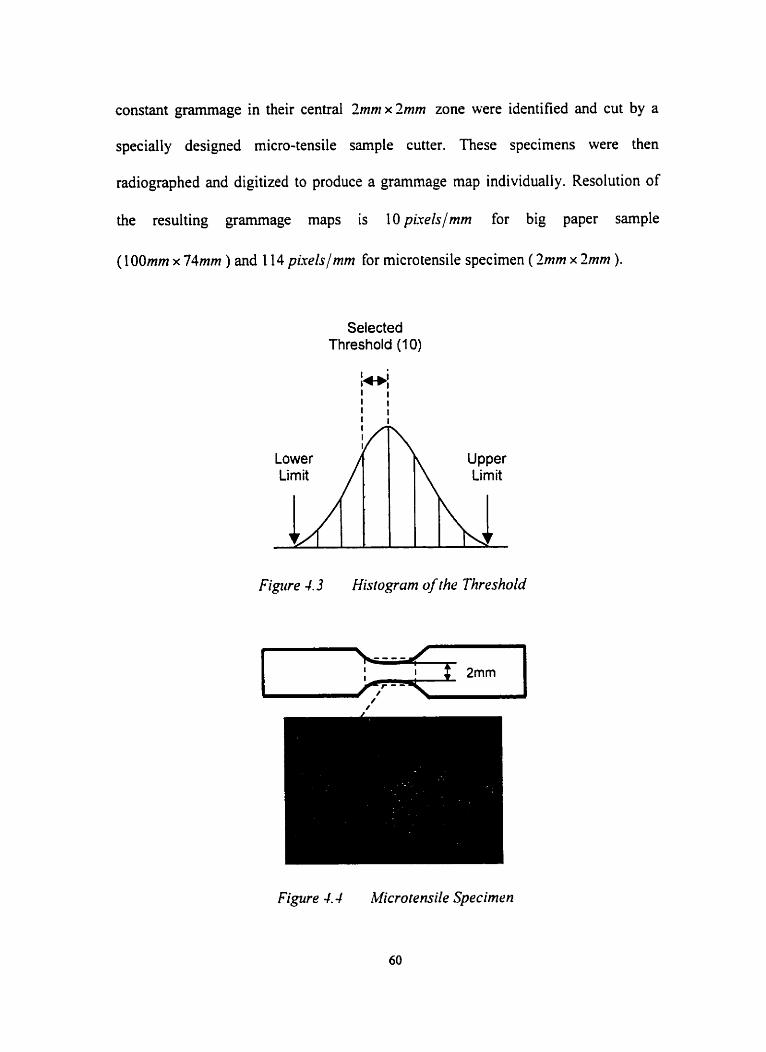
radiographs were digitized with a Kodak Megaplus camera. A thresholding operation
was then applied to these digital images with a moving window with the size of 10
grey Ievels to identiS, regions of relatively uniform grammage, as shown in Fig. 4.3.
Based on the threshold results, microtensile specimens (see Fig. 4.4) with relatively
constant grarnmage in their central 2mm x 2mm zone were identified and cut by a
specially designed micro-tensile sample cutter. These specimens were then
radiographed and digitized to produce a grarnmage map individually. Resolution of
the resulting gramrnage maps is 10 pixelslmrn for big paper sample
( 1 00mm x 74mm ) and 1 14 pirels/mm for microtensile specimen ( 2mrn x Zmm ).
Selected Threshold (1 0)
Lower limit /
Figure 4.3 Histograrn of the Threshold
Figure 4.4 Microtensile Specimen
From the video image of the microtensile specimen, the texture-related
information in the greyscale image is digitized and recorded as a bitrnap of grey
levels, which is in fact a two-dimensional histograrn of image based on the density
variation. To extract local variations in grammage, we have developed a recursive
algorithm for the computation of local gradients based on Scharscanski and Dodson's
theory (see Section 2.2.2).
MATLAB programming is used in this study to implement this image and
signal processing on the grammage maps. The gray scale image is converted to
grammage map using the calibration curve. Thus grammage of the cal i bration wedges
and their corresponding gray levels on the P-radiognph form a group of calibration
values in the format: (gray level. grammage). Polynomial fitting is used to connect
these points into a curve. as s h o w in Fig. 4.5. With this calibration curve. gray scale
image can be converted to a corresponding grammage map. The computed results of
rnean grammage ( g and CV') for each specimen are used for strength modelling
later on. For details of the program 1ocalGrad.m. see Appendix B for the source code
and comments.
For large handsheet or machine made samples, a similar MATLAB program
(g1obGrad.m) was applied except lower resolution and larger size of operaior window
and inspection zone. The detailed information can be found in Appendix C.
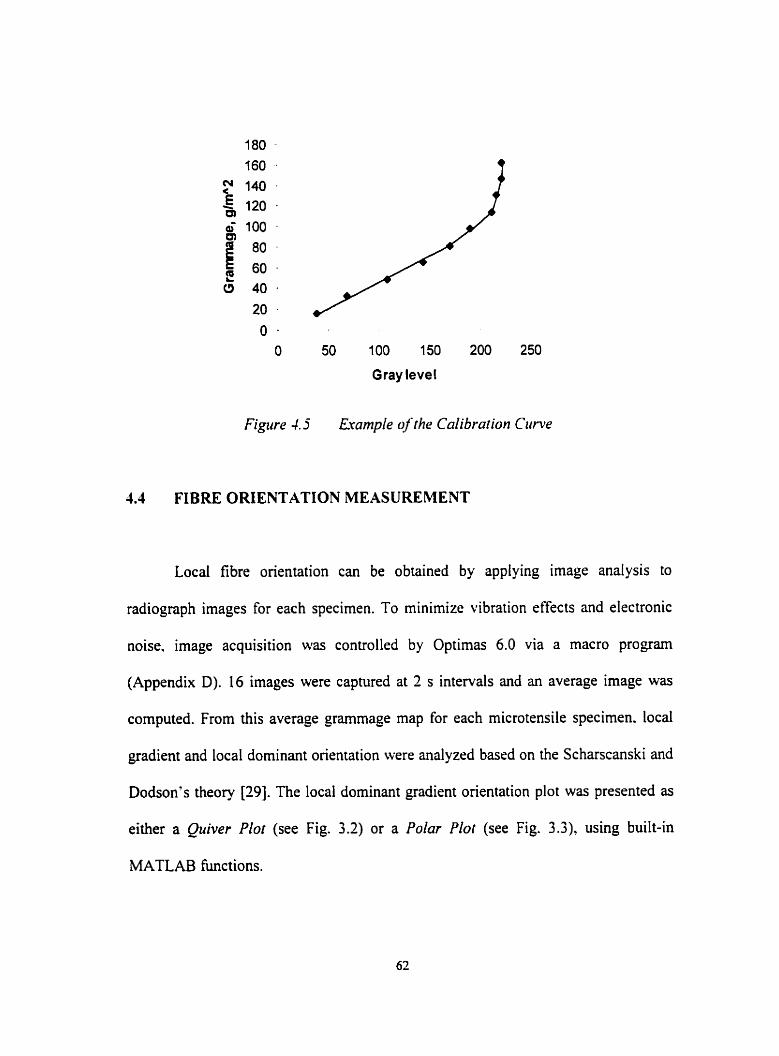
O - O 50 100 150 200 250
Gray level
Figure 4.5 Erample ofihe Calibraiion Cwve
4.4 FIBRE ORIENTATION MEASUREMENT
Local fibre orientation can be obrained by applying image analysis to
radiograph images for each specimen. To minimize vibration effects and electronic
noise. image acquisition was controlled by Optimas 6.0 via a macro prograrn
(Appendix D). 16 images were captured at 2 s intervals and an average image was
computed. From this average grammage map for each microtensile specimen. local
gradient and local dominant orientation were analyzed based on the Scharscanski and
Dodson's theory [29]. The local dominant gradient orientation plot was presented as
either a Quiver Plot (see Fig. 3.2) or a Polar Plot (see Fig. 3.3), using built-in
MATLAB functions.
As introduced in Section 3.3.3, the mean fibre orientation factors ( C,, and
SumC9O ) for each specimen were computed and used for strength modelling later on.
For details of the program 1ocalGrad.m and g1obGrad.m. see Appendix B and C
respectively for the source code and comments.
To calibrate the mean fibre orientation factors ( C, and SumC90 ) used in this
study, the optical images for oriented handsheet and machine made samples were
obtained from the Chemistry Department in Laval University, Quebec. A polarized
far-infrared wave transmission measurement was based on the observation of the
dichroic behaviour of paper in the fàr infrared [27][28]. The technique has a spatial
resolution varying from lmm2 to several square centimeters. The results for both
oriented handsheet samples ( 1 Ocm x 1 Ocm ) and machine made samples
( 7.6cm x 10cm ) are presented in Section 5.4.3. Here, the resolution of the FIR
measurement was 1.96mmJpo int ; the inspection zone was 3mm x 3mm square; each
sarnpled point was characterized for three parameters: basis weight. the magnitude of
anisotropy of fibre orientation and the angle of the dominant fire orientation. Thus
one arrow on the graphical images represents a window size around 5mm x 5mm
square.
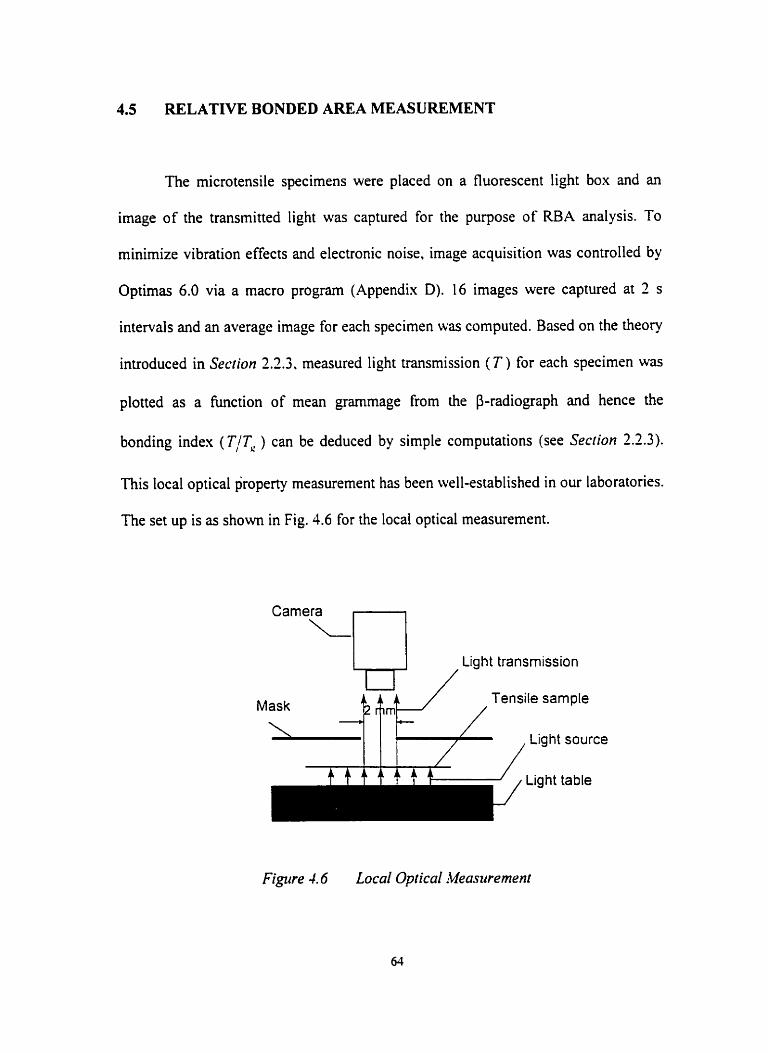
4.5 RELATIVE BONDED a A MEASUREMENT
The microtensile specimens were placed on a fluorescent light box and an
image of the transmitted light was captured for the purpose of RBA analysis. To
minimize vibration effects and electronic noise. image acquisition was controlled by
Optimas 6.0 via a macro program (Appendix D). 16 images were captured at 2 s
intervals and an average image for each specimen was computed. Based on the theory
introduced in Section 2.2.3. measured light transmission ( T ) for each specimen was
ploned as a h c t i o n of mean grammage from the P-radiograph and hence the
bonding index (T /Tg ) can be deduced by simple cornputations (see Section 2.2.3).
This local optical property measurement has been well-established in Our laboratories.
The set up is as shown in Fig. 4.6 for the local optical measurement.
Camera ,-,
1 1 Liciht transmission
Mask 8xc / , Tensile sample
Fisire 1.6 Local Optical Measurement
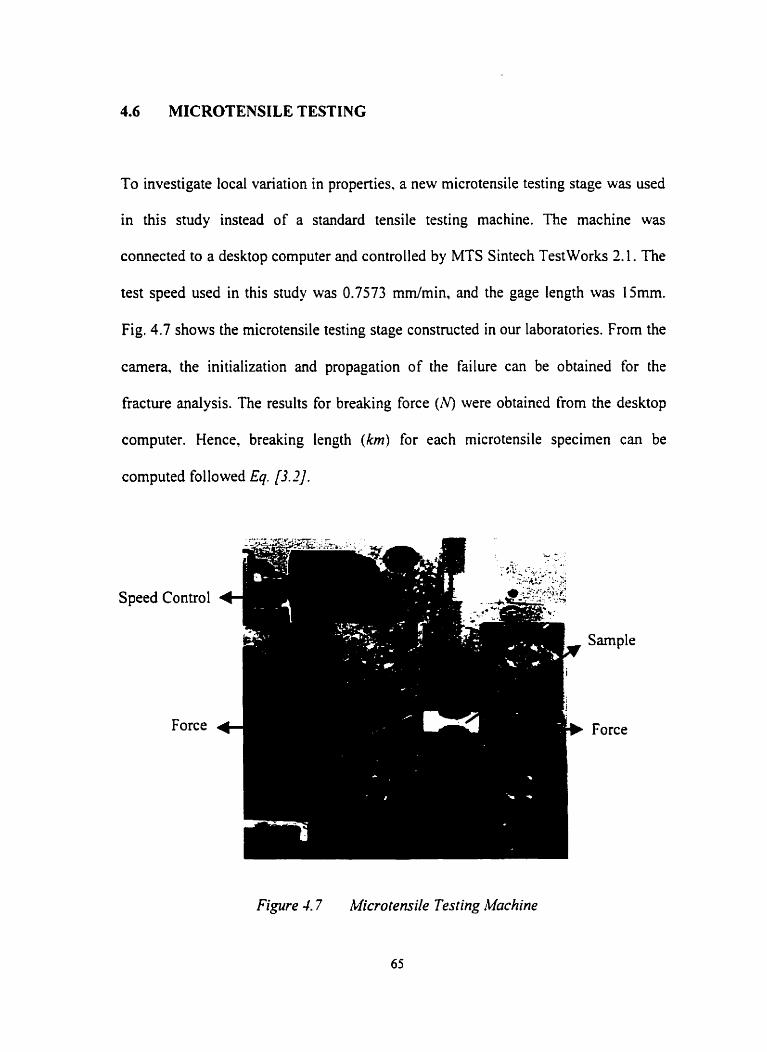
4.6 MICROTENSILE TESTING
To investigate local variation in properties, a new microtensile testing stage was used
in this study instead of a standard tensile testing machine. The machine was
comected to a desktop computer and controlled by MTS Sintech TestWorks 2.1. The
test speed used in this study was 0.7573 mm/min, and the gage length was Ijmm.
Fig. 4.7 shows the microtensile testing stage constructed in Our laboratories. From the
camera, the initialization and propagation of the failure can be obtained for the
fracture analysis. The results for breaking force (IV) were obtained from the desktop
computer. Hence, breaking iength (km) for each microtensiie specimen can be
computed fol 10 wed Eq. [3.2].
Speed
Force
Sample
Force
Figure 4.7 Microtensile Tesring Machine
CHAPTER FIVE
RESULTS AND DISCUSSION
5.1 INTRODUCTION
For each handsheet and machine made çpecimen. the rnean grammage (g ).
coefficient of variation of grarnmage (CC., ). fibre orientation factors ( StîmC90 and
Cr,, ), bonding index (T/T' ). and predicted and experimental breaking length were
computed. We thrn tried to correlate these structural parameters to local breaking
length of 2mm x 2mm specimens.
To confirm our methods. global variations in bonding and fibre orientation
were measured. in this study, global variations in bonding were created by changing
the wet pressure for handsheets. and global variations in fibre orientation were
created by selecting the specimens from MD to CD directions in commercial machine
made paper. Cornparisons between the results of our new method for local fibre
orientation and the polarized far-infrared wave transmission measurement (FIR) of
local fibre orientation (from Laval University in Quebec) are described in Section
5.4.3.
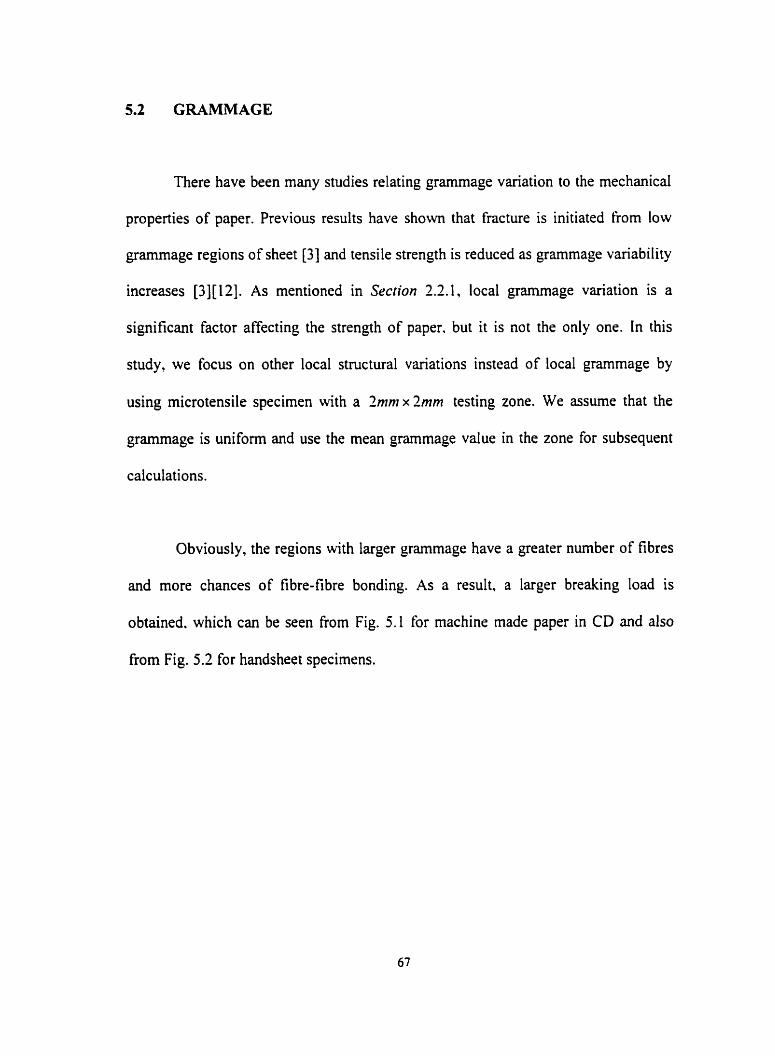
5.2 GRAMMAGE
There have been many studies relating grammage variation to the mechanical
properties of paper. Previous results have s h o w that fracture is initiated from low
grammage regions of sheet [3] and tensile strength is reduced as grarnmage variability
increases [3][12]. As mentioned in Section 2.2.1, local grammage variation is a
significant factor affecting the strength of paper. but it is not the only one. In this
study, we focus on other local structural variations instead of local grammage by
using microtensile specimen with a Imm x 2mm testing zone. We assume that the
grammage is uniform and use the mean grarnmage value in the zone for subsequent
calculations.
Obviously, the regions with larger grarnmage have a greater number of fibres
and more chances of fibre-fibre bonding. As a result, a larger breaking load is
obtained. which can be seen from Fig. 5.1 for machine made paper in CD and also
from Fig. 5.2 for handsheet specimens.
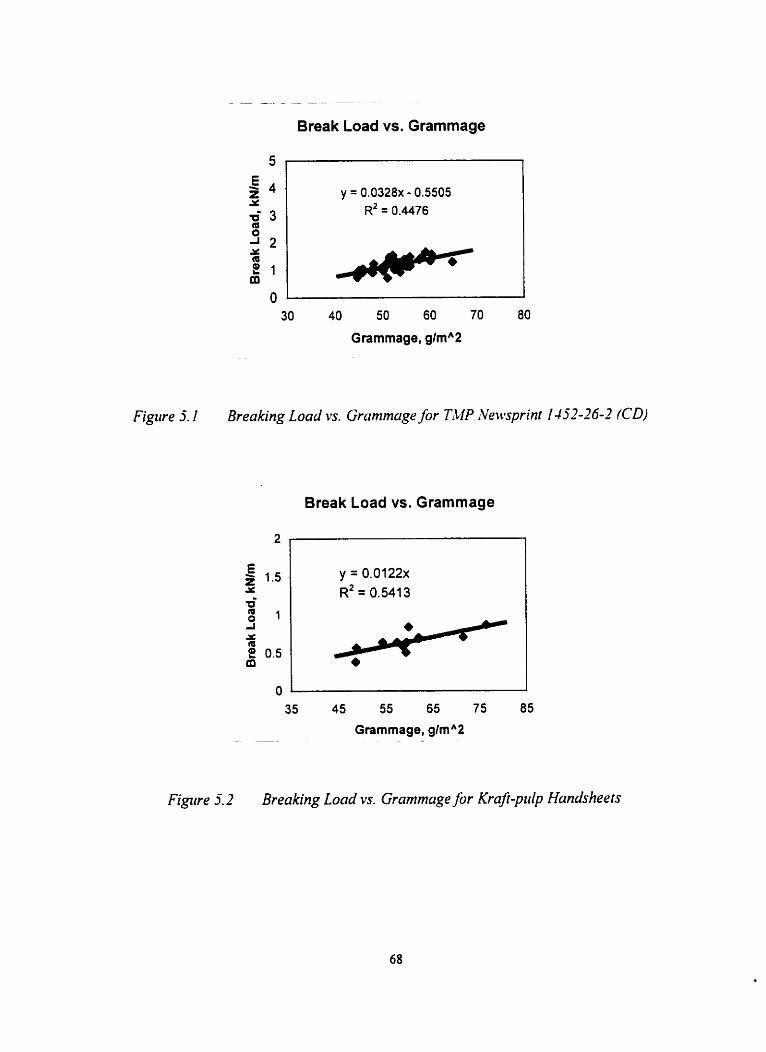
Break Load vs. Grammage
30 40 50 60 70 80
Grammage, glmA2
Figrre 5. I Breaking Load vs. Gromrnuge for TMP Newprinf fAK?-26-2 (CD)
Break Load vs. Grammage
35 45 55 65 75 85
Grammage, glmA2 . -
Figure 5.2 Breaking Load vs. Grammage for Kraft-pr lp Handshee fs
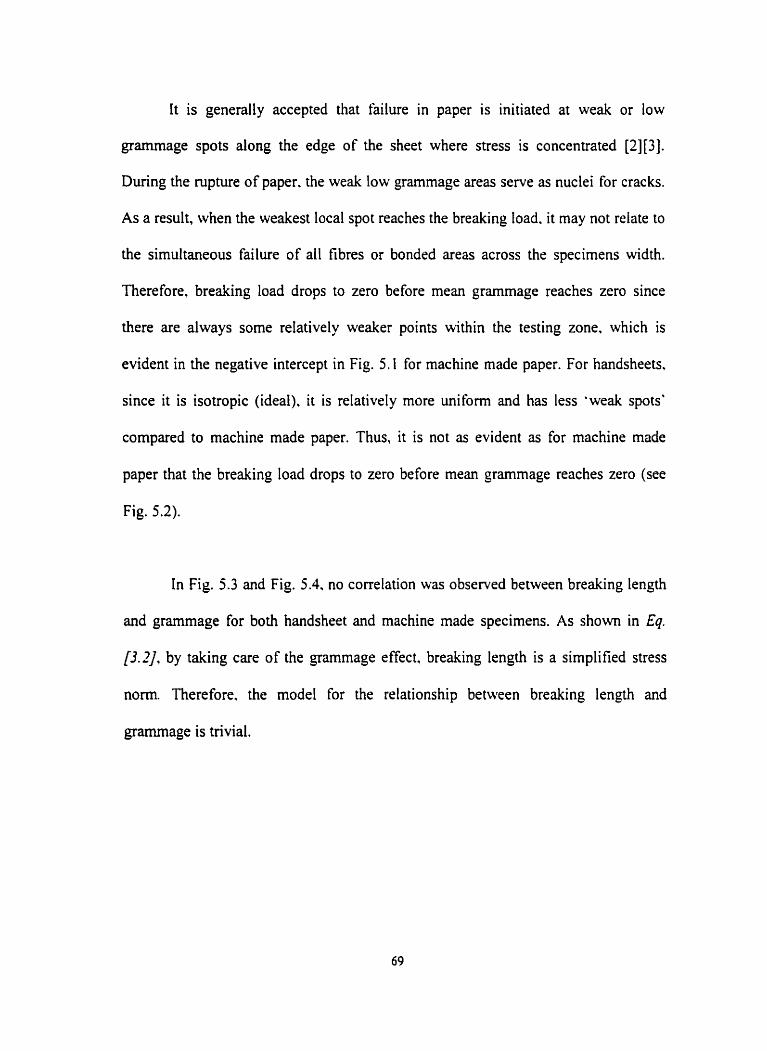
It is generally accepted that failure in paper is initiated at weak or low
grammage spots along the edge of the sheet where stress is concentrated [2][3].
Dunng the rupture of paper. the weak low grammage areas serve as nuclei for cracks.
As a result, when the weakest local spot reaches the breaking load. it may not relate to
the simultaneous failure of al1 fibres or bonded areas across the specirnens width.
Therefore, breaking load drops to zero before mean grammage reaches zero since
there are always some relatively weaker points within the testing zone, which is
evident in the negative intercept in Fig. 5.1 for machine made paper. For handsheets,
since it is isotropie (ideal). it is relatively more uniform and has less 'weak spots'
compared to machine made paper. Thus, it is not as evident as for machine made
paper that the breaking load drops to zero before mean grammage reaches zero (see
Fig. 5.2).
In Fig. 5.3 and Fig. 5.4. no correlation was observed betwcen breaking length
and grammage for both handsheet and machine made specimens. As shown in Eq.
[3.2], by taking care of the grammage effect, breaking length is a simplified stress
nom. Therefore. the mode1 for the relationship between breaking length and
grammage is trivial.
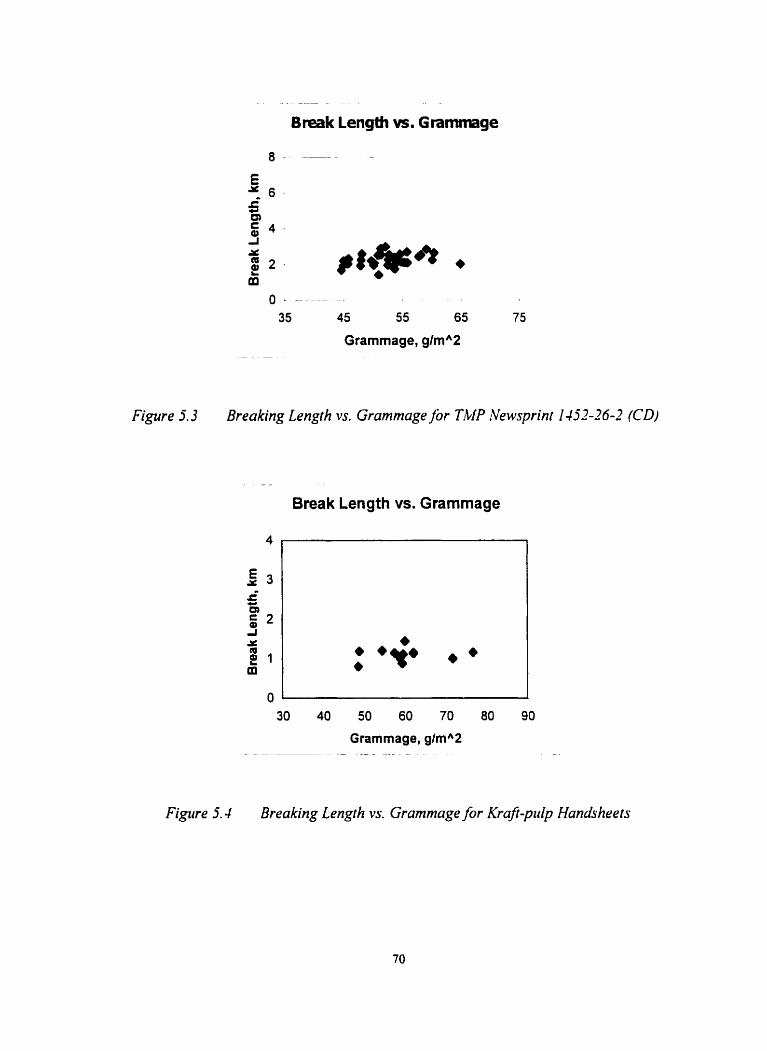
- - - -
Break Length vs. Grammage
Grammage, glmA2
Figure 5.3 Breaking Length vs. Grammage for ThP Newsprin f 1 -/52-26-? (CD)
Break Length vs. Grammage
4n
Grammage, glmA2 - - - - . - - - - - - - -
Figure 5. J Breaking Length vs. Grammage for Kru) p r l p Handsheets
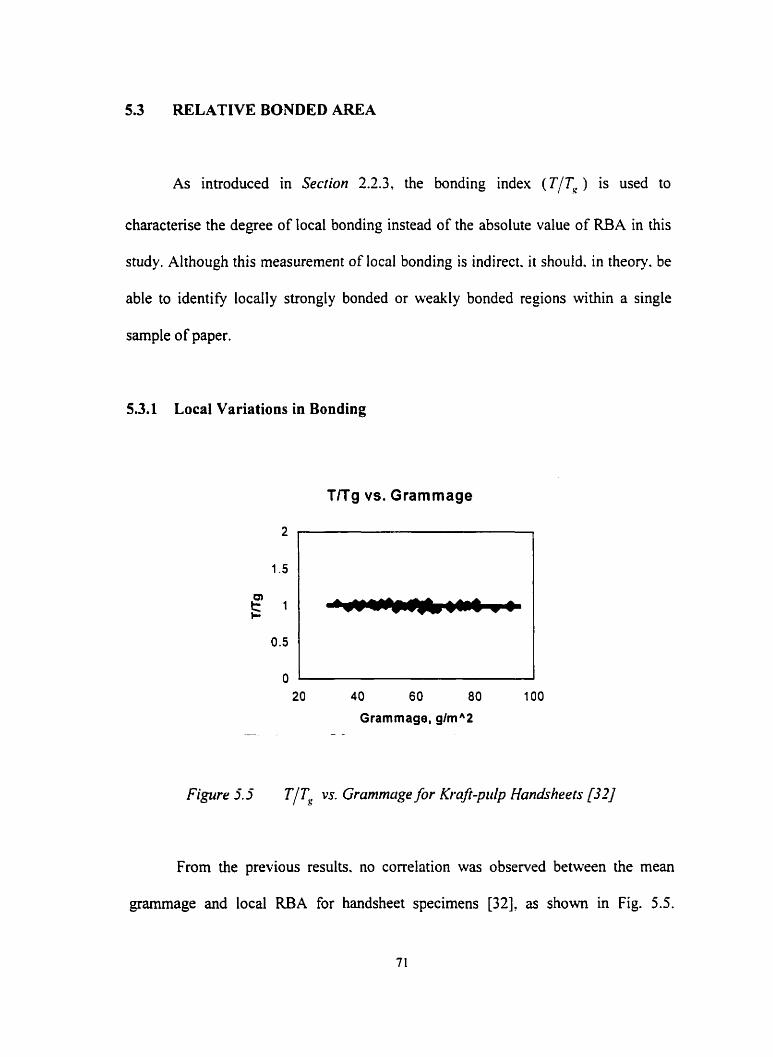
5.3 RELATIVE BONDED AREA
As introduced in Section 2.2.3, the bonding index (T /T , ) is used to
characterise the degree of local bonding instead of the absolute value of RBA in this
study. Although this measurement of local bonding is indirect. it should. in theory. be
able to identify locally strongly bonded or weakly bonded regions within a single
sample of paper.
5.3.1 Local Variations in Bonding
TlTg vs. Grammage
20 40 60 80 100
Grammage, g/mA2 --- - - -
Figure 5.5 T/T, vs. Grammage for KM-pulp Handsheets [32]
From the previous results. no correlation was observed between the mean
grammage and local RBA for handsheet specirnens [32], as s h o w in Fig. 5.5.
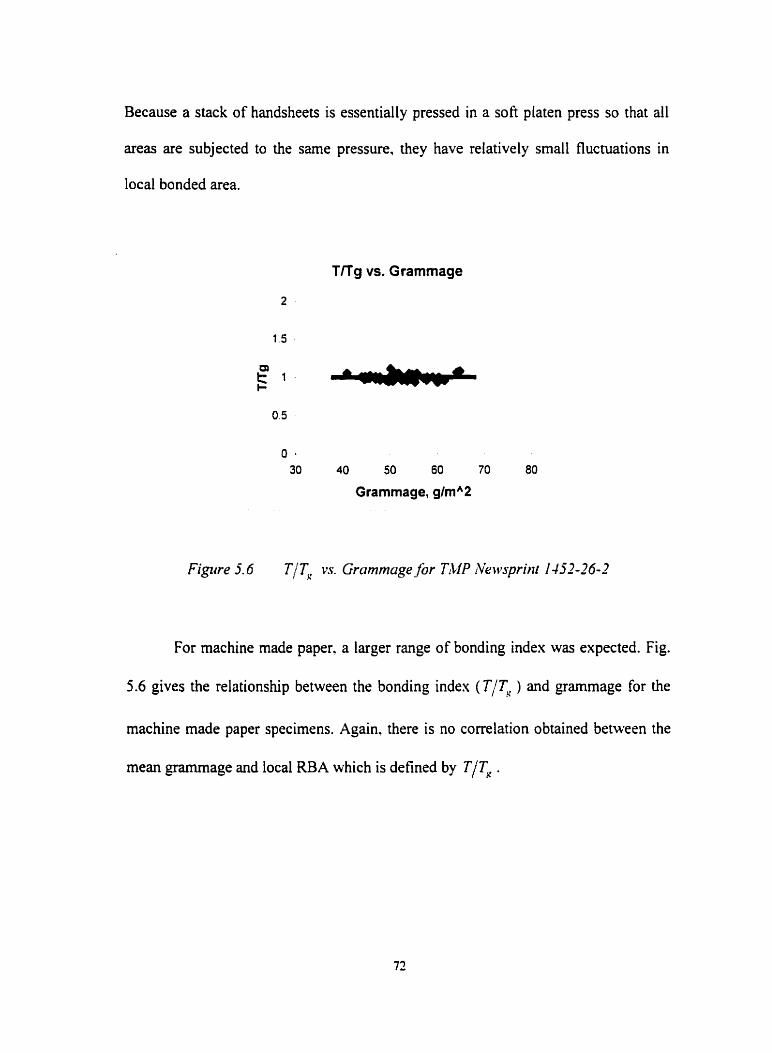
Because a stack of handsheets is essentidly pressed in a soft platen press so that all
areas are subjected to the sarne pressure, they have relatively small fluctuations in
local bonded area.
TKg vs. Grammage
2
0 - 30 40 50 60 70 80
Grammage, g/mA2
Figure 5.6 T/T, vs. Grammage for TMP i\iewsprint 1452-26-2
For machine made paper, a larger range of bonding index was expected. Fig.
5.6 gives the relationship between the bonding index ( T / q ) and grarnrnage for the
machine made paper specimens. Again. there is no correlation obtained between the
mean grammage and local RBA which is defined by T/T, .
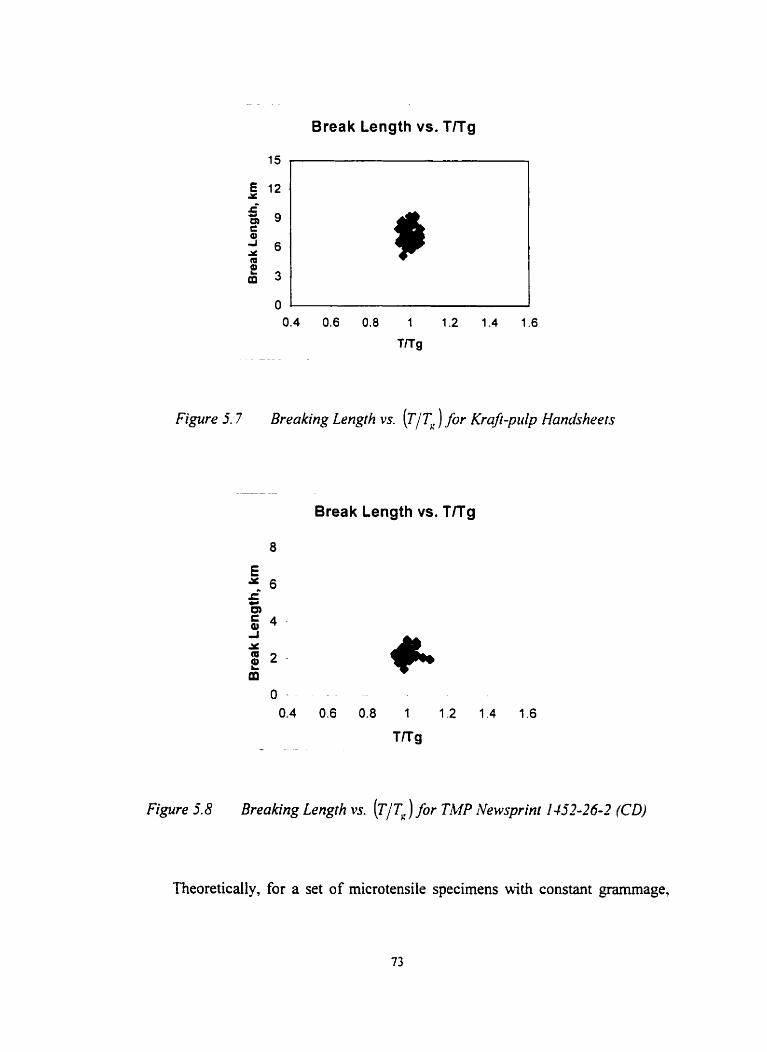
Break Length vs. TiTg
Figure 5.7 Breaking Length vs. ( T I C ) for KM-prrlp Handsheers
Break Length vs. TlTg
Figure 5.8 Breaking Length W. (TIT,) for TMP Newsprint 1452-26-2 (CD)
Theoretically, for a set of microtensile specimens with constant grammage,
73
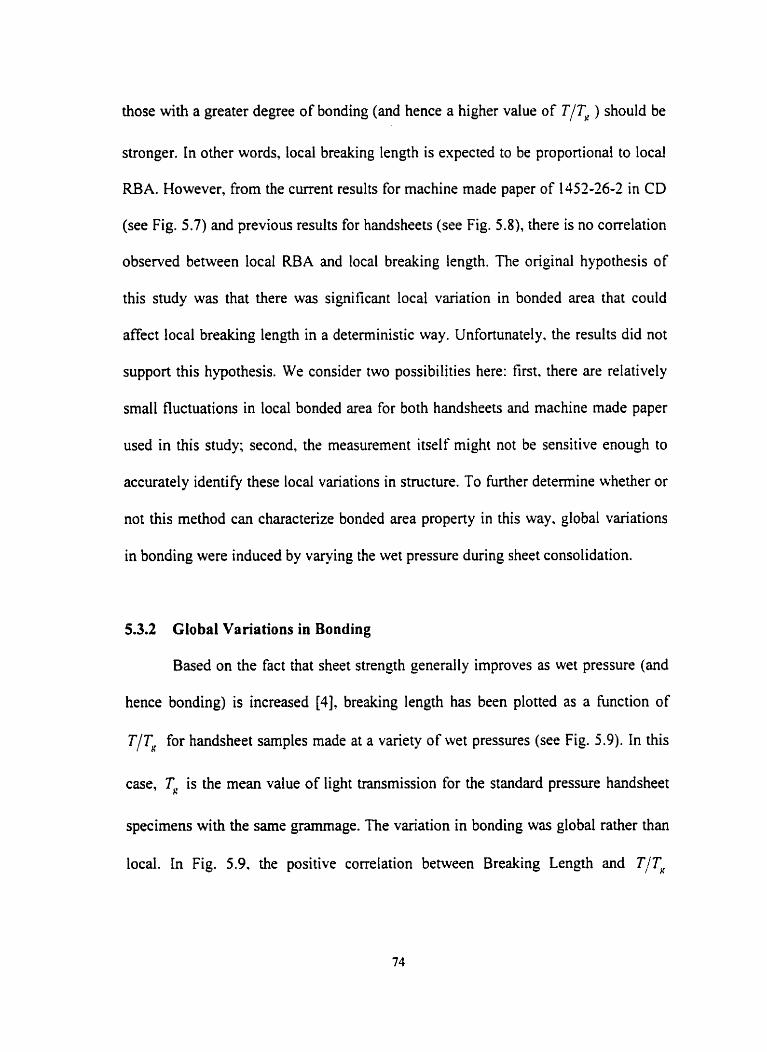
those with a greater degree of bonding (and hence a higher value of TIT, ) should be
stronger. In other words, local breaking length is expected to be proportional to local
RBA. However, from the current results for machine made paper of 1452-26-2 in CD
(see Fig. 5.7) and previous results for handsheets (see Fig. 5.8), there is no correlation
observed between local RBA and local breaking length. The original hypothesis of
this study was that there was significant local variation in bonded area that could
affect local breaking length in a deterministic way. Unfortunately, the results did not
support this hypothesis. We consider two possibi lities here: first. there are relatively
small fluctuations in local bonded area for both handsheets and machine made paper
used in this study; second. the measurement itself might not be sensitive enough to
accurately identi@ these local variations in structure. To further determine whether or
not this rnethod can characterize bonded area property in this way. global variations
in bonding were induced by varying the wet pressure during sheet consolidation.
5.3.2 Global Variations in Bonding
Based on the fact that sheet strength generally improves as wet pressure (and
hence bonding) is increased [4]. breaking length has been plotted as a function of
TIT, for handsheet samples made at a variety of wet pressures (see Fig. 5.9). In this
case, Tg is the mean value of light transmission for the standard pressure handsheet
specirnens with the same grammage. The variation in bonding was global rather than
local. In Fig. 5.9. the positive correlation between Breaking Length and T/T,
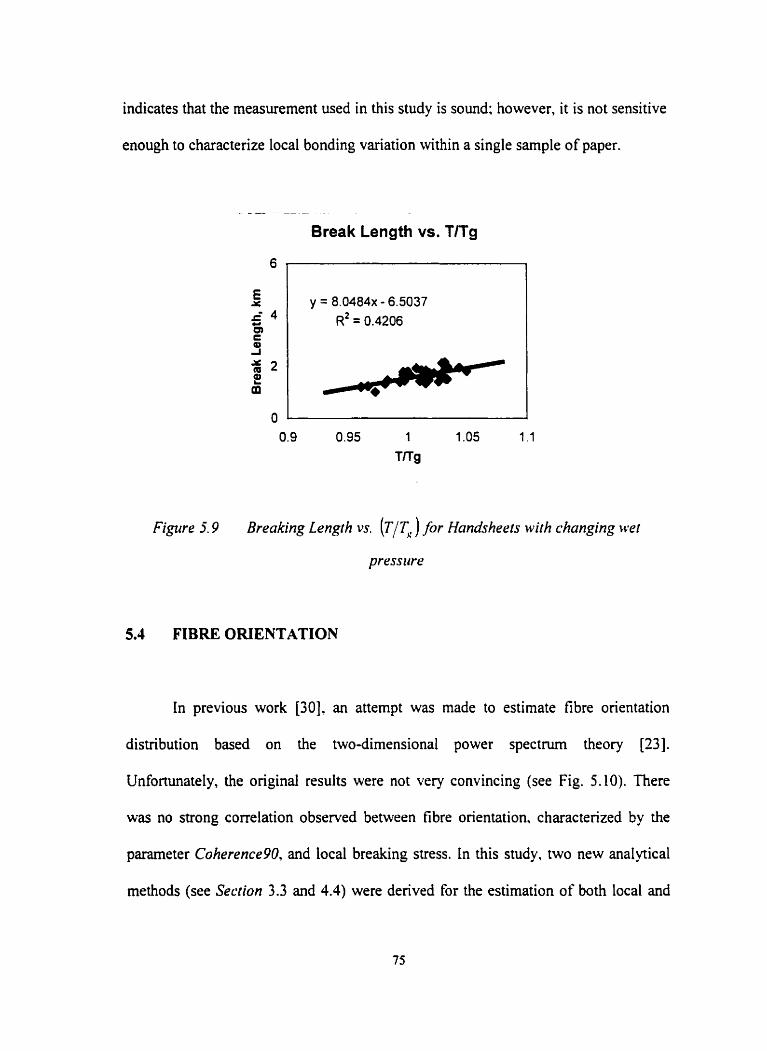
indicates that the measurement used in this study is sound; however, it is not sensitive
enough to characterize local bonding variation within a single sarnple of paper.
--- - - -
Break Length vs. TlTg
Figure 3.9 Breaking Length vs. (TI T, ) for Handsheets with changing wet
pressure
5.4 FIBRE ORIENTATION
In previous work [30], an attempt was made to estimate fibre orientation
distribution based on the two-dimensional power spectrurn theory [23].
Unfonunately, the original results were not very convincing (see Fig. 5.10). There
was no strong correlation observed between fibre orientation. characterized by the
parameter Coherence90, and local breaking stress. In this study, two new analytical
methods (see Section 3.3 and 4.4) were denved for the estimation of both local and
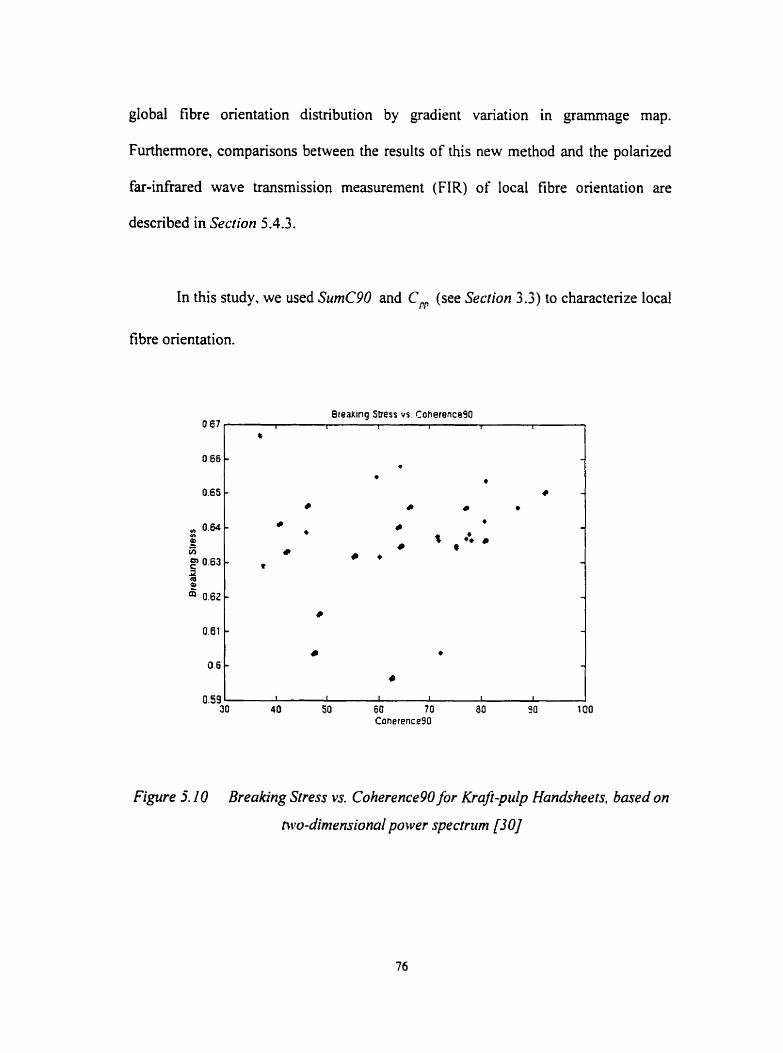
global fibre orientation distribution by gradient variation in grammage map.
Furthemore, cornparisons between the results of this new method and the polarized
f a r - i w e d wave transmission measurement (FIR) of local fibre orientation are
described in Section 5.4.3.
In this study, we used SumC90 and C, (see Section 3.5) to characterize local
fibre orientation.
Breaking Stress vs. Coherence90
Figure 5. IO Breaking Stress vs. Coherence90 for Krufl-pulp Handsheets. based on
two-dimensional power spectnim [30]
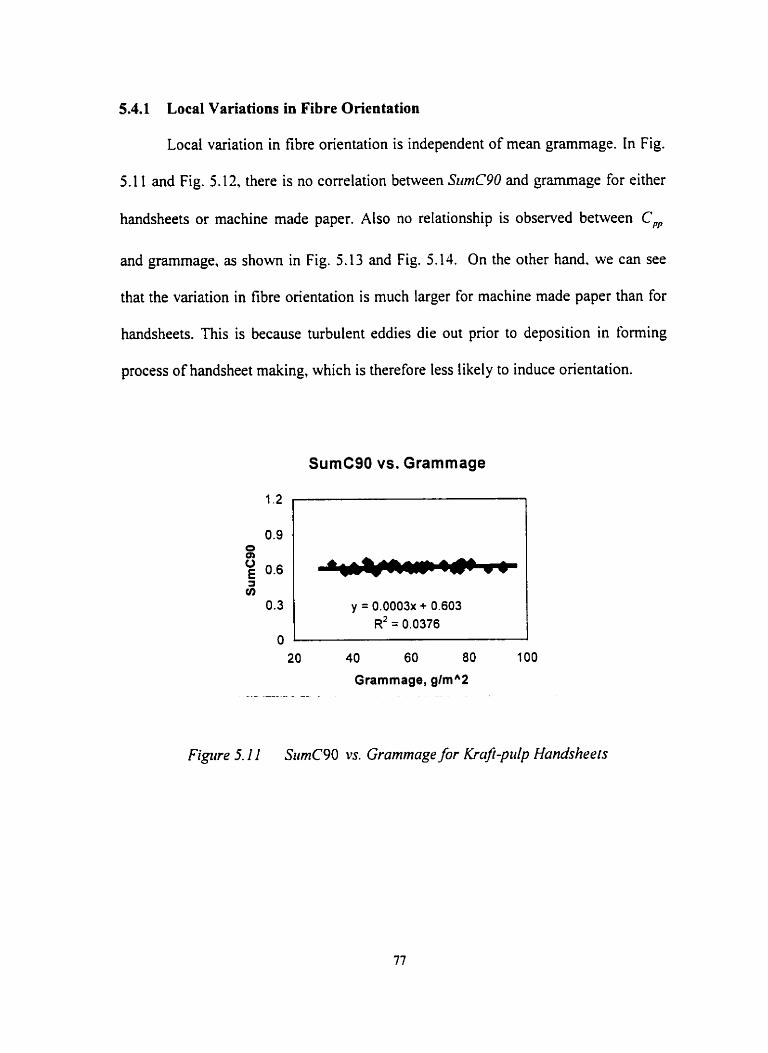
5.4.1 Local Variations in Fibre Orientation
Local variation in fibre orientation is independent of mean grammage. In Fig.
5.1 1 and Fig. 5.12. there is no correlation between StimC90 and grammage for either
handsheets or machine made paper. Also no relationship is observed between C,
and grammage, as shown in Fig. 5.13 and Fig. 5.14. On the other hand. we can see
that the variation in fibre orientation is much larger for machine made paper than for
handsheets. This is because turbulent eddies die out prier to deposition in forming
process of handsheet making, which is therefore less likely to induce orientation.
SumC9O vs. Gramrnage
20 40 60 80 1 O0
Grammage, glmAZ .. . - . -- - . . - - - . - - - - - - .
Figure 5.11 S~irnC90 vs. Grammage for Krafr-pdp Handsheets
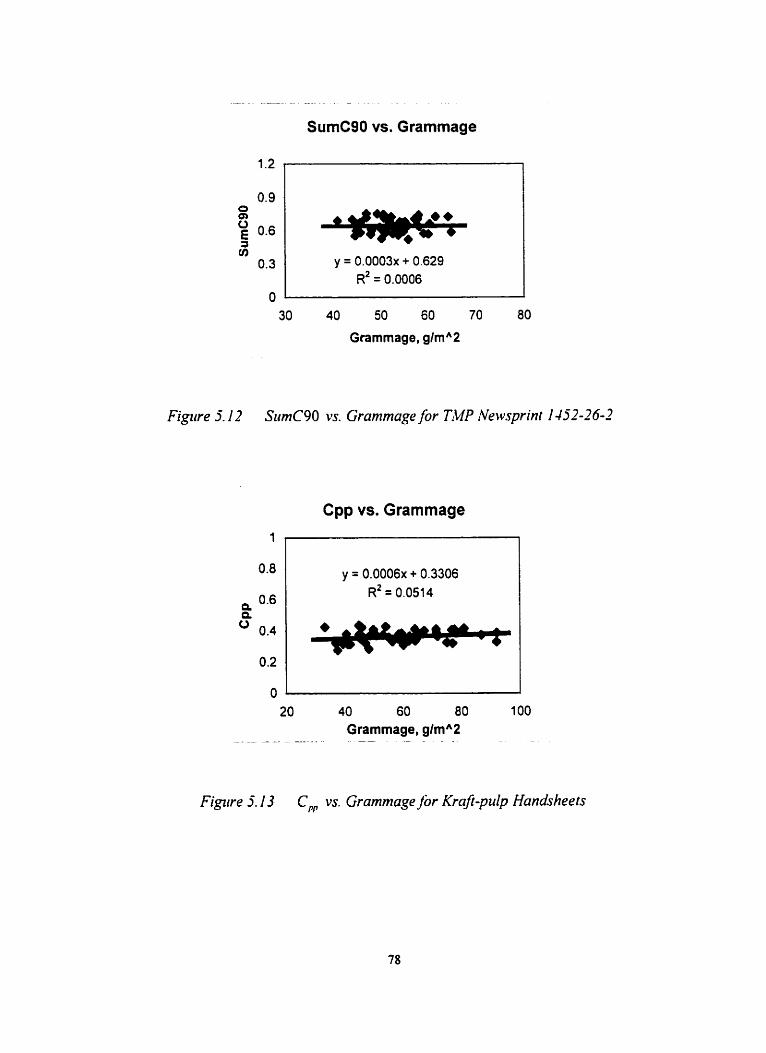
. -- . ..
SumC9O vs. Grammage
30 40 50 60 70 80
Grammage, glmA2
Figure 5-12 SztmC90 vs. Grammage for T M Newsprint 1452-26-2
Cpp vs. Grammage
Figwe 5.1 3 C, vs. Grammage for Krafl-pulp Handsheets
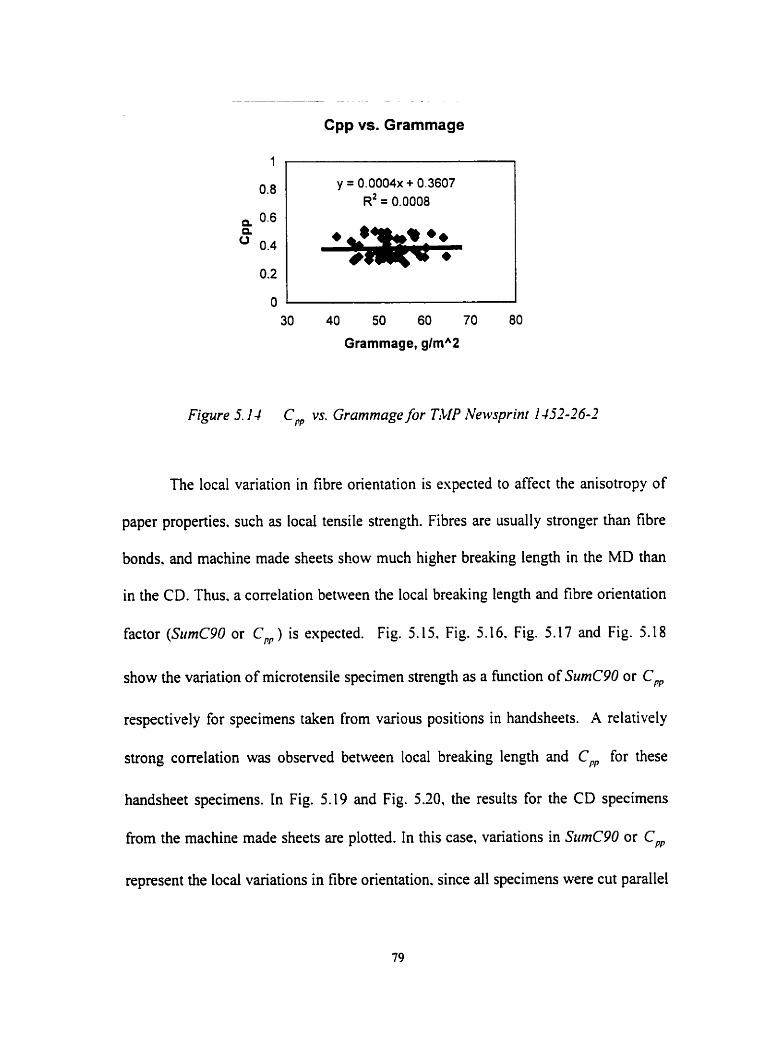
Cpp vs. Grammage
Grammage, glmA2
Figure 5. I 4 C,, vs. Grammage for TMP Newsprinr 1 -LU-?6-2
The local variation in fibre orientation is espected to affect the anisotropy of
paper properties. such as local tensile strength. Fibres are usually stronger than fibre
bonds. and machine made sheets show much higher breaking length in the MD than
in the CD. Thus. a conelation between the local breaking length and fibre orientation
factor (SitmC90 or C, ) is expected. Fig. 5.15. Fig. 5.16. Fig. 5.17 and Fig. 5.18
show the variation of microtensile specimen strength as a hnction of SumC90 or C,
respectively for specimens taken from various positions in handsheets. A relatively
strong correlation was observed between local breaking length and C, for these
handsheet specimens. In Fig. 5.19 and Fig. 5.20, the results for the CD specimens
From the machine made sheets are plotted. In this case, variations in SztmC90 or C,
represent the local variations in fibre orientation. since al1 specimens were cut parallel
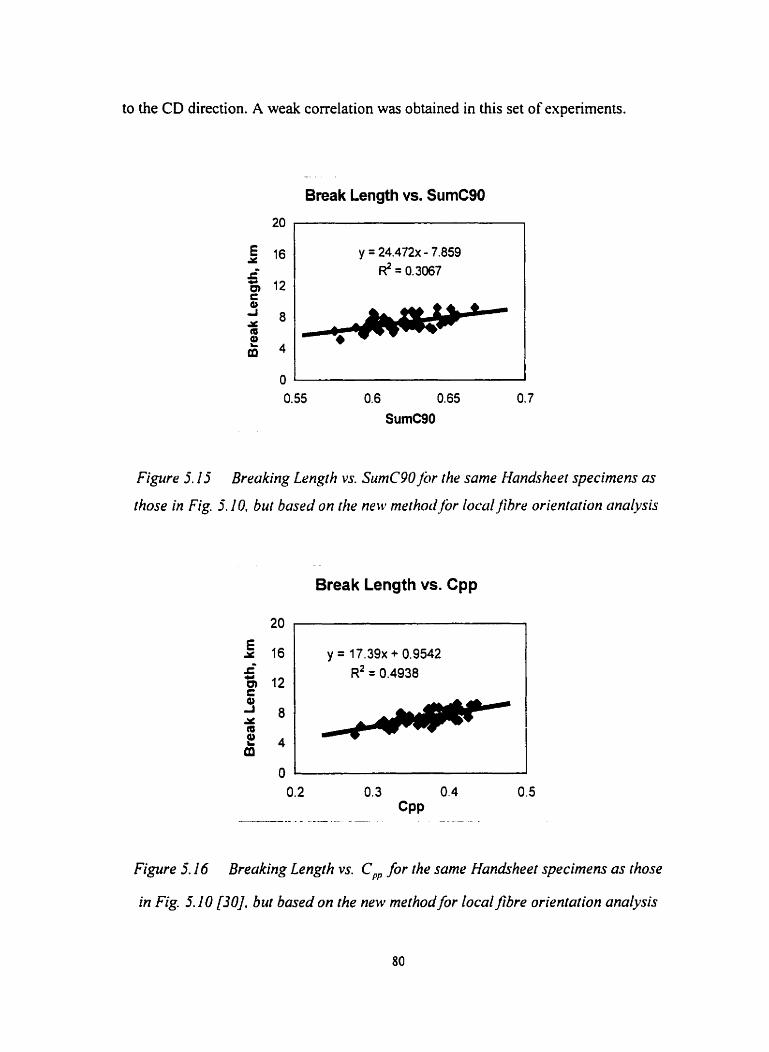
to the CD direction. A weak correlation was obtained in this set of experimenis.
-. . .
Break Length vs. SumC9O
Figure 5.25 Breaking Length vs. SumC90jhr the same Hondsheet specimens as
those in Fig. 5.10. but based on the new merhotijor loculjibre orientation analysis
Break Length vs. Cpp
Figure 5.16 Breaking Length vs. C,, for the same Handsheet specimens as those
in Fig. 5.110 [30]. but based on the new method for local fibre orientation analysis
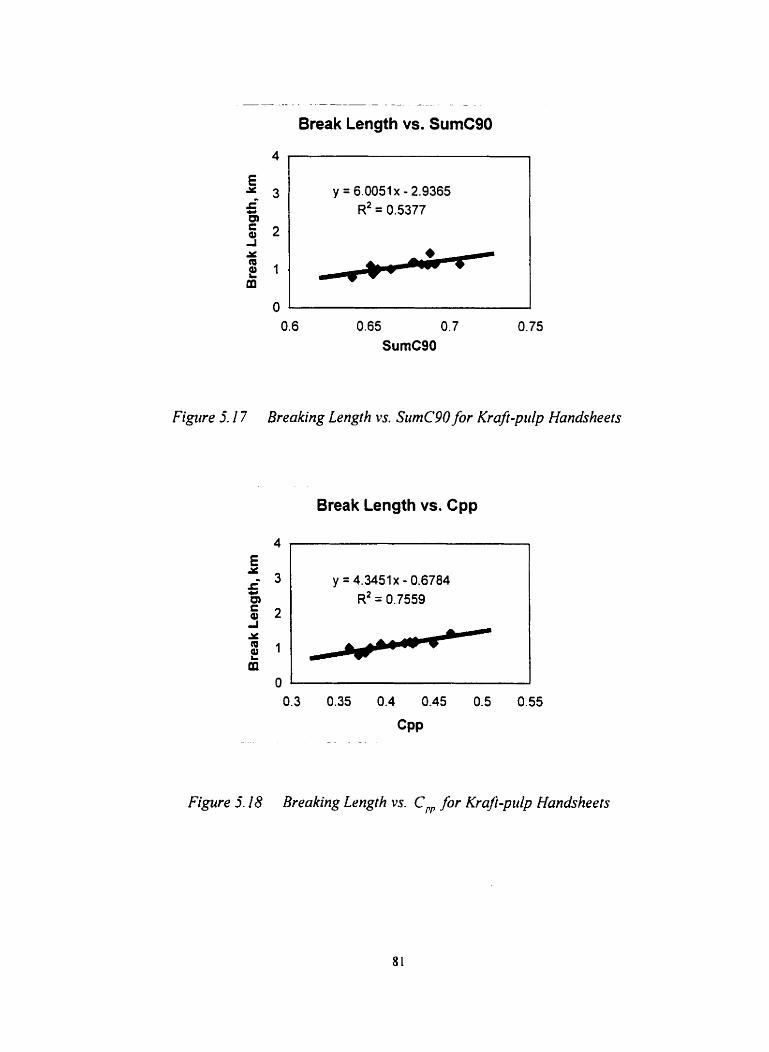
-- -- - - - - - . - - - . .
Break Length vs. SumC9O
4~
Figure 5.17 Breaking Length vs. SumC90 for Krafr-pulp Handsheers
Break Length vs. Cpp
B r e a h g Lengrh vs. C,, for Kra)-pttip Handsheers
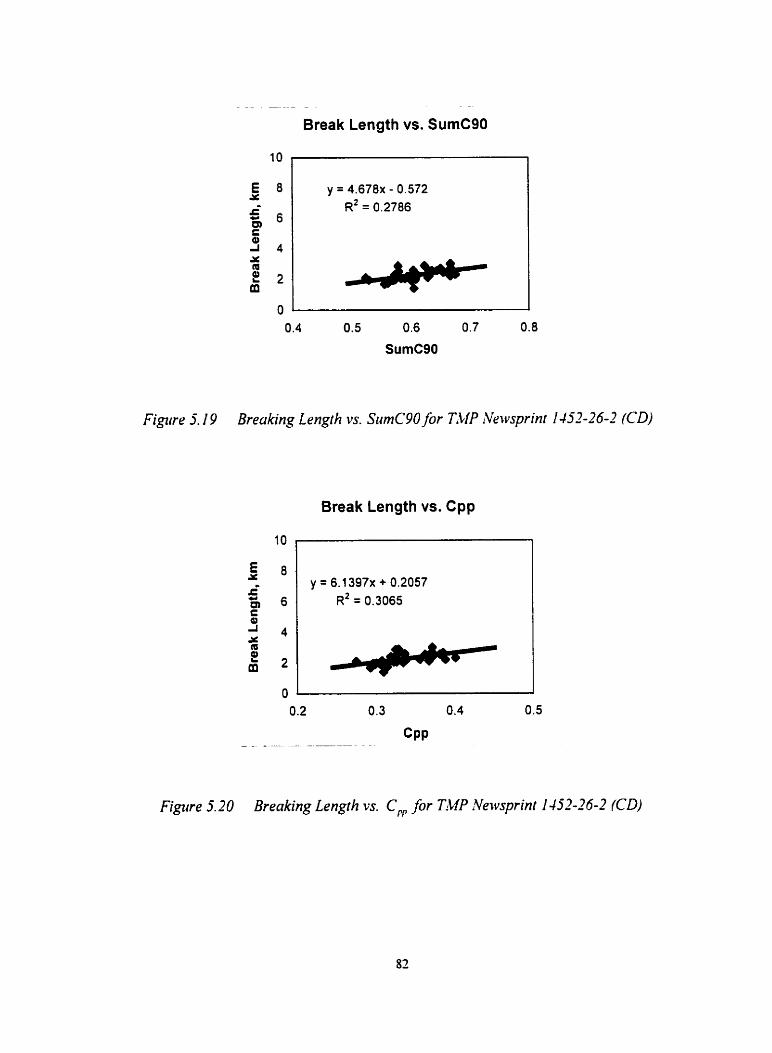
Break Length vs. SumC9O
Break Length vs. Cpp

The current results indicate that local fibre orientation factor is an additional
factor affecting paper strength. The scattering of data implies that local fibre
orientation is not the only factor goveming paper strength.
As a single parameter characterizing g(8). C, was derived on the basis of
mechanical interpretation (see Section 3.3 2). There fore. Cm should be better
conelated to strength compared to SltmC90 and give a proportional relationship with
strength (see Eq. [3.1 O]). This can be seen in Fig. 5.1 7. Fig. 5.1 8. Fig. 5.19 and Fig.
5.20.
5.4.2 Global Variation
As introduced in Section 4.1. if specimens for machine made sheet are cut at a
variety of angles to the machine direction. a global variation in fibre orientation is
obtained. Two kinds of machine made paper were used in this study to confirm the
new measurement for fibre orientation. Fig. 5.21. Fig. 5.22. Fig. 5.23 and Fig. 5.34
show a fairly positive correlation between breaking length and fibre orientation
(SumCW and C, ).
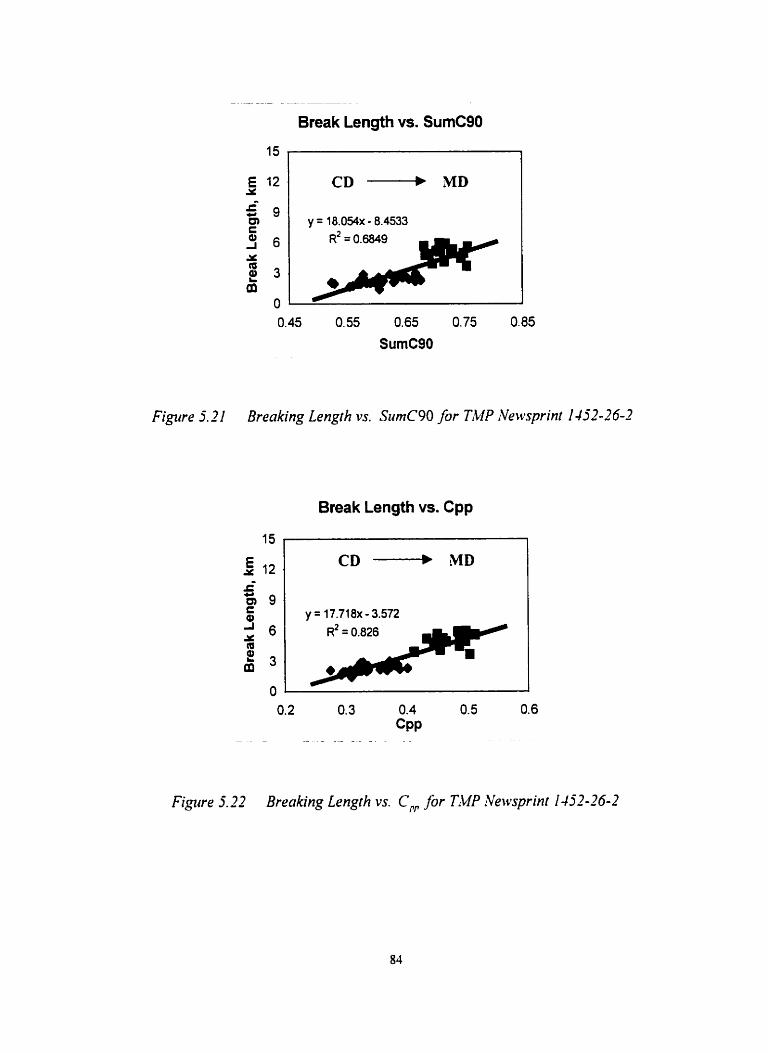
Figure 5 . 2 Breoking Length vs. SurnC90 /or TMP AJeivsprint 1452-26-2
Break Length vs. Cpp
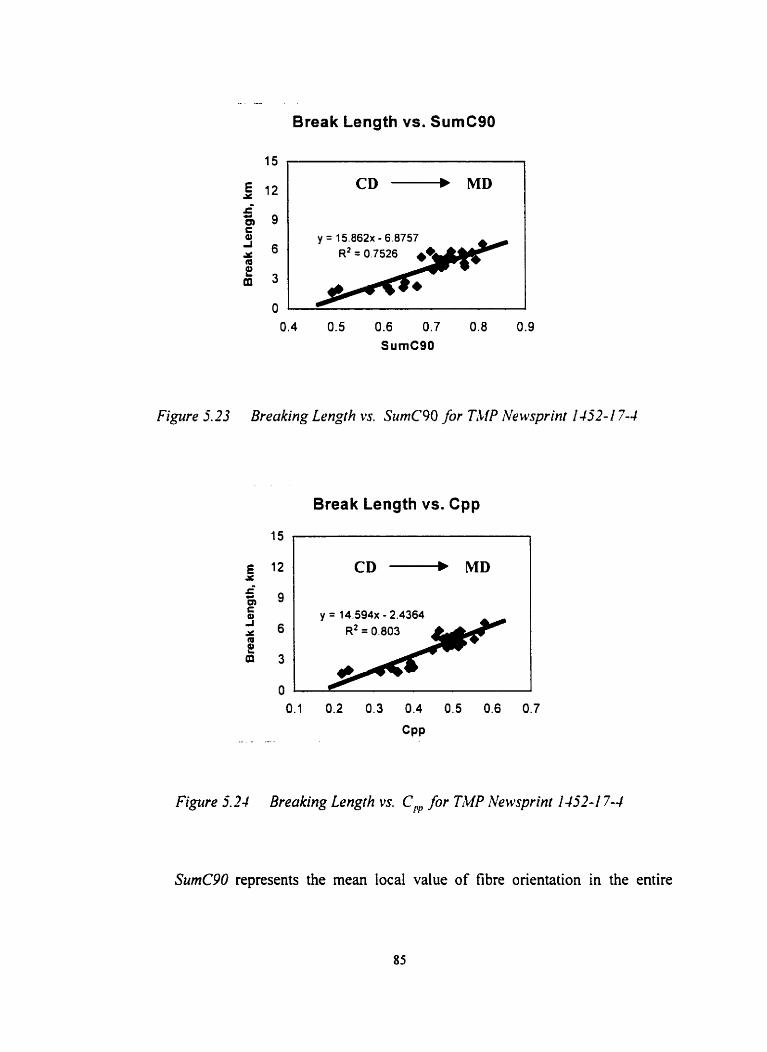
- - - - - - -
Break Length vs. SurnC9O
Figure 5.23 Breaking Length W. SurnC9O for TMP ivewsprint 1 4j2- 1 7-4
Break Length vs. Cpp
Figure 5-24 Breaking Length vs. C,, for TMP Newsprint 1452- 1 7-4
SumC90 represents the mean local value of fibre orientation in the entire
region of interest for each microtensile specimen (see Seclion 3.3.3). C,, was defined
as a fibre orientation factor in the sheet strength equation based on mechanics (see
Section 5.4.1) and a linear relationship was derived between breaking length and C,
(see Eq. [3.101). From the current results, a relatively stronger correlation was
observed between breaking length and C, . This implies that C, is more suitable to
characterize local fibre orientation in the prediction of sheet strength though SumC90
directly corresponds to local fibre orientation in the zone.
5.4.3 Global Images
The visualized global images of fibre orientation distribution in a paper
sample were studied by both the FIR measurement and our new image analysis
method based on gradient variation. The arrows on the following figures give the
direction and magnitude of mean fibre orientation over a given measurement region.
Fig. 5.25 presents the fibre orientation distribution for orienîed handsheeis measured
by the FIR.
In this study, we have developed algorithrns for extracting local fibre
orientation From P-radiographs based on image analysis techniques. In Fig. 5.26, a
Quiver Plot of Local Dominant Fibre Orientation for the same sample is presented.
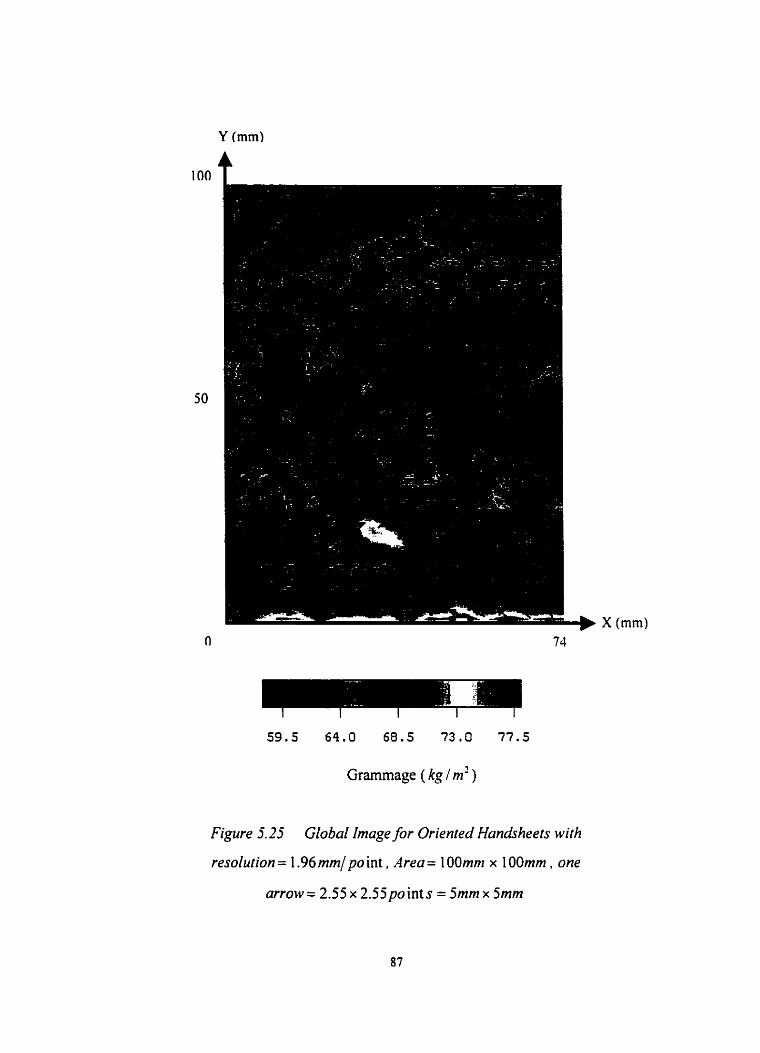
Figure 5-25 Global Image for Oriented Handsheets with
resolution = 1.96 mm/ po int , Area = 100mm x 1 OOmm , one
arrow = 2.55 x 2 . 5 5 ~ 0 int s = 5mm x 5mm
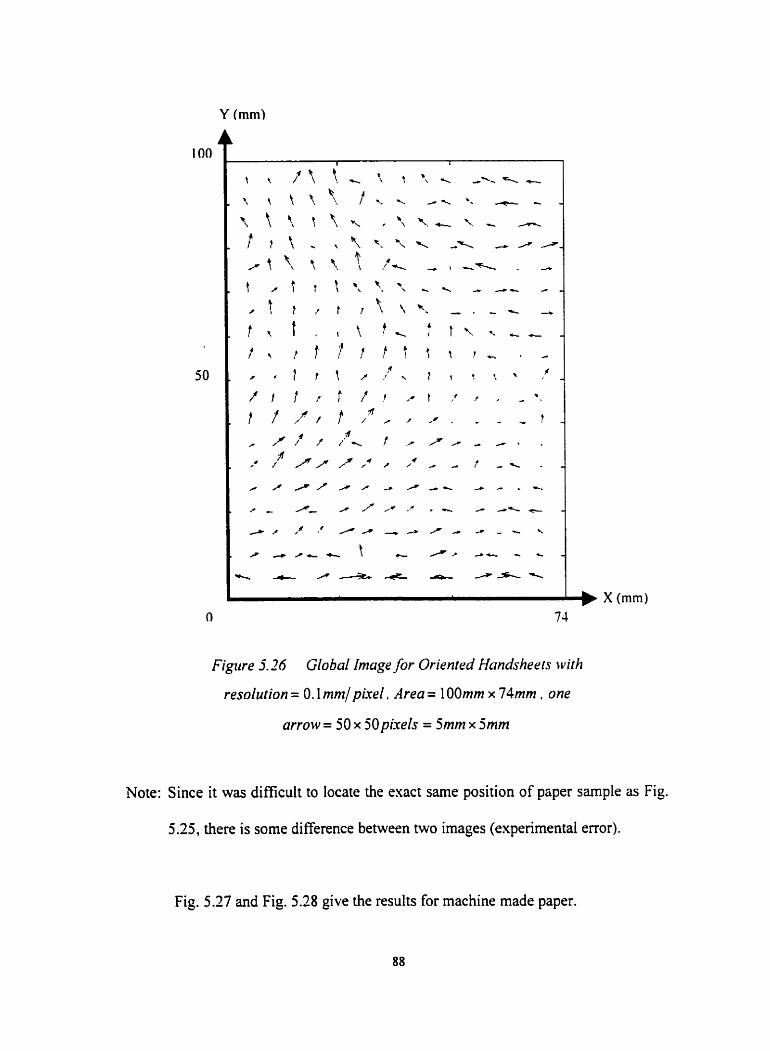
Figtrre 5-26 Global Image for Orienled Handsheets wirh
resolution = O. 1 mm/ pire!. Area = 100mm x 74mm . one
arrow = 50 x 50pirel.s = 5mm x 5mm
Note: Since it was dificult to locate the exact same position of paper sample as Fig.
5.25, there is some difference between two images (experimental enor).
Fig. 5.27 and Fig. 5.28 give the results for machine made paper.
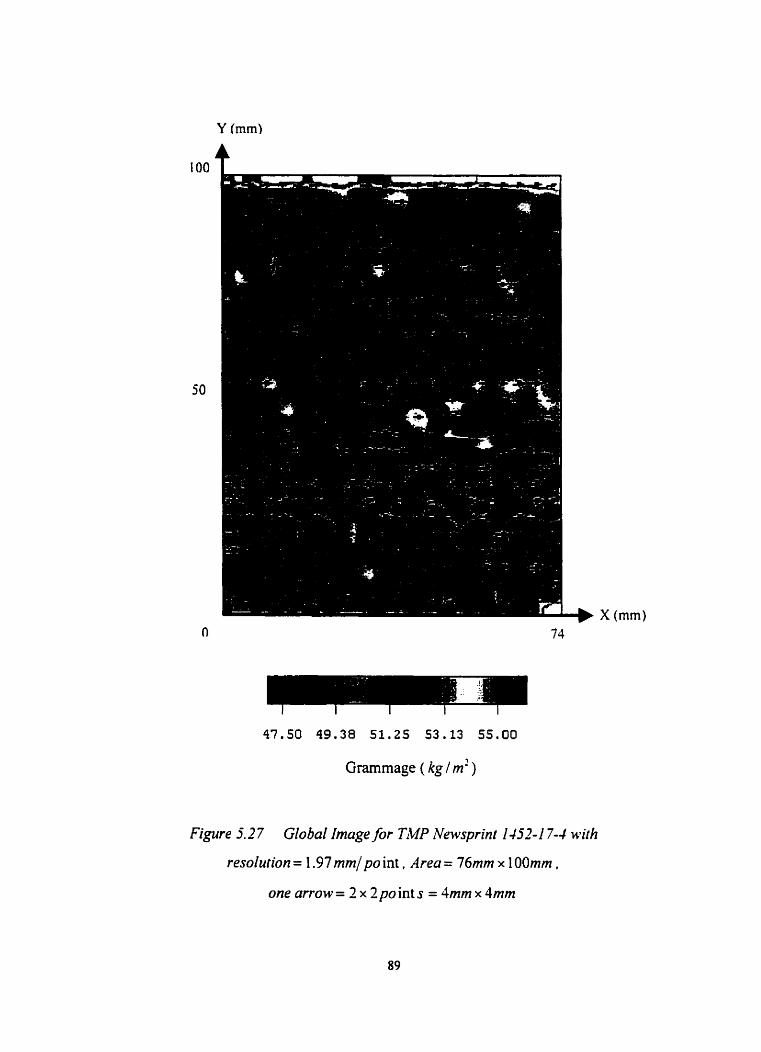
Grarnmage ( kg 1 m' )
Figure 5.2 7 Global Image for T M Newsprini 1452- I 7-4 with
resolurion = 1.97 mm/ po int . Area = 76mm x 1 OOmm . one arrow = 2 x 2po int s = 4mm x 4mm
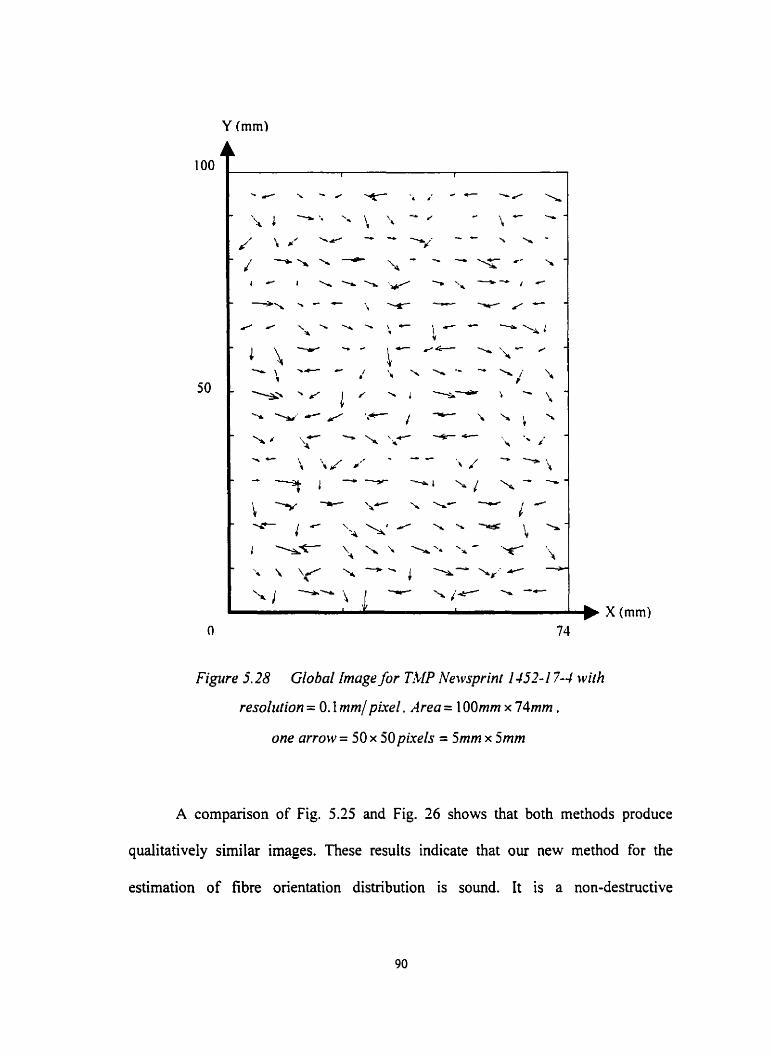
Figure 5.28 Global Image for TMP Neivsprinî iJ.V-l7--/ wilh
resohiion = 0.1 rnm/plrel. Area = 100rnm x 74mm . one arrorv = 50 x 5Opixel.s = 5mm x 5mm
A cornparison of Fig. 5.25 and Fig. 26 shows that both methods produce
qualitatively simila. images. These results indicate that our new method for the
estimation of fibre orientation distribution is sound. It is a non-destructive
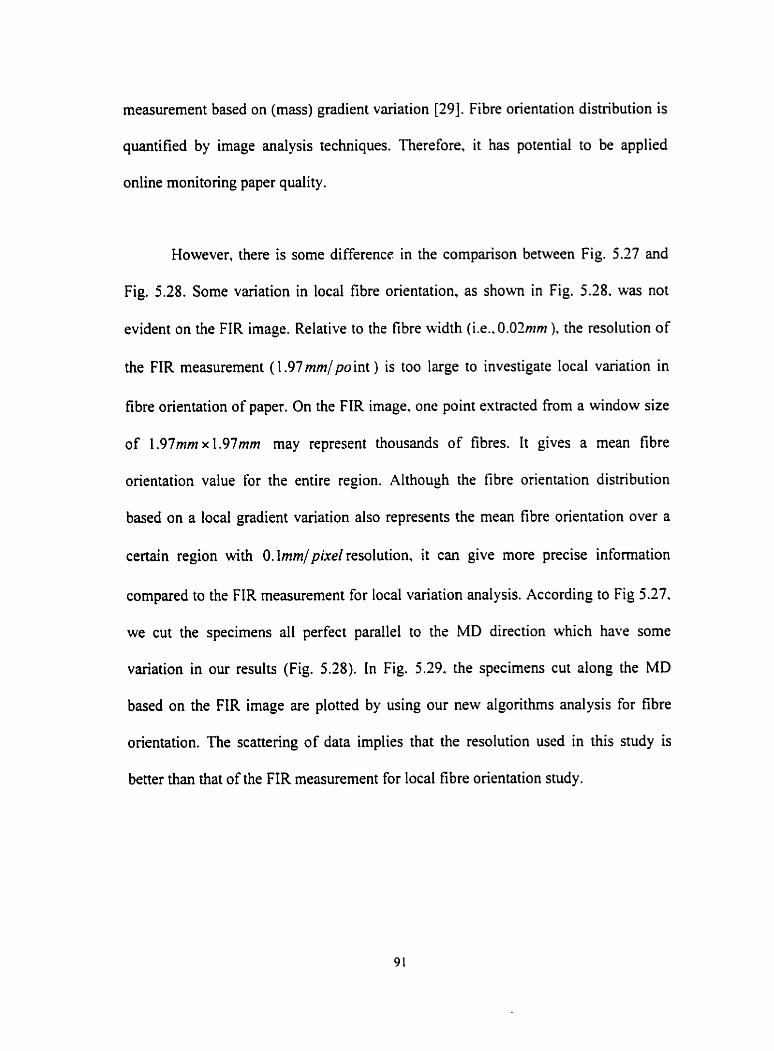
measurement based on (mass) gradient variation [29]. Fibre orientation distribution is
quantified by image analysis techniques. Therefore, it bas potential to be applied
online monitoring paper quality.
However, there is some difference in the cornparison between Fig. 5.27 and
Fig. 5.28. Some variation in local fibre orientation, as s h o w in Fig. 5.28. was not
evident on the FIR image. Relative to the fibre width (i.e.. 0.02mm ), the resolution of
the FIR measurement ( 1.97 m m / p int ) is too large to investigate local variation in
fibre orientation of paper. On the FIR image, one point extracted from a window size
of 1.97mm x 1.97mm may represent thousands of fibres. It gives a mean fibre
orientation value for the entire region. Although the fibre orientation distribution
based on a local gradient variation also represents the mean fibre orientation over a
certain region with O.lrnm/pixelresolution, it can give more precise information
compared to the FIR measurement for local variation analysis. According to Fig 5.27.
we cut the specimens al1 perfect parallel to the MD direction which have some
variation in our results (Fig. 5.28). In Fig. 5.29. the specirnens cut dong the MD
based on the FIR image are plotted by using Our new algorithms analysis for fibre
orientation. The scattering of data implies that the resolution used in this study is
better than that of the FIR measurement for local fibre orientation study.
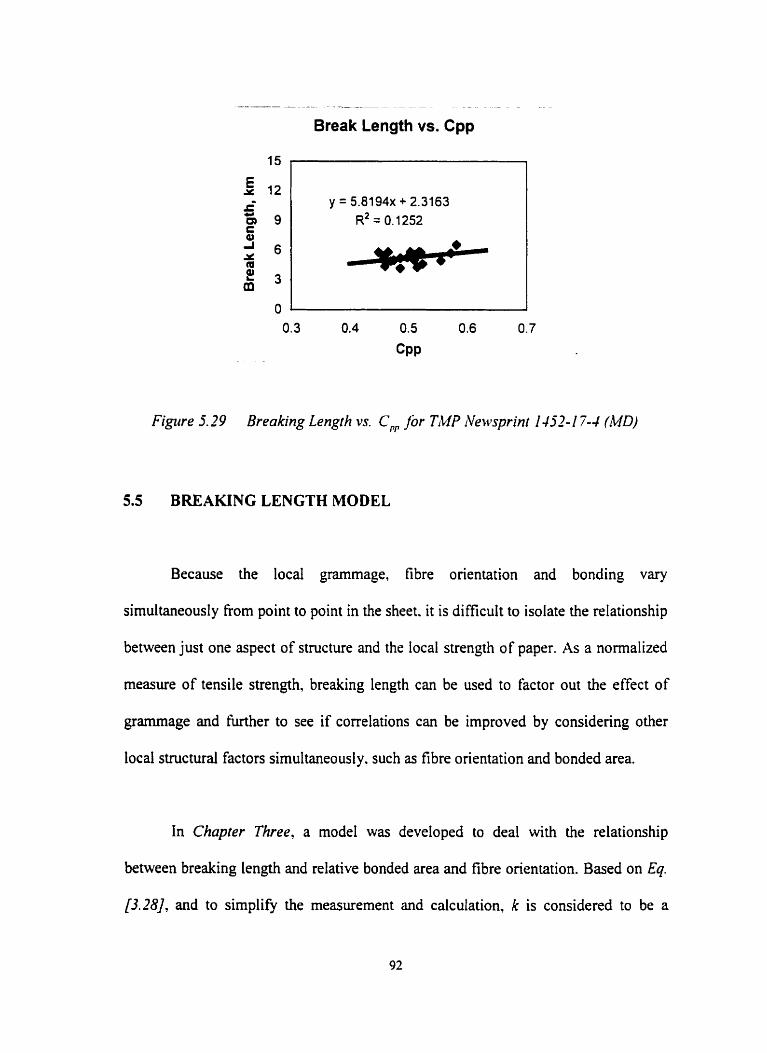
Figure 3.29 Breaking Length vs. C,, for TiMP Newsprint 2 452- 2 7-4 (MD)
5.5 BREAKJNG LENGTH MODEL
Because the local grammage, fibre orientation and bonding Vary
simultaneously fiom point to point in the sheet. it is dificult to isolate the relationship
between just one aspect of structure and the local strength of paper. As a normalized
measure of tensile strength, breaking length can be used to factor out the effect of
grammage and further to see if conelations c m be improved by considering other
local structurai factors simultaneously. such as fibre orientation and bonded area.
In Chapter Three, a mode1 was developed to deal with the relationship
between breaking length and relative bonded area and Fibre orientation. Based on Eq.
r3.281, and to sirnpliQ the measurement and calculation, k is considered to be a
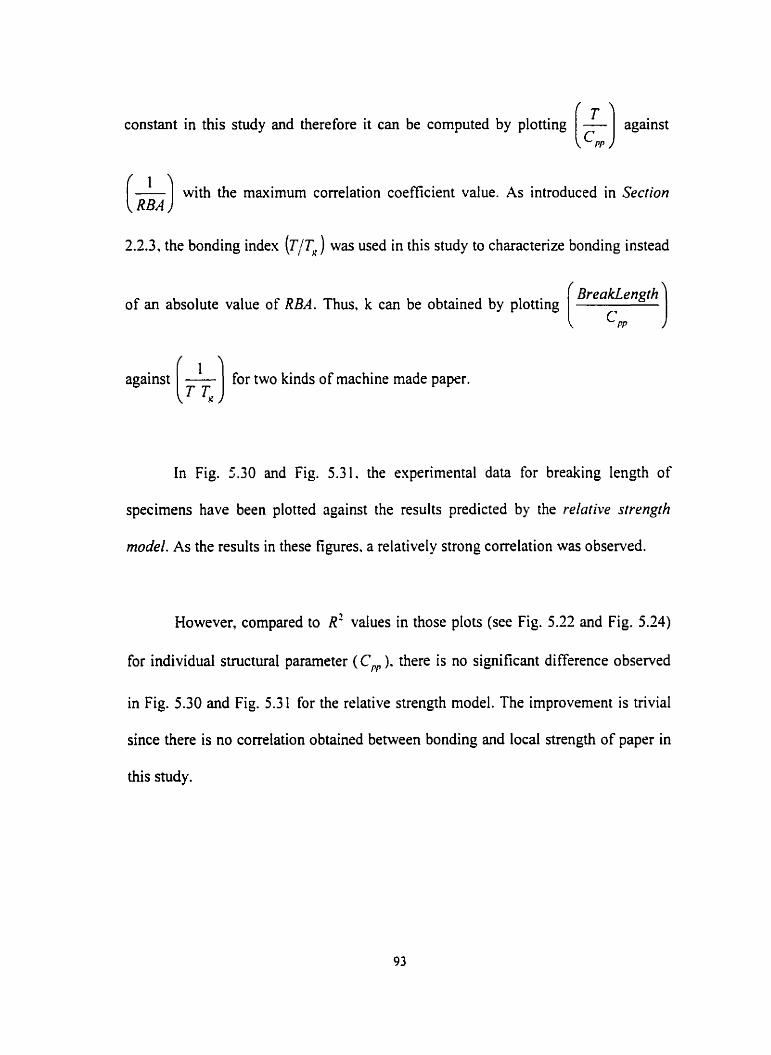
constant in this study and therefore it can be computed by plotting (2) againrt
(&) with the maximum correlation coefficient value. As introduced in Section
2.2.3, the bonding index (T/T,) was used in this study to characterize bonding instead
BreakLength of an absolute value of RBA. Thus, k c m be obtained by plotting
againrt (k) for two kindr of' machine made paper.
In Fig. 5.30 and Fig. 5.31. the experîmental data for breaking length of
specimens have been plotted against the results predicted by the relative strength
modei. As the results in these figures. a relatively strong correlation was observed.
However, compared to R' values in those plots (see Fig. 5.22 and Fig. 5.24)
for individual structural parameter (C,,, ). there is no significant difference obsemed
in Fig. 5.30 and Fig. 5.3 1 for the relative strength model. The improvement is trivial
since there is no correlation obtained between bonding and local strength of paper in
this study.
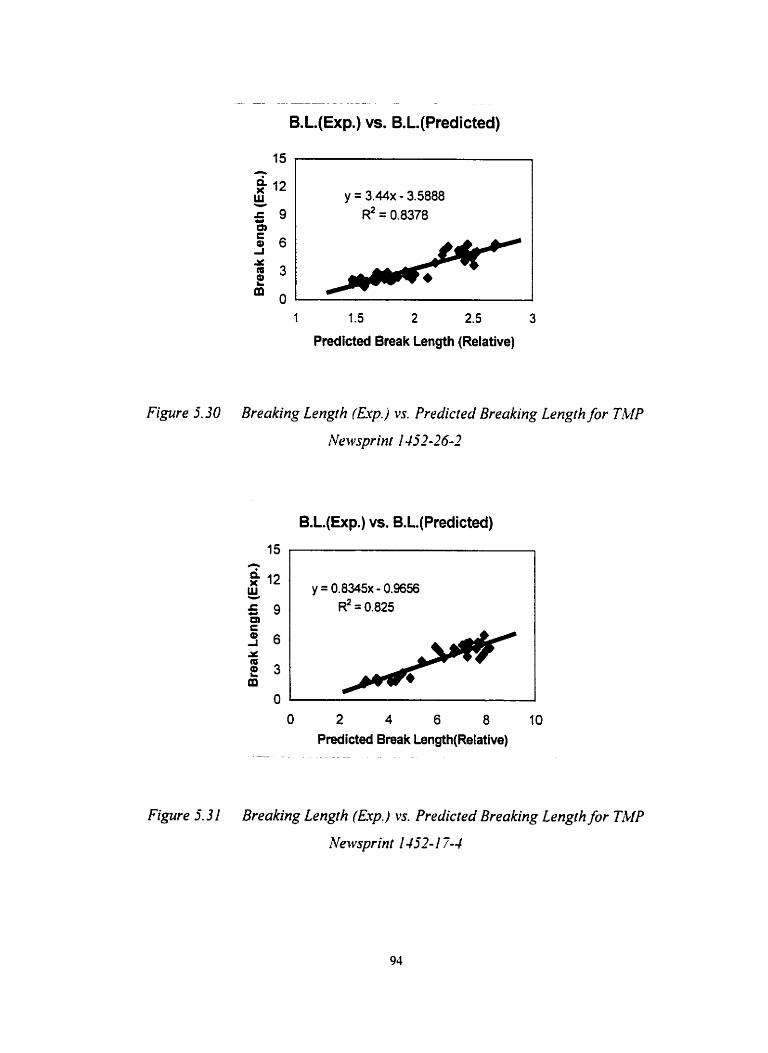
B. L.(Exp.) vs. B. L. (Predicted)
1 1.5 2 2.5 3
Predicted Break Length (Relative)
Figure 5-30 Breaking Length (Eup..) vs. Predicted Breaking Lengrh for ThlP
Newsprint 1452-26-2
B.L(Exp.) vs. B.L.(Predicted)
O 2 4 6 8 I O Predicted Break Length(Re1ative)
--- . - - ..
Figure 5.3 1 Breaking Length (Ekp.) vs. Predicted Breaking Lengîh for TMP
Newsprint 3 452- 1 7-4
5.6 SUMMARY AND DISCUSSION
This study was founded on the hypothesis that there were significant local
variations in structure that could have a significant effect on local property variations
of paper. The results presented above indicate that
Predicted Breaking Length a C, [ l - hl
The simplified Eq. [3.30] gives a multivariable correlation between local tensile
strength and local structural properties. Previous studies. such as those of Page [4] or
Kallmes, Bernier and Perez [SI. dealt with the failure of random network structures at
the global level. There have not been any previous models relating local RBA and
fibre orientation to the local tensile strength of sheet.
The current results. while quite limited. do support the original hypothesis of
this study. On the mesostructure level ( î m m x ?mm in this study). local breaking
length can be plotted as a function of local fibre orientation ( C,, ) and local bonding
(T/T' ), with local grammage, C,, and T/ir, are assumed to be constant in
rnicrotensile specimen. Particularly. for the local fibre orientation factor. the strong
trend obtained here is in agreement with the generally accepted view that fibre
orientation is an important factor affecting the strength of paper. It also indicates that
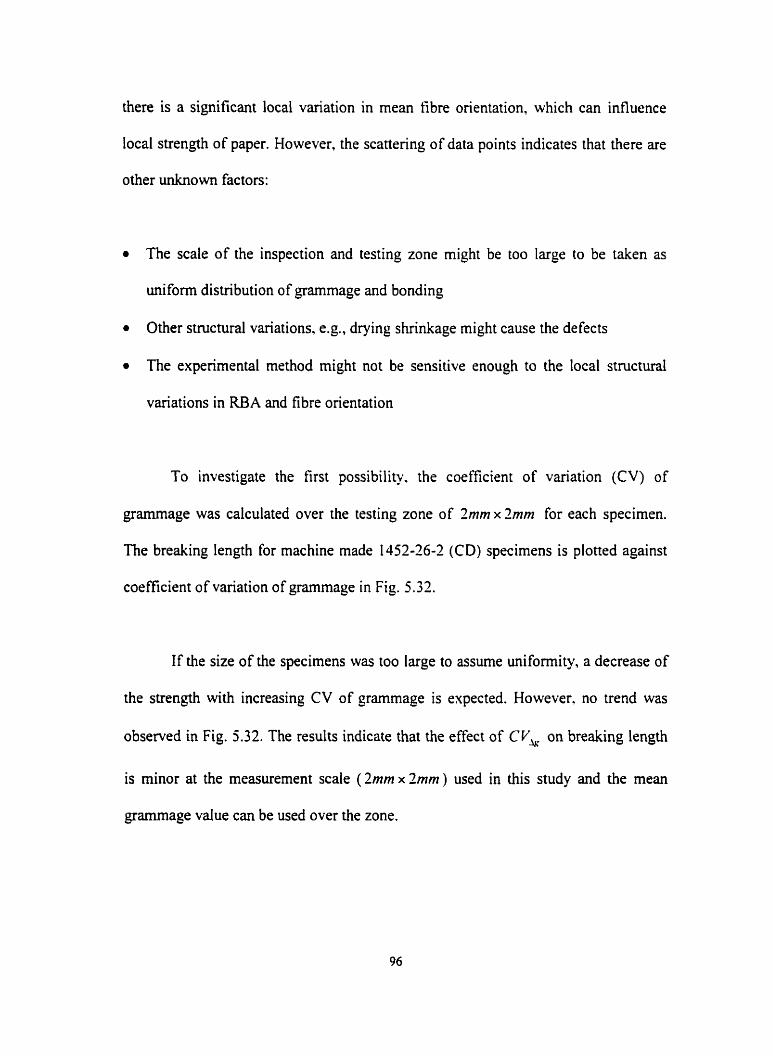
there is a significant local variation in mean fibre orientation, which can influence
local strength of paper. However, the scattering of data points indicates that there are
other unknown factors:
The scale of the inspection and testing zone might be too large to be taken as
uniform distribution of grarnmage and bonding
Other stmctural variations, e.g., drying shnnkage might cause the defects
The experimental method might not be sensitive enough to the local structural
variations in RBA and fibre orientation
To investigate the first possibility. the coefficient of variation (CV) of
grammage was calculated over the testing zone of 2mm x -mm for each specimen.
The breaking length for machine made 1452-26-2 (CD) specimens is ploaed against
coefficient of variation of grammage in Fig. 5.32.
If the size of the specimens was too large to assume unifomity, a decrease of
the strength with increasing CV of grammage is expected. However. no trend was
observed in Fig. 5.32. The results indicate that the effect of CV, on breaking length
is minor at the measurement scale (Zmm x 2mm ) used in this study and the mean
grarnmage value can be used over the zone.
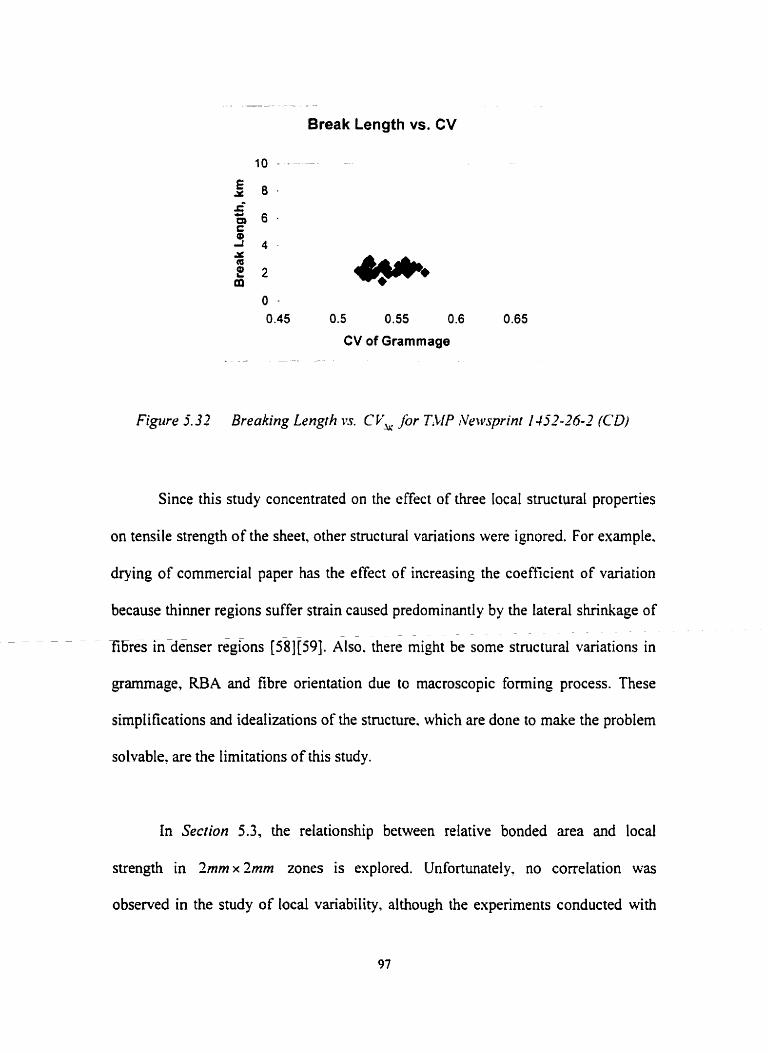
. - - - - . - -
Break Length vs. CV
CV of Grammage
Figtrre 5.32 Breaking Length vs. C VbU for TTlP 1Veivsprinf 1-152-26-2 (0
Since this study concentrated on the effect of three local structural properties
on tensile strength of the sheet. other structural variations were ignored. For exarnple.
drying of commercial paper has the effect of increasing the coefficient of variation
because thinner regions suffer strain caused predominantly by the lateral shrînkage of p p p p p p p p p p p p p p p - - - - - - - - - - - - - - - - -
fibres indenser regions [58] [59]. Also. there might be some structural variations in
grammage, RBA and fibre orientation due to macroscopic forming process. These
simplifications and idealizations of the structure. which are done to make the problem
solvable. are the limitations of this study.
In Section 5.3, the relationship between relative bonded area and local
strength in 2mm x 2mm zones is explored. Unfortunately. no correlation was
observed in the study of local variability, aithough the experiments conducted with
global variations in bonding demonstrates that Our indirect measurement of RBA is
sound. One possibility we consider here is that there are relatively smail fluctuations
in local density and bonded area within one single sample of paper. In other words,
the experimental method used in this study might not be sensitive enough to
investigate local structunl variation in RBA.
CHAPTER SIX
CONCLUSIONS AND RECOMMENDATIONS
6.1 CONCLUSIONS
(1) A new method based on Scharscanski and Dodson's theory is
proposed and applied in this study. Fibre orientation is quantified by
SrmC90 and C,,, through local mass gradient variation analysis.
Cornparisons between the results of our new method and the polarized
far-infrared wave transmission rneasurement (FIR) for local fibre
orientation confirmed that the method developed in this study for the
estimation of fibre orientation distribution is sound.
(2) The current results. while quite limited. do support the original
hypothesis: there were significant local variations in structure that
could have a significant effect on local tensile strength of sheet. On the
rnesostnictural level, local strength can be plotted as a function of local
fibre orientation ( Cr,, ) and local bonding ( T/T, ) while local
grammage can be assurned as a constant value for microtensile
specirnens. A strong trend obtained in this study (see Section 5.4 for
local and global variations) indicates that local variation in mean fibre
orientation can affect the local strength of paper in a deterministic
way. However, a weak correlation was observed between local
strength and local bonded area. The scattering of data points implies
that there are other unknown factors affecting the strength of paper.
(3) A relaiive strength model (see Eq. [3.30]) gives a multivariable
correlation between local strength and local structural properties, such
as fibre orientation and bonded area. This is the first tirne that both
local RBA and fibre orientation variables are related to local strength
of sheet on the mesostructural levei. However, due to no correlation
obtained between local strength and bonding in this study. there is no
significant improvement on the correlation in the relative strength
model by considering fibre orientation and bonding simultaneously.
6.2 RECOMMENDATIONS
(1) There was a weak correlation between local strength and local bonded
area (TJT' ) observed in this study for both handsheets and machine
made paper. Relatively small fluctuations in bonded area are
considered to be one of the possible reasons. Although the
experimentai method for characterizing RBA as local bonding index
was confirmed to be sound through experirnents involving global
variations in bonding, the current results for local variations are not
very convincing. Further study. such as cornparisons with other
methods for measuring local bonding, is necessary.
(2) Although the relative strength mode1 developed in this study gives a
strong trend which is in agreement with the hypothesis of this work.
the scattering of data points suggests that other unknown factors
should be considered. such as drying shrinkage which is unavoidable
in forming process.
(3) The effect of inspection zone size on local structural properties is
critical for this study since uniform distribution of grammage and
bonded area is assumed. From the current results, the effect of
coefficient variation of grammage on local strength can be ignored and
uniformity can be assumed for grammage distribution of microtensile
specimens. However, there is no better method of exarnining local
bonding variation at present.
[ I l M.T.Kortschot, "The Role of the Fibre in the Structural Hierarchy of Paper",
Proceedings of the 1 lth Fundamental Research Symposium, Cambridge. U.K.,
September 22-26. Vol. 1. pp. 35 1-399. 1997
[2] L.Wong, M.T.Kortschot and C.T.J.Dodson. "Effect of Formation on Local
Strain and Fracture of Paper", Journal of P d p and Puper Science, Vol. 22. No.
6, pp. 12 19, 1996
[3] L.Wong, M.T.Konschot and C.T.J.Dodson, "Finite Element Analysis and
Experimental Measurement of Strain Fields and Failure in Paper". International
Paper Physics Conference. pp. 13 1 - 135, 1995
[4] D.H.Page. "A ïheory for the Tensile Strength of Paper". LIPPI Joirrnal,
Vol.52. No.4. pp. 67468 1. 1969
[SI O.J.Kallmes, G.A.Bemier and M.Perez, "A Mechanistic Theory of the Load-
elongation Properties of Paper". in four parts. Paper Technology, 18(7). pp.
222-228, 1977; 18(8), pp. 243-245. 1977; 18(9). pp. 283-285. 1977; l8(l O). pp.
328-33 1, 1977; 19(9), pp. 3 1 1-3 12, 1978
[6] B.Noman, "Overview of the Physics of Forming". Fundamentals of
Papemaking, Mechanical Engineering Publications. London. pp. 73-149, 1989
[7] D.F.Rutland, "Dimensional Stability and Curl of Papers". 7 1" Annual Meeting,
Tech. Section. CPPA, Preprints pp. A227-A283. 1985
[8] J.Koskimies, "Leaning Behaviour of Form Stack Paper", 72" A M U ~ Meeting,
Tech. Section. CPPA. Preprints pp. A 12% 1986
[9] M.B.Lyne and R.Hazel1, "Formation Testing as A Means of Monitoring
Strength Uniformity", in The Fundarnental Properties of Paper Related to Its
Uses, London, pp. 74- 100, 1976
[IO] J.L.Thorpe, "Simulation of Tensile Properties of Newsprint". Appita. 36. pp.
198-204, f 982
[ 1 11 M. J.Koneoja, A.Lukkarinen, KKaski. D.E.Gunderson. J.L.Dahlke and
K.J.Niskanen, "Local Strain Fields in Paper". TAPPI Journal, Vol.74. No.4. pp.
2 1 7-223, 1996
[IZ] C.T.J.Dodson, "A S w e y of Paper Mechanics in Fundarnental Terms", in The
Fundamental Properties of Paper Related to Its Uses - Transactions of the
Symposium held at Cambridge. 1973. Bolam. F (ed), BPBIF. London. 1. pp.
202-226. 1976
[l3] R.J.Noman, "Dependence of Sheet Properties on Formation and Forming
Variables", in Consolidation of the Paper Web - Transactions of the Symposium
held at Cambridge. 1965. Bolarn, F (ed). BPBMA. London. 1966
[14] R.W.Davison, "The Weak Link in Paper Dry Strength". TA PPI Joiirnal, Vo1.55.
No.4, pp. 567-573, 1972
[15] M.Deng and C.T.J.Dodson. "Paper - An Engineered S tochastic Structure".
TAPPI Press. Atlanta. GA, 1994
B-Norman, "The Formation of Paper Sheets", in Paper Structure and Properties,
Macel Dekker, New York, pp. 123-1 50. 1986
H.Tomimasu, D.Kim, M.Suk and P.Luner. "Cornparison of Four Paper Imaging
Techniques: P-radiography, Electrography. Light Transmission, and Soft X-
ray". W PPI Journal. Vo1.7, pp. 165- i 76. 199 1
B.Norman and D.Wahren. "Mass Distribution and Sheet Properties of Paper".
Transactions of the 5" International Fundamental Research Symposium.
Cambridge. pp. 7-73. 1973
AKomppa. "Measurement of Formation", Paper and Timber. 3. pp. 243-250,
1988
H.Sara, "The Characterization and Measurement of Paper Formation with
Standard Deviation and Power Spectrum". PhD Thesis. Helsinky University of
Technology. Helsinki. 1978
H.Tomimasu, P.Lunar and R.B.Hanna. "Rapid Imaging of Mass Distribution in
Paper By Electron Bearns", in Fundamentals of Papermalting - Transactions of
the 9" Fundamental Research Symposium held at Cambridge. 1989, C.F.Baker
and V.Puton, Mechanical Engineering Publications, London, 1 989
C.T.J.Dodson. The Failure oj' bonds During the Fracture O/-a Random Fibroics
Nehvork Siructiire, Solid Mechanics and Engineering Design, The Proceedings
of the Southampton 1969 Civil Engineering, Wiley-Interscience, pp. 357-366,
[23] T.Yuhara, M.Hasuike and K.Murakarni, Tibre Orientation Measurement with
the Two-Dimensional Power Spectrurn of a High-Resolution Soft X-ray
Image". Journal of Ptrlp and Paper Science. Vol. 1 7. No. 14. pp. J 1 104 1 14. July
1991
[24] K.J.Niskanen and J.W.Sadowski. "Evaluation of Some Fibre Orientation
Measurements", Journal of Piilp and Paper Science. Vol. 1 5. No.6. pp. 5220-
5224, November 1989
[25] C.C.Habeger and G.A.Baurn, T h e Use of Microwave Attenuation as a Measure
of Fibre Orientation Anisotropy". TAPPI Joltrnal. No.2, pp. 109- 1 13' Feb. 1987
[26] S. Osaki, "Microwaves Quickly Detemine the Fibre Orientation of Paper".
TAPPI Journal. No.2. pp. 105-108. Feb. 1987
(371 B.Drouin and R.Gagnon. "Optical Measurement of Paper Fibre Orientation".
Optical Engineering. Vol.32. No.9. pp. 2 138-2 1-12. 1993
[28] R.Gagnon, B.Drouin. L.-G.Dicaire and P.Bernard. "High Spatial Resolution
Non-Destructive Testing of Newsprint". Journal of Pulp and Puper Science,
Vol. 16. No.6, pp. J 1794 183, November IWO
[29] JScharcanski and C.T.Dodson. "Texture Analysis for Estimation Spatial
Variability and Anisotropy in Planar Stochastic Structuresg', Oprical
Engineering, Vo1.35 No.8. pp.2302-2309. August 1996
[30] Y. Chen, "Image Analysis Method for Paper Formation Evaluation", M.A.Sc.
Thesis, E!ectrical & Cornputer Engineering Department. University of Toronto.
1997
[3 11 R.E.Mark, "Handbook of Physical and Mechanical Testing of Paper and Paper-
board", Chapter 25, Vol. 2, Marcel Dekker Inc. 1985
[32] A. Wu. M.T.Kortschot. Y .Chen and RKwong, "Vaiiability in the Local
Structure and Properties of Paper". TAPPI International Paper Physics
Conference. pp. 155- 159. 1999
[33] W.R.Haselton, TAPPI Journd, Vo1.38, No.8, pp. 7 16, 1995
[34] W.L.Ingmanson and E.F.Thode. '-Factors Contribution to the Strength of A
Sheet of Paper", TAPPI Jownal. Vo1.42. No. 1. pp. 83-93. 1959
[35] T.Uesaka, Paper presented at 1990 Progress in Paper Physics Seminar.
Kalamazoo. October 1990
[36] R.A.Stranon. .'C haracterization of Fibre-Fibre Bond S trength From Paper
Mechanical Properties". International Paper Physics Conference, pp. 56 1-567.
1991
[37] 0.Kallmes and C.Eckert, "The Structure and Paper-VIL The Application of the
Relative Bonded Area Concept to Paper Evaluation", TAPPI Jozrrnal, Vol.47.
No. 9, pp. 540-548, Sept. 1964
[38] J. W.Swanson and ALSteber. "Fiber Surface Area and Bonded Area'?. TAPPI
Journal, Vol. 42, No. 12, pp. 986-994, Dec. 1959
[39] W.L.Ingmanson and E.F.Thode. "Factors Contribution to the Strength of a
Sheet of Paper-II. Relative Bonded Area". TAPPI JownaI. Vol. 42. No. 9. pp.
737-751. Sept. 1960
[40] KNiskanen, "Strength and Fracture of Paper", in Products of Papemaking -
Transactions of the Tenth Fundamental Research Symposium held at Oxford,
1993, Pira International. Leatherhead. 7. pp. 64 1 -725, 1993
[41] Van den Akker, J A, "Stmcture and Tensile Characteristics of Paper", TAPPI
Joianal, Vo1.53, No.3. pp. 388-400. 1970
[42] K.Jayaraman and M.T.Kortschot, "Closed-form Network Models for the Tensile
Strength of Paper - A Critical Discussion". Nordic P d p and Paper Reseclrch
Journal, Vol. 13, No. 3. pp. 233-242, 1998
[43] H.L.Cox, "The Eiasticity and Strength of Paper and Other Fibrous Materials",
British Journal Applied Physics. 3 3, pp. 72-79. 1952
[44] M.W.Kane. "The effect of Beating on Fibre Length Distribution-Part 1". Pulp
Paper Magazine, Canada 60: 10, pp. T308. 1959
[45] M.W.Kane, "Beating, Fibre Length Distribution and Tensile Strength-Part 11".
Pulp Paper Magazine, Canada 60: 12. pp. T3 59. 1959
[46] P .S hallhom and A.Karnis. "Tear and Tensile Strength of Mechanical Pulps".
Trans.Tech. Sect., CPPA, Vol.5, No.4. pp. TR92-99, 1979
[47] PKarenlampi, "Effect of Distributions of Fibre Properties on Tensile Strength
of Paper: A closed Form Theory", Joiirnal P d p Paper Science. Vo1.21. No.4.
pp. 5138-5143, 1995
[48] P.Karenlampi. "Tensile Strength of Paper", Tri PPI Journal, Vo1.52, No.4. pp.
674-68 1, 1969
[49] P.T.Herdrnan and H.Cone, "Comments on the Distribution of Mass Density in
Paper", P d p and Paper Canada, Vo1.81, No.10, pp. T261-64, 1980
[50] 0.J.Kallmes and M-Perez. "Consolidation of the Paper Web". edited by
F.Bolam (Technical section of the British Paper and Board Makers'
Association), London, UK, pp. 779-8 13, 1966
[5 11 K.Jayararnan and M.T.Kortschot. "Correction to the Fukuda-Kawata Young's
Modulus Theory and the Fukuda-Chou Strength Theory for Short Fibre-
reinforced Composite Materials", Jownal of Materials Science, 3 1. pp. 2059-
2064, 1996
[52] H.Fukuda and K.Kawata. "On Young's Modulus of Short Fibre Composites".
Fibre Science and Technology. Vo1.7. pp.207-222. 1 974
[53] D.H.Page, and F.EI-Hosseiny. "The Mechanical Properties of Single Wood
Pulp Fibres: part IV. Fibril Angle and the Shape of the Stress-Strain Curve",
Journal of Pulp und Paper Science, Vol. 9. No.4. pp. TR99. 1983
[54] M.K.Ramasubramanian and R.W.Perkins. "Computer Simulation of the
Uniaxial Elastic-Plastic Behavior of Paper". Jorrrnnl of Engineering Materials
and Technology. pp. 1 10-1 17, 1988
[55 ] C.C.Habeger, "An Addition to the Seth-Page Nonlinear Network Mode1 for
Paper". Journal of Pulp and Paper Science. Vol. 1 1 , No.2. pp. J5 1 4 5 5 . 1985
[56] W.K.Ng and C.T.J.Dodson, "Rapid Formation Performance Test'', Preprints of
the 1995 International Paper Physics Conference. Niagara-on-the-Lake, pp. 49-
54, 1995
[57] L.Wong, "Effect of Formation on Local Strain Fields and Fracture of Pape?.
M.A.Sc. Thesis, Chemical Engineering and Applied Chemistry Department.
University of Toronto. 1 995
[58] H.Corte and P.T.Herdman, "Physical Processes During the Drying of Paper8',
Das Papier 29, pp. 288-295, 1975
[59] P.Herdman and H.Corte. "Comments or. the Distribution of Mass Density in
Paper", Pirlp and Paper Canada. Vo1.8 1. No. l O. pp. 68-7 1. 1980
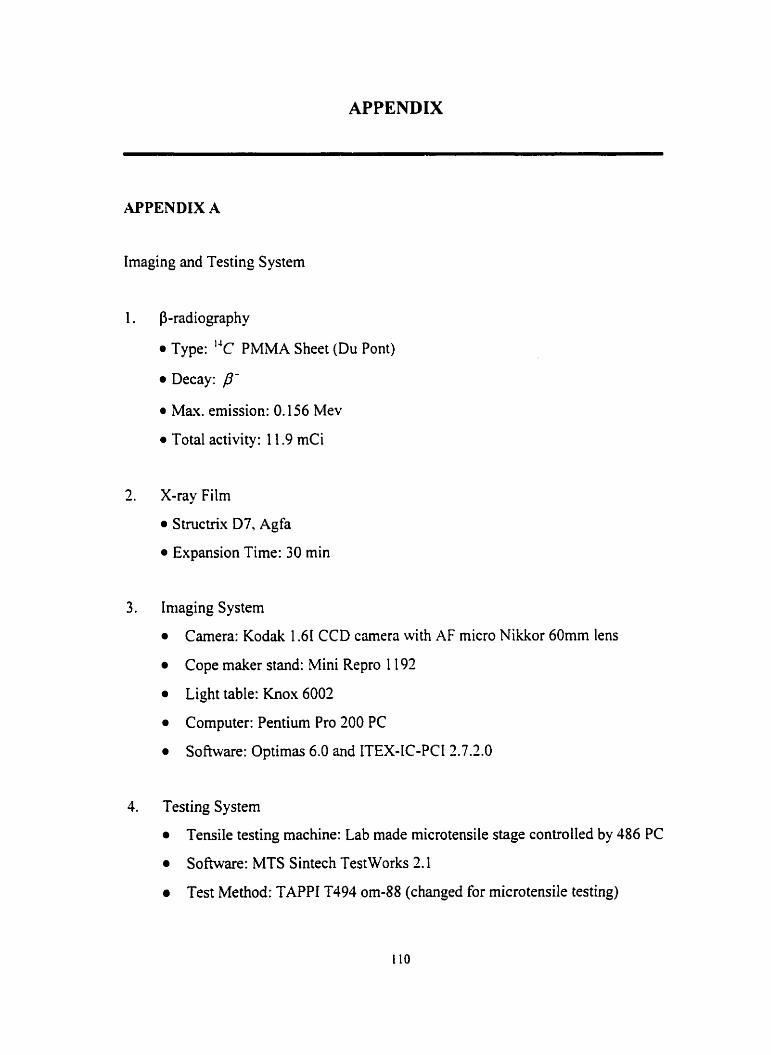
APPENDIX
- - - - . - - . . . --
APPENDIX A
Imaging and Testing System
P-radiography
Type: ''c PMMA Sheet (Du Pont)
Decay: P- a M a x emission: O. 156 Mev
Total activity: 1 1.9 mCi
X-ray Film
Stnictrix D7. Agfa
Expansion Time: 30 min
Imaging System
Camera: Kodak 1.61 CCD canera with AF micro Nikkor 60mm lens
Cope maker stand: Mini Repro 1 192
Light table: Knox 6003
Cornputer: Pentium Pro 200 PC
Software: Optimas 6.0 and ITEX-IC-PCI 2.7.2.0
Testing System
Tende testing machine: Lab made microtensile stage controiled by 486 PC
Software: MTS Sintech TestWorks 2.1
Test Method: TAPPI T494 om-88 (changed for microtensile testing)
Test Speed: 0.7573 mm/min, experimentally discovered speed
Gage Length: 15iirn
Test Condition: 50.0% f 2.0% RH and 23.0 f 1 .O O C
Cutter: Lab made micro-(ensile sarnple cutter sprcially for î m m x Imm
microtensile specimen
APPENDIX B
Local Fibre Orientation MATLAB Prograrn
Yinglin Chen [30]
Modified by Baohua Shen
%Read in .tiff image file and convert the gray level image to g rammage map
grammage=[162.0 145.8 129.6 1 13.4 97.2 81 .O 64.8 38.6 32.4 16.21;
gray=[233.762 23 1.34 214.153 214.07 199.2 174.377 143.41 1 103.096 6 1.6639
30.79411;
gram=[] ;
p 1 =polyfit(gray(j: 1 0). grammage(5: 10). 1):
p2=polyfit(gray( 1 : 5). grammage( 1 :5).2):
[X, map]=imread('/u/grad/shenb/matlab/local imagemeta/ 1452-26-Z/Jan2000/ts 1. tif );
A=double(X);
for i=1:200
for j= 1 200
if A(iJ) < 20 1
G(iJ)=p 1 (l)*A(i.j)+p l(2):
else
G(itj)=p2(1)* A(iJ)"2+p2(2)* A(i.j)+p2(3);
end
end
end
gmean=rnean(mean(G)); %Mean grarnmage value
% Given G (the grammage map) already
tic;
resolution=0.008772; % (mdpixel)
imgLen=1.7544; % length of the original image (mm)
suvLen=l.7544; % length of suveyed area (mm)
suvWid4.7544; % width of surveyed area (mm)
%insLen=0.02; % inspection zone side length (mm)
x l= l ; % starting row of the surveyed area
y l = 1; % starting column
x2=x 1 +suv W idhesolution; % ending mw
y2=y 1 +suvLen/resolution: % ending column
imgDim=imgLen/resolution; % dimension of the original image
suvWDim=yZ-y1; % dimension of surveyed area length
suvLDim=xZ-x 1 ; % dimension of surveyed area width
opOrder4; % order of operator, odd number
w=(opOrder- 1 )/2;
tsetupftoc;
%tic:
deltg=zeros(suvLDim-Pw.suvWDim-Pw):
theta=zeros(suvLDim-2* w.suvWDim-2* w); % initialize matrices for deltg and theta
PrewCol(1 :opOrder,w+ 1 )=zeros(opOrder, I ):
PrewCol( 1 :opOrder,w+2:0pOrder)=(- 1 )*ones(opOrder.opOrder-w- 1 );
PrewRow(w+2:opOrder. 1 :oporder)=(- 1 )*ones(opOrder-w- 1 .oporder):
% de fine prewitt row and column operators
GradRow=conv2(G,PrewRow,'valid'); % gradient in row direction
GradCol=conv2(G.PrewCol,'valid'); % gradient in colurnn direction
deltg=sqrt(GradRow."2+GradCol."2);
Mudeltg=mean(deltg);
Mudeltg
theta=atan2(GradRo~.GradCol);
Mux=mean(mean(GradCol));
Muy=mean(mean(GradRow));
Vxx=sum(sum((GradCol-Mux* Unit)."2))lMbyN:
Vyy=sum(surn((GradRow-Muy* Unit).^2))/MbyN;
Vxy=surn(sum((GradCol-Mux *Unit). *(GradRow-Muy * Unit)))/Mb yN ;
Lumdmax=(Vxx+Vyy+sqrt((V;~x-V~y)~2+4*Vxy^2;
Lumdrnin=(Vxx+Vyy-~qrt((Vx.~-Vyy)~2+4*Vxy~2))/2;
e2=LumdmauA7JLumdminA2; % eccentrity number e?
% e2
LoDoLDim=floor(validLDim/insDim);
LoDo WDim=floor(validWDim/insDim);
Thetad2=zeros(LoDoLDim.LoDo WDirn);
Thetad=zeros(LoDoLDim,LoDo WDim);
Coherence=zeros(LoDoLDim.LoDo WDim);
for i= 1 :LoDoLDim
for j=l :LoDoWDim
yO=(i- 1 )* insDim+ 1 ;
xO=Q - 1 )* insDim+ 1 ;
sinSum=sum(sum(deltg(yO: yO+insDim- 1 .xO:xO+insDim-
1 )."2.* sin(î-*theta(yO: yO+insDim- 1 .xO:xO+insDim- 1 )))):
cosSum=sum(sum(deltg(yO: yO+insDim- 1 .xO:xO+insDim-
1 )."2.*cos(2*theta(y0:yO+insDim- l .xO:xO+insDim- 1 ))));
Thetad2(i.j)=atan2(sinSum.cosSum):
if Thetadî(i.j)>=O
Thetad(i j ) = O . j *ThetadZ(i.j);
end
if Thetad2(i.j)<0
Thetad(i.j)=O. 5 * (2*pi+Thetad2(i.j));
end
deltgc=deltg(yO: yO+insDim- 1 ?xOxO+insDim- 1 );
thetac=theta(yO: yO+insDim- 1 ,xO:xO+insDim- 1 );
Thetadc=ones(insDim,insDim)*Thetad(i.j);
Coherence(i j)=surn(sum(abs(deltgc. * c o s ( t h t a d c ) ) ) ) ;
Coherence(i.j)=Coherence(i.j)l(insDim"2);
end
end % find the local dominant orientation & coherence( absolute values of
projections)
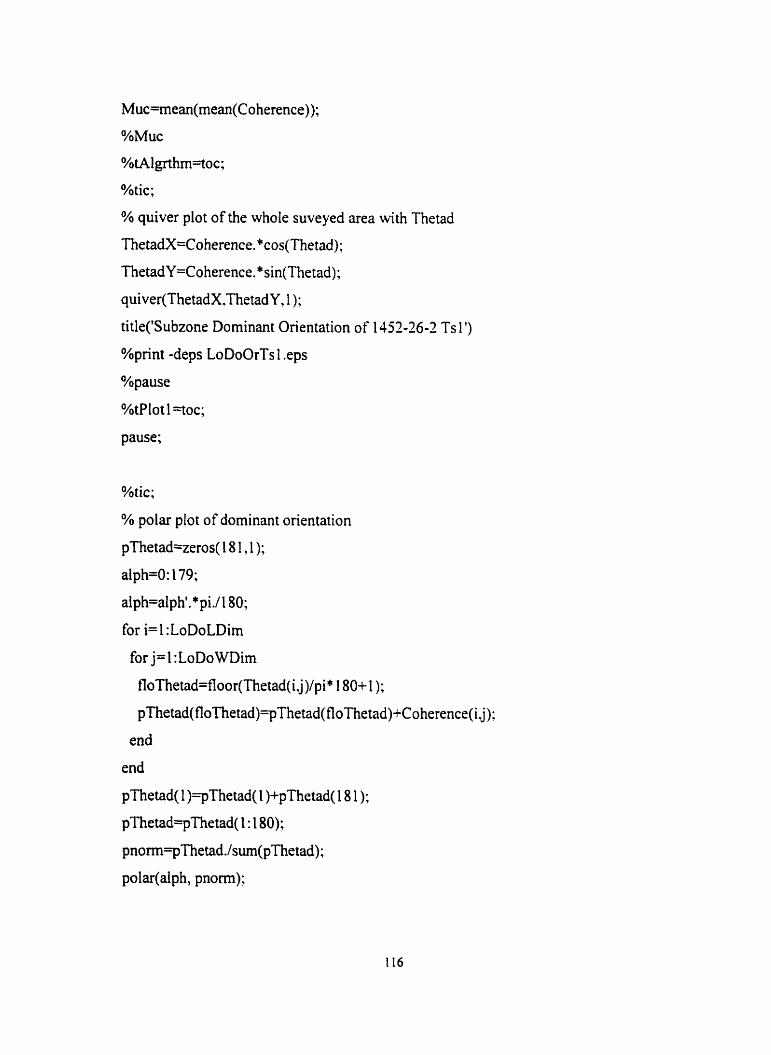
Muc=mean(mean(Co herence));
%Muc
%tAlgrthm=toc;
%tic;
% quiver plot of the whole suveyed area with Thetad
ThetadX=Coherence. *cos(Thetad);
ThetadY=Coherence.*sin(Thetad);
quiver(ThetadX,ThetadY, 1 );
title('Subzone Dominant Orientation of 1452-26-2 Ts 1 ')
%print -deps LoDoOrTs 1 .eps
%pause
%tPlot 1 =toc;
pause;
%tic;
% polar plot of dominant orientation
pThetad=zems( 18 1 . 1 );
alph=O: 179;
alph=alpht.*pi./l 80;
for i=l :LoDoLDim
for j=l:LoDoWDim
floThetad=floor(Thetad(i.j)/pi' 1 80+ 1 );
pThetad(floThetad)=pThetad( floThetad)+Cokmce(Lj);
end
end
pThetad( 1 )=pThetad(l )+pThetad(l8 1 );
pThetad=pThetad(l : 180);
pnorm=pThe tad./sum(pThetad);
polar(alph, pnorm);
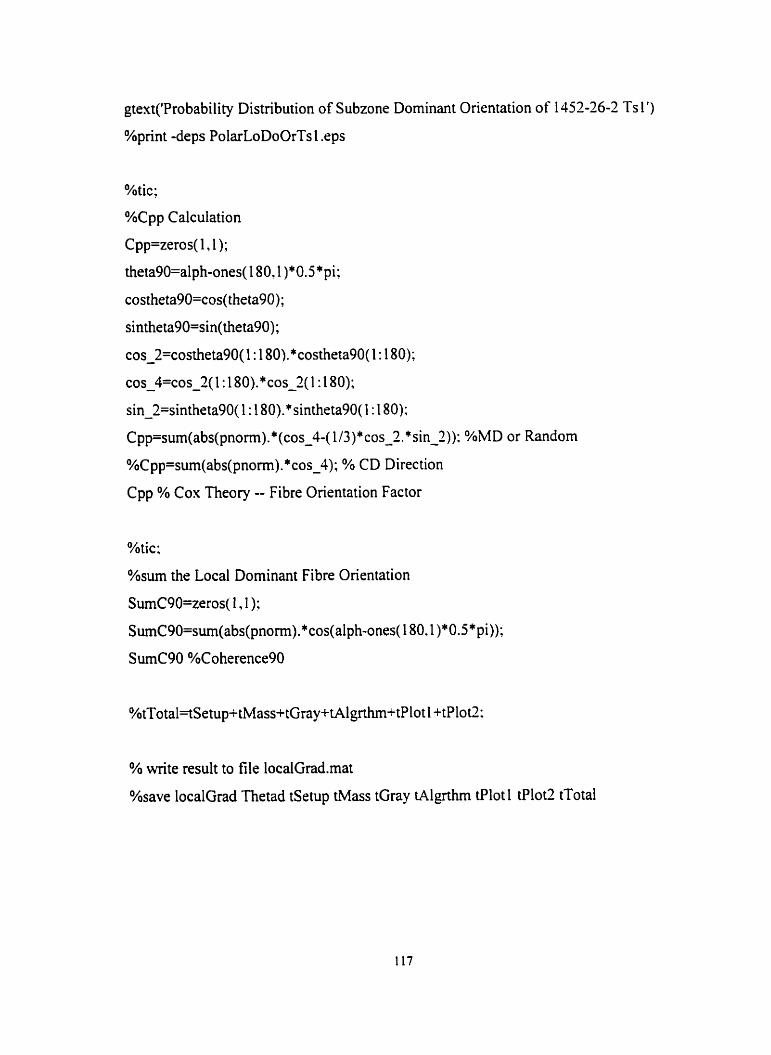
gtext('Probabi1ity Distribution of Subzone Dominant Orientation of 1452-26-2 Ts 1 ')
%print -deps PolarLoDoOrTs 1 .eps
%tic;
%Cpp Calculation
Cpp=zeros( 1 , 1 );
theta90=alph-ones([ 80.1 )*0.5*pi;
costheta90=cos(theta90);
sintheta90=sin(theta90);
cos~2=costheta90(1: 180).*costheta90(1: 180);
cos - 4~0s-2(1: 180).*cos-2(1 : 180);
sin-2=sintheta90(1: 180).*sintheta90(1: 180):
Cpp=sum(abs(pnom). *(cos - 4-(1/3)*~0~-2.*sin - 2)): %MD or Random
%C pp=sum(abs(pnorm). * cos-4); % CD Direction
Cpp % Cox Theory -- Fibre Orientation Factor
%tic;
%sum the Local Dominant Fibre Orientation
SumC90=zeros( 1, 1):
SumC90=sum(abs(pnorm).*cos(alph-ones( 1 80.1 )*O5 *pi));
SumC90 %Coherence90
% write result to file 1ocalGrad.mat
%save localCirad Thetad tSetup tMass tGray tAlgrthm Plot 1 tPlot2 tTota1
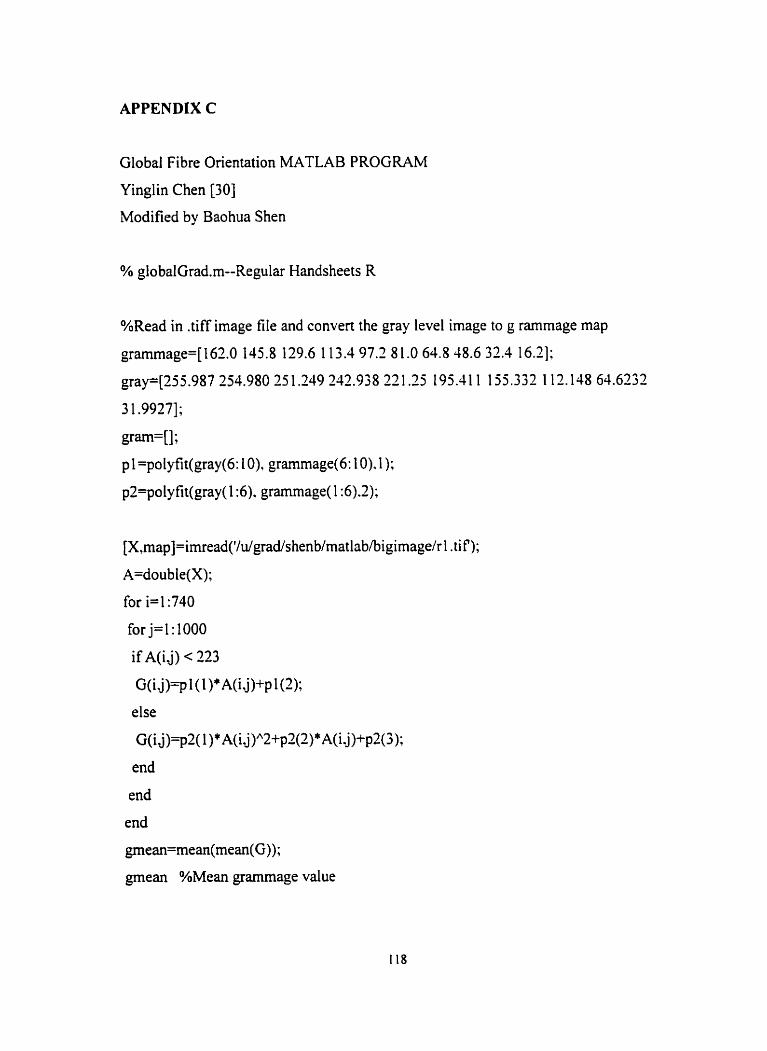
APPENDIX C
Global Fibre Orientation MATLAB PROGRAM
Yinglin Chen [30]
Modified by Baohua Shen
% globa1Grad.m--Regular Handsheets R
%Read in .tiff image file and convert the gray level image to g rarnmage map
grarnmage=[162.0 145.8 129.6 1 13.4 97.2 8 1 .O 64.8 48.6 32.4 16.21;
gray=[255.987 254.980 251.249 242.938 221 .X 195.41 1 155.332 112.148 64.6232
3 1.99271;
gram=[] ;
pl=polfit(gray(6: 1 O), grammage(6: 10). 1);
p2=polyfit(gray(l:6). grammage( 1 :6).2);
[X,map]=imread('/u/grad/shenb/matlab/bigr 1. tif);
A=double(X);
for i=1:740
for j=1: 1000
if A(ij) < 223
G(i.j)=p 1 (1 )* A(i.j)+p l(2);
else
G(ij)=p2( l)*A(i.j)A2+p3(2)*A(i.j)+p2(3);
end
end
end
gmean=mean(mean(G)) ;
gmean %Mean grammage value
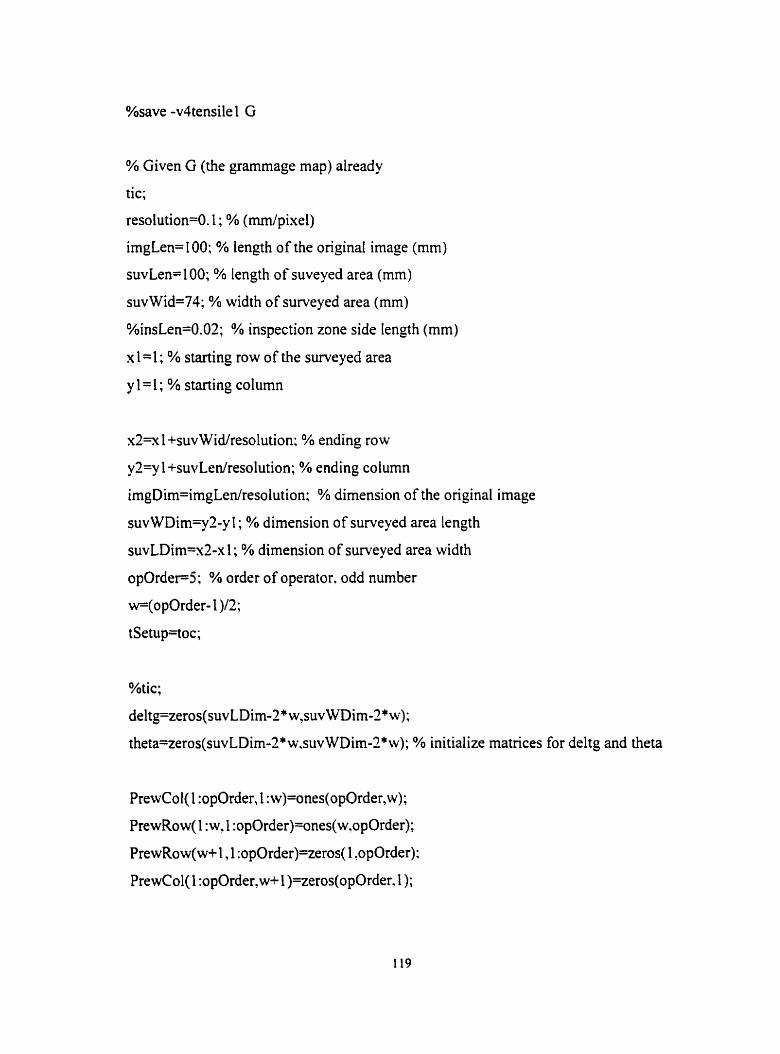
% Given G (the grammage map) already
tic;
resolutios0.l; % (rndpixel)
imgLen= 100; % length of the original image (mm)
suvLen=100; % length of suveyed area (mm)
suvWid=74; % width of surveyed area (mm)
%insLen=O.Oî; % inspection zone side length (mm)
x 1 = I ; % starting row of the surveyed area
y 1 = l ; % starting column
x 2 ~ 1 +suvWid/resolution: % ending row
y2=y 1 +suvLen/resolution; % ending column
imgDirn=imgLen/resolution; % dimension of the original image
suvWDim=y2-y I ; % dimension of surveyed area length
suvLDim==xZ-x I ; % dimension of surveyed area width
o p O r d e ~ 5 : % order of operator. odd number
w=(opOrder- 1 )/2;
tbetuptoc;
%tic;
deltg=zeros(suvLDim-2* w,suvWDim-2* w);
theta=zeros(suvLDim-2'w.suvWDim-fi); % initialize matrices for deltg and theta
PrewCol( 1 :opOrder,w+2:opOrder)=(- 1 ) * ones(opOrder.opOrder-w- 1 1;
PrewRow(w+Z:opOrder, 1 :oporder)=(- l )*ones(opOrder-w- l .oporder);
% define prewitt row and column operators
GradRow=convZ(G.PrewRow,'valid'); % gradient in row direction
GradCol=conv2(G.PrewCoI.'valid'); % gradient in column direction
validLDim=suvLDim-2* w;
validWDim=suvWDim-2*w; %size of deitg and theta
Unit=ones(validLDim, valid WDim);
MbyN=suvLDim*validWDim;
deltg=sqrt(GradRo~.~2+GradC01.~2);
Mudel tg=mean(mean(deI tg));
%Mudeltg % mean magnitude of gradient
Sigmdeltg2=mean(mean((deltg-Mudeltg* Unit).?));
Sigmdeltg=sqrt(S igmdellg2)/ 1 0:
%Sigmdeltg % variance of magnitude of gradient
CVdeltg=sqrt(Sigmdeltg?)/Mudel tg;
%CVdeItg % coefficient of variation--deviation of gradient magnitude
Kdeltg=MudeltgAUSigmdeltg2:
%Kdeltg % parameter of gamma distribution
theta=atan2(GradRow,GradCol);
validLDim=suvLDim-2*w;
validWDim=suvWDim-2*w; %size of deltg and theta
Vxx=sum(sum((GradCoI-Mux * Unit)."S))/MbyN:
Vyy=surn(sum((GradRow-M~y*Unit).~Z))/MbyN;
Vxy=sum(sum((GradCol-Mux* Unit).* (GradRow-Muy *Unit)))/MbyN;
Lumdmax=(Vxx+Vyy+sqrt((Vx~-Vyy)~2+4*V;~y~3))/2;
Lumdmin=(Vxx+Vyy-sqrt((Vx.~-Vyy)~2+4* VxyA2))/2;
e2=LumdmaxA2/Lumdmin"2;
%eZ % eccentrity number e2
insDim= l O*opOrder;
LoDoLDim=floor(validLDim/insDim):
LoDo WDim=floor(validWDirn/insDim):
Thetad3=zeros(LoDoLDim,LoDo WDim);
Thetad=zeros(LoDoLDim.LoDo WDim);
Coherence=zeros(LoDoLDim,LoDo WDim);
for i=l :LoDoLDim
for j=l :LoDoWDim
yO=(i- l )* insDim+ 1 ;
xO=(j-l)*insDim+l;
sinSum=sum(sum(deltg(yO:yO+insDim- 1 ,xO:xO+insDim-
l)."2.*sin(2* theta(yO:yO+insDim- 1 ,xO:xO+insDim- 1)))):
cosSum=surn(sum(deltg( yO: yO+insDim- 1 ,xO:xO+insDim-
1)."2.*c0s(2*theta(y0:y0+insDim- 1 .xO:xO+insDim- 1))));
Thetad2(i j)=atan2(sinS~cosSurn);
if Thetad2(ij)>=O
Thetad(i &=OS *Thetad2(i j );
end
if Thetad2(i j)<O
Thetad(i.j)=0.5 * (2*pi+Thetad2(i 4));
end
deltgc=deltg(yO:yO+insDim- 1 .xO:xO+insDim- 1 );
thetac=theta(yO:yO+insDim- 1 ,xO:xO+insDim-1);
Thetadc=ones(insDim,insDim)*Thetad(ij);
Coherence(i j)=sum(sum(abs(deltgc. * cos(thetac-Thetadc))));
Coherence(i j)=Coherence(i.j)/(insDimA2);
end
end % find the local dominant orientation & coherence( absolute values of
projections)
Muc=mean(mean(Coherence));
%Muc % mean magnitude of coherence
%tAlgrthm=toc;
%tic;
% quiver plot of the whole suveyed area with Thetad
ThetadX=Coherence. * sin(Thetad);
ThetadY=Coherence. *cos(Thetad);
quiver(ThetadX,ThetadY. 1 );
title('Local Dominant Fibre Orientation of Regular Handsheet R')
%pint -deps LoDoOrR 1 .eps
%pause
%tPlot 1 ==toc;
pause;
% polar plot of dominant orientation
pThetad=zeros( 18 1,1);
dph=O: 179;
dph=alph'.*piJi 80;
for i=l :LoDoLDim
for j=l :LoDoWDim
floThetad=fioor(Thetad(i.j)/pi* 1 8U+ 1 );
pThetad(floThetad)=pThetad(Ro~etad)+Coherence(i.j);
end
end
pThetad(1 )=pThetad( l )+pThetad( 1 8 1 );
pThetad=pThetad( 1: 180);
pnorm=pThetad./sum(pThetad);
polar(alph, pnorm);
gtext('Probabiiity Distribution of Local Dominant Orientation for Regular Handsheet
R')
%print -deps PolarLoDoOrRl .eps
% write result to file globalGrad.mat
%save globalGrad Thetad tSetup tMass tGray tAlgrthrn Plot 1 tPlor2 tTotal
APPENDIX D
dNoise Macro-Program
Standard Program in Optimas 6.0
// AVERAGNG 16 IMAGES TOGETHER
// Define variables
CHAR CA, clmage;
CHAR cB = "IMAGE";
CHAR CD = "AVG";
// turn off undo
Undo(FALSE);
// Acquire and average the first image
ROIToList(," AVG 1 ");
Acquireo;
Freeze();
ROIToList(NULL," fiamet' );
Acquire();
Freeze() ;
ArithmeticOp("Average", " frame");
CA = ToText(y);
cImage = cB:cA;
ROIToList(,c Image);
z = ToText(y- 1 );
CHAR avg = cD:z;
ArithmeticOp(" AverageH.cD:z):
ROIToList(.cD:cA);
DeleteImage(c1mage):
DeleteImage(cD:z):
1
DeleteIrnage(" frame"):