Embed Size (px)
Citation preview
Mon. Not. R. Astron. Soc. 378, 1131–1140 (2007) doi:10.1111/j.1365-2966.2007.11848.x
Proper motion L and T dwarf candidate members of the Pleiades
S. L. Casewell,1� P. D. Dobbie,1,2 S. T. Hodgkin,3 E. Moraux,4 R. F. Jameson,1
N. C. Hambly,5 J. Irwin3 and N. Lodieu1,6
1Department of Physics and Astronomy, University of Leicester, University Road, Leicester LE1 7RH2Anglo-Australian Observatory, PO Box 296, Epping, NSW 1710, Australia3CASU, Institute of Astronomy,University of Cambridge, Maddingley Road, Cambridge CB3 0HA4Laboratoire d’Astrophysique, Observatoire de Grenoble, Universite Joseph Fourier, BP 53, 38041 Grenoble Cedex 9, France5Scottish Universities Physics Alliance (SUPA), Institute for Astronomy, School of Physics, University of Edinburgh, Royal Observatory, Blackford Hill,Edinburgh EH9 3HJ6Instituto de Astrofısica de Canarias, Vıa Lactea s/n, E-38205 La Laguna, Tenerife, Spain
Accepted 2007 April 11. Received 2007 April 11; in original form 2007 February 5
ABSTRACTWe present the results of a deep optical–near-infrared (optical–NIR) multi-epoch survey cov-ering 2.5 deg2 of the Pleiades open star cluster to search for new very low-mass brown dwarfmembers. A significant (∼5 yr) epoch difference exists between the optical (CFH12k I-,Z-band) and NIR (UKIRT WFCAM J-band) observations. We construct I, I − Z and Z, Z − Jcolour–magnitude diagrams to select candidate cluster members. Proper motions are computedfor all candidate members and compared to the background field objects to further refine thesample. We recover all known cluster members within the area of our survey. In addition, wehave discovered nine new candidate brown dwarf cluster members. The seven faintest can-didates have red Z − J colours and show blue NIR colours. These are consistent with beingL- and T-type Pleiads. Theoretical models predict their masses to be around 11MJup.
Key words: stars: low-mass, brown dwarfs – open clusters and associations: individual:Pleiades.
1 I N T RO D U C T I O N
The initial mass spectrum (IMS), the number of objects manufac-tured per unit mass interval, is an outcome of the star formationprocess which can be constrained via observation. Consequently,empirical determinations of the form of the IMS can be used to crit-ically examine our theoretical understanding of the complexities ofstar formation. In recent years there has been a particular empha-sis on building a solid comprehension of the mechanisms by whichvery low-mass stars, brown dwarfs and free-floating planetary massobjects form (e.g. Boss 2001; Bate 2004; Goodwin, Whitworth &Ward-Thompson 2004; Whitworth & Goodwin 2005). Neverthe-less, one key question which remains unanswered is what is thelowest possible mass of object that can be manufactured by thestar formation process? From a theoretical stance, traditional mod-els predict that if substellar objects form like stars, via the frag-mentation and collapse of molecular clouds, then there is a strictlower mass limit to their manufacture of 0.007–0.010 M� (Padoan& Nordlund 2002). This is set by the rate at which the gas can radiateaway the heat released by the compression (e.g. Low & Lynden-Bell1976). However, in more elaborate theories, magnetic fields couldcause rebounds in collapsing cloud cores which might lead to the
�E-mail: [email protected]
decompressional cooling of the primordial gas, a lowering of theJeans mass and hence the production of gravitationally bound frag-ments with masses of only ∼ 0.001 M� (Boss 2001). In contrast,if feedback from putative winds and outflows driven by the onsetof deuterium burning play a role, the smallest objects which formvia the star formation process may be restricted to masses equal toor greater than the deuterium burning limit (∼0.013 M�; Adams &Fatuzzo 1996).
Recent work on very young clusters (τ < 10 Myr) and star for-mation regions, for example, σ -Orionis, the Trapezium, IC 348 andUpper Sco (Bejar et al. 2001; Muench et al. 2002, 2003; Lodieu et al.2007) suggests that the initial mass function continues slowly risingdown to masses of the order of M ∼ 0.01 M�, at least in these envi-ronments. Indeed, it has been claimed that an object with a mass aslow as 2–3 MJup has been unearthed in σ -Ori (Zapatero Osorio et al.2002). However, the cluster membership of σ -Ori 70 is disputedby Burgasser et al. (2004). Furthermore, mass estimates for suchyoung substellar objects derived by comparing their observed prop-erties to the predictions of theoretical evolutionary tracks remainsomewhat controversial. Baraffe et al. (2002) have shown that to ro-bustly model the effective temperature and luminosity of a low-massobject with an age less than ∼1 Myr, evolutionary calculations needto be coupled to detailed simulations of the collapse and accretionphase of star formation. As the current generation of evolutionarymodels start from arbitrary initial conditions, theoretical predictions
C© 2007 The Authors. Journal compilation C© 2007 RAS
1132 S. L. Casewell et al.
for ages less than a few Myr must be treated with a fair degree ofcaution. Indeed, the few available dynamical mass measurements ofpre-main-sequence objects indicate that models tend to underesti-mate mass by a few tens of per cent in the range 0.3 � M � 1.0 M�(see Hillenbrand & White 2004, for review). A recent dynamicalmass measurement of the 50–125 Myr old object AB Dor C (spec-tral type ∼M8), the first for a pre-main-sequence object with M <
0.3 M� suggests that the discrepancy between model predictionsand reality might be even larger at lower masses, with the formerunderestimating mass by a factor of 2–3 at M ∼ 0.1 M� (Close et al.2005). However, this conclusion is dependent on the assumed age ofAB Dor, which is currently a matter of great contention (Luhman,Stauffer & Mamajek 2005; Janson et al. 2007). On the positive side,Zapatero Osorio et al. (2004) have determined the masses of thebrown dwarf binary components of GJ 569 Bab and their luminosi-ties and effective temperatures are in agreement with theoreticalpredictions, for an age of 300 Myr. More recently, Stassun, Mathieu& Valenti (2006) discuss an eclipsing brown dwarf binary in theOrion nebula star-forming region and find the large radii predictedby theory for a very young dwarf. Surprisingly, they find that thesecondary is hotter than the more massive primary. Clearly, furtherwork is still needed to support the predictions of theoretical models.
It is clearly important to search for the lowest mass objects, notonly in the young clusters, but also in more mature clusters, suchas the Pleiades. The results of previous surveys of the Pleiades in-dicate that the present-day cluster mass function, across the stel-lar/substellar boundary and down to M ∼ 0.02 M� (based on theevolutionary models of the Lyon Group), can be represented by aslowly rising power-law model, dN/dM ∝ M−α . For example, fromtheir Canada–France–Hawaii Telescope (CFHT) survey conductedat R and I and covering 2.5 deg2, Bouvier et al. (1998) identified 17candidate brown dwarfs (IC � 17.8) and derived a power-law in-dex of α = 0.6. From their 1.1-deg2 Isaac Newton Telescope (INT)survey conducted at I and Z, with follow-up work undertaken atK, Dobbie et al. (2002) unearthed 16 candidate substellar membersand found a power law of index α = 0.8 to be compatible with theirdata. Jameson et al. (2002) showed that a power law of index α =0.41 ± 0.08 was consistent with the observed mass function over therange 0.3 � M � 0.035 M�. This study used a sample of 49 proba-ble brown dwarf members assembled from the four most extensiveCCD surveys of the cluster available at the time, the InternationalTime Project survey (Zapatero Osorio et al. 1998), the CFHT survey(Bouvier et al. 1998; Moraux, Bouvier & Stauffer 2001), the BurrellSchmidt survey (Pinfield et al. 2000) and the INT survey (Dobbieet al. 2002). The CFHT survey was subsequently extended to anarea of 6.4 deg2 (at I and Z) and unearthed a total of 40 candidatebrown dwarfs. Moraux et al. (2003) applied statistical arguments toaccount for non-members in their sample and derived a power-lawindex of α = 0.6. Most recently, Bihain et al. (2006) have used deepR-, I-, J- and K-band photometry and proper motion measurementsto unearth six robust L-type Pleiades members in an area of 1.8 deg2
with masses in the range 0.04–0.02M� and derived a power-lawindex of α = 0.5 ± 0.2.
Here we report the results of a new optical/infrared (IR) surveyof 2.5 deg2 of the Pleiades, the aim of which is to extend empiri-cal constraints on the cluster mass function down to the planetarymass regime (M ∼ 0.01 M�). In the next section we describe theobservations acquired/used as part for this study, their reduction,their calibration and their photometric completeness. In subsequentsections we describe how we have identified candidate brown dwarfmembers on the basis of colours and proper motions. We use ournew results to constrain the form of the cluster mass function and
conclude by briefly discussing our findings in the context of starformation models.
2 O B S E RVAT I O N S , DATA R E D U C T I O N A N DS U RV E Y C O M P L E T E N E S S
2.1 The J-band imaging and its reduction
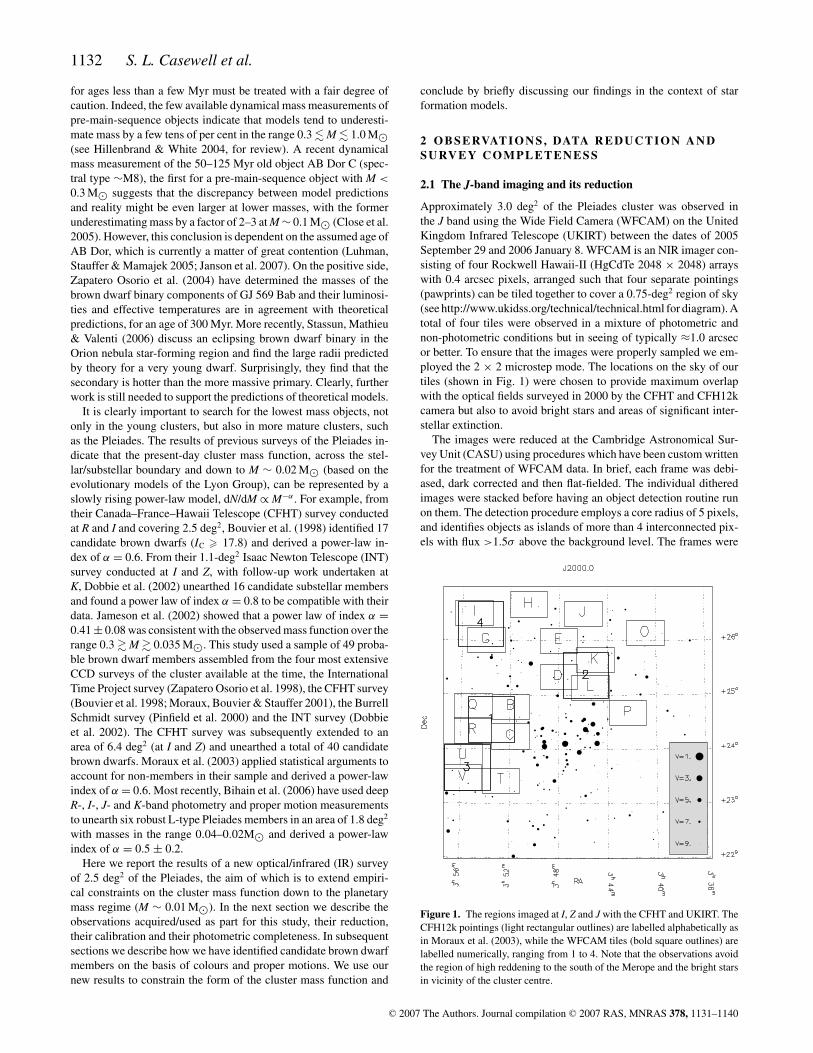
Approximately 3.0 deg2 of the Pleiades cluster was observed inthe J band using the Wide Field Camera (WFCAM) on the UnitedKingdom Infrared Telescope (UKIRT) between the dates of 2005September 29 and 2006 January 8. WFCAM is an NIR imager con-sisting of four Rockwell Hawaii-II (HgCdTe 2048 × 2048) arrayswith 0.4 arcsec pixels, arranged such that four separate pointings(pawprints) can be tiled together to cover a 0.75-deg2 region of sky(see http://www.ukidss.org/technical/technical.html for diagram). Atotal of four tiles were observed in a mixture of photometric andnon-photometric conditions but in seeing of typically ≈1.0 arcsecor better. To ensure that the images were properly sampled we em-ployed the 2 × 2 microstep mode. The locations on the sky of ourtiles (shown in Fig. 1) were chosen to provide maximum overlapwith the optical fields surveyed in 2000 by the CFHT and CFH12kcamera but also to avoid bright stars and areas of significant inter-stellar extinction.
The images were reduced at the Cambridge Astronomical Sur-vey Unit (CASU) using procedures which have been custom writtenfor the treatment of WFCAM data. In brief, each frame was debi-ased, dark corrected and then flat-fielded. The individual ditheredimages were stacked before having an object detection routine runon them. The detection procedure employs a core radius of 5 pixels,and identifies objects as islands of more than 4 interconnected pix-els with flux >1.5σ above the background level. The frames were
Figure 1. The regions imaged at I, Z and J with the CFHT and UKIRT. TheCFH12k pointings (light rectangular outlines) are labelled alphabetically asin Moraux et al. (2003), while the WFCAM tiles (bold square outlines) arelabelled numerically, ranging from 1 to 4. Note that the observations avoidthe region of high reddening to the south of the Merope and the bright starsin vicinity of the cluster centre.
C© 2007 The Authors. Journal compilation C© 2007 RAS, MNRAS 378, 1131–1140
Proper motion members of the Pleiades 1133
astrometrically calibrated using point sources in the Two Micron AllSky Survey (2MASS) catalogue. These solutions, in general, had ascatter of less than 0.1 arcsec. The photometric calibration employedby the CASU pipeline also relies on 2MASS data (there are typi-cally hundreds of 2MASS calibrators per detector) and is found tobe accurate to ≈2 per cent in good conditions (see Hodgkin et al.,in preparation and Warren et al. 2007 for details).
In measuring our photometry we used an aperture of 2 arcsec,which is approximately twice the core radius of point sources. This2 arcsec diameter of the aperture is also twice the seeing FWHM. Thereduction pipeline also attempts to classify each source dependingon its morphology (e.g. galaxy, star, noise). However, at the limit ofthe data this classification becomes less reliable. Therefore, in oursubsequent analysis we chose to define as stellar all objects whichlie within 3σ of the stellar locus, where σ is defined according toIrwin et al. (in preparation).
2.2 The far-red optical imaging and a new reduction
As part of this work we have used a subset (2.54 deg2) of the far-redoptical data obtained in the course of the IZ survey of the Pleiadesconducted in 2000 by Moraux et al. (2003). The relevant CFH12kdata were extracted from the Canadian Astrophysical Data Centrearchive and were reprocessed at Cambridge University using theCASU optical imaging pipeline (Irwin & Lewis 2001). In brief,these data were bias subtracted and corrected for non-linearity priorto flat-fielding. Fringe maps, which were constructed for each pho-tometric band from images obtained during the observing run, wereused to remove the effects of interference between night sky lines inthe CCD substrate. Subsequently, sources at a level of significanceof 3σ or greater were morphologically classified and aperture pho-tometry obtained for each. A World Coordinate System (WCS) wasdetermined for each frame by cross-correlating these sources withthe Automated Plate Measuring machine catalogue (Irwin 1985).The approximately 100 common objects per CCD chip lead to aninternal accuracy of typically better than 0.3 arcsec. The photometrywas calibrated on to a CFH12k I and Z natural system using starswith near zero colour (B − V − R − I ≈ 0) in Landolt standardfield SA98 (Landolt 1992) which was observed the same nights asthe science data. The systematic errors in the photometry were cal-
Table 1. 50 and 90 per cent completeness figures for the optical and IR fields. The positioning of these fields is shown in Fig. 1. Note that while WFCAMfield 1 corresponds to CFHT fields B, C, R and Q, the individual pawprints do not correspond on a one-to-one basis – that is, field1 00 does not correspond tofield B.
Field name I Z WFCAM tile name WFCAM pawprint name J50 per cent 90 per cent 50 per cent 90 per cent 50 per cent 90 per cent
B 23.2 22.5 22.3 21.5 Field 1 00 20.9 19.9C 23.7 22.6 22.6 21.6 Field 1 01 20.9 20.1R 24.0 23.0 22.9 21.6 Field 1 10 20.9 19.8Q 23.7 22.5 22.7 21.6 Field 1 11 20.9 19.7K 23.6 22.5 23.0 21.9 Field 2 00 20.9 19.7L 24.0 22.7 23.0 21.8 Field 2 01 20.9 19.9D 23.7 22.4 23.0 21.7 Field 2 10 21.0 19.9
Field 2 11 20.9 19.7U 23.5 22.5 22.9 21.7 Field 3 00 19.5 18.8V 23.8 22.5 22.7 21.7 Field 3 01 19.0 17.7T 23.6 22.5 22.6 21.5 Field 3 10 19.6 18.6
Field 3 11 18.9 17.7I 23.9 22.3 23.1 22.0 Field 4 00 20.8 19.7G 23.7 22.7 23.4 22.3 Field 4 01 20.8 19.7
Field 4 10 20.8 19.7Field 4 11 20.8 19.7
culated by comparing the photometry of overlapping fields as inMoraux et al. (2003). The photometry was found to be accurate to≈3 per cent.
2.3 The completeness of data sets
To estimate the completeness of our IR images, we injected fakestars with magnitudes in the range J = 12–22 into each of the16 chips of every WFCAM frame and reran the object detectionsoftware with the same parameters that were used to detect the realsources. To avoid significantly increasing the density of all sourcesin the data we inserted only 200 fake stars per chip in a given run.To provide meaningful statistics we repeated this whole procedure10 times. Subsequently, we calculated percentage completeness ata given magnitude by taking the ratio of the number of fake starsrecovered to the number of fake stars injected into a given magnitudebin (and multiplying by 100). We note that a 100 per cent recoveryrate was never achieved at any magnitude since a small proportionof the fake stars always fell sufficiently close to other sources tobe overlooked by the object detection algorithm. This method wasalso applied to determine the completeness of the I- and Z-bandCFH12k data. However, the magnitude range of the fake stars wasadjusted to be consistent with the different saturation and faint-endmagnitude limits of these data. The results of this procedure for allthree photometric bands are shown in Table 1.
A glance at this table indicates that the IR data are in general90 per cent complete to J ≈ 19.7, although field 3 is slightly lessdeep, due to moonlight and poor seeing. In this case the proximity ofthe moon led to higher background counts. The I data are typically90 and 50 per cent complete to I = 22.5 and 23.5, respectively. Thecorresponding completeness limits for the Z-band data are Z = 21.5and 22.5, respectively.
3 A NA LY S I S O F T H E DATA
3.1 Photometric selection of candidate cluster members
An initial photometrically culled sample of candidate brown dwarfshas been obtained from the I, I − Z colour–magnitude diagram(CMD) (Fig. 2) where the 120-Myr NEXTGEN (Baraffe et al. 1998)
C© 2007 The Authors. Journal compilation C© 2007 RAS, MNRAS 378, 1131–1140
1134 S. L. Casewell et al.
17
18
19
20
21
22
23
24
25 0 1 2 3 4 5
I
I-Z
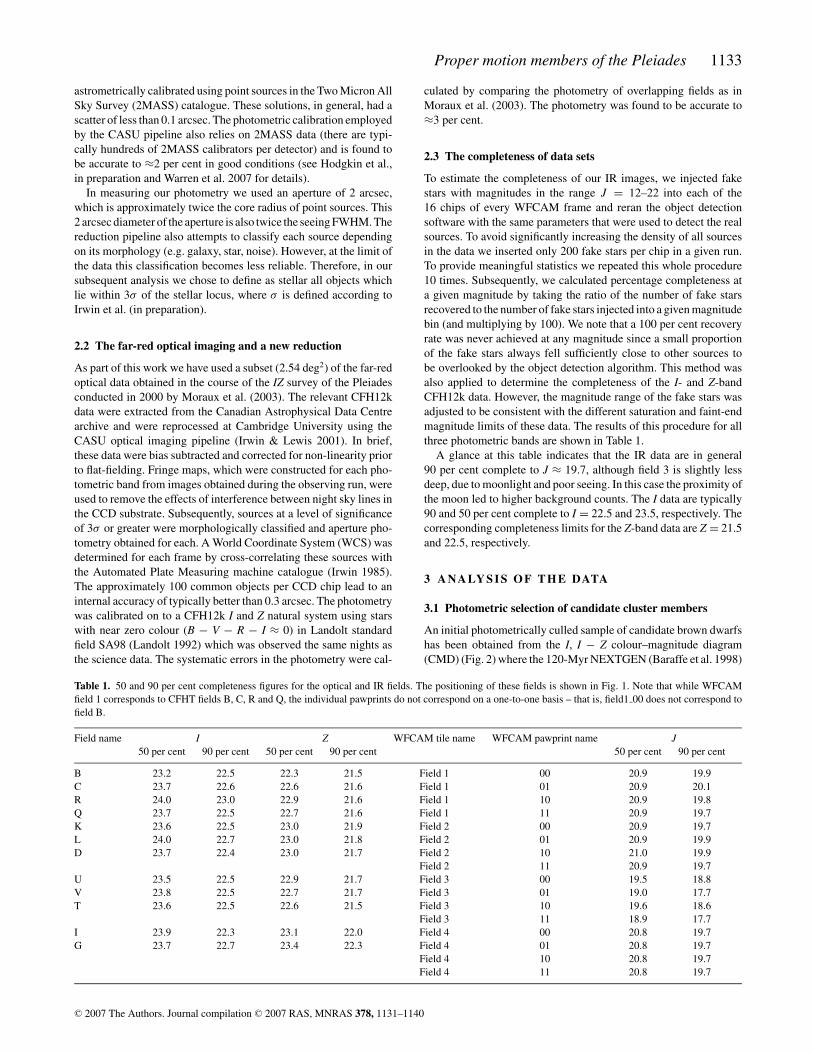
Figure 2. The I, I − Z CMD for the whole of field 1. The solid line is theNEXTGEN model, and the dotted line the DUSTY model. The small pointsare all objects that were classed as stellar in both I and Z data. The crossesare all objects that met the following selection criteria: classed as stellar inboth I and Z data, for 16.5 < I < 22.5, they must lie no more than 0.25 magto the left-hand side of the DUSTY isochrone; for I �22.5, they must lieto the right-hand side of the line, I − Z = (I − 19.0)/3.5. The filled squaresare the previously identified cluster candidate members from Bihain et al.(2006), Moraux et al. (2003) and Bouvier et al. (1998), plotted to highlightthe cluster sequence.
and DUSTY (Chabrier et al. 2000) model isochrones (modified totake into account the Pleiades distance of 134 pc, e.g. Percival,Salaris & Groenewegen 2005) served as a guide to the location ofthe Pleiades sequence. With the uncertainties in both the photometryand the age of the cluster in mind, we selected all objects classedas stellar in both the I and Z data, which in the magnitude range16.5 < I < 22.5 lay no more than 0.25 mag to the left-hand side ofthe DUSTY isochrone. All the candidate Pleiads found by Morauxet al. (2003) and Bihain et al. (2006) lay within ±0.25 mag of theDUSTY model. Thus our selection criterion is 0.25 mag to the left-hand side of the DUSTY model isochrone. Below I = 22.5, theDUSTY model is not red enough to account for known field stars,and so is inappropriate in this effective temperature regime. Wehave calculated an approximate field star sequence from Tinney,Burgasser & Kirkpatrick (2003) and Hawley et al. (2002) and low-ered it by 2 mag. This results in the line I − Z = (I − 19.0)/3.5.This selection is conservative, and is particularly aimed at remov-ing the bulk of the red tail of the background stars. Subsequently,the initial list of candidates was cross-correlated with our J-bandphotometric catalogue (using a matching radius of 2 arcsec) and arefined photometrically culled sample obtained using the Z, Z − JCMD (Fig. 3). These objects are also shown on the J, I − J CMD(Fig. 4). As before, the 120-Myr model isochrones were used as aguide to the location of the cluster sequence. With the photometricuncertainties in mind, all candidates with Z � 20 were retained. Allcandidates with 20 < Z < 21 and Z − J � 1.6 were also retained.Finally, all candidates with Z > 21 and Z − J � 1.9 were retained.These constraints are conservative and are based on the field L andT dwarfs sequence (Z − J � 3, Chiu et al. 2006) since the DUSTYmodels are known to be inappropriate in this effective temperatureregime. Since our survey is limited by the depth of the I-band data,all candidates with Z > 20 and no I-band counterpart were alsokept.
16
17
18
19
20
21
22
23
24 0 0.5 1 1.5 2 2.5 3 3.5 4
Z
Z-J
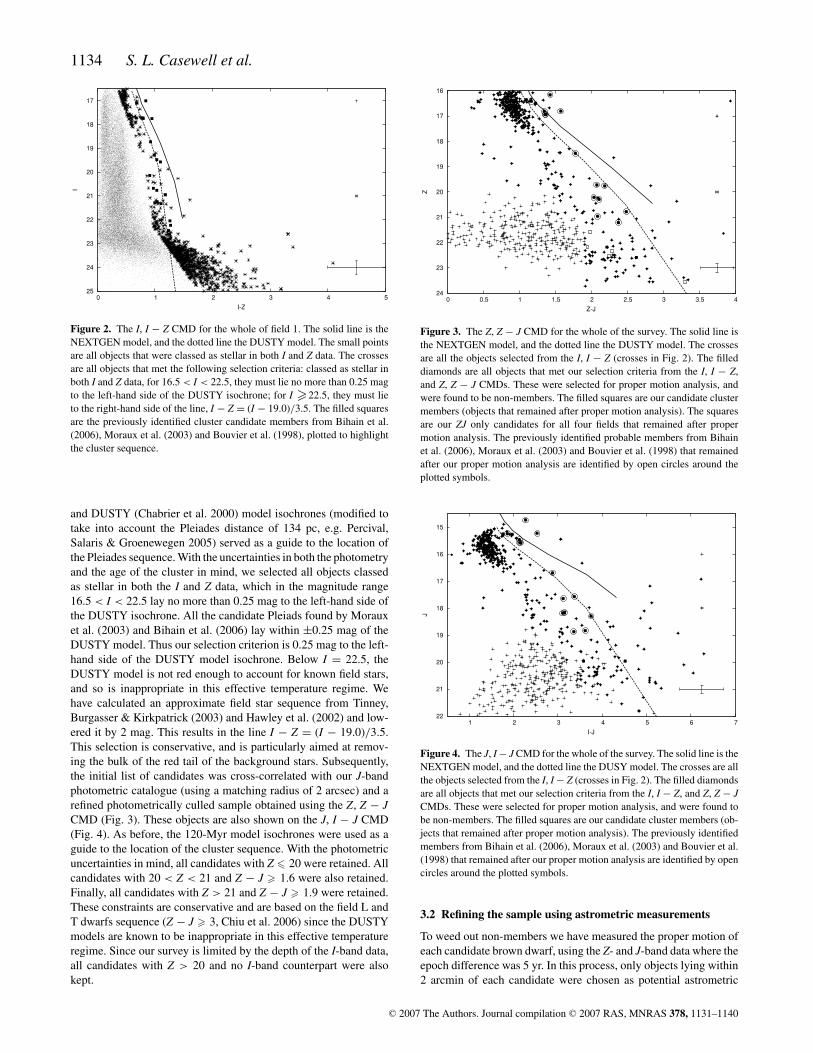
Figure 3. The Z, Z − J CMD for the whole of the survey. The solid line isthe NEXTGEN model, and the dotted line the DUSTY model. The crossesare all the objects selected from the I, I − Z (crosses in Fig. 2). The filleddiamonds are all objects that met our selection criteria from the I, I − Z,and Z, Z − J CMDs. These were selected for proper motion analysis, andwere found to be non-members. The filled squares are our candidate clustermembers (objects that remained after proper motion analysis). The squaresare our ZJ only candidates for all four fields that remained after propermotion analysis. The previously identified probable members from Bihainet al. (2006), Moraux et al. (2003) and Bouvier et al. (1998) that remainedafter our proper motion analysis are identified by open circles around theplotted symbols.
15
16
17
18
19
20
21
22 1 2 3 4 5 6 7
J
I-J
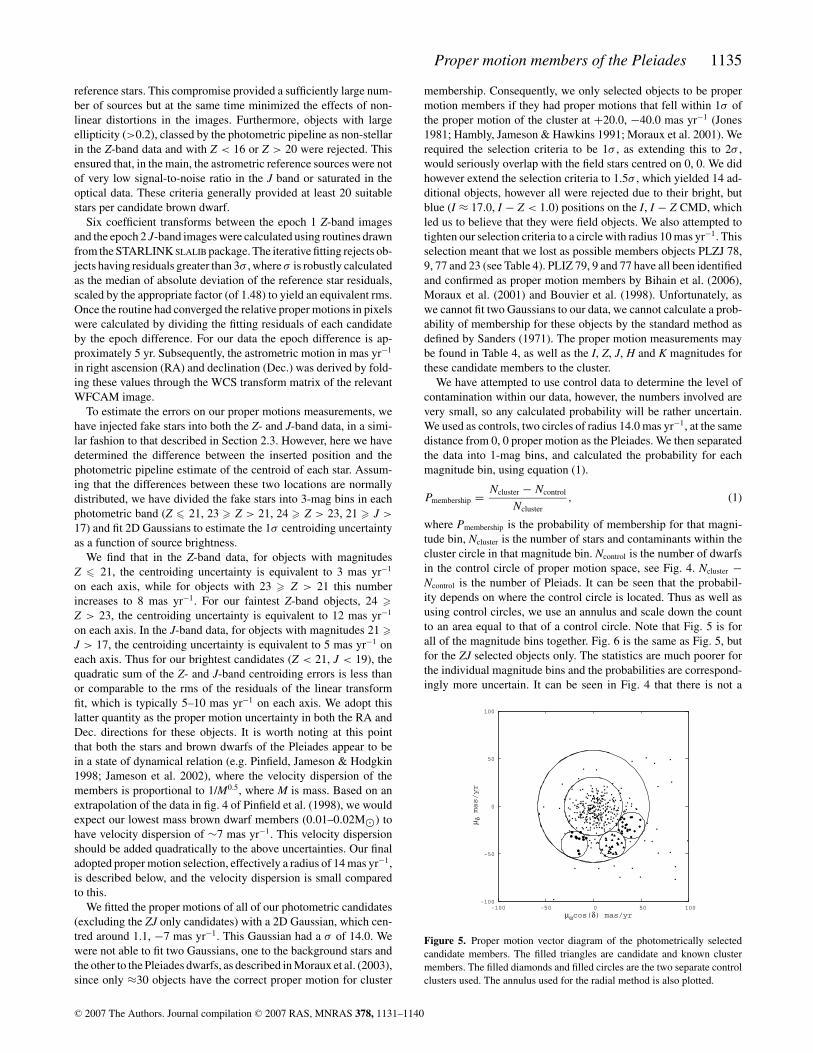
Figure 4. The J, I − J CMD for the whole of the survey. The solid line is theNEXTGEN model, and the dotted line the DUSY model. The crosses are allthe objects selected from the I, I − Z (crosses in Fig. 2). The filled diamondsare all objects that met our selection criteria from the I, I − Z, and Z, Z − JCMDs. These were selected for proper motion analysis, and were found tobe non-members. The filled squares are our candidate cluster members (ob-jects that remained after proper motion analysis). The previously identifiedmembers from Bihain et al. (2006), Moraux et al. (2003) and Bouvier et al.(1998) that remained after our proper motion analysis are identified by opencircles around the plotted symbols.
3.2 Refining the sample using astrometric measurements
To weed out non-members we have measured the proper motion ofeach candidate brown dwarf, using the Z- and J-band data where theepoch difference was 5 yr. In this process, only objects lying within2 arcmin of each candidate were chosen as potential astrometric
C© 2007 The Authors. Journal compilation C© 2007 RAS, MNRAS 378, 1131–1140
Proper motion members of the Pleiades 1135
reference stars. This compromise provided a sufficiently large num-ber of sources but at the same time minimized the effects of non-linear distortions in the images. Furthermore, objects with largeellipticity (>0.2), classed by the photometric pipeline as non-stellarin the Z-band data and with Z < 16 or Z > 20 were rejected. Thisensured that, in the main, the astrometric reference sources were notof very low signal-to-noise ratio in the J band or saturated in theoptical data. These criteria generally provided at least 20 suitablestars per candidate brown dwarf.
Six coefficient transforms between the epoch 1 Z-band imagesand the epoch 2 J-band images were calculated using routines drawnfrom the STARLINK SLALIB package. The iterative fitting rejects ob-jects having residuals greater than 3σ , where σ is robustly calculatedas the median of absolute deviation of the reference star residuals,scaled by the appropriate factor (of 1.48) to yield an equivalent rms.Once the routine had converged the relative proper motions in pixelswere calculated by dividing the fitting residuals of each candidateby the epoch difference. For our data the epoch difference is ap-proximately 5 yr. Subsequently, the astrometric motion in mas yr−1
in right ascension (RA) and declination (Dec.) was derived by fold-ing these values through the WCS transform matrix of the relevantWFCAM image.
To estimate the errors on our proper motions measurements, wehave injected fake stars into both the Z- and J-band data, in a simi-lar fashion to that described in Section 2.3. However, here we havedetermined the difference between the inserted position and thephotometric pipeline estimate of the centroid of each star. Assum-ing that the differences between these two locations are normallydistributed, we have divided the fake stars into 3-mag bins in eachphotometric band (Z � 21, 23 � Z > 21, 24 � Z > 23, 21 � J >
17) and fit 2D Gaussians to estimate the 1σ centroiding uncertaintyas a function of source brightness.
We find that in the Z-band data, for objects with magnitudesZ � 21, the centroiding uncertainty is equivalent to 3 mas yr−1
on each axis, while for objects with 23 � Z > 21 this numberincreases to 8 mas yr−1. For our faintest Z-band objects, 24 �Z > 23, the centroiding uncertainty is equivalent to 12 mas yr−1
on each axis. In the J-band data, for objects with magnitudes 21 �J > 17, the centroiding uncertainty is equivalent to 5 mas yr−1 oneach axis. Thus for our brightest candidates (Z < 21, J < 19), thequadratic sum of the Z- and J-band centroiding errors is less thanor comparable to the rms of the residuals of the linear transformfit, which is typically 5–10 mas yr−1 on each axis. We adopt thislatter quantity as the proper motion uncertainty in both the RA andDec. directions for these objects. It is worth noting at this pointthat both the stars and brown dwarfs of the Pleiades appear to bein a state of dynamical relation (e.g. Pinfield, Jameson & Hodgkin1998; Jameson et al. 2002), where the velocity dispersion of themembers is proportional to 1/M0.5, where M is mass. Based on anextrapolation of the data in fig. 4 of Pinfield et al. (1998), we wouldexpect our lowest mass brown dwarf members (0.01–0.02M�) tohave velocity dispersion of ∼7 mas yr−1. This velocity dispersionshould be added quadratically to the above uncertainties. Our finaladopted proper motion selection, effectively a radius of 14 mas yr−1,is described below, and the velocity dispersion is small comparedto this.
We fitted the proper motions of all of our photometric candidates(excluding the ZJ only candidates) with a 2D Gaussian, which cen-tred around 1.1, −7 mas yr−1. This Gaussian had a σ of 14.0. Wewere not able to fit two Gaussians, one to the background stars andthe other to the Pleiades dwarfs, as described in Moraux et al. (2003),since only ≈30 objects have the correct proper motion for cluster
membership. Consequently, we only selected objects to be propermotion members if they had proper motions that fell within 1σ ofthe proper motion of the cluster at +20.0, −40.0 mas yr−1 (Jones1981; Hambly, Jameson & Hawkins 1991; Moraux et al. 2001). Werequired the selection criteria to be 1σ , as extending this to 2σ ,would seriously overlap with the field stars centred on 0, 0. We didhowever extend the selection criteria to 1.5σ , which yielded 14 ad-ditional objects, however all were rejected due to their bright, butblue (I ≈ 17.0, I − Z < 1.0) positions on the I, I − Z CMD, whichled us to believe that they were field objects. We also attempted totighten our selection criteria to a circle with radius 10 mas yr−1. Thisselection meant that we lost as possible members objects PLZJ 78,9, 77 and 23 (see Table 4). PLIZ 79, 9 and 77 have all been identifiedand confirmed as proper motion members by Bihain et al. (2006),Moraux et al. (2001) and Bouvier et al. (1998). Unfortunately, aswe cannot fit two Gaussians to our data, we cannot calculate a prob-ability of membership for these objects by the standard method asdefined by Sanders (1971). The proper motion measurements maybe found in Table 4, as well as the I, Z, J, H and K magnitudes forthese candidate members to the cluster.
We have attempted to use control data to determine the level ofcontamination within our data, however, the numbers involved arevery small, so any calculated probability will be rather uncertain.We used as controls, two circles of radius 14.0 mas yr−1, at the samedistance from 0, 0 proper motion as the Pleiades. We then separatedthe data into 1-mag bins, and calculated the probability for eachmagnitude bin, using equation (1).
Pmembership = Ncluster − Ncontrol
Ncluster, (1)
where Pmembership is the probability of membership for that magni-tude bin, Ncluster is the number of stars and contaminants within thecluster circle in that magnitude bin. Ncontrol is the number of dwarfsin the control circle of proper motion space, see Fig. 4. Ncluster −Ncontrol is the number of Pleiads. It can be seen that the probabil-ity depends on where the control circle is located. Thus as well asusing control circles, we use an annulus and scale down the countto an area equal to that of a control circle. Note that Fig. 5 is forall of the magnitude bins together. Fig. 6 is the same as Fig. 5, butfor the ZJ selected objects only. The statistics are much poorer forthe individual magnitude bins and the probabilities are correspond-ingly more uncertain. It can be seen in Fig. 4 that there is not a
-100
-50
0
50
100
-100 -50 0 50 100
µ δ mas/yr
µαcos(δ) mas/yr
Figure 5. Proper motion vector diagram of the photometrically selectedcandidate members. The filled triangles are candidate and known clustermembers. The filled diamonds and filled circles are the two separate controlclusters used. The annulus used for the radial method is also plotted.
C© 2007 The Authors. Journal compilation C© 2007 RAS, MNRAS 378, 1131–1140
1136 S. L. Casewell et al.
-100
-50
0
50
100
-100 -50 0 50 100
µ δ mas/yr
µαcos(δ) mas/yr
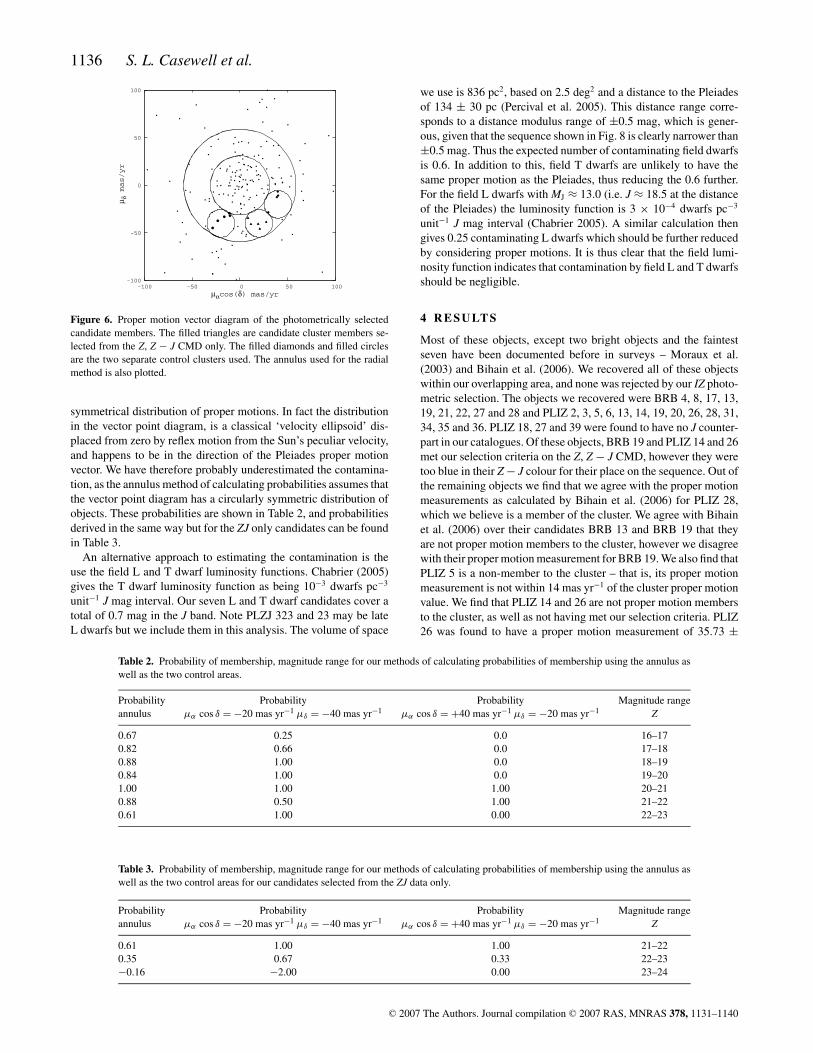
Figure 6. Proper motion vector diagram of the photometrically selectedcandidate members. The filled triangles are candidate cluster members se-lected from the Z, Z − J CMD only. The filled diamonds and filled circlesare the two separate control clusters used. The annulus used for the radialmethod is also plotted.
symmetrical distribution of proper motions. In fact the distributionin the vector point diagram, is a classical ‘velocity ellipsoid’ dis-placed from zero by reflex motion from the Sun’s peculiar velocity,and happens to be in the direction of the Pleiades proper motionvector. We have therefore probably underestimated the contamina-tion, as the annulus method of calculating probabilities assumes thatthe vector point diagram has a circularly symmetric distribution ofobjects. These probabilities are shown in Table 2, and probabilitiesderived in the same way but for the ZJ only candidates can be foundin Table 3.
An alternative approach to estimating the contamination is theuse the field L and T dwarf luminosity functions. Chabrier (2005)gives the T dwarf luminosity function as being 10−3 dwarfs pc−3
unit−1 J mag interval. Our seven L and T dwarf candidates cover atotal of 0.7 mag in the J band. Note PLZJ 323 and 23 may be lateL dwarfs but we include them in this analysis. The volume of space
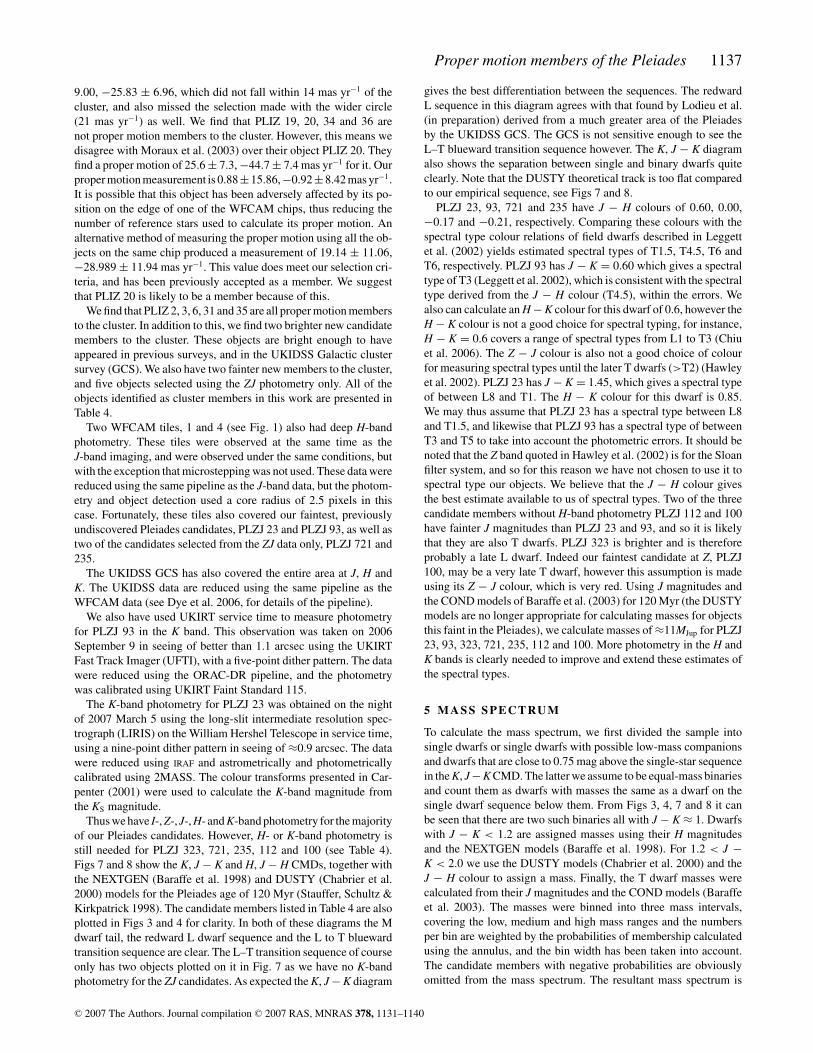
Table 2. Probability of membership, magnitude range for our methods of calculating probabilities of membership using the annulus aswell as the two control areas.
Probability Probability Probability Magnitude rangeannulus µα cos δ = −20 mas yr−1 µδ = −40 mas yr−1 µα cos δ = +40 mas yr−1 µδ = −20 mas yr−1 Z
0.67 0.25 0.0 16–170.82 0.66 0.0 17–180.88 1.00 0.0 18–190.84 1.00 0.0 19–201.00 1.00 1.00 20–210.88 0.50 1.00 21–220.61 1.00 0.00 22–23
Table 3. Probability of membership, magnitude range for our methods of calculating probabilities of membership using the annulus aswell as the two control areas for our candidates selected from the ZJ data only.
Probability Probability Probability Magnitude rangeannulus µα cos δ = −20 mas yr−1 µδ = −40 mas yr−1 µα cos δ = +40 mas yr−1 µδ = −20 mas yr−1 Z
0.61 1.00 1.00 21–220.35 0.67 0.33 22–23−0.16 −2.00 0.00 23–24
we use is 836 pc2, based on 2.5 deg2 and a distance to the Pleiadesof 134 ± 30 pc (Percival et al. 2005). This distance range corre-sponds to a distance modulus range of ±0.5 mag, which is gener-ous, given that the sequence shown in Fig. 8 is clearly narrower than±0.5 mag. Thus the expected number of contaminating field dwarfsis 0.6. In addition to this, field T dwarfs are unlikely to have thesame proper motion as the Pleiades, thus reducing the 0.6 further.For the field L dwarfs with MJ ≈ 13.0 (i.e. J ≈ 18.5 at the distanceof the Pleiades) the luminosity function is 3 × 10⁻⁴ dwarfs pc−3
unit−1 J mag interval (Chabrier 2005). A similar calculation thengives 0.25 contaminating L dwarfs which should be further reducedby considering proper motions. It is thus clear that the field lumi-nosity function indicates that contamination by field L and T dwarfsshould be negligible.
4 R E S U LT S
Most of these objects, except two bright objects and the faintestseven have been documented before in surveys – Moraux et al.(2003) and Bihain et al. (2006). We recovered all of these objectswithin our overlapping area, and none was rejected by our IZ photo-metric selection. The objects we recovered were BRB 4, 8, 17, 13,19, 21, 22, 27 and 28 and PLIZ 2, 3, 5, 6, 13, 14, 19, 20, 26, 28, 31,34, 35 and 36. PLIZ 18, 27 and 39 were found to have no J counter-part in our catalogues. Of these objects, BRB 19 and PLIZ 14 and 26met our selection criteria on the Z, Z − J CMD, however they weretoo blue in their Z − J colour for their place on the sequence. Out ofthe remaining objects we find that we agree with the proper motionmeasurements as calculated by Bihain et al. (2006) for PLIZ 28,which we believe is a member of the cluster. We agree with Bihainet al. (2006) over their candidates BRB 13 and BRB 19 that theyare not proper motion members to the cluster, however we disagreewith their proper motion measurement for BRB 19. We also find thatPLIZ 5 is a non-member to the cluster – that is, its proper motionmeasurement is not within 14 mas yr−1 of the cluster proper motionvalue. We find that PLIZ 14 and 26 are not proper motion membersto the cluster, as well as not having met our selection criteria. PLIZ26 was found to have a proper motion measurement of 35.73 ±
C© 2007 The Authors. Journal compilation C© 2007 RAS, MNRAS 378, 1131–1140
Proper motion members of the Pleiades 1137
9.00, −25.83 ± 6.96, which did not fall within 14 mas yr−1 of thecluster, and also missed the selection made with the wider circle(21 mas yr−1) as well. We find that PLIZ 19, 20, 34 and 36 arenot proper motion members to the cluster. However, this means wedisagree with Moraux et al. (2003) over their object PLIZ 20. Theyfind a proper motion of 25.6 ± 7.3, −44.7 ± 7.4 mas yr−1 for it. Ourproper motion measurement is 0.88±15.86,−0.92±8.42 mas yr−1.It is possible that this object has been adversely affected by its po-sition on the edge of one of the WFCAM chips, thus reducing thenumber of reference stars used to calculate its proper motion. Analternative method of measuring the proper motion using all the ob-jects on the same chip produced a measurement of 19.14 ± 11.06,−28.989 ± 11.94 mas yr−1. This value does meet our selection cri-teria, and has been previously accepted as a member. We suggestthat PLIZ 20 is likely to be a member because of this.
We find that PLIZ 2, 3, 6, 31 and 35 are all proper motion membersto the cluster. In addition to this, we find two brighter new candidatemembers to the cluster. These objects are bright enough to haveappeared in previous surveys, and in the UKIDSS Galactic clustersurvey (GCS). We also have two fainter new members to the cluster,and five objects selected using the ZJ photometry only. All of theobjects identified as cluster members in this work are presented inTable 4.
Two WFCAM tiles, 1 and 4 (see Fig. 1) also had deep H-bandphotometry. These tiles were observed at the same time as theJ-band imaging, and were observed under the same conditions, butwith the exception that microstepping was not used. These data werereduced using the same pipeline as the J-band data, but the photom-etry and object detection used a core radius of 2.5 pixels in thiscase. Fortunately, these tiles also covered our faintest, previouslyundiscovered Pleiades candidates, PLZJ 23 and PLZJ 93, as well astwo of the candidates selected from the ZJ data only, PLZJ 721 and235.
The UKIDSS GCS has also covered the entire area at J, H andK. The UKIDSS data are reduced using the same pipeline as theWFCAM data (see Dye et al. 2006, for details of the pipeline).
We also have used UKIRT service time to measure photometryfor PLZJ 93 in the K band. This observation was taken on 2006September 9 in seeing of better than 1.1 arcsec using the UKIRTFast Track Imager (UFTI), with a five-point dither pattern. The datawere reduced using the ORAC-DR pipeline, and the photometrywas calibrated using UKIRT Faint Standard 115.
The K-band photometry for PLZJ 23 was obtained on the nightof 2007 March 5 using the long-slit intermediate resolution spec-trograph (LIRIS) on the William Hershel Telescope in service time,using a nine-point dither pattern in seeing of ≈0.9 arcsec. The datawere reduced using IRAF and astrometrically and photometricallycalibrated using 2MASS. The colour transforms presented in Car-penter (2001) were used to calculate the K-band magnitude fromthe KS magnitude.
Thus we have I-, Z-, J-, H- and K-band photometry for the majorityof our Pleiades candidates. However, H- or K-band photometry isstill needed for PLZJ 323, 721, 235, 112 and 100 (see Table 4).Figs 7 and 8 show the K, J − K and H, J − H CMDs, together withthe NEXTGEN (Baraffe et al. 1998) and DUSTY (Chabrier et al.2000) models for the Pleiades age of 120 Myr (Stauffer, Schultz &Kirkpatrick 1998). The candidate members listed in Table 4 are alsoplotted in Figs 3 and 4 for clarity. In both of these diagrams the Mdwarf tail, the redward L dwarf sequence and the L to T bluewardtransition sequence are clear. The L–T transition sequence of courseonly has two objects plotted on it in Fig. 7 as we have no K-bandphotometry for the ZJ candidates. As expected the K, J − K diagram
gives the best differentiation between the sequences. The redwardL sequence in this diagram agrees with that found by Lodieu et al.(in preparation) derived from a much greater area of the Pleiadesby the UKIDSS GCS. The GCS is not sensitive enough to see theL–T blueward transition sequence however. The K, J − K diagramalso shows the separation between single and binary dwarfs quiteclearly. Note that the DUSTY theoretical track is too flat comparedto our empirical sequence, see Figs 7 and 8.
PLZJ 23, 93, 721 and 235 have J − H colours of 0.60, 0.00,−0.17 and −0.21, respectively. Comparing these colours with thespectral type colour relations of field dwarfs described in Leggettet al. (2002) yields estimated spectral types of T1.5, T4.5, T6 andT6, respectively. PLZJ 93 has J − K = 0.60 which gives a spectraltype of T3 (Leggett et al. 2002), which is consistent with the spectraltype derived from the J − H colour (T4.5), within the errors. Wealso can calculate an H − K colour for this dwarf of 0.6, however theH − K colour is not a good choice for spectral typing, for instance,H − K = 0.6 covers a range of spectral types from L1 to T3 (Chiuet al. 2006). The Z − J colour is also not a good choice of colourfor measuring spectral types until the later T dwarfs (>T2) (Hawleyet al. 2002). PLZJ 23 has J − K = 1.45, which gives a spectral typeof between L8 and T1. The H − K colour for this dwarf is 0.85.We may thus assume that PLZJ 23 has a spectral type between L8and T1.5, and likewise that PLZJ 93 has a spectral type of betweenT3 and T5 to take into account the photometric errors. It should benoted that the Z band quoted in Hawley et al. (2002) is for the Sloanfilter system, and so for this reason we have not chosen to use it tospectral type our objects. We believe that the J − H colour givesthe best estimate available to us of spectral types. Two of the threecandidate members without H-band photometry PLZJ 112 and 100have fainter J magnitudes than PLZJ 23 and 93, and so it is likelythat they are also T dwarfs. PLZJ 323 is brighter and is thereforeprobably a late L dwarf. Indeed our faintest candidate at Z, PLZJ100, may be a very late T dwarf, however this assumption is madeusing its Z − J colour, which is very red. Using J magnitudes andthe COND models of Baraffe et al. (2003) for 120 Myr (the DUSTYmodels are no longer appropriate for calculating masses for objectsthis faint in the Pleiades), we calculate masses of ≈11MJup for PLZJ23, 93, 323, 721, 235, 112 and 100. More photometry in the H andK bands is clearly needed to improve and extend these estimates ofthe spectral types.
5 M A S S S P E C T RU M
To calculate the mass spectrum, we first divided the sample intosingle dwarfs or single dwarfs with possible low-mass companionsand dwarfs that are close to 0.75 mag above the single-star sequencein the K, J − K CMD. The latter we assume to be equal-mass binariesand count them as dwarfs with masses the same as a dwarf on thesingle dwarf sequence below them. From Figs 3, 4, 7 and 8 it canbe seen that there are two such binaries all with J − K ≈ 1. Dwarfswith J − K < 1.2 are assigned masses using their H magnitudesand the NEXTGEN models (Baraffe et al. 1998). For 1.2 < J −K < 2.0 we use the DUSTY models (Chabrier et al. 2000) and theJ − H colour to assign a mass. Finally, the T dwarf masses werecalculated from their J magnitudes and the COND models (Baraffeet al. 2003). The masses were binned into three mass intervals,covering the low, medium and high mass ranges and the numbersper bin are weighted by the probabilities of membership calculatedusing the annulus, and the bin width has been taken into account.The candidate members with negative probabilities are obviouslyomitted from the mass spectrum. The resultant mass spectrum is
C© 2007 The Authors. Journal compilation C© 2007 RAS, MNRAS 378, 1131–1140
1138 S. L. Casewell et al.
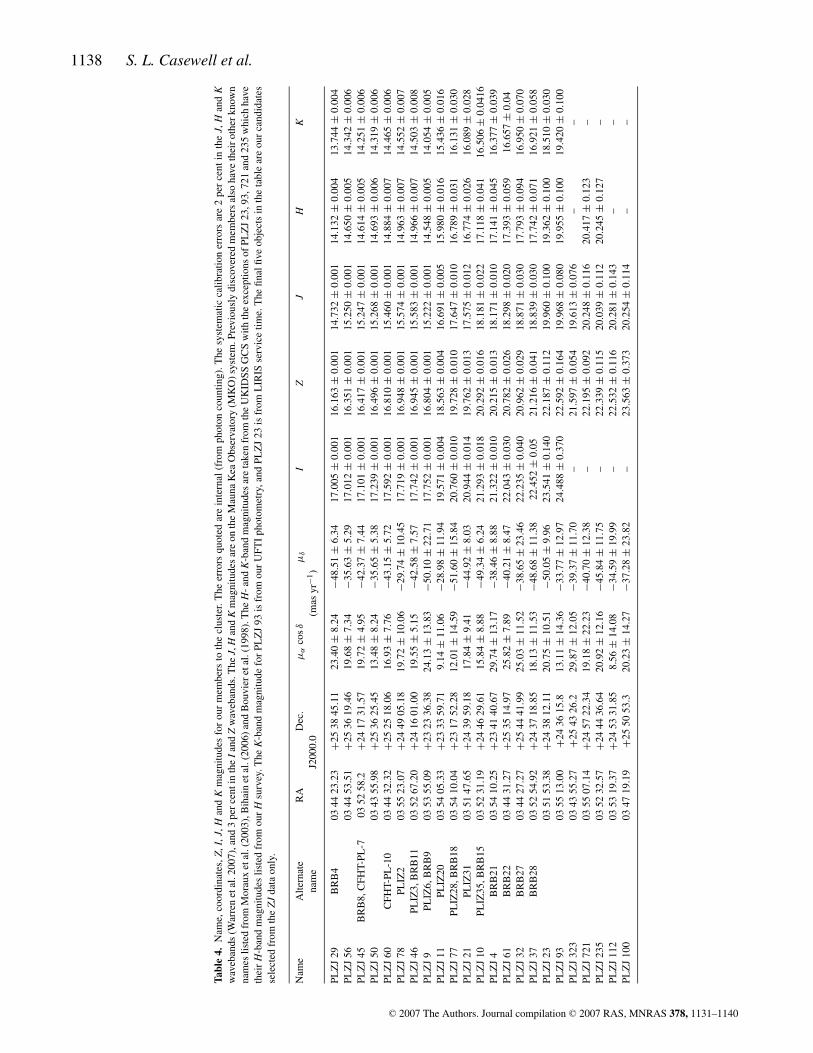
Tabl
e4.
Nam
e,co
ordi
nate
s,Z
,I,J
,Han
dK
mag
nitu
des
for
our
mem
bers
toth
ecl
uste
r.T
heer
rors
quot
edar
ein
tern
al(f
rom
phot
onco
untin
g).T
hesy
stem
atic
calib
ratio
ner
rors
are
2pe
rce
ntin
the
J,H
and
Kw
aveb
ands
(War
ren
etal
.200
7),a
nd3
per
cent
inth
eI
and
Zw
aveb
ands
.The
J,H
and
Km
agni
tude
sar
eon
the
Mau
naK
eaO
bser
vato
ry(M
KO
)sy
stem
.Pre
viou
sly
disc
over
edm
embe
rsal
soha
veth
eir
othe
rkn
own
nam
eslis
ted
from
Mor
aux
etal
.(20
03),
Bih
ain
etal
.(20
06)
and
Bou
vier
etal
.(19
98).
The
H-
and
K-b
and
mag
nitu
des
are
take
nfr
omth
eU
KID
SSG
CS
with
the
exce
ptio
nsof
PLZ
J23
,93,
721
and
235
whi
chha
veth
eir
H-b
and
mag
nitu
des
liste
dfr
omou
rH
surv
ey.T
heK
-ban
dm
agni
tude
for
PLZ
J93
isfr
omou
rU
FTI
phot
omet
ry,a
ndPL
ZJ
23is
from
LIR
ISse
rvic
etim
e.T
hefin
alfiv
eob
ject
sin
the
tabl
ear
eou
rca
ndid
ates
sele
cted
from
the
ZJ
data
only
.
Nam
eA
ltern
ate
RA
Dec
.µ
αco
sδµ
δI
ZJ
HK
nam
eJ2
000.
0(m
asyr
−1)
PLZ
J29
BR
B4
0344
23.2
3+2
538
45.1
123
.40
±8.
24−4
8.51
±6.
3417
.005
±0.
001
16.1
63±
0.00
114
.732
±0.
001
14.1
32±
0.00
413
.744
±0.
004
PLZ
J56
0344
53.5
1+2
536
19.4
619
.68
±7.
34−3
5.63
±5.
2917
.012
±0.
001
16.3
51±
0.00
115
.250
±0.
001
14.6
50±
0.00
514
.342
±0.
006
PLZ
J45
BR
B8,
CFH
T-PL
-703
5258
.2+2
417
31.5
719
.72
±4.
95−4
2.37
±7.
4417
.101
±0.
001
16.4
17±
0.00
115
.247
±0.
001
14.6
14±
0.00
514
.251
±0.
006
PLZ
J50
0343
55.9
8+2
536
25.4
513
.48
±8.
24−3
5.65
±5.
3817
.239
±0.
001
16.4
96±
0.00
115
.268
±0.
001
14.6
93±
0.00
614
.319
±0.
006
PLZ
J60
CFH
T-PL
-10
0344
32.3
2+2
525
18.0
616
.93
±7.
76−4
3.15
±5.
7217
.592
±0.
001
16.8
10±
0.00
115
.460
±0.
001
14.8
84±
0.00
714
.465
±0.
006
PLZ
J78
PLIZ
203
5523
.07
+24
4905
.18
19.7
2±
10.0
6−2
9.74
±10
.45
17.7
19±
0.00
116
.948
±0.
001
15.5
74±
0.00
114
.963
±0.
007
14.5
52±
0.00
7PL
ZJ
46PL
IZ3,
BR
B11
0352
67.2
0+2
416
01.0
019
.55
±5.
15−4
2.58
±7.
5717
.742
±0.
001
16.9
45±
0.00
115
.583
±0.
001
14.9
66±
0.00
714
.503
±0.
008
PLZ
J9
PLIZ
6,B
RB
903
5355
.09
+23
2336
.38
24.1
3±
13.8
3−5
0.10
±22
.71
17.7
52±
0.00
116
.804
±0.
001
15.2
22±
0.00
114
.548
±0.
005
14.0
54±
0.00
5PL
ZJ
11PL
IZ20
0354
05.3
3+2
333
59.7
19.
14±
11.0
6−2
8.98
±11
.94
19.5
71±
0.00
418
.563
±0.
004
16.6
91±
0.00
515
.980
±0.
016
15.4
36±
0.01
6PL
ZJ
77PL
IZ28
,BR
B18
0354
10.0
4+2
317
52.2
812
.01
±14
.59
−51.
60±
15.8
420
.760
±0.
010
19.7
28±
0.01
017
.647
±0.
010
16.7
89±
0.03
116
.131
±0.
030
PLZ
J21
PLIZ
3103
5147
.65
+24
3959
.18
17.8
4±
9.41
−44.
92±
8.03
20.9
44±
0.01
419
.762
±0.
013
17.5
75±
0.01
216
.774
±0.
026
16.0
89±
0.02
8PL
ZJ
10PL
IZ35
,BR
B15
0352
31.1
9+2
446
29.6
115
.84
±8.
88−4
9.34
±6.
2421
.293
±0.
018
20.2
92±
0.01
618
.181
±0.
022
17.1
18±
0.04
116
.506
±0.
0416
PLZ
J4
BR
B21
0354
10.2
5+2
341
40.6
729
.74
±13
.17
−38.
46±
8.88
21.3
22±
0.01
020
.215
±0.
013
18.1
71±
0.01
017
.141
±0.
045
16.3
77±
0.03
9PL
ZJ
61B
RB
2203
4431
.27
+25
3514
.97
25.8
2±
7.89
−40.
21±
8.47
22.0
43±
0.03
020
.782
±0.
026
18.2
98±
0.02
017
.393
±0.
059
16.6
57±
0.04
PLZ
J32
BR
B27
0344
27.2
7+2
544
41.9
925
.03
±11
.52
−38.
65±
23.4
622
.235
±0.
040
20.9
62±
0.02
918
.871
±0.
030
17.7
93±
0.09
416
.950
±0.
070
PLZ
J37
BR
B28
0352
54.9
2+2
437
18.8
518
.13
±11
.53
−48.
68±
11.3
822
.452
±0.
0521
.216
±0.
041
18.8
39±
0.03
017
.742
±0.
071
16.9
21±
0.05
8PL
ZJ
2303
5153
.38
+24
3812
.11
20.7
5±
10.5
1−5
0.05
±9.
9623
.541
±0.
140
22.1
87±
0.11
219
.960
±0.
100
19.3
62±
0.10
018
.510
±0.
030
PLZ
J93
0355
13.0
0+2
436
15.8
13.1
1±
14.3
6−3
3.77
±12
.97
24.4
88±
0.37
022
.592
±0.
164
19.9
68±
0.08
019
.955
±0.
100
19.4
20±
0.10
0PL
ZJ
323
0343
55.2
7+2
543
26.2
29.8
7±
12.0
5−3
9.37
±11
.70
–21
.597
±0.
054
19.6
13±
0.07
6–
–PL
ZJ
721
0355
07.1
4+2
457
22.3
419
.18
±22
.23
−40.
70±
12.3
8–
22.1
95±
0.09
220
.248
±0.
116
20.4
17±
0.12
3–
PLZ
J23
503
5232
.57
+24
4436
.64
20.9
2±
12.1
6−4
5.84
±11
.75
–22
.339
±0.
115
20.0
39±
0.11
220
.245
±0.
127
–PL
ZJ
112
0353
19.3
7+2
453
31.8
58.
56±
14.0
8−3
4.59
±19
.99
–22
.532
±0.
116
20.2
81±
0.14
3–
–PL
ZJ
100
0347
19.1
9+2
550
53.3
20.2
3±
14.2
7−3
7.28
±23
.82
–23
.563
±0.
373
20.2
54±
0.11
4–
–
C© 2007 The Authors. Journal compilation C© 2007 RAS, MNRAS 378, 1131–1140
Proper motion members of the Pleiades 1139
13
14
15
16
17
18
19
20 0.4 0.6 0.8 1 1.2 1.4 1.6 1.8 2
K
J-K
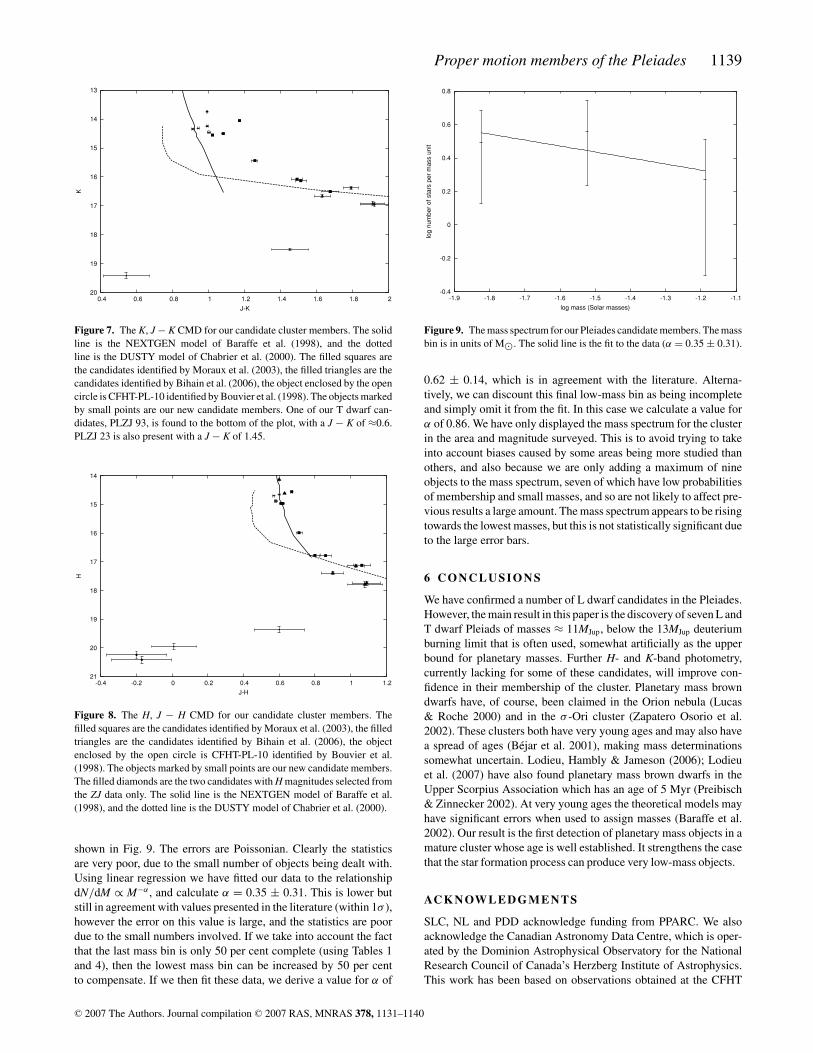
Figure 7. The K, J − K CMD for our candidate cluster members. The solidline is the NEXTGEN model of Baraffe et al. (1998), and the dottedline is the DUSTY model of Chabrier et al. (2000). The filled squares arethe candidates identified by Moraux et al. (2003), the filled triangles are thecandidates identified by Bihain et al. (2006), the object enclosed by the opencircle is CFHT-PL-10 identified by Bouvier et al. (1998). The objects markedby small points are our new candidate members. One of our T dwarf can-didates, PLZJ 93, is found to the bottom of the plot, with a J − K of ≈0.6.PLZJ 23 is also present with a J − K of 1.45.
14
15
16
17
18
19
20
21-0.4 -0.2 0 0.2 0.4 0.6 0.8 1 1.2
H
J-H
Figure 8. The H, J − H CMD for our candidate cluster members. Thefilled squares are the candidates identified by Moraux et al. (2003), the filledtriangles are the candidates identified by Bihain et al. (2006), the objectenclosed by the open circle is CFHT-PL-10 identified by Bouvier et al.(1998). The objects marked by small points are our new candidate members.The filled diamonds are the two candidates with H magnitudes selected fromthe ZJ data only. The solid line is the NEXTGEN model of Baraffe et al.(1998), and the dotted line is the DUSTY model of Chabrier et al. (2000).
shown in Fig. 9. The errors are Poissonian. Clearly the statisticsare very poor, due to the small number of objects being dealt with.Using linear regression we have fitted our data to the relationshipdN/dM ∝ M−α , and calculate α = 0.35 ± 0.31. This is lower butstill in agreement with values presented in the literature (within 1σ ),however the error on this value is large, and the statistics are poordue to the small numbers involved. If we take into account the factthat the last mass bin is only 50 per cent complete (using Tables 1and 4), then the lowest mass bin can be increased by 50 per centto compensate. If we then fit these data, we derive a value for α of
-0.4
-0.2
0
0.2
0.4
0.6
0.8
-1.9 -1.8 -1.7 -1.6 -1.5 -1.4 -1.3 -1.2 -1.1
log
num
ber
of s
tars
per
mas
s un
it
log mass (Solar masses)
Figure 9. The mass spectrum for our Pleiades candidate members. The massbin is in units of M�. The solid line is the fit to the data (α = 0.35 ± 0.31).
0.62 ± 0.14, which is in agreement with the literature. Alterna-tively, we can discount this final low-mass bin as being incompleteand simply omit it from the fit. In this case we calculate a value forα of 0.86. We have only displayed the mass spectrum for the clusterin the area and magnitude surveyed. This is to avoid trying to takeinto account biases caused by some areas being more studied thanothers, and also because we are only adding a maximum of nineobjects to the mass spectrum, seven of which have low probabilitiesof membership and small masses, and so are not likely to affect pre-vious results a large amount. The mass spectrum appears to be risingtowards the lowest masses, but this is not statistically significant dueto the large error bars.
6 C O N C L U S I O N S
We have confirmed a number of L dwarf candidates in the Pleiades.However, the main result in this paper is the discovery of seven L andT dwarf Pleiads of masses ≈ 11MJup, below the 13MJup deuteriumburning limit that is often used, somewhat artificially as the upperbound for planetary masses. Further H- and K-band photometry,currently lacking for some of these candidates, will improve con-fidence in their membership of the cluster. Planetary mass browndwarfs have, of course, been claimed in the Orion nebula (Lucas& Roche 2000) and in the σ -Ori cluster (Zapatero Osorio et al.2002). These clusters both have very young ages and may also havea spread of ages (Bejar et al. 2001), making mass determinationssomewhat uncertain. Lodieu, Hambly & Jameson (2006); Lodieuet al. (2007) have also found planetary mass brown dwarfs in theUpper Scorpius Association which has an age of 5 Myr (Preibisch& Zinnecker 2002). At very young ages the theoretical models mayhave significant errors when used to assign masses (Baraffe et al.2002). Our result is the first detection of planetary mass objects in amature cluster whose age is well established. It strengthens the casethat the star formation process can produce very low-mass objects.
AC K N OW L E D G M E N T S
SLC, NL and PDD acknowledge funding from PPARC. We alsoacknowledge the Canadian Astronomy Data Centre, which is oper-ated by the Dominion Astrophysical Observatory for the NationalResearch Council of Canada’s Herzberg Institute of Astrophysics.This work has been based on observations obtained at the CFHT
C© 2007 The Authors. Journal compilation C© 2007 RAS, MNRAS 378, 1131–1140
1140 S. L. Casewell et al.
which is operated by the National Research Council of Canada, theInstitut National des Sciences de l’Univers of the Centre National dela Recherche Scientifique of France and the University of Hawaii.Observations were also made at the United Kingdom Infrared Tele-scope, which is operated by the Joint Astronomy Centre on behalf ofthe UK Particle Physics and Astronomy Research Council. This pub-lication makes use of data products from the 2MASS, which is a jointproject of the University of Massachusetts and the Infrared Process-ing and Analysis Center/California Institute of Technology, fundedby the National Aeronautics and Space Administration and the Na-tional Science Foundation. This research has made use of NASA’sAstrophysics Data System Bibliographic Services, the WHT ser-vice programme and the UKIRT service programme. We would liketo thank the referee V. J. S. Bejar for his comments which haveimproved the paper.
R E F E R E N C E S
Adams F. C., Fatuzzo M., 1996, ApJ, 464, 256Baraffe I., Chabrier G., Allard F., Hauschildt P. H., 1998, A&A, 332, 403Baraffe I., Chabrier G., Allard F., Hauschildt P. H., 2002, A&A, 382, 563Baraffe I., Chabrier G., Barman T. S., Allard F., Hauschildt P. H., 2003,
A&A, 402, 701Bate M. R., 2004, Ap&SS, 292, 297Bejar V. J. S. et al., 2001, ApJ, 556, 830Bihain G., Rebolo R., Bejar V. J. S., Caballero J. A., Bailer-Jones C. A. L.,
Mundt R., Acosta-Pulido J. A., Manchado Torres A., 2006, A&A, 458,805
Boss A. P., 2001, ApJ, 551, L167Bouvier J., Stauffer J. R., Martın E. L., Barrado y Navascues D., Wallace B.,
Bejar V. J. S., 1998, A&A, 336, 490Burgasser A. J., Kirkpatrick J. D., McGovern M. R., McLean I. S., Prato L.,
Reid I. N., 2004, ApJ, 604, 827Carpenter J. M., 2001, AJ, 121, 2851Chabrier G., 2005, in Corbelli E., Palla F., Zinnecker H., eds, ASSL
Vol. 327, The Initial Mass function 50 Years Later, Springer, DordrechtChabrier G., Baraffe I., Allard F., Hauschildt P. H., 2000, ApJ, 542, 464Chiu K., Fan X., Leggett S. K., Golimowski D. A., Zheng W., Geballe T. R.,
Schneider D. P., Brinkmann J., 2006, AJ, 131, 2722Close L. M. et al., 2005, Nat, 433, 286Dobbie P. D., Kenyon F., Jameson R. F., Hodgkin S. T., Pinfield D. J., Osborne
S. L., 2002, MNRAS, 335, 687Dye S. et al., 2006, MNRAS, 372, 1227Goodwin S. P., Whitworth A. P., Ward-Thompson D., 2004, A&A, 414, 633
Hambly N. C., Jameson R. F., Hawkins M. R. S., 1991, MNRAS, 253, 1Hawley S. L. et al., 2002, AJ, 123, 3049Hillenbrand L. A., White R. J., 2004, ApJ, 604, 741Irwin M. J., 1985, MNRAS, 214, 575Irwin M. J., Lewis J., 2001, New Astron. Rev., 45, 105Jameson R. F., Dobbie P. D., Hodgkin S. T., Pinfield D. J., 2002, MNRAS,
335, 853Janson M., Brandner W., Lenzen R., Close L., Nielsen E., Hartung M.,
Hening T., Bouy H., 2007, A&A, 462, 615Jones B. F., 1981, AJ, 86, 290Landolt A. U. et al., 1992, AJ, 104, 340Leggett S. K. et al., 2002, ApJ, 564, 452Lodieu N., Hambly N. C., Jameson R. F., 2006, MNRAS, 373, 95Lodieu N., Hambly N. C., Jameson R. F., Hodgkin S. T., Carraro G., Kendall
T. R., 2007, MNRAS, 374, 372Low C., Lynden-Bell D., 1976, MNRAS, 176, 367Lucas P. W., Roche P. F., 2000, MNRAS, 314, 654Luhman K. L., Stauffer J. R., Mamajek E. E., 2005, ApJ, 628, 69LMoraux E., Bouvier J., Stauffer J. R., 2001, A&A, 367, 211Moraux E., Bouvier J., Stauffer J. R., Cullindre J.-C., 2003, A&A, 400, 891Muench A. A., Lada E. A., Lada C. J., Alves J., 2002, ApJ, 573, 366Muench A. A. et al., 2003, AJ, 125, 2029Padoan P., Nordlund Å., 2002, ApJ, 576, 870Percival S. M., Salaris M., Groenewegen M. A. T., 2005, A&A, 429, 887Pinfield D. J., Jameson R. F., Hodgkin S. T., 1998, MNRAS, 299, 955Pinfield D. J., Hodgkin S. T., Jameson R. F., Cossburn M. R., Hambly N. C.,
Devereux N., 2000, MNRAS, 313, 347Preibisch T., Zinnecker H., 2002, AJ, 123, 1613Sanders W. L., 1971, A&A, 14, 226Stassun K. G., Mathieu R. D., Valenti J. A., 2006, Nat, 440, 311Stauffer J. R., Schultz G., Kirkpatrick J. D., 1998, ApJ, 499, 199LTinney C. G., Burgasser A. J., Kirkpatrick J. D., 2003, AJ, 126, 975Warren S. J. et al., 2007, MNRAS, 375, 213Whitworth A. P., Goodwin S. P., 2005, Astron. Nachr., 326, 899Zapatero Osorio M. R., Rebolo R., Martın E. L., Basri G., Magazzu A.,
Hodgkin S. T., Cossburn M. R., Jameson R. F., 1998, in Donahue, R.A., Bookbinder J. A., eds, ASP Conf. Ser. Vol. 154, Cool Stars, StellarSystems, and the Sun. Astron. Soc. Pac., San Francisco, p. 1912
Zapatero Osorio M. R., Bejar V. J. S., Martın E. L., Rebolo R., Barrado yNavascues D., Mundt R., Eisloffel J., Caballero J. A., 2002, ApJ, 578,536
Zapatero Osorio M. R., Lane B. F., Pavlenko Y., Martın E. L., Britton M.,Kulkarni S. R., 2004, ApJ, 615, 2004
This paper has been typeset from a TEX/LATEX file prepared by the author.
C© 2007 The Authors. Journal compilation C© 2007 RAS, MNRAS 378, 1131–1140