Embed Size (px)
Citation preview

Prof. Karl G. Hofbauer
Chair for Applied Pharmacology
Biozentrum / PharmazentrumUniversity of Basel
Zürich, 25.09.2007
Proof of Concept

The „Message in a Bottle“- Approach to Drug Discovery
New compound
Medicinal chemistry
Broad screening

New compound
Medicinal chemistry
Broad screening
The „Message in a Bottle“- Approach to Drug Discovery
Indication
New compound
Broad screening
Selection Criteria for a Development Compound
Pharmacodynamicse.g. Efficacy, selectivity
Physicochemical propertiese.g. Solubility, molecular size
Pharmacokineticse.g. Bioavailability, half-life
Tolerabilitye.g. Toxicity, mutagenicity
Technical feasibilitye.g. Patentability, manufacturing costs
Marketing aspectse.g. Treatment costs, medical need
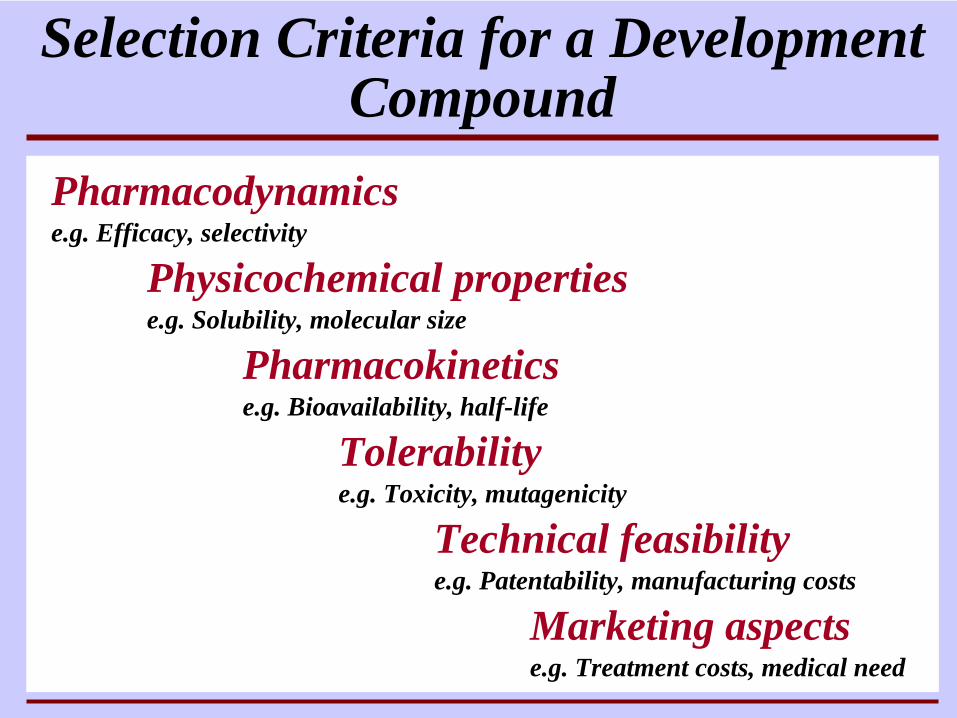
Productivity - Expenditure (US Data)R
esea
rch
Exp
endi
ure
(US
$)
New
Reg
istr
atio
ns(N
CE
s)
1985 1990 1995 2000
approx. 60 NCEs*)
approx. 40 NCEsapprox. 7 billion US $
> 40 billion US $
*) NCE, new chemical entity
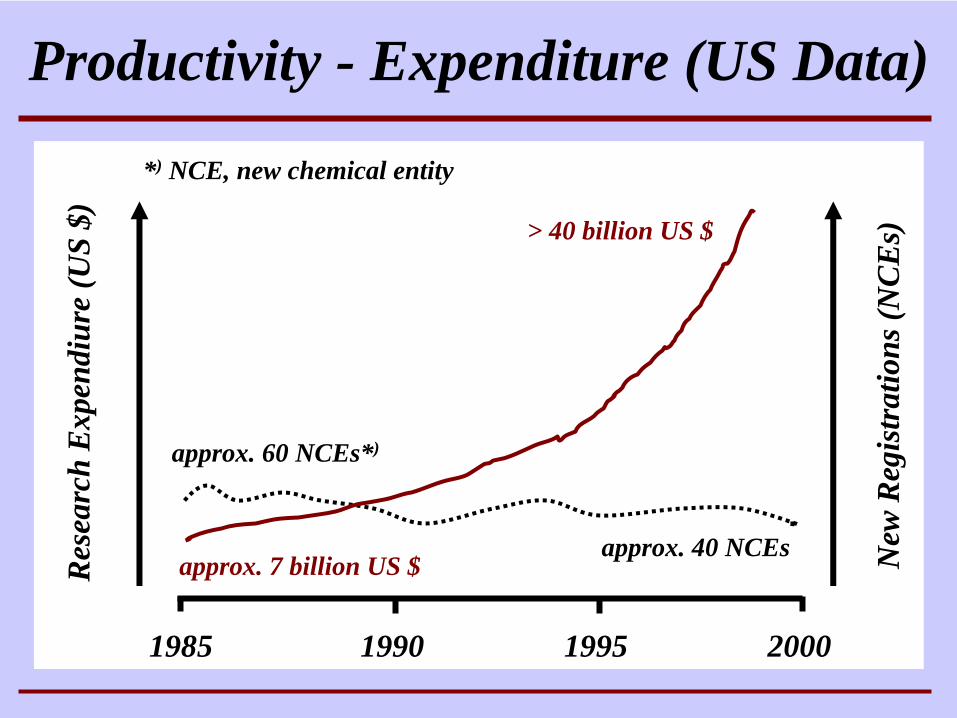
From “Preclinical Research“ to “Drug Discovery“
Preclinical ResearchIdeas
Concepts
Drug DiscoveryTargets
Processes
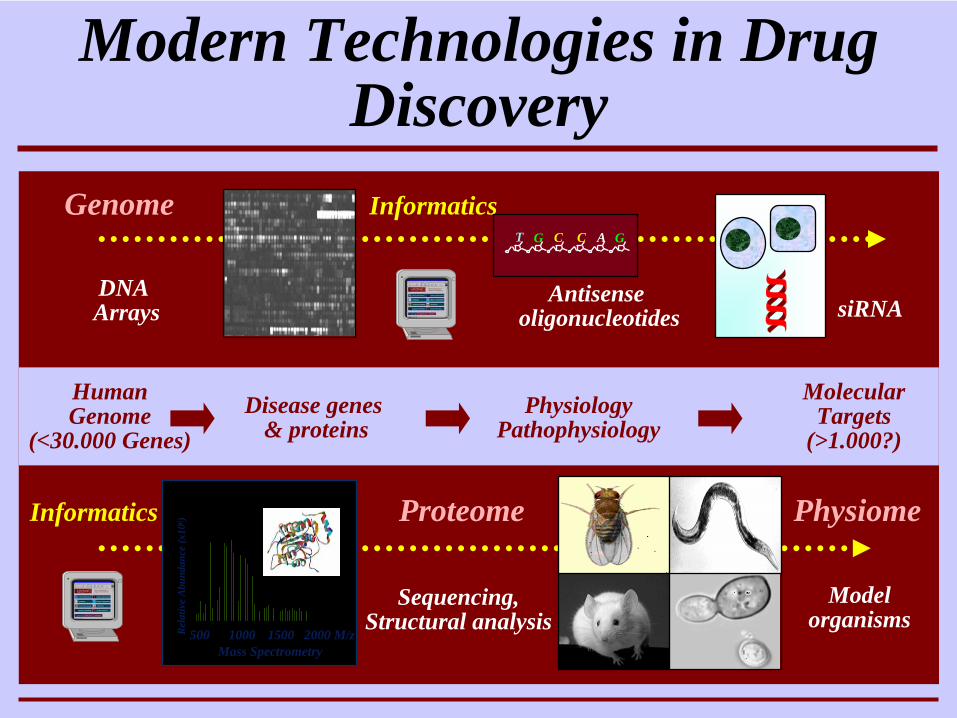
Modern Technologies in Drug Discovery
Disease genes & proteins
PhysiologyPathophysiology
Molecular Targets
(>1.000?)
DNA Arrays
Proteome
Antisenseoligonucleotides
Modelorganisms
HumanGenome
(<30.000 Genes)
InformaticsGACCGT
Informatics
500 1000 1500 2000 M/zRel
ativ
e A
bund
ance
(x10
6 )
Mass Spectrometry
Genome
Physiome
Sequencing,Structural analysis
siRNA
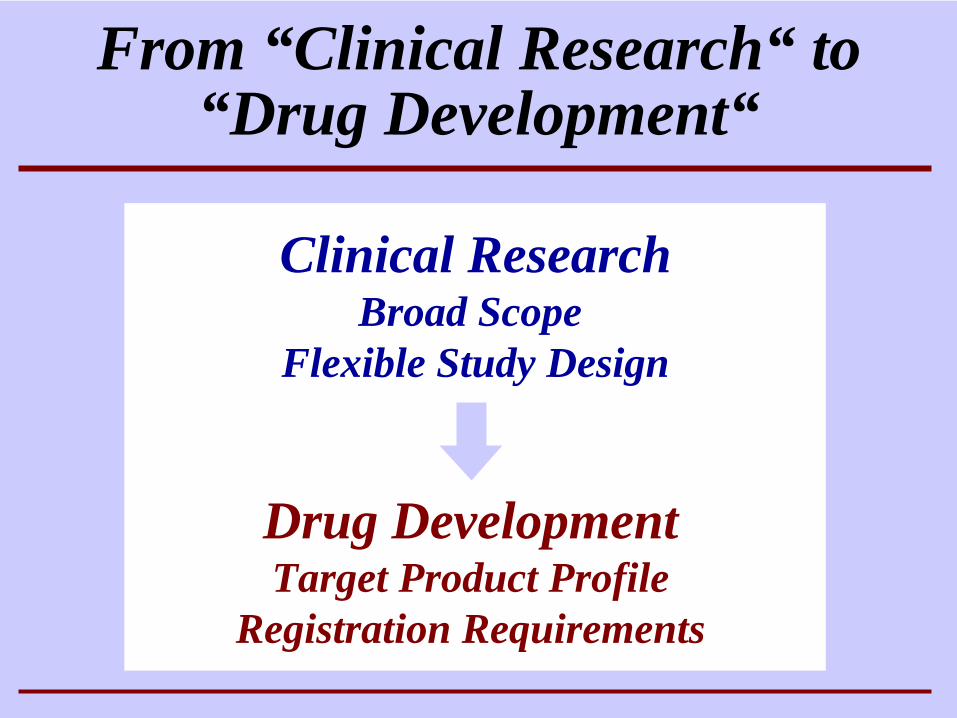
From “Clinical Research“ to “Drug Development“
Clinical ResearchBroad Scope
Flexible Study Design
Drug DevelopmentTarget Product Profile
Registration Requirements
Pre-clinical
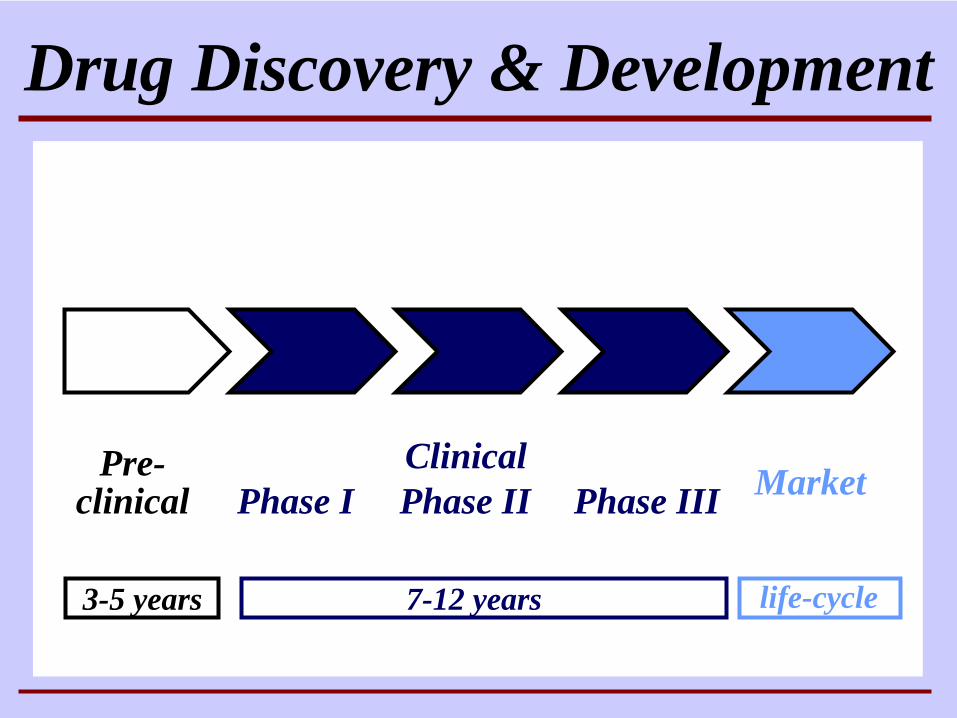
Drug Discovery & Development
Phase I Phase II Phase III Market
3-5 years 7-12 years life-cycle
Clinical
D0 D1 D2 D3
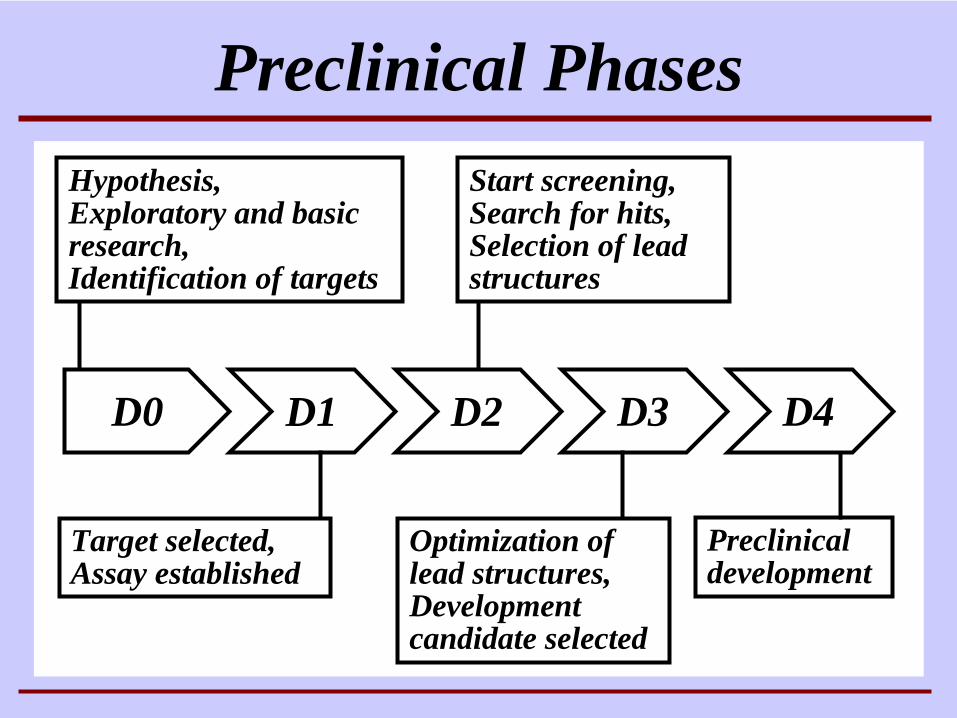
Target selected,Assay established
Start screening,Search for hits, Selection of lead structures
Optimization of lead structures, Development candidate selected
Hypothesis,Exploratory and basicresearch,Identification of targets
Preclinical Phases
D4
Preclinical development
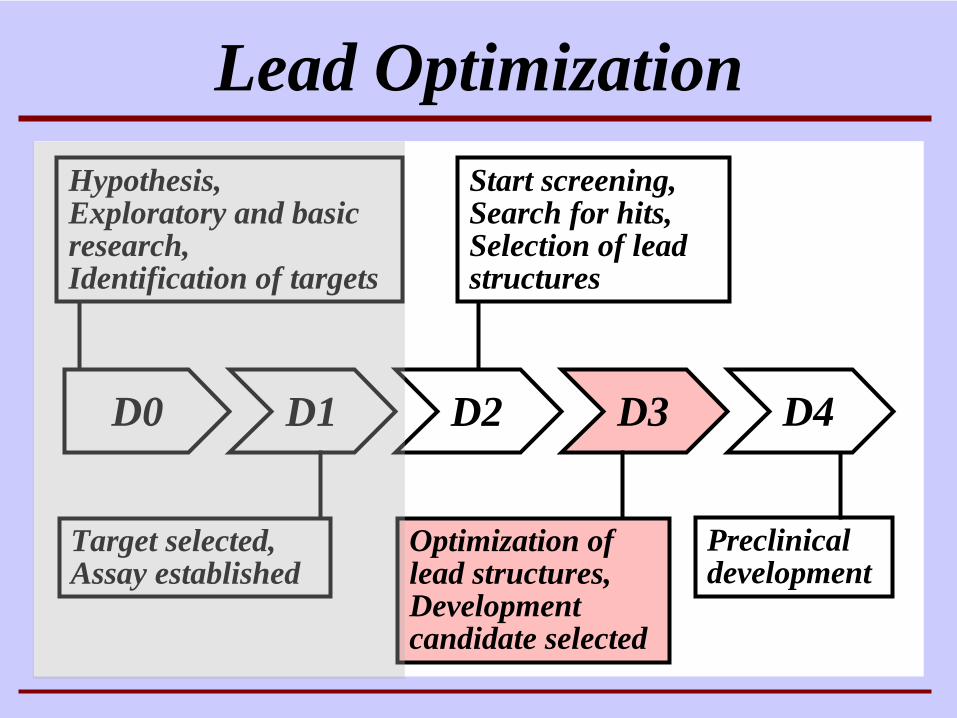
D0 D1 D2 D3
Start screening,Search for hits, Selection of lead structures
Optimization of lead structures, Development candidate selected
Lead Optimization
D4
Preclinical development
Hypothesis,Exploratory and basicresearch,Identification of targets
Target selected,Assay established
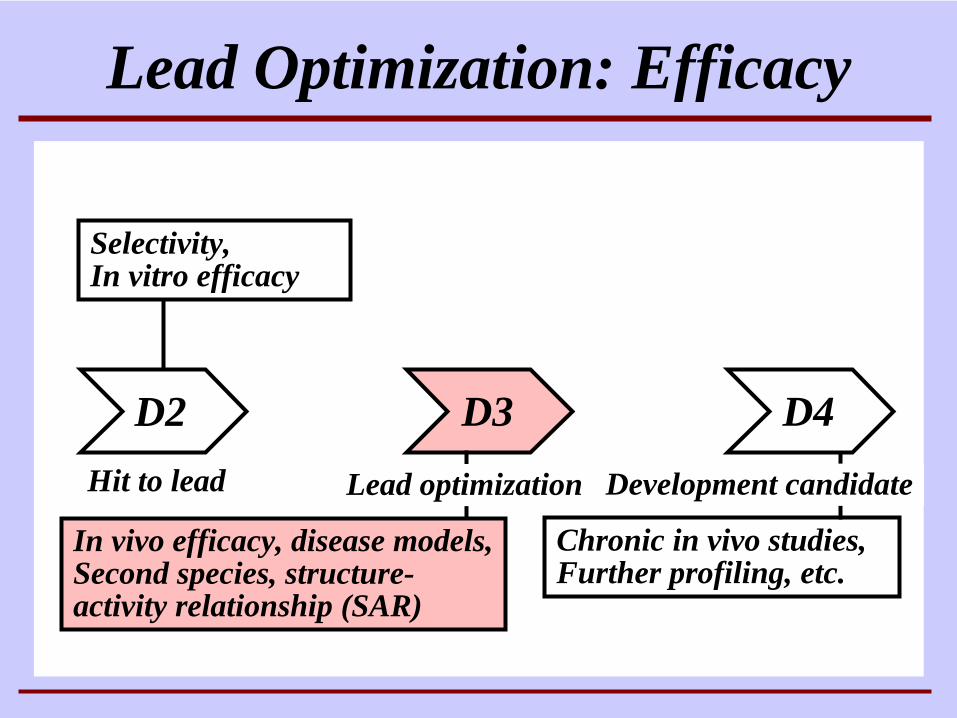
D2 D3
Selectivity,In vitro efficacy
In vivo efficacy, disease models,Second species, structure- activity relationship (SAR)
Lead Optimization: Efficacy
D4
Chronic in vivo studies, Further profiling, etc.
Hit to lead Lead optimization Development candidate
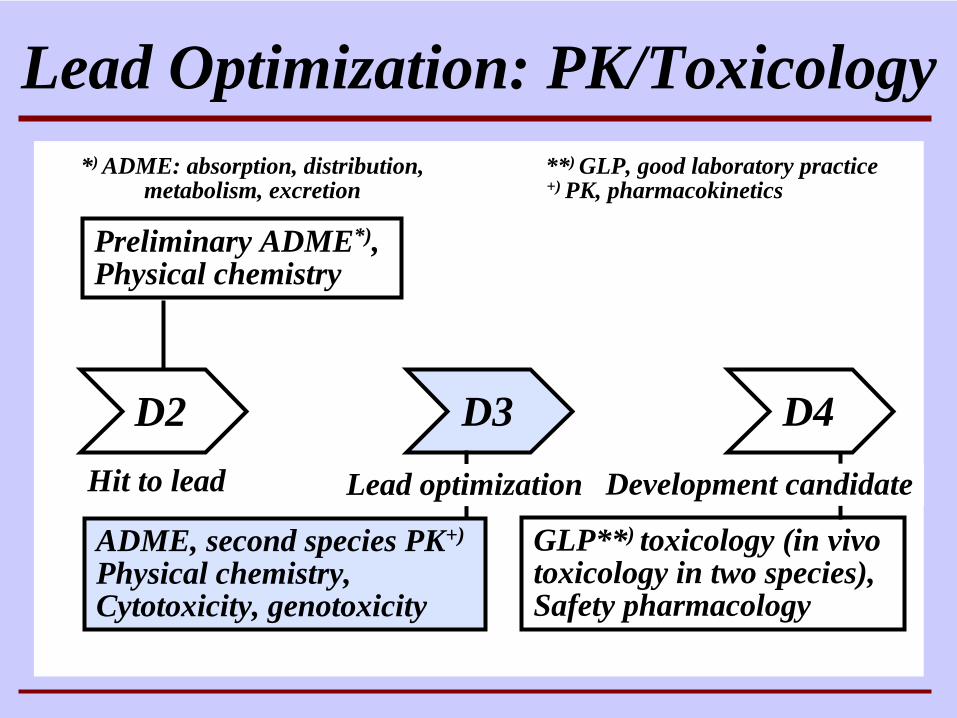
D2 D3
Preliminary ADME*),Physical chemistry
ADME, second species PK+)
Physical chemistry,Cytotoxicity, genotoxicity
Lead Optimization: PK/Toxicology
D4
GLP**) toxicology (in vivo toxicology in two species),Safety pharmacology
*) ADME: absorption, distribution, metabolism, excretion
Hit to lead Lead optimization Development candidate
**) GLP, good laboratory practice+) PK, pharmacokinetics
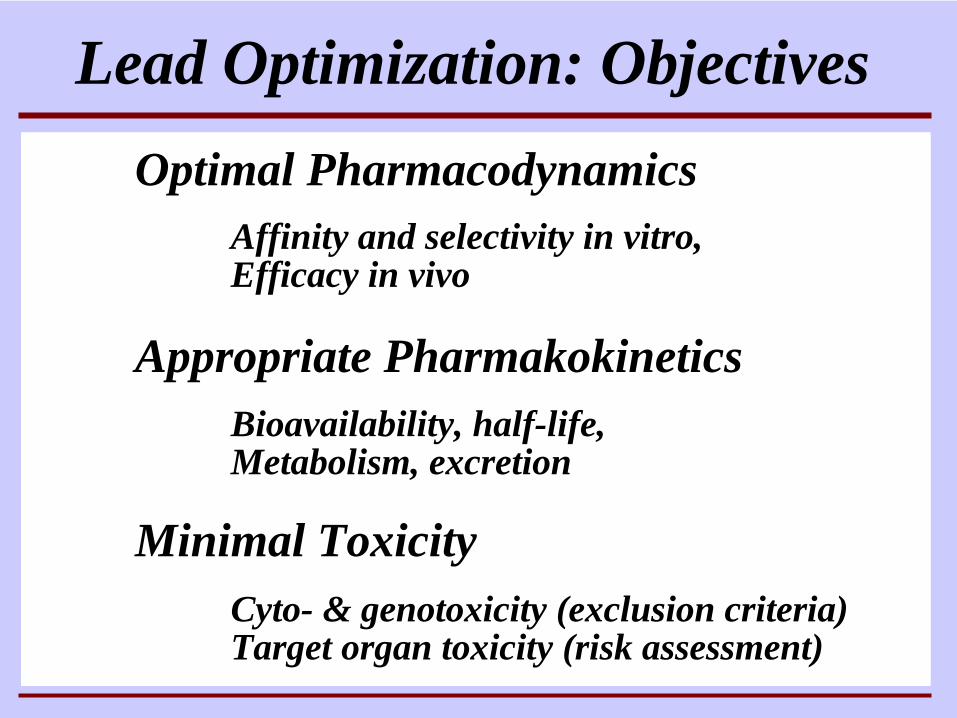
Lead Optimization: ObjectivesOptimal Pharmacodynamics
Appropriate Pharmakokinetics
Affinity and selectivity in vitro, Efficacy in vivo
Bioavailability, half-life,Metabolism, excretion
Minimal ToxicityCyto- & genotoxicity (exclusion criteria)Target organ toxicity (risk assessment)
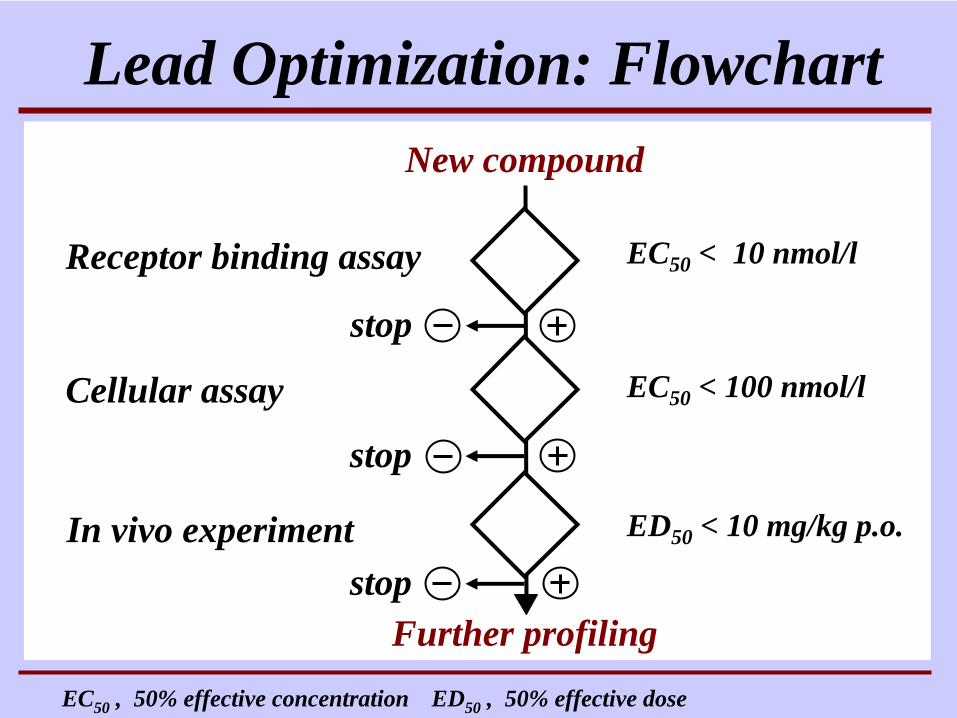
Lead Optimization: FlowchartNew compound
Further profiling
Receptor binding assay
Cellular assay
In vivo experiment ED50 < 10 mg/kg p.o.
EC50 < 10 nmol/l
EC50 < 100 nmol/l
EC50 , 50% effective concentration ED50 , 50% effective dose
stop
stop
stop
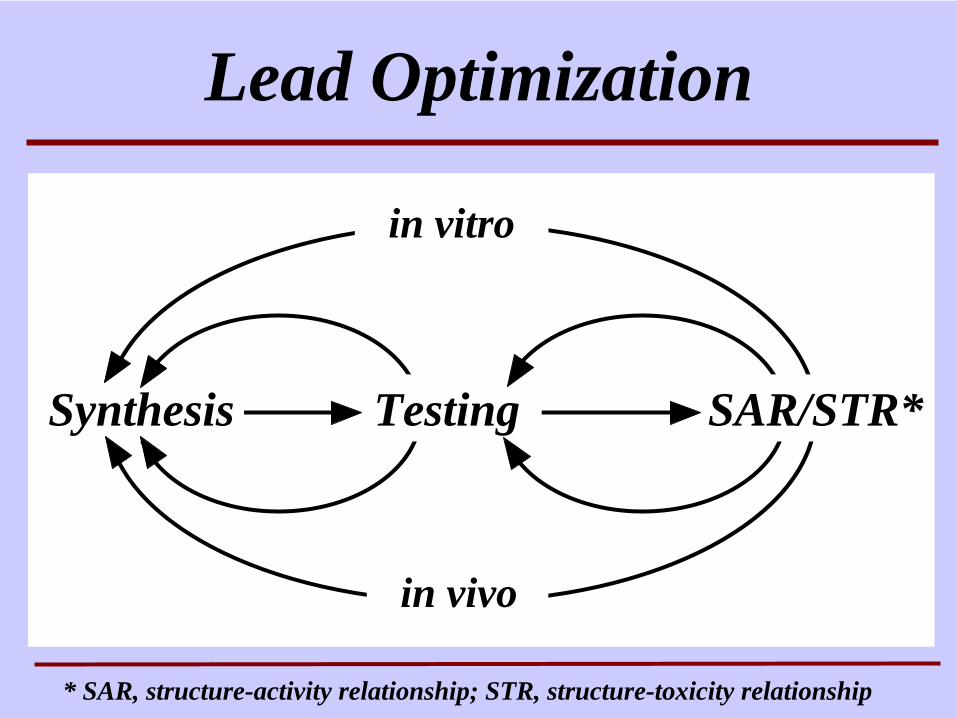
Lead Optimization
Synthesis SAR/STR*Testing
in vitro
in vivo
* SAR, structure-activity relationship; STR, structure-toxicity relationship
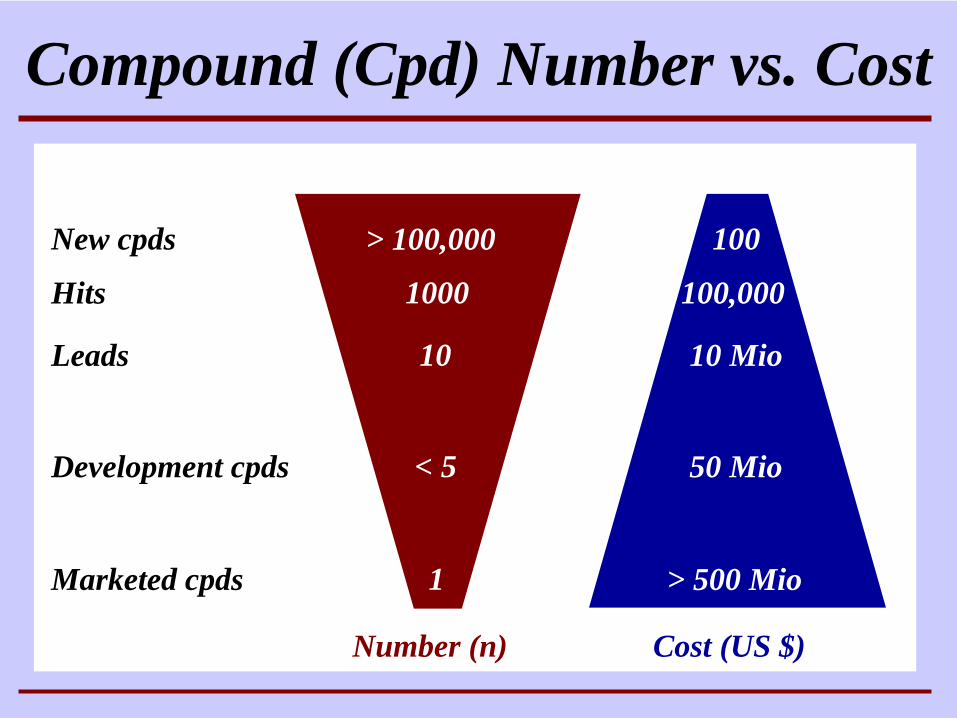
Compound (Cpd) Number vs. Cost
> 100,000
1000
10
< 5
1
New cpds
Hits
Leads
Development cpds
Marketed cpds
100
100,000
10 Mio
50 Mio
> 500 Mio
Cost (US $)Number (n)
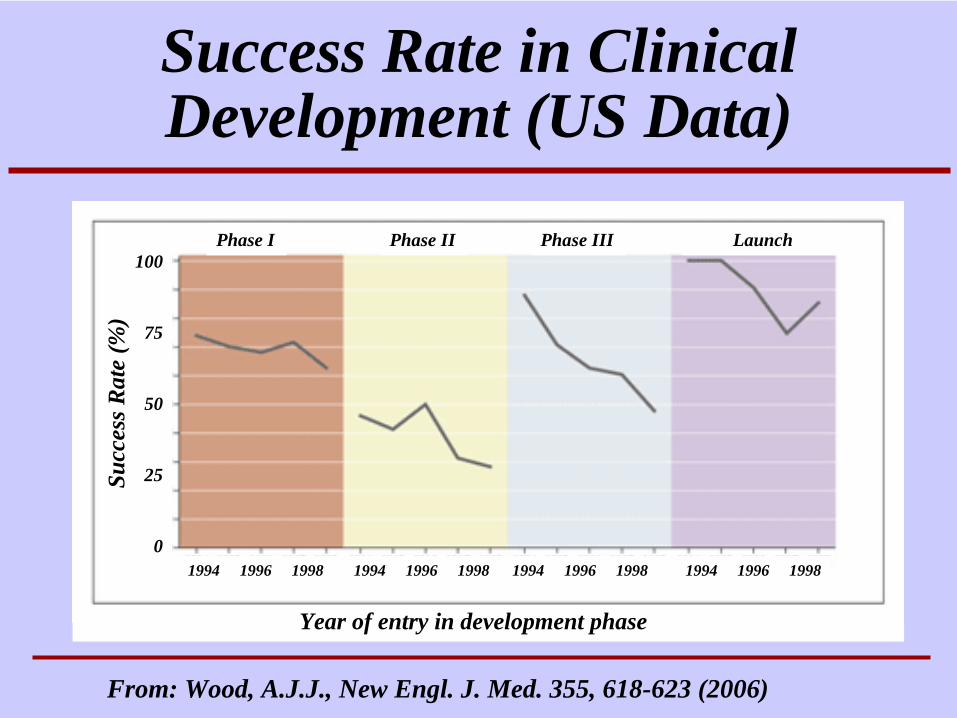
Success Rate in Clinical Development (US Data)
Phase I LaunchPhase IIIPhase II100
75
50
25
01994 1996 1998 1994 1996 1998 1994 1996 1998 1994 1996 1998
From: Wood, A.J.J., New Engl. J. Med. 355, 618-623 (2006)
Succ
essR
ate
(%)
Year of entry in development phase
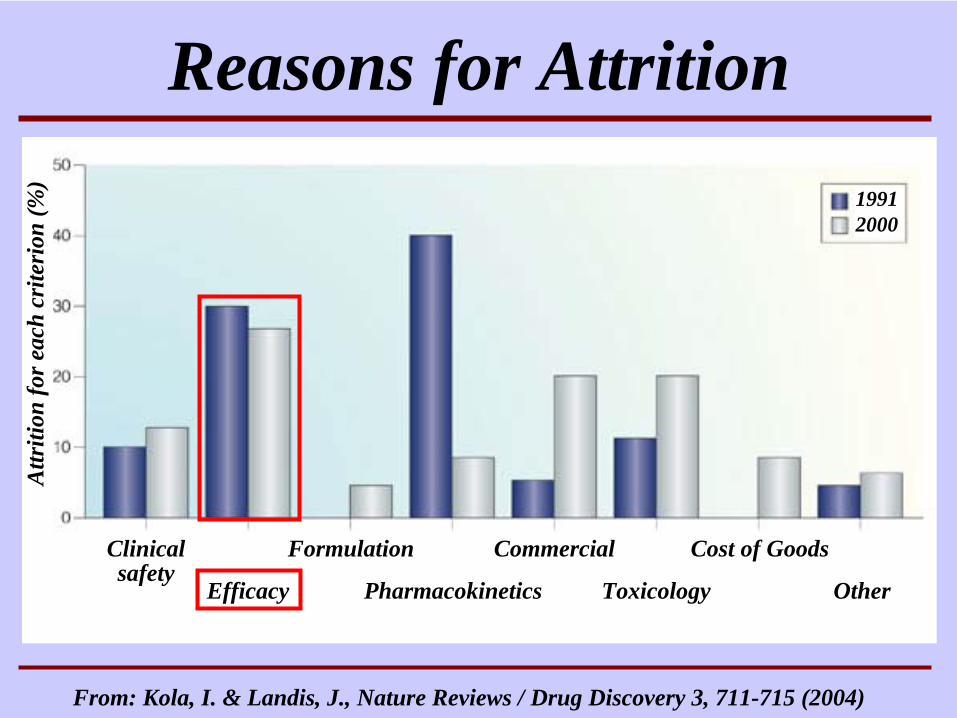
Reasons for AttritionA
ttriti
onfo
reac
hcr
iteri
on(%
)
19912000
Clinical safety
Efficacy
Formulation
Pharmacokinetics
Commercial
Toxicology
Cost of Goods
Other
From: Kola, I. & Landis, J., Nature Reviews / Drug Discovery 3, 711-715 (2004)
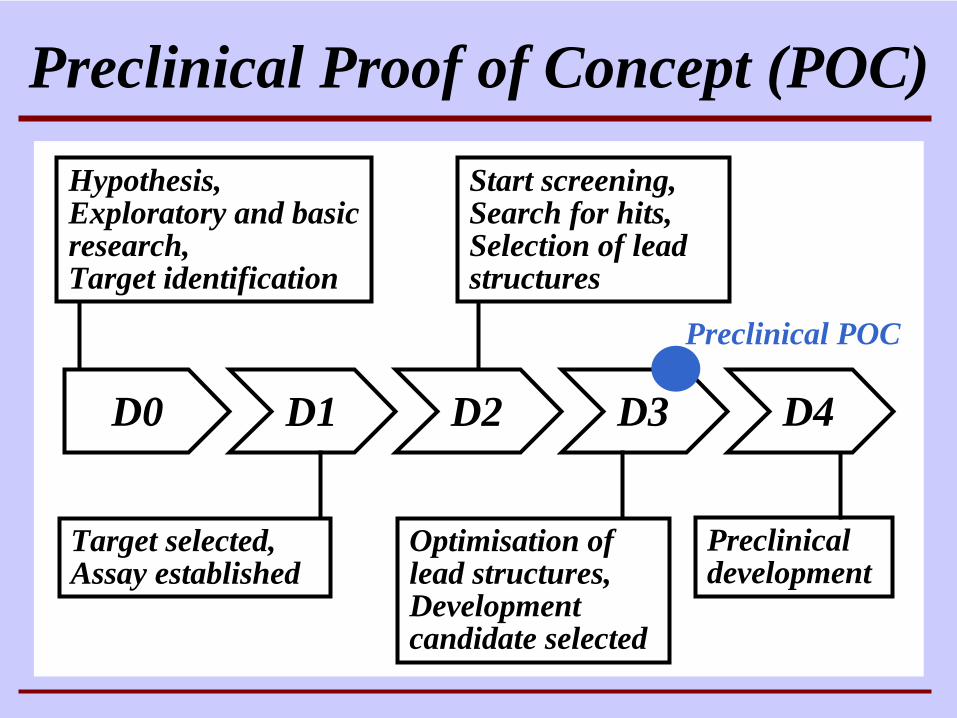
D0 D1 D2 D3
Target selected,Assay established
Start screening,Search for hits, Selection of lead structures
Optimisation of lead structures, Development candidate selected
Hypothesis,Exploratory and basicresearch,Target identification
Preclinical Proof of Concept (POC)
D4
Preclinical development
Preclinical POC
Pre-clinical
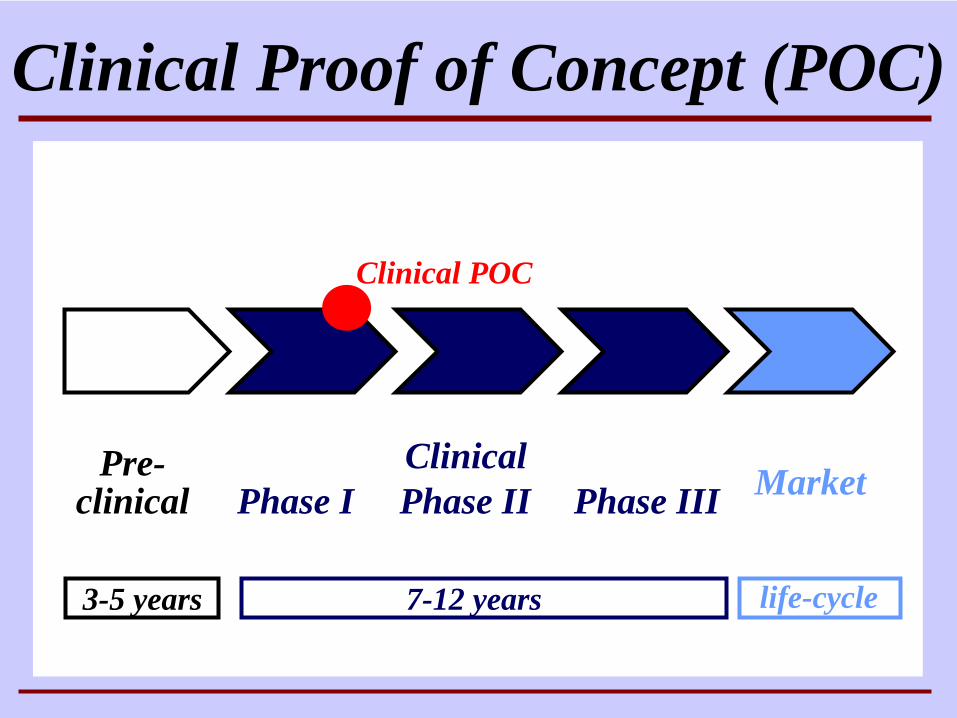
Clinical Proof of Concept (POC)
Phase I Phase II Phase III Market
3-5 years 7-12 years life-cycle
Clinical
Clinical POC
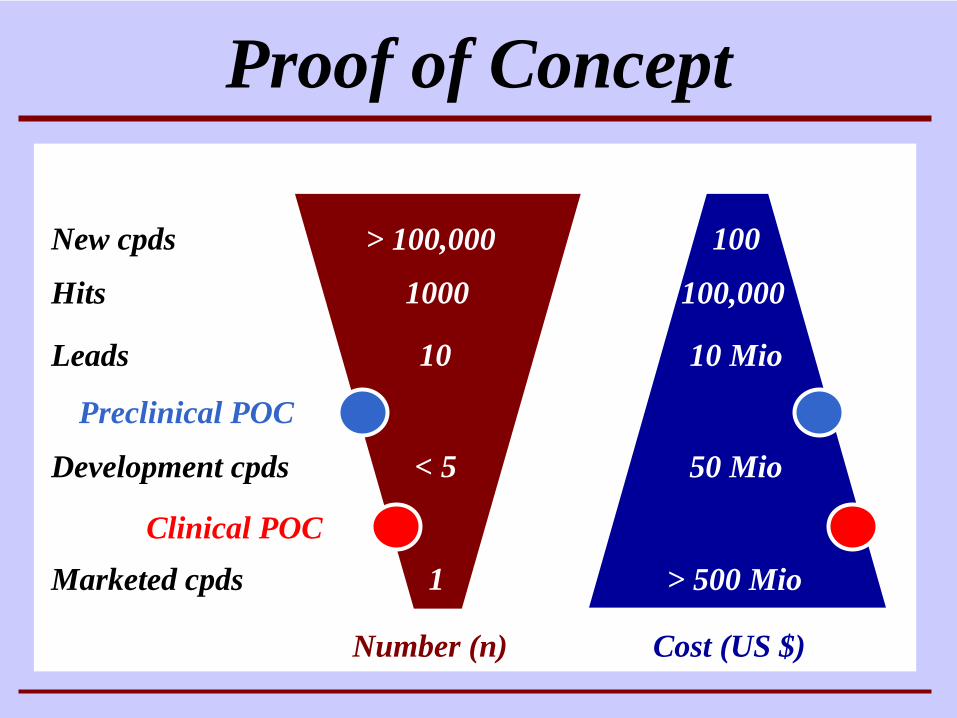
Proof of Concept
> 100,000
1000
10
< 5
1
New cpds
Hits
Leads
Development cpds
Marketed cpds
100
100,000
10 Mio
50 Mio
> 500 Mio
Cost (US $)Number (n)
Preclinical POC
Clinical POC
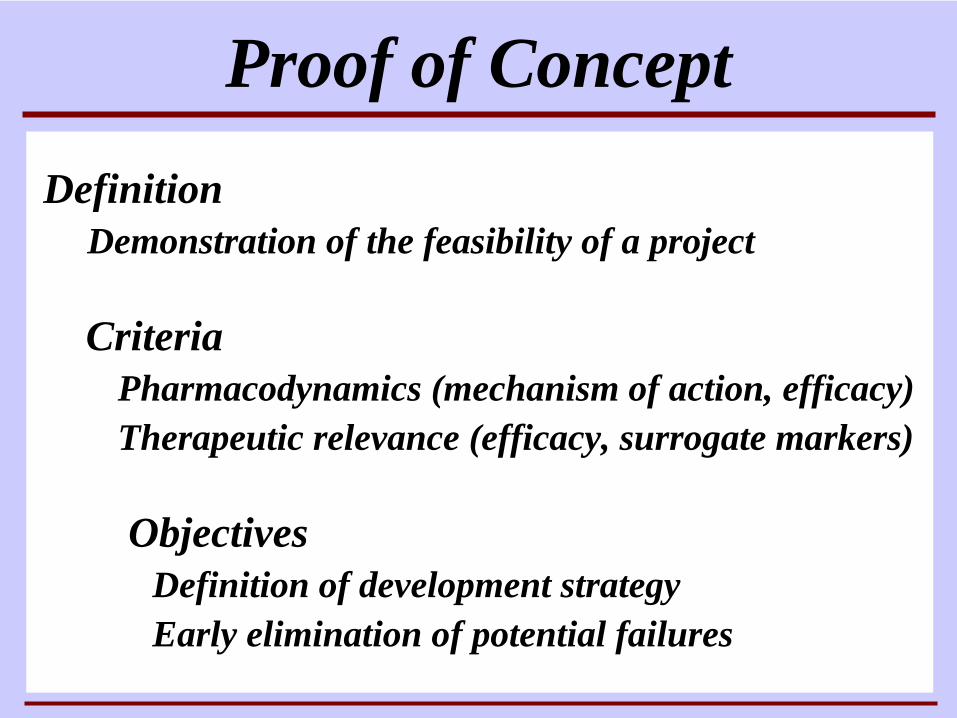
Definition Demonstration of the feasibility of a project
CriteriaPharmacodynamics (mechanism of action, efficacy)Therapeutic relevance (efficacy, surrogate markers)
ObjectivesDefinition of development strategyEarly elimination of potential failures
Proof of Concept
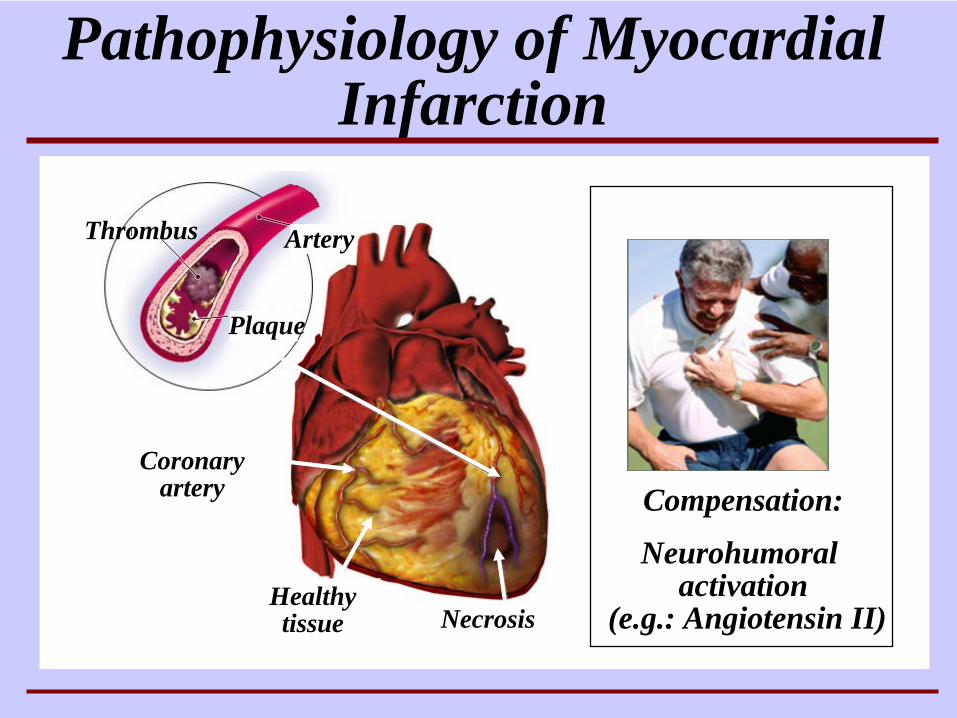
NecrosisHealthy tissue
Coronary artery
Pathophysiology of Myocardial Infarction
Thrombus Artery
Plaque
Compensation:
Neurohumoralactivation
(e.g.: Angiotensin II)
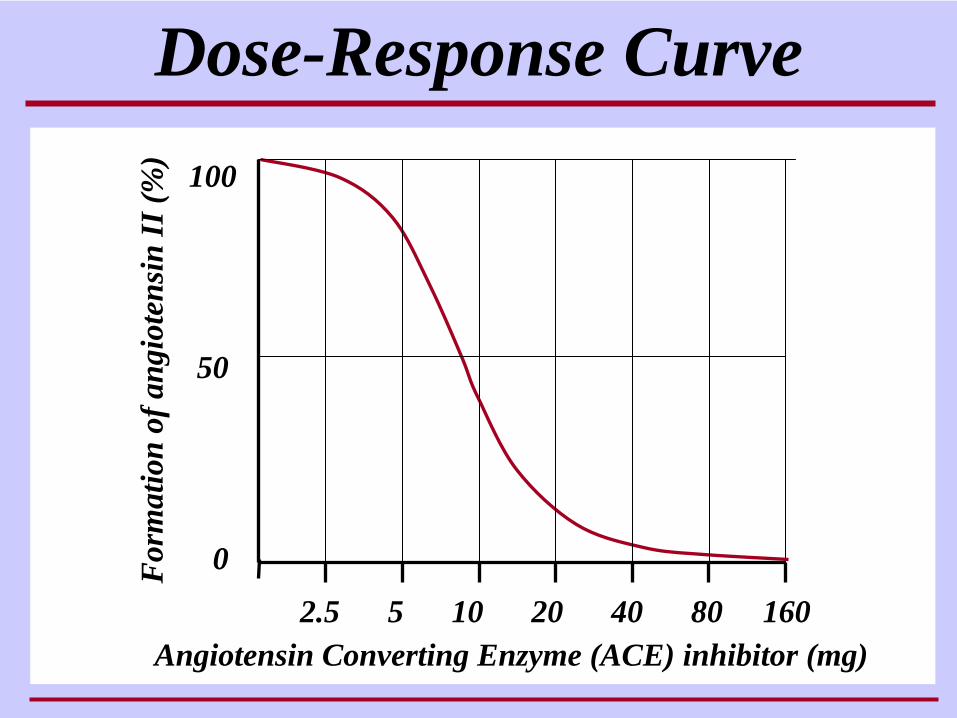
Dose-Response Curve100
50
0
2.5 5 10 20 40 80 160
For
mat
ion
of a
ngio
tens
inII
(%)
Angiotensin Converting Enzyme (ACE) inhibitor (mg)
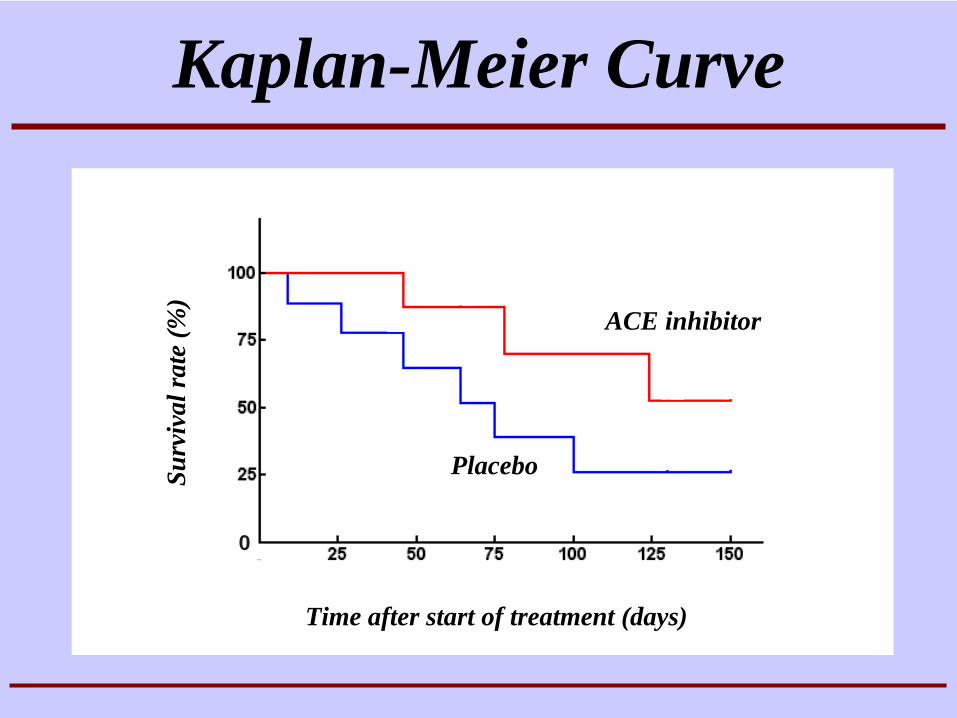
Kaplan-Meier Curve
Placebo
ACE inhibitor
Surv
ival
rate
(%)
Time after start of treatment (days)
0
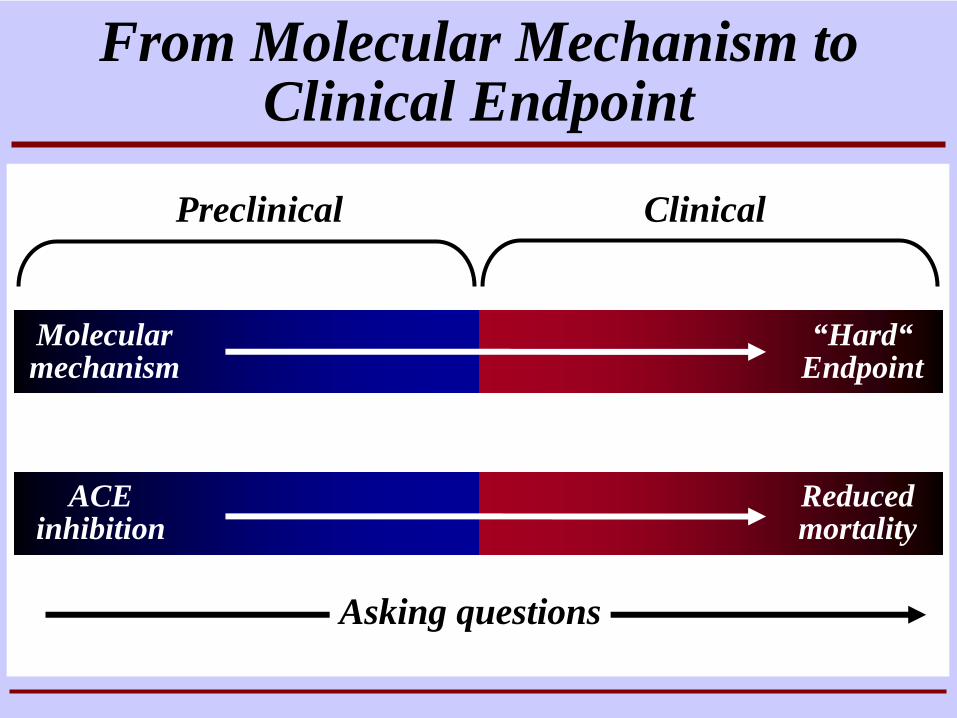
Preclinical Clinical
Molecular mechanism
ACE inhibition
Reduced mortality
From Molecular Mechanism to Clinical Endpoint
“Hard“ Endpoint
Asking questions
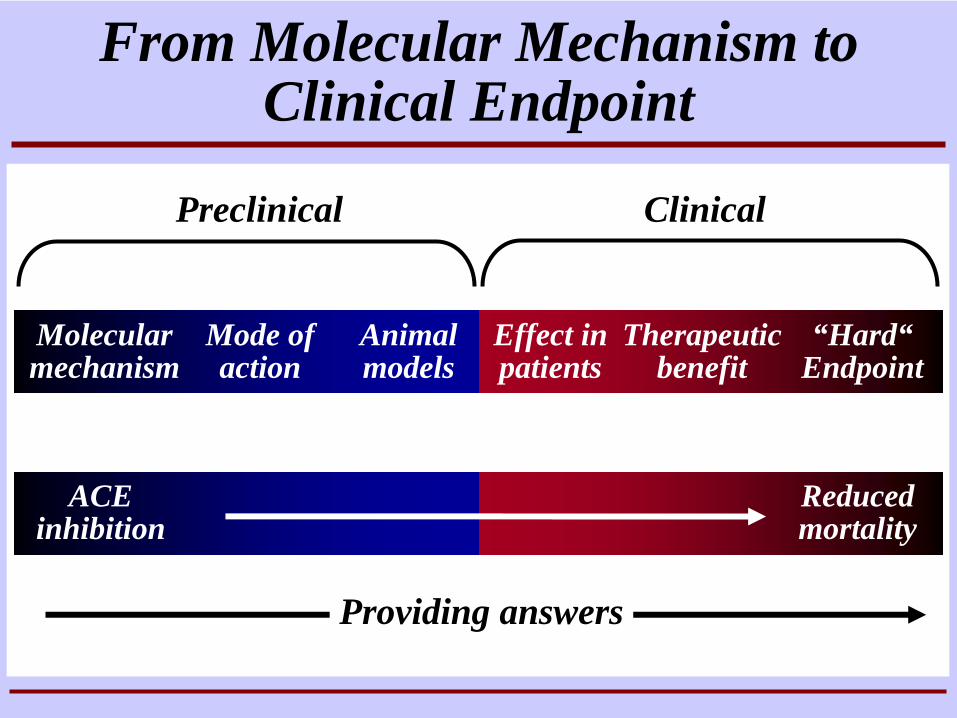
Preclinical Clinical
Molecular mechanism
Mode of action
Animal models
Effect in patients
Therapeutic benefit
ACE inhibition
Reduced mortality
From Molecular Mechanism to Clinical Endpoint
“Hard“ Endpoint
Providing answers
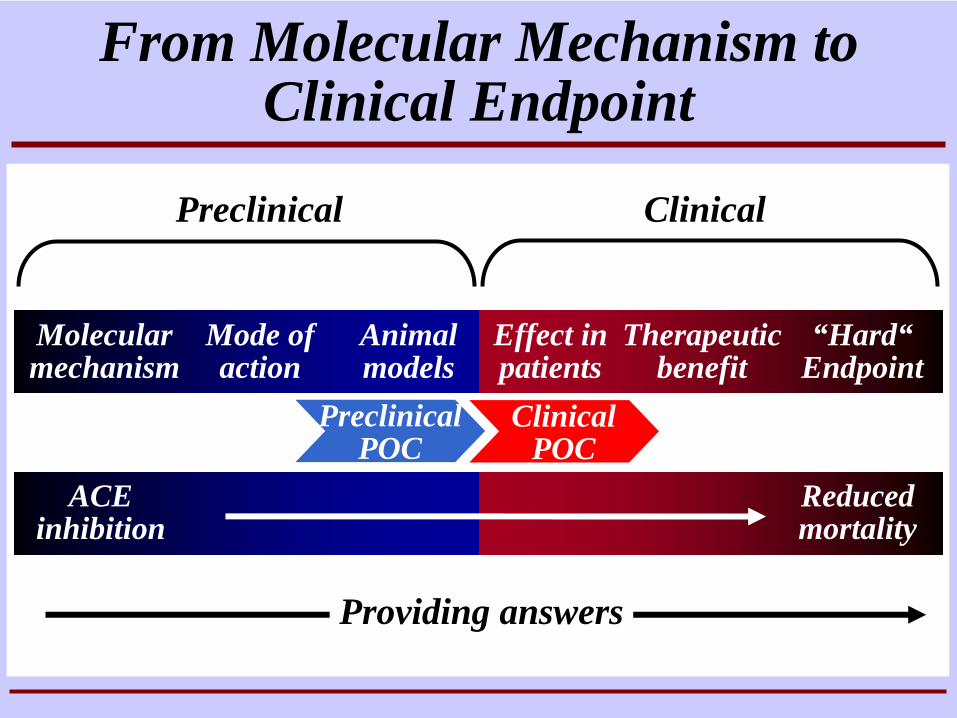
Preclinical Clinical
Molecular mechanism
Mode of action
Animal models
Effect in patients
Therapeutic benefit
ACE inhibition
Reduced mortality
From Molecular Mechanism to Clinical Endpoint
“Hard“ Endpoint
Providing answers
ClinicalPOC
PreclinicalPOC
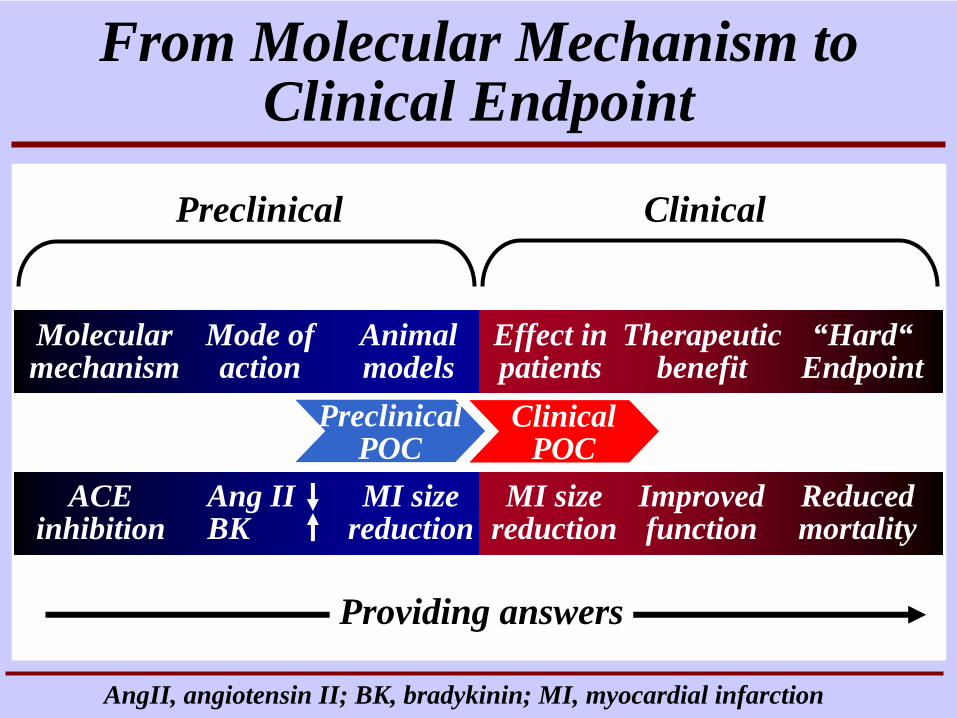
Preclinical Clinical
Molecular mechanism
Mode of action
Animal models
Effect in patients
Therapeutic benefit
ACE inhibition
MI size reduction
MI size reduction
Improvedfunction
Reduced mortality
Ang II BK
From Molecular Mechanism to Clinical Endpoint
“Hard“ Endpoint
Providing answers
AngII, angiotensin II; BK, bradykinin; MI, myocardial infarction
ClinicalPOC
PreclinicalPOC
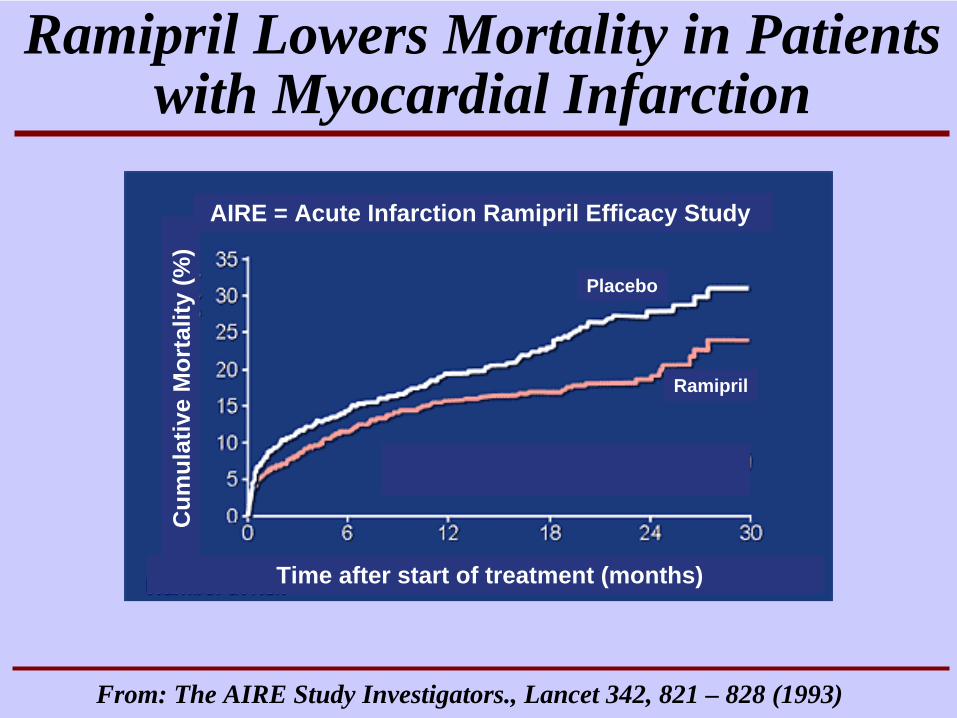
Ramipril Lowers Mortality in Patients with Myocardial Infarction
Cum
ulat
ive
Mor
talit
y(%
)
Ramipril
Placebo
Time after start of treatment (months)
AIRE = Acute Infarction Ramipril Efficacy Study
From: The AIRE Study Investigators., Lancet 342, 821 – 828 (1993)
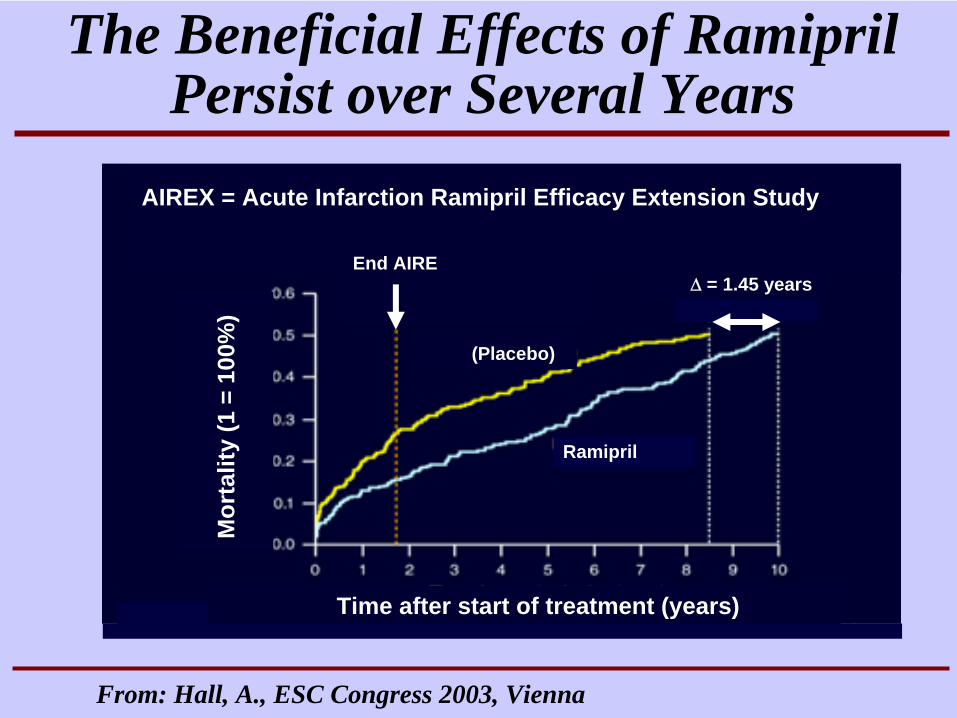
The Beneficial Effects of Ramipril Persist over Several Years
From: Hall, A., ESC Congress 2003, Vienna
Mor
talit
y(1
= 1
00%
)
Ramipril
Time after start of treatment (years)
(Placebo)
AIREX = Acute Infarction Ramipril Efficacy Extension Study
End AIREΔ = 1.45 years
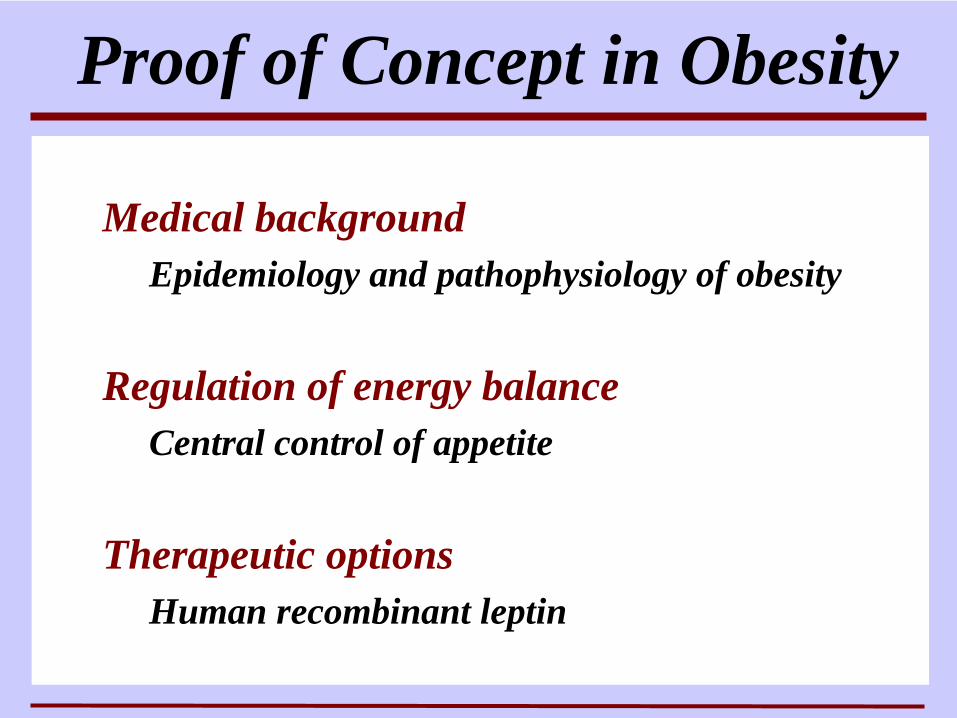
Medical backgroundEpidemiology and pathophysiology of obesity
Regulation of energy balanceCentral control of appetite
Therapeutic optionsHuman recombinant leptin
Proof of Concept in Obesity
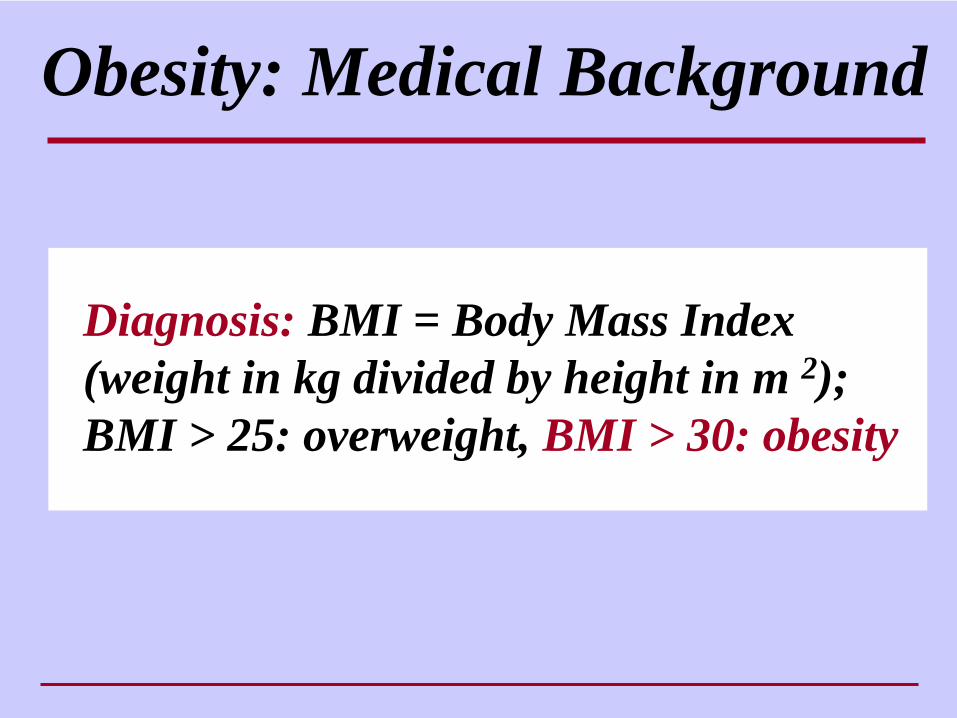
Obesity: Medical Background
Diagnosis: BMI = Body Mass Index (weight in kg divided by height in m 2); BMI > 25: overweight, BMI > 30: obesity
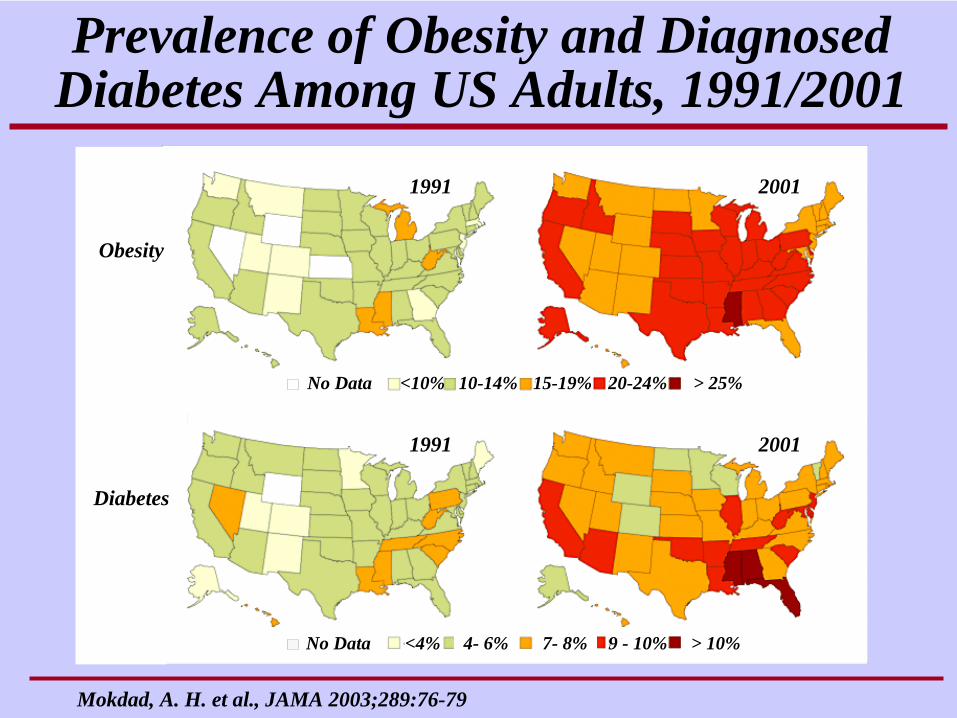
Mokdad, A. H. et al., JAMA 2003;289:76-79
Prevalence of Obesity and Diagnosed Diabetes Among US Adults, 1991/2001
1991
1991
2001
2001
<4% 4- 6% 7- 8% 9 - 10% > 10%No Data
<10% 10-14% 15-19% 20-24% > 25%No Data
Obesity
Diabetes
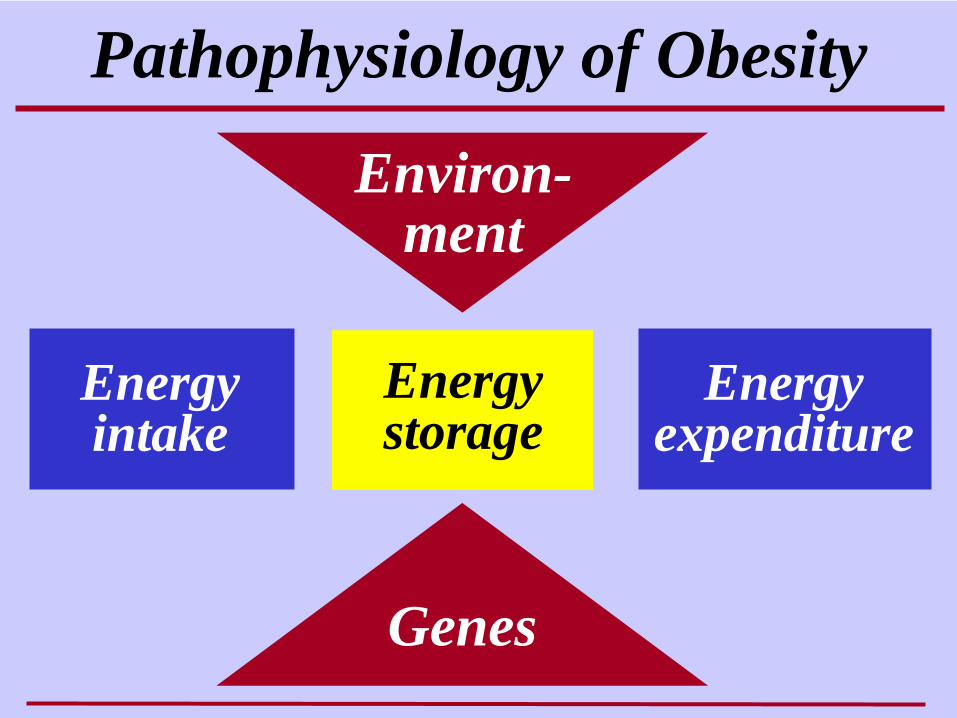
Pathophysiology of Obesity
Environ-ment
Genes
Energy expenditure
Energy intake
Energy storage
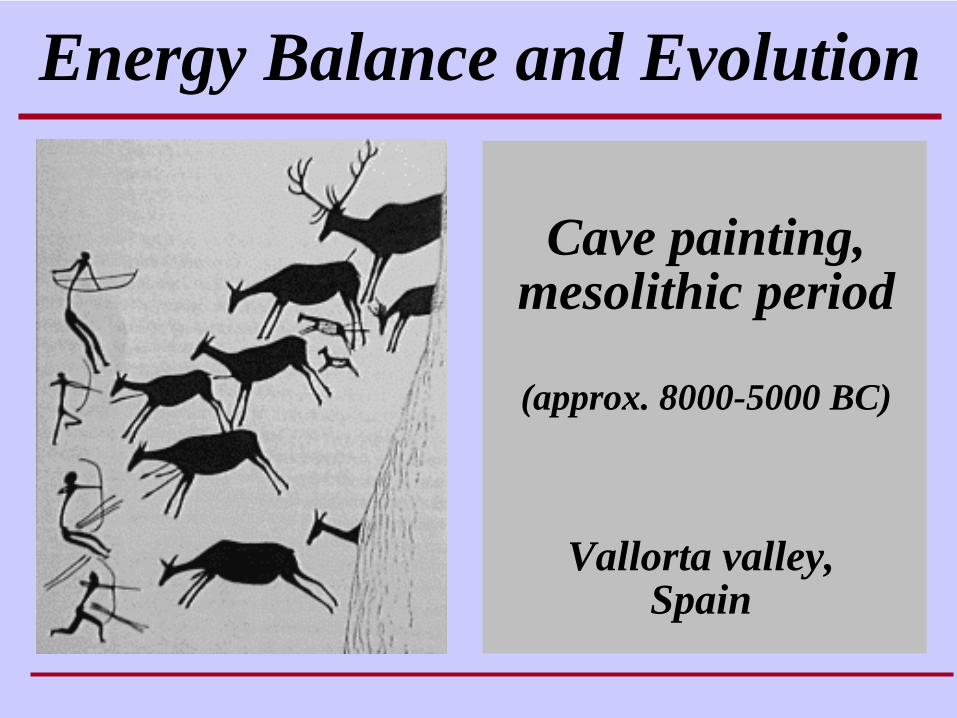
Cave painting, mesolithic period
(approx. 8000-5000 BC)
Energy Balance and Evolution
Vallorta valley, Spain
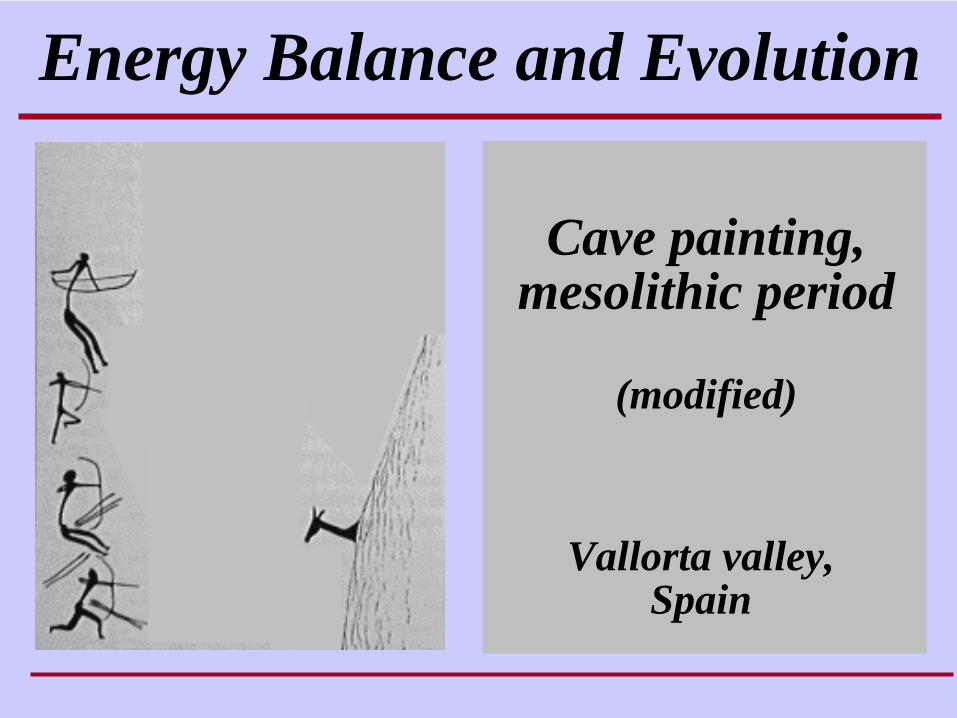
Cave painting,mesolithic period
(modified)
Energy Balance and Evolution
Vallorta valley, Spain
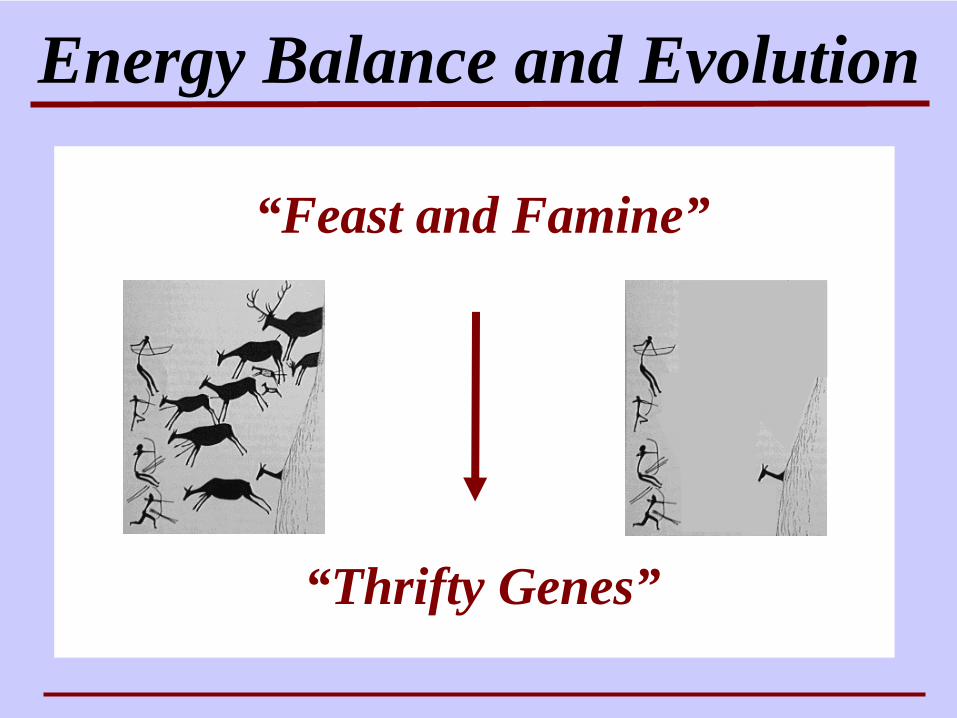
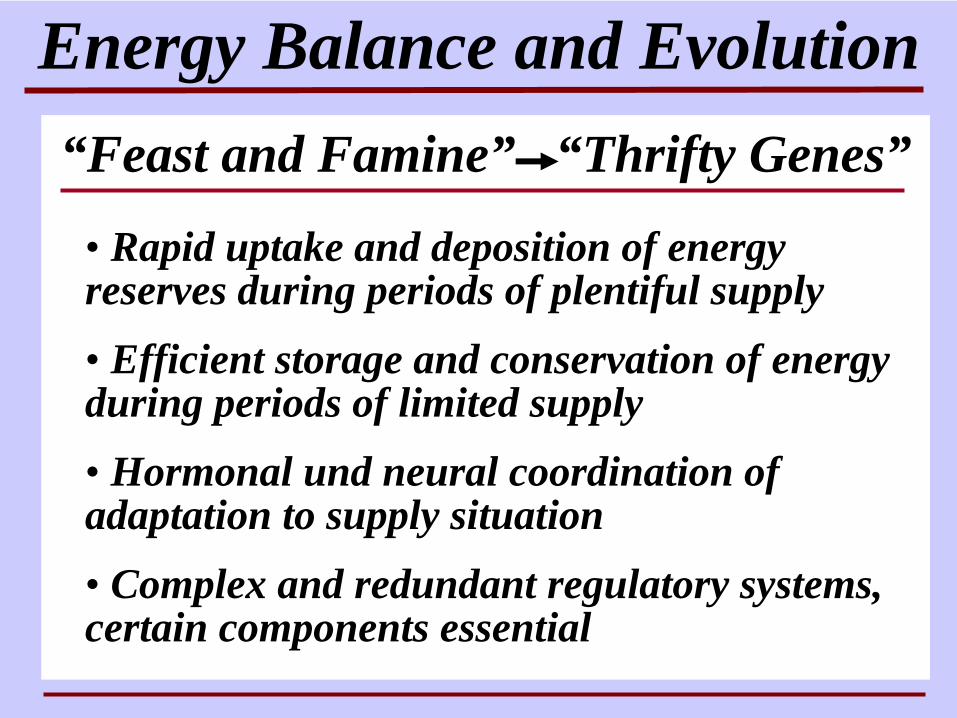
Energy Balance and Evolution
“Feast and Famine”
“Thrifty Genes”
Energy Balance and Evolution
• Rapid uptake and deposition of energy reserves during periods of plentiful supply • Efficient storage and conservation of energy during periods of limited supply• Hormonal und neural coordination of adaptation to supply situation• Complex and redundant regulatory systems, certain components essential
“Feast and Famine” “Thrifty Genes”
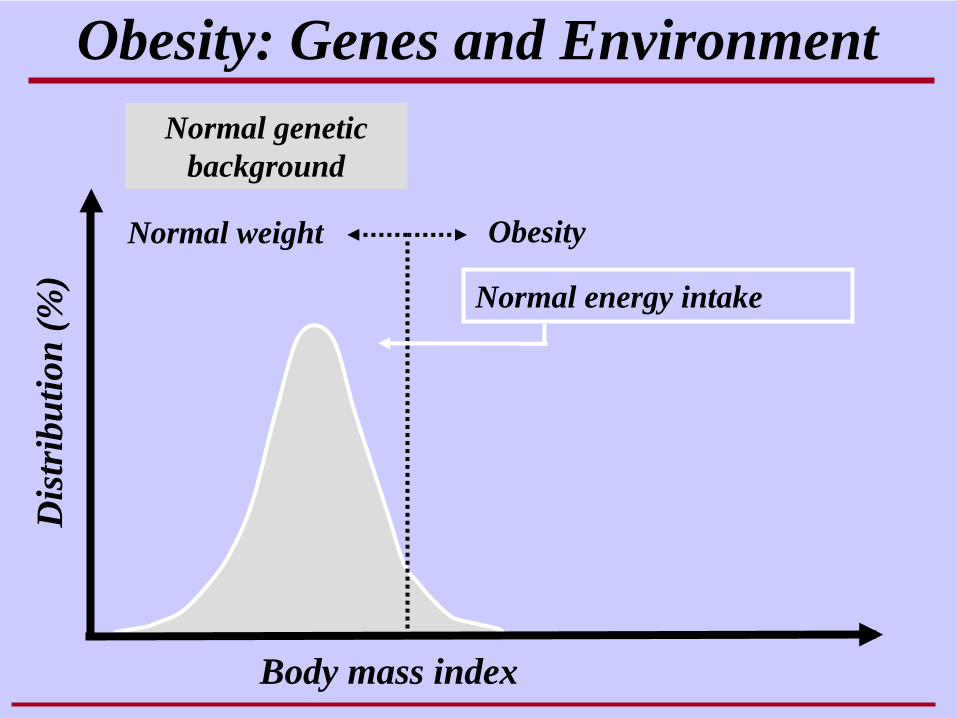
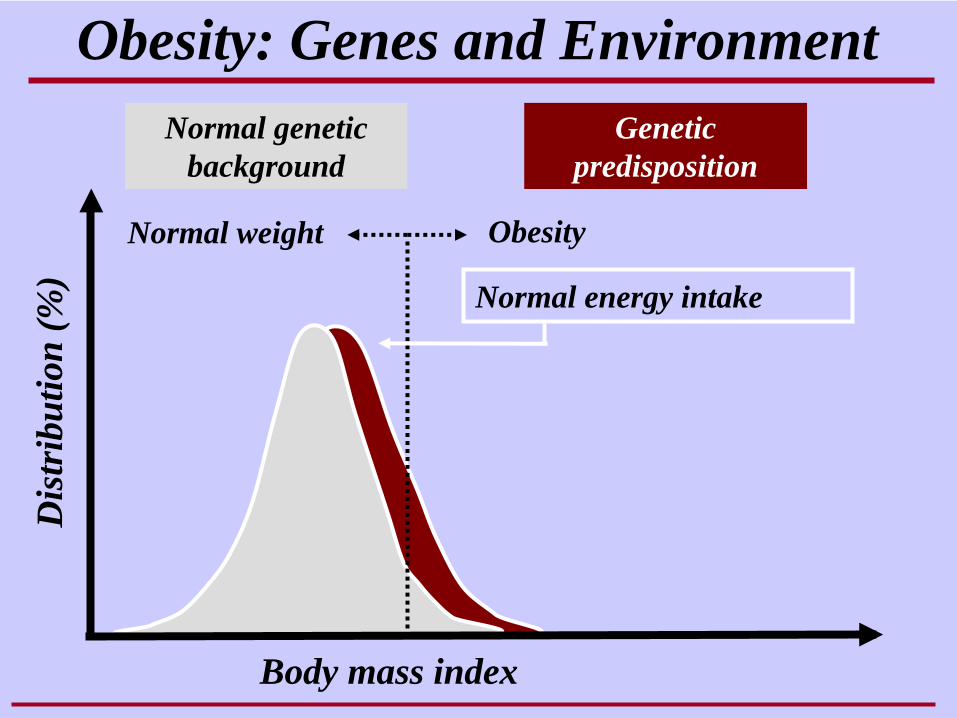
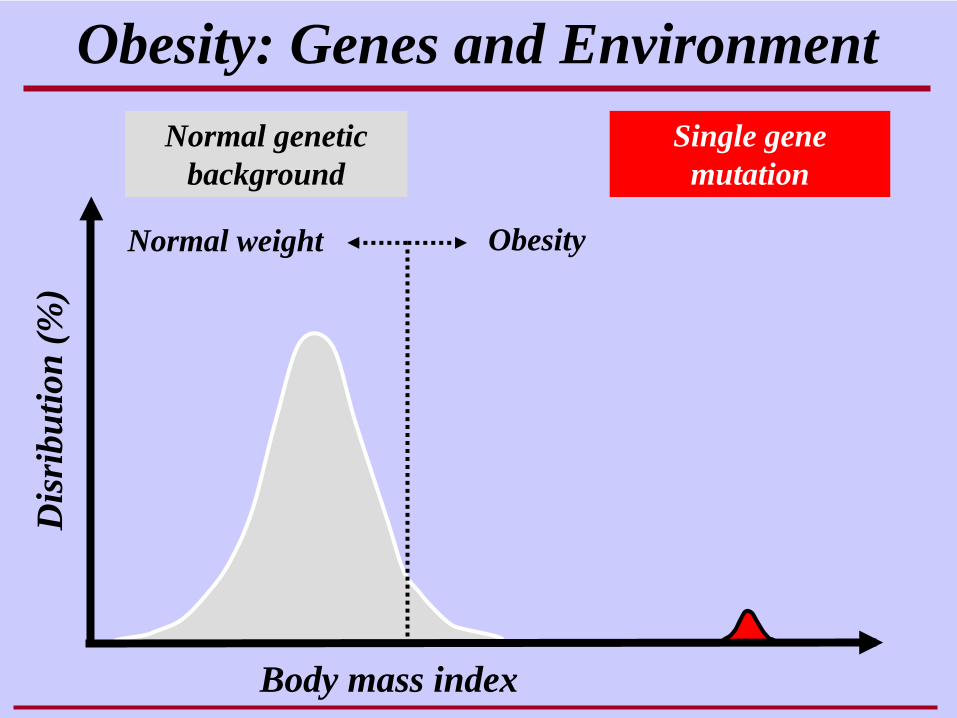
Obesity: Genes and EnvironmentD
istr
ibut
ion
(%)
Normal genetic background
Body mass index
Normal energy intake
Normal weight Obesity
High energy intake & low
energy expenditure
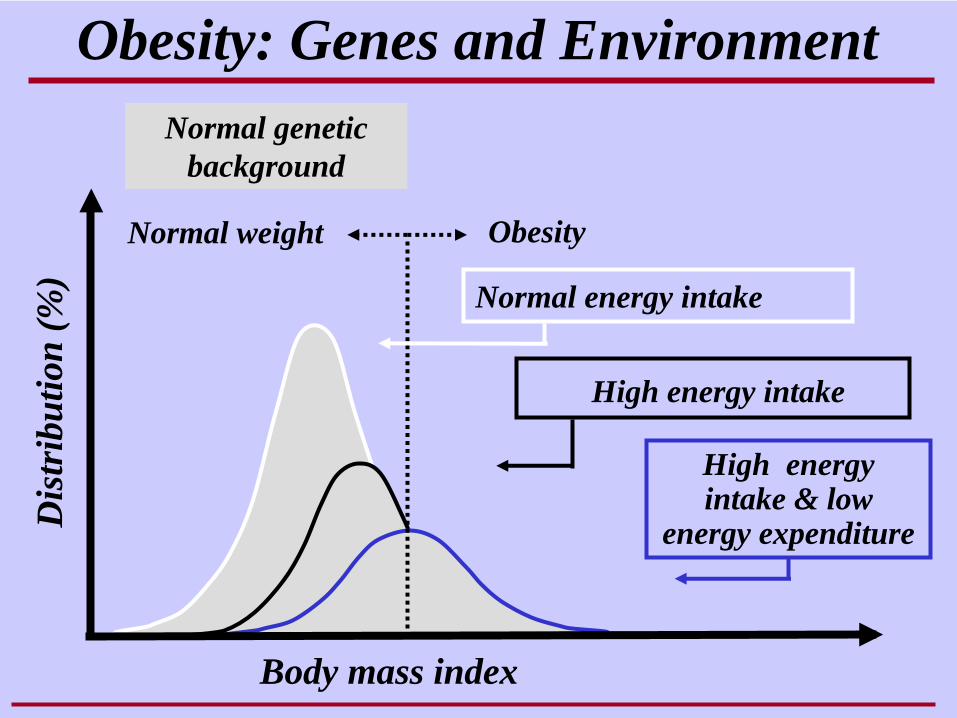
Obesity: Genes and EnvironmentD
istr
ibut
ion
(%)
Normal genetic background
Body mass index
Normal energy intake
High energy intake
Normal weight Obesity
Obesity: Genes and EnvironmentD
istr
ibut
ion
(%)
Genetic predisposition
Normal genetic background
Body mass index
Normal energy intake
Normal weight Obesity
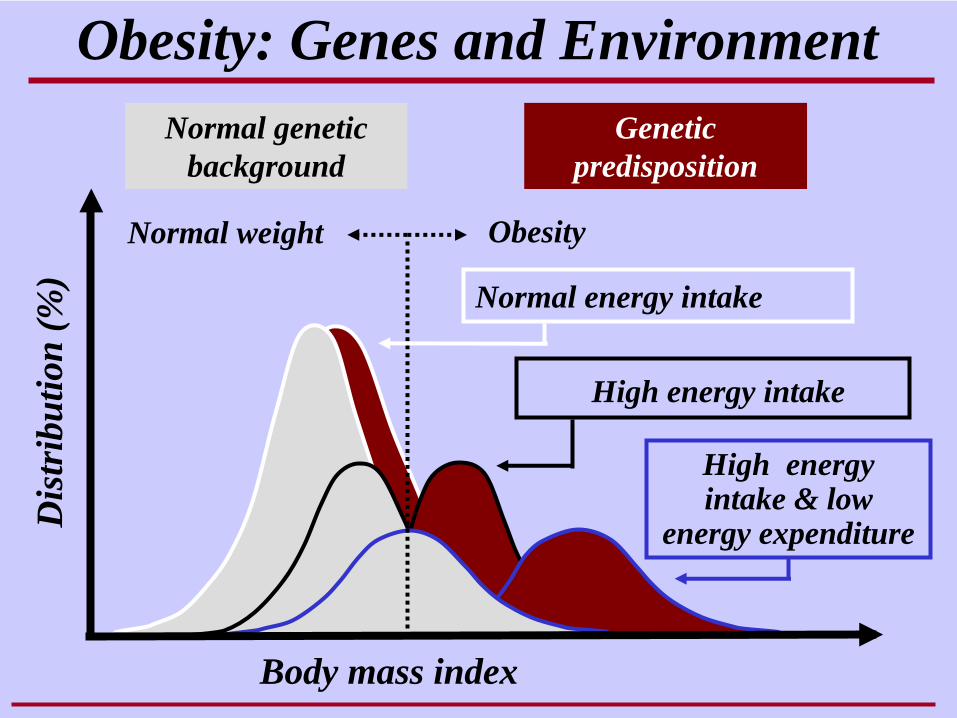
High energy intake & low
energy expenditure
Obesity: Genes and EnvironmentD
istr
ibut
ion
(%)
Genetic predisposition
Normal genetic background
Body mass index
Normal energy intake
High energy intake
Normal weight Obesity
Obesity: Genes and EnvironmentD
isri
butio
n(%
)
Body mass index
Normal weight Obesity
Normal genetic background
Single gene mutation
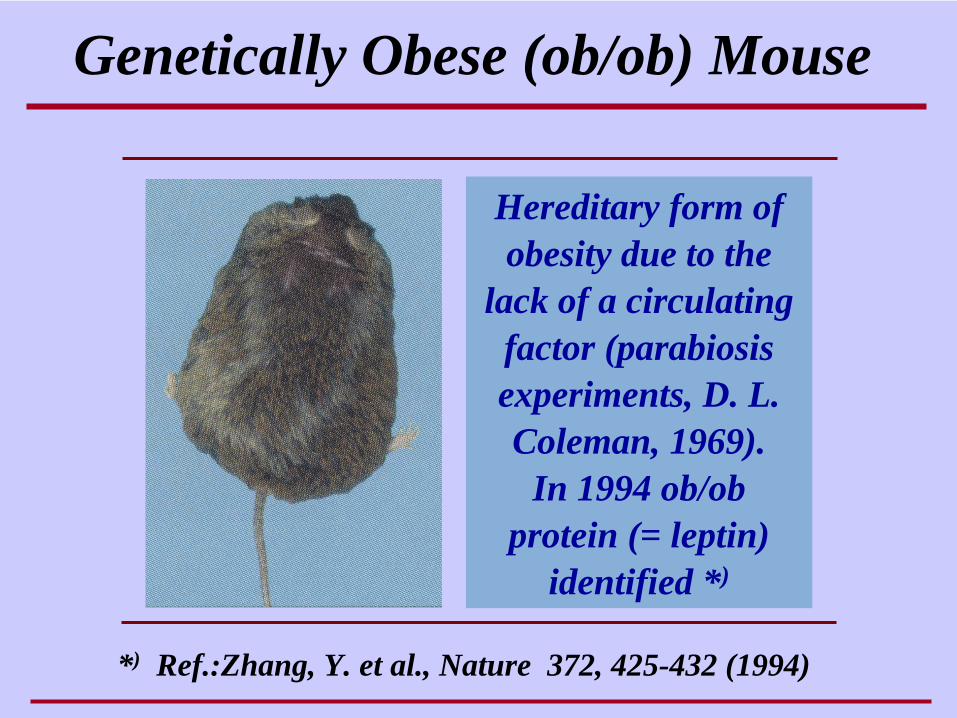
Genetically Obese (ob/ob) Mouse
Hereditary form of obesity due to the
lack of a circulating factor (parabiosis experiments, D. L. Coleman, 1969).
In 1994 ob/ob protein (= leptin)
identified *)
*) Ref.:Zhang, Y. et al., Nature 372, 425-432 (1994)
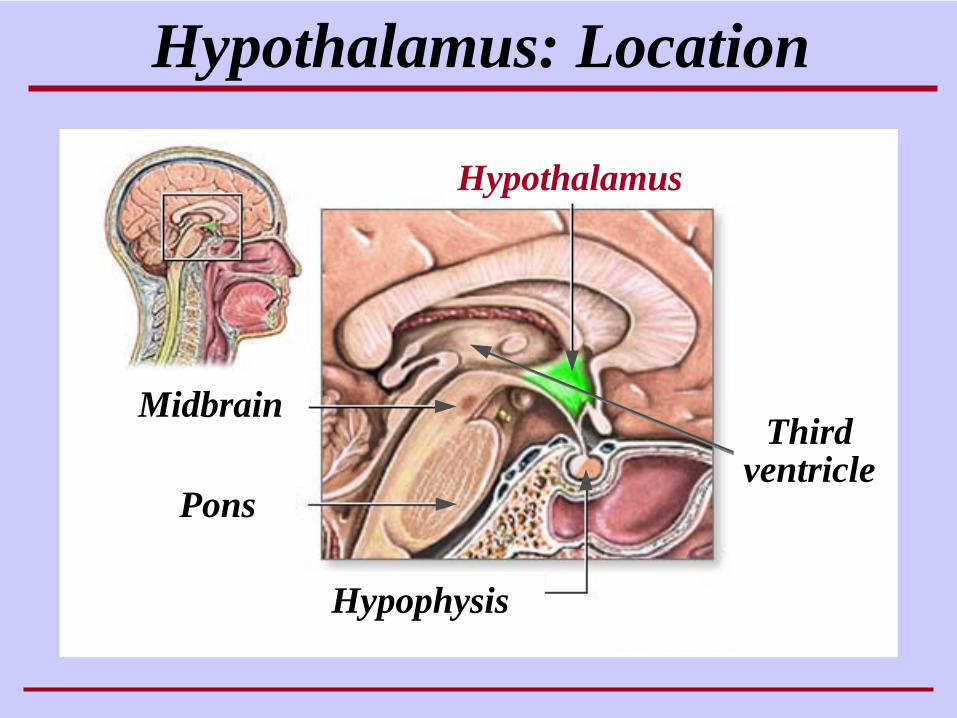
Hypothalamus: Location
Hypothalamus
Pons
Midbrain
Hypophysis
Thirdventricle
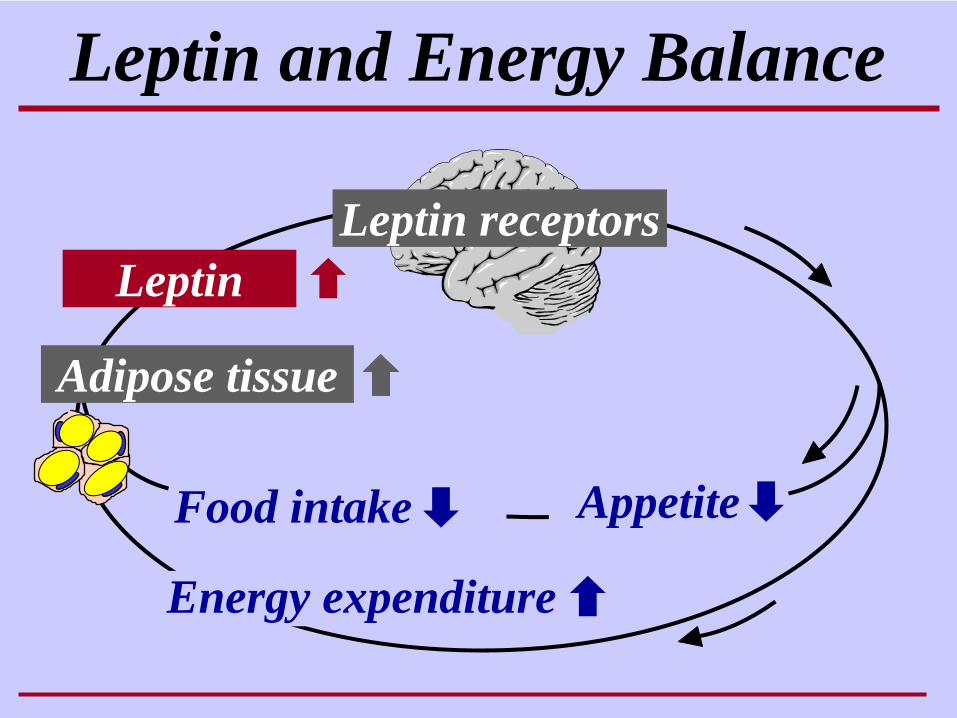
Leptin and Energy Balance
Energy expenditure
Leptin receptors
Food intake
Adipose tissue
Appetite
Leptin
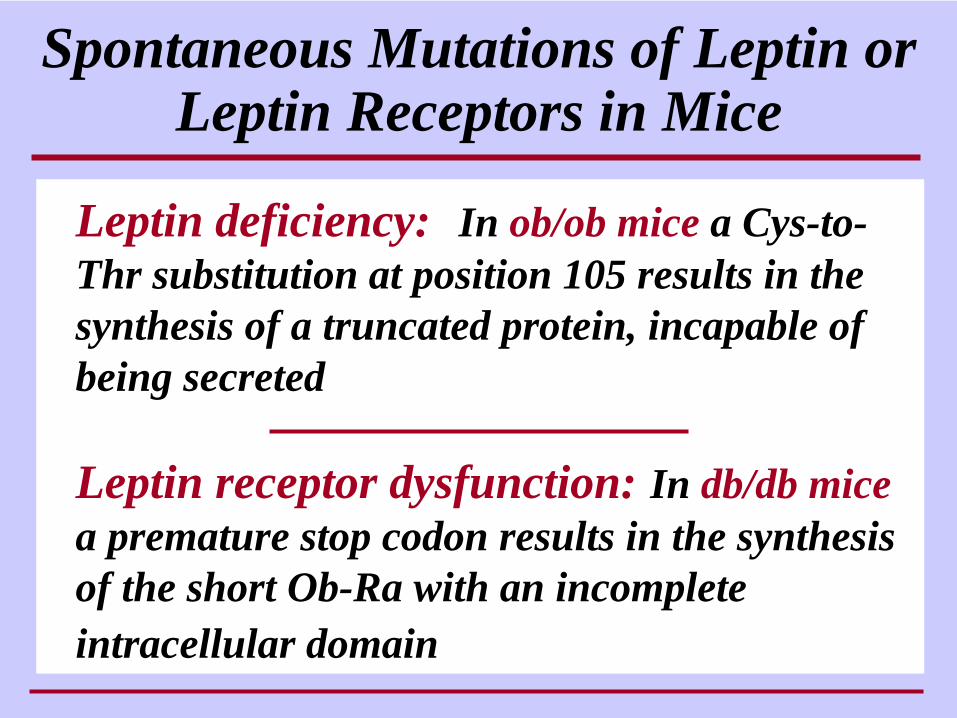
Spontaneous Mutations of Leptin or Leptin Receptors in Mice
Leptin deficiency: In ob/ob mice a Cys-to- Thr substitution at position 105 results in the synthesis of a truncated protein, incapable of being secreted
Leptin receptor dysfunction: In db/db mice a premature stop codon results in the synthesis of the short Ob-Ra with an incomplete intracellular domain
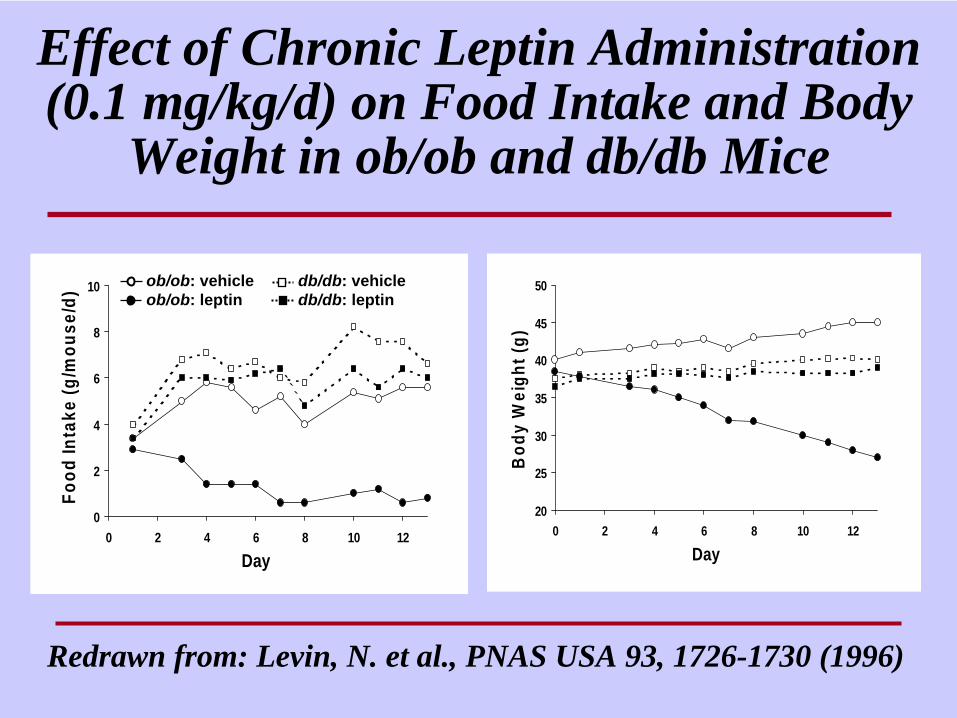
Effect of Chronic Leptin Administration (0.1 mg/kg/d) on Food Intake and Body
Weight in ob/ob and db/db Mice
Redrawn from: Levin, N. et al., PNAS USA 93, 1726-1730 (1996)
0
2
4
6
8
10
0 2 4 6 8 10 12
Day
Food
Inta
ke (g
/mou
se/d
)
20
25
30
35
40
45
50
0 2 4 6 8 10 12
Day
Bod
y W
eigh
t (g)
ob/ob: vehicleob/ob: leptin
db/db: vehicledb/db: leptin
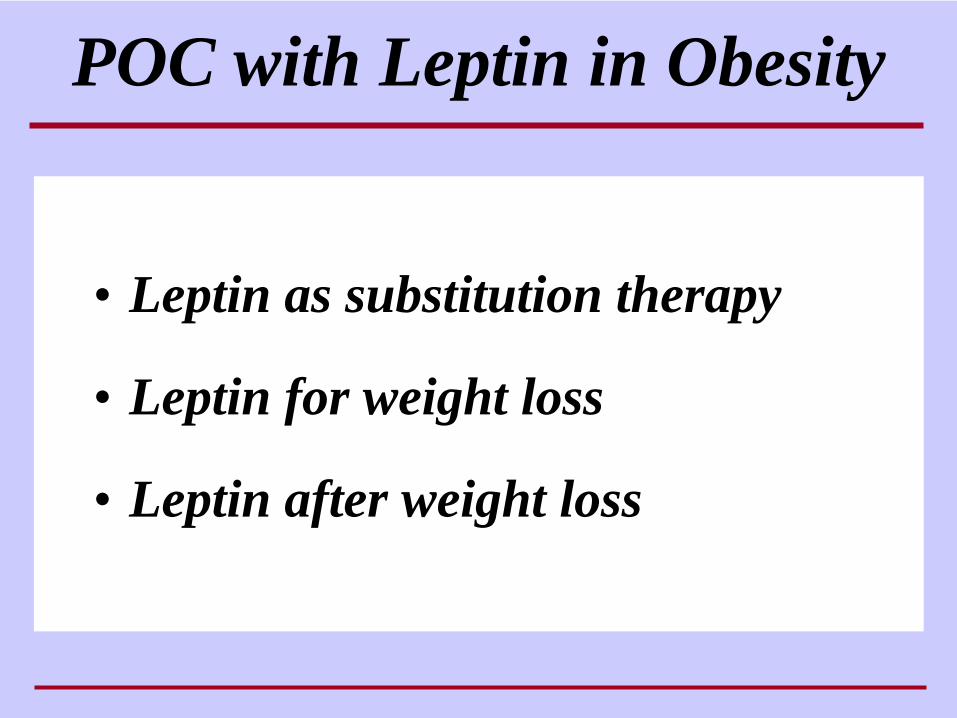
POC with Leptin in Obesity
• Leptin as substitution therapy
• Leptin for weight loss
• Leptin after weight loss
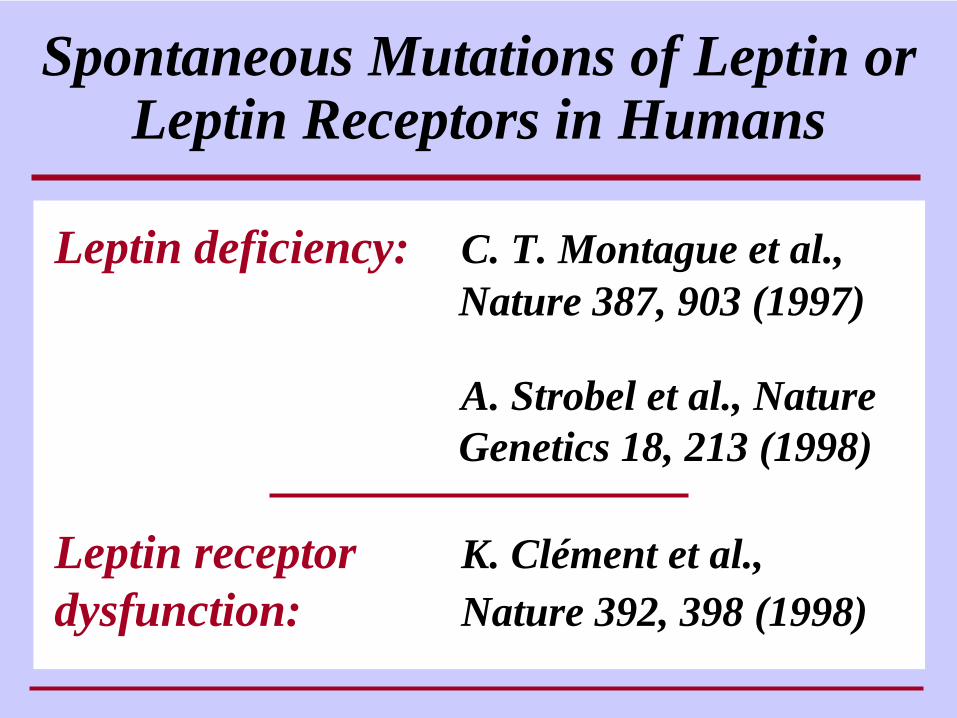
Spontaneous Mutations of Leptin or Leptin Receptors in Humans
Leptin deficiency: C. T. Montague et al., Nature 387, 903 (1997)
A. Strobel et al., Nature Genetics 18, 213 (1998)
Leptin receptor K. Clément et al.,dysfunction: Nature 392, 398 (1998)
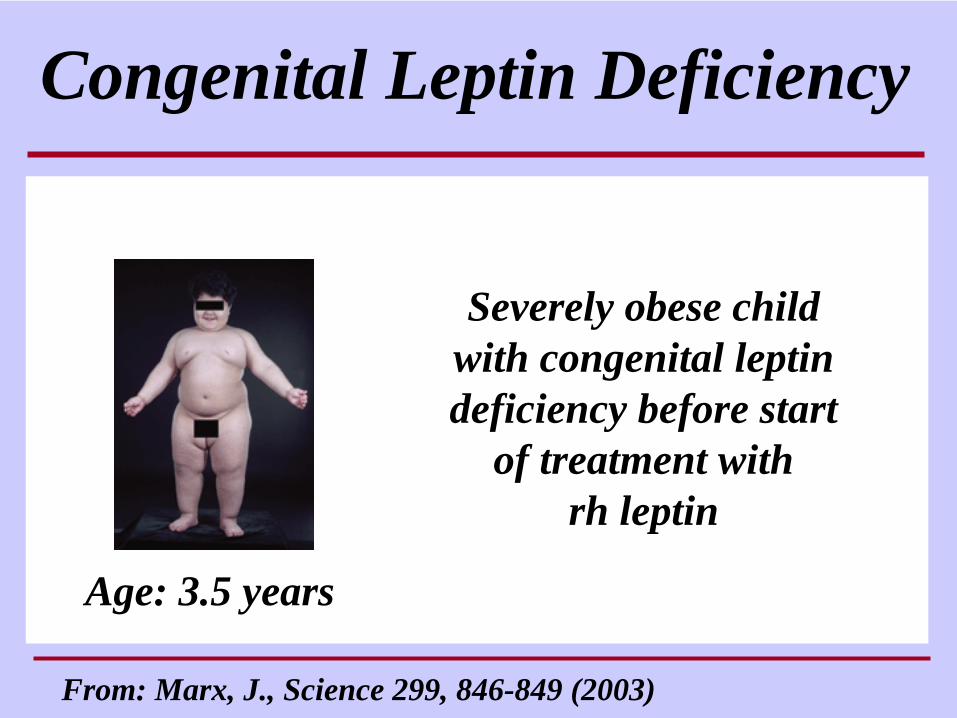
Congenital Leptin Deficiency
From: Marx, J., Science 299, 846-849 (2003)
Severely obese child with congenital leptin deficiency before start
of treatment with rh leptin
Age: 3.5 years
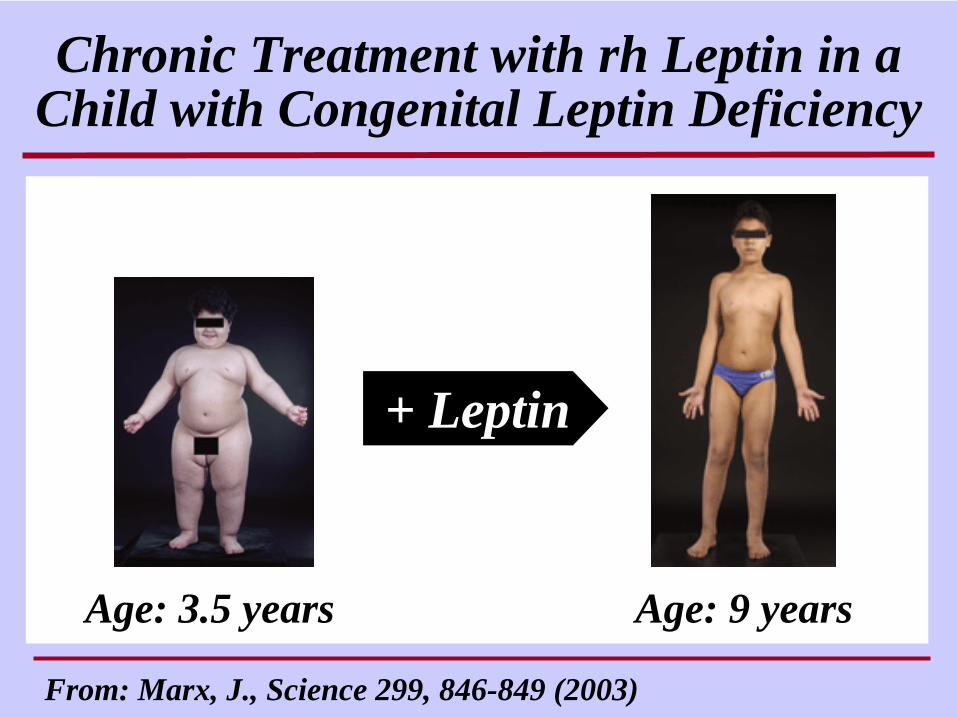
Chronic Treatment with rh Leptin in a Child with Congenital Leptin Deficiency
From: Marx, J., Science 299, 846-849 (2003)
Age: 3.5 years Age: 9 years
+ Leptin
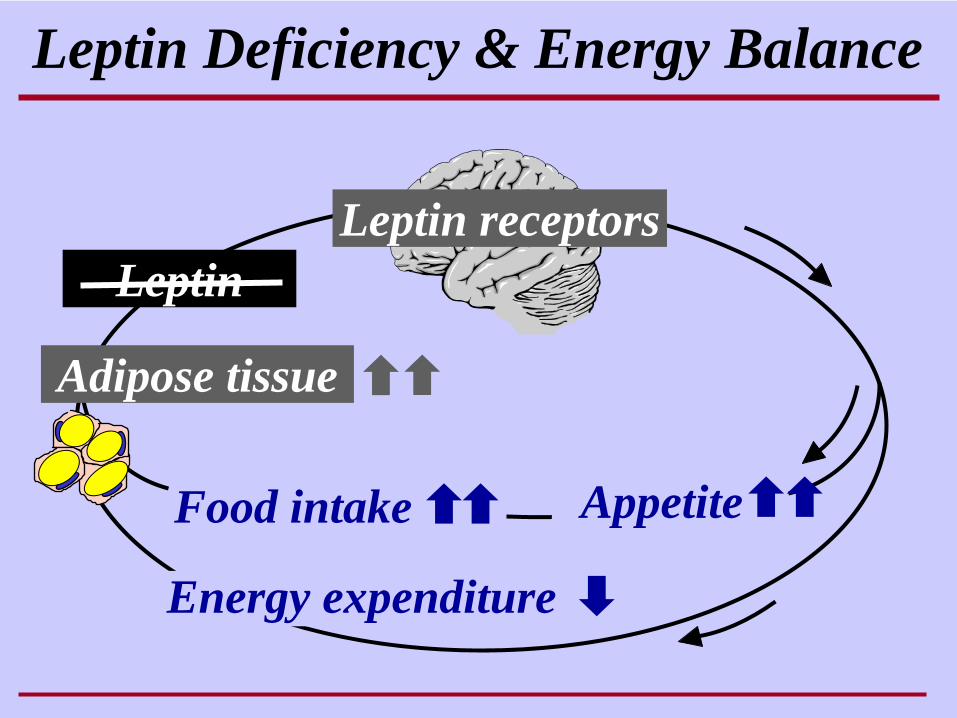
Leptin Deficiency & Energy Balance
Energy expenditure
Leptin receptors
Food intake
Adipose tissue
Appetite
Leptin
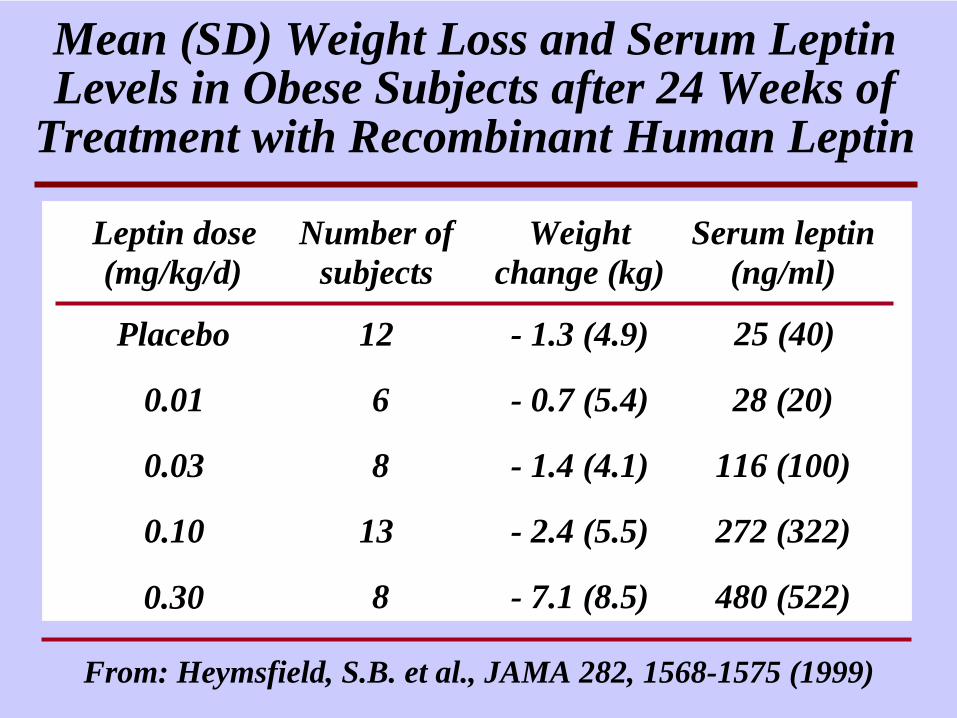
Mean (SD) Weight Loss and Serum Leptin Levels in Obese Subjects after 24 Weeks of
Treatment with Recombinant Human Leptin
Leptin dose(mg/kg/d)
Number ofsubjects
Weightchange (kg)
Serum leptin(ng/ml)
Placebo 12 - 1.3 (4.9) 25 (40)
0.01 6 - 0.7 (5.4) 28 (20)
0.03 8 - 1.4 (4.1) 116 (100)
0.10 13 - 2.4 (5.5) 272 (322)
0.30 8 - 7.1 (8.5) 480 (522)
From: Heymsfield, S.B. et al., JAMA 282, 1568-1575 (1999)
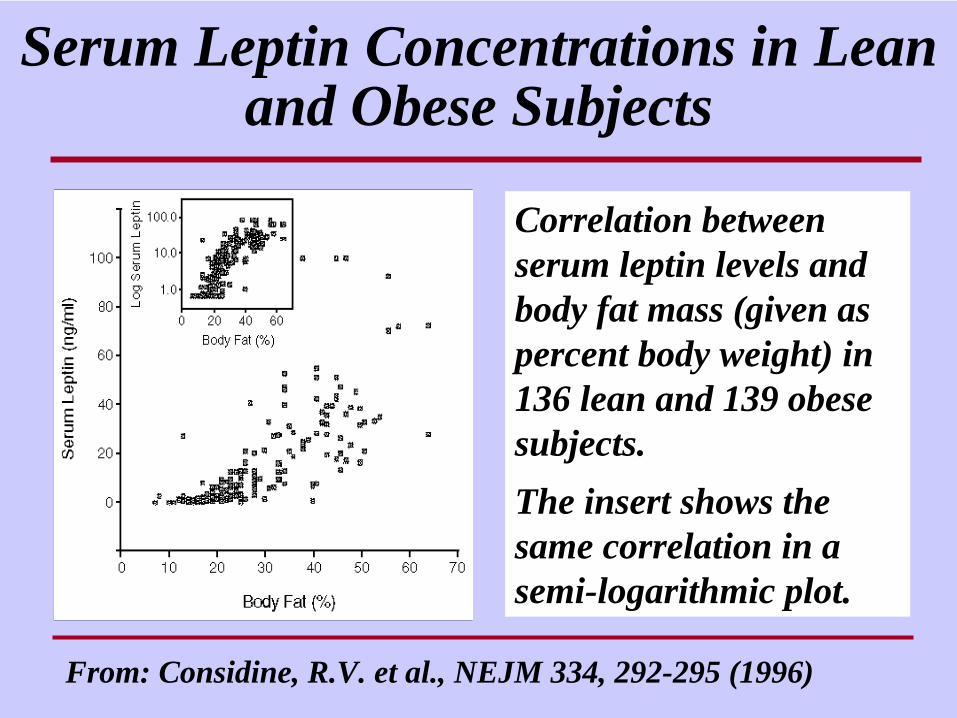
Correlation between serum leptin levels and body fat mass (given as percent body weight) in 136 lean and 139 obese subjects. The insert shows the same correlation in a semi-logarithmic plot.
Serum Leptin Concentrations in Lean and Obese Subjects
From: Considine, R.V. et al., NEJM 334, 292-295 (1996)
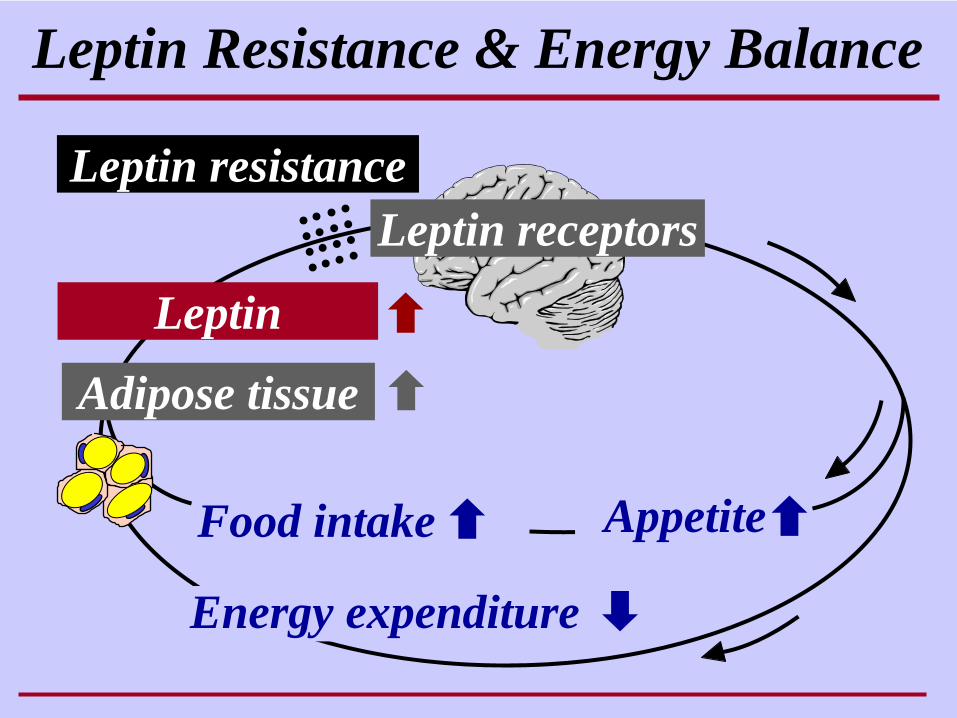
Leptin Resistance & Energy Balance
Energy expenditure
Food intake
Adipose tissue
Appetite
Leptin
Leptin resistanceLeptin receptors
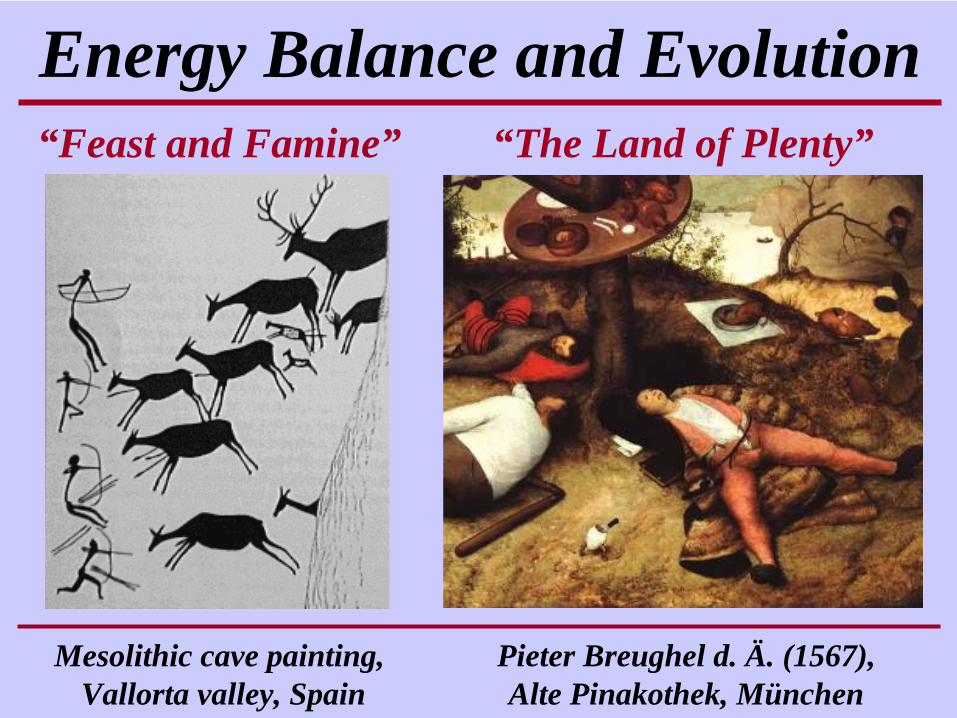
Mesolithic cave painting,Vallorta valley, Spain
Pieter Breughel d. Ä. (1567), Alte Pinakothek, München
Energy Balance and Evolution“Feast and Famine” “The Land of Plenty”
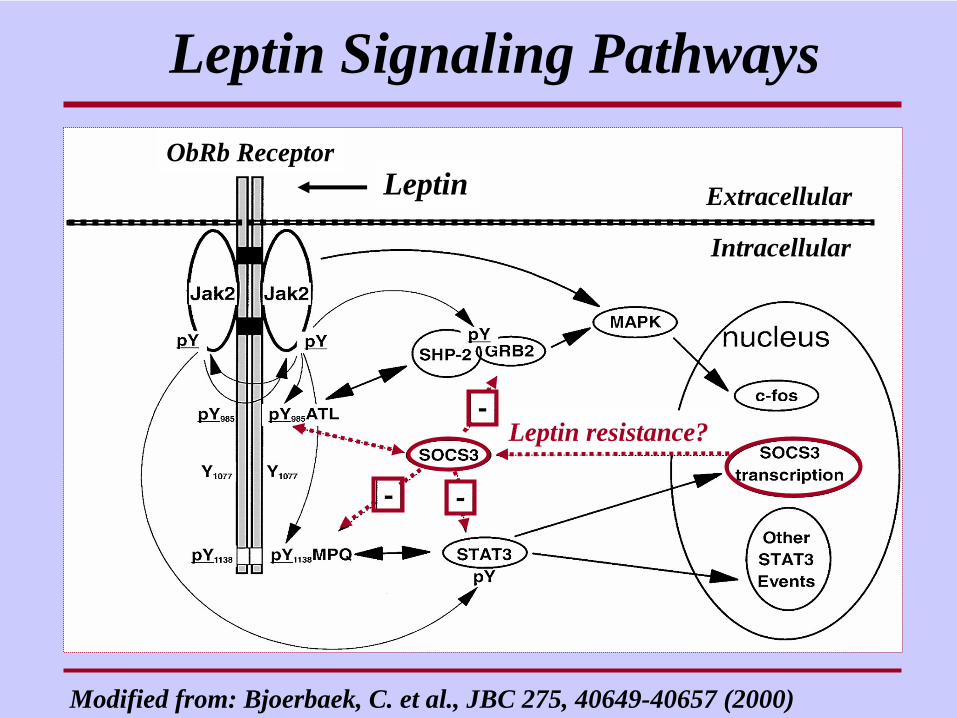
Leptin Signaling Pathways
Modified from: Bjoerbaek, C. et al., JBC 275, 40649-40657 (2000)
Extracellular
Intracellular
Leptin resistance?
ObRb ReceptorLeptin
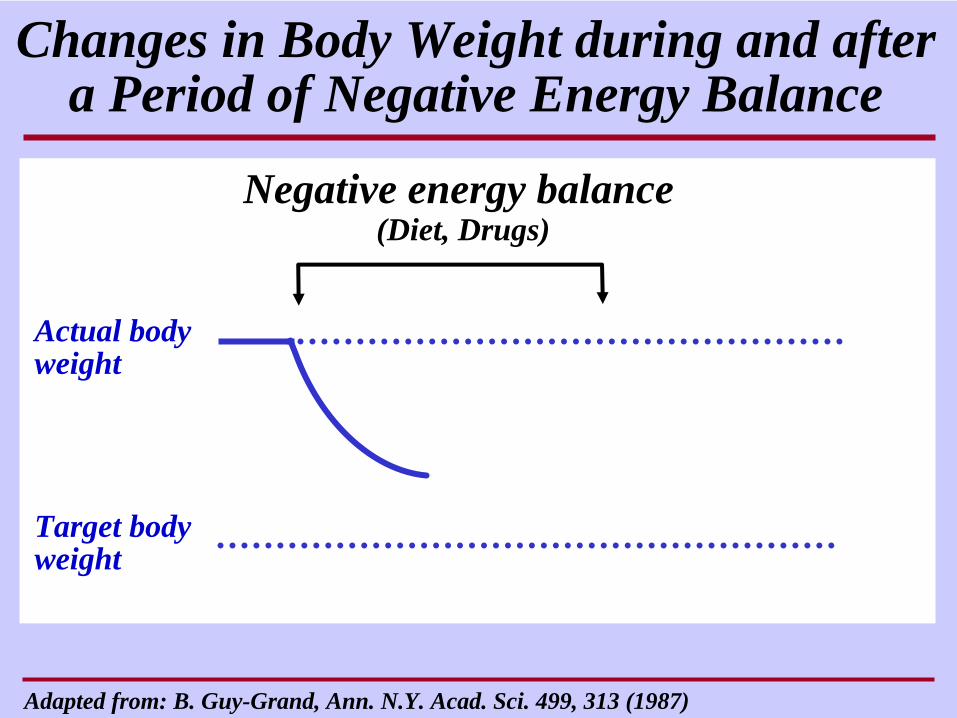
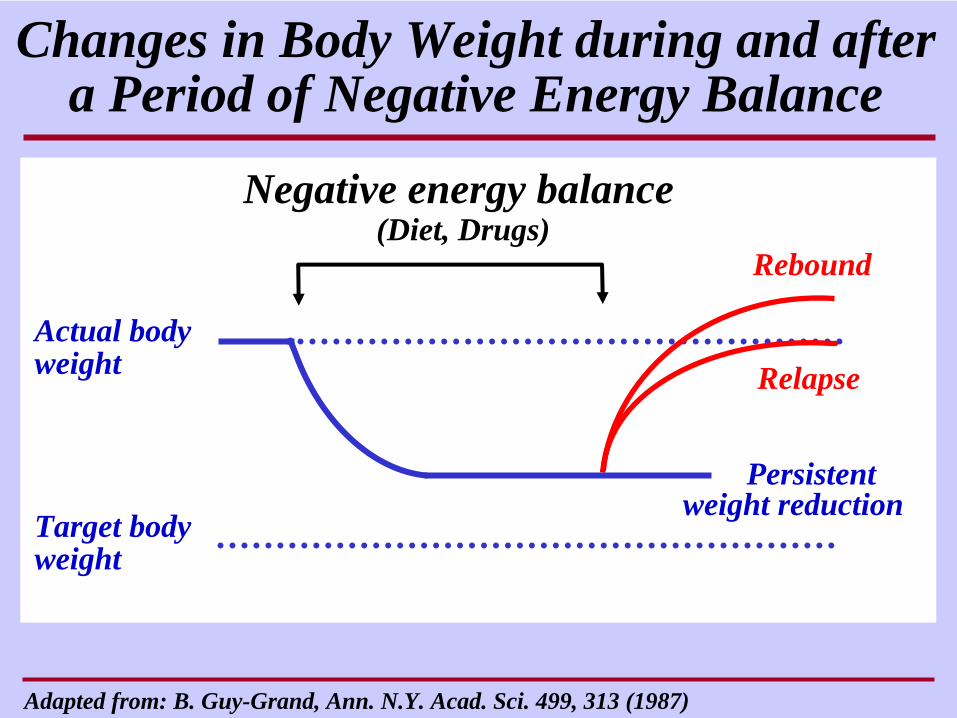
Actual body weight
Target body weight
Negative energy balance(Diet, Drugs)
Changes in Body Weight during and after a Period of Negative Energy Balance
Adapted from: B. Guy-Grand, Ann. N.Y. Acad. Sci. 499, 313 (1987)
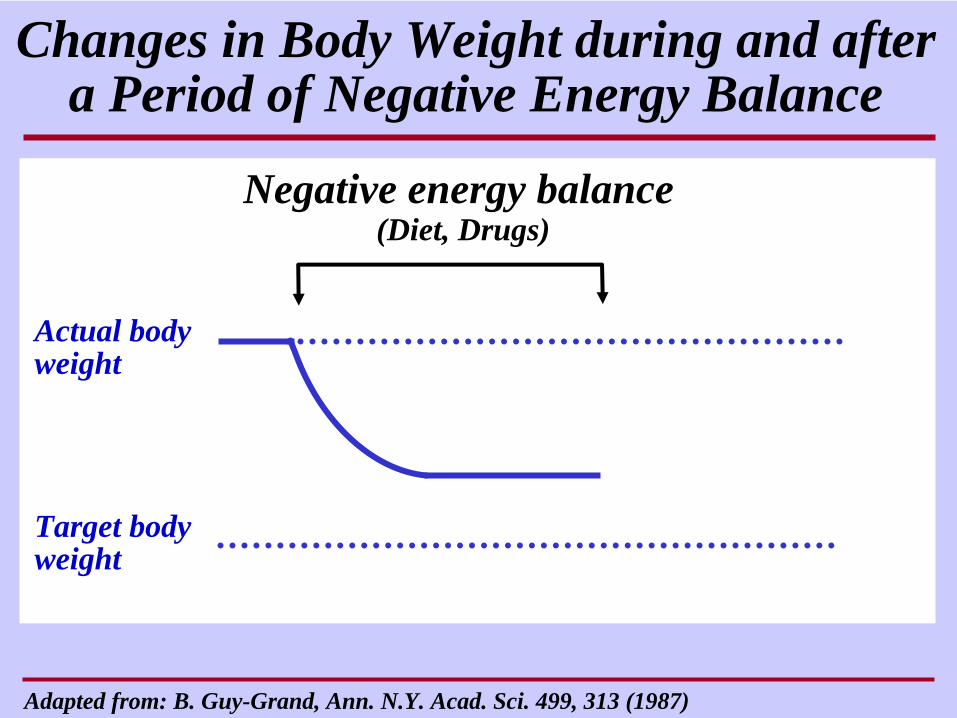
Actual body weight
Target body weight
Negative energy balance(Diet, Drugs)
Changes in Body Weight during and after a Period of Negative Energy Balance
Adapted from: B. Guy-Grand, Ann. N.Y. Acad. Sci. 499, 313 (1987)
Actual body weight
Target body weight
Persistent weight reduction
Negative energy balance(Diet, Drugs)
Relapse
Rebound
Changes in Body Weight during and after a Period of Negative Energy Balance
Adapted from: B. Guy-Grand, Ann. N.Y. Acad. Sci. 499, 313 (1987)
Actual body weight
Target body weight
Persistent weight reduction
Counterregulation
Negative energy balance(Diet, Drugs)
Relapse
Rebound
Changes in Body Weight during and after a Period of Negative Energy Balance
Adapted from: B. Guy-Grand, Ann. N.Y. Acad. Sci. 499, 313 (1987)
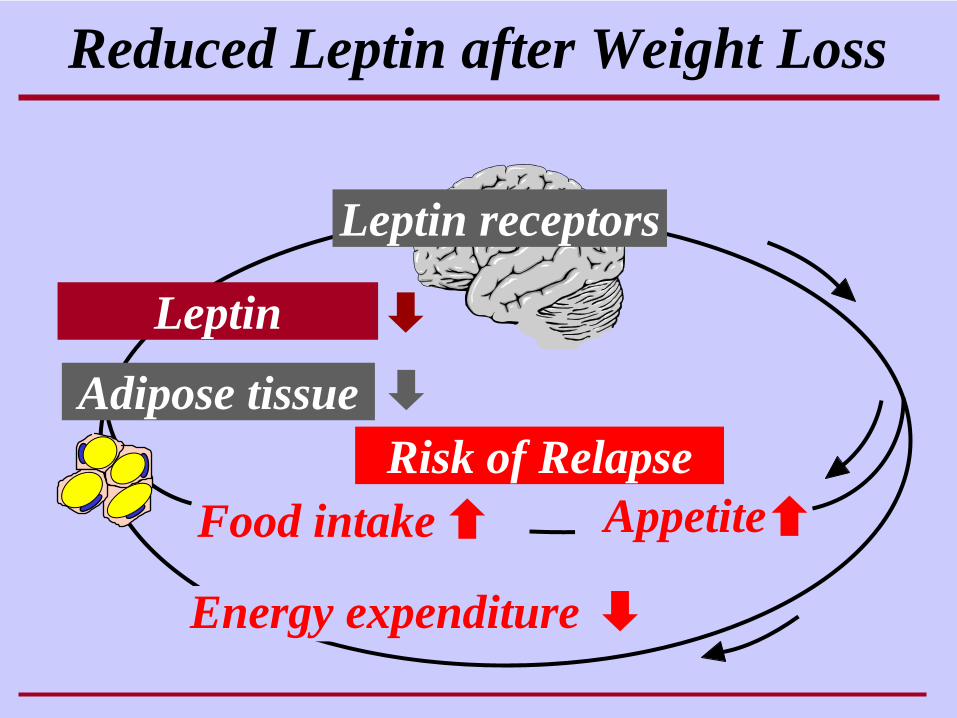
Reduced Leptin after Weight Loss
Energy expenditure
Food intake
Adipose tissue
Appetite
Leptin
Risk of Relapse
Leptin receptors
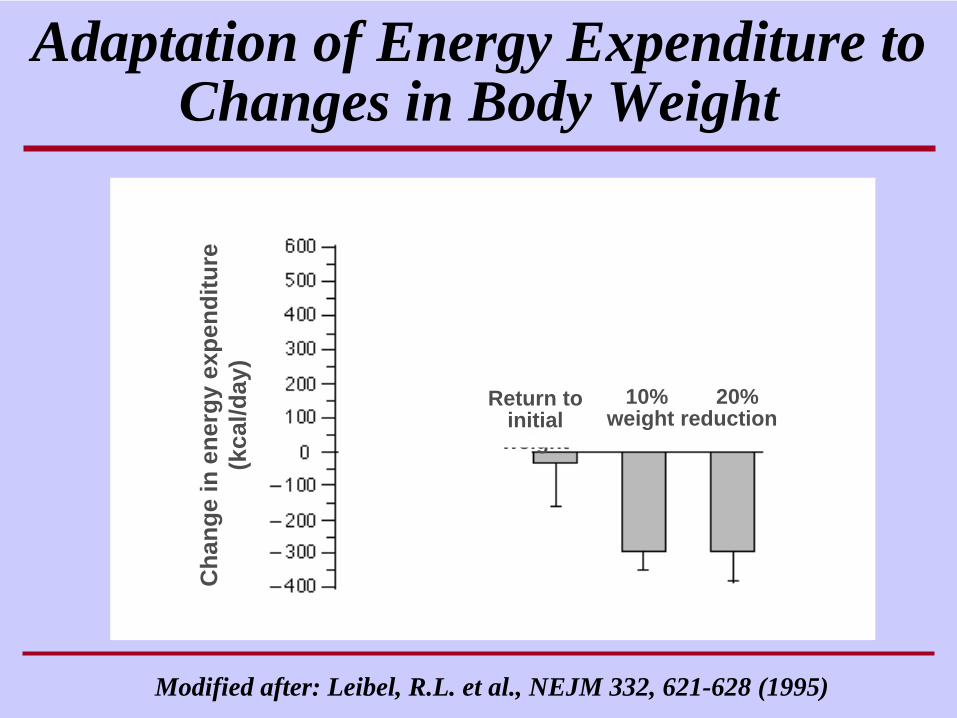
Adaptation of Energy Expenditure to Changes in Body Weight
Cha
nge
in e
nerg
yex
pend
iture
(kca
l/day
)
10% 20% weight reduction
10% Gewichts-zunahme
Modified after: Leibel, R.L. et al., NEJM 332, 621-628 (1995)
Return to initial weight
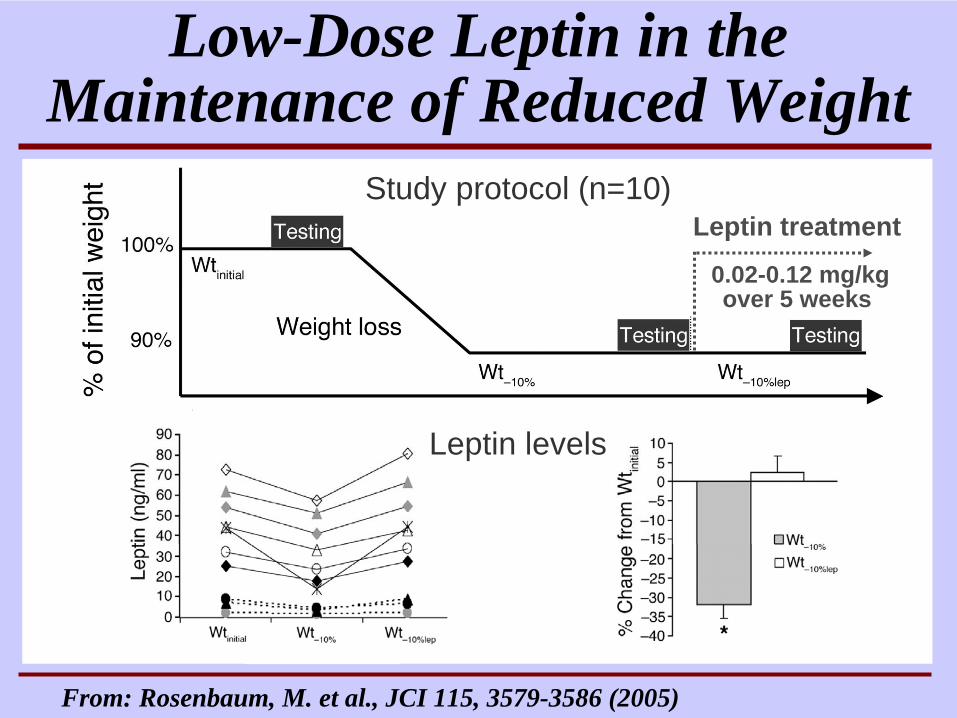
Study protocol (n=10)
Low-Dose Leptin in the Maintenance of Reduced Weight
From: Rosenbaum, M. et al., JCI 115, 3579-3586 (2005)
Leptin levels
Leptin treatment
0.02-0.12 mg/kg over 5 weeks
From: Rosenbaum, M. et al., JCI 115, 3579-3586 (2005)
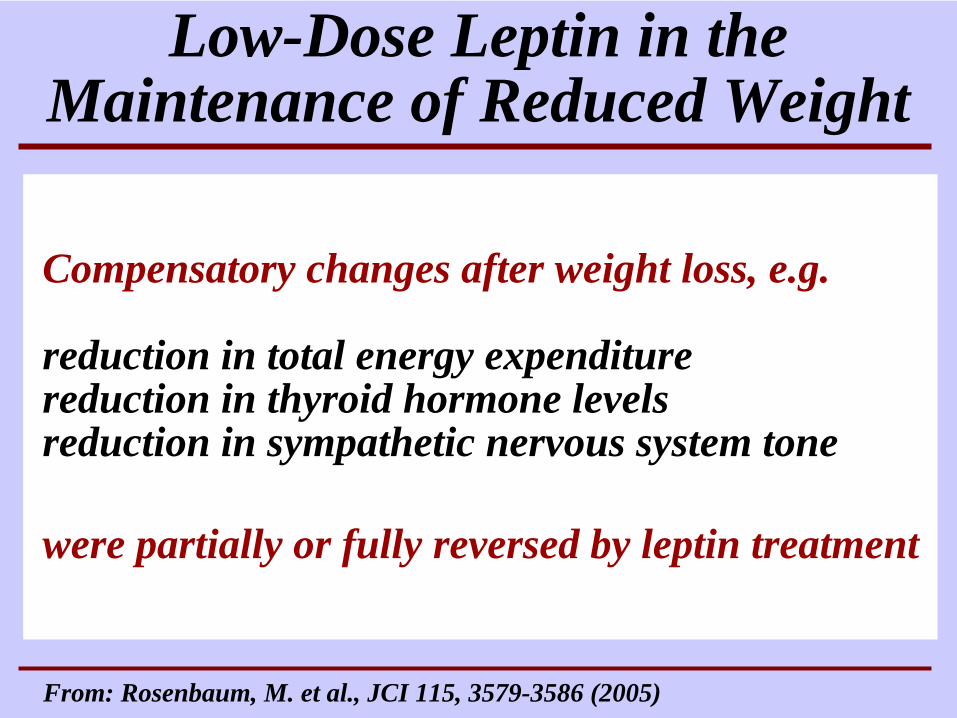
Compensatory changes after weight loss, e.g.
reduction in total energy expenditurereduction in thyroid hormone levelsreduction in sympathetic nervous system tone
were partially or fully reversed by leptin treatment
Low-Dose Leptin in the Maintenance of Reduced Weight
From: Rosenbaum, M. et al., JCI 115, 3579-3586 (2005)
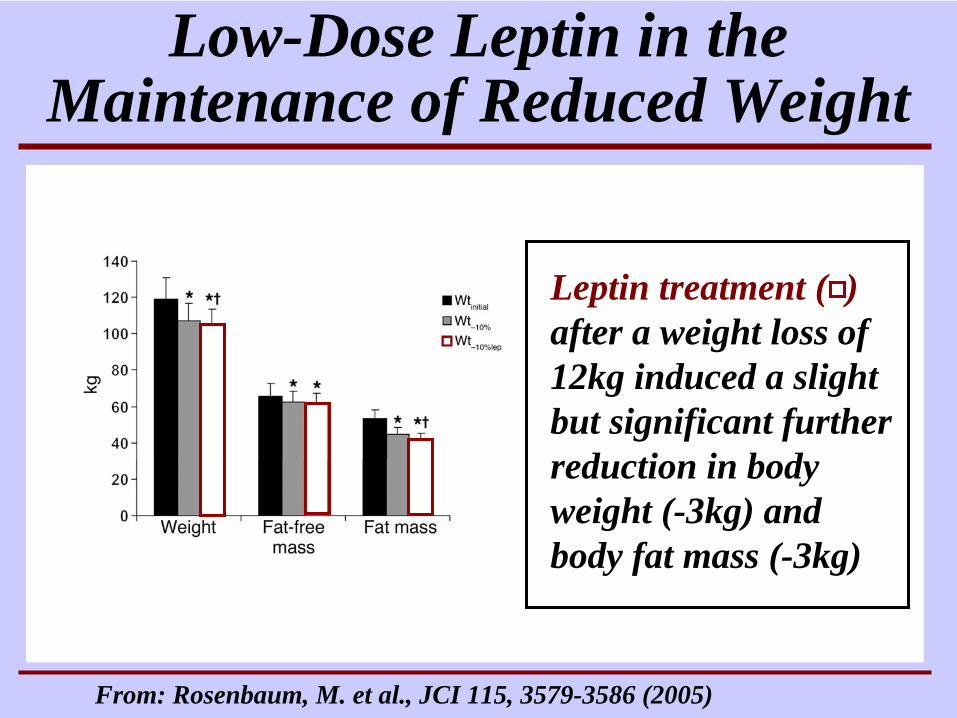
Low-Dose Leptin in the Maintenance of Reduced Weight
Leptin treatment ( )after a weight loss of 12kg induced a slight but significant further reduction in body weight (-3kg) and body fat mass (-3kg)
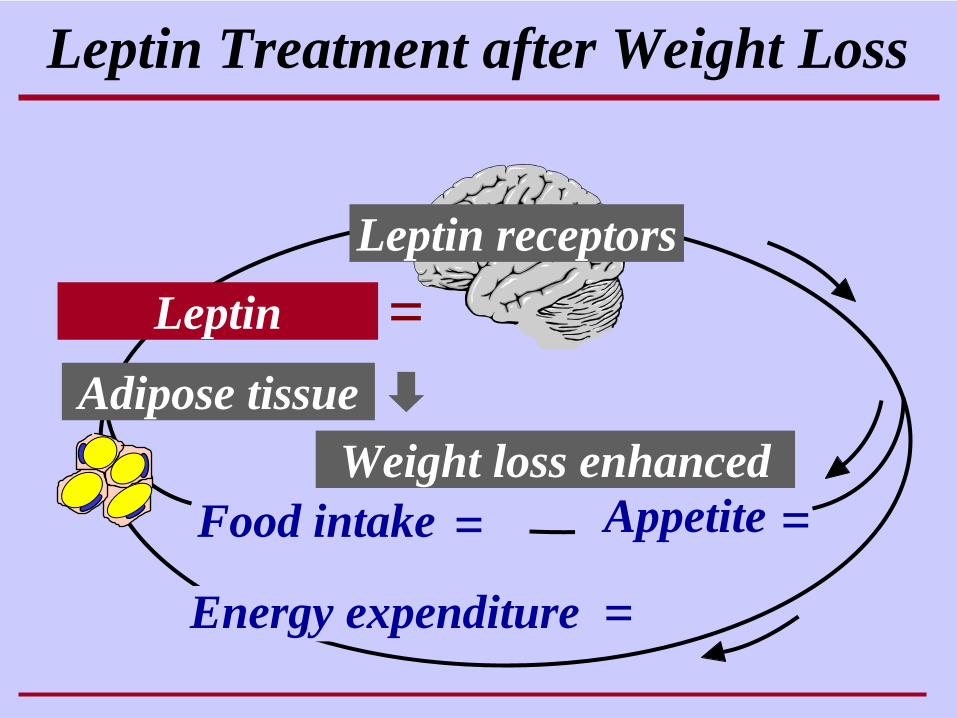
Leptin Treatment after Weight Loss
Energy expenditure
Food intake
Adipose tissue
Appetite
Leptin
Weight loss enhanced
=
= =
=
Leptin receptors
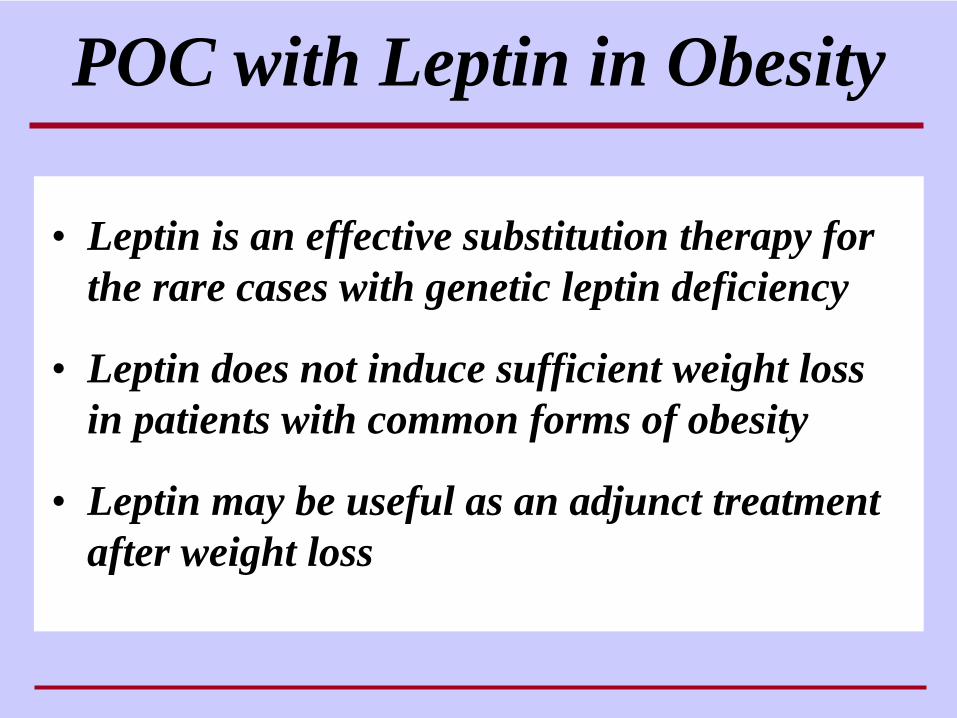
POC with Leptin in Obesity
• Leptin is an effective substitution therapy for the rare cases with genetic leptin deficiency
• Leptin does not induce sufficient weight loss in patients with common forms of obesity
• Leptin may be useful as an adjunct treatment after weight loss
Prof. Karl G. Hofbauer
Chair for Applied Pharmacology
Biozentrum / PharmazentrumUniversity of Basel
Zürich, 25.09.2007
Proof of Concept