Embed Size (px)
Citation preview
PROMOTING SUSTAINABLE STRATEGIES FOR A RESILIENT ASIA PACIFIC
Kareem Adel IsmailAndrew MunyaAlfian Afandy SyamAnindita MandalNur Azfahani AhmadMuhammad Farid Azizul Azizui Nur Huzeima Mohd Hussain

PROMOTING SUSTAINABLE STRATEGIES FOR A RESILIENT ASIA PACIFIC | i
This publication was produced by a group of PhD students from various backgrounds, at the School of Architecture and Planning, National Institute of Creative Arts and Industries (NICAI), The University of Auckland, New Zealand.
In this publication they share their experiences and research to develop an integrated vision promoting sustainable strategies towards a resilient Asia Pacific. This shared vision was exhibited in the World Urban Forum 6 - organised by the United Nations (UN) Habitat - which was held in Naples, Italy in September 2012.
Image Credits:
Kareem Adel IsmailAndrew MunyaAlfian Afandy SyamAnindita MandalNur Azfahani AhmadMuhammad Farid Azizul Azizui Nur Huzeima Mohd Hussain
Cover Credit Andrew Munya
Copyright 2012
Printed by Abc123
ISBN: 978-0-9922510-0-0
ISBN: 978-0-9922510-1-7
Promoting Sustainable Strategies for a Resilient Asia Pacific
ii | PROMOTING SUSTAINABLE STRATEGIES FOR A RESILIENT ASIA PACIFIC
Editors
Prof Dory Reeves
Dr Hugh Byrd
Dr Stephen Knight-Lenihan
Authors
Andrew MunyaKenya
Anindita MandalIndia
Nur Azfahani AhmadMalaysia
Nur Huzeima Mohd HussainMalaysia
Kareem Adel IsmailEgypt
Alfian Afandy SyamIndonesia
Muhammad Farid AzizulMalaysia
N.B: Countries mentioned below authors’ names refer to their nationalities not case study areas
EDITORIALS
PROMOTING SUSTAINABLE STRATEGIES FOR A RESILIENT ASIA PACIFIC | iii
CONTENTS
FOREWORD iv
ABOUT THE PROJECT vi
INTEGRATED APPROACH towards a resilient future of Asia Pacific: Linking three research modules vii
NEXUS 1 - Urbanisation: Urban Agriculture, Metabolism of a City, Transportation 1URBAN AGRICULTURE & URBAN GROWTH by ANDREW MUNYA 2
METABOLISM OF A CITY: Impacts of Density & Intensification by ANINDITA MANDAL 10
TRANSPORTATION SYSTEM by ALFIAN AFANDY SYAM 16
NEXUS 2 - De-urbanization: Land capacity & Society capability. Solar energy empowerment 23LAND CAPACITY & SOCIETY CAPABILITY by NUR HUZEIMA MOHD HUSSAIN 24
SOLAR ENERGY EMPOWERMENT: Towards resilient future of low-income groups in rural Malaysia by NUR AZFAHANI AHMAD 32
NEXUS 3 - Integration Linkages: Bio-regional Planning. Coastal Tourism Management 39BIO-REGIONAL PLANNING Bridging Sense of Place & Conservation by MUHAMMAD FARID AZIZUL 40
COASTAL TOURISM MANAGEMENT: Challenges and future sustainable approaches Case of Whitianga, by KAREEM ADEL ISMAIL 44
Conclusion - The Integrated Research 49

iv | PROMOTING SUSTAINABLE STRATEGIES FOR A RESILIENT ASIA PACIFIC
Ideas have always been changing our world, from the discovery of fire to the invention of computers and the internet. These ideas are created mainly in research centres and universities. We believe that as doctoral students and researchers in Architecture and Planning, we too can contribute towards creating a better world with emphases on equity, social justice and the preservation of our resources. To create more vibrant and humane built environments and to reach a balance between socio-economic growth and the necessity to conserve and preserve our natural environment and heritage, we need creative ideas and an approach based on resilience.
As PhD candidates at the University of Auckland (UoA), we want to “leave a mark”. Our teams consists of researchers from a variety of cultural and academic backgrounds with research aimed at solving different problems in the Asia-Pacific region based on the location of their case studies. The individual research topics range from urban agriculture, metabolism of cities, transportation systems to solar energy, rural development land use patterns, bio-regional planning and resilient coastal tourism development. Yet, all these research topics share a binding element. They all aspire to achieve sustainable development and promote resilience as the foundation for development.
With the help and guidance from our supervisors, we took the initiative to integrate our projects into three main modules. These discuss the future of the Asia-Pacific region and development for a more resilient future. The first module is based on urbanisation: how urban agriculture interfaces with urban growth and the implications thereof, how high densities affect the metabolism of communities and how transportation systems are affected by ethnic differences in cities. The second module has an emphasis on rural development: how usage of renewable energy sources like solar energy
and creative planning of land use could make rural areas more sustainable. The third and last module focuses on integration linkages: investigating the bio-regional planning concept and how it could affect our sense of place, and how our coastal tourism development could be more resilient to climate change threats.
Intending to present our work in an international arena, we held a sustainability exhibition in the sixth World Urban Forum held in Naples , Italy 1-7 September 2012. Having received encouraging feedback from visitors at the exhibition, we decided to take our project a step further by publishing this booklet in order to present our work to more researchers. We hope that our ideas will contribute towards making our world a more sustainable and resilient place.
The University of Auckland became a Habitat Partner University in 2008 and with the support of the University, delegations have attended World Urban Forum (WUF) 5 in Rio and WUF 6 in Naples. The UoA is committed to the sustainable urbanization objective and will be actively engaging in preparations for Habitat III in 2016.
Kareem Adel Ismail, Group Leader
FOREWORD
PROMOTING SUSTAINABLE STRATEGIES FOR A RESILIENT ASIA PACIFIC | v
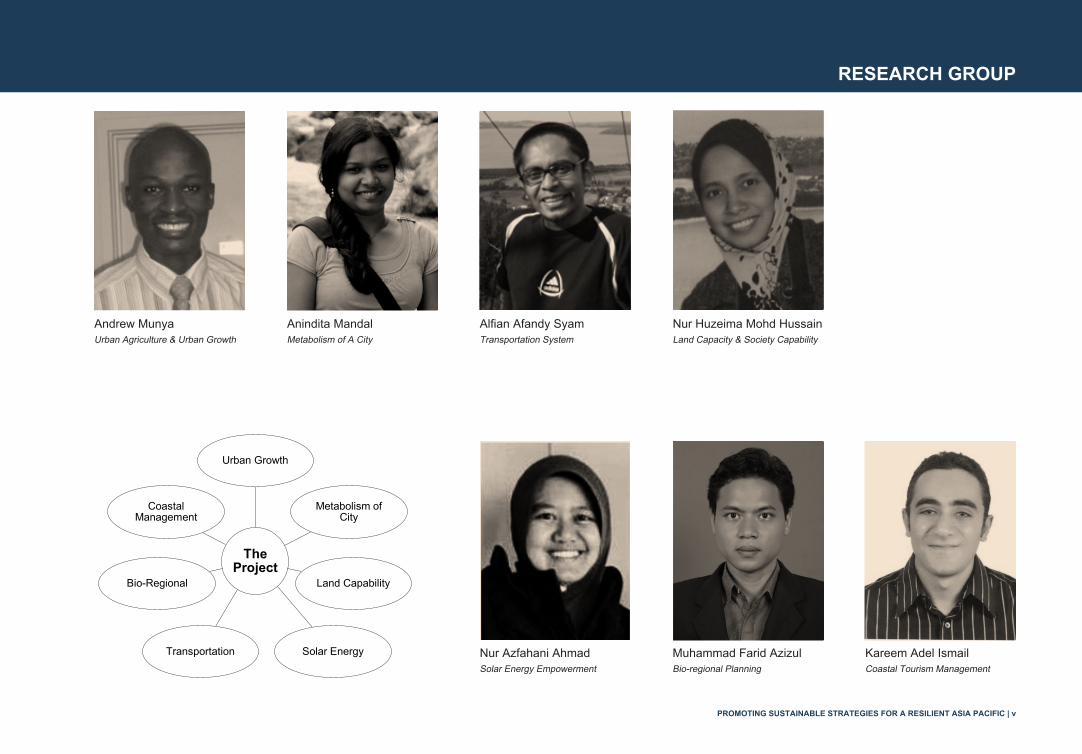
RESEARCH GROUP
Andrew MunyaUrban Agriculture & Urban Growth
Anindita MandalMetabolism of A City
Muhammad Farid AzizulBio-regional Planning
Nur Huzeima Mohd HussainLand Capacity & Society Capability
Nur Azfahani AhmadSolar Energy Empowerment
Kareem Adel IsmailCoastal Tourism Management
Alfian Afandy SyamTransportation System
The Project
Urban Growth
Metabolism of City
Land Capability
Solar EnergyTransportation
Bio-Regional
Coastal Management
vi | PROMOTING SUSTAINABLE STRATEGIES FOR A RESILIENT ASIA PACIFIC
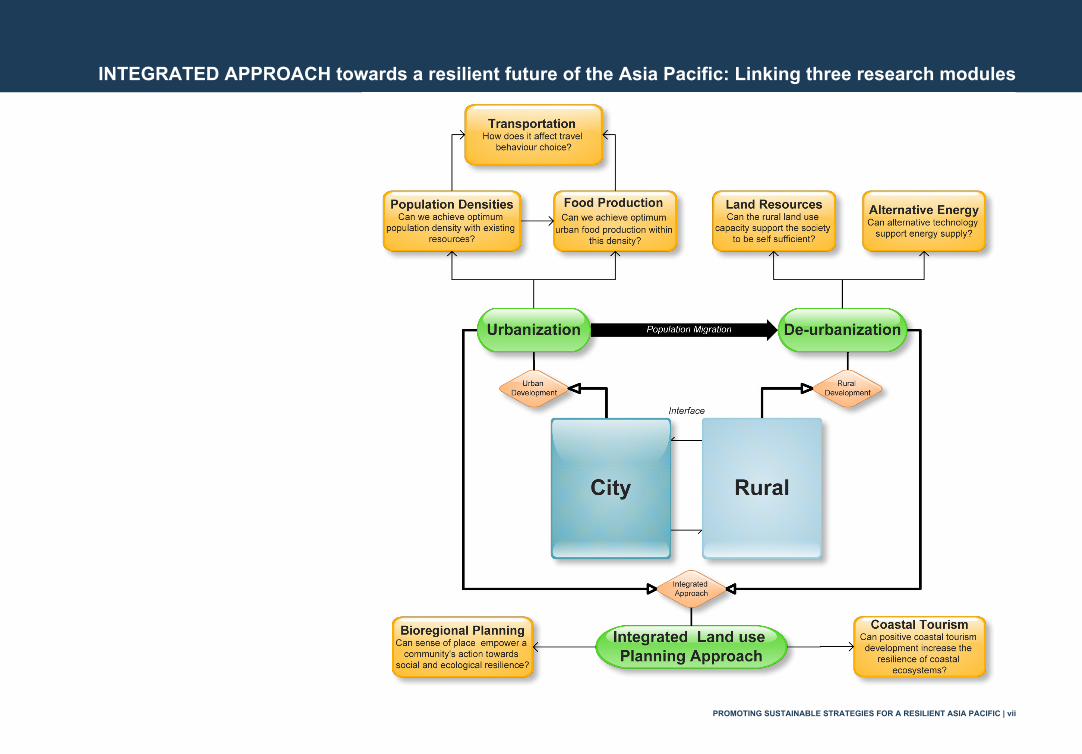
This project aims to promote an Integrated Approach to both urban, rural and coastal land use planning.
The objective is to advance alternative thinking in understanding the challenges of urbanisation and its impact on urban-rural and coastal relationships. Urban areas rely on their hinterland (both local and global) for deriving resources for their efficient functioning. Therefore any change that happens in urban areas eventually spills over to rural areas and consequently impacts our coastal environments. This project seeks to explore these inter-linkages compiled from on-going research in urban, rural and coastal case studies, the project explores new ways of analysis and tackling urbanisation and promoting resilience within the Asia-Pacific region.
This project presents an integrated approach to evaluating the challenges facing urbanization in association with increasing population and decreasing per capita availability of resources, through the identification of various issues like: food security, density and intensification, alternative energy, impact on rural land resources, ecosystem planning and coastal tourism management. Three overarching links have been identified as:
(i) current urbanisation trends;
(ii) possibility of de-urbanisation; and
(iii) the need for integrating coastal land uses and ecosystems to create a sense of place for all.
The following questions are used to guide the project. Can existing resources support increasing intensification and density? What is the potential for food production within this intensification and density? How will travel behaviour choices be affected? In the event of de-urbanization; Can rural land use capacity support an influx of urban immigrants? How can
alternative technology in rural areas support energy supply? Can the bio-regional planning bridge conservation and sense of place in coastal areas? How resilient is coastal tourism development?
The following chapters discuss in detail these research questions and provide a brief outline of the proposed strategies and methods used to answer these questions. Considering that our research is work-in-progress and at various stages of development. It was therefore very difficult to draw specific conclusions or recommend solutions. This integrated approach is our first step towards developing both local and global understanding of some of the real challenges facing Asia-Pacific region.
ABOUT THE PROJECT
PROMOTING SUSTAINABLE STRATEGIES FOR A RESILIENT ASIA PACIFIC | vii
INTEGRATED APPROACH towards a resilient future of the Asia Pacific: Linking three research modules

NEXUS 1 - Urbanisation: Urban Agriculture, Metabolism of a City, Transportation
2 | PROMOTING SUSTAINABLE STRATEGIES FOR A RESILIENT ASIA PACIFIC
URBAN AGRICULTURE & URBAN GROWTH by ANDREW MUNYA
This proposal focuses on the relationship between urban indicators (net density and housing patterns) and potential solar energy available at ground level for urban agriculture, soil fertility (nutrient recycling) and water availability to determine the urban food production potential.
1.0 Introduction
Urban agriculture in developing and developed nations has assumed two contrasting narratives: as a survival strategy in the former for the urban poor (Mougeot, 2005) and as a link between the urban and the rural (Schans, 2010) in the later. Urban agriculture is thus redefining the traditional way in which cities have been laid out, the way they work and consequently the urban form (Mougeot, 2006).
This calls for a closer examination of the relationship between urban food production and current growth strategies particularly in developed nations like New Zealand which have adopted the concept of the “Compact City”. Additionally the vulnerability of New Zealand agriculture to climate change and peak oil raises critical questions concerning Auckland’s growth expansion strategies.
2.0 Aim
The overall aim of this research is how changes in attitude and policy direction can be used to achieve two overarching goals:
(i) Retrofitting suburbia to accommodate urban food production; and
(ii) Considering future growth through green fields; how can cities expand and grow food simultaneously.
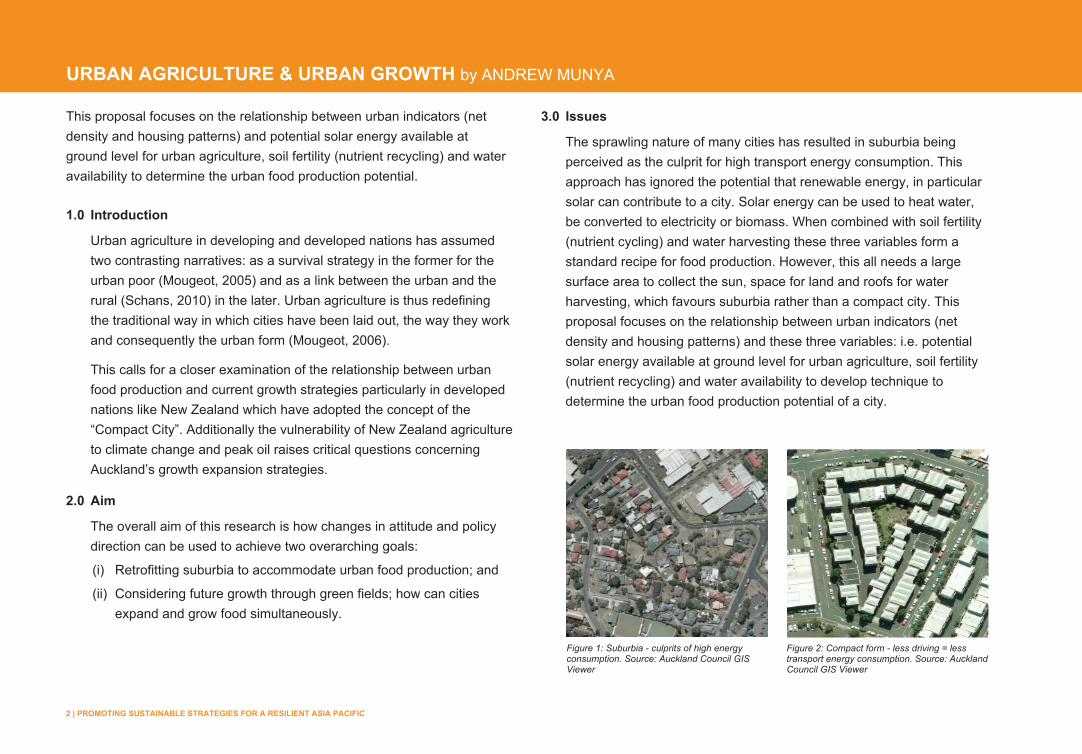
3.0 Issues
The sprawling nature of many cities has resulted in suburbia being perceived as the culprit for high transport energy consumption. This approach has ignored the potential that renewable energy, in particular solar can contribute to a city. Solar energy can be used to heat water, be converted to electricity or biomass. When combined with soil fertility (nutrient cycling) and water harvesting these three variables form a standard recipe for food production. However, this all needs a large surface area to collect the sun, space for land and roofs for water harvesting, which favours suburbia rather than a compact city. This proposal focuses on the relationship between urban indicators (net density and housing patterns) and these three variables: i.e. potential solar energy available at ground level for urban agriculture, soil fertility (nutrient recycling) and water availability to develop technique to determine the urban food production potential of a city.
Figure 1: Suburbia - culprits of high energy consumption. Source: Auckland Council GIS Viewer
Figure 2: Compact form - less driving = less transport energy consumption. Source: Auckland Council GIS Viewer
PROMOTING SUSTAINABLE STRATEGIES FOR A RESILIENT ASIA PACIFIC | 3
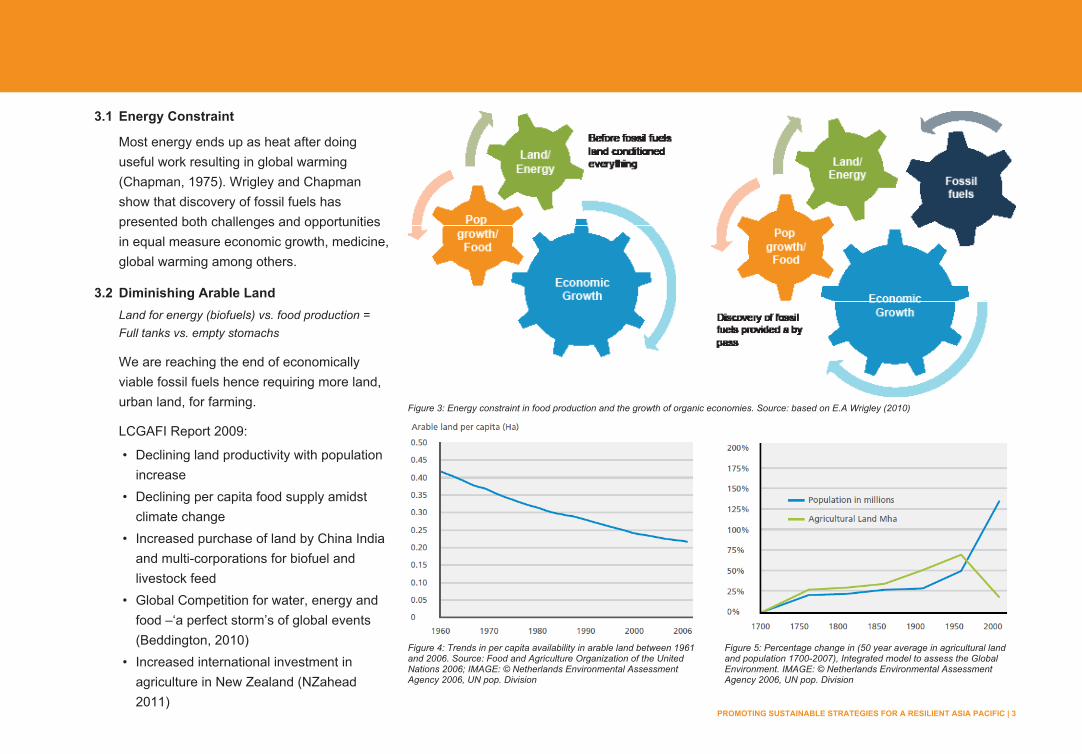
3.1 Energy Constraint
Most energy ends up as heat after doing useful work resulting in global warming (Chapman, 1975). Wrigley and Chapman show that discovery of fossil fuels has presented both challenges and opportunities in equal measure economic growth, medicine, global warming among others.
3.2 Diminishing Arable LandLand for energy (biofuels) vs. food production = Full tanks vs. empty stomachs
We are reaching the end of economically viable fossil fuels hence requiring more land, urban land, for farming.
LCGAFI Report 2009:
• Declining land productivity with population increase
• Declining per capita food supply amidst climate change
• Increased purchase of land by China India and multi-corporations for biofuel and livestock feed
• Global Competition for water, energy and food –‘a perfect storm’s of global events (Beddington, 2010)
• Increased international investment in agriculture in New Zealand (NZahead 2011)
Figure 3: Energy constraint in food production and the growth of organic economies. Source: based on E.A Wrigley (2010)
Figure 4: Trends in per capita availability in arable land between 1961 and 2006. Source: Food and Agriculture Organization of the United Nations 2006; IMAGE: © Netherlands Environmental Assessment Agency 2006, UN pop. Division
Figure 5: Percentage change in (50 year average in agricultural land and population 1700-2007), Integrated model to assess the Global Environment. IMAGE: © Netherlands Environmental Assessment Agency 2006, UN pop. Division

4 | PROMOTING SUSTAINABLE STRATEGIES FOR A RESILIENT ASIA PACIFIC
4.0 The New Zealand Context
Auckland’s temperatures are likely to increase from the current 1.0°C to 2.8°C with a 10 per cent reduction in rainfall by the year 2080 (NIWA,2008). The negative effects of these increases will be the scarcity of water and how to prioritise its use. For instance how much of it will be allocated to hydro-power generation rather than irrigation for food production given the projected rainfall decreases in eastern regions of Hawke’s Bay, Gisborne ,Canterbury, Wairapapa and Malborough which are the traditional food baskets of New Zealand.
Currently New Zealand has a water-footprint of 1589m3 per year which is almost 15 per cent more than the 1385m3 per year global average. Its external water-footprint is 57.7 per cent of its total water-footprint. This means that most of the goods and services consumed in New Zealand rely heavily on water generated outside the country. Oram
(2007) quoting Williams (2004) suggests that strong evidence points to the fact that New Zealand waterways and lakes are becoming nutrient enriched and degraded from nitrogen, animal faecal matter and eroded sediment. This not only becomes costly in water treatment domestically but also international markets in Asia and Europe may not want products sourced from farms that are environmentally unfriendly.
5.0 Precedent Study - Auckland, New Zealand
A preliminary study by Munya, Byrd and Haarhoff (2012) has ruled out the potential for food production (vegetables only) in high density suburbs unless rooftop gardening is considered. This study compared three residential blocks in high, medium and low density suburbs of increasing density from the city centre (Fig 1). The study concluded that medium to low density have the potential for food production. The Selection of the case studies was based on a previous study on
Figure 6: NZ temperature predictions to the 2080s. Source: NIWA, 2008 Figure 7: NZ rainfall predictions to the 2080s. Source: NIWA, 2008
PROMOTING SUSTAINABLE STRATEGIES FOR A RESILIENT ASIA PACIFIC | 5
transport and energy and how renewable energy can reverse the curve (Ho and Byrd 2012). This study determined that the case studies were representative of Auckland suburbs.
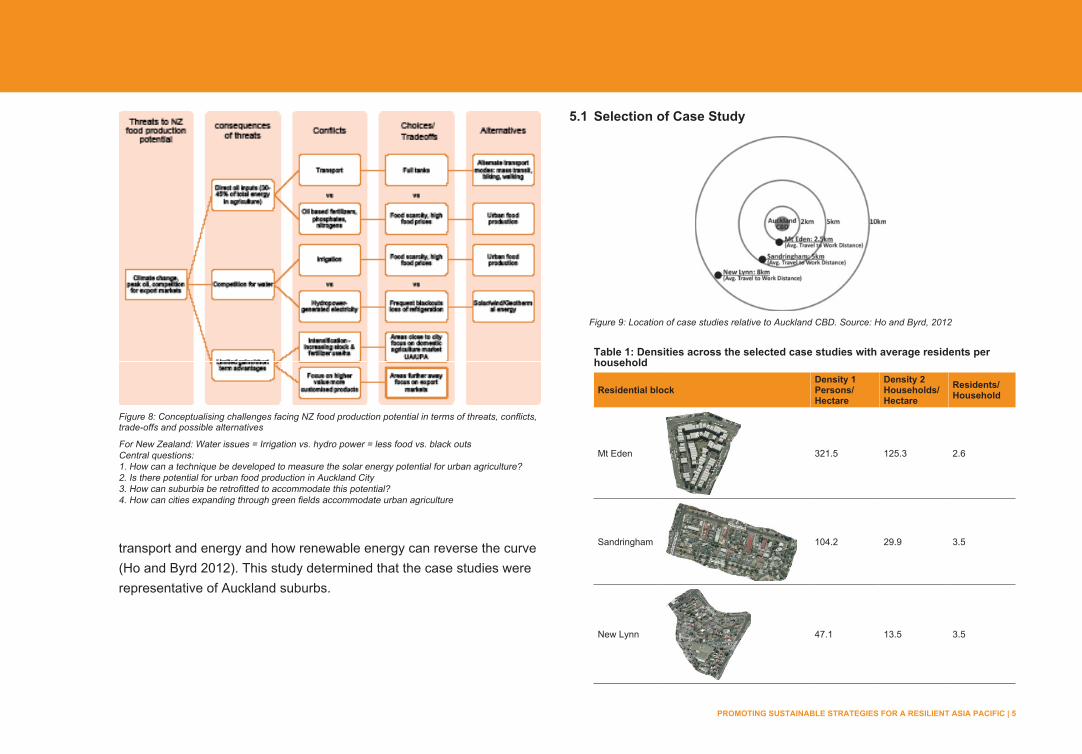
5.1 Selection of Case Study
Table 1: Densities across the selected case studies with average residents per household
Residential blockDensity 1Persons/ Hectare
Density 2Households/Hectare
Residents/Household
Mt Eden 321.5 125.3 2.6
Sandringham 104.2 29.9 3.5
New Lynn 47.1 13.5 3.5
Figure 9: Location of case studies relative to Auckland CBD. Source: Ho and Byrd, 2012
Figure 8: Conceptualising challenges facing NZ food production potential in terms of threats, conflicts, trade-offs and possible alternatives
For New Zealand: Water issues = Irrigation vs. hydro power = less food vs. black outsCentral questions:1. How can a technique be developed to measure the solar energy potential for urban agriculture? 2. Is there potential for urban food production in Auckland City3. How can suburbia be retrofitted to accommodate this potential?4. How can cities expanding through green fields accommodate urban agriculture
6 | PROMOTING SUSTAINABLE STRATEGIES FOR A RESILIENT ASIA PACIFIC
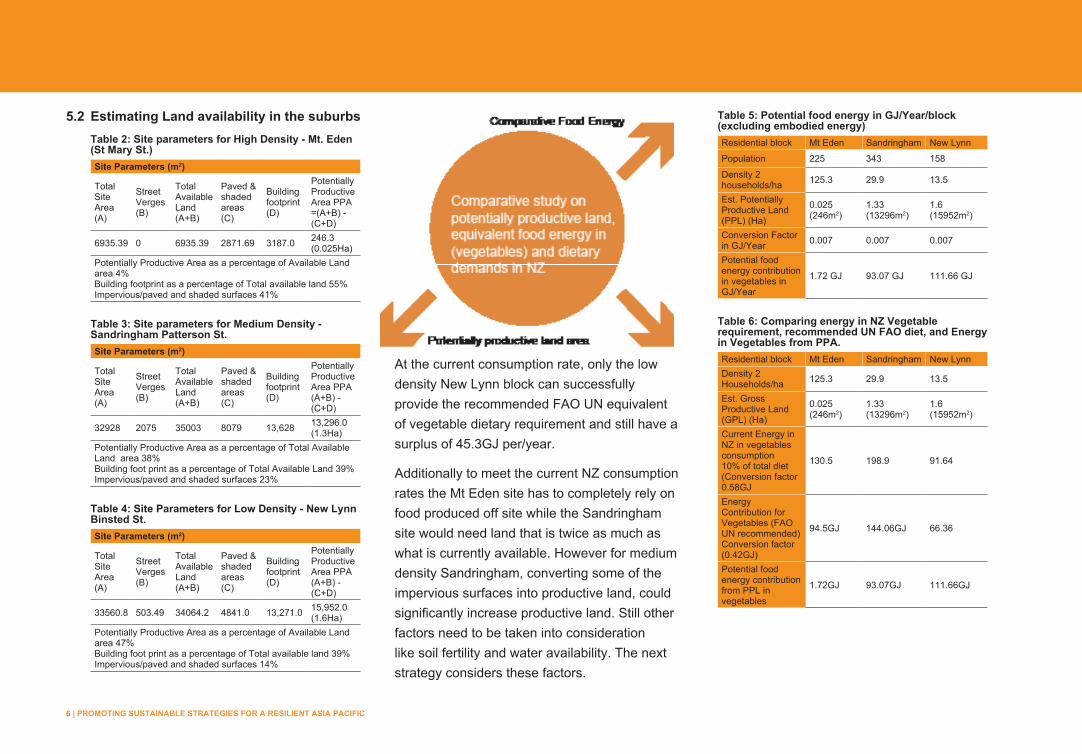
5.2 Estimating Land availability in the suburbsTable 2: Site parameters for High Density - Mt. Eden (St Mary St.)Site Parameters (m2)
Total Site Area (A)
Street Verges (B)
Total Available Land (A+B)
Paved & shaded areas (C)
Building footprint (D)
Potentially Productive Area PPA =(A+B) - (C+D)
6935.39 0 6935.39 2871.69 3187.0 246.3 (0.025Ha)
Potentially Productive Area as a percentage of Available Land area 4%Building footprint as a percentage of Total available land 55%Impervious/paved and shaded surfaces 41%
Table 3: Site parameters for Medium Density - Sandringham Patterson St.Site Parameters (m2)
Total Site Area (A)
Street Verges (B)
Total Available Land (A+B)
Paved & shaded areas (C)
Building footprint (D)
Potentially Productive Area PPA (A+B) - (C+D)
32928 2075 35003 8079 13,628 13,296.0 (1.3Ha)
Potentially Productive Area as a percentage of Total Available Land area 38%Building foot print as a percentage of Total Available Land 39%Impervious/paved and shaded surfaces 23%
Table 4: Site Parameters for Low Density - New Lynn Binsted St.Site Parameters (m2)
Total Site Area (A)
Street Verges (B)
Total Available Land (A+B)
Paved & shaded areas (C)
Building footprint (D)
Potentially Productive Area PPA (A+B) - (C+D)
33560.8 503.49 34064.2 4841.0 13,271.0 15,952.0 (1.6Ha)
Potentially Productive Area as a percentage of Available Land area 47%Building foot print as a percentage of Total available land 39%Impervious/paved and shaded surfaces 14%
At the current consumption rate, only the low density New Lynn block can successfully provide the recommended FAO UN equivalent of vegetable dietary requirement and still have a surplus of 45.3GJ per/year.
Additionally to meet the current NZ consumption rates the Mt Eden site has to completely rely on food produced off site while the Sandringham site would need land that is twice as much as what is currently available. However for medium density Sandringham, converting some of the impervious surfaces into productive land, could significantly increase productive land. Still other factors need to be taken into consideration like soil fertility and water availability. The next strategy considers these factors.
Table 5: Potential food energy in GJ/Year/block (excluding embodied energy)Residential block Mt Eden Sandringham New Lynn
Population 225 343 158
Density 2 households/ha 125.3 29.9 13.5
Est. Potentially Productive Land (PPL) (Ha)
0.025 (246m2)
1.33 (13296m2)
1.6 (15952m2)
Conversion Factor in GJ/Year 0.007 0.007 0.007
Potential food energy contribution in vegetables in GJ/Year
1.72 GJ 93.07 GJ 111.66 GJ
Table 6: Comparing energy in NZ Vegetable requirement, recommended UN FAO diet, and Energy in Vegetables from PPA.Residential block Mt Eden Sandringham New LynnDensity 2 Households/ha 125.3 29.9 13.5
Est. Gross Productive Land (GPL) (Ha)
0.025 (246m2)
1.33 (13296m2)
1.6 (15952m2)
Current Energy in NZ in vegetables consumption 10% of total diet (Conversion factor 0.58GJ
130.5 198.9 91.64
Energy Contribution for Vegetables (FAO UN recommended) Conversion factor (0.42GJ)
94.5GJ 144.06GJ 66.36
Potential food energy contribution from PPL in vegetables
1.72GJ 93.07GJ 111.66GJ
PROMOTING SUSTAINABLE STRATEGIES FOR A RESILIENT ASIA PACIFIC | 7
6.0 Strategy
Food production requires solar energy, soil nutrients and water. Techniques to determine soil fertility and water availability are determined. A technique to measure the solar energy potential for urban agriculture is also developed using selected CAD enabled solar analysis software and simple mathematical methods. The outputs from the above three techniques are combined and used to determine the urban food production potential for Auckland using these two case studies as samples.
STEP 1 Determine the availability of land and the solar access to ground level in the selected case studies (solar access is determined using solar analysis CAD software - Ecotech Analysis)
STEP 2 Establish the soil fertility levels of the identified area that has solar access using random soil sampling techniques and literature review on soil characteristics.
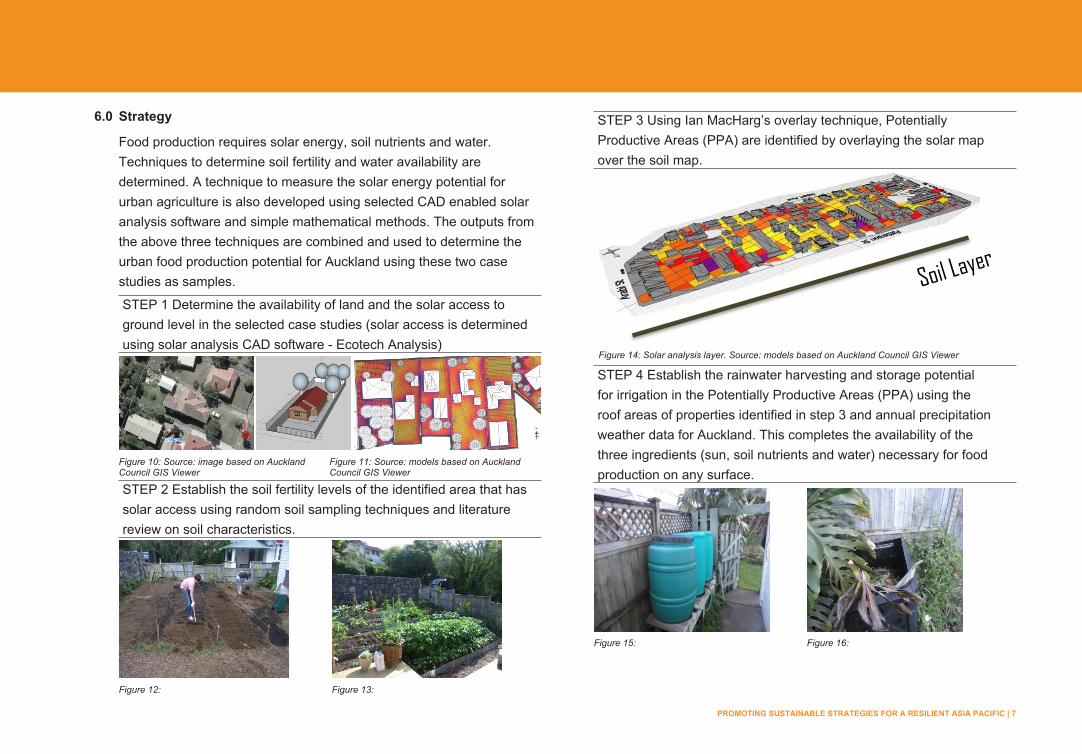
STEP 3 Using Ian MacHarg’s overlay technique, Potentially Productive Areas (PPA) are identified by overlaying the solar map over the soil map.
STEP 4 Establish the rainwater harvesting and storage potential for irrigation in the Potentially Productive Areas (PPA) using the roof areas of properties identified in step 3 and annual precipitation weather data for Auckland. This completes the availability of the three ingredients (sun, soil nutrients and water) necessary for food production on any surface.
Figure 11: Source: models based on Auckland Council GIS Viewer
Figure 12: Figure 13:
Figure 14: Solar analysis layer. Source: models based on Auckland Council GIS Viewer
Figure 10: Source: image based on Auckland Council GIS Viewer
Figure 15: Figure 16:
8 | PROMOTING SUSTAINABLE STRATEGIES FOR A RESILIENT ASIA PACIFIC
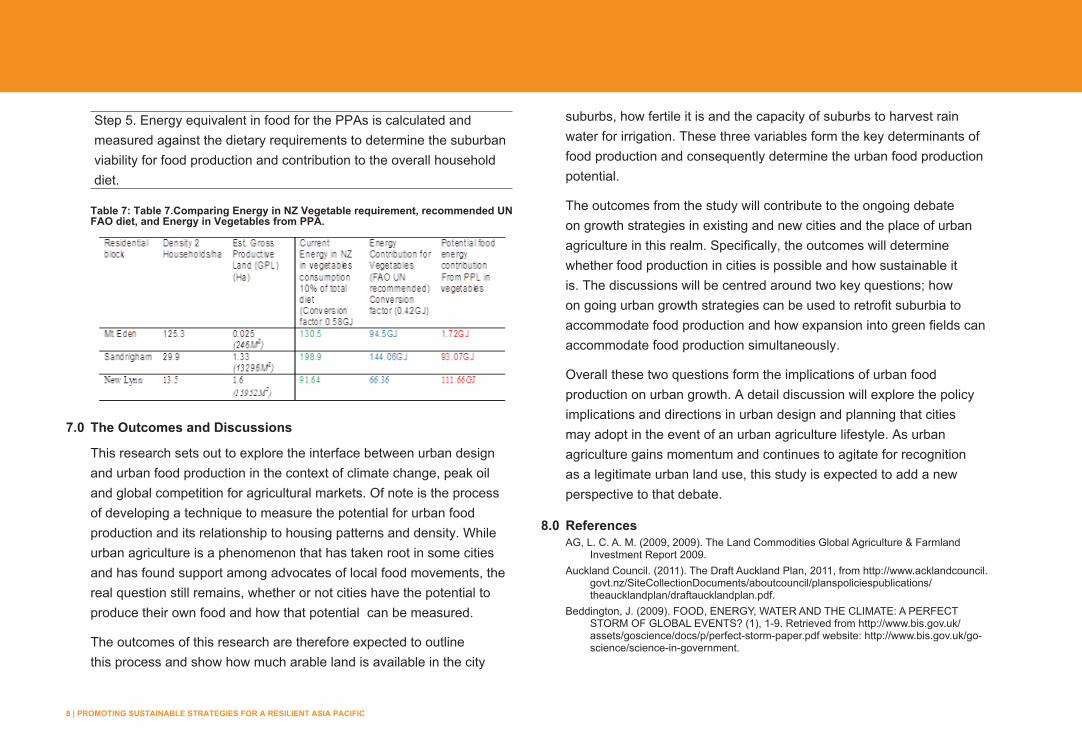
Step 5. Energy equivalent in food for the PPAs is calculated and measured against the dietary requirements to determine the suburban viability for food production and contribution to the overall household diet.
Table 7: Table 7.Comparing Energy in NZ Vegetable requirement, recommended UN FAO diet, and Energy in Vegetables from PPA.
7.0 The Outcomes and Discussions
This research sets out to explore the interface between urban design and urban food production in the context of climate change, peak oil and global competition for agricultural markets. Of note is the process of developing a technique to measure the potential for urban food production and its relationship to housing patterns and density. While urban agriculture is a phenomenon that has taken root in some cities and has found support among advocates of local food movements, the real question still remains, whether or not cities have the potential to produce their own food and how that potential can be measured.
The outcomes of this research are therefore expected to outline this process and show how much arable land is available in the city
suburbs, how fertile it is and the capacity of suburbs to harvest rain water for irrigation. These three variables form the key determinants of food production and consequently determine the urban food production potential.
The outcomes from the study will contribute to the ongoing debate on growth strategies in existing and new cities and the place of urban agriculture in this realm. Specifically, the outcomes will determine whether food production in cities is possible and how sustainable it is. The discussions will be centred around two key questions; how on going urban growth strategies can be used to retrofit suburbia to accommodate food production and how expansion into green fields can accommodate food production simultaneously.
Overall these two questions form the implications of urban food production on urban growth. A detail discussion will explore the policy implications and directions in urban design and planning that cities may adopt in the event of an urban agriculture lifestyle. As urban agriculture gains momentum and continues to agitate for recognition as a legitimate urban land use, this study is expected to add a new perspective to that debate.
8.0 ReferencesAG, L. C. A. M. (2009, 2009). The Land Commodities Global Agriculture & Farmland
Investment Report 2009.Auckland Council. (2011). The Draft Auckland Plan, 2011, from http://www.acklandcouncil.
govt.nz/SiteCollectionDocuments/aboutcouncil/planspoliciespublications/theaucklandplan/draftaucklandplan.pdf.
Beddington, J. (2009). FOOD, ENERGY, WATER AND THE CLIMATE: A PERFECT STORM OF GLOBAL EVENTS? (1), 1-9. Retrieved from http://www.bis.gov.uk/assets/goscience/docs/p/perfect-storm-paper.pdf website: http://www.bis.gov.uk/go-science/science-in-government.
PROMOTING SUSTAINABLE STRATEGIES FOR A RESILIENT ASIA PACIFIC | 9
Byrd, H. (2012). Energy,Climate Buildings-An Introduction to Designing Future Proof Buildings In New Zealand. Book, Architecture and Planning, University of Auckland, Auckland.
Centre, N. N. C. (2008). Climate Change-Projections for New Zealand. Retrieved from http://www.niwa.co.nz/sites/default/files/import/attachments/IPCC_08_report_02s.pdf
Chapman, P. (1975). Fuel’s paradise: energy options for Britain. London, Reading and Fakenham: Cox & Wyman Ltd.
Chudleigh, P. D., Young, S. L., & Brown, W. A. N. (1979). New Zealand agriculture and oil price increases. Discussion paper (Lincoln College (University of Canterbury). Agricultural Economics Research Unit); no. 40, 40(40), 43. Retrieved from http://hdl.handle.net/10182/1000.
Ho, A., & Byrd, H. (2011). Transport energy and city density: a case study of how renewable energy can reverse the curve. Paper presented at the 45th ANZASca, Sydney.
McHarg, I. L., & History, A. M. o. N. (1992). Design with nature: Wiley Nova YorkMougeot, L. J. A. (2005). Growing Better Cities: Urban Agriculture for Sustainable
Development.nzahead. (2011, October 2011). A report card of New Zealand Social, economic and
environmental wellbeing Retrieved 15/07/12, 2012, from www.nzinstitute.orgOram, R. (2007). THE RESOURCE MANAGEMENT ACT:NOW AND IN THE FUTURE.
Paper presented at the Beyond the RMA Conference 30-31 May 2007Schans, J. W. v. d. (2010, 09/09/2010). Urban Agriculture in the Netherlands. Urban
Agriculture Magazine, 24, 40-42.Wrigley., E. A. (2010). Energy and English Industrial Revolution (1 ed., Vol. 1). New York:
Cambridge University Press.W, A., Boche, m., Brue, T., Giger, M., Lay, J., Messerli, P., & Nolte, K. (2012).
Transnational Land Deals For Agriculture in the Global South. Land Matrix Data Base, 1(1), 7-24. Retrieved from http://landportal.info/landmatrix website: http://www.landportal.info/landmatrix.
10 | PROMOTING SUSTAINABLE STRATEGIES FOR A RESILIENT ASIA PACIFIC
METABOLISM OF A CITY: Impacts of Density & Intensification by ANINDITA MANDAL
This research investigates the increased demand for resources in cities as they undergo the process of redevelopment, accompanied by intensification of already dense neighbourhoods, and the capacity of nature/infrastructure to cope with these demands. Metabolism is defined as ‘the sum of all the biological, chemical and physical processes that occur within an organism or ecosystem to enable it to exist indefinitely’ (Steemers, 2003, p.124). Equating urban areas to natural ecosystems, the Urban Metabolism Model, provides both a means of understanding and measuring the sustainability/resilience of a development, in terms of energy efficiency, material cycling, waste management and effectiveness of infrastructure.
1.0 Introduction“There is a growing realisation that much of the sustainability debate has an urban focus. The world’s cities are the major consumers of natural resources and the major producers of pollution and waste. Thus, if cities can be designed and managed in such a way that resource use and pollution are reduced, then major contribution to the solution of the global problem can be achieved. The role of cities in the debate is seen to be greater still if we appreciate that they are the focus of most other human activities. Thus, if the relationship – and possibly trade-off – between environmental and social, economic and cultural aspirations is part of the debate, then the role of the cities looms large (Breheny, 1992, p.2).
1.1 Issues/Problems
Rapid Urbanisation:
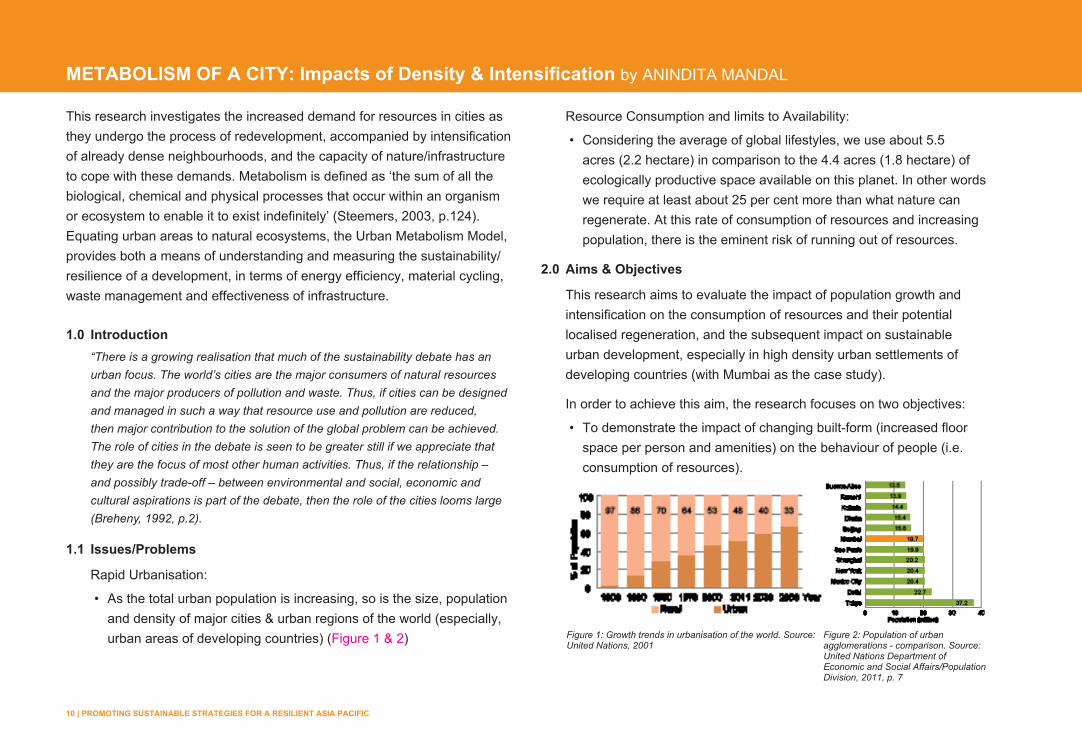
• As the total urban population is increasing, so is the size, population and density of major cities & urban regions of the world (especially, urban areas of developing countries) (Figure 1 & 2)
Resource Consumption and limits to Availability:
• Considering the average of global lifestyles, we use about 5.5 acres (2.2 hectare) in comparison to the 4.4 acres (1.8 hectare) of ecologically productive space available on this planet. In other words we require at least about 25 per cent more than what nature can regenerate. At this rate of consumption of resources and increasing population, there is the eminent risk of running out of resources.
2.0 Aims & Objectives
This research aims to evaluate the impact of population growth and intensification on the consumption of resources and their potential localised regeneration, and the subsequent impact on sustainable urban development, especially in high density urban settlements of developing countries (with Mumbai as the case study).
In order to achieve this aim, the research focuses on two objectives:
• To demonstrate the impact of changing built-form (increased floor space per person and amenities) on the behaviour of people (i.e. consumption of resources).
Figure 1: Growth trends in urbanisation of the world. Source: United Nations, 2001
Figure 2: Population of urban agglomerations - comparison. Source: United Nations Department of Economic and Social Affairs/Population Division, 2011, p. 7
PROMOTING SUSTAINABLE STRATEGIES FOR A RESILIENT ASIA PACIFIC | 11
• To evaluate the change in metabolism of urban areas caused by further increasing the (residential) population density of high density areas (276,000 to 350,000 people/km2).
3.0 Research Strategy
The research follows the philosophy of pragmatism as the research problem/aim has been given precedence over the methods used. It draws liberally on both quantitative and qualitative methods of data collection and analysis. This sequential mixed method research focuses on the neighbourhood redevelopments in Mumbai, to evaluate the pressure on the infrastructure and environment and test the resilience of proposed built-forms.
4.0 Case Study – Mumbai, India
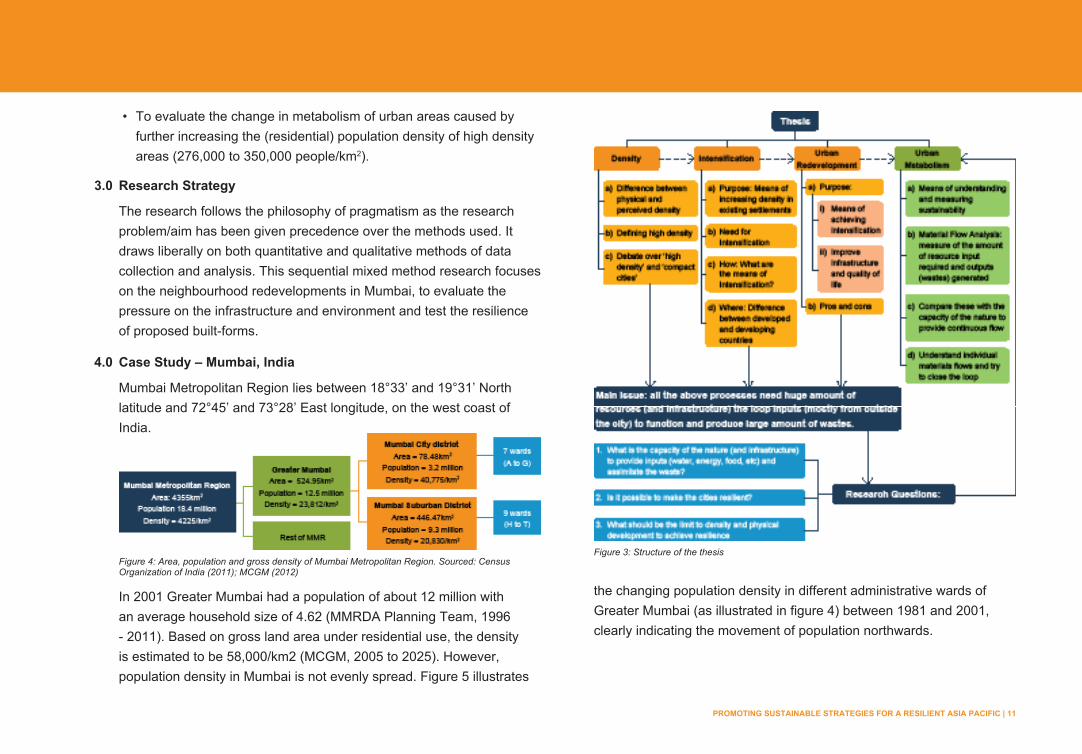
Mumbai Metropolitan Region lies between 18°33’ and 19°31’ North latitude and 72°45’ and 73°28’ East longitude, on the west coast of India.
In 2001 Greater Mumbai had a population of about 12 million with an average household size of 4.62 (MMRDA Planning Team, 1996 - 2011). Based on gross land area under residential use, the density is estimated to be 58,000/km2 (MCGM, 2005 to 2025). However, population density in Mumbai is not evenly spread. Figure 5 illustrates
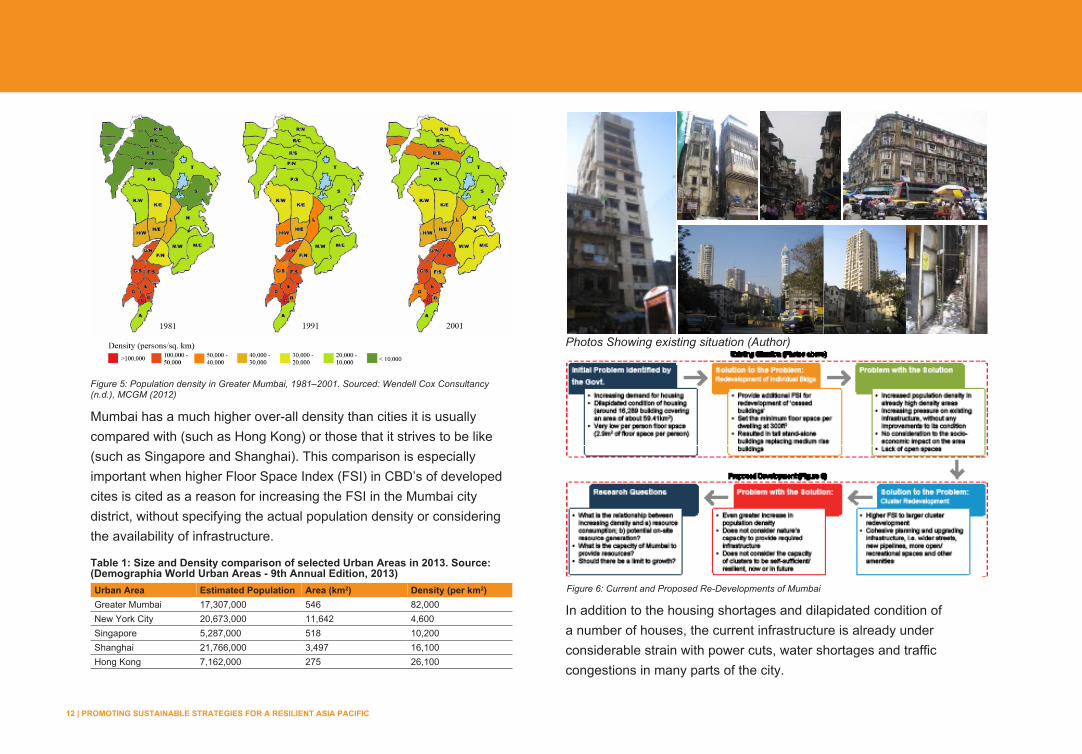
the changing population density in different administrative wards of Greater Mumbai (as illustrated in figure 4) between 1981 and 2001, clearly indicating the movement of population northwards.
Figure 3: Structure of the thesisFigure 4: Area, population and gross density of Mumbai Metropolitan Region. Sourced: Census Organization of India (2011); MCGM (2012)
12 | PROMOTING SUSTAINABLE STRATEGIES FOR A RESILIENT ASIA PACIFIC
Mumbai has a much higher over-all density than cities it is usually compared with (such as Hong Kong) or those that it strives to be like (such as Singapore and Shanghai). This comparison is especially important when higher Floor Space Index (FSI) in CBD’s of developed cites is cited as a reason for increasing the FSI in the Mumbai city district, without specifying the actual population density or considering the availability of infrastructure.
Table 1: Size and Density comparison of selected Urban Areas in 2013. Source: (Demographia World Urban Areas - 9th Annual Edition, 2013)Urban Area Estimated Population Area (km2) Density (per km2)Greater Mumbai 17,307,000 546 82,000New York City 20,673,000 11,642 4,600Singapore 5,287,000 518 10,200Shanghai 21,766,000 3,497 16,100Hong Kong 7,162,000 275 26,100
Photos Showing existing situation (Author)
In addition to the housing shortages and dilapidated condition of a number of houses, the current infrastructure is already under considerable strain with power cuts, water shortages and traffic congestions in many parts of the city.
Figure 5: Population density in Greater Mumbai, 1981–2001. Sourced: Wendell Cox Consultancy (n.d.), MCGM (2012)
Figure 6: Current and Proposed Re-Developments of Mumbai
PROMOTING SUSTAINABLE STRATEGIES FOR A RESILIENT ASIA PACIFIC | 13
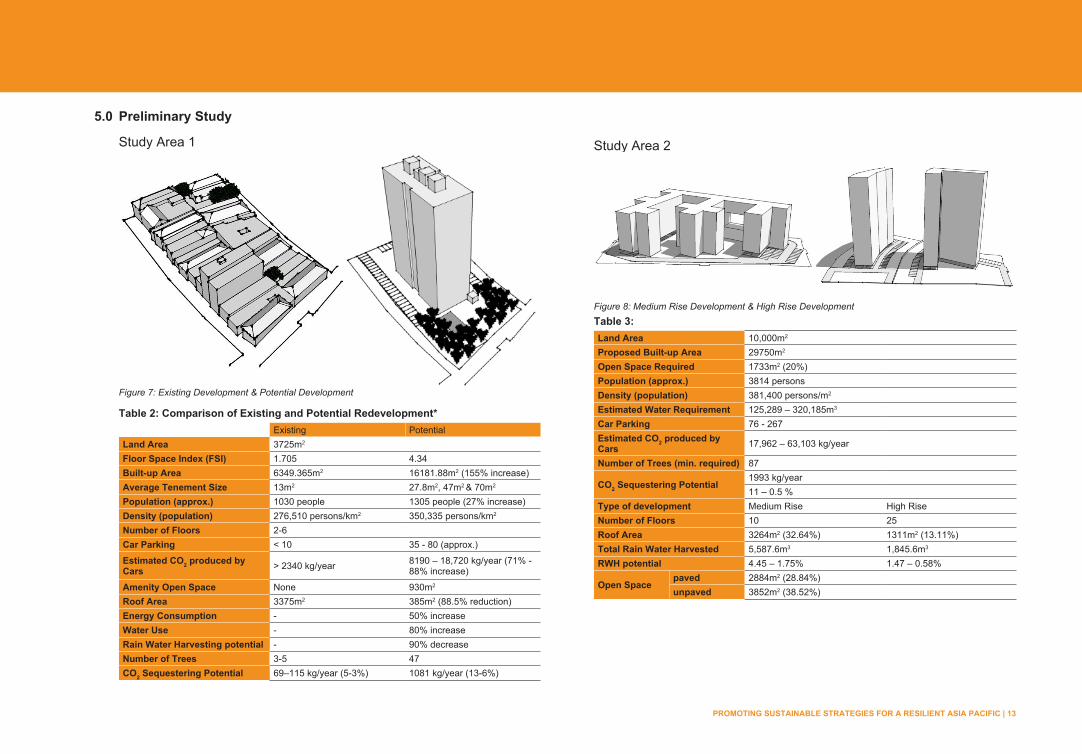
5.0 Preliminary Study
Study Area 1
Table 2: Comparison of Existing and Potential Redevelopment*Existing Potential
Land Area 3725m2
Floor Space Index (FSI) 1.705 4.34 Built-up Area 6349.365m2 16181.88m2 (155% increase)Average Tenement Size 13m2 27.8m2, 47m2 & 70m2
Population (approx.) 1030 people 1305 people (27% increase)Density (population) 276,510 persons/km2 350,335 persons/km2
Number of Floors 2-6 Car Parking < 10 35 - 80 (approx.)
Estimated CO2 produced by Cars > 2340 kg/year 8190 – 18,720 kg/year (71% -
88% increase)
Amenity Open Space None 930m2
Roof Area 3375m2 385m2 (88.5% reduction)Energy Consumption - 50% increaseWater Use - 80% increaseRain Water Harvesting potential - 90% decreaseNumber of Trees 3-5 47CO2 Sequestering Potential 69–115 kg/year (5-3%) 1081 kg/year (13-6%)
Study Area 2
Table 3: Land Area 10,000m2
Proposed Built-up Area 29750m2
Open Space Required 1733m2 (20%)Population (approx.) 3814 personsDensity (population) 381,400 persons/m2
Estimated Water Requirement 125,289 – 320,185m3
Car Parking 76 - 267Estimated CO2 produced by Cars 17,962 – 63,103 kg/year
Number of Trees (min. required) 87
CO2 Sequestering Potential1993 kg/year11 – 0.5 %
Type of development Medium Rise High RiseNumber of Floors 10 25Roof Area 3264m2 (32.64%) 1311m2 (13.11%)Total Rain Water Harvested 5,587.6m3 1,845.6m3
RWH potential 4.45 – 1.75% 1.47 – 0.58%
Open Spacepaved 2884m2 (28.84%)unpaved 3852m2 (38.52%)
Figure 7: Existing Development & Potential Development
Figure 8: Medium Rise Development & High Rise Development
14 | PROMOTING SUSTAINABLE STRATEGIES FOR A RESILIENT ASIA PACIFIC
6.1 Results
Study Area 1:
• A typical development with increased density would mean: - more than double the energy consumption; - double the use of water; - reduce the amount of rainwater that could be collected or returned
to the ground; - reduce the scope for collecting solar energy; and - an increase in the number of private vehicles, without providing
an opportunity to increase road width causing further strain on the already overloaded infrastructure.
Study Area 2:
• Based on analysis of various plot sizes, it is observed that, smaller plot sizes encourage tall buildings, due to the current height-to-open space regulations.
• Amalgamation of plots into a singular development can help achieve the same density through medium rise development.
• The medium rise development has greater potential for rainwater harvesting, electricity generation from photovoltaic cells due to increased roof area, whereas, high rise development has greater potential for CO2 sequestering and ground water recharge due to increased open space on ground.
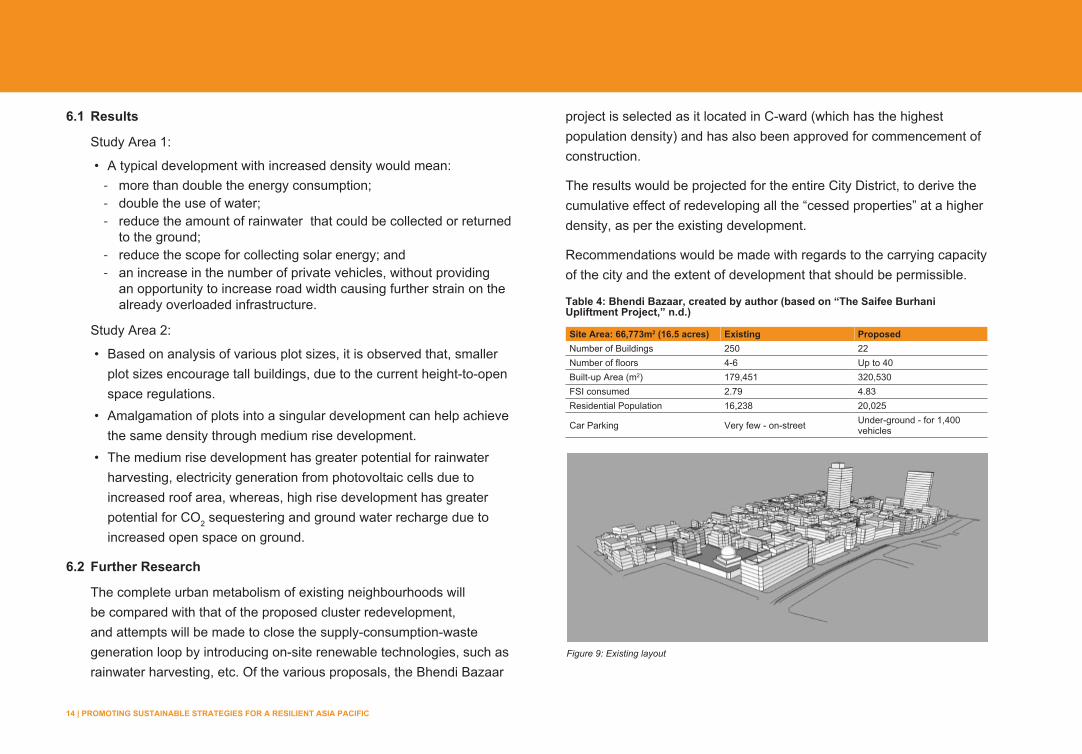
6.2 Further Research
The complete urban metabolism of existing neighbourhoods will be compared with that of the proposed cluster redevelopment, and attempts will be made to close the supply-consumption-waste generation loop by introducing on-site renewable technologies, such as rainwater harvesting, etc. Of the various proposals, the Bhendi Bazaar
project is selected as it located in C-ward (which has the highest population density) and has also been approved for commencement of construction.
The results would be projected for the entire City District, to derive the cumulative effect of redeveloping all the “cessed properties” at a higher density, as per the existing development.
Recommendations would be made with regards to the carrying capacity of the city and the extent of development that should be permissible.
Table 4: Bhendi Bazaar, created by author (based on “The Saifee Burhani Upliftment Project,” n.d.)
Site Area: 66,773m2 (16.5 acres) Existing Proposed Number of Buildings 250 22 Number of floors 4-6 Up to 40 Built-up Area (m2) 179,451 320,530 FSI consumed 2.79 4.83 Residential Population 16,238 20,025
Car Parking Very few - on-street Under-ground - for 1,400 vehicles
Figure 9: Existing layout
PROMOTING SUSTAINABLE STRATEGIES FOR A RESILIENT ASIA PACIFIC | 15
7.0 ReferencesBreheny, M. J. (1992). Sustainable development and urban form. London: Pion.Census Organization of India. (2011). India Census 2011. Retrieved from http://www.
census2011.co.in/ Demographia World Urban Areas - 9th Annual Edition. (2013). Demographia. Retrieved
from http://www.demographia.com/db-worldua.pdfMandal, A., & Byrd, H. (2010, 1st-2nd December). Urban development in Developing
Countries: Analyzing current policies for Mumbai. Paper presented at the 4th International conference on built environment in developing countries, Penang, Malaysia.
MCGM. (2005 to 2025). Greater Mumbai City Development Plan. Mumbai: Retrieved from http://www.mcgm.gov.in/irj/portal/anonymous?NavigationTarget=navurl://095e1c7b9486b1423b881dce8b106978
Municipal Corporation of Greater Mumbai (MCGM) (2012). Greater Mumbai data portal. Retrieved from http://www.mcgm.gov.in/irj/portal/anonymous?NavigationTarget=navurl://745be63a8c86ec6b74ccad4690ad4100
MMRDA Planning Team, Planning division. (1996 - 2011b). Chapter 8. Shelter needs and strategies Regional Plan for Mumbai Metropolitan Region: MMRDA.
The Saifee Burhani Upliftment Project. (n.d.). Retrieved February, 2011, from http://www.sbut.in/home-saifee-burhani-upliftment-trust.html
United Nations. (2001) The World Urbanisation Prospectus - The 2001 Revision. United Nations Publications.
United Nations Department of Economic and Social Affairs/Population Division. (2011) The World Urbanisation Prospectus - The 2011 Revision (Highlights). New York: United Nations Publications.
Wendell Cox Consultancy, (n.d.) Mumbai: Population, Area & density by ward 1991 and 1981. Retrieved from http://www.demographia.com/db-mumbaiward91.htm
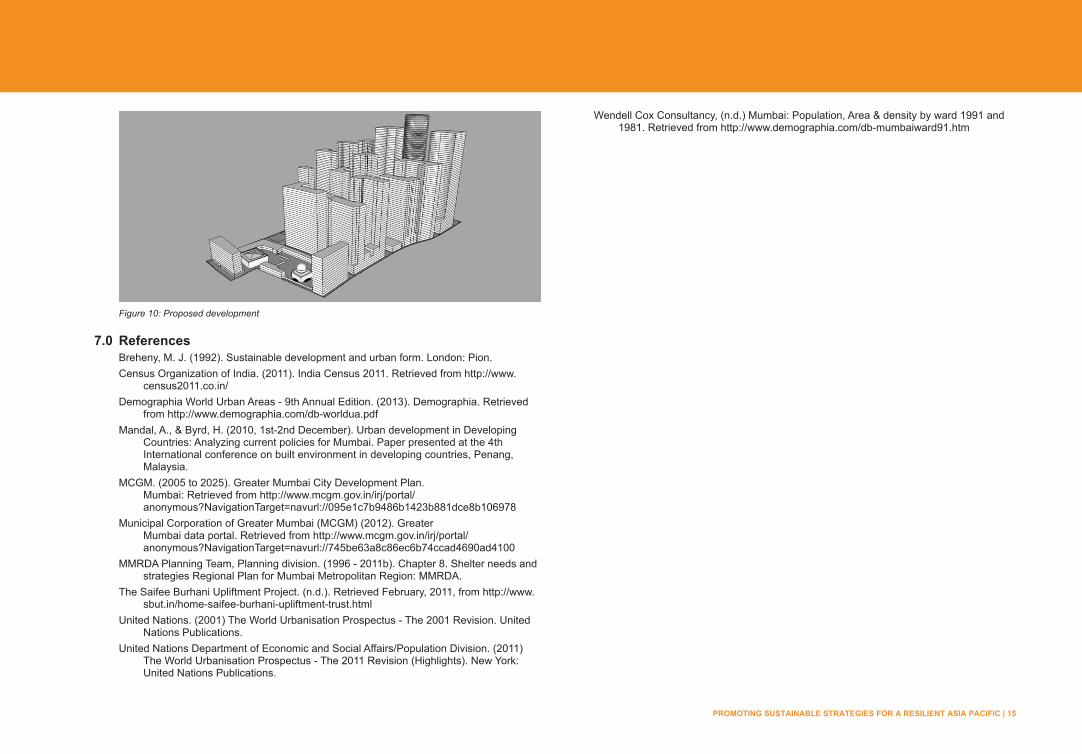
Figure 10: Proposed development
16 | PROMOTING SUSTAINABLE STRATEGIES FOR A RESILIENT ASIA PACIFIC
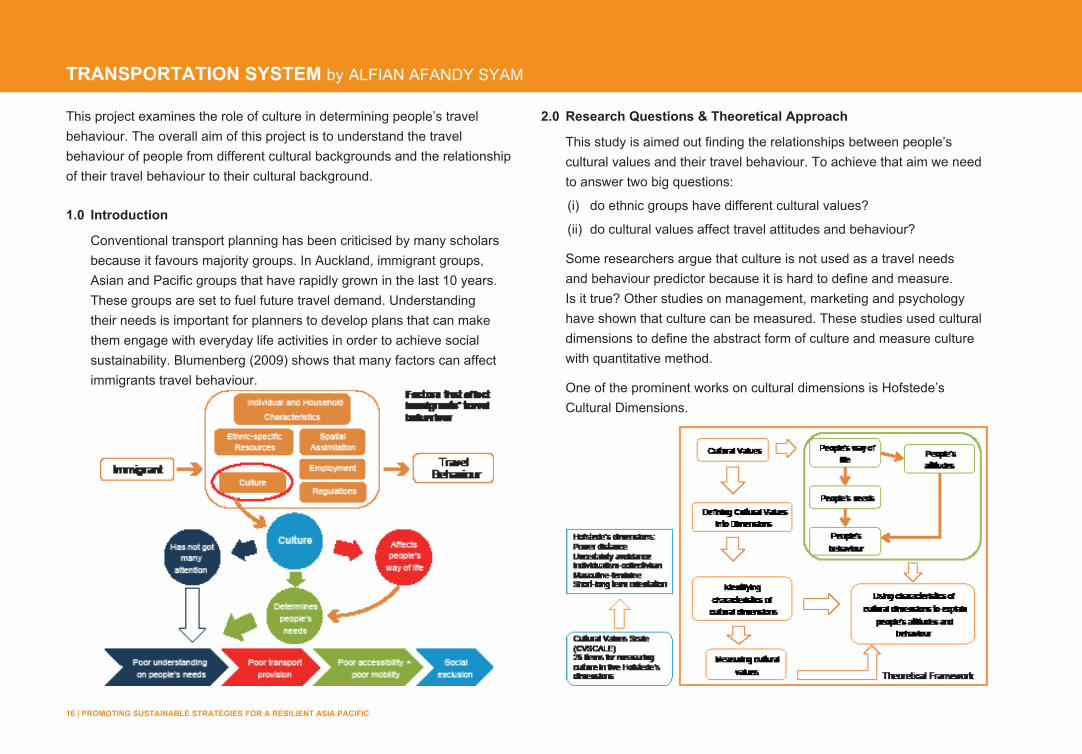
TRANSPORTATION SYSTEM by ALFIAN AFANDY SYAM
This project examines the role of culture in determining people’s travel behaviour. The overall aim of this project is to understand the travel behaviour of people from different cultural backgrounds and the relationship of their travel behaviour to their cultural background.
1.0 Introduction
Conventional transport planning has been criticised by many scholars because it favours majority groups. In Auckland, immigrant groups, Asian and Pacific groups that have rapidly grown in the last 10 years. These groups are set to fuel future travel demand. Understanding their needs is important for planners to develop plans that can make them engage with everyday life activities in order to achieve social sustainability. Blumenberg (2009) shows that many factors can affect immigrants travel behaviour.
2.0 Research Questions & Theoretical Approach
This study is aimed out finding the relationships between people’s cultural values and their travel behaviour. To achieve that aim we need to answer two big questions:
(i) do ethnic groups have different cultural values?
(ii) do cultural values affect travel attitudes and behaviour?
Some researchers argue that culture is not used as a travel needs and behaviour predictor because it is hard to define and measure. Is it true? Other studies on management, marketing and psychology have shown that culture can be measured. These studies used cultural dimensions to define the abstract form of culture and measure culture with quantitative method.
One of the prominent works on cultural dimensions is Hofstede’s Cultural Dimensions.
PROMOTING SUSTAINABLE STRATEGIES FOR A RESILIENT ASIA PACIFIC | 17
Hofstede’s developed a cultural index for 93 countries. Unfortunately, the index cannot be used in this research because it can cause ecological fallacy. We need to measure cultural values at individual level. CVSCALE can be used for that purpose. It was developed by Yoo, Donthu and Lenartowicz (1998).
3.0 Method
3.1 Sample
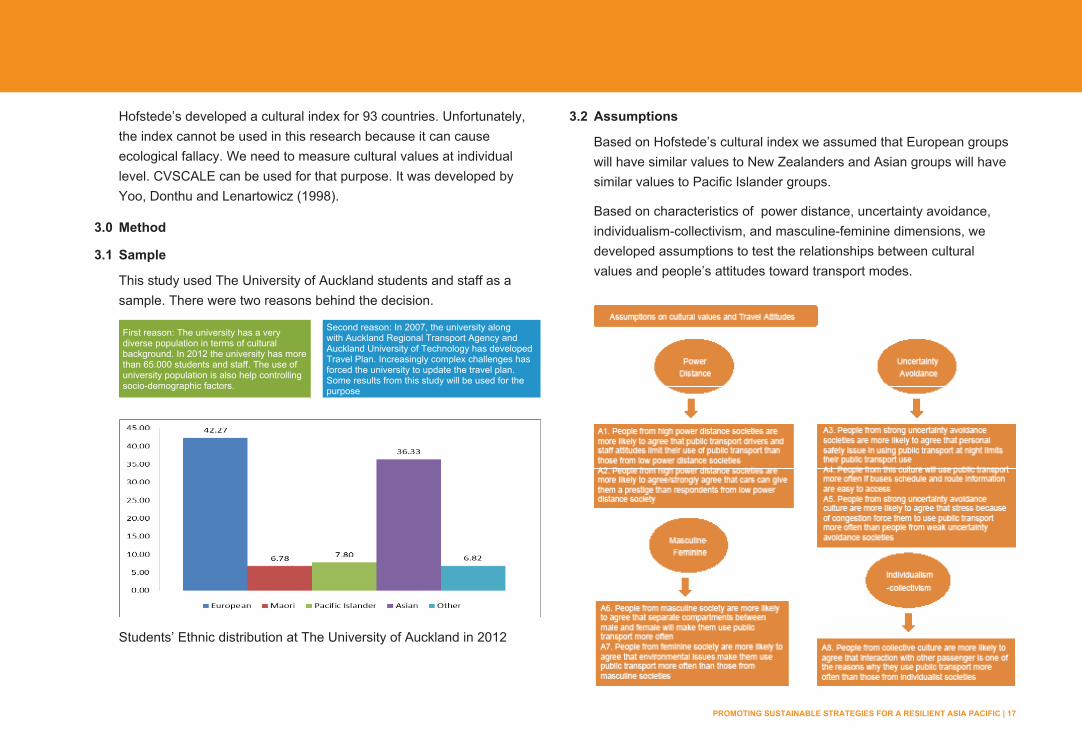
This study used The University of Auckland students and staff as a sample. There were two reasons behind the decision.
First reason: The university has a very diverse population in terms of cultural background. In 2012 the university has more than 65.000 students and staff. The use of university population is also help controlling socio-demographic factors.
Second reason: In 2007, the university along with Auckland Regional Transport Agency and Auckland University of Technology has developed Travel Plan. Increasingly complex challenges has forced the university to update the travel plan. Some results from this study will be used for the purpose
Students’ Ethnic distribution at The University of Auckland in 2012
3.2 Assumptions
Based on Hofstede’s cultural index we assumed that European groups will have similar values to New Zealanders and Asian groups will have similar values to Pacific Islander groups.
Based on characteristics of power distance, uncertainty avoidance, individualism-collectivism, and masculine-feminine dimensions, we developed assumptions to test the relationships between cultural values and people’s attitudes toward transport modes.
18 | PROMOTING SUSTAINABLE STRATEGIES FOR A RESILIENT ASIA PACIFIC
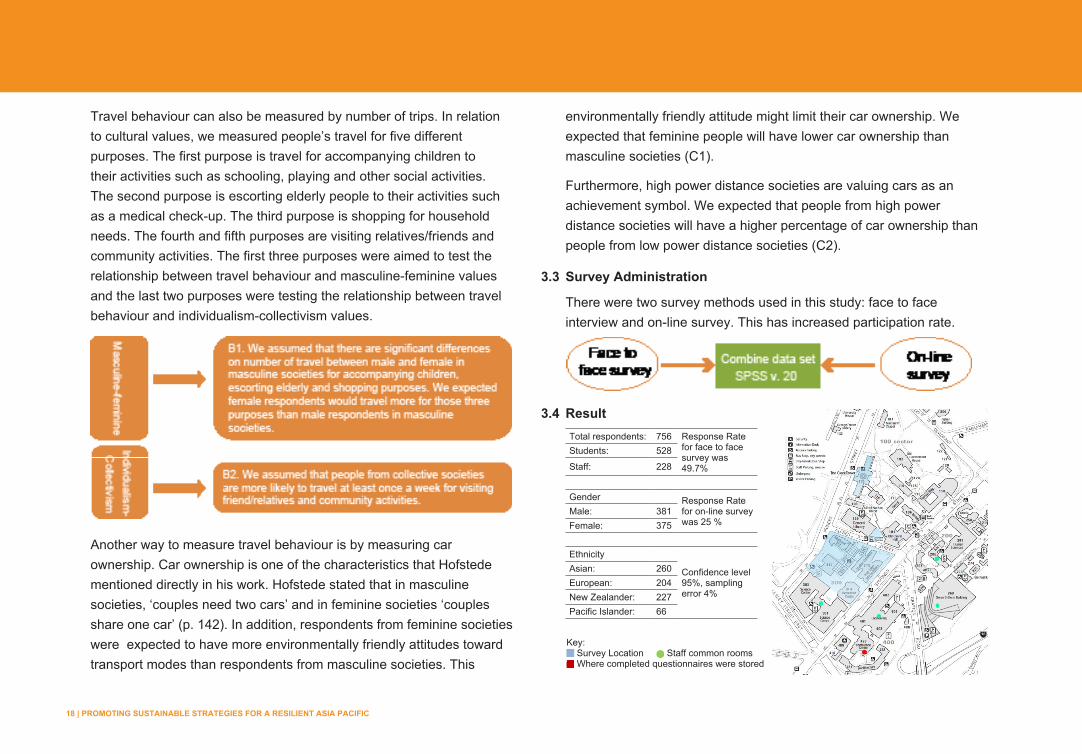
Travel behaviour can also be measured by number of trips. In relation to cultural values, we measured people’s travel for five different purposes. The first purpose is travel for accompanying children to their activities such as schooling, playing and other social activities. The second purpose is escorting elderly people to their activities such as a medical check-up. The third purpose is shopping for household needs. The fourth and fifth purposes are visiting relatives/friends and community activities. The first three purposes were aimed to test the relationship between travel behaviour and masculine-feminine values and the last two purposes were testing the relationship between travel behaviour and individualism-collectivism values.
Another way to measure travel behaviour is by measuring car ownership. Car ownership is one of the characteristics that Hofstede mentioned directly in his work. Hofstede stated that in masculine societies, ‘couples need two cars’ and in feminine societies ‘couples share one car’ (p. 142). In addition, respondents from feminine societies were expected to have more environmentally friendly attitudes toward transport modes than respondents from masculine societies. This
environmentally friendly attitude might limit their car ownership. We expected that feminine people will have lower car ownership than masculine societies (C1).
Furthermore, high power distance societies are valuing cars as an achievement symbol. We expected that people from high power distance societies will have a higher percentage of car ownership than people from low power distance societies (C2).
3.3 Survey Administration
There were two survey methods used in this study: face to face interview and on-line survey. This has increased participation rate.
3.4 ResultTotal respondents: 756 Response Rate
for face to face survey was 49.7%
Students: 528
Staff: 228
Gender Response Rate for on-line survey was 25 %
Male: 381Female: 375
Ethnicity
Confidence level 95%, sampling error 4%
Asian: 260European: 204New Zealander: 227Pacific Islander: 66
Key: Survey Location Staff common rooms Where completed questionnaires were stored
PROMOTING SUSTAINABLE STRATEGIES FOR A RESILIENT ASIA PACIFIC | 19
The scale has a relatively high reliability for all dimensions. A test on construct validity also indicated that the scale has valid constructs
Comparing reliability test results
Dimension This study Kwok and Uncles (2005)
Patterson et al (2006)
Prasongsukaru (2009)
Power Distance 0.76 0.65 0.73 0.63Uncertainty Avoidance 0.85 0.67 0.80 0.81Collectivism 0.83 0.61 0.61 0.81Masculinity 0.82 0.54 n.a 0.61Long-term orientation 0.72 0.68 n.a 0.85
4.0 Data Analysis
4.1 Cultural Values
Data analysis on ethnic groups cultural values indicated that the Asian groups have high power distance, strong uncertainty avoidance, masculine, collectivist and long-term orientation. The Pacific Islander groups have almost similar values to the Asian groups except that Pacific Islanders have feminine values instead of masculine values. Meanwhile, the New Zealander groups have relatively low power distance, weak uncertainty avoidance, feminine, individualist and short-term orientation. The European groups have a similar value with New Zealanders but the group demonstrated lower score for power distance and feminine values than New Zealanders.
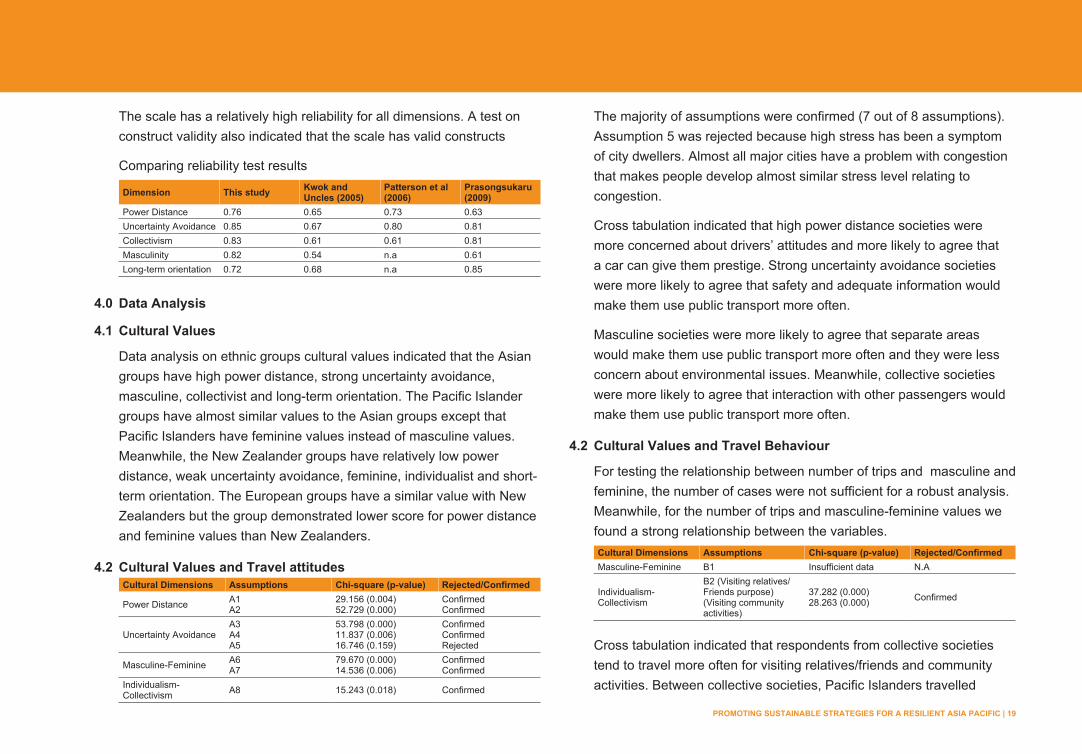
4.2 Cultural Values and Travel attitudesCultural Dimensions Assumptions Chi-square (p-value) Rejected/Confirmed
Power Distance A1A2
29.156 (0.004)52.729 (0.000)
ConfirmedConfirmed
Uncertainty AvoidanceA3 A4 A5
53.798 (0.000) 11.837 (0.006) 16.746 (0.159)
ConfirmedConfirmedRejected
Masculine-Feminine A6 A7
79.670 (0.000) 14.536 (0.006)
ConfirmedConfirmed
Individualism-Collectivism A8 15.243 (0.018) Confirmed
The majority of assumptions were confirmed (7 out of 8 assumptions). Assumption 5 was rejected because high stress has been a symptom of city dwellers. Almost all major cities have a problem with congestion that makes people develop almost similar stress level relating to congestion.
Cross tabulation indicated that high power distance societies were more concerned about drivers’ attitudes and more likely to agree that a car can give them prestige. Strong uncertainty avoidance societies were more likely to agree that safety and adequate information would make them use public transport more often.
Masculine societies were more likely to agree that separate areas would make them use public transport more often and they were less concern about environmental issues. Meanwhile, collective societies were more likely to agree that interaction with other passengers would make them use public transport more often.
4.2 Cultural Values and Travel Behaviour
For testing the relationship between number of trips and masculine and feminine, the number of cases were not sufficient for a robust analysis. Meanwhile, for the number of trips and masculine-feminine values we found a strong relationship between the variables.Cultural Dimensions Assumptions Chi-square (p-value) Rejected/ConfirmedMasculine-Feminine B1 Insufficient data N.A
Individualism-Collectivism
B2 (Visiting relatives/Friends purpose)(Visiting community activities)
37.282 (0.000) 28.263 (0.000) Confirmed
Cross tabulation indicated that respondents from collective societies tend to travel more often for visiting relatives/friends and community activities. Between collective societies, Pacific Islanders travelled
20 | PROMOTING SUSTAINABLE STRATEGIES FOR A RESILIENT ASIA PACIFIC
more often for visiting friends/relatives than Asians. This was because a majority of Pacific Islanders have lived for more than 4 years in Auckland or were born there. They have more friends and relatives than Asians.
Analysis on car ownership indicated that high power distance and masculine societies tend to have more cars in households than low power distance and feminine societies. This finding confirms assumption C1 and C2.
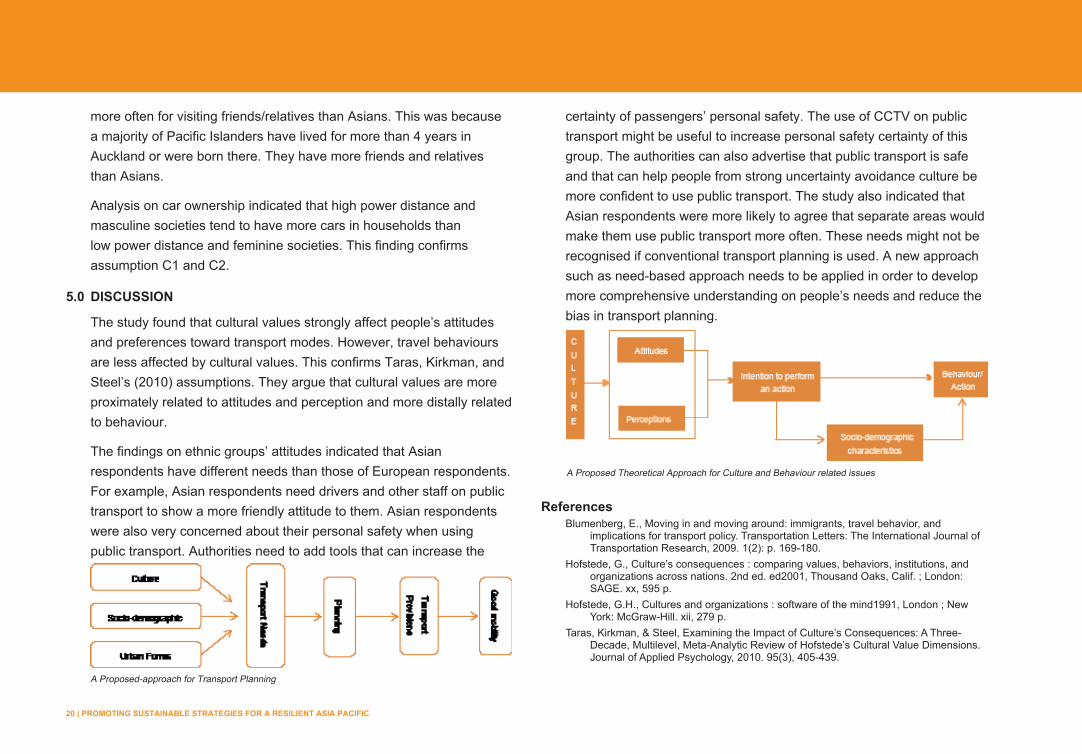
5.0 DISCUSSION
The study found that cultural values strongly affect people’s attitudes and preferences toward transport modes. However, travel behaviours are less affected by cultural values. This confirms Taras, Kirkman, and Steel’s (2010) assumptions. They argue that cultural values are more proximately related to attitudes and perception and more distally related to behaviour.
The findings on ethnic groups’ attitudes indicated that Asian respondents have different needs than those of European respondents. For example, Asian respondents need drivers and other staff on public transport to show a more friendly attitude to them. Asian respondents were also very concerned about their personal safety when using public transport. Authorities need to add tools that can increase the
certainty of passengers’ personal safety. The use of CCTV on public transport might be useful to increase personal safety certainty of this group. The authorities can also advertise that public transport is safe and that can help people from strong uncertainty avoidance culture be more confident to use public transport. The study also indicated that Asian respondents were more likely to agree that separate areas would make them use public transport more often. These needs might not be recognised if conventional transport planning is used. A new approach such as need-based approach needs to be applied in order to develop more comprehensive understanding on people’s needs and reduce the bias in transport planning.
ReferencesBlumenberg, E., Moving in and moving around: immigrants, travel behavior, and
implications for transport policy. Transportation Letters: The International Journal of Transportation Research, 2009. 1(2): p. 169-180.
Hofstede, G., Culture’s consequences : comparing values, behaviors, institutions, and organizations across nations. 2nd ed. ed2001, Thousand Oaks, Calif. ; London: SAGE. xx, 595 p.
Hofstede, G.H., Cultures and organizations : software of the mind1991, London ; New York: McGraw-Hill. xii, 279 p.
Taras, Kirkman, & Steel, Examining the Impact of Culture’s Consequences: A Three-Decade, Multilevel, Meta-Analytic Review of Hofstede’s Cultural Value Dimensions. Journal of Applied Psychology, 2010. 95(3), 405-439.
A Proposed-approach for Transport Planning
A Proposed Theoretical Approach for Culture and Behaviour related issues
PROMOTING SUSTAINABLE STRATEGIES FOR A RESILIENT ASIA PACIFIC | 21
Yoo, B., N. Donthu, and T. Lenartowicz, Measuring Hofstede’s Five Dimensions of Cultural Values at the Individual Level: Development and Validation of CVSCALE. International Consumer Marketing, 2010(Forthcoming): p. xx-xx.
Kwok, S., & Uncles, Mark, Sales Promotion Effectiveness: The Impact of Consumer Differences at An Ethnic-Group Level Journal of Product & Brand Management, 2005. 14(3): p. 170-186.
Prasongsukarn, K., Validating the Cultural Value Scale (CVSCALE): A Case Study of Thailand. ABAC Journal, 2009. 29(2): p. 1-13.

NEXUS 2 - De-urbanisation: Land capacity & Society capability. Solar energy empowerment
24 | PROMOTING SUSTAINABLE STRATEGIES FOR A RESILIENT ASIA PACIFIC
LAND CAPACITY & SOCIETY CAPABILITY by NUR HUZEIMA MOHD HUSSAIN
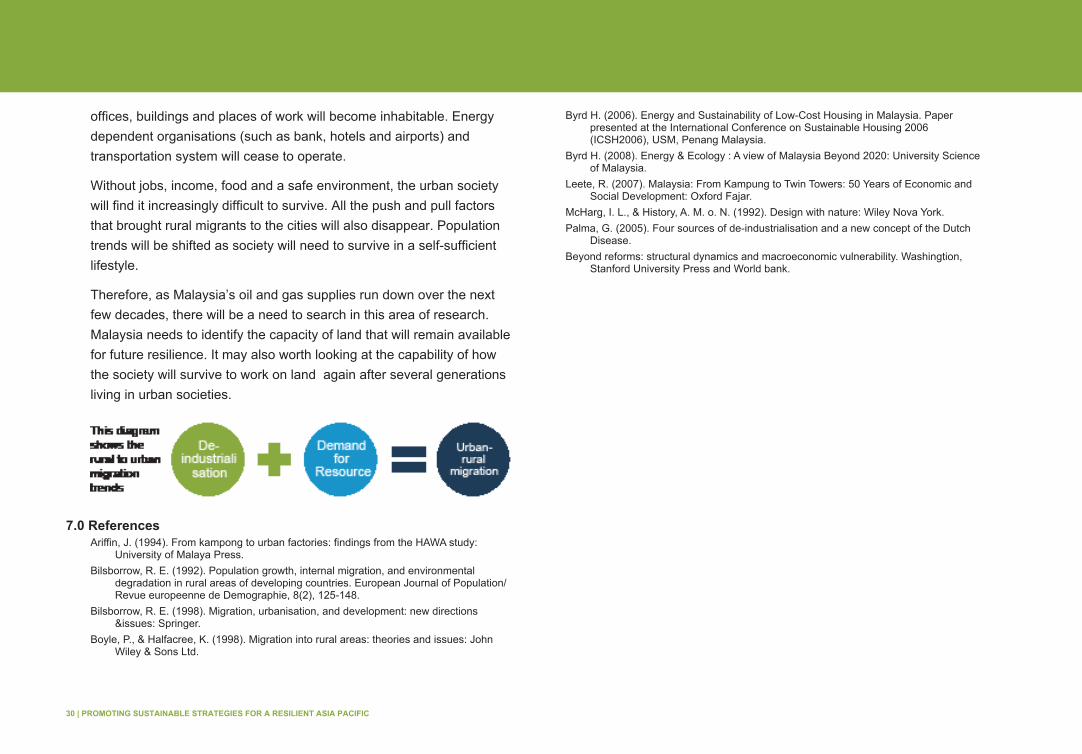
This research investigates the push and pull factors that have led Malaysia to urbanisation and subsequently, de-industrialisation. It analyses the capacity of the land and the capability of the people to once again live from the land, to return from the cities to Kampong.
1.0 Introduction
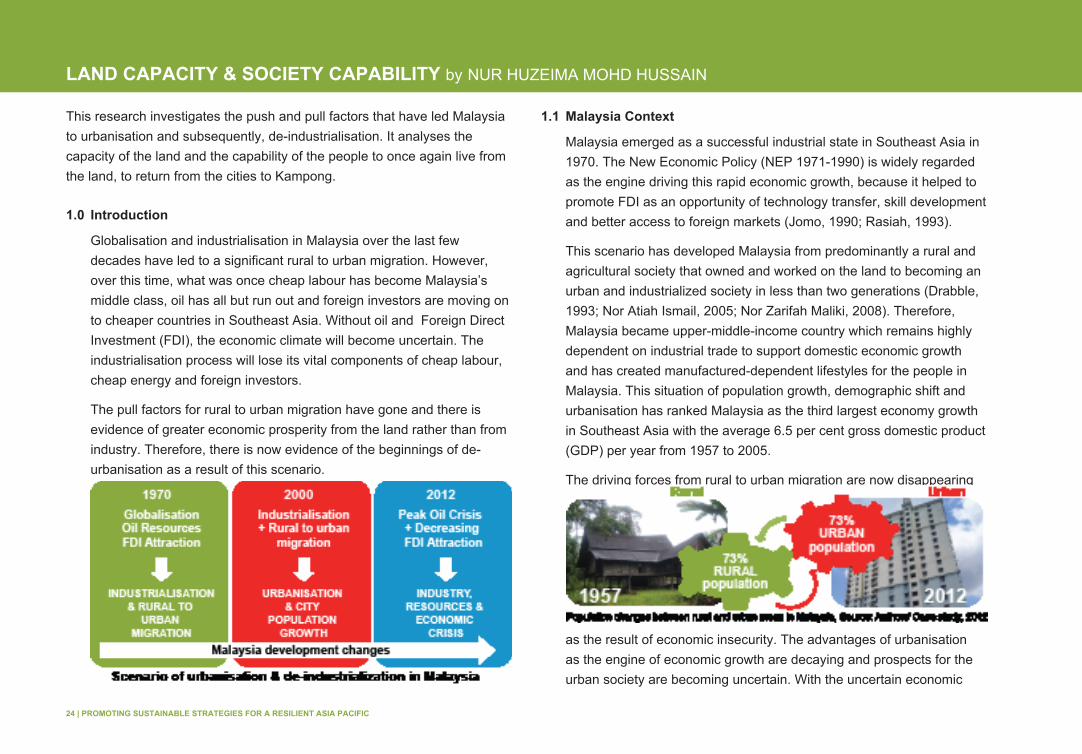
Globalisation and industrialisation in Malaysia over the last few decades have led to a significant rural to urban migration. However, over this time, what was once cheap labour has become Malaysia’s middle class, oil has all but run out and foreign investors are moving on to cheaper countries in Southeast Asia. Without oil and Foreign Direct Investment (FDI), the economic climate will become uncertain. The industrialisation process will lose its vital components of cheap labour, cheap energy and foreign investors.
The pull factors for rural to urban migration have gone and there is evidence of greater economic prosperity from the land rather than from industry. Therefore, there is now evidence of the beginnings of de-urbanisation as a result of this scenario.
1.1 Malaysia Context
Malaysia emerged as a successful industrial state in Southeast Asia in 1970. The New Economic Policy (NEP 1971-1990) is widely regarded as the engine driving this rapid economic growth, because it helped to promote FDI as an opportunity of technology transfer, skill development and better access to foreign markets (Jomo, 1990; Rasiah, 1993).
This scenario has developed Malaysia from predominantly a rural and agricultural society that owned and worked on the land to becoming an urban and industrialized society in less than two generations (Drabble, 1993; Nor Atiah Ismail, 2005; Nor Zarifah Maliki, 2008). Therefore, Malaysia became upper-middle-income country which remains highly dependent on industrial trade to support domestic economic growth and has created manufactured-dependent lifestyles for the people in Malaysia. This situation of population growth, demographic shift and urbanisation has ranked Malaysia as the third largest economy growth in Southeast Asia with the average 6.5 per cent gross domestic product (GDP) per year from 1957 to 2005.
The driving forces from rural to urban migration are now disappearing
as the result of economic insecurity. The advantages of urbanisation as the engine of economic growth are decaying and prospects for the urban society are becoming uncertain. With the uncertain economic
PROMOTING SUSTAINABLE STRATEGIES FOR A RESILIENT ASIA PACIFIC | 25
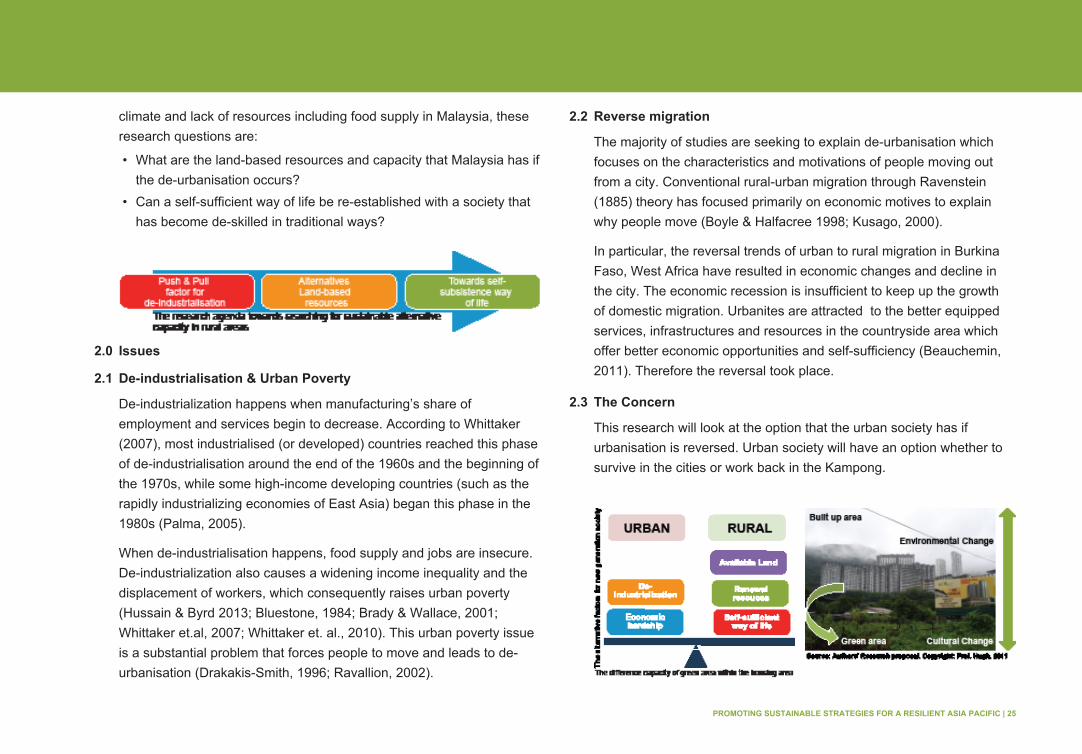
climate and lack of resources including food supply in Malaysia, these research questions are:
• What are the land-based resources and capacity that Malaysia has if the de-urbanisation occurs?
• Can a self-sufficient way of life be re-established with a society that has become de-skilled in traditional ways?
2.0 Issues
2.1 De-industrialisation & Urban Poverty
De-industrialization happens when manufacturing’s share of employment and services begin to decrease. According to Whittaker (2007), most industrialised (or developed) countries reached this phase of de-industrialisation around the end of the 1960s and the beginning of the 1970s, while some high-income developing countries (such as the rapidly industrializing economies of East Asia) began this phase in the 1980s (Palma, 2005).
When de-industrialisation happens, food supply and jobs are insecure. De-industrialization also causes a widening income inequality and the displacement of workers, which consequently raises urban poverty (Hussain & Byrd 2013; Bluestone, 1984; Brady & Wallace, 2001; Whittaker et.al, 2007; Whittaker et. al., 2010). This urban poverty issue is a substantial problem that forces people to move and leads to de-urbanisation (Drakakis-Smith, 1996; Ravallion, 2002).
2.2 Reverse migration
The majority of studies are seeking to explain de-urbanisation which focuses on the characteristics and motivations of people moving out from a city. Conventional rural-urban migration through Ravenstein (1885) theory has focused primarily on economic motives to explain why people move (Boyle & Halfacree 1998; Kusago, 2000).
In particular, the reversal trends of urban to rural migration in Burkina Faso, West Africa have resulted in economic changes and decline in the city. The economic recession is insufficient to keep up the growth of domestic migration. Urbanites are attracted to the better equipped services, infrastructures and resources in the countryside area which offer better economic opportunities and self-sufficiency (Beauchemin, 2011). Therefore the reversal took place.
2.3 The Concern
This research will look at the option that the urban society has if urbanisation is reversed. Urban society will have an option whether to survive in the cities or work back in the Kampong.
26 | PROMOTING SUSTAINABLE STRATEGIES FOR A RESILIENT ASIA PACIFIC
3.0 Aims
Particularly, this research is looking for the alternative solution for resilient living in the future. Thus, in regards to the uniqueness in having rich land resources and reserved land ownership in Malaysia; this research will investigate:
• The capacity that rural areas have in order to cater for the return migrants.
• The capability that the urban society has to survive in a self-sufficient way of life.
3.1 Objectives• To analyse the trends and impacts of the urbanisation process in
Malaysia.• To accurately record the self-sufficient practices and resources
during the pre-rural-urban migration and to evaluate the potential urban-rural migration.
• To investigate the capacity of the land and resources in rural areas and potential utilisation.
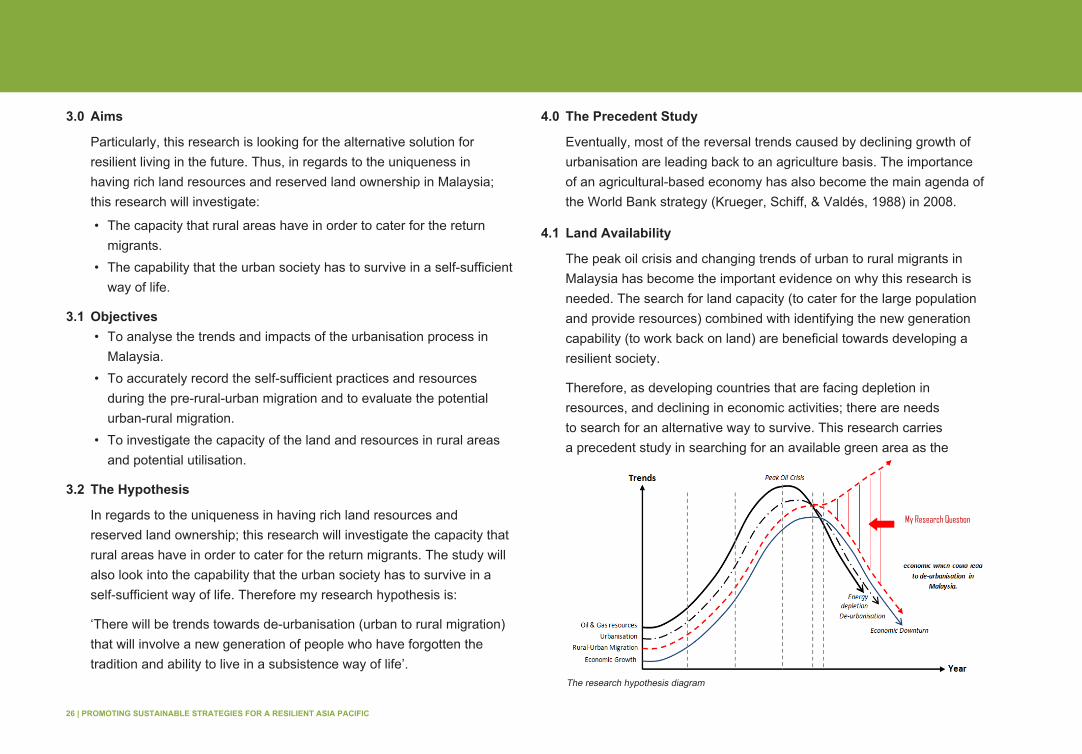
3.2 The Hypothesis
In regards to the uniqueness in having rich land resources and reserved land ownership; this research will investigate the capacity that rural areas have in order to cater for the return migrants. The study will also look into the capability that the urban society has to survive in a self-sufficient way of life. Therefore my research hypothesis is:
‘There will be trends towards de-urbanisation (urban to rural migration) that will involve a new generation of people who have forgotten the tradition and ability to live in a subsistence way of life’.
4.0 The Precedent Study
Eventually, most of the reversal trends caused by declining growth of urbanisation are leading back to an agriculture basis. The importance of an agricultural-based economy has also become the main agenda of the World Bank strategy (Krueger, Schiff, & Valdés, 1988) in 2008.
4.1 Land Availability
The peak oil crisis and changing trends of urban to rural migrants in Malaysia has become the important evidence on why this research is needed. The search for land capacity (to cater for the large population and provide resources) combined with identifying the new generation capability (to work back on land) are beneficial towards developing a resilient society.
Therefore, as developing countries that are facing depletion in resources, and declining in economic activities; there are needs to search for an alternative way to survive. This research carries a precedent study in searching for an available green area as the
My Research Question
The research hypothesis diagram
PROMOTING SUSTAINABLE STRATEGIES FOR A RESILIENT ASIA PACIFIC | 27
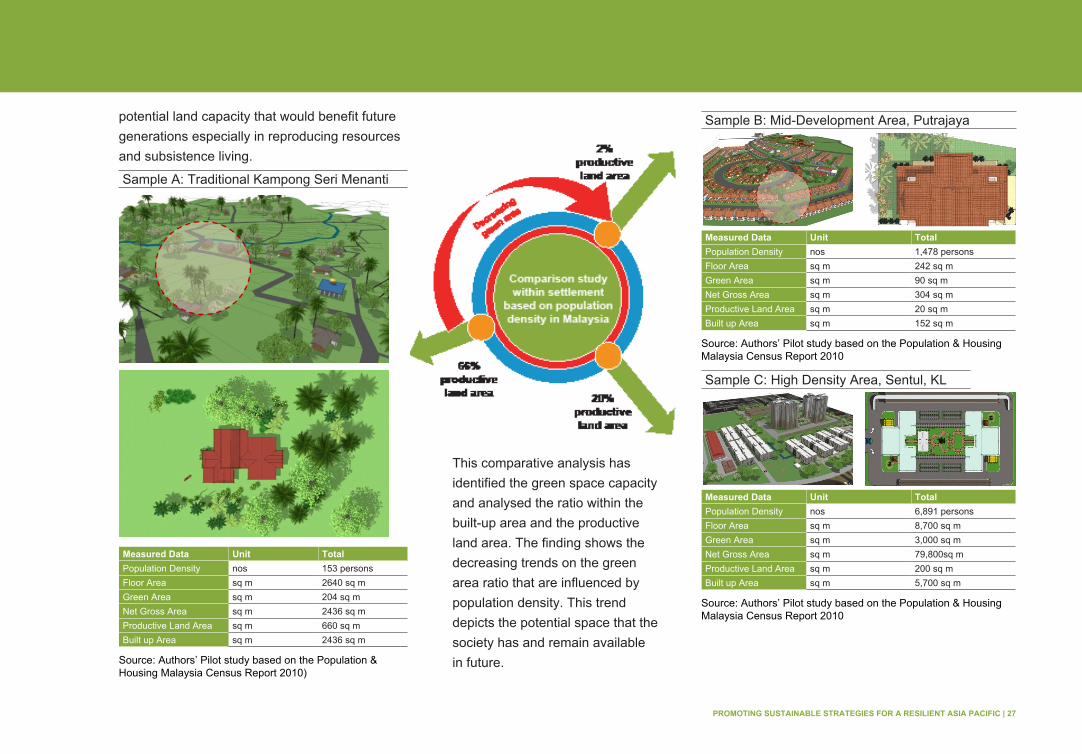
potential land capacity that would benefit future generations especially in reproducing resources and subsistence living.
Sample A: Traditional Kampong Seri Menanti
Measured Data Unit TotalPopulation Density nos 153 personsFloor Area sq m 2640 sq m Green Area sq m 204 sq m Net Gross Area sq m 2436 sq mProductive Land Area sq m 660 sq m Built up Area sq m 2436 sq m
Source: Authors’ Pilot study based on the Population & Housing Malaysia Census Report 2010)
This comparative analysis has identified the green space capacity and analysed the ratio within the built-up area and the productive land area. The finding shows the decreasing trends on the green area ratio that are influenced by population density. This trend depicts the potential space that the society has and remain available in future.
Sample B: Mid-Development Area, Putrajaya
Measured Data Unit TotalPopulation Density nos 1,478 personsFloor Area sq m 242 sq mGreen Area sq m 90 sq m Net Gross Area sq m 304 sq mProductive Land Area sq m 20 sq m Built up Area sq m 152 sq m
Source: Authors’ Pilot study based on the Population & Housing Malaysia Census Report 2010
Sample C: High Density Area, Sentul, KL
Measured Data Unit TotalPopulation Density nos 6,891 personsFloor Area sq m 8,700 sq m Green Area sq m 3,000 sq m Net Gross Area sq m 79,800sq mProductive Land Area sq m 200 sq m Built up Area sq m 5,700 sq m
Source: Authors’ Pilot study based on the Population & Housing Malaysia Census Report 2010
28 | PROMOTING SUSTAINABLE STRATEGIES FOR A RESILIENT ASIA PACIFIC
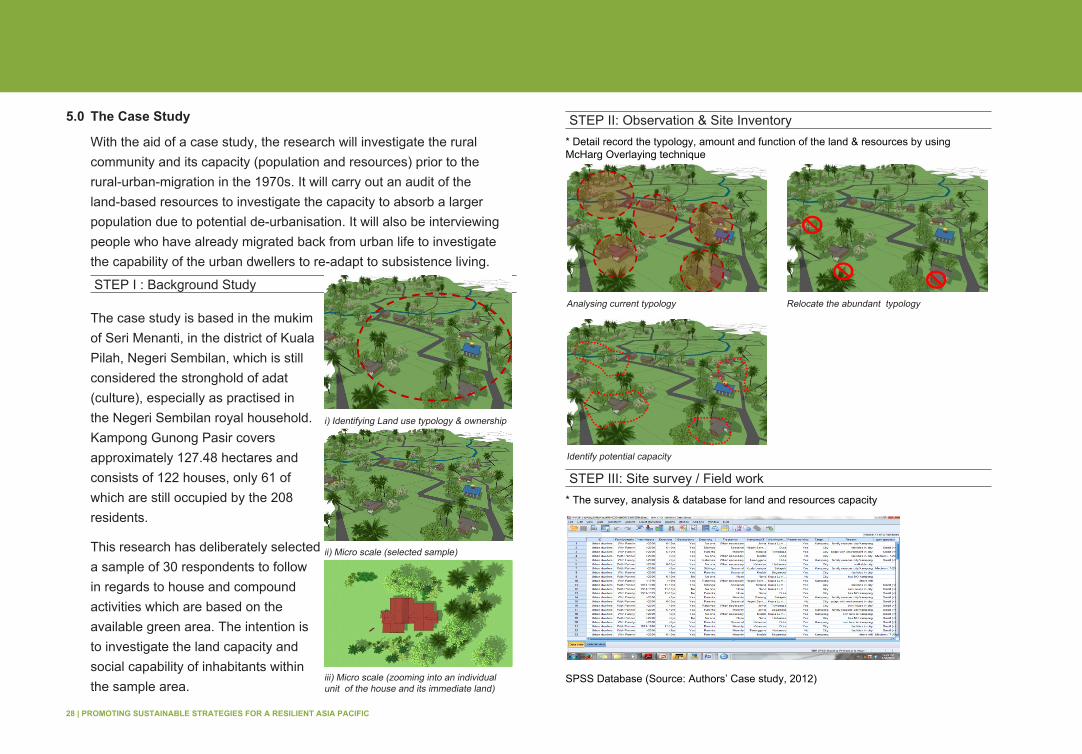
5.0 The Case Study
With the aid of a case study, the research will investigate the rural community and its capacity (population and resources) prior to the rural-urban-migration in the 1970s. It will carry out an audit of the land-based resources to investigate the capacity to absorb a larger population due to potential de-urbanisation. It will also be interviewing people who have already migrated back from urban life to investigate the capability of the urban dwellers to re-adapt to subsistence living.
STEP I : Background Study
The case study is based in the mukim of Seri Menanti, in the district of Kuala Pilah, Negeri Sembilan, which is still considered the stronghold of adat (culture), especially as practised in the Negeri Sembilan royal household. Kampong Gunong Pasir covers approximately 127.48 hectares and consists of 122 houses, only 61 of which are still occupied by the 208 residents.
This research has deliberately selected a sample of 30 respondents to follow in regards to house and compound activities which are based on the available green area. The intention is to investigate the land capacity and social capability of inhabitants within the sample area.
STEP II: Observation & Site Inventory* Detail record the typology, amount and function of the land & resources by using McHarg Overlaying technique
STEP III: Site survey / Field work* The survey, analysis & database for land and resources capacity
SPSS Database (Source: Authors’ Case study, 2012)
i) Identifying Land use typology & ownership
ii) Micro scale (selected sample)
iii) Micro scale (zooming into an individual unit of the house and its immediate land)
Analysing current typology Relocate the abundant typology
Identify potential capacity
PROMOTING SUSTAINABLE STRATEGIES FOR A RESILIENT ASIA PACIFIC | 29
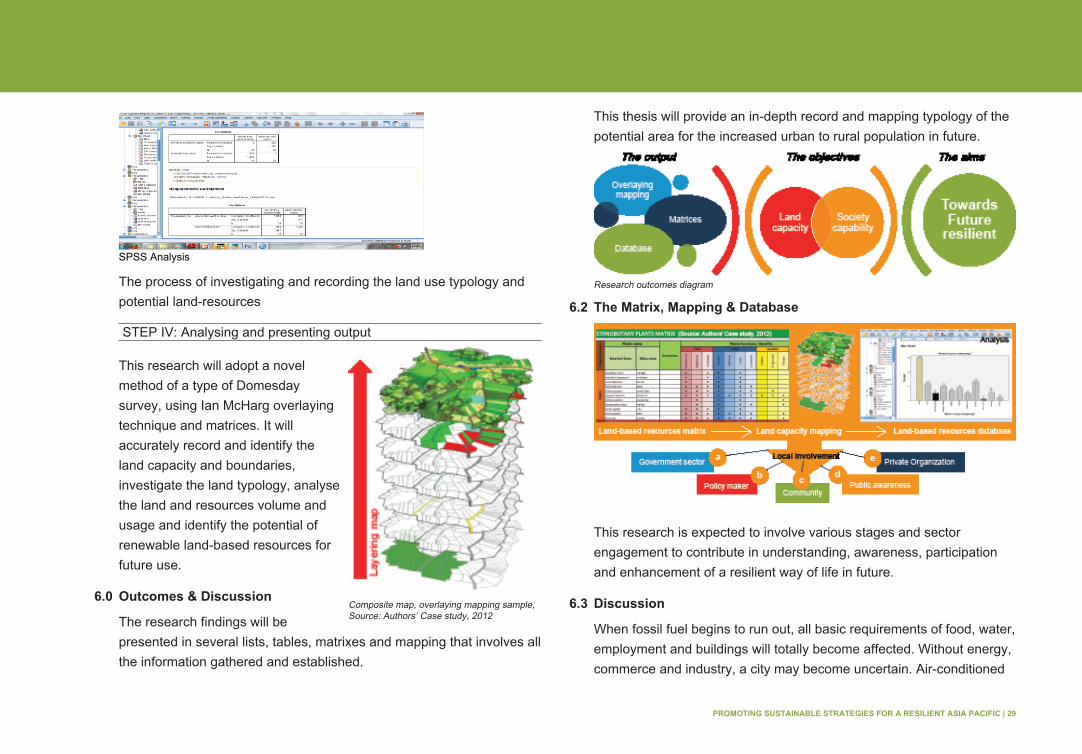
SPSS Analysis
The process of investigating and recording the land use typology and potential land-resources
STEP IV: Analysing and presenting output
This research will adopt a novel method of a type of Domesday survey, using Ian McHarg overlaying technique and matrices. It will accurately record and identify the land capacity and boundaries, investigate the land typology, analyse the land and resources volume and usage and identify the potential of renewable land-based resources for future use.
6.0 Outcomes & Discussion
The research findings will be presented in several lists, tables, matrixes and mapping that involves all the information gathered and established.
This thesis will provide an in-depth record and mapping typology of the potential area for the increased urban to rural population in future.
6.2 The Matrix, Mapping & Database
This research is expected to involve various stages and sector engagement to contribute in understanding, awareness, participation and enhancement of a resilient way of life in future.
6.3 Discussion
When fossil fuel begins to run out, all basic requirements of food, water, employment and buildings will totally become affected. Without energy, commerce and industry, a city may become uncertain. Air-conditioned
Composite map, overlaying mapping sample, Source: Authors’ Case study, 2012
Research outcomes diagram
30 | PROMOTING SUSTAINABLE STRATEGIES FOR A RESILIENT ASIA PACIFIC
offices, buildings and places of work will become inhabitable. Energy dependent organisations (such as bank, hotels and airports) and transportation system will cease to operate.
Without jobs, income, food and a safe environment, the urban society will find it increasingly difficult to survive. All the push and pull factors that brought rural migrants to the cities will also disappear. Population trends will be shifted as society will need to survive in a self-sufficient lifestyle.
Therefore, as Malaysia’s oil and gas supplies run down over the next few decades, there will be a need to search in this area of research. Malaysia needs to identify the capacity of land that will remain available for future resilience. It may also worth looking at the capability of how the society will survive to work on land again after several generations living in urban societies.
7.0 ReferencesAriffin, J. (1994). From kampong to urban factories: findings from the HAWA study:
University of Malaya Press.Bilsborrow, R. E. (1992). Population growth, internal migration, and environmental
degradation in rural areas of developing countries. European Journal of Population/Revue europeenne de Demographie, 8(2), 125-148.
Bilsborrow, R. E. (1998). Migration, urbanisation, and development: new directions &issues: Springer.
Boyle, P., & Halfacree, K. (1998). Migration into rural areas: theories and issues: John Wiley & Sons Ltd.
Byrd H. (2006). Energy and Sustainability of Low-Cost Housing in Malaysia. Paper presented at the International Conference on Sustainable Housing 2006 (ICSH2006), USM, Penang Malaysia.
Byrd H. (2008). Energy & Ecology : A view of Malaysia Beyond 2020: University Science of Malaysia.
Leete, R. (2007). Malaysia: From Kampung to Twin Towers: 50 Years of Economic and Social Development: Oxford Fajar.
McHarg, I. L., & History, A. M. o. N. (1992). Design with nature: Wiley Nova York.Palma, G. (2005). Four sources of de-industrialisation and a new concept of the Dutch
Disease.Beyond reforms: structural dynamics and macroeconomic vulnerability. Washingtion,
Stanford University Press and World bank.

PROMOTING SUSTAINABLE STRATEGIES FOR A RESILIENT ASIA PACIFIC | 31

32 | PROMOTING SUSTAINABLE STRATEGIES FOR A RESILIENT ASIA PACIFIC
SOLAR ENERGY EMPOWERMENT: Towards resilient future of low-income groups in rural Malaysia by NUR AZFAHANI AHMAD
This research will investigate and analyse the distributed renewable energy scenario in Malaysia especially in providing an equitable power supply towards low-income groups in rural area.
1.0 Introduction
The main focus of this research is to support solar photovoltaic (PV) energy implementation into the national power grid, by providing suitable schemes that can help rural Malaysia implement this technology and as a fundamental action for this technology to be diffused largely to the whole low-income communities in Malaysia.
1.1 Malaysia Context
Malaysia has features that differ from other countries in the world which make the intensification argument on electricity supplies more complex. This literature will depict Malaysia as an ‘upper-middle-income’ country (Yusof and Bhattasali, 2008) having a different situations and obstacles which stand in the way of the realisation of PV programs in the country. Malaysia is a country which does not fit easily into either the category of ‘developed’ or of ‘developing’ country in establishing PV technology to a widespread basis (Byrd, 2008) because this is one country where electricity can be consumed lavishly due to the dependency of abundant fossil fuels and subsidies.
Inadequate electricity infrastructures and inequalities in power distribution are very uncommon to the people. Nonetheless, the rising issues of peak oil and depletion of fossil fuels will eventually threaten the development of Malaysia and leaving the people, especially low-income people, in vulnerable state due to energy crunch. Hence, it is essential to derive these issues and review them for the sake of Malaysia, particularly in maintaining an equitable electricity distribution.
1.2 Malaysia: A “Fossil-Fuel Country”(i) Primarily reliant on fossil fuels for generating electricity (93 per
cent) (Petronas, 2011)
Malaysia
Electricity Coverage in Malaysia (For Residential Sector)
PROMOTING SUSTAINABLE STRATEGIES FOR A RESILIENT ASIA PACIFIC | 33
(ii) The Energy Scenario in Malaysia: Energy demand is primarily dependent on fossil fuels (82 per cent)
(iii) Electricity growth for housing sector; increased at 4.9 per cent every year (TNB, 2011)
1.3 ‘Electricity-Dependent Lifestyles’(i) Due to affordable market of electrical appliances, cheap prices of
electricity (subsidised) and rapid urbanisation for the past 20 years
(ii) Cheap prices of electricity has increased GDP (4.6 per cent - June 2012), electricity intensity and Human Development Index (HDI) (0.761 – ranked 61 from 187 countries) – Create job opportunities through telecommunication, manufacturing, industrial and automotive (Yusof and Bhattasali, 2008)
(iii) Poverty has been reduced (3.8 per cent - 2009) (EPU, 2010)
2.0 Scope
This research will focuses on the rural area of Malaysia and the low-income communities in rural areas.
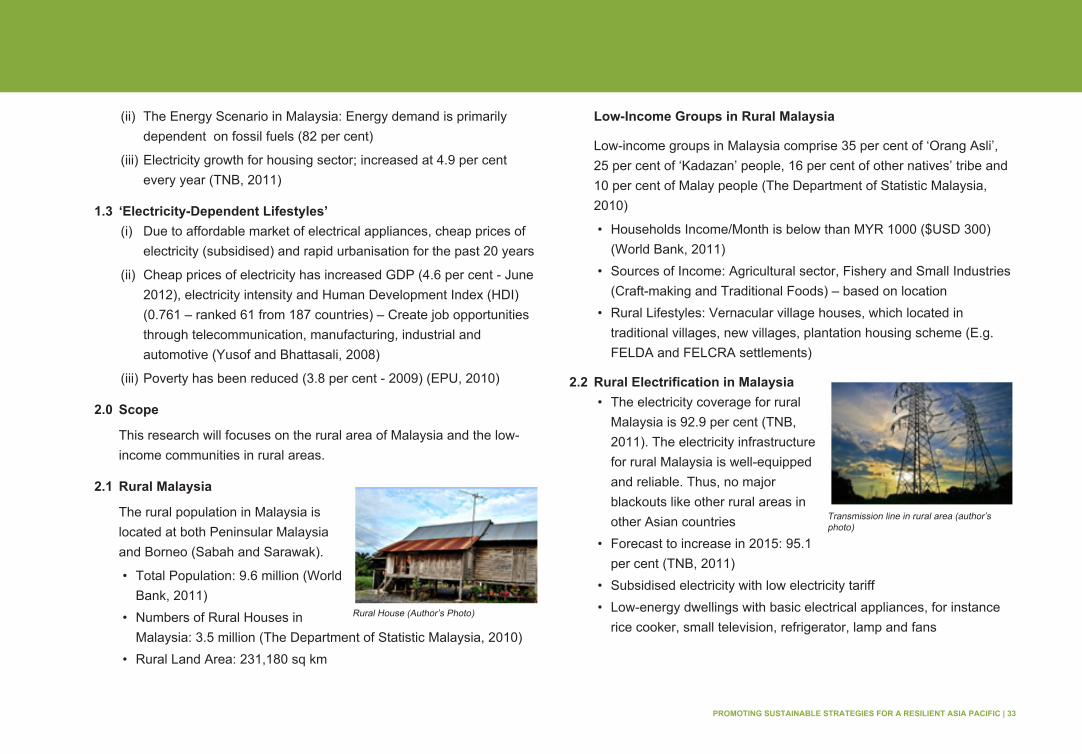
2.1 Rural Malaysia
The rural population in Malaysia is located at both Peninsular Malaysia and Borneo (Sabah and Sarawak).
• Total Population: 9.6 million (World Bank, 2011)
• Numbers of Rural Houses in Malaysia: 3.5 million (The Department of Statistic Malaysia, 2010)
• Rural Land Area: 231,180 sq km
Low-Income Groups in Rural Malaysia
Low-income groups in Malaysia comprise 35 per cent of ‘Orang Asli’, 25 per cent of ‘Kadazan’ people, 16 per cent of other natives’ tribe and 10 per cent of Malay people (The Department of Statistic Malaysia, 2010)
• Households Income/Month is below than MYR 1000 ($USD 300) (World Bank, 2011)
• Sources of Income: Agricultural sector, Fishery and Small Industries (Craft-making and Traditional Foods) – based on location
• Rural Lifestyles: Vernacular village houses, which located in traditional villages, new villages, plantation housing scheme (E.g. FELDA and FELCRA settlements)
2.2 Rural Electrification in Malaysia• The electricity coverage for rural
Malaysia is 92.9 per cent (TNB, 2011). The electricity infrastructure for rural Malaysia is well-equipped and reliable. Thus, no major blackouts like other rural areas in other Asian countries
• Forecast to increase in 2015: 95.1 per cent (TNB, 2011)
• Subsidised electricity with low electricity tariff• Low-energy dwellings with basic electrical appliances, for instance
rice cooker, small television, refrigerator, lamp and fansRural House (Author’s Photo)
Transmission line in rural area (author’s photo)
34 | PROMOTING SUSTAINABLE STRATEGIES FOR A RESILIENT ASIA PACIFIC
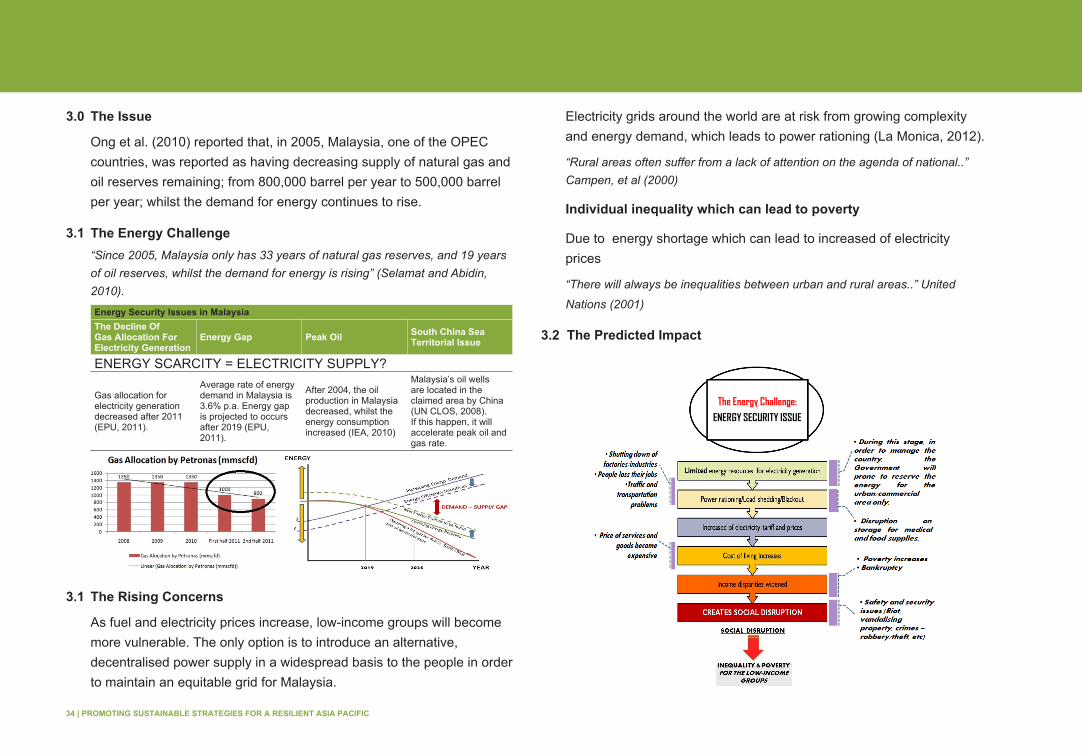
3.0 The Issue
Ong et al. (2010) reported that, in 2005, Malaysia, one of the OPEC countries, was reported as having decreasing supply of natural gas and oil reserves remaining; from 800,000 barrel per year to 500,000 barrel per year; whilst the demand for energy continues to rise.
3.1 The Energy Challenge“Since 2005, Malaysia only has 33 years of natural gas reserves, and 19 years of oil reserves, whilst the demand for energy is rising” (Selamat and Abidin, 2010).
Energy Security Issues in Malaysia The Decline Of Gas Allocation For Electricity Generation
Energy Gap Peak Oil South China Sea Territorial Issue
ENERGY SCARCITY = ELECTRICITY SUPPLY?
Gas allocation for electricity generation decreased after 2011 (EPU, 2011).
Average rate of energy demand in Malaysia is 3.6% p.a. Energy gap is projected to occurs after 2019 (EPU, 2011).
After 2004, the oil production in Malaysia decreased, whilst the energy consumption increased (IEA, 2010)
Malaysia’s oil wells are located in the claimed area by China (UN CLOS, 2008). If this happen, it will accelerate peak oil and gas rate.
3.1 The Rising Concerns
As fuel and electricity prices increase, low-income groups will become more vulnerable. The only option is to introduce an alternative, decentralised power supply in a widespread basis to the people in order to maintain an equitable grid for Malaysia.
Electricity grids around the world are at risk from growing complexity and energy demand, which leads to power rationing (La Monica, 2012).
“Rural areas often suffer from a lack of attention on the agenda of national..” Campen, et al (2000)
Individual inequality which can lead to poverty
Due to energy shortage which can lead to increased of electricity prices
“There will always be inequalities between urban and rural areas..” United
Nations (2001)
3.2 The Predicted Impact
The Energy Challenge:
ENERGY SECURITY ISSUE
PROMOTING SUSTAINABLE STRATEGIES FOR A RESILIENT ASIA PACIFIC | 35
3.3 Issues need to be pondered
I could not avoid asking many questions, for instance: “What will happen to Malaysia if the issue of insufficient electricity occurs, especially in terms of development and humanities?” and “Are there significant problems related to insufficient electricity that may cause hardship to the people, especially the low-income people?”. Other subsequent questions are: “How will the Malaysian government overcome the situation?” and “What are the actions from Malaysian government to solve this issue, especially in terms of electricity generation?”
4.0 Research Framework
4.1 Aim of the Research
Towards a sustainable and energy self-sufficient lifestyles for the future of rural Malaysia.
4.2 Objectives
Below are the objectives for this research:
• To identify the potential for utilising the roofs of rural housing as collectors of solar energy via PV
• To identify the incentives and strategies necessary to allow solar PV to have a significant impact on the equitable provision of energy for low income population groups in Malaysia.
• To design a strategic planning framework for the diffusion of the PV programme in order to provide an equitable energy supply for Malaysia
4.3 Hypothesis
The equitable distribution of electricity is a challenge for Malaysia since the risk of inadequate electricity production is increasing due to the depletion of the resources necessary for electricity generation. As fuel and electricity prices continue to increase, low-income groups will become increasingly vulnerable. In order to alleviate this situation, the only option available appears to be the introduction of an alternative, decentralised, power supply provided by micro-generation. With its abundant amount of sunshine, Malaysia has significant potential to exploit solar energy and, in particular, to enable PVs to generate electricity. Thus, the hypothesis of this research is:
“PVs On Rural Housing Can Significantly Contribute To National Electricity Supply And Reduce Social Inequality”
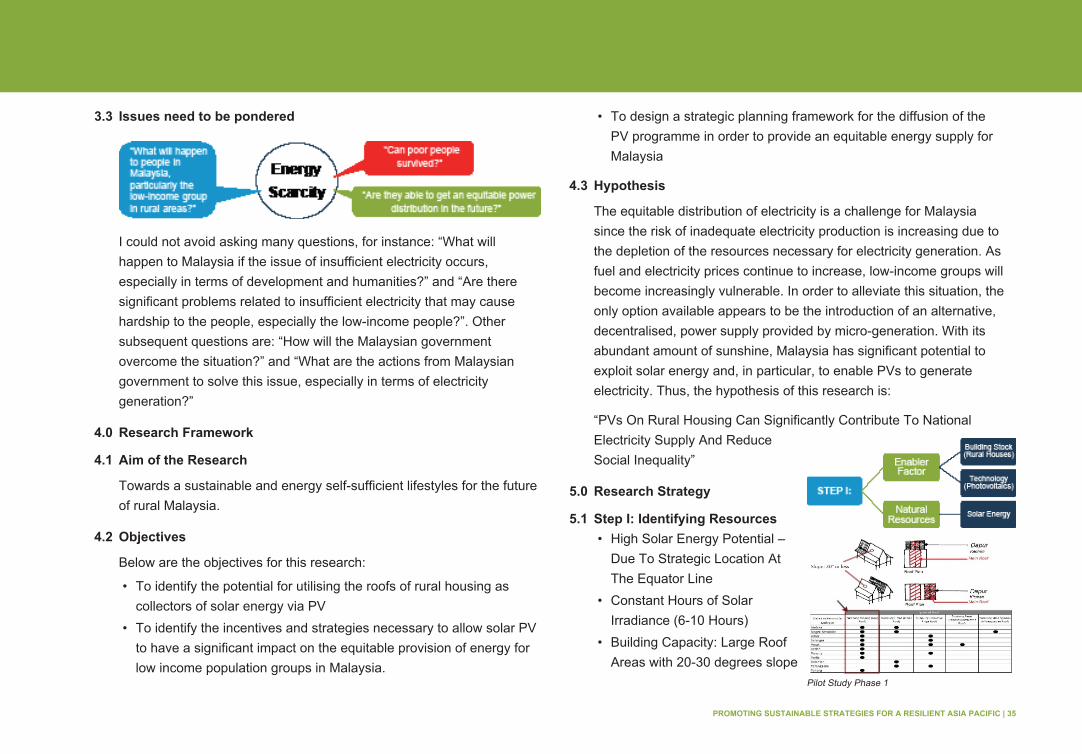
5.0 Research Strategy
5.1 Step I: Identifying Resources• High Solar Energy Potential –
Due To Strategic Location At The Equator Line
• Constant Hours of Solar Irradiance (6-10 Hours)
• Building Capacity: Large Roof Areas with 20-30 degrees slope
Pilot Study Phase 1
36 | PROMOTING SUSTAINABLE STRATEGIES FOR A RESILIENT ASIA PACIFIC
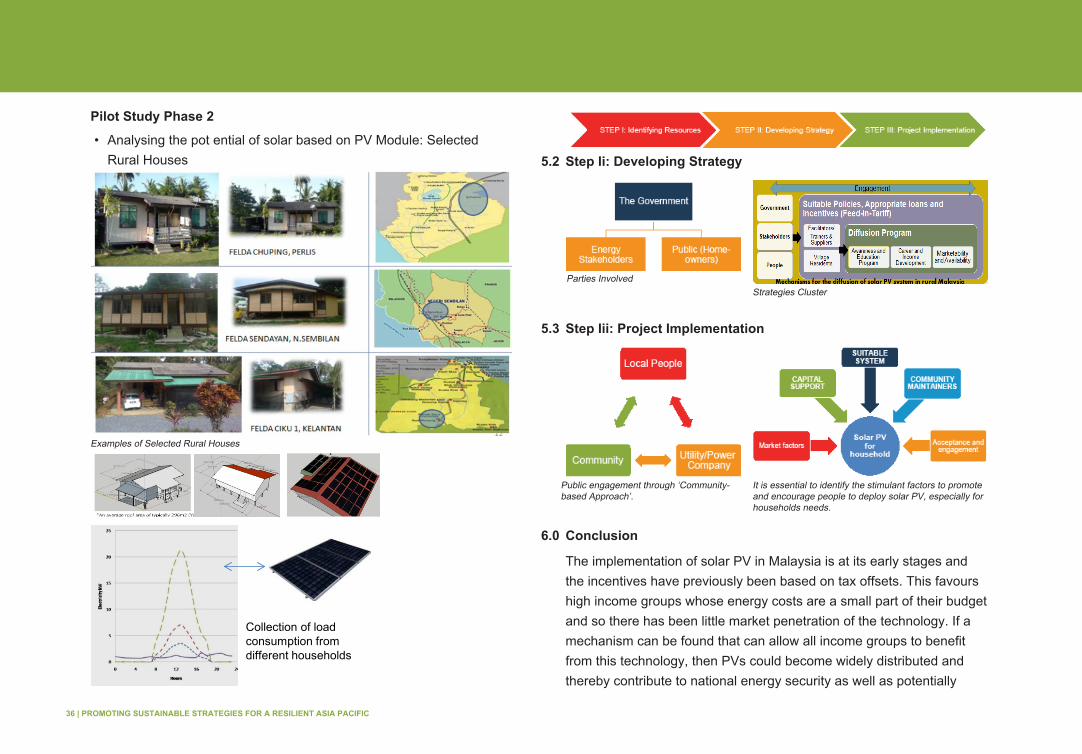
Pilot Study Phase 2
• Analysing the pot ential of solar based on PV Module: Selected Rural Houses 5.2 Step Ii: Developing Strategy
5.3 Step Iii: Project Implementation
6.0 Conclusion
The implementation of solar PV in Malaysia is at its early stages and the incentives have previously been based on tax offsets. This favours high income groups whose energy costs are a small part of their budget and so there has been little market penetration of the technology. If a mechanism can be found that can allow all income groups to benefit from this technology, then PVs could become widely distributed and thereby contribute to national energy security as well as potentially
Examples of Selected Rural Houses
Collection of load consumption from different households
Parties InvolvedStrategies Cluster
Public engagement through ‘Community-based Approach’.
It is essential to identify the stimulant factors to promote and encourage people to deploy solar PV, especially for households needs.
PROMOTING SUSTAINABLE STRATEGIES FOR A RESILIENT ASIA PACIFIC | 37
providing an income for lower income groups. This can reduced inequality and eliminates poverty for low-income groups.
7.0 ReferencesAb Kadir, M. Z. A., Rafeeu, Y., & Adam, N. M. (2010). Prospective scenarios for the full
solar energy development in Malaysia. Renewable and Sustainable Energy Reviews, 14(9), 3023-3031.
Buszynski, L. (2010). Rising Tensions in the South China Sea: Prospects for a Resolution of the Issue. Security Challenges Volume 6(Number 2 (Winter 2010)), 85-104.
Byrd, H. (2010). Energy and Ecology: A View of Malaysia Beyond 2020. Penang: USM Publisher.
CNBC (Writer). (2008). Business news, Segment with Robert L. Hirsh. In Consumer News and Business Channel (Producer). United States: CNBC.
Malaysia (2010). The Tenth Malaysia Plan 20011-2015.Naidu, G. (2010) “Chapter 7: Infrastructure Development in Malaysia.” International
Infrastructure Development in East Asia - Towards Balanced Regional Development and Integration. Ed. Kumar, Nagesh: Economic Research Institute for ASEAN and East Asia, 210. 204-27.
World Bank 2011a, World Bank 2011b.United Nation Development Program (UNDP) 2010, Greenpeace (2011)

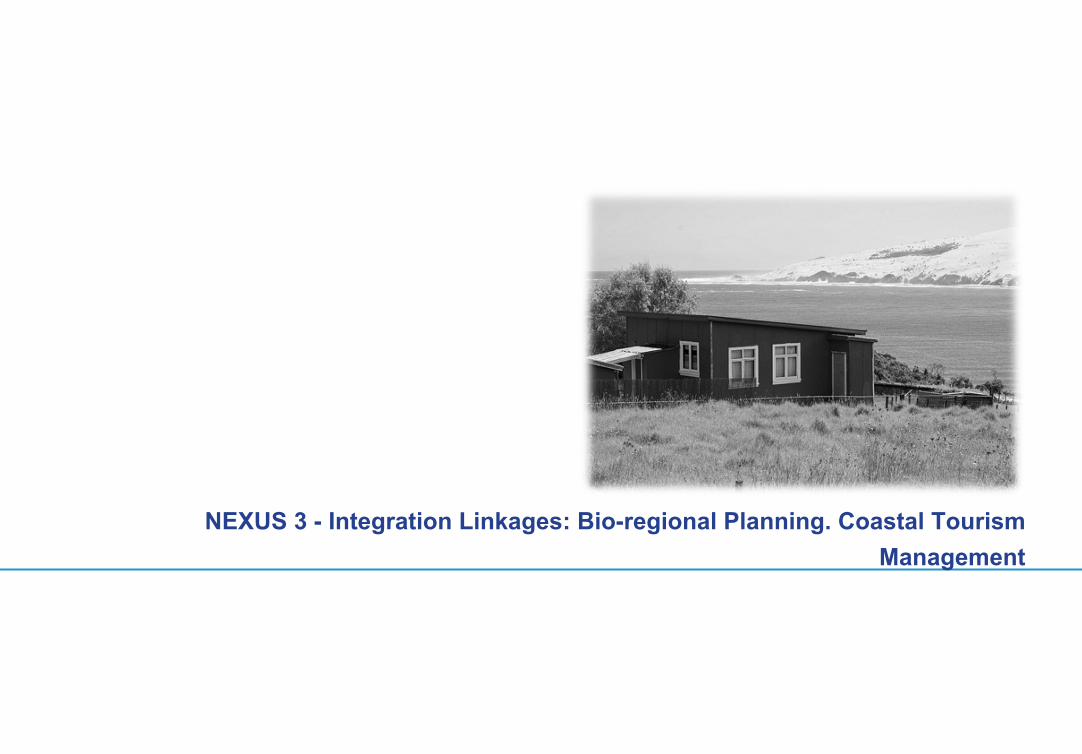
NEXUS 3 - Integration Linkages: Bio-regional Planning. Coastal Tourism Management
40 | PROMOTING SUSTAINABLE STRATEGIES FOR A RESILIENT ASIA PACIFIC
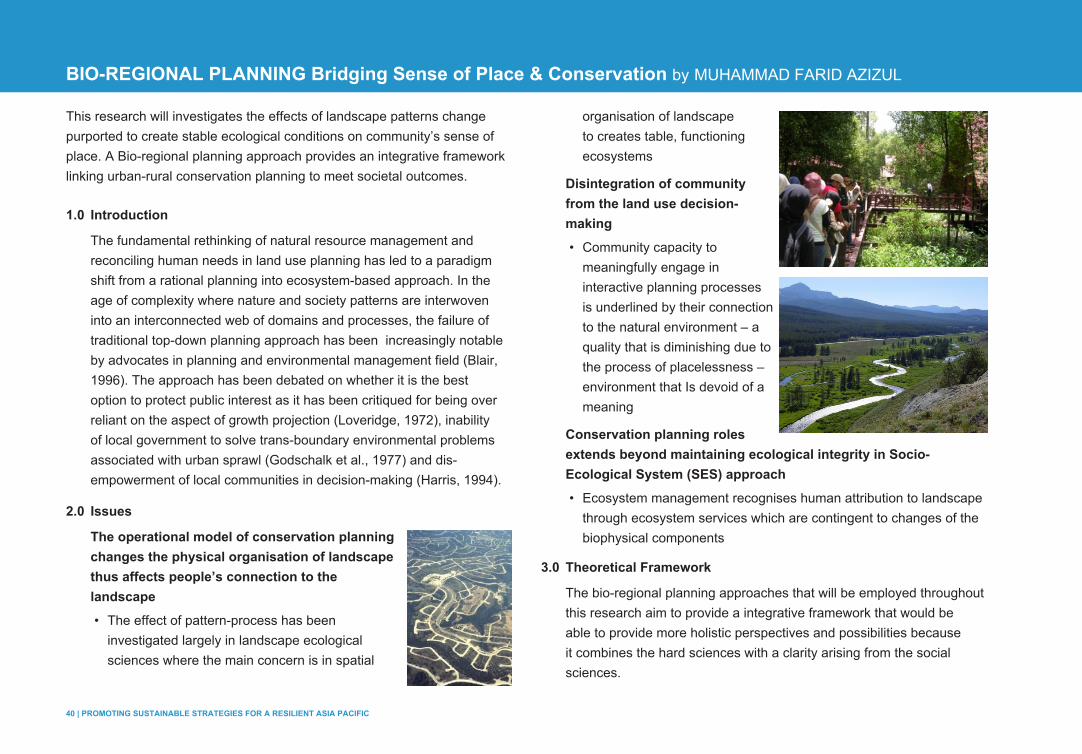
BIO-REGIONAL PLANNING Bridging Sense of Place & Conservation by MUHAMMAD FARID AZIZUL
This research will investigates the effects of landscape patterns change purported to create stable ecological conditions on community’s sense of place. A Bio-regional planning approach provides an integrative framework linking urban-rural conservation planning to meet societal outcomes.
1.0 Introduction
The fundamental rethinking of natural resource management and reconciling human needs in land use planning has led to a paradigm shift from a rational planning into ecosystem-based approach. In the age of complexity where nature and society patterns are interwoven into an interconnected web of domains and processes, the failure of traditional top-down planning approach has been increasingly notable by advocates in planning and environmental management field (Blair, 1996). The approach has been debated on whether it is the best option to protect public interest as it has been critiqued for being over reliant on the aspect of growth projection (Loveridge, 1972), inability of local government to solve trans-boundary environmental problems associated with urban sprawl (Godschalk et al., 1977) and dis-empowerment of local communities in decision-making (Harris, 1994).
2.0 Issues
The operational model of conservation planning changes the physical organisation of landscape thus affects people’s connection to the landscape
• The effect of pattern-process has been investigated largely in landscape ecological sciences where the main concern is in spatial
organisation of landscape to creates table, functioning ecosystems
Disintegration of community from the land use decision-making
• Community capacity to meaningfully engage in interactive planning processes is underlined by their connection to the natural environment – a quality that is diminishing due to the process of placelessness – environment that Is devoid of a meaning
Conservation planning roles extends beyond maintaining ecological integrity in Socio-Ecological System (SES) approach
• Ecosystem management recognises human attribution to landscape through ecosystem services which are contingent to changes of the biophysical components
3.0 Theoretical Framework
The bio-regional planning approaches that will be employed throughout this research aim to provide a integrative framework that would be able to provide more holistic perspectives and possibilities because it combines the hard sciences with a clarity arising from the social sciences.
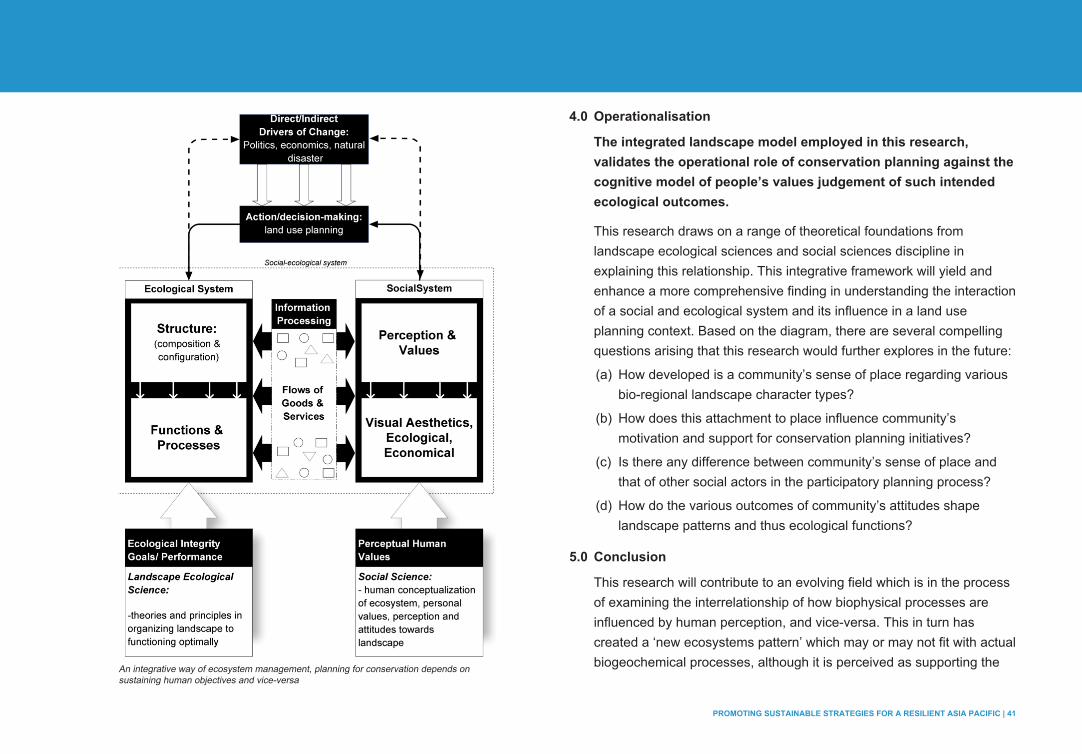
PROMOTING SUSTAINABLE STRATEGIES FOR A RESILIENT ASIA PACIFIC | 41
4.0 Operationalisation
The integrated landscape model employed in this research, validates the operational role of conservation planning against the cognitive model of people’s values judgement of such intended ecological outcomes.
This research draws on a range of theoretical foundations from landscape ecological sciences and social sciences discipline in explaining this relationship. This integrative framework will yield and enhance a more comprehensive finding in understanding the interaction of a social and ecological system and its influence in a land use planning context. Based on the diagram, there are several compelling questions arising that this research would further explores in the future:
(a) How developed is a community’s sense of place regarding various bio-regional landscape character types?
(b) How does this attachment to place influence community’s motivation and support for conservation planning initiatives?
(c) Is there any difference between community’s sense of place and that of other social actors in the participatory planning process?
(d) How do the various outcomes of community’s attitudes shape landscape patterns and thus ecological functions?
5.0 Conclusion
This research will contribute to an evolving field which is in the process of examining the interrelationship of how biophysical processes are influenced by human perception, and vice-versa. This in turn has created a ‘new ecosystems pattern’ which may or may not fit with actual biogeochemical processes, although it is perceived as supporting the An integrative way of ecosystem management, planning for conservation depends on
sustaining human objectives and vice-versa
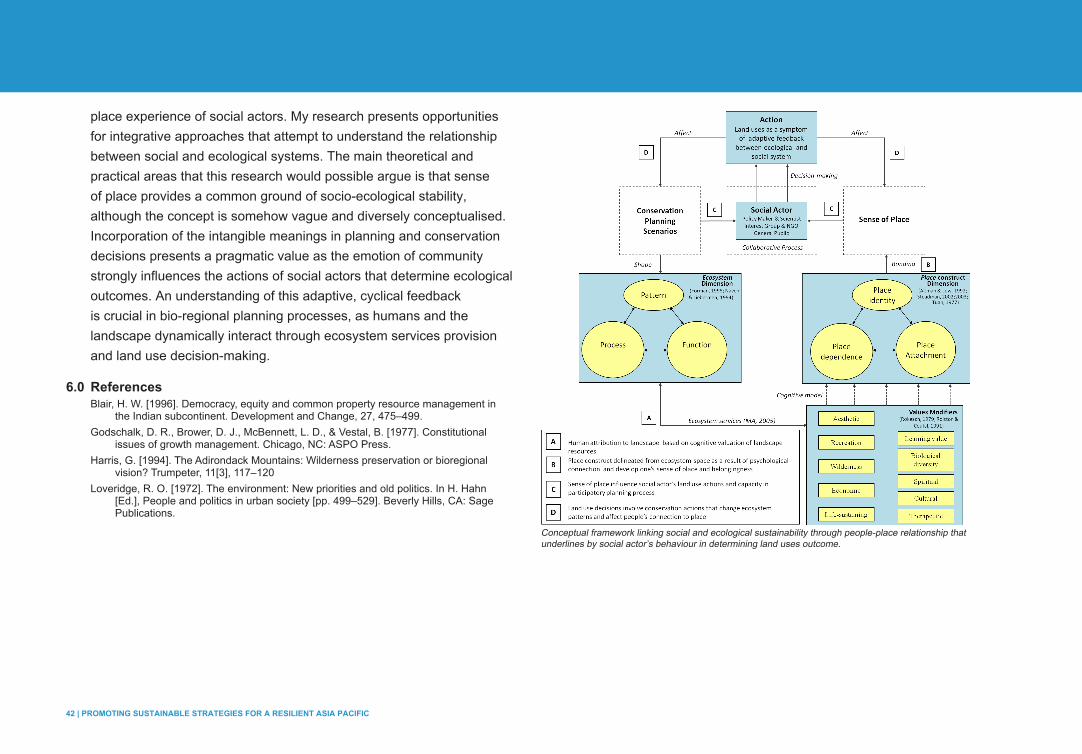
42 | PROMOTING SUSTAINABLE STRATEGIES FOR A RESILIENT ASIA PACIFIC
place experience of social actors. My research presents opportunities for integrative approaches that attempt to understand the relationship between social and ecological systems. The main theoretical and practical areas that this research would possible argue is that sense of place provides a common ground of socio-ecological stability, although the concept is somehow vague and diversely conceptualised. Incorporation of the intangible meanings in planning and conservation decisions presents a pragmatic value as the emotion of community strongly influences the actions of social actors that determine ecological outcomes. An understanding of this adaptive, cyclical feedback is crucial in bio-regional planning processes, as humans and the landscape dynamically interact through ecosystem services provision and land use decision-making.
6.0 ReferencesBlair, H. W. [1996]. Democracy, equity and common property resource management in
the Indian subcontinent. Development and Change, 27, 475–499.Godschalk, D. R., Brower, D. J., McBennett, L. D., & Vestal, B. [1977]. Constitutional
issues of growth management. Chicago, NC: ASPO Press.Harris, G. [1994]. The Adirondack Mountains: Wilderness preservation or bioregional
vision? Trumpeter, 11[3], 117–120Loveridge, R. O. [1972]. The environment: New priorities and old politics. In H. Hahn
[Ed.], People and politics in urban society [pp. 499–529]. Beverly Hills, CA: Sage Publications.
Conceptual framework linking social and ecological sustainability through people-place relationship that underlines by social actor’s behaviour in determining land uses outcome.

PROMOTING SUSTAINABLE STRATEGIES FOR A RESILIENT ASIA PACIFIC | 43
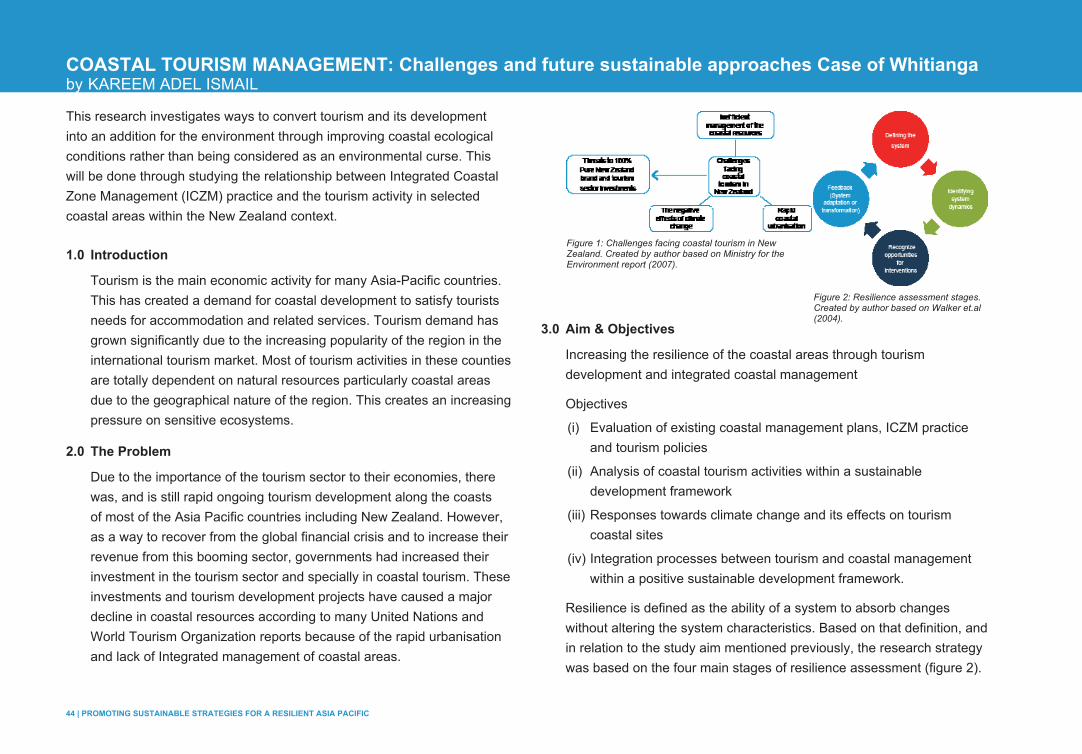
44 | PROMOTING SUSTAINABLE STRATEGIES FOR A RESILIENT ASIA PACIFIC
COASTAL TOURISM MANAGEMENT: Challenges and future sustainable approaches Case of Whitianga by KAREEM ADEL ISMAIL
This research investigates ways to convert tourism and its development into an addition for the environment through improving coastal ecological conditions rather than being considered as an environmental curse. This will be done through studying the relationship between Integrated Coastal Zone Management (ICZM) practice and the tourism activity in selected coastal areas within the New Zealand context.
1.0 Introduction
Tourism is the main economic activity for many Asia-Pacific countries. This has created a demand for coastal development to satisfy tourists needs for accommodation and related services. Tourism demand has grown significantly due to the increasing popularity of the region in the international tourism market. Most of tourism activities in these counties are totally dependent on natural resources particularly coastal areas due to the geographical nature of the region. This creates an increasing pressure on sensitive ecosystems.
2.0 The Problem
Due to the importance of the tourism sector to their economies, there was, and is still rapid ongoing tourism development along the coasts of most of the Asia Pacific countries including New Zealand. However, as a way to recover from the global financial crisis and to increase their revenue from this booming sector, governments had increased their investment in the tourism sector and specially in coastal tourism. These investments and tourism development projects have caused a major decline in coastal resources according to many United Nations and World Tourism Organization reports because of the rapid urbanisation and lack of Integrated management of coastal areas.
3.0 Aim & Objectives
Increasing the resilience of the coastal areas through tourism development and integrated coastal management
Objectives
(i) Evaluation of existing coastal management plans, ICZM practice and tourism policies
(ii) Analysis of coastal tourism activities within a sustainable development framework
(iii) Responses towards climate change and its effects on tourism coastal sites
(iv) Integration processes between tourism and coastal management within a positive sustainable development framework.
Resilience is defined as the ability of a system to absorb changes without altering the system characteristics. Based on that definition, and in relation to the study aim mentioned previously, the research strategy was based on the four main stages of resilience assessment (figure 2).
Figure 1: Challenges facing coastal tourism in New Zealand. Created by author based on Ministry for the Environment report (2007).
Figure 2: Resilience assessment stages. Created by author based on Walker et.al (2004).
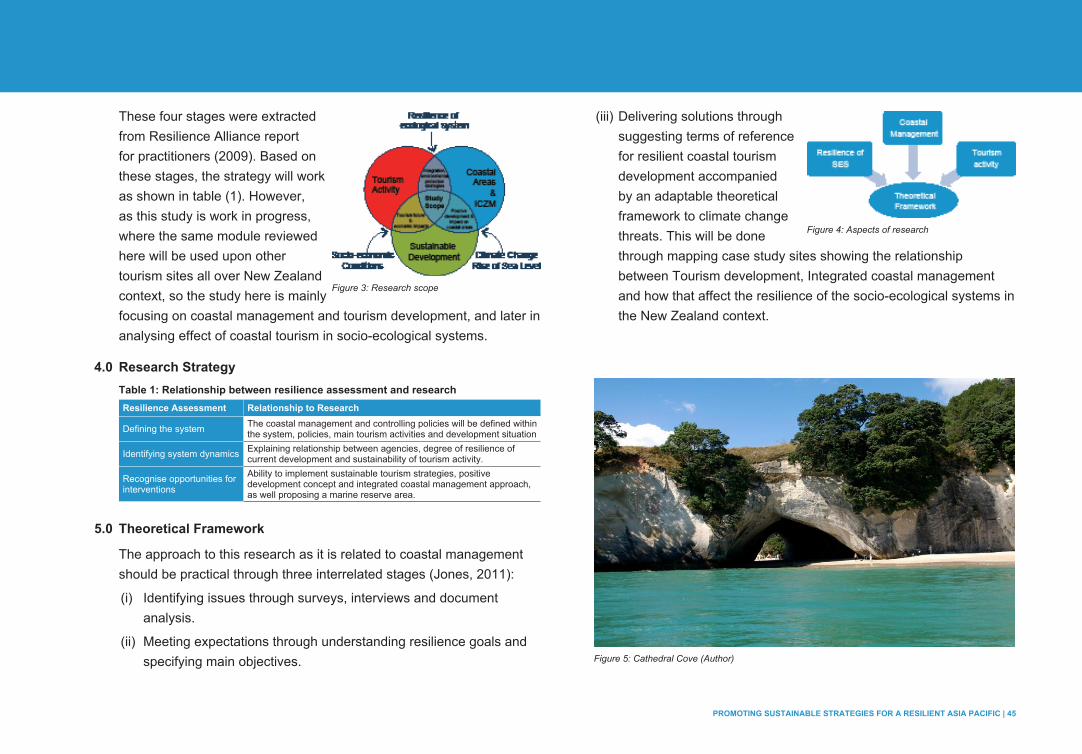
PROMOTING SUSTAINABLE STRATEGIES FOR A RESILIENT ASIA PACIFIC | 45
These four stages were extracted from Resilience Alliance report for practitioners (2009). Based on these stages, the strategy will work as shown in table (1). However, as this study is work in progress, where the same module reviewed here will be used upon other tourism sites all over New Zealand context, so the study here is mainly focusing on coastal management and tourism development, and later in analysing effect of coastal tourism in socio-ecological systems.
4.0 Research StrategyTable 1: Relationship between resilience assessment and researchResilience Assessment Relationship to Research
Defining the system The coastal management and controlling policies will be defined within the system, policies, main tourism activities and development situation
Identifying system dynamics Explaining relationship between agencies, degree of resilience of current development and sustainability of tourism activity.
Recognise opportunities for interventions
Ability to implement sustainable tourism strategies, positive development concept and integrated coastal management approach, as well proposing a marine reserve area.
5.0 Theoretical Framework
The approach to this research as it is related to coastal management should be practical through three interrelated stages (Jones, 2011):
(i) Identifying issues through surveys, interviews and document analysis.
(ii) Meeting expectations through understanding resilience goals and specifying main objectives.
(iii) Delivering solutions through suggesting terms of reference for resilient coastal tourism development accompanied by an adaptable theoretical framework to climate change threats. This will be done through mapping case study sites showing the relationship between Tourism development, Integrated coastal management and how that affect the resilience of the socio-ecological systems in the New Zealand context.
Figure 4: Aspects of research
Figure 5: Cathedral Cove (Author)
Figure 3: Research scope
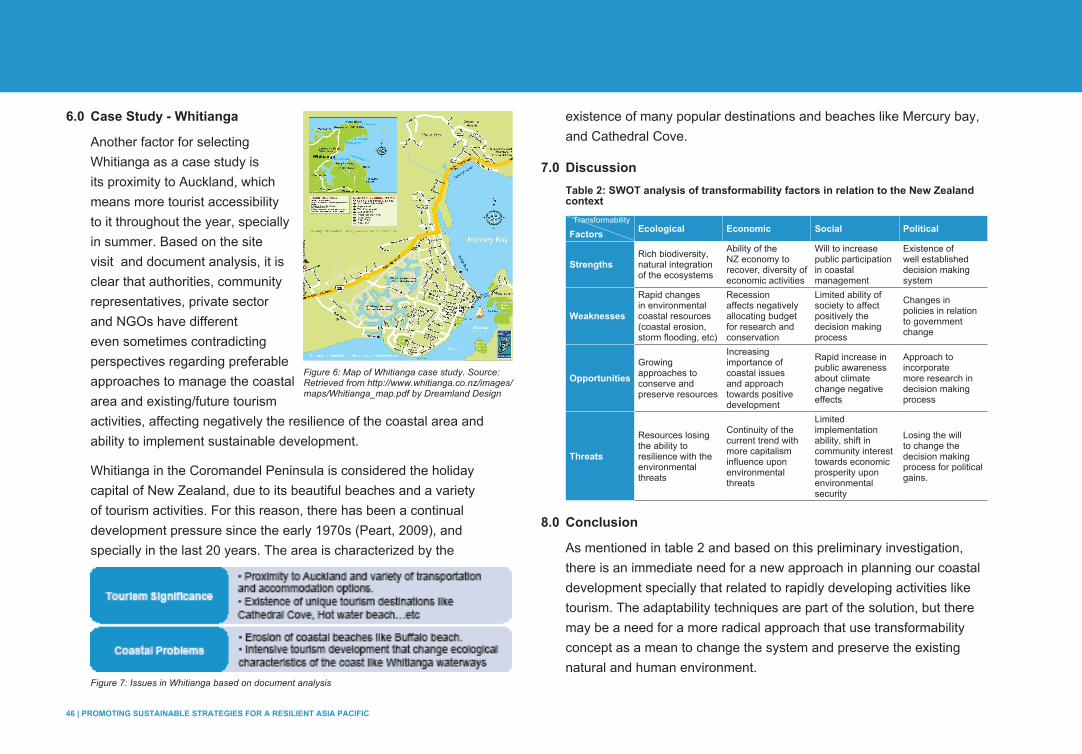
46 | PROMOTING SUSTAINABLE STRATEGIES FOR A RESILIENT ASIA PACIFIC
6.0 Case Study - Whitianga
Another factor for selecting Whitianga as a case study is its proximity to Auckland, which means more tourist accessibility to it throughout the year, specially in summer. Based on the site visit and document analysis, it is clear that authorities, community representatives, private sector and NGOs have different even sometimes contradicting perspectives regarding preferable approaches to manage the coastal area and existing/future tourism activities, affecting negatively the resilience of the coastal area and ability to implement sustainable development.
Whitianga in the Coromandel Peninsula is considered the holiday capital of New Zealand, due to its beautiful beaches and a variety of tourism activities. For this reason, there has been a continual development pressure since the early 1970s (Peart, 2009), and specially in the last 20 years. The area is characterized by the
existence of many popular destinations and beaches like Mercury bay, and Cathedral Cove.
7.0 DiscussionTable 2: SWOT analysis of transformability factors in relation to the New Zealand context
Factors Ecological Economic Social Political
StrengthsRich biodiversity, natural integration of the ecosystems
Ability of the NZ economy to recover, diversity of economic activities
Will to increase public participation in coastal management
Existence of well established decision making system
Weaknesses
Rapid changes in environmental coastal resources (coastal erosion, storm flooding, etc)
Recession affects negatively allocating budget for research and conservation
Limited ability of society to affect positively the decision making process
Changes in policies in relation to government change
OpportunitiesGrowing approaches to conserve and preserve resources
Increasing importance of coastal issues and approach towards positive development
Rapid increase in public awareness about climate change negative effects
Approach to incorporate more research in decision making process
Threats
Resources losing the ability to resilience with the environmental threats
Continuity of the current trend with more capitalism influence upon environmental threats
Limited implementation ability, shift in community interest towards economic prosperity upon environmental security
Losing the will to change the decision making process for political gains.
8.0 Conclusion
As mentioned in table 2 and based on this preliminary investigation, there is an immediate need for a new approach in planning our coastal development specially that related to rapidly developing activities like tourism. The adaptability techniques are part of the solution, but there may be a need for a more radical approach that use transformability concept as a mean to change the system and preserve the existing natural and human environment.
Figure 7: Issues in Whitianga based on document analysis
Transformability
Figure 6: Map of Whitianga case study. Source: Retrieved from http://www.whitianga.co.nz/images/maps/Whitianga_map.pdf by Dreamland Design
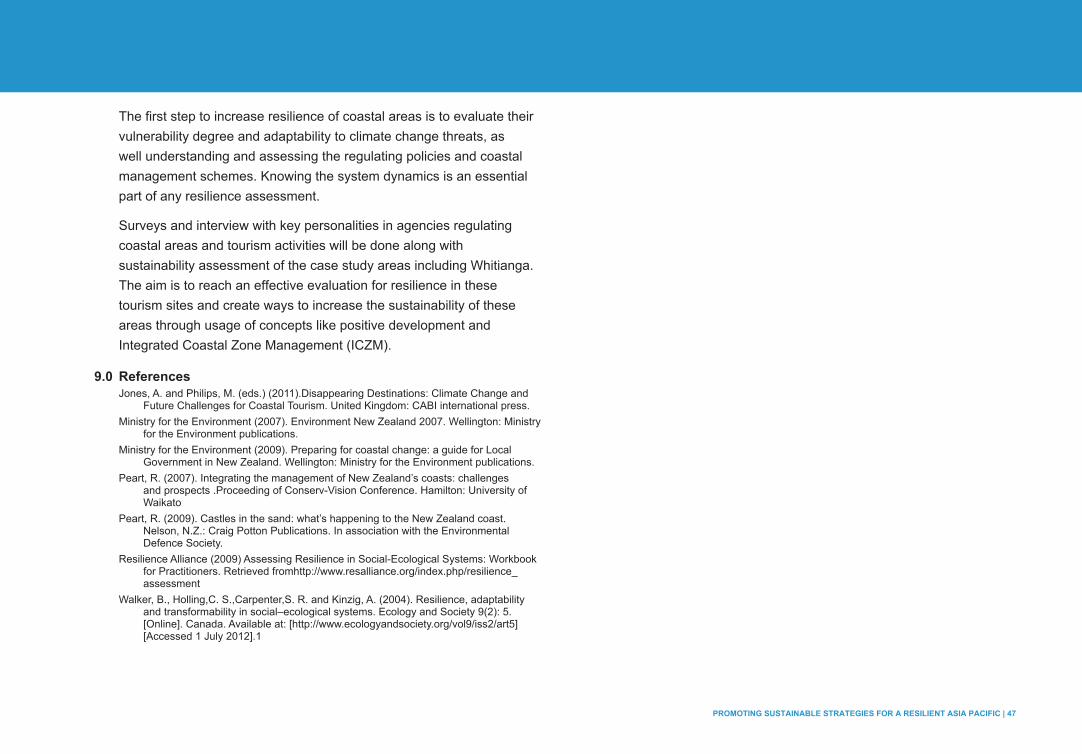
PROMOTING SUSTAINABLE STRATEGIES FOR A RESILIENT ASIA PACIFIC | 47
The first step to increase resilience of coastal areas is to evaluate their vulnerability degree and adaptability to climate change threats, as well understanding and assessing the regulating policies and coastal management schemes. Knowing the system dynamics is an essential part of any resilience assessment.
Surveys and interview with key personalities in agencies regulating coastal areas and tourism activities will be done along with sustainability assessment of the case study areas including Whitianga. The aim is to reach an effective evaluation for resilience in these tourism sites and create ways to increase the sustainability of these areas through usage of concepts like positive development and Integrated Coastal Zone Management (ICZM).
9.0 ReferencesJones, A. and Philips, M. (eds.) (2011).Disappearing Destinations: Climate Change and
Future Challenges for Coastal Tourism. United Kingdom: CABI international press.Ministry for the Environment (2007). Environment New Zealand 2007. Wellington: Ministry
for the Environment publications.Ministry for the Environment (2009). Preparing for coastal change: a guide for Local
Government in New Zealand. Wellington: Ministry for the Environment publications.Peart, R. (2007). Integrating the management of New Zealand’s coasts: challenges
and prospects .Proceeding of Conserv-Vision Conference. Hamilton: University of Waikato
Peart, R. (2009). Castles in the sand: what’s happening to the New Zealand coast. Nelson, N.Z.: Craig Potton Publications. In association with the Environmental Defence Society.
Resilience Alliance (2009) Assessing Resilience in Social-Ecological Systems: Workbook for Practitioners. Retrieved fromhttp://www.resalliance.org/index.php/resilience_assessment
Walker, B., Holling,C. S.,Carpenter,S. R. and Kinzig, A. (2004). Resilience, adaptability and transformability in social–ecological systems. Ecology and Society 9(2): 5. [Online]. Canada. Available at: [http://www.ecologyandsociety.org/vol9/iss2/art5] [Accessed 1 July 2012].1

48 | PROMOTING SUSTAINABLE STRATEGIES FOR A RESILIENT ASIA PACIFIC
PROMOTING SUSTAINABLE STRATEGIES FOR A RESILIENT ASIA PACIFIC | 49
Conclusion - The Integrated Research
It is evident from the case studies in different locations in the Asia-Pacific region that the challenges to achieving resilience are not only multi-dimensional, but greatly dependent on the nature of the study area and its socio-political structures. However, the results derived from these preliminary studies demonstrate the need for an integrated approach to planning to increase the resilience of the communities.
This approach considers the urban-rural interface: Providing opportunities for investigating optimum population densities for urban areas for specific regions with regards to infrastructure availability such as food supply through urban agriculture, water supply and transportation…etc. The flexibility of the module also investigates the creation of other options, such as potential to shift the focus of future settlements to a sustainable rural character. It explores how such options could be supported by a creative approach of land use planning for landscape and usage of renewable resources like solar energy.
In addition to these two approaches, there is a need for a third approach with a more regional focus, that could maintain the socio-ecological systems, protect the environment as well as increase revenue from important economic activities like tourism. Such an approach could depend on bio-regional planning, the implementation of concepts like positive development, integrated management of coastal areas, and sustainable tourism.
This report provides an overview to the research being conducted by a group of PhD candidates at the University of Auckland, The research is work in progress and will be developed further with the hope of providing a.fully integrated approach that offers a holistic understanding of designing for the future in this globalising society.

ISBN: 978-0-9922510-0-0
ISBN: 978-0-9922510-1-7


![presentation for ph.d students -Program- Opening 1st session 2nd session Muhammad Alfian Amrizal [Energy-efficient Multi-level Checkpointing for Heterogenous Computing Systems] [The](https://img.pdfslide.us/doc/110x75/5cfa884188c99315288e24ff/presentation-for-phd-students-program-opening-1st-session-2nd-session-muhammad.jpg)