Embed Size (px)
Citation preview
PROJECT REPORT No. OS63
LIGHT LEAF SPOT (PYRENOPEZIZA BRASSICAE) IN OILSEED
RAPE: EXTENT OF TRIAZOLE FUNGICIDE RESISTANCE IN
SCOTLAND; FUNGICIDE STRATEGIES
MMAARRCCHH 22000033
££55..5500
PROJECT REPORT No. OS63e
LIGHT LEAF SPOT (PYRENOPEZIZA BRASSICAE) IN OILSEED
RAPE: EXTENT OF TRIAZOLE FUNGICIDE RESISTANCE IN
SCOTLAND; FUNGICIDE STRATEGIES
by
F J Burnett
Crop Science Department, SAC, West Mains Road, Edinburgh EH9 3JG
This is the final report of a twenty-five month project which started in November 2000. The work was funded by a grant of £70,000 from HGCA (project no. 2458).
The Home-Grown Cereals Authority (HGCA) has provided funding for this project but has not conducted the research or written this report. While the authors have worked on the best information available to them, neither HGCA nor the authors shall in any event be liable for any loss, damage or injury howsoever suffered directly or indirectly in relation to the report or the research on which it is based. Reference herein to trade names and proprietary products without stating that they are protected does not imply that they may be regarded as unprotected and thus free for general use. No endorsement of named products is intended nor is any criticism implied of other alternative, but unnamed products.
i
CONTENTS 1. ABSTRACT ..................................................................................................................................... 1 2. SUMMARY...................................................................................................................................... 2 Technical detail............................................................................................................................................ 5 3. INTRODUCTION ........................................................................................................................ 5
3.1 Light Leaf Spot..................................................................................................................................... 5 3.2 Decision support systems ..................................................................................................................... 5 3.3 Chemical control .................................................................................................................................. 7 Figure 1. Average winter oilseed rape yields from SAC trials from 1999 and 2000 compared to 4 year average from 1993 - 1997........................................................................................................................... 9 3.4 Project aims ........................................................................................................................................ 10
4. MATERIALS AND METHODS....................................................................................... 11 4.1 Light leaf spot survey ......................................................................................................................... 11 4.2 Fungicide Resistance testing .............................................................................................................. 11 4.3 Fungicide strategy field trials ............................................................................................................. 12 Table 1. Treatment list for Trial 1, Milrig site, West Lothian, 2000/2001 ............................................... 13 Table 2. Treatment list for Trial 2, Blairnathort site, Kinross, 2000/2001 ............................................... 13 Table 3. Treatment list for Trial 3, Kames site, Borders, 2001/2002 ....................................................... 14 Table 4. Treatment list for Trial 4, Blairnathort site, Kinross, 2001/2002 ............................................... 14 Sampling and assessment details for trials: .............................................................................................. 14 Sampling for tebuconazole residues ......................................................................................................... 15
5. RESULTS ........................................................................................................................................ 17 Table 5. Influence of previous fungicide history on mean MIC value of survey isolates......................... 17 Table 6. Influence of variety of oilseed rape on mean MIC value of survey isolates............................... 18 Table 7. Influence of location of oilseed rape on mean MIC value of survey isolates ............................. 19
2000 / 2001 FIELD TRIALS........................................................................................................................ 20 Table 8. MIC values for isolates tested from Trial 1 Milrig, West Lothian site 2000/2001 ..................... 20 Table 9. MIC values for isolates tested from trial 2 Blairnathort, Kinross site 2000/2001 ...................... 21 Table 10. Disease and vigour assessment Trial 1 Milrig, West Lothian site 15 December 2000, GS 1,8 22 Table 11. Disease, scorch and vigour assessment Trial 1 Milrig, West Lothian site 15 February 2001, GS 1,8............................................................................................................................................................. 23 Table 12 Disease, scorch and vigour assessment. Trial 1 Milrig, West Lothian site 26 March 2001, GS 2,4............................................................................................................................................................. 24 Table 13. Disease, scorch and vigour assessmentTrial 1 Milrig, West Lothian site 12 April 2001, GS 3,1.................................................................................................................................................................. 25 Table 14. Disease and height assessment,Trial 1 Milrig, West Lothian site 27 April 2001, GS 3,3 ........ 26 Table 15. Height (8 May 2001) and Yield (15 and 16 August 2001)Trial 1 Milrig, West Lothian site. .. 27 Table 16. Disease, scorch and vigour assessment Trial 2 2000/ 2001 Blairnathort 3 April 2001 GS 3,1 28 Table 17. Yield, Trial 2 Blairnathort 2001 ............................................................................................... 29
2001/2002 FIELD TRIALS.......................................................................................................................... 30 Table 18. MIC values for isolates tested from field trial 3 2002, Kames, Borders site ............................ 30 Table 19. MIC values for isolates tested in Trial 4 2001/2002 Blairnathort, Kinross site........................ 30 Table 20. Disease and vigour assessment. Field trial 3 Kames, Borders site 11 January 2002 GS 1,6 – 1,8.................................................................................................................................................................. 31 Table 21. Disease, vigour and scorch assessment, Field trial 3 Kames, Borders site 27 March 2002 Gs3,1.................................................................................................................................................................. 32 Table 22. Disease and vigour assessment, Field trial 3 Kames, Borders site 9 April 2002 Gs3,3........... 33 Table 23. Disease and vigour assessment, trial 3 Kames, Borders site 25 April 2002 Gs3,7 – 4,0.......... 34 Table 24. Crop Yields Field trial 3 Kames, Borders site. ......................................................................... 35 Table 25. Disease assessment, vigour and scorch, Trial 4, Blairnathort, Kinross site 15 March 2002 GS 1,12........................................................................................................................................................... 36
ii
Table 26. Disease and vigour assessment Trial 4, Blairnathort, Kinross site 9 May 2002 GS 4,1........... 37 Table 27. Crop yield, Trial 4, Blairnathort, Kinross site ......................................................................... 38
6. DISCUSSION................................................................................................................................ 39 6.1 Survey of crops to test for triazole sensitivity in light leaf spot ................................................... 39
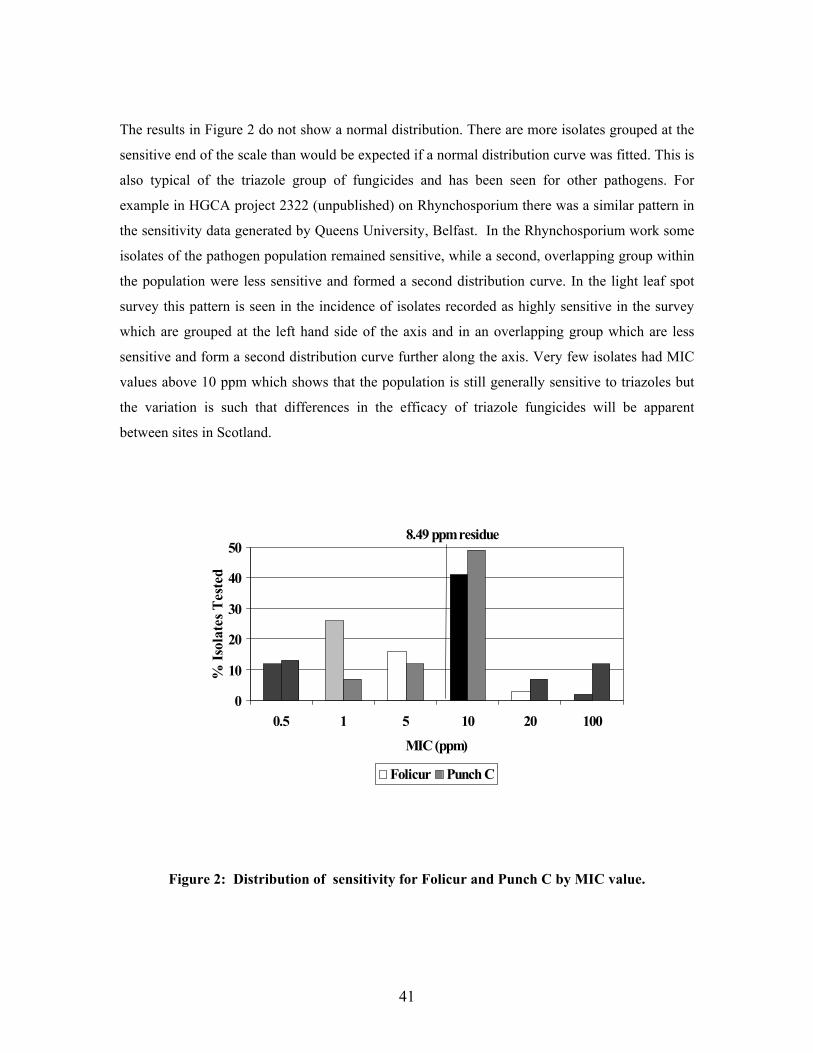
Figure 2: Distribution of sensitivity for Folicur and Punch C by MIC value. ........................................ 41 Figure 3. The relationship between full commercial dose rate and ppm of active ingredient with a line to indicate the maximum residue level detected in leaf tissue following full dose rate treatment................ 43 6.2 Fungicide efficacy in field trials ......................................................................................................... 43 Figure 4. The mean sensitivity (MIC) of light leaf spot from the four trial sites...................................... 44 Figure 5. Light leaf spot levels in the untreated controls at the field trial sites ........................................ 45 Figure 6. The influence of dose rate of Folicur on light leaf spot control at Gs 3,1 and yield, sites 1 and two............................................................................................................................................................ 46 Figure 7. The mean effect of partner fungicides to Folicur on yield and light leaf spot control before second sprays were applied (T2), Sites 1 and 2. ....................................................................................... 47 Figure 8. The influence of crop vigour on yield at Site 3, 2002. .............................................................. 48 Figure 9. Light leaf spot control and yield as a result of Sanction or Bavistan treatment in comparison to Punch C ................................................................................................................................................... 49
7. CONCLUSIONS ......................................................................................................................... 53 8. REFERENCES ............................................................................................................................. 56 9. APPENDICES............................................................................................................................... 59
Appendix A. Summary of competitive ELISA......................................................................................... 61 Sample preparation and competition ELISA protocol.............................................................................. 62 Appendix B. Fungicide sensitivity of isolates tested in survey ................................................................ 64 Appendix C. Field trials site details.......................................................................................................... 67 Field trial site 1 details ............................................................................................................................. 67 Field trial site 2 details ............................................................................................................................. 68 Files trial site 3 details .............................................................................................................................. 69 Field trial site 4 details ............................................................................................................................. 70
1
1. ABSTRACT
In recent seasons the efficacy of triazole fungicides for light leaf spot control in oilseed rape has
markedly declined in high disease pressure areas. The objective of this project was to determine
the distribution of triazole resistance in light leaf spot (Pyrenopeziza brassicae) in Scotland and to
establish how this problem could be managed in cost effective fungicide programmes. Isolates of
P. brassicae were taken from commercial crops and trial sites throughout the main arable areas of
Scotland and their sensitivity to Folicur (a.i. tebuconazole) and Punch C (a.i. flusilazole and
carbenazim) determined. The sensitivity of isolates was very variable and some were up to forty
times less sensitive than the most sensitive isolates. These less sensitive isolates were found in all
the Scottish arable areas surveyed. There was no link between the sensitivity of isolates and the
previous fungicide history of the crop from which they had been sampled.
The occurrence of less sensitive isolates within the P. brassicae population was critical in the
efficacy of triazole fungicides in field trials. Tebuconazole residue analysis a month after autumn
fungicide sprays were applied showed that the fungicide was detectable at more than background
levels following reduced dose rate treatments. Even after a full dose rate treatment levels one
month after treatment were low enough that less sensitive isolates would still have been able to
develop. Disease control data from the trials showed that full and three quarter rate Folicur
(tebuconazole) treatments tended to give significantly better control than half dose rate
treatments. However there were crop safety issues involved in increasing the dose rate and a full
dose rate caused significant losses in crop vigour that were reflected in yield. Punch C (flusilazole
plus carbendazim) did not have the same crop safety issues at higher dose rates. Full rate
treatment of Punch C, however, yielded less than a three quarter dose rate treatment, implying the
three quarter rate was optimal. P. brassicae isolates assayed were generally more sensitive to
Folicur than to Punch C but this was seldom translated into reduced efficacy compared to Folicur
in the field trials. The addition of partner fungicides to the Folicur treatments with alternative
modes of action such as Dithane, Thiovit or Bravo did not significantly improve disease control
and consequently did not offer an effective anti-resistance strategy. Punch C may still offer an
effective anti-resistance strategy in areas where sensitivity to MBC fungicides like carbendazim is
still present. Triazole dose rates of below half as currently commonly used in commercial practice
in Scotland will almost certainly not control light leaf spot effectively.
2
2. SUMMARY
In recent seasons the efficacy of triazole fungicides for light leaf spot control in oilseed rape has
markedly declined in high disease pressure areas. The objective of this project was to determine
the distribution of triazole resistance in the light leaf spot (Pyrenopeziza brassicae) population in
Scotland and to establish how this problem could be managed in cost effective fungicide
programmes.
The distribution of triazole resistance was determined by isolating the fungus from leaf samples
taken from HGCA funded variety trials and from commercial crop. Field trials were established
in the 2000/2001 and 2001/2002 seasons to determine the influence of dose rate on fungicide
efficacy. Two trials were conducted in each season. Additional fungicides with alternative modes
of action were evaluated to see if the efficacy of control from triazoles could be improved by their
use in mixtures which would form an effective anti-resistance strategy. Fungicide residues were
measured in field plants in the winter to determine the impact of fungicide dose on subsequent
residues in new growth in the spring.
The results of the survey showed that the P. brassicae population was very variable in its
sensitivity to the triazole fungicides Folicur (tebuconazole) and Punch C (flusilazole and
carnendazim). The sensitivity of the isolates assayed in the course of this work ranged at least
forty fold from an MIC (minimum inhibitory concentration to prevent fungal growth) value of 0.5
part per million (ppm) Folicur or Punch C to an MIC of 20 ppm. There was no link between area
surveyed and the mean sensitivity of isolates assayed. Less sensitive isolates were isolated from
commercial crops throughout Scotland and were as common in all the regions surveyed. There
was no link determined between the recorded crop history and the sensitivity of the isolates – the
variety sampled did not influence the sensitivity of the isolates and nor did previous fungicide
history.
Comparison with historical data from DuPont (UK) Ltd shows that the proportion of isolates that
will grow on a discriminatory dose of 10 ppm Punch C has increased since 1995, but this shift in
sensitivity has not been large. This is in contrast to resistance to MBC fungicides like
carbendazim where resistant isolates will continue to grow in concentrations in excess of 2000
ppm.
3
The range in sensitivity within the P. brassicae population was still large enough to cause
problems in light leaf spot control in the field. Tebuconazole residue testing showed that a month
after autumn applications to trials the half and three quarter dose rate tebuconazole treatments had
levels of tebuconazole in the leaves that were no greater than the untreated control plots. Even in
the full dose rate treatment sampled a month after spraying the tebuconazole levels were still low
enough that the majority of the P. brassica isolates assayed would have been able to grow. This
demonstrated that dose rate was very critical in the efficacy of control.
Similar results were found in the disease control seen in the field trials. Full and three quarter
dose rate Folicur treatment tended to give significantly better control than half dose rate
treatments. However there were crop safety issues involved in increasing the dose rate and a full
dose rate caused significant losses in crop vigour that were reflected in yield. Given the current
levels of reduced sensitivity to tebuconazole in the Scottish P. brassicae population, dose rates of
below half dose rate Folicur will almost certainly be ineffective in controlling light leaf spot. A
three quarter dose rate probably represents a compromise between this reduced disease efficacy
and the crop damage seen at higher rates. There were no crop safety issues involved in increasing
the dose rate of Punch C, although the full commercial dose rate yielded less than the three
qaurter dose rate treatments, implying the three quartes rate treatment may be optimal. Although
the P. brassiace population was generally less sensitive to Punch C than it was to Folicur the
difference was seldom large enough to translate into a reduction in efficacy in the field. Only at
one of the four trial sites which had a high proportion of tebuconazole sensitive isolates was
Punch C significantly less effective in light leaf spot control when compared to Folicur. At the
other three sites disease control from Punch C was comparable to the Folicur treatments and yield
was equal or better.
There was no influence from dose rate on the sensitivity of isolates and isolates from reduced
dose rate plots were no more or less sensitive than isolates from untreated or full commercial dose
rate plots. The addition of partner fungicides with alternative modes of action such as Dithane,
Thiovit or Bravo did not significantly improve disease control. As a consequence of this lack of
efficacy they did not alter the sensitivity to triazoles of the P. brassicae isolates assayed from the
trials and did not therefore represent an effective anti-resistance strategy. Sanction (straight
flusilazole) was as effective as Punch C in controlling light leaf spot in trials and did not yield
significantly more or less. This implies that the carbendazim component in Punch C was not
contributing much to the disease control and yield benefits seen with this product. However the
4
straight carbendazim product, Bavistan, applied at a rate equivalent to that in full rate Punch C
did show a small effect in reducing light leaf spot levels. This implies that it may still be effective
against a small proportion of the light leaf spot population that remains sensitive to MBC
fungicides like carbendazim and that Punch C may still represent an effective anti-resistance
strategy where this is the case.
The lack of effective mixing partners demonstrated in this work and the widespread occurrence of
MBC resistance makes the use of MBC as an alternative mode of action mixture strategy a
questionable approach. It does however represent the only mixing partner with any efficacy at
present and has to be given consideration because of this. Where there are still MBC sensitive
isolates in the population it may still represent an effective anti-resistant strategy and may prolong
the period of efficacy of the triazoles by avoiding an over reliance on the triazole component.
Triazoles applied at dose rates of less than half the full commercial dose rate, as is common in
commercial practice, will almost certainly not be effective at controlling light leaf spot in
Scotland.
5
Technical detail
3. INTRODUCTION 3.1 Light Leaf Spot
Light leaf spot (Pyrenopeziza brassicae) is one of the most important diseases of winter oilseed
rape (Brassica napus L. oleifra D.C.) in the UK. Oilseed rape is the main arable break crop in the
United Kingdom with over 300 000 hectares grown in 2000, the season just prior to the start of
this project. Over 30 000 ha of this were grown in Scotland (DEFRA, 2001, Scottish Executive
2001)
Each year approximately £9 million are spent on fungicides to control diseases (Fitt et al., 1997)
but despite this, losses of as much as £40 million are attributed to light leaf spot (Gladders, 1998).
Light leaf spot is the most important disease of oilseed rape crops in Scotland, being favoured by
long, cool, wet winters. The disease first appears in the autumn, following infection from infected
seed and stubble, and peaks in the early spring (Sutherland and Griffin-Walker, 1994). The
symptoms are of pale green or bleached leaf blotches, often surrounded by a halo of white spore
droplets. Stems may also develop lesions. Spores from the leaf spots are spread to other leaves,
flower buds, pods and plants by rain splash.
3.2 Decision support systems
Fungicides for the control of light leaf spot do not always guarantee a yield response but omitting
them in high pressure situations can result in large yield losses. Yield losses of up to 3 t/ha are
possible as a result of infection with light leaf spot (Freer et al., 1998). Yield losses are due to
decreased plant populations, decreased seed numbers per plant or decreased thousand seed
weights (Doughty et al., 1995). Losses are, however, very variable between crops and between
seasons and recent work has focused on predicting the likely yield losses as a result of light leaf
spot. This has been done in the hope of forecasting the likely cost benefits of applying fungicides
to control the disease in order to optimise the use of fungicides for control of light leaf spot and
avoid applications to crops that do not need them. The optimum timing for disease control is in
the autumn (Sansford et al. 1996) but symptoms do not appear until later, usually between
December and February (Sutherland et al., 1998). Su et.al. (1998a) found that the incidence of
light leaf spot at growth stage 3,3 (flower buds visible) was closely related to final disease levels
and yield loss. The severity of infection, however, differs between seasons, regions and individual
crops (Fitt et al., 1997). This yield loss model has been incorporated into a forecasting model that
also included, along with the disease incidence data, seasonal risk indexes based on
6
environmental data and crop risk indexes based on agronomic data (Fitt et al., 1996.). The aim of
these schemes has been to predict early in the season when sprays have to be applied and what the
likely yield benefits of fungicide application are likely to be. Such risk predictions for oilseed
rape required to be included into a scheme that managed all diseases and pests on winter oilseed
rape (Fitt et al., 1997). This was subsequently developed as the PASSWORD project. The model
developed by Fitt et al., in 1996 was validated by Sutherland et al. 1998. This showed that while
the model worked well for predictions of high risk there was still a risk of infection in areas
predicted to be at low risk where high levels of disease inoculum were present. The initial model
by Fitt et al. (1996) suggested that early sowing and cultivar susceptibility increased the risk but
that proximity to previous crop did not. The work by Sutherland et al. (1998) suggested that
proximity to previous crop may be more important than previously thought. They concluded this
from the occurrence of light leaf spot as a result of trash borne infection at otherwise low risk
sites. This highlighted that growers should be advised to assess each individual crop even if a
low risk has been predicted for their region.
Varietal resistance is also important in determining the likely response to fungicide sprays aimed
at the control of light leaf spot. Yield losses of 3 t/ha were recorded for the susceptible variety
Bristol in work by Freer et al. 1998. In contrast the resistant variety Rocket when untreated still
out yielded a two spray fungicide treatment applied to Bristol.
Risk prediction at present is based on an assessment of seasonal risk to identify high risk seasons
on the basis of rainfall and temperature, and on crop risk assessment based on sowing date,
varietal resistance, previous cropping and regional disease incidence. In addition the presence of
disease in the crop should be assessed every month from October to March so that the initial risk
assessment can be modified and appropriate fungicide treatment applied (Fitt et al., (1997).
Based on the DEFRA crop survey for England and Wales, the forecast uses light leaf spot levels
on pods at the end of the season to predict the percentage of crops with severe infections in the
following spring. This in turn predicts the number of crops that would respond to fungicide
treatments applied to control the disease in autumn. Levels of disease in the crop in spring can be
used to predict the likely response to a spring fungicide treatment. The prediction scheme was
extended into Scotland in 2000 (Sutherland et al., 2002). Initial results show that the scheme in its
present form is likely to underestimate the risk of light leaf spot infection in Scotland and that it
needs to be modified for Scottish conditions to allow for more accurate predications (Sutherland
7
et al., 2002). In general terms though crops in Scotland are far more likely to be sprayed routinely
for light leaf spot and give far more consistent responses to fungicides controlling light leaf spot
between season than is the case in England where crops are judged to be at much lower risk
(Wale et al. 1990).
The light leaf spot forecast is available to growers via the Internet at
http//www3.res.bbsrc.ac.uk/leafspot/forecast/. It allows growers to enter information on factors
which influence severity such as region, variety and sowing date. It does not at present provide
any information on product or dose rate selection or on what actions should be taken if weather
and ground conditions prevent application at optimum times.
The development of the Pest and Disease Management System for Supporting Winter Oilseed
Rape Decisions (PASSWORD) project aims to integrate as one Internet-based system the light
leaf spot risk predication scheme described, with decision making information on other diseases
such as phoma stem canker as well as integrating this with a key insect pest control decision
support system (Sutherland et al., 2002).
3.3 Chemical control
Growers in Scotland routinely apply fungicides to winter oilseed rape in the autumn and spring
for control of light leaf spot and yield benefits of up to 3 t/ha are possible (Freer et al., 1998).
SAC trials show that the most cost effective fungicide programmes for light leaf spot control
consist of an autumn and spring application of a triazole fungicide such as tebuconazole (Folicur)
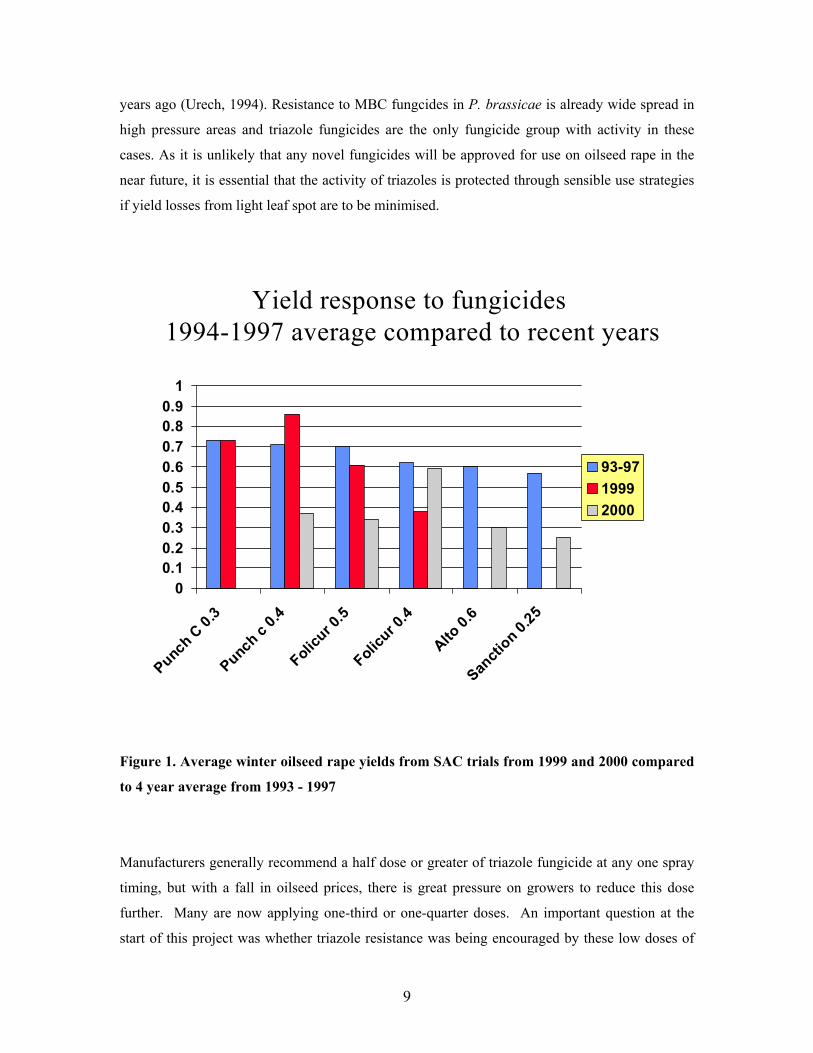
or flusilazole + MBC (Punch C). In recent seasons, however, the efficacy of the triazole
fungicides in areas of high light leaf spot pressure has declined (Figure 1). In 2000, there was a
noticeable reduction in yield response compared to previous years. For example, Punch C at 0.4
l/ha, that had previously been a robust enough dose to control the disease, appeared to be less
effective. There have also been widespread reports of disease control failure on farm. It is
suspected that triazole resistance may be widespread throughout the UK and that it may be linked
to the areas of most intense disease pressure and fungicide use such as Scotland. This is of great
concern since growers rely wholly on triazoles for light leaf spot control.
The use of MBC fungicides for the control of light leaf spot was common in Scotland in the mid
1980s and early 1990s (Bowen et al., 1993). A study in 1987 (Ilott et al., 1997) demonstrated that
8
isolates were very sensitive to the MBC fungicide benomyl. All the field isolates surveyed at this
time had MIC values (minimum inhibitory concentration of fungicide which will prevent growth)
of less than 1ppm. By the early 1990s, however, disease control failures were common in high
disease pressure areas like the north east of Scotland. This coincided with seasons of more intense
disease pressure (Sutherland and Griffin-Walker, 1994). Sutherland and Griffin-Walker (1994)
found that in contrast to the earlier work, 96% of field isolates assayed from the north east of
Scotland grew on 1ppm carbendazim and 25% of these isolates could continue to grow on
concentrations in excess of 2000ppm. They linked this with the failure of MBC fungicides to
control light leaf spot in this area in 1993.
MBC fungicides still appear to be effective against light leaf spot in England & Wales (Gladders,
pers.comm.), so they may continue to play a part in mixtures to reduce any potential slide in the
effectiveness of triazole fungicides in areas where MBC fungicides remain effective. However,
Freer et al. (1998) found at a trial site in Suffolk that triazole fungicides were more effective than
MBC fungicides. Straight MBC treatments did not reduce light leaf spot levels compared to the
untreated control. No resistance testing was done as part of this study but the implication is that
MBC resistance may have been present at the site.
In view of the widespread resistance to MBC fungicides, there was a need to revisit fungicides
that in previous trials showed minimal effects e.g. sulphur and chlorothalonil. Such compounds
may play a part in maintaining control with triazole fungicides if used in mixtures. Strobilurin
fungicides that have transformed cereal fungicide programmes show little effect against light leaf
spot control in winter oilseed rape (Simon Oxley, SAC trial report 1999), therefore current
strobilurin fungicides are unlikely to gain approval for oilseed rape. Other oilseed rape
fungicides, such as iprodione and vinclozolin, have limited effect on light leaf spot and as a result
triazole fungicides will continue to be the main defence against light leaf spot in the near future.
Mixtures or alternations of fungicides with alternative modes of action in a spray programme are
an important defense against the development of fungicide resistance (Jones, 1994). The use of
such anti-resistance strategies are very important in prolonging the useful life of fungicides, even
once resistance in the pathogen has started to develop. In an example borrowed from potato
blight, the statutory requirement to use phenylamide fungicides in mixtures with fungicides with
alternative modes of action meant that the phenylamides remained the mainstay of potato blight
fungicide programmes despite resistance to phenylamides having been identified more than 20
9
years ago (Urech, 1994). Resistance to MBC fungcides in P. brassicae is already wide spread in
high pressure areas and triazole fungicides are the only fungicide group with activity in these
cases. As it is unlikely that any novel fungicides will be approved for use on oilseed rape in the
near future, it is essential that the activity of triazoles is protected through sensible use strategies
if yield losses from light leaf spot are to be minimised.
Figure 1. Average winter oilseed rape yields from SAC trials from 1999 and 2000 compared
to 4 year average from 1993 - 1997
Manufacturers generally recommend a half dose or greater of triazole fungicide at any one spray
timing, but with a fall in oilseed prices, there is great pressure on growers to reduce this dose
further. Many are now applying one-third or one-quarter doses. An important question at the
start of this project was whether triazole resistance was being encouraged by these low doses of
Yield response to fungicides 1994-1997 average compared to recent years
00.10.20.30.40.50.60.70.80.9
1
Punch C 0.3
Punch c 0.4
Folicur 0
.5
Folicur 0
.4
Alto 0.6
Sancti
on 0.25
93-9719992000
10
fungicide or whether poor disease control was as a result of reduced longevity of activity that is
being construed as resistance.
The development of triazole resistance would have a direct effect on the levy payers, with less
effective disease control and poor returns. Resistance will also have implications for other
HGCA funded research such as variety testing and the PASSWORD project. The UK variety list
is based on comparisons of varieties untreated and treated with triazole fungicides. If any of the
variety test sites has a triazole resistant light leaf spot population then this could favour resistant
but lower yielding varieties over susceptible but higher yielding varieties. It could also affect
potential new variety screening.
3.4 Project aims
The aim of this project was to determine how triazole resistance in the Pyrenopeziza brassicae
population is distributed in Scotland. Base line sensitivity data was supplied by DuPont, that
would confirm if there has been a shift throughout Scotland or if this decline in triazole sensitivity
affects only certain areas. It is critical that fungicide strategies are developed to minimise the risk
of resistance and retain the efficacy of the triazole fungicides against light leaf spot.
In order to determine if dose rate was a factor in the reported problems of light leaf spot control,
fungicide levels in leaves were tested. A recent HGCA project (Oxley, 1999) developed an
accurate diagnostic to measure fungicide residues of tebuconazole in leaves. This test provides a
valuable way to monitor the way different doses of tebuconazole are distributed in the crop over
the winter and can indicate when residues are too low to provide further control in the spring.
Testing also provides a useful method to directly compare effective fungicide doses in the
laboratory with actual fungicide residues typically found in oilseed rape plants.
11
4. MATERIALS AND METHODS
The project experimental work was conducted over two years and there were two main sections
to the work. The first involved a survey of winter oilseed rape crops around Scotland to determine
the occurrence and distribution of resistance. The second investigated the influence of fungicide
control strategies on the sensitivity of isolates through dedicated field trials. Leaf samples taken
from these field trials were tested for tebuconazole residues to determine if dose rate applied was
adequate for disease control purposes.
4.1 Light leaf spot survey
Samples of light leaf spot were collected from commercial farms throughout the main arable
areas of Scotland. Samples of light leaf spot were also collected from leaves taken from the
untreated plots in HGCA winter oilseed rape variety trials at sites located throughout Scotland.
Additional isolates were collected across Scotland by sampling leaves from winter oilseed rape
crops monitored for a SEERAD funded Crop Health Advisory Activity. Ten whole plants with
roots or 50 infected leaves per crop were selected and sealed in plastic bags. Samples were taken
by selecting leaves or plants with visible symptoms of light leaf spot. In the laboratory isolates
were taken by selecting infected leaves and incubating these leaves in damp chambers at 18°C
for 48 hours. After this time the white spore droplets were clearly visible under a dissection
microscope. A sterile needle was used to pick spores from the leaf surface. Spores were plated
onto either antibiotic amended Potato Dextrose Agar or onto antibiotic amended Malt Yeast Agar.
In general the PDA had a higher recovery rate and was used exclusively in the second year of the
project. Any plates showing fungal or bacterial contamination were discarded. The isolates
recovered were kept at 18°C and were re-isolated onto fresh agar plates every four to six weeks as
required until there was sufficient isolates to start fungicide resistance testing.
4.2 Fungicide Resistance testing
Plugs of the isolates to be tested were placed in the centre of agar amended plates and the
sensitivity of the isolates determined as measured by the minimum inhibitory concentration
needed to halt isolate growth.
Folicur (tebuconazole) was the test fungicide selected to determine triazole resistance. In the first
year of the project the number of light leaf spot isolates that could be tested was limited by
reductions in access to farms as a result of the foot and mouth epidemic. This meant that
12
resources were available to test isolates for sensitivity to Punch C (flusilazole + carbendazim),
and this testing was continued in the second year of the project.
In year one the concentrations of Folicur and Punch C used in tests were, 0, 1,10, 100 and 1000
parts per million (ppm). In the second year, because of the range of sensitivities found in the first
year, the concentrations were revised to 0.1, 0.5, 1, 5 and 10 ppm. In the second year any isolates
that grew on 10 ppm were re tested on 20 ppm and 30 ppm amended agar. The concentrations
used for Punch C were calculated for the flusilazole component.
Five replicate plates of each isolate were established at each concentration. The diameter of the
colony was measured at the start of the test and again after 7, 14 and 28 days. The measurements
after 28 days were then used to determine the minimum inhibitory concentration of the test
fungicide.
4.3 Fungicide strategy field trials
Field trials were established in high risk areas in both years of the project to determine the
efficacy of the fungicides and the effect of fungicide programmes on the sensitivity of the light
leaf spot populations.
Isolates were taken from trials before in March or April, before spring applications of fungicide
spray applications by sampling leaves as described in section 4.2 and their sensitivity to Folicur
and Punch C tested, also as described in section 4.2. Included in the fungicide programmes was a
study of the importance of dose rate to determine if low doses promote or reduce the likelihood of
triazole resistance.
Four field trials were carried out in total, two in 2000/2001 and two in 2001/2002. The variety
used was Synergy. There were four replicates of every treatment with the exception of Trial 2
where there were three replicates. Plot sizes ranged from 2 by 18 m to 2 by 20 m. The trial design
was complete randomised blocks. Site details are shown in appendix C.
The treatment lists are shown in tables 1, 2, 3 and 4.
13
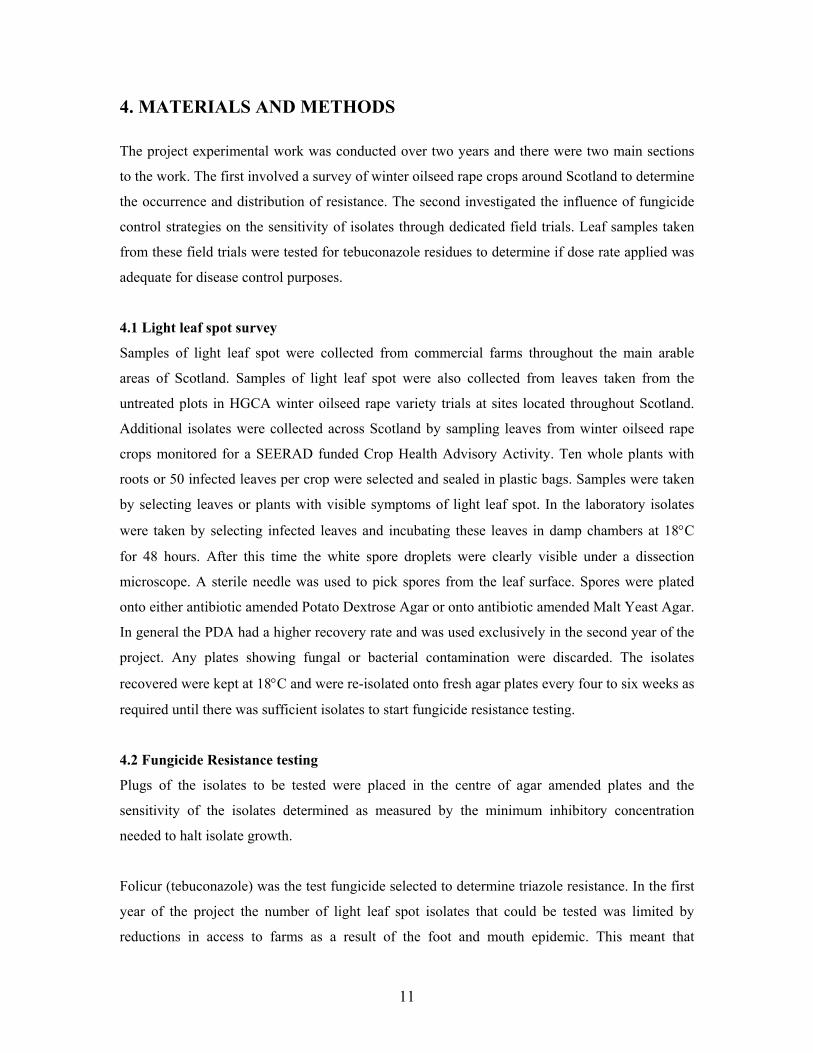
Table 1. Treatment list for Trial 1, Milrig site, West Lothian, 2000/2001
Autumn treatment (T1)
Dose rate as l/ha
Spring treatment (T2)
Dose rate as l/ha
1 Nil Folicur 0.5
2 Folicur 0.5 Folicur 0.5
3 Folicur 0.75 Folicur 0.5
4 Folicur 1.0 Folicur 0.5
5 Folicur 0.5 + Bravo 2.0 Folicur 0.5
6 Folicur 0.5 + Thiovit 10 kg Folicur 0.5
7 Folicur 0.5 + Dithane 945 1.7 kg Folicur 0.5
8 Bravo 2.0 Folicur 0.5
9 Thiovit 10 kg Folicur 0.5
10 Dithane 945 1.7 kg Folicur 0.5
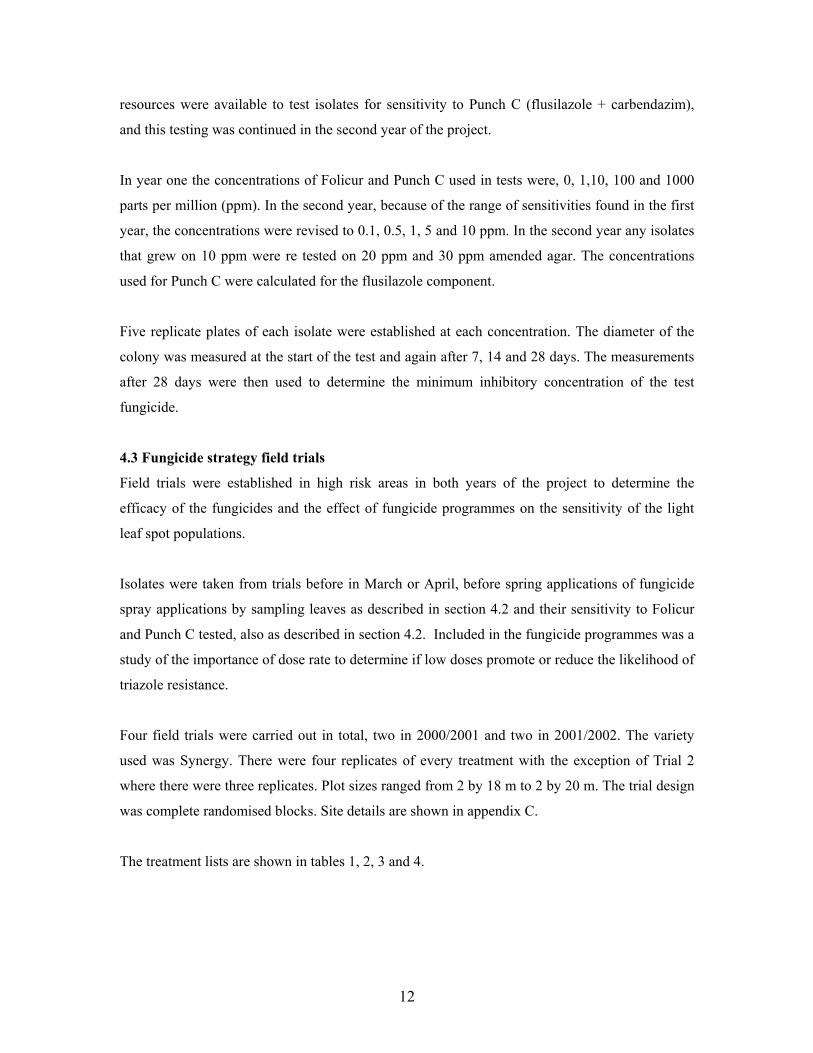
Table 2. Treatment list for Trial 2, Blairnathort site, Kinross, 2000/2001
Autumn treatment (T1)
Dose rate as l/ha
Spring treatment (T2)
Dose rate as l/ha
1 Nil Nil
2 Punch C 0.4 Punch C 0.4
3 Folicur 0.5 Folicur 0.5
4 Folicur 1.0 Folicur 1.0
5 Foplicur 0.5 + Bravo 2.0 Foplicur 0.5 + Bravo 2.0
6 Folicur 0.5 + Thiovit 10 kg Folicur 0.5 + Thiovit 10 kg
7 Folicur 0.5 + Dithane superflo 2.8 l/ha Folicur 0.5 + Dithane superflo
2.8 l/ha
8 Bravo 2.0 Bravo 2.0
9 Thiovit 10 kg Thiovit 10 kg
10 Dithane superflo 2.8 l/ha Dithane superflo 2.8 l/ha
14
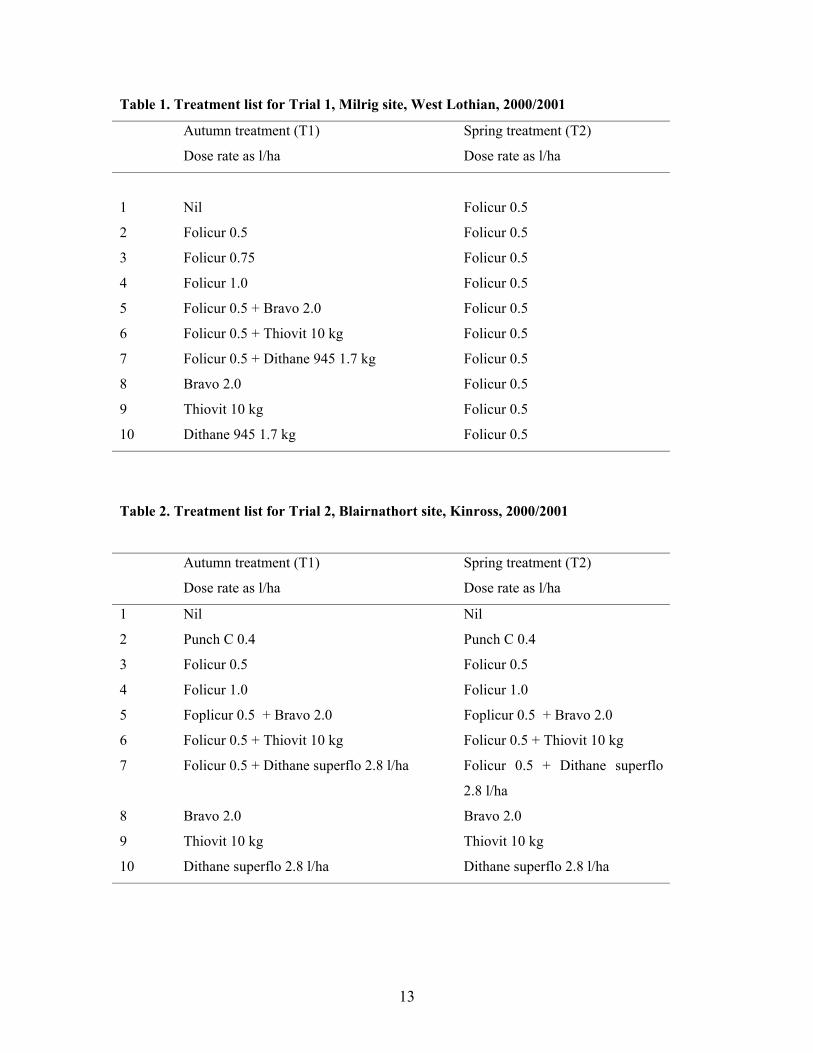
Table 3. Treatment list for Trial 3, Kames site, Borders, 2001/2002
Autumn treatment (T1)
Dose rate as l/ha
Spring treatment (T2)
Dose rate as l/ha
1 Nil Nil
2 Nil Folicur 0.5
3 Folicur 0.5 Folicur 0.5
4 Folicur 0.75 Folicur 0.5
5 Folicur 1.0 Folicur 0.5
6 Punch C 0.4 Folicur 0.5
7 Punch C 0.6 Folicur 0.5
8 Punch C 0.8 Folicur 0.5
9 Bavisitin 0.2 l/ha Folicur 0.5
10 Sanction 0.8 Folicur 0.5
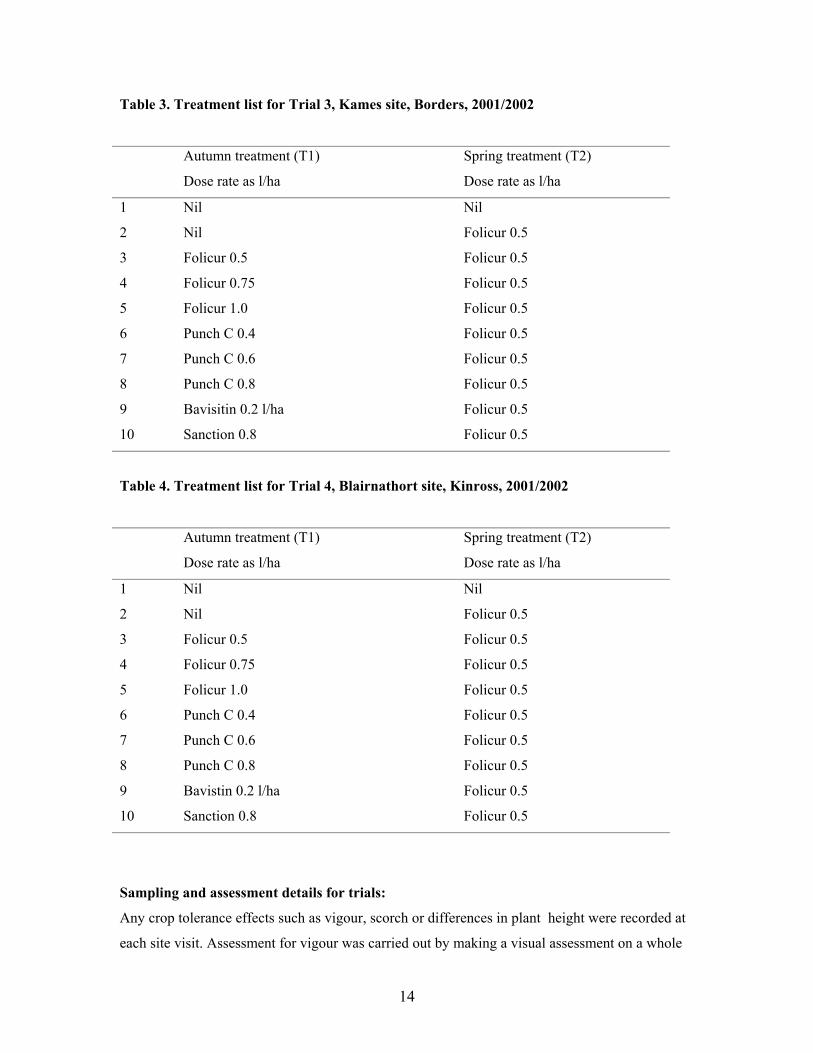
Table 4. Treatment list for Trial 4, Blairnathort site, Kinross, 2001/2002
Autumn treatment (T1)
Dose rate as l/ha
Spring treatment (T2)
Dose rate as l/ha
1 Nil Nil
2 Nil Folicur 0.5
3 Folicur 0.5 Folicur 0.5
4 Folicur 0.75 Folicur 0.5
5 Folicur 1.0 Folicur 0.5
6 Punch C 0.4 Folicur 0.5
7 Punch C 0.6 Folicur 0.5
8 Punch C 0.8 Folicur 0.5
9 Bavistin 0.2 l/ha Folicur 0.5
10 Sanction 0.8 Folicur 0.5
Sampling and assessment details for trials:
Any crop tolerance effects such as vigour, scorch or differences in plant height were recorded at
each site visit. Assessment for vigour was carried out by making a visual assessment on a whole
15
plot basis of the health , leaf colour, and biomass of plants. This was recorded on a scale of 1 – 9
with 9 representing high vigour. Scorch was also recorded on a whole plot basis on a 1 - 9 scale
with 9 representing 100% scorch. The growth stage was also assessed (Sylvester-Bradley, 1985).
Efficacy of fungicide was assessed by recording the mean % disease per plant and the %
incidence of infected plants per plot.
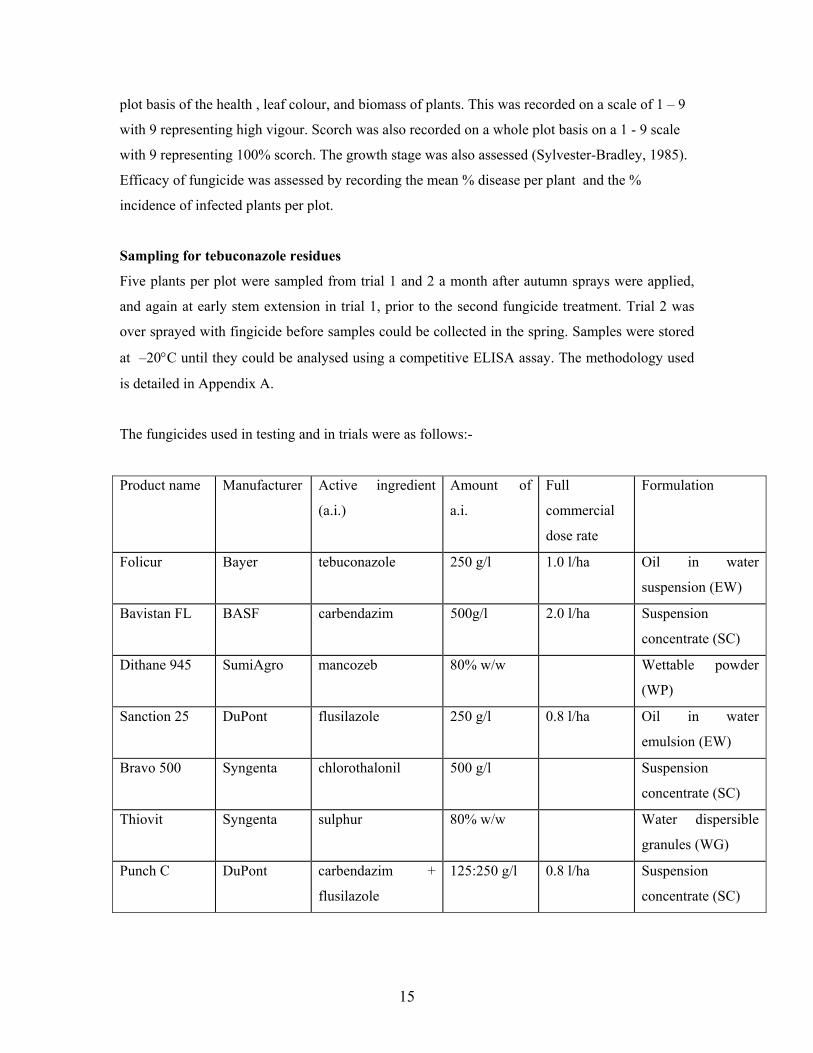
Sampling for tebuconazole residues
Five plants per plot were sampled from trial 1 and 2 a month after autumn sprays were applied,
and again at early stem extension in trial 1, prior to the second fungicide treatment. Trial 2 was
over sprayed with fingicide before samples could be collected in the spring. Samples were stored
at –20°C until they could be analysed using a competitive ELISA assay. The methodology used
is detailed in Appendix A.
The fungicides used in testing and in trials were as follows:-
Product name Manufacturer Active ingredient
(a.i.)
Amount of
a.i.
Full
commercial
dose rate
Formulation
Folicur Bayer tebuconazole 250 g/l 1.0 l/ha Oil in water
suspension (EW)
Bavistan FL BASF carbendazim 500g/l 2.0 l/ha Suspension
concentrate (SC)
Dithane 945 SumiAgro mancozeb 80% w/w Wettable powder
(WP)
Sanction 25 DuPont flusilazole 250 g/l 0.8 l/ha Oil in water
emulsion (EW)
Bravo 500 Syngenta chlorothalonil 500 g/l Suspension
concentrate (SC)
Thiovit Syngenta sulphur 80% w/w Water dispersible
granules (WG)
Punch C DuPont carbendazim +
flusilazole
125:250 g/l 0.8 l/ha Suspension
concentrate (SC)

16
The methods used in the course of this project and the data generated were covered by a quality
assurance system operated by SAC Crop Science and Agronomy Departments which is both GLP
and PSD (efficacy) compliant.
17
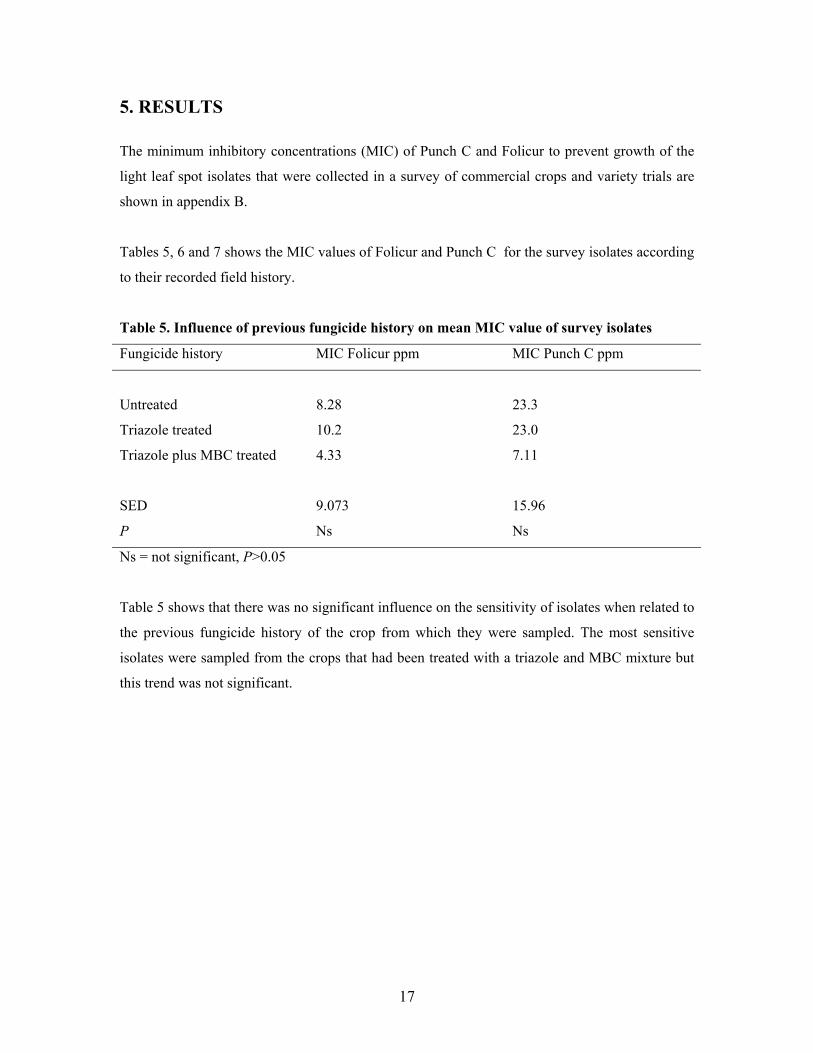
5. RESULTS
The minimum inhibitory concentrations (MIC) of Punch C and Folicur to prevent growth of the
light leaf spot isolates that were collected in a survey of commercial crops and variety trials are
shown in appendix B.
Tables 5, 6 and 7 shows the MIC values of Folicur and Punch C for the survey isolates according
to their recorded field history.
Table 5. Influence of previous fungicide history on mean MIC value of survey isolates
Fungicide history MIC Folicur ppm MIC Punch C ppm
Untreated 8.28 23.3
Triazole treated 10.2 23.0
Triazole plus MBC treated 4.33 7.11
SED 9.073 15.96
P Ns Ns
Ns = not significant, P>0.05
Table 5 shows that there was no significant influence on the sensitivity of isolates when related to
the previous fungicide history of the crop from which they were sampled. The most sensitive
isolates were sampled from the crops that had been treated with a triazole and MBC mixture but
this trend was not significant.
18
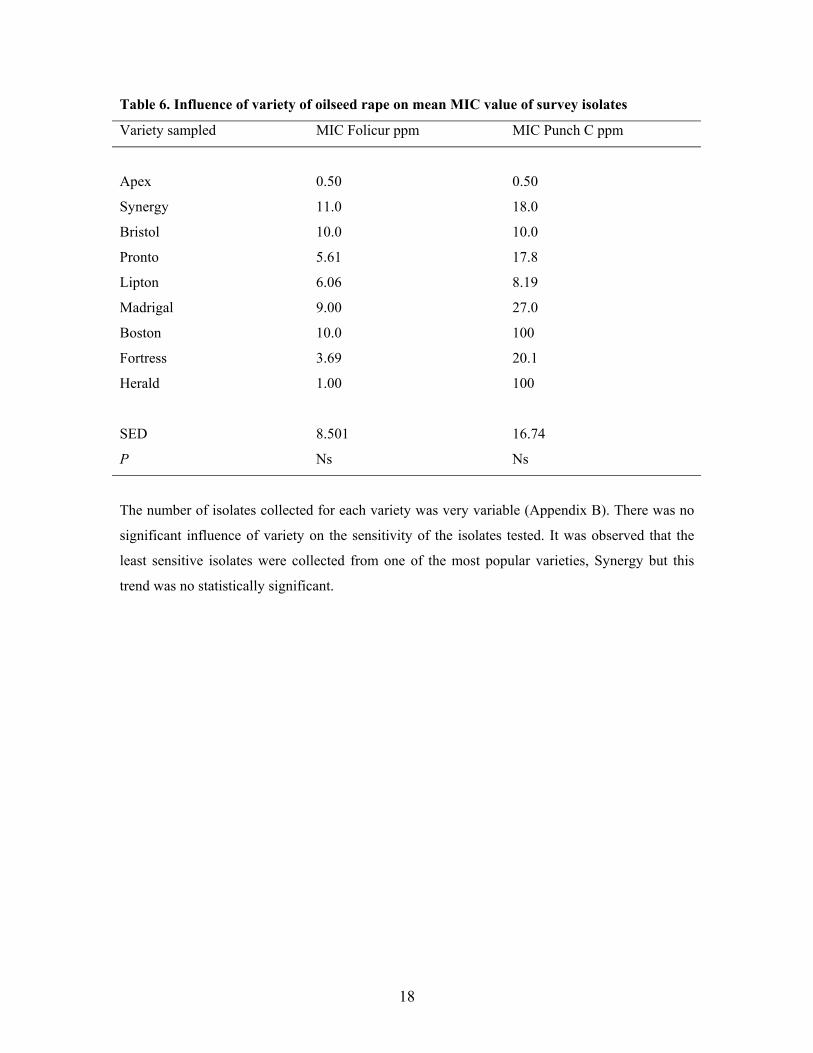
Table 6. Influence of variety of oilseed rape on mean MIC value of survey isolates
Variety sampled MIC Folicur ppm MIC Punch C ppm
Apex 0.50 0.50
Synergy 11.0 18.0
Bristol 10.0 10.0
Pronto 5.61 17.8
Lipton 6.06 8.19
Madrigal 9.00 27.0
Boston 10.0 100
Fortress 3.69 20.1
Herald 1.00 100
SED 8.501 16.74
P Ns Ns
The number of isolates collected for each variety was very variable (Appendix B). There was no
significant influence of variety on the sensitivity of the isolates tested. It was observed that the
least sensitive isolates were collected from one of the most popular varieties, Synergy but this
trend was no statistically significant.
19
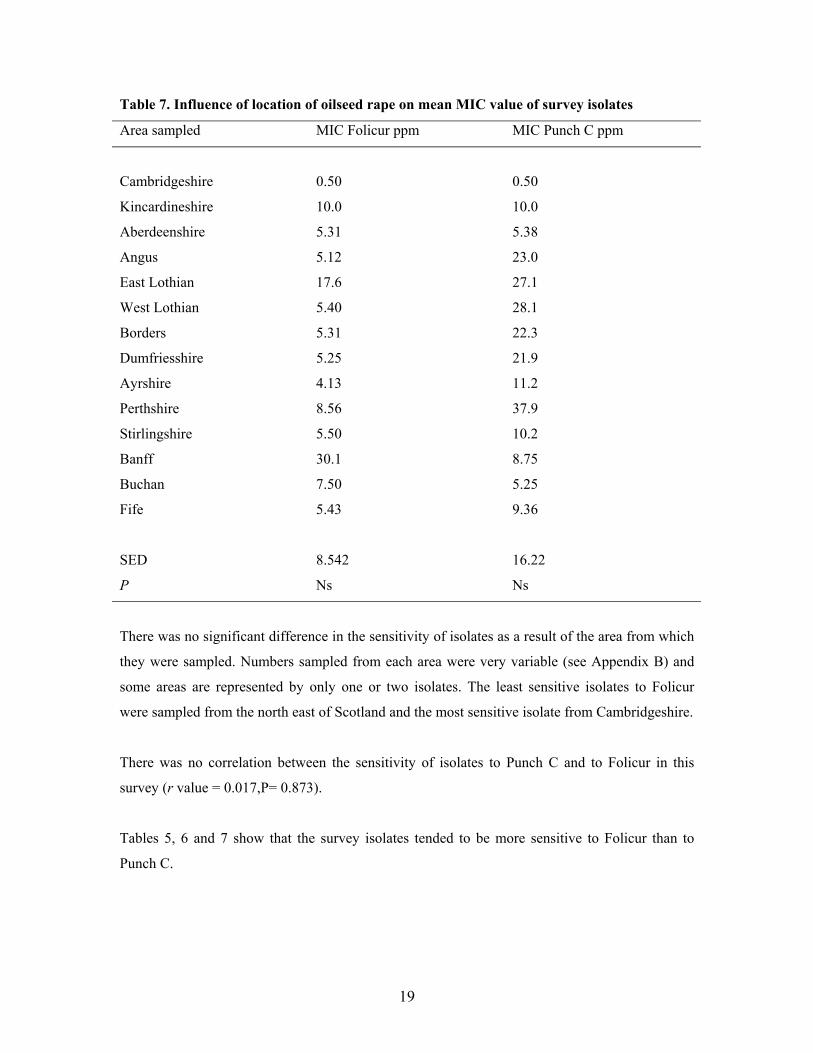
Table 7. Influence of location of oilseed rape on mean MIC value of survey isolates
Area sampled MIC Folicur ppm MIC Punch C ppm
Cambridgeshire 0.50 0.50
Kincardineshire 10.0 10.0
Aberdeenshire 5.31 5.38
Angus 5.12 23.0
East Lothian 17.6 27.1
West Lothian 5.40 28.1
Borders 5.31 22.3
Dumfriesshire 5.25 21.9
Ayrshire 4.13 11.2
Perthshire 8.56 37.9
Stirlingshire 5.50 10.2
Banff 30.1 8.75
Buchan 7.50 5.25
Fife 5.43 9.36
SED 8.542 16.22
P Ns Ns
There was no significant difference in the sensitivity of isolates as a result of the area from which
they were sampled. Numbers sampled from each area were very variable (see Appendix B) and
some areas are represented by only one or two isolates. The least sensitive isolates to Folicur
were sampled from the north east of Scotland and the most sensitive isolate from Cambridgeshire.
There was no correlation between the sensitivity of isolates to Punch C and to Folicur in this
survey (r value = 0.017,P= 0.873).
Tables 5, 6 and 7 show that the survey isolates tended to be more sensitive to Folicur than to
Punch C.
20
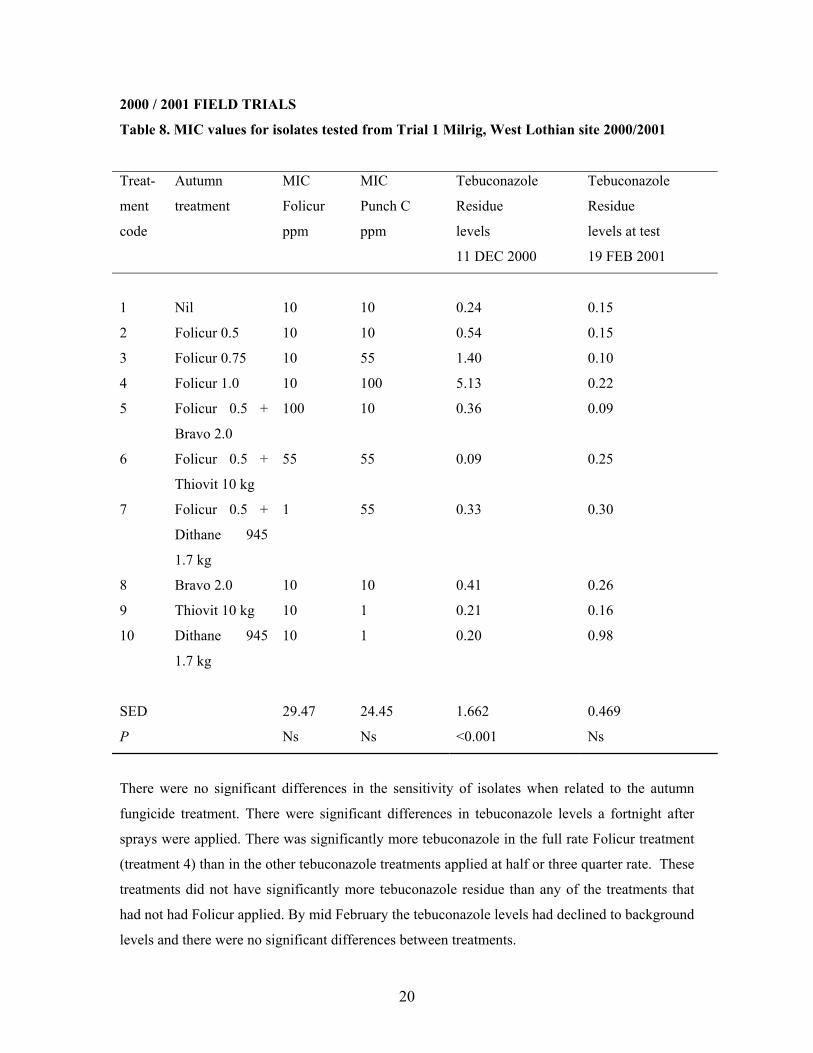
2000 / 2001 FIELD TRIALS
Table 8. MIC values for isolates tested from Trial 1 Milrig, West Lothian site 2000/2001
Treat-
ment
code
Autumn
treatment
MIC
Folicur
ppm
MIC
Punch C
ppm
Tebuconazole
Residue
levels
11 DEC 2000
Tebuconazole
Residue
levels at test
19 FEB 2001
1 Nil 10 10 0.24 0.15
2 Folicur 0.5 10 10 0.54 0.15
3 Folicur 0.75 10 55 1.40 0.10
4 Folicur 1.0 10 100 5.13 0.22
5 Folicur 0.5 +
Bravo 2.0
100 10 0.36 0.09
6 Folicur 0.5 +
Thiovit 10 kg
55 55 0.09 0.25
7 Folicur 0.5 +
Dithane 945
1.7 kg
1 55 0.33 0.30
8 Bravo 2.0 10 10 0.41 0.26
9 Thiovit 10 kg 10 1 0.21 0.16
10 Dithane 945
1.7 kg
10 1 0.20 0.98
SED 29.47 24.45 1.662 0.469
P Ns Ns <0.001 Ns
There were no significant differences in the sensitivity of isolates when related to the autumn
fungicide treatment. There were significant differences in tebuconazole levels a fortnight after
sprays were applied. There was significantly more tebuconazole in the full rate Folicur treatment
(treatment 4) than in the other tebuconazole treatments applied at half or three quarter rate. These
treatments did not have significantly more tebuconazole residue than any of the treatments that
had not had Folicur applied. By mid February the tebuconazole levels had declined to background
levels and there were no significant differences between treatments.
21
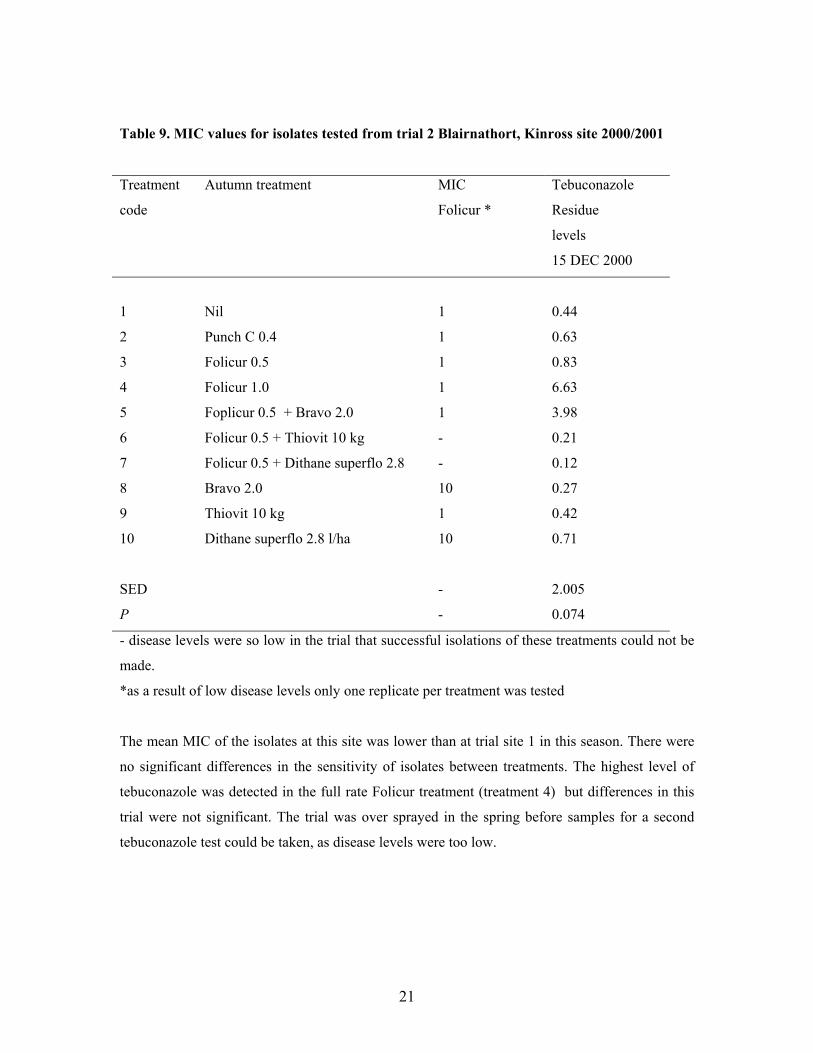
Table 9. MIC values for isolates tested from trial 2 Blairnathort, Kinross site 2000/2001
Treatment
code
Autumn treatment MIC
Folicur *
Tebuconazole
Residue
levels
15 DEC 2000
1 Nil 1 0.44
2 Punch C 0.4 1 0.63
3 Folicur 0.5 1 0.83
4 Folicur 1.0 1 6.63
5 Foplicur 0.5 + Bravo 2.0 1 3.98
6 Folicur 0.5 + Thiovit 10 kg - 0.21
7 Folicur 0.5 + Dithane superflo 2.8 - 0.12
8 Bravo 2.0 10 0.27
9 Thiovit 10 kg 1 0.42
10 Dithane superflo 2.8 l/ha 10 0.71
SED - 2.005
P - 0.074
- disease levels were so low in the trial that successful isolations of these treatments could not be
made.
*as a result of low disease levels only one replicate per treatment was tested
The mean MIC of the isolates at this site was lower than at trial site 1 in this season. There were
no significant differences in the sensitivity of isolates between treatments. The highest level of
tebuconazole was detected in the full rate Folicur treatment (treatment 4) but differences in this
trial were not significant. The trial was over sprayed in the spring before samples for a second
tebuconazole test could be taken, as disease levels were too low.
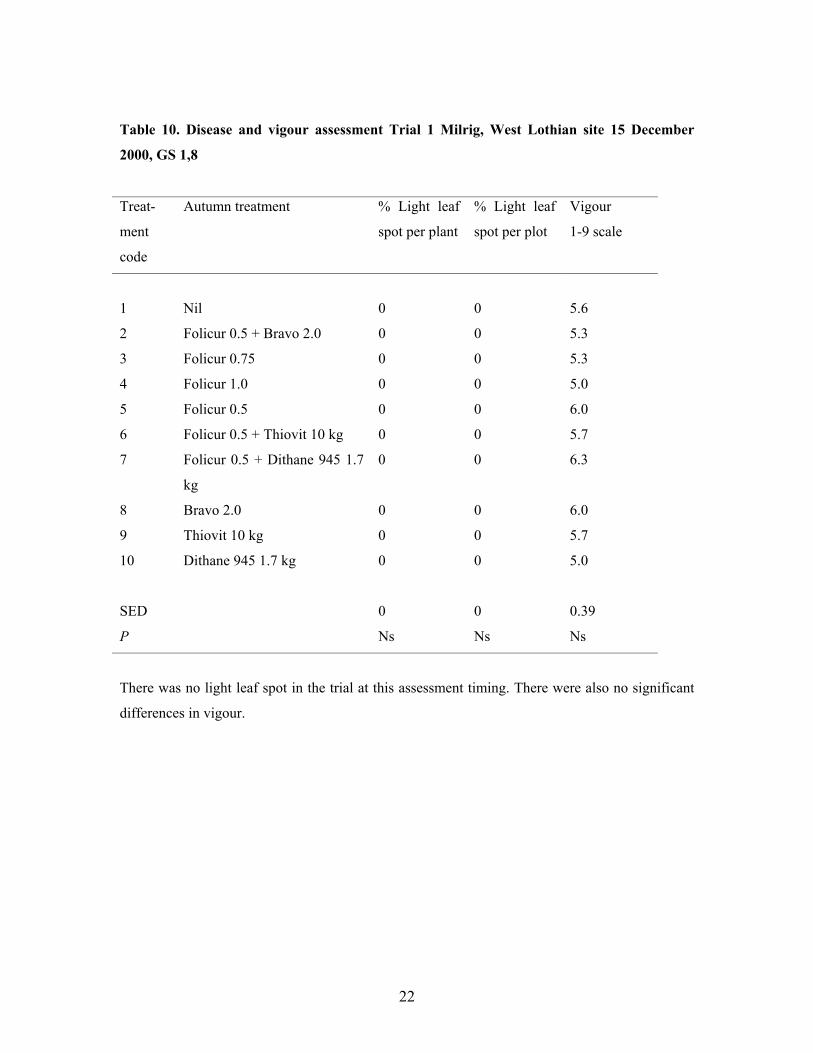
22
Table 10. Disease and vigour assessment Trial 1 Milrig, West Lothian site 15 December
2000, GS 1,8
Treat-
ment
code
Autumn treatment % Light leaf
spot per plant
% Light leaf
spot per plot
Vigour
1-9 scale
1 Nil 0 0 5.6
2 Folicur 0.5 + Bravo 2.0 0 0 5.3
3 Folicur 0.75 0 0 5.3
4 Folicur 1.0 0 0 5.0
5 Folicur 0.5 0 0 6.0
6 Folicur 0.5 + Thiovit 10 kg 0 0 5.7
7 Folicur 0.5 + Dithane 945 1.7
kg
0 0 6.3
8 Bravo 2.0 0 0 6.0
9 Thiovit 10 kg 0 0 5.7
10 Dithane 945 1.7 kg 0 0 5.0
SED 0 0 0.39
P Ns Ns Ns
There was no light leaf spot in the trial at this assessment timing. There were also no significant
differences in vigour.
23
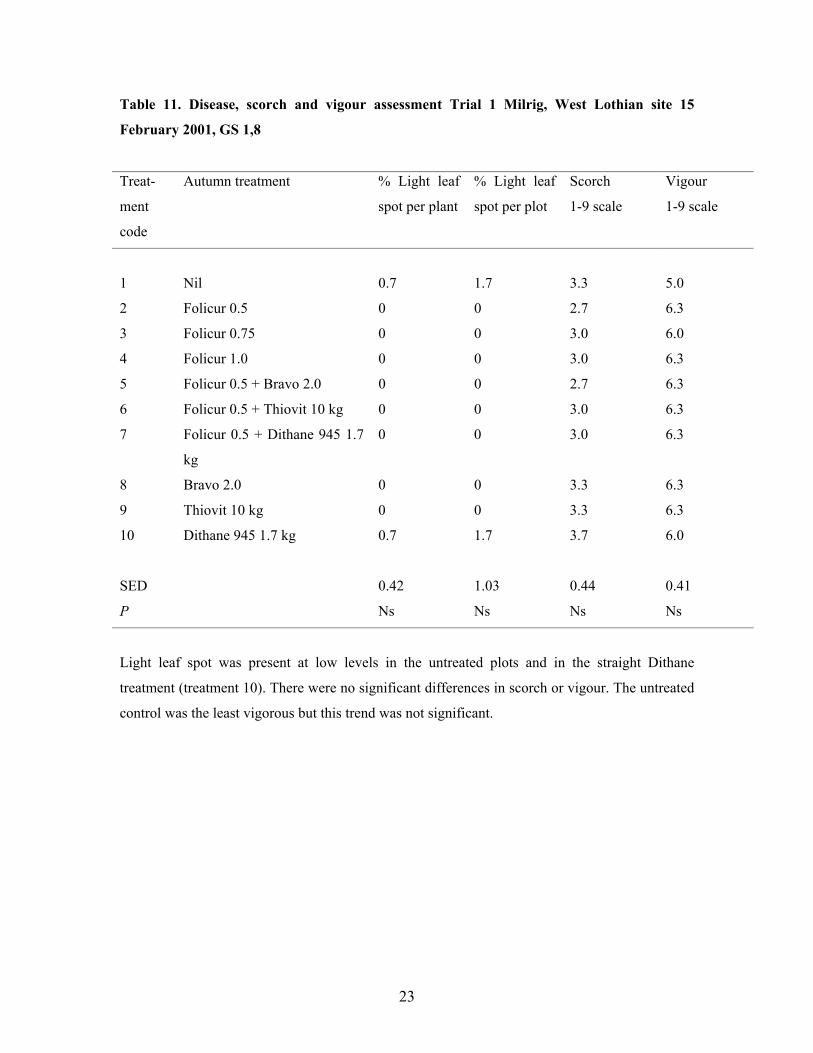
Table 11. Disease, scorch and vigour assessment Trial 1 Milrig, West Lothian site 15
February 2001, GS 1,8
Treat-
ment
code
Autumn treatment % Light leaf
spot per plant
% Light leaf
spot per plot
Scorch
1-9 scale
Vigour
1-9 scale
1 Nil 0.7 1.7 3.3 5.0
2 Folicur 0.5 0 0 2.7 6.3
3 Folicur 0.75 0 0 3.0 6.0
4 Folicur 1.0 0 0 3.0 6.3
5 Folicur 0.5 + Bravo 2.0 0 0 2.7 6.3
6 Folicur 0.5 + Thiovit 10 kg 0 0 3.0 6.3
7 Folicur 0.5 + Dithane 945 1.7
kg
0 0 3.0 6.3
8 Bravo 2.0 0 0 3.3 6.3
9 Thiovit 10 kg 0 0 3.3 6.3
10 Dithane 945 1.7 kg 0.7 1.7 3.7 6.0
SED 0.42 1.03 0.44 0.41
P Ns Ns Ns Ns
Light leaf spot was present at low levels in the untreated plots and in the straight Dithane
treatment (treatment 10). There were no significant differences in scorch or vigour. The untreated
control was the least vigorous but this trend was not significant.
24
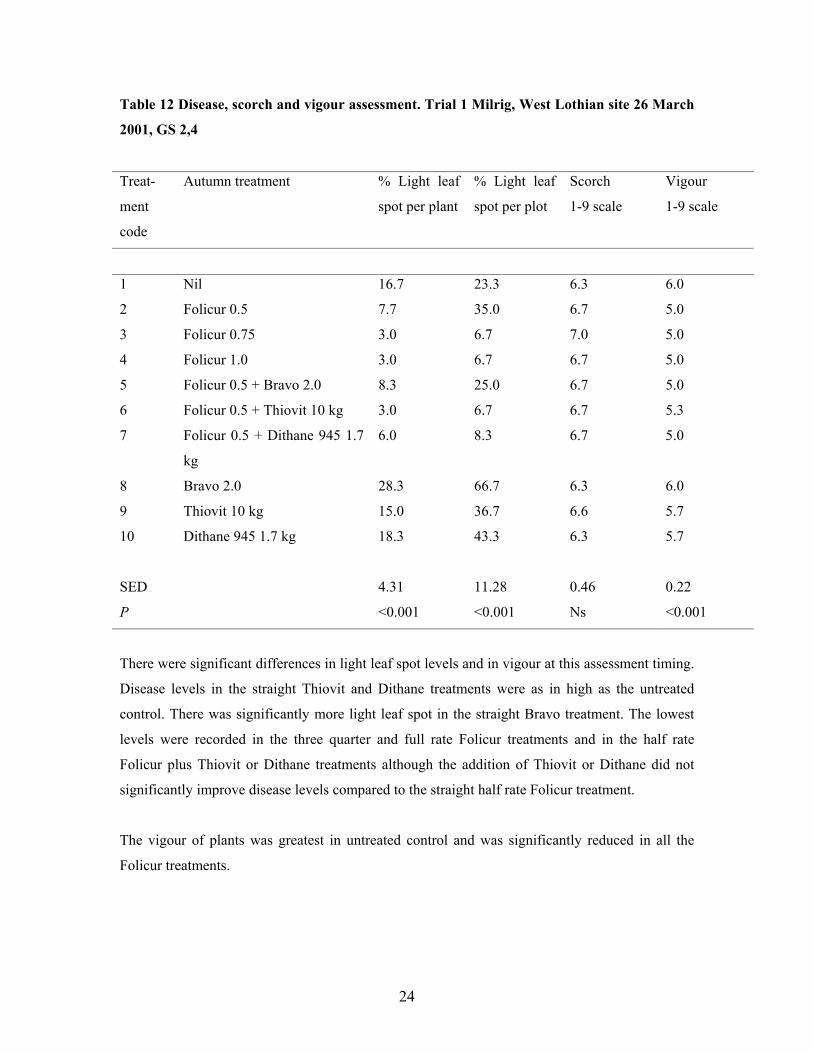
Table 12 Disease, scorch and vigour assessment. Trial 1 Milrig, West Lothian site 26 March
2001, GS 2,4
Treat-
ment
code
Autumn treatment % Light leaf
spot per plant
% Light leaf
spot per plot
Scorch
1-9 scale
Vigour
1-9 scale
1 Nil 16.7 23.3 6.3 6.0
2 Folicur 0.5 7.7 35.0 6.7 5.0
3 Folicur 0.75 3.0 6.7 7.0 5.0
4 Folicur 1.0 3.0 6.7 6.7 5.0
5 Folicur 0.5 + Bravo 2.0 8.3 25.0 6.7 5.0
6 Folicur 0.5 + Thiovit 10 kg 3.0 6.7 6.7 5.3
7 Folicur 0.5 + Dithane 945 1.7
kg
6.0 8.3 6.7 5.0
8 Bravo 2.0 28.3 66.7 6.3 6.0
9 Thiovit 10 kg 15.0 36.7 6.6 5.7
10 Dithane 945 1.7 kg 18.3 43.3 6.3 5.7
SED 4.31 11.28 0.46 0.22
P <0.001 <0.001 Ns <0.001
There were significant differences in light leaf spot levels and in vigour at this assessment timing.
Disease levels in the straight Thiovit and Dithane treatments were as in high as the untreated
control. There was significantly more light leaf spot in the straight Bravo treatment. The lowest
levels were recorded in the three quarter and full rate Folicur treatments and in the half rate
Folicur plus Thiovit or Dithane treatments although the addition of Thiovit or Dithane did not
significantly improve disease levels compared to the straight half rate Folicur treatment.
The vigour of plants was greatest in untreated control and was significantly reduced in all the
Folicur treatments.
25
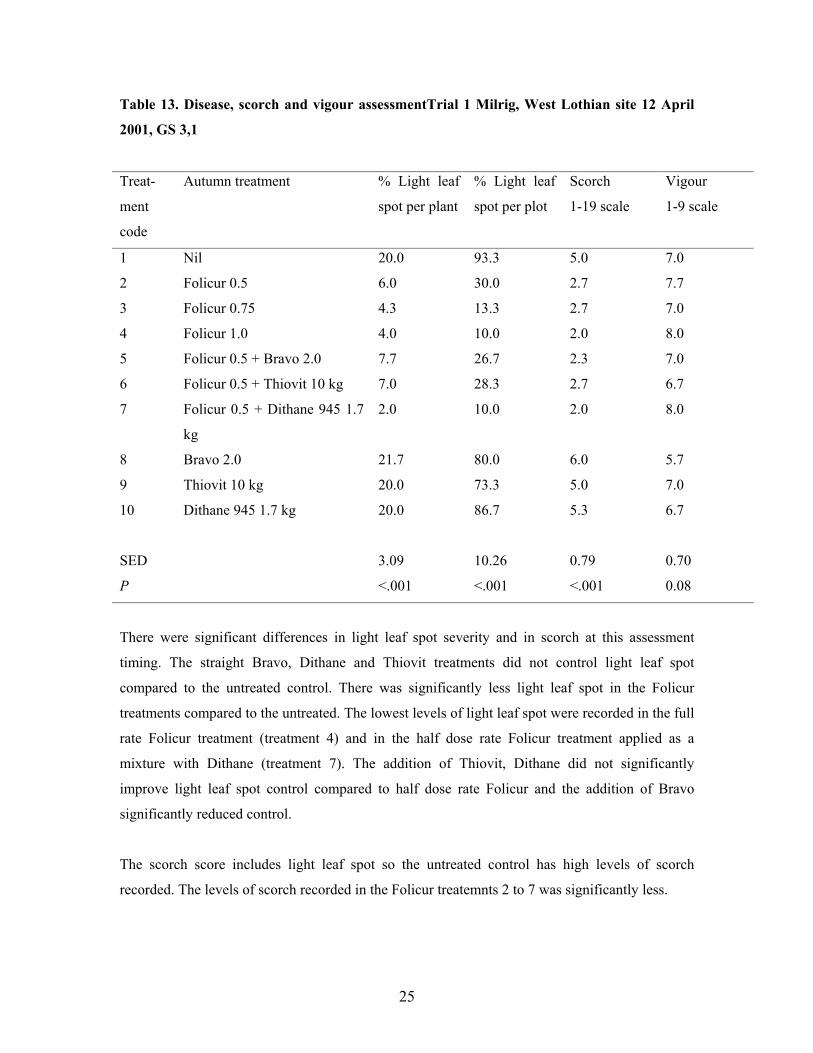
Table 13. Disease, scorch and vigour assessmentTrial 1 Milrig, West Lothian site 12 April
2001, GS 3,1
Treat-
ment
code
Autumn treatment % Light leaf
spot per plant
% Light leaf
spot per plot
Scorch
1-19 scale
Vigour
1-9 scale
1 Nil 20.0 93.3 5.0 7.0
2 Folicur 0.5 6.0 30.0 2.7 7.7
3 Folicur 0.75 4.3 13.3 2.7 7.0
4 Folicur 1.0 4.0 10.0 2.0 8.0
5 Folicur 0.5 + Bravo 2.0 7.7 26.7 2.3 7.0
6 Folicur 0.5 + Thiovit 10 kg 7.0 28.3 2.7 6.7
7 Folicur 0.5 + Dithane 945 1.7
kg
2.0 10.0 2.0 8.0
8 Bravo 2.0 21.7 80.0 6.0 5.7
9 Thiovit 10 kg 20.0 73.3 5.0 7.0
10 Dithane 945 1.7 kg 20.0 86.7 5.3 6.7
SED 3.09 10.26 0.79 0.70
P <.001 <.001 <.001 0.08
There were significant differences in light leaf spot severity and in scorch at this assessment
timing. The straight Bravo, Dithane and Thiovit treatments did not control light leaf spot
compared to the untreated control. There was significantly less light leaf spot in the Folicur
treatments compared to the untreated. The lowest levels of light leaf spot were recorded in the full
rate Folicur treatment (treatment 4) and in the half dose rate Folicur treatment applied as a
mixture with Dithane (treatment 7). The addition of Thiovit, Dithane did not significantly
improve light leaf spot control compared to half dose rate Folicur and the addition of Bravo
significantly reduced control.
The scorch score includes light leaf spot so the untreated control has high levels of scorch
recorded. The levels of scorch recorded in the Folicur treatemnts 2 to 7 was significantly less.
26
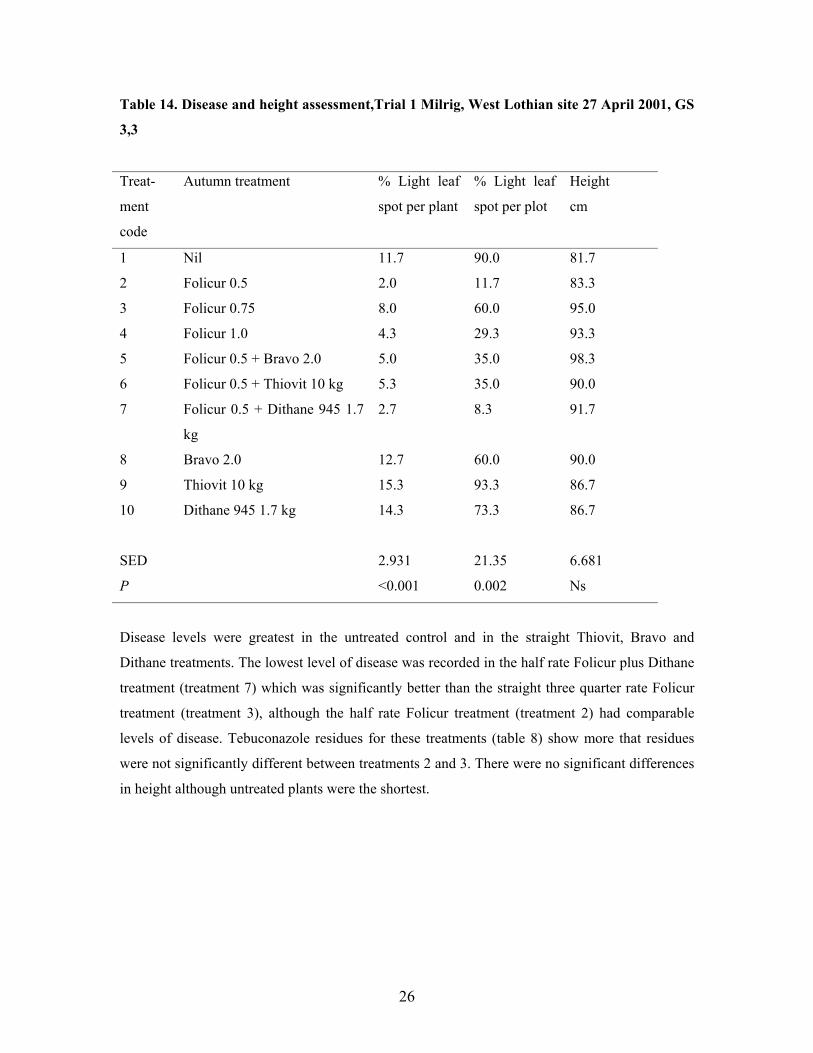
Table 14. Disease and height assessment,Trial 1 Milrig, West Lothian site 27 April 2001, GS
3,3
Treat-
ment
code
Autumn treatment % Light leaf
spot per plant
% Light leaf
spot per plot
Height
cm
1 Nil 11.7 90.0 81.7
2 Folicur 0.5 2.0 11.7 83.3
3 Folicur 0.75 8.0 60.0 95.0
4 Folicur 1.0 4.3 29.3 93.3
5 Folicur 0.5 + Bravo 2.0 5.0 35.0 98.3
6 Folicur 0.5 + Thiovit 10 kg 5.3 35.0 90.0
7 Folicur 0.5 + Dithane 945 1.7
kg
2.7 8.3 91.7
8 Bravo 2.0 12.7 60.0 90.0
9 Thiovit 10 kg 15.3 93.3 86.7
10 Dithane 945 1.7 kg 14.3 73.3 86.7
SED 2.931 21.35 6.681
P <0.001 0.002 Ns
Disease levels were greatest in the untreated control and in the straight Thiovit, Bravo and
Dithane treatments. The lowest level of disease was recorded in the half rate Folicur plus Dithane
treatment (treatment 7) which was significantly better than the straight three quarter rate Folicur
treatment (treatment 3), although the half rate Folicur treatment (treatment 2) had comparable
levels of disease. Tebuconazole residues for these treatments (table 8) show more that residues
were not significantly different between treatments 2 and 3. There were no significant differences
in height although untreated plants were the shortest.
27
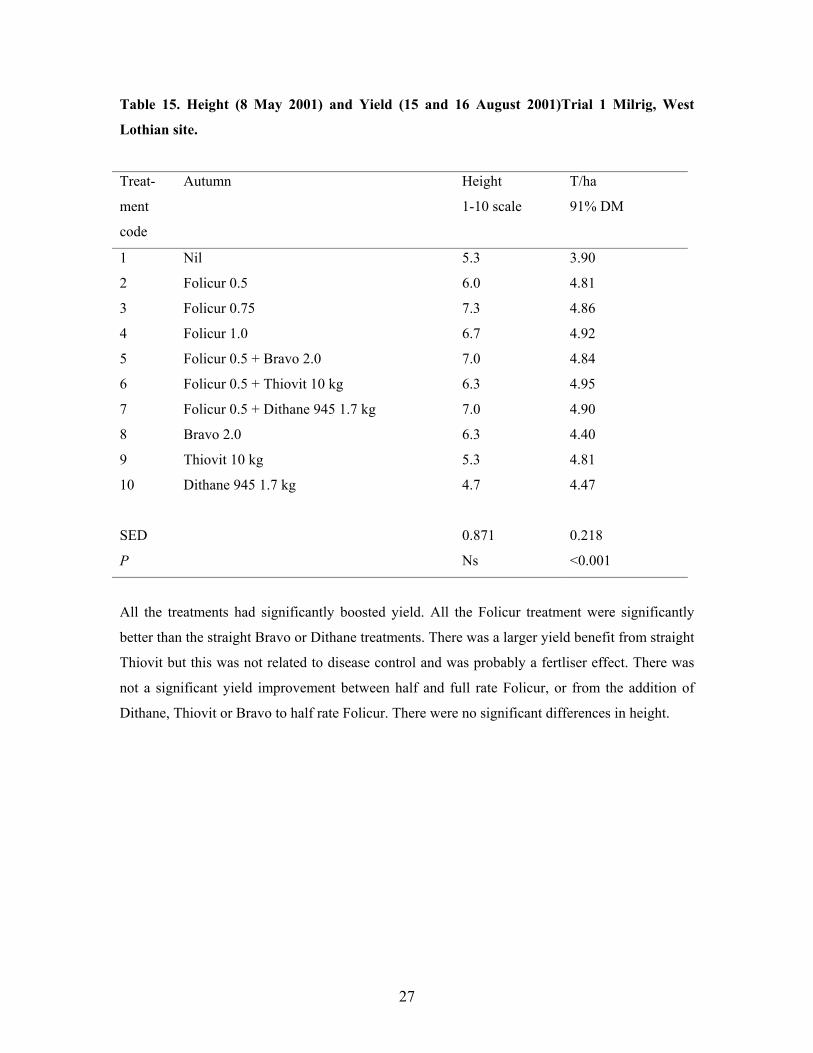
Table 15. Height (8 May 2001) and Yield (15 and 16 August 2001)Trial 1 Milrig, West
Lothian site.
Treat-
ment
code
Autumn Height
1-10 scale
T/ha
91% DM
1 Nil 5.3 3.90
2 Folicur 0.5 6.0 4.81
3 Folicur 0.75 7.3 4.86
4 Folicur 1.0 6.7 4.92
5 Folicur 0.5 + Bravo 2.0 7.0 4.84
6 Folicur 0.5 + Thiovit 10 kg 6.3 4.95
7 Folicur 0.5 + Dithane 945 1.7 kg 7.0 4.90
8 Bravo 2.0 6.3 4.40
9 Thiovit 10 kg 5.3 4.81
10 Dithane 945 1.7 kg 4.7 4.47
SED 0.871 0.218
P Ns <0.001
All the treatments had significantly boosted yield. All the Folicur treatment were significantly
better than the straight Bravo or Dithane treatments. There was a larger yield benefit from straight
Thiovit but this was not related to disease control and was probably a fertliser effect. There was
not a significant yield improvement between half and full rate Folicur, or from the addition of
Dithane, Thiovit or Bravo to half rate Folicur. There were no significant differences in height.
28
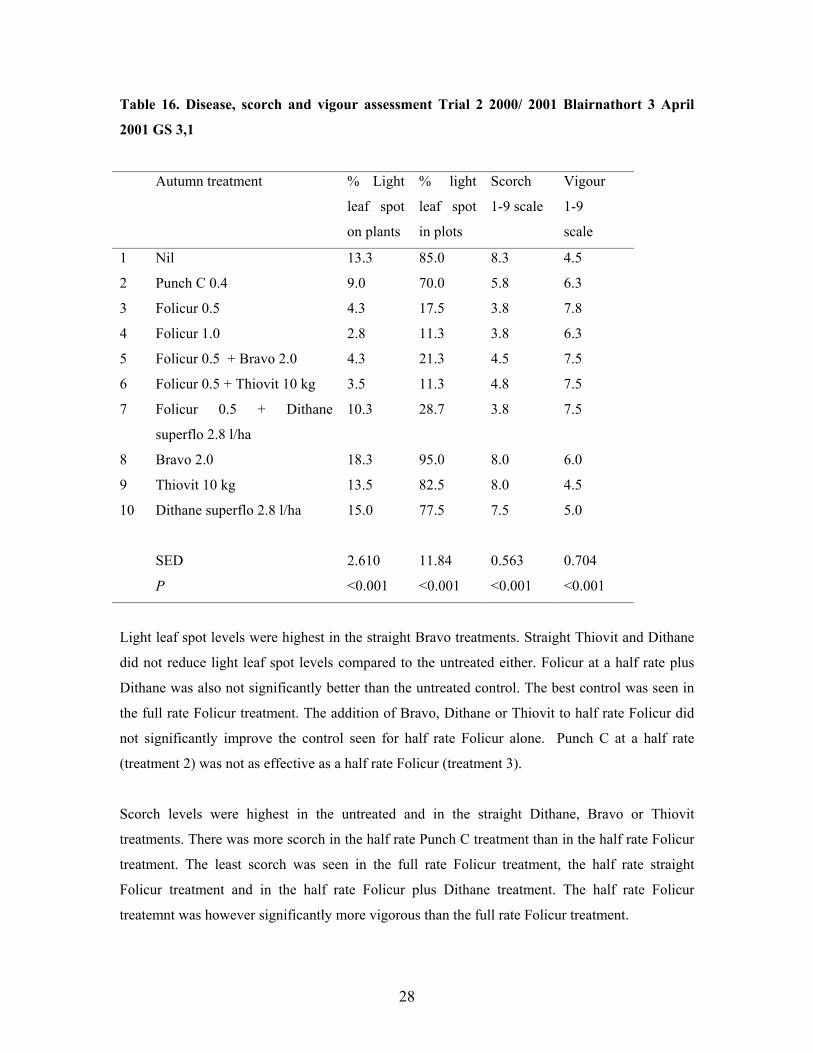
Table 16. Disease, scorch and vigour assessment Trial 2 2000/ 2001 Blairnathort 3 April
2001 GS 3,1
Autumn treatment % Light
leaf spot
on plants
% light
leaf spot
in plots
Scorch
1-9 scale
Vigour
1-9
scale
1 Nil 13.3 85.0 8.3 4.5
2 Punch C 0.4 9.0 70.0 5.8 6.3
3 Folicur 0.5 4.3 17.5 3.8 7.8
4 Folicur 1.0 2.8 11.3 3.8 6.3
5 Folicur 0.5 + Bravo 2.0 4.3 21.3 4.5 7.5
6 Folicur 0.5 + Thiovit 10 kg 3.5 11.3 4.8 7.5
7 Folicur 0.5 + Dithane
superflo 2.8 l/ha
10.3 28.7 3.8 7.5
8 Bravo 2.0 18.3 95.0 8.0 6.0
9 Thiovit 10 kg 13.5 82.5 8.0 4.5
10 Dithane superflo 2.8 l/ha 15.0 77.5 7.5 5.0
SED 2.610 11.84 0.563 0.704
P <0.001 <0.001 <0.001 <0.001
Light leaf spot levels were highest in the straight Bravo treatments. Straight Thiovit and Dithane
did not reduce light leaf spot levels compared to the untreated either. Folicur at a half rate plus
Dithane was also not significantly better than the untreated control. The best control was seen in
the full rate Folicur treatment. The addition of Bravo, Dithane or Thiovit to half rate Folicur did
not significantly improve the control seen for half rate Folicur alone. Punch C at a half rate
(treatment 2) was not as effective as a half rate Folicur (treatment 3).
Scorch levels were highest in the untreated and in the straight Dithane, Bravo or Thiovit
treatments. There was more scorch in the half rate Punch C treatment than in the half rate Folicur
treatment. The least scorch was seen in the full rate Folicur treatment, the half rate straight
Folicur treatment and in the half rate Folicur plus Dithane treatment. The half rate Folicur
treatemnt was however significantly more vigorous than the full rate Folicur treatment.
29
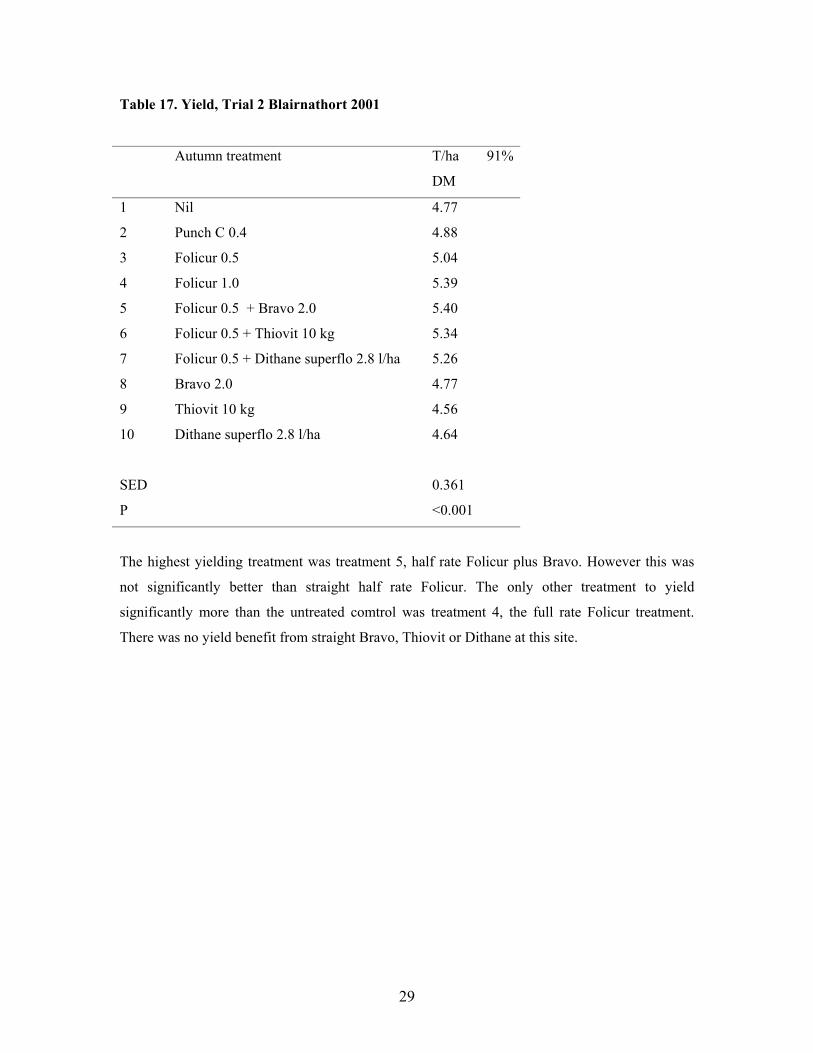
Table 17. Yield, Trial 2 Blairnathort 2001
Autumn treatment T/ha 91%
DM
1 Nil 4.77
2 Punch C 0.4 4.88
3 Folicur 0.5 5.04
4 Folicur 1.0 5.39
5 Folicur 0.5 + Bravo 2.0 5.40
6 Folicur 0.5 + Thiovit 10 kg 5.34
7 Folicur 0.5 + Dithane superflo 2.8 l/ha 5.26
8 Bravo 2.0 4.77
9 Thiovit 10 kg 4.56
10 Dithane superflo 2.8 l/ha 4.64
SED 0.361
P <0.001
The highest yielding treatment was treatment 5, half rate Folicur plus Bravo. However this was
not significantly better than straight half rate Folicur. The only other treatment to yield
significantly more than the untreated comtrol was treatment 4, the full rate Folicur treatment.
There was no yield benefit from straight Bravo, Thiovit or Dithane at this site.
30
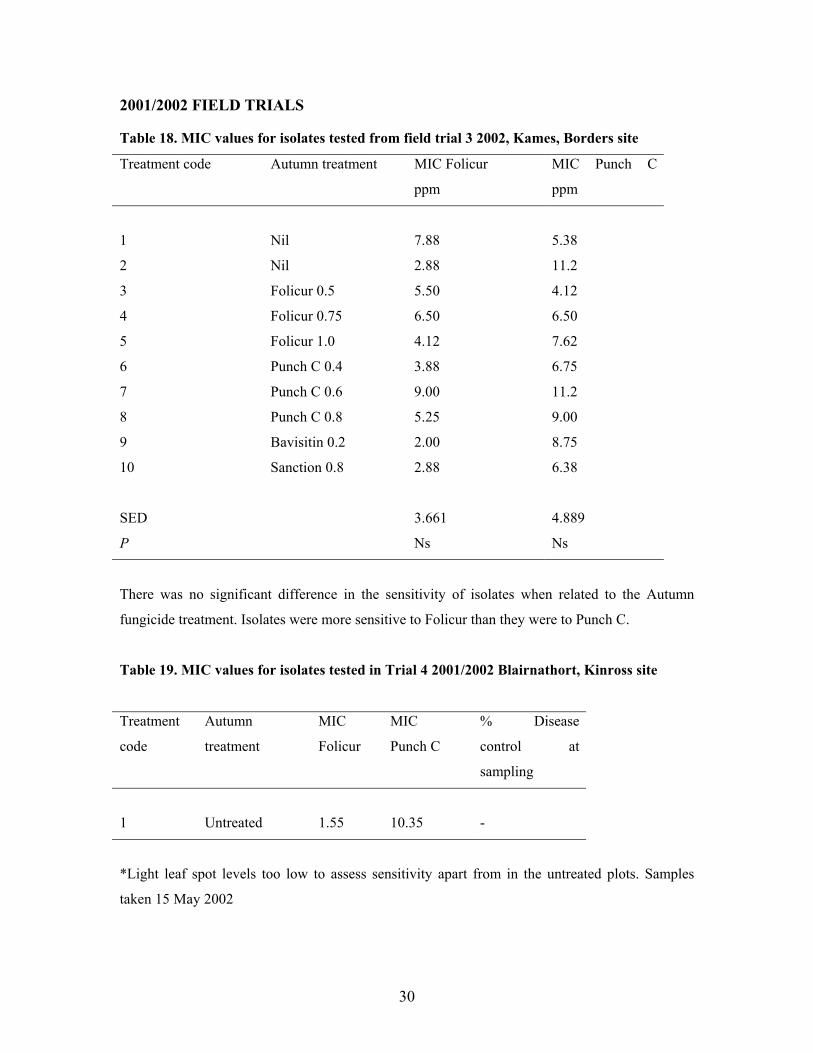
2001/2002 FIELD TRIALS Table 18. MIC values for isolates tested from field trial 3 2002, Kames, Borders site
Treatment code Autumn treatment MIC Folicur
ppm
MIC Punch C
ppm
1 Nil 7.88 5.38
2 Nil 2.88 11.2
3 Folicur 0.5 5.50 4.12
4 Folicur 0.75 6.50 6.50
5 Folicur 1.0 4.12 7.62
6 Punch C 0.4 3.88 6.75
7 Punch C 0.6 9.00 11.2
8 Punch C 0.8 5.25 9.00
9 Bavisitin 0.2 2.00 8.75
10 Sanction 0.8 2.88 6.38
SED 3.661 4.889
P Ns Ns
There was no significant difference in the sensitivity of isolates when related to the Autumn
fungicide treatment. Isolates were more sensitive to Folicur than they were to Punch C.
Table 19. MIC values for isolates tested in Trial 4 2001/2002 Blairnathort, Kinross site
Treatment
code
Autumn
treatment
MIC
Folicur
MIC
Punch C
% Disease
control at
sampling
1 Untreated 1.55 10.35 -
*Light leaf spot levels too low to assess sensitivity apart from in the untreated plots. Samples
taken 15 May 2002
31
Isolates tended to be more sensitive to Folicur at this site compared to trial 3, the Kames, Borders
site in this season. There was no light leaf spot in the autumn treated plots that could be sampled
before the second sprays were applied.
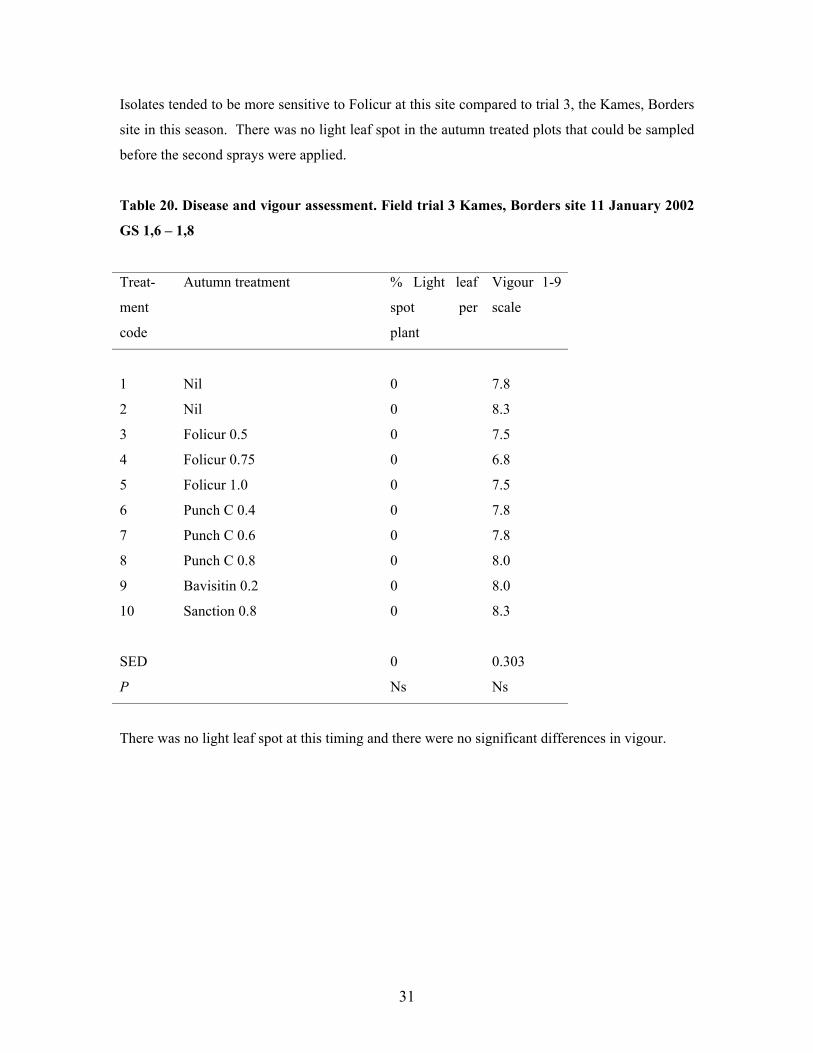
Table 20. Disease and vigour assessment. Field trial 3 Kames, Borders site 11 January 2002
GS 1,6 – 1,8
Treat-
ment
code
Autumn treatment % Light leaf
spot per
plant
Vigour 1-9
scale
1 Nil 0 7.8
2 Nil 0 8.3
3 Folicur 0.5 0 7.5
4 Folicur 0.75 0 6.8
5 Folicur 1.0 0 7.5
6 Punch C 0.4 0 7.8
7 Punch C 0.6 0 7.8
8 Punch C 0.8 0 8.0
9 Bavisitin 0.2 0 8.0
10 Sanction 0.8 0 8.3
SED 0 0.303
P Ns Ns
There was no light leaf spot at this timing and there were no significant differences in vigour.
32
Table 21. Disease, vigour and scorch assessment, Field trial 3 Kames, Borders site 27 March
2002 Gs3,1
Treat-
ment
code
Autumn
treatment
% Light leaf
spot
plant
% Light leaf
spot per plot
Vigour
1-9 scale
Scorch
1-9 scale
1 Nil 7.5 22.5 9.0 4.5
2 Nil 7.3 20.0 9.0 4.3
3 Folicur 0.5 0 0 5.8 2.0
4 Folicur 0.75 0 0 6.8 1.5
5 Folicur 1.0 0 0 4.8 0
6 Punch C 0.4 0 0 8.8 1.3
7 Punch C 0.6 6.3 1.3 8.8 2.0
8 Punch C 0.8 0.3 0.5 8.8 1.0
9 Bavisitin 0.2 l/ha 2.3 5.0 8.8 2.8
10 Sanction 0.8 0 0 9.0 1.5
SED 2.18 2.38 0.29 0.63
P 0.050 <0.001 <0.001 <0.001
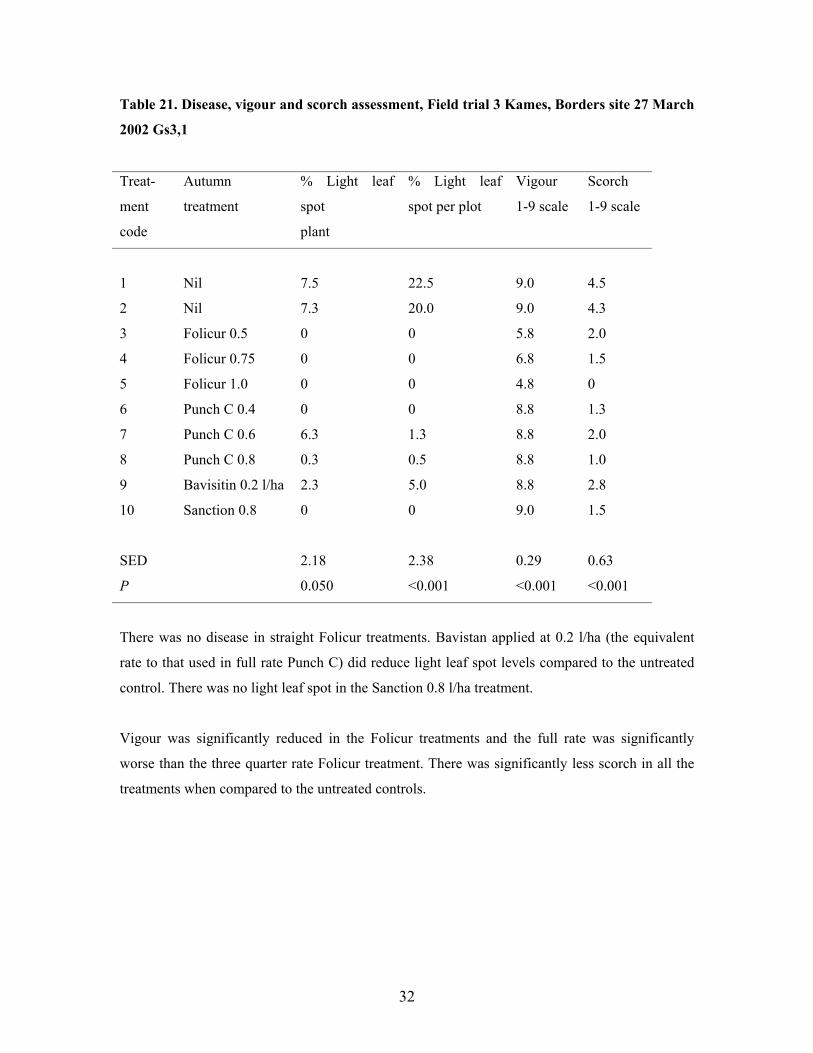
There was no disease in straight Folicur treatments. Bavistan applied at 0.2 l/ha (the equivalent
rate to that used in full rate Punch C) did reduce light leaf spot levels compared to the untreated
control. There was no light leaf spot in the Sanction 0.8 l/ha treatment.
Vigour was significantly reduced in the Folicur treatments and the full rate was significantly
worse than the three quarter rate Folicur treatment. There was significantly less scorch in all the
treatments when compared to the untreated controls.
33
Table 22. Disease and vigour assessment, Field trial 3 Kames, Borders site 9 April 2002
Gs3,3
Treat-
ment
code
Autumn treatment % Light leaf
spot per
plant
% Light leaf
spot per plot
Vigour
1-9 scale
1 Nil 12.5 80.0 9.0
2 Nil (spring Folicur 0.5) 4.5 28.8 9.0
3 Folicur 0.5 1.3 5.0 8.3
4 Folicur 0.75 0.0 0.0 6.8
5 Folicur 1.0 2.3 7.5 6.3
6 Punch C 0.4 0.5 2.5 8.5
7 Punch C 0.6 0.0 0.0 8.8
8 Punch C 0.8 0.3 1.3 8.8
9 Bavisitin 0.2 3.3 15.0 8.5
10 Sanction 0.8 0.5 1.3 9.0
SED 0.86 4.55 0.26
P <0.001 <0.001 <0.001
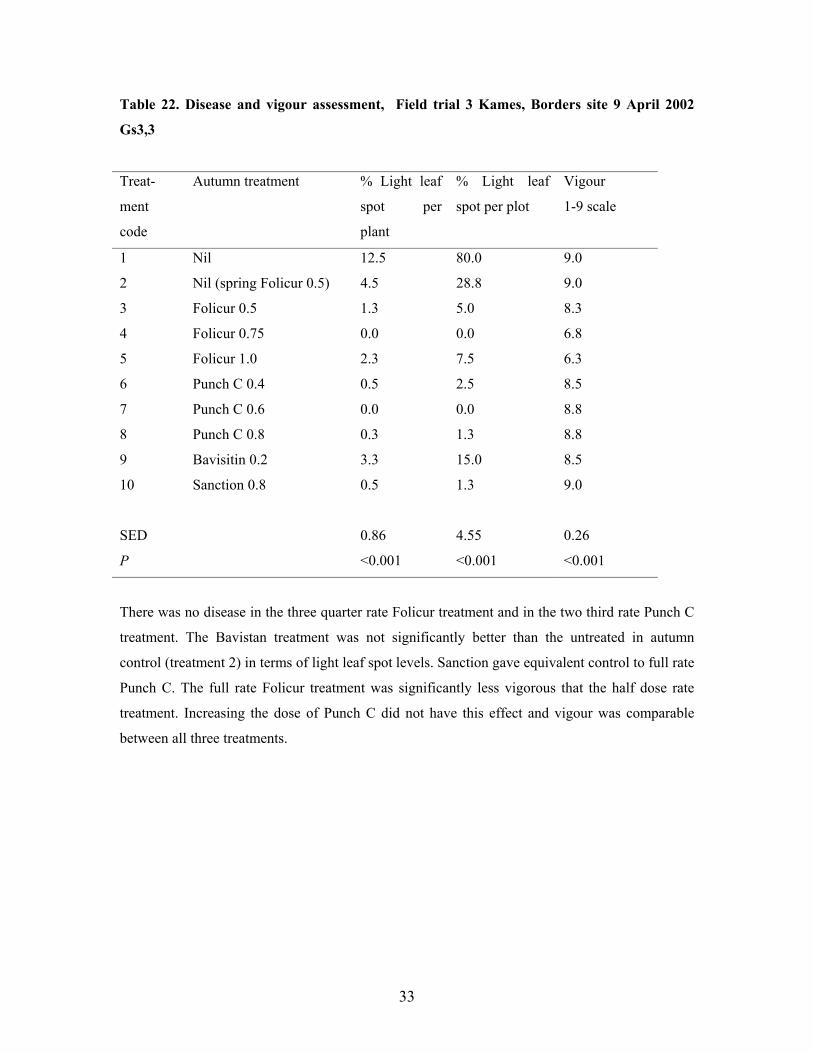
There was no disease in the three quarter rate Folicur treatment and in the two third rate Punch C
treatment. The Bavistan treatment was not significantly better than the untreated in autumn
control (treatment 2) in terms of light leaf spot levels. Sanction gave equivalent control to full rate
Punch C. The full rate Folicur treatment was significantly less vigorous that the half dose rate
treatment. Increasing the dose of Punch C did not have this effect and vigour was comparable
between all three treatments.
34
Table 23. Disease and vigour assessment, trial 3 Kames, Borders site 25 April 2002 Gs3,7 –
4,0
Treat-
ment
code
Autumn
treatment
% Light leaf
spot per
plant
% Light leaf
spot per plot
Vigour
1-9 scale
1 Nil 9.8 70.0 8.3
2 Nil 6.0 60.0 8.8
3 Folicur 0.5 2.3 15.0 7.0
4 Folicur 0.75 0 0 7.3
5 Folicur 1.0 0 0 5.7
6 Punch C 0.4 1.3 6.5 8.0
7 Punch C 0.6 1.5 3.8 7.5
8 Punch C 0.8 0 0 8.5
9 Bavisitin 0.2 l/ha 1.0 5.0 7.5
10 Sanction 0.8 0.5 2.5 8.5
SED 0.84 5.18 0.42
P <0.001 <0.001 <0.001
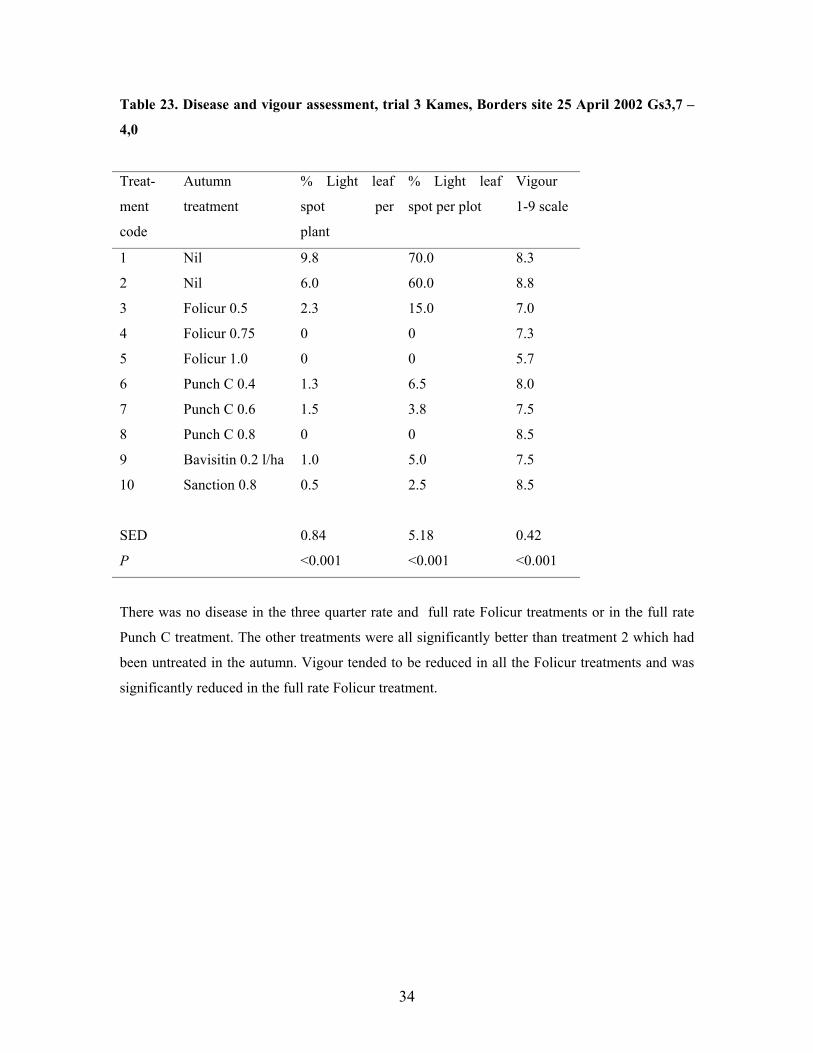
There was no disease in the three quarter rate and full rate Folicur treatments or in the full rate
Punch C treatment. The other treatments were all significantly better than treatment 2 which had
been untreated in the autumn. Vigour tended to be reduced in all the Folicur treatments and was
significantly reduced in the full rate Folicur treatment.
35
Table 24. Crop Yields Field trial 3 Kames, Borders site.
Autumn treatment T/ha 91% DM
1 Nil 3.57
2 Nil 4.04
3 Folicur 0.5 4.12
4 Folicur 0.75 3.99
5 Folicur 1.0 3.85
6 Punch C 0.4 4.11
7 Punch C 0.6 4.12
8 Punch C 0.8 4.05
9 Bavisitin 0.2 3.80
10 Sanction 25 0.8 4.39
SED 0.206
P 0.043
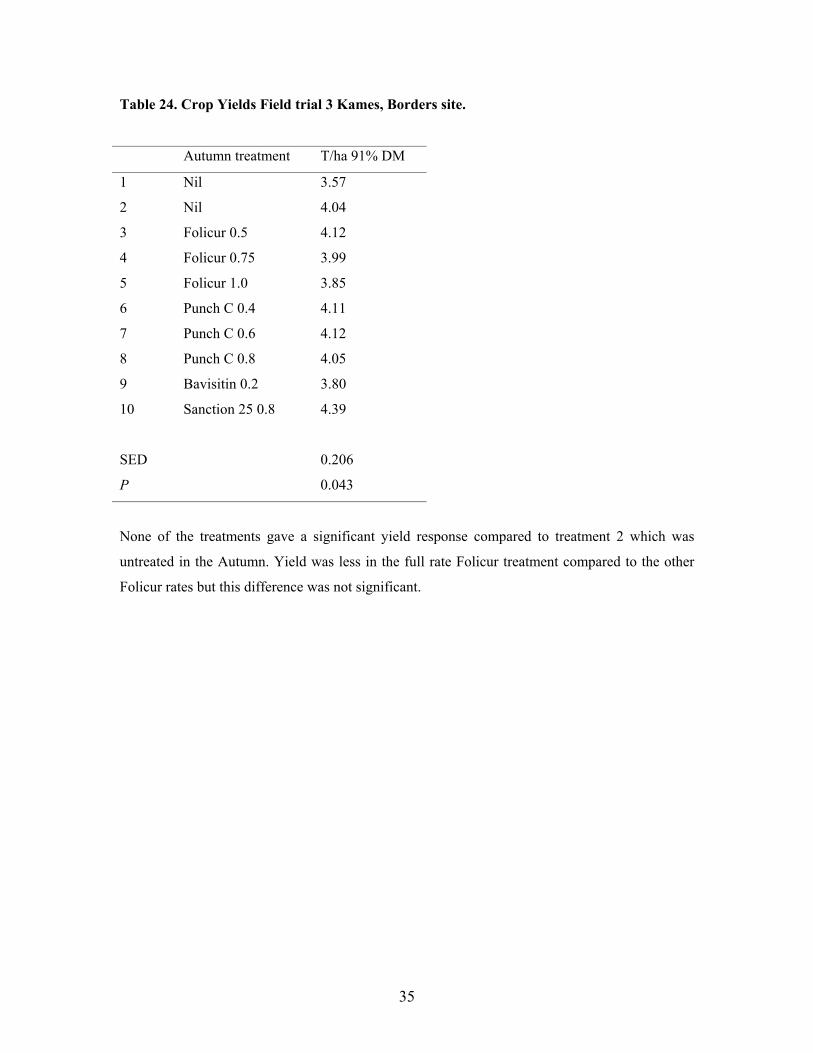
None of the treatments gave a significant yield response compared to treatment 2 which was
untreated in the Autumn. Yield was less in the full rate Folicur treatment compared to the other
Folicur rates but this difference was not significant.
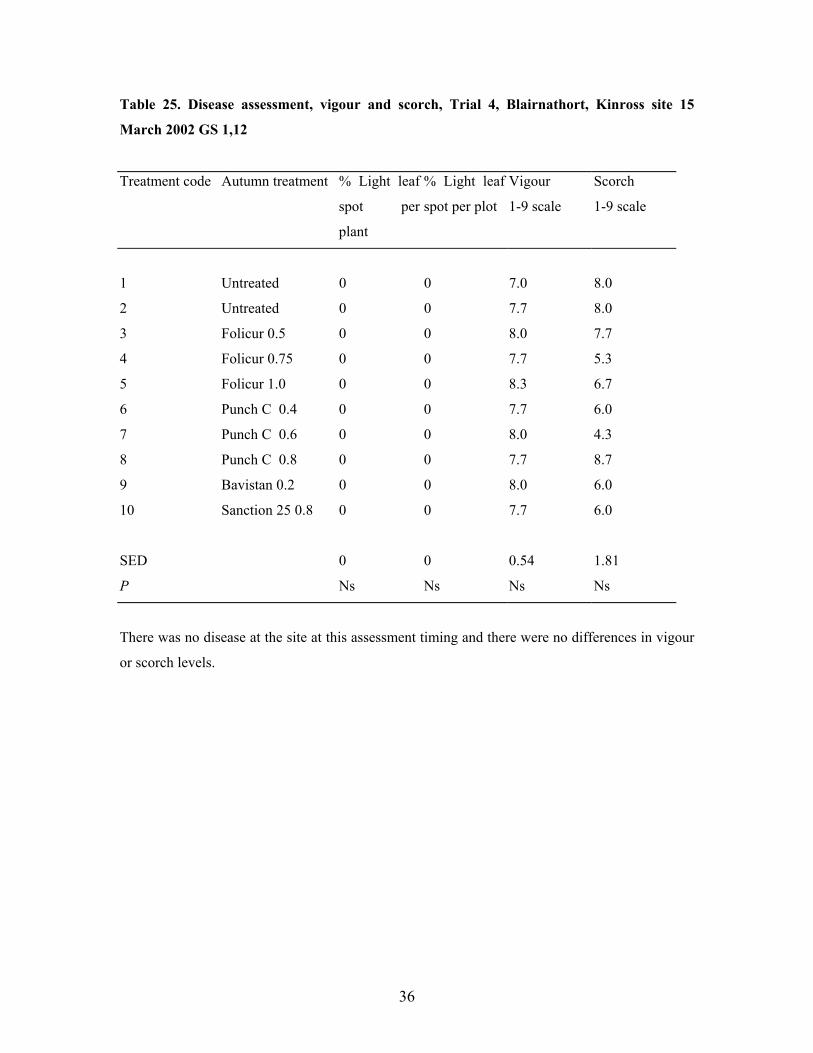
36
Table 25. Disease assessment, vigour and scorch, Trial 4, Blairnathort, Kinross site 15
March 2002 GS 1,12
Treatment code Autumn treatment % Light leaf
spot per
plant
% Light leaf
spot per plot
Vigour
1-9 scale
Scorch
1-9 scale
1 Untreated 0 0 7.0 8.0
2 Untreated 0 0 7.7 8.0
3 Folicur 0.5 0 0 8.0 7.7
4 Folicur 0.75 0 0 7.7 5.3
5 Folicur 1.0 0 0 8.3 6.7
6 Punch C 0.4 0 0 7.7 6.0
7 Punch C 0.6 0 0 8.0 4.3
8 Punch C 0.8 0 0 7.7 8.7
9 Bavistan 0.2 0 0 8.0 6.0
10 Sanction 25 0.8 0 0 7.7 6.0
SED 0 0 0.54 1.81
P Ns Ns Ns Ns
There was no disease at the site at this assessment timing and there were no differences in vigour
or scorch levels.
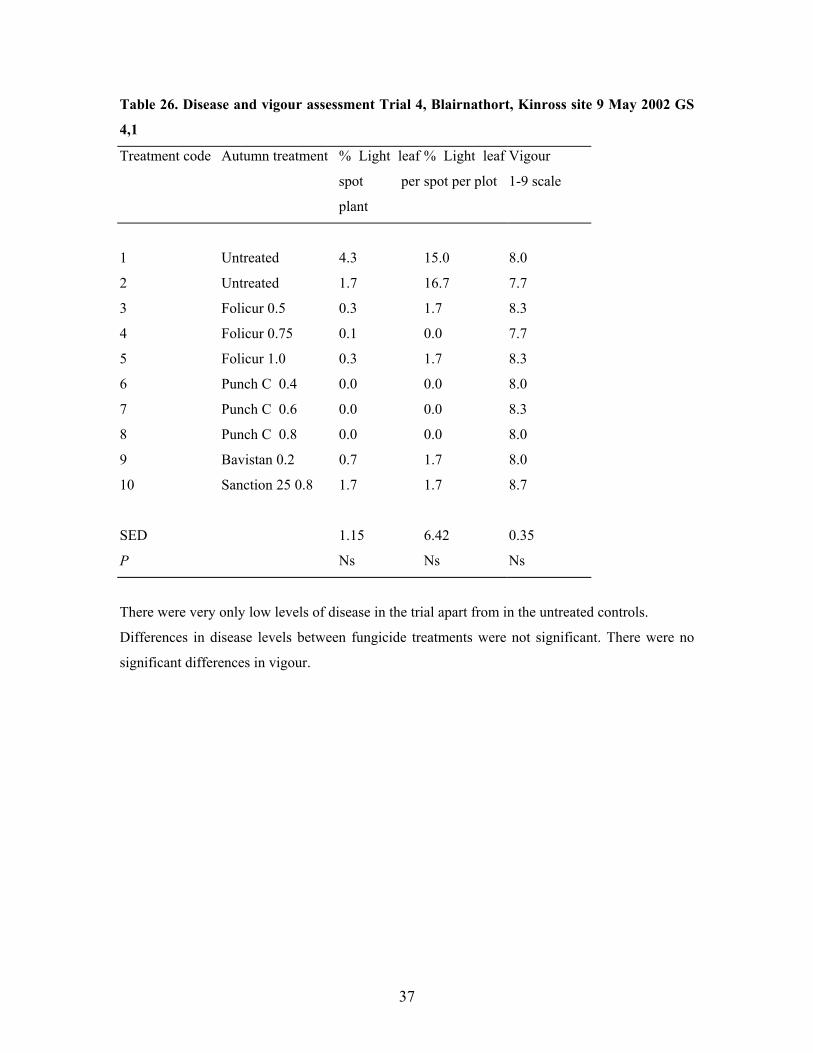
37
Table 26. Disease and vigour assessment Trial 4, Blairnathort, Kinross site 9 May 2002 GS
4,1
Treatment code Autumn treatment % Light leaf
spot per
plant
% Light leaf
spot per plot
Vigour
1-9 scale
1 Untreated 4.3 15.0 8.0
2 Untreated 1.7 16.7 7.7
3 Folicur 0.5 0.3 1.7 8.3
4 Folicur 0.75 0.1 0.0 7.7
5 Folicur 1.0 0.3 1.7 8.3
6 Punch C 0.4 0.0 0.0 8.0
7 Punch C 0.6 0.0 0.0 8.3
8 Punch C 0.8 0.0 0.0 8.0
9 Bavistan 0.2 0.7 1.7 8.0
10 Sanction 25 0.8 1.7 1.7 8.7
SED 1.15 6.42 0.35
P Ns Ns Ns
There were very only low levels of disease in the trial apart from in the untreated controls.
Differences in disease levels between fungicide treatments were not significant. There were no
significant differences in vigour.
38
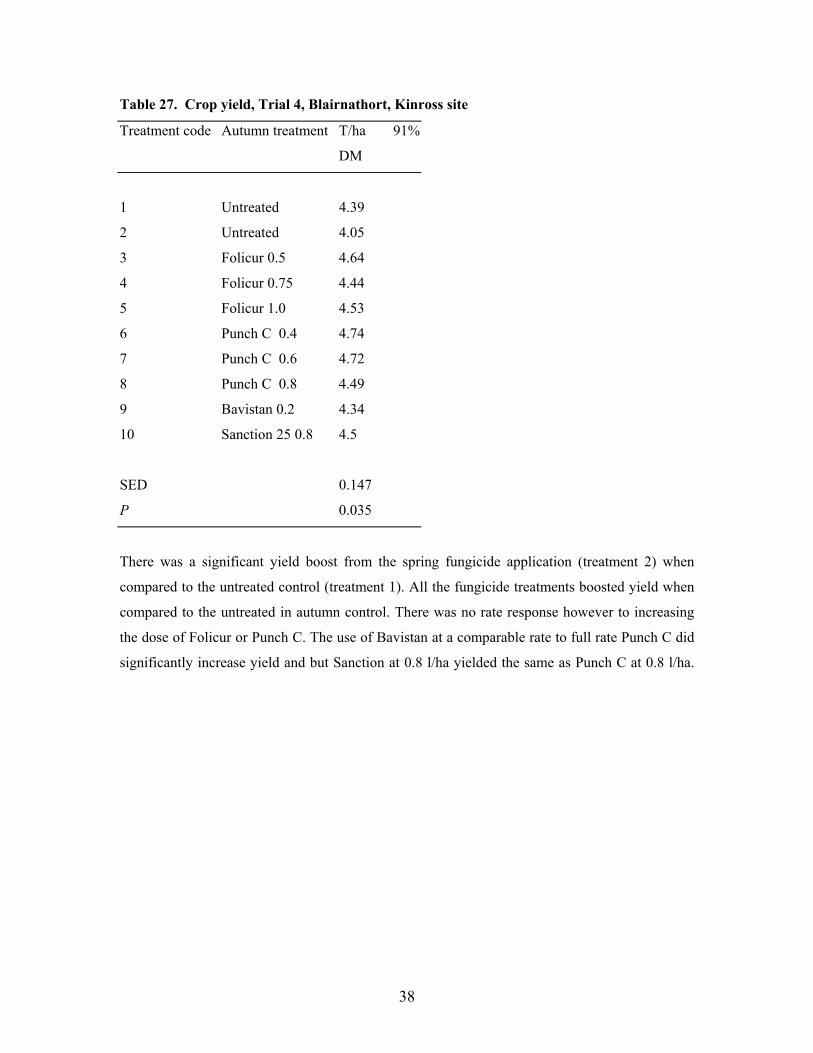
Table 27. Crop yield, Trial 4, Blairnathort, Kinross site
Treatment code Autumn treatment T/ha 91%
DM
1 Untreated 4.39
2 Untreated 4.05
3 Folicur 0.5 4.64
4 Folicur 0.75 4.44
5 Folicur 1.0 4.53
6 Punch C 0.4 4.74
7 Punch C 0.6 4.72
8 Punch C 0.8 4.49
9 Bavistan 0.2 4.34
10 Sanction 25 0.8 4.5
SED 0.147
P 0.035
There was a significant yield boost from the spring fungicide application (treatment 2) when
compared to the untreated control (treatment 1). All the fungicide treatments boosted yield when
compared to the untreated in autumn control. There was no rate response however to increasing
the dose of Folicur or Punch C. The use of Bavistan at a comparable rate to full rate Punch C did
significantly increase yield and but Sanction at 0.8 l/ha yielded the same as Punch C at 0.8 l/ha.
39
6. DISCUSSION There were two main areas of testing in this project. The first was a survey of commercial crops
to determine the incidence and spread of triazole resistance to fungicides. The second area was
the use of field trials to generate fungicide efficacy data and to determine if disease control was
related to the sensitivity of the light leaf spot to the triazole fungicides and to determine if non
triazole mixing partners could improve control.
6.1 Survey of crops to test for triazole sensitivity in light leaf spot The survey covered selected commercial crops throughout the main arable areas of Scotland. A
limited number of samples were also collected from variety trials as part of this survey to increase
the number of varieties sampled within the survey. Isolates were tested for sensitivity to both
Folicur (tebuconazole) and Punch C (flusilazole plus MBC). Fewer isolates were collected in the
2000/2001 season as the outbreak of Foot and Mouth Disease restricted access to farms.
The range of sensitivities measured was large and ranged from 0.5 to 20 ppm. In the first year of
testing the highest concentrations used for testing were 10 and 100 ppm so that isolates that grew
on 10 ppm were classed as having a MIC value of 100. In the second year of testing the highest
concentrations were revised as isolates were generally more sensitive than expected. No isolates
in 2002 grew on fungicide concentrations of greater than 20 ppm and it is likely that the 2001
isolates which grew on 10 ppm would have shown no growth on 20 ppm. It would therefore be
misleading to imply that sensitivity ranged 200 fold. A 40 fold range in sensitivity from 0.5 ppm
to 20 ppm is more accurate.
Isolates with very low MIC values would be very sensitive to the fungicides and isolates with
MIC values of 20 ppm would much less sensitive and therefore harder to control in practice. The
survey showed that there was no significant link between the sensitivity of isolates and the
location from which they were sampled. There was an interesting trend in that isolates from the
north east where light leaf spot pressure is high were amongst the least sensitive, whilst the
isolate collected from Cambridge was the most sensitive with an MIC value of 0.5.
There was also no link between the sensitivity of isolates and the variety from which they had
been sampled which suggests there was no selection for different resistance genotypes with
40
different varieties. Previous fungicide history on the crop from which light leaf spot samples were
taken did not influence fungicide sensitivity and there was no evidence that samples from
untreated crops were more or less sensitive than those from treated crops. Similarly there was no
evidence that isolates taken from MBC plus triazole treated crops were any more or less sensitive
than isolates sampled from straight triazole treated crops. There was also no correlation between
area sampled and the sensitivity of isolates. Isolates with reduced sensitivities were noted in all
the Scottish geographic regions sampled.
Isolates were tested for sensitivity to Folicur and to Punch C. Isolates tended to be more sensitive
to Folicur (mean MIC 8.22 ppm) than to Punch C (mean MIC 19.2ppm). There has been very
little base line testing of triazole fungicides carried out for light leaf spot and it is therefore hard
to determine if the sensitivity to triazoles have declined markedly since their introduction for light
leaf spot control. Data supplied by DuPont (UK) Ltd shows that for a limited number of isolates
tested in 1995 from England, none grew on 10 ppm Punch C amended agar. For Scottish isolates
tested at the same time, 40% grew on 10 ppm amended agar. None of the isolates tested in the
1995 survey had an MIC value of greater than 25 ppm. For the current project, in the survey
completed in 2001 and 2002, 68% of isolates showed some growth on 10 ppm Punch C, but in
2002 none of the isolates showed any growth on 20 ppm Punch C amended agar. There is
therefore an indication from past data that more isolates will now grow on a 10 ppm
discriminatory dose now compared to 1995 but this shift has not been dramatic as isolate growth
was still halted at 20 ppm.
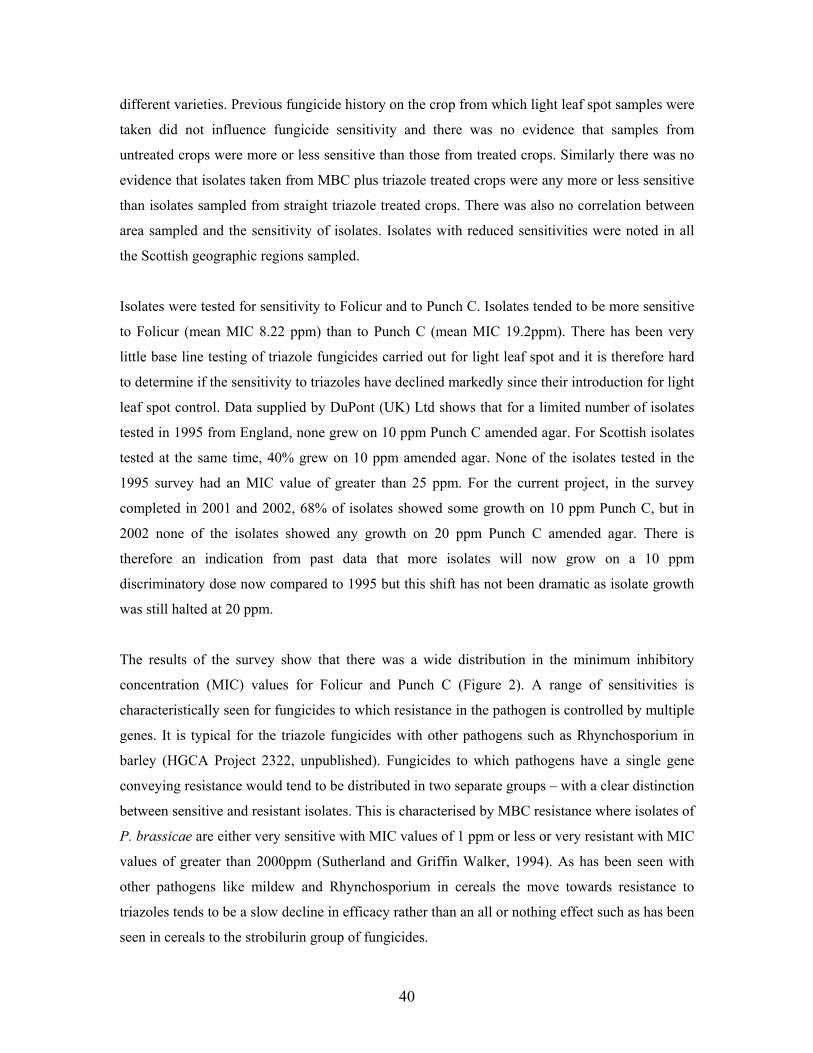
The results of the survey show that there was a wide distribution in the minimum inhibitory
concentration (MIC) values for Folicur and Punch C (Figure 2). A range of sensitivities is
characteristically seen for fungicides to which resistance in the pathogen is controlled by multiple
genes. It is typical for the triazole fungicides with other pathogens such as Rhynchosporium in
barley (HGCA Project 2322, unpublished). Fungicides to which pathogens have a single gene
conveying resistance would tend to be distributed in two separate groups – with a clear distinction
between sensitive and resistant isolates. This is characterised by MBC resistance where isolates of
P. brassicae are either very sensitive with MIC values of 1 ppm or less or very resistant with MIC
values of greater than 2000ppm (Sutherland and Griffin Walker, 1994). As has been seen with
other pathogens like mildew and Rhynchosporium in cereals the move towards resistance to
triazoles tends to be a slow decline in efficacy rather than an all or nothing effect such as has been
seen in cereals to the strobilurin group of fungicides.
41
The results in Figure 2 do not show a normal distribution. There are more isolates grouped at the
sensitive end of the scale than would be expected if a normal distribution curve was fitted. This is
also typical of the triazole group of fungicides and has been seen for other pathogens. For
example in HGCA project 2322 (unpublished) on Rhynchosporium there was a similar pattern in
the sensitivity data generated by Queens University, Belfast. In the Rhynchosporium work some
isolates of the pathogen population remained sensitive, while a second, overlapping group within
the population were less sensitive and formed a second distribution curve. In the light leaf spot
survey this pattern is seen in the incidence of isolates recorded as highly sensitive in the survey
which are grouped at the left hand side of the axis and in an overlapping group which are less
sensitive and form a second distribution curve further along the axis. Very few isolates had MIC
values above 10 ppm which shows that the population is still generally sensitive to triazoles but
the variation is such that differences in the efficacy of triazole fungicides will be apparent
between sites in Scotland.
Figure 2: Distribution of sensitivity for Folicur and Punch C by MIC value.
0
10
20
30
40
50
0.5 1 5 10 20 100
MIC (ppm)
% Is
olat
es T
este
d
Folicur Punch C
8.49 ppm residue

42
The issue of variable sensitivity leading to variable control with fungicides is very critical when
the data from the tebuconazole residue testing is added to the data in Figure 2. The highest
residue recorded in the trials a month after a spray with a full dose rate of Folicur (a.i.
tebuconazole) was 8.49 ppm.
The growth habit of the light leaf spot pathogen is different in planta than it is when isolated onto
agar. On amended agar P. brassicae is more directly exposed to the fungicide than would be the
case in planta , and there will be differences in the breakdown and metabolism of fungicides
between the two scenarios. It is not, therefore, possible to compare directly between fungicide
efficacy in the plant and fungicide efficacy in the amended agar used to determine the isolate
sensitivity. Making the assumption that they are related the survey data shows that two weeks
after spray application, potentially 68% of the light leaf spot population in Scotland would not be
controlled by this level of tebuconazole. This raises very important questions about the dose rates
used in light leaf spot control programmes in terms of the persistence of the fungicide sprays
applied and the protectant effect that is required.
A full dose rate of Folicur in 200 litres of water equates to 1250 ppm. One half of the full dose
rate equates to 625 ppm as shown in Figure 3. The residue levels detected in the trial sites
therefore represent a small fraction of the dose rate applied to the treatment. Punch C in 200 litres
of water gives a concentration of 1000 ppm flusilazole. The line at the bottom of the graph in
Figure 3 represents the highest residue level of 8.49 ppm tebuconazole that was detected in the
trials. The wide range in sensitivity to Folicur and to Punch C that has been quantified in this
project, coupled with the residue data showing tebuconazole residues in plants following
treatment implies that there will be variable efficacy in triazole fungicides across Scotland. Dose
rate maybe very critical in determining the degree of control seen on many farms.
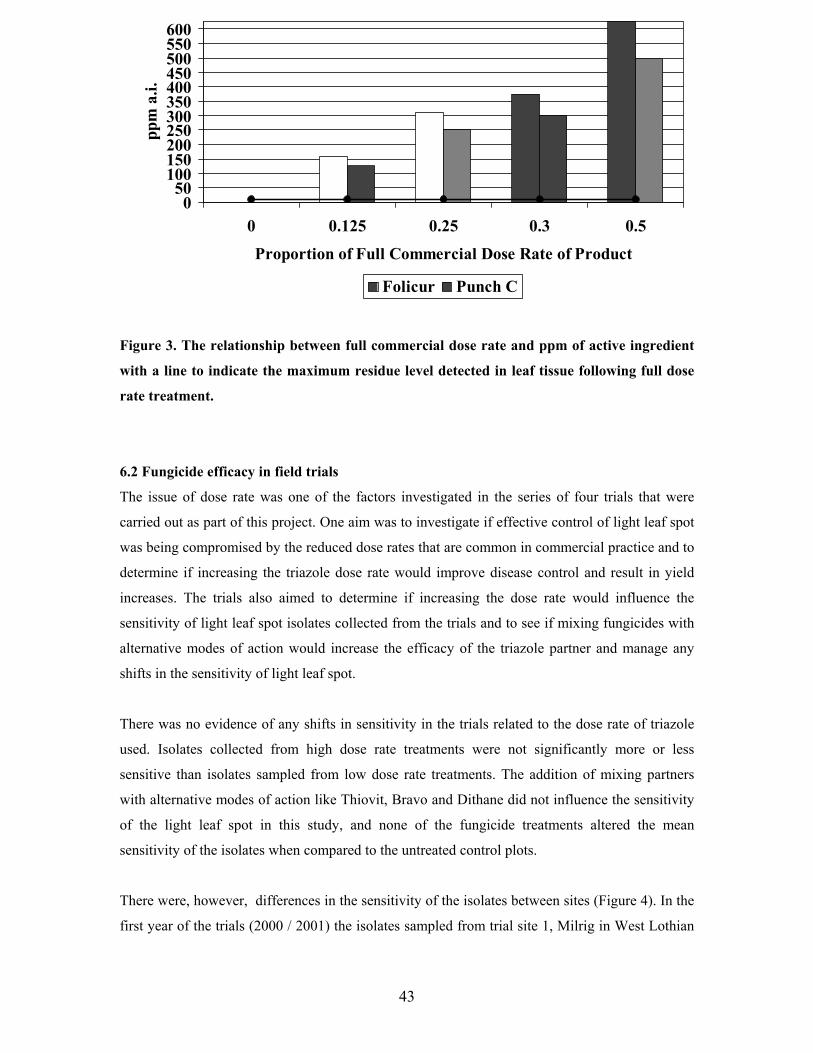
43
Figure 3. The relationship between full commercial dose rate and ppm of active ingredient
with a line to indicate the maximum residue level detected in leaf tissue following full dose
rate treatment.
6.2 Fungicide efficacy in field trials
The issue of dose rate was one of the factors investigated in the series of four trials that were
carried out as part of this project. One aim was to investigate if effective control of light leaf spot
was being compromised by the reduced dose rates that are common in commercial practice and to
determine if increasing the triazole dose rate would improve disease control and result in yield
increases. The trials also aimed to determine if increasing the dose rate would influence the
sensitivity of light leaf spot isolates collected from the trials and to see if mixing fungicides with
alternative modes of action would increase the efficacy of the triazole partner and manage any
shifts in the sensitivity of light leaf spot.
There was no evidence of any shifts in sensitivity in the trials related to the dose rate of triazole
used. Isolates collected from high dose rate treatments were not significantly more or less
sensitive than isolates sampled from low dose rate treatments. The addition of mixing partners
with alternative modes of action like Thiovit, Bravo and Dithane did not influence the sensitivity
of the light leaf spot in this study, and none of the fungicide treatments altered the mean
sensitivity of the isolates when compared to the untreated control plots.
There were, however, differences in the sensitivity of the isolates between sites (Figure 4). In the
first year of the trials (2000 / 2001) the isolates sampled from trial site 1, Milrig in West Lothian
050
100150200250300350400450500550600
0 0.125 0.25 0.3 0.5
Proportion of Full Commercial Dose Rate of Product
ppm
a.i.
Folicur Punch C
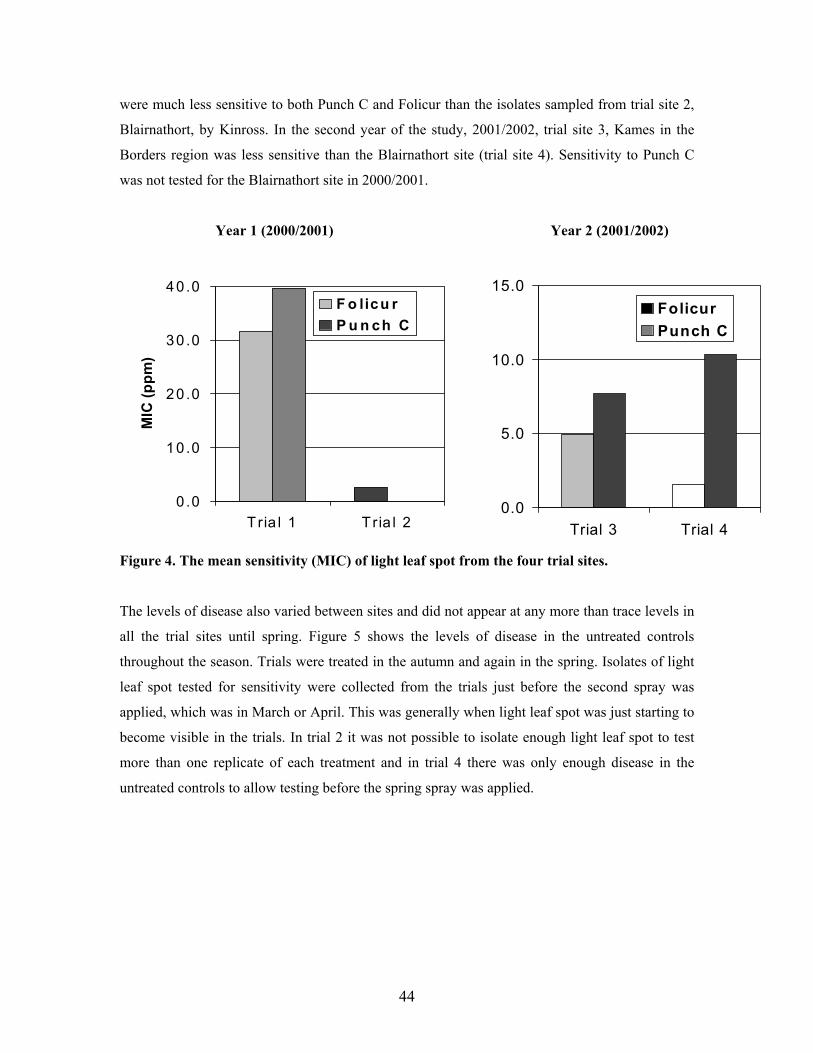
44
were much less sensitive to both Punch C and Folicur than the isolates sampled from trial site 2,
Blairnathort, by Kinross. In the second year of the study, 2001/2002, trial site 3, Kames in the
Borders region was less sensitive than the Blairnathort site (trial site 4). Sensitivity to Punch C
was not tested for the Blairnathort site in 2000/2001.
Year 1 (2000/2001) Year 2 (2001/2002)
Figure 4. The mean sensitivity (MIC) of light leaf spot from the four trial sites.
The levels of disease also varied between sites and did not appear at any more than trace levels in
all the trial sites until spring. Figure 5 shows the levels of disease in the untreated controls
throughout the season. Trials were treated in the autumn and again in the spring. Isolates of light
leaf spot tested for sensitivity were collected from the trials just before the second spray was
applied, which was in March or April. This was generally when light leaf spot was just starting to
become visible in the trials. In trial 2 it was not possible to isolate enough light leaf spot to test
more than one replicate of each treatment and in trial 4 there was only enough disease in the
untreated controls to allow testing before the spring spray was applied.
0.0
10 .0
20 .0
30 .0
40 .0
Tria l 1 Tria l 2
MIC
(ppm
)
F o licu rP u n ch C
0.0
5.0
10.0
15.0
Trial 3 Trial 4
FolicurPunch C
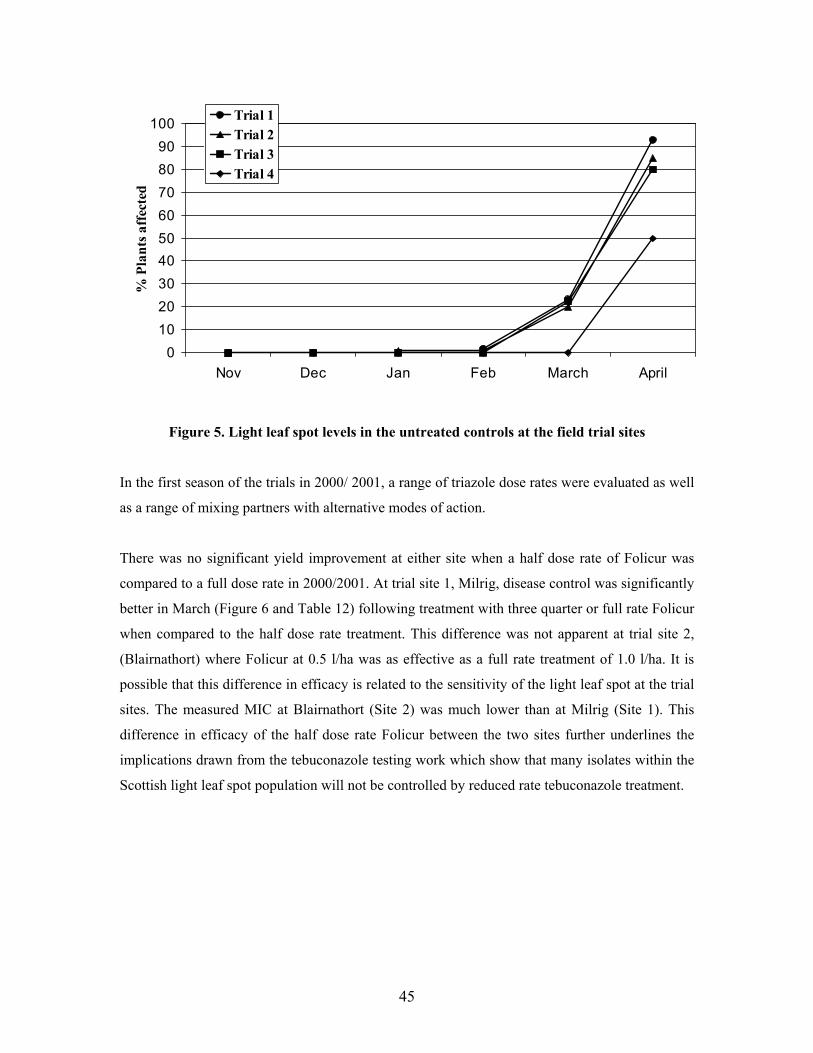
45
Figure 5. Light leaf spot levels in the untreated controls at the field trial sites
In the first season of the trials in 2000/ 2001, a range of triazole dose rates were evaluated as well
as a range of mixing partners with alternative modes of action.
There was no significant yield improvement at either site when a half dose rate of Folicur was
compared to a full dose rate in 2000/2001. At trial site 1, Milrig, disease control was significantly
better in March (Figure 6 and Table 12) following treatment with three quarter or full rate Folicur
when compared to the half dose rate treatment. This difference was not apparent at trial site 2,
(Blairnathort) where Folicur at 0.5 l/ha was as effective as a full rate treatment of 1.0 l/ha. It is
possible that this difference in efficacy is related to the sensitivity of the light leaf spot at the trial
sites. The measured MIC at Blairnathort (Site 2) was much lower than at Milrig (Site 1). This
difference in efficacy of the half dose rate Folicur between the two sites further underlines the
implications drawn from the tebuconazole testing work which show that many isolates within the
Scottish light leaf spot population will not be controlled by reduced rate tebuconazole treatment.
0102030405060708090
100
Nov Dec Jan Feb March April
% P
lant
s aff
ecte
d
Trial 1Trial 2Trial 3Trial 4

46
Figure 6. The influence of dose rate of Folicur on light leaf spot control at Gs 3,1 and yield,
sites 1 and two.
In both trials carried out in 2000/2001 (Trial sites 1 and 2) there was no significant improvement
in disease control with the addition of either Thiovit, Bravo or Dithane to half dose rate Folicur
when compared to a straight half dose rate Folicur treatment. Disease control from straight
Thiovit, Bravo or Dithane was not significantly better than the untreated controls and one
assessment timings Bravo was significantly worse. There was a small but just significant (P =
0.05) yield benefit, however, at trial site 1 at Milrig, West Lothian from straight Bravo and
Dithane when compared to the untreated control (Figure 7). There was a larger yield benefit to
straight Thiovit at this site but the site was of a lower sulphur status and the yield response was
probably a fertiliser response and was not noted at the other site.
0102030405060708090
100
UT 0.5 Folicur 0.75 Folicur 1.0 Folicur
% P
lant
s af
fect
ed
3
3.5
4
4.5
5
5.5
6
Yiel
d t/h
a
LLS site 1 LLS site 2 Yield site 1 Yield site 2
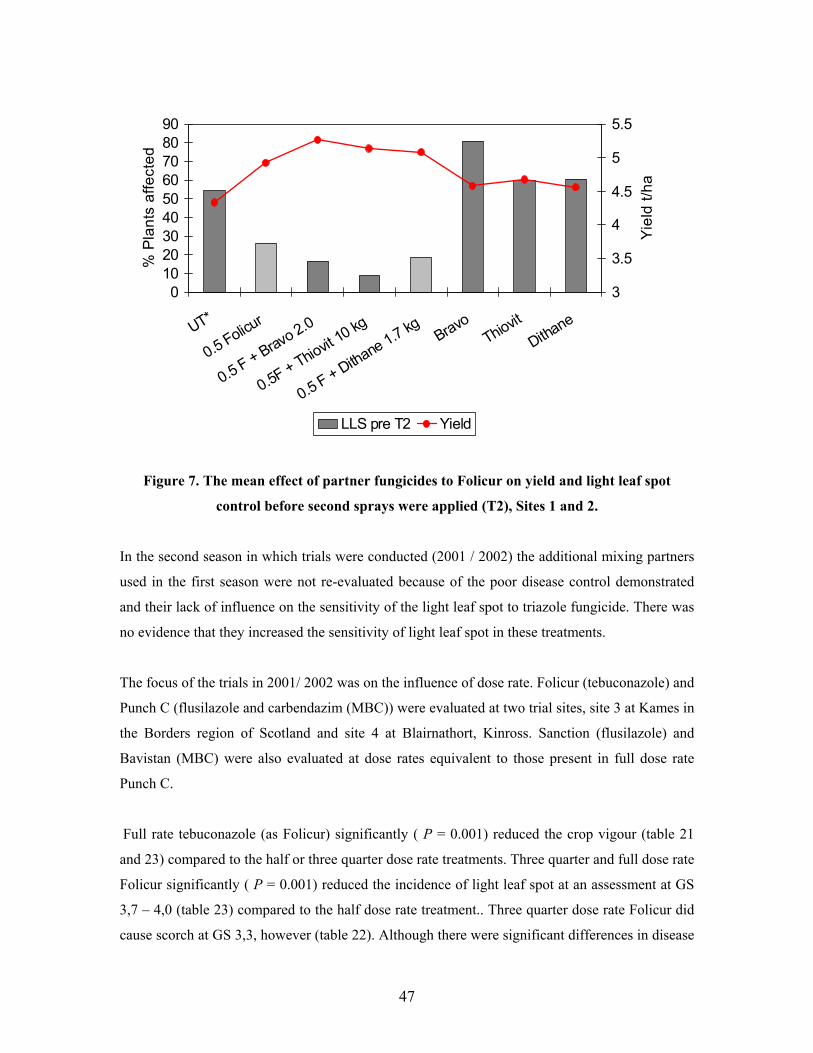
47
Figure 7. The mean effect of partner fungicides to Folicur on yield and light leaf spot
control before second sprays were applied (T2), Sites 1 and 2.
In the second season in which trials were conducted (2001 / 2002) the additional mixing partners
used in the first season were not re-evaluated because of the poor disease control demonstrated
and their lack of influence on the sensitivity of the light leaf spot to triazole fungicide. There was
no evidence that they increased the sensitivity of light leaf spot in these treatments.
The focus of the trials in 2001/ 2002 was on the influence of dose rate. Folicur (tebuconazole) and
Punch C (flusilazole and carbendazim (MBC)) were evaluated at two trial sites, site 3 at Kames in
the Borders region of Scotland and site 4 at Blairnathort, Kinross. Sanction (flusilazole) and
Bavistan (MBC) were also evaluated at dose rates equivalent to those present in full dose rate
Punch C.
Full rate tebuconazole (as Folicur) significantly ( P = 0.001) reduced the crop vigour (table 21
and 23) compared to the half or three quarter dose rate treatments. Three quarter and full dose rate
Folicur significantly ( P = 0.001) reduced the incidence of light leaf spot at an assessment at GS
3,7 – 4,0 (table 23) compared to the half dose rate treatment.. Three quarter dose rate Folicur did
cause scorch at GS 3,3, however (table 22). Although there were significant differences in disease
0102030405060708090
UT*
0.5 Folicur
0.5 F + Bravo 2.0
0.5F + Thiovit 10 kg
0.5 F + Dithane 1.7 kg BravoThiovit
Dithane
% P
lant
s af
fect
ed
3
3.5
4
4.5
5
5.5
Yiel
d t/h
a
LLS pre T2 Yield
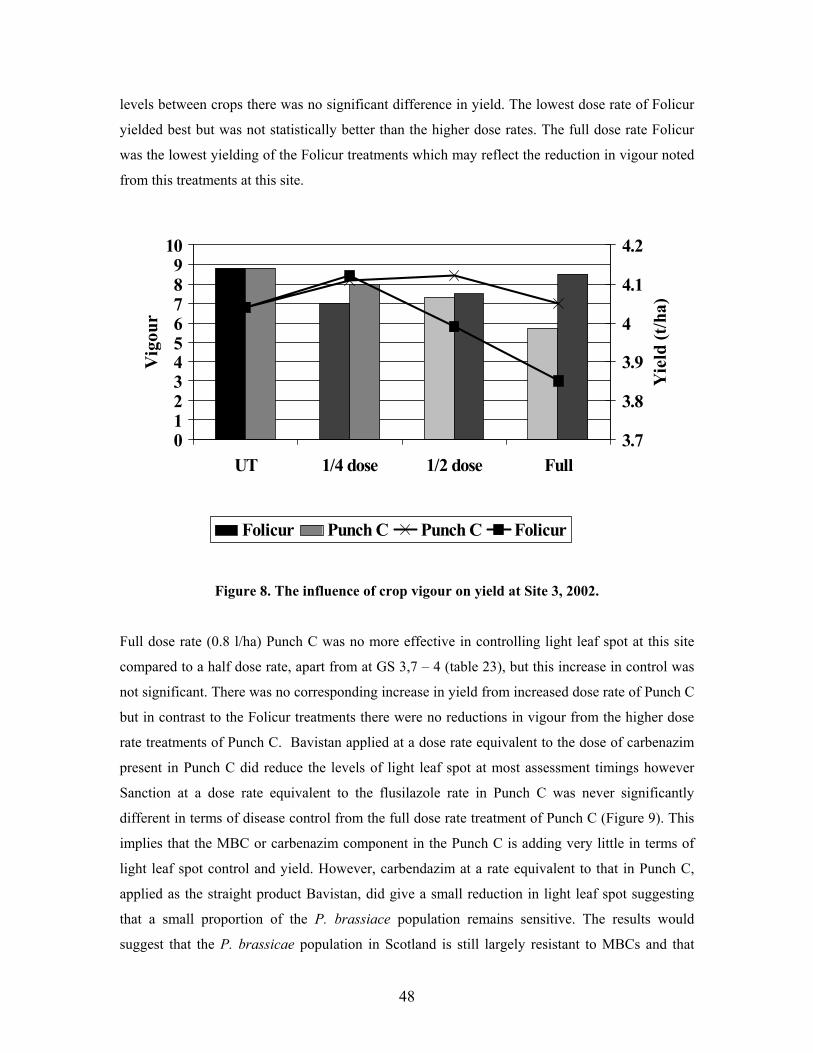
48
levels between crops there was no significant difference in yield. The lowest dose rate of Folicur
yielded best but was not statistically better than the higher dose rates. The full dose rate Folicur
was the lowest yielding of the Folicur treatments which may reflect the reduction in vigour noted
from this treatments at this site.
Figure 8. The influence of crop vigour on yield at Site 3, 2002.
Full dose rate (0.8 l/ha) Punch C was no more effective in controlling light leaf spot at this site
compared to a half dose rate, apart from at GS 3,7 – 4 (table 23), but this increase in control was
not significant. There was no corresponding increase in yield from increased dose rate of Punch C
but in contrast to the Folicur treatments there were no reductions in vigour from the higher dose
rate treatments of Punch C. Bavistan applied at a dose rate equivalent to the dose of carbenazim
present in Punch C did reduce the levels of light leaf spot at most assessment timings however
Sanction at a dose rate equivalent to the flusilazole rate in Punch C was never significantly
different in terms of disease control from the full dose rate treatment of Punch C (Figure 9). This
implies that the MBC or carbenazim component in the Punch C is adding very little in terms of
light leaf spot control and yield. However, carbendazim at a rate equivalent to that in Punch C,
applied as the straight product Bavistan, did give a small reduction in light leaf spot suggesting
that a small proportion of the P. brassiace population remains sensitive. The results would
suggest that the P. brassicae population in Scotland is still largely resistant to MBCs and that
0123456789
10
UT 1/4 dose 1/2 dose Full
Vig
our
3.7
3.8
3.9
4
4.1
4.2
Yie
ld (t
/ha)
Folicur Punch C Punch C Folicur
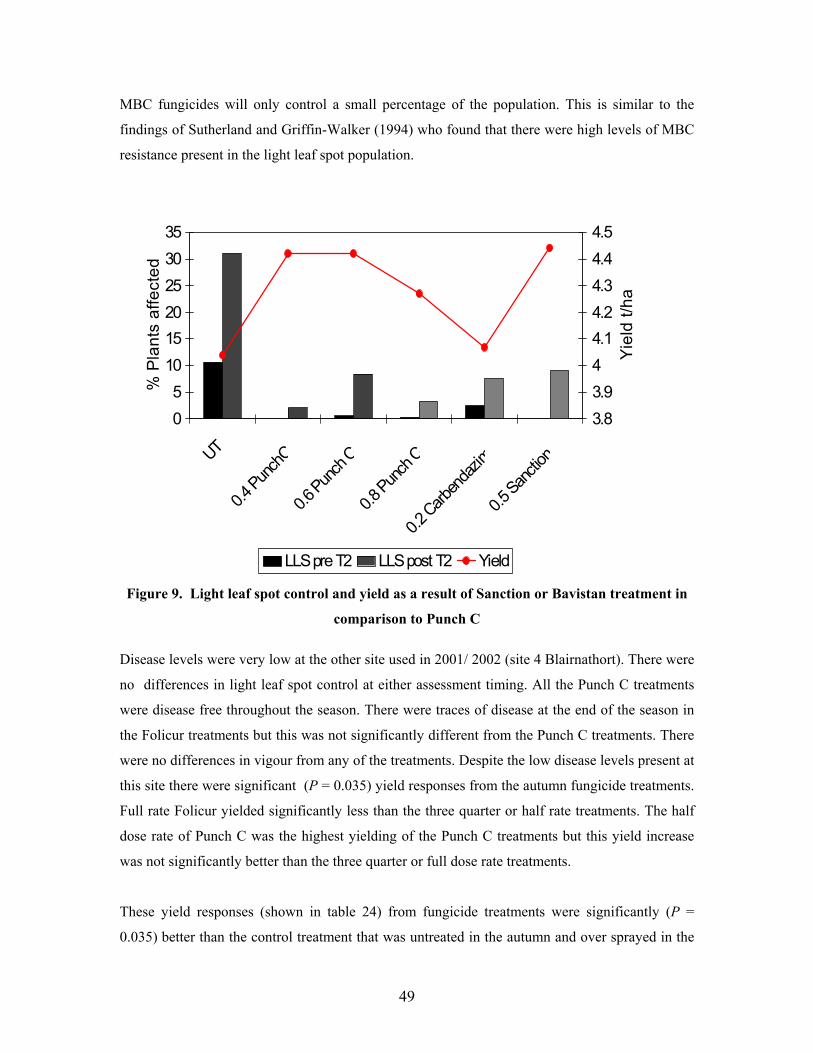
49
MBC fungicides will only control a small percentage of the population. This is similar to the
findings of Sutherland and Griffin-Walker (1994) who found that there were high levels of MBC
resistance present in the light leaf spot population.
Figure 9. Light leaf spot control and yield as a result of Sanction or Bavistan treatment in
comparison to Punch C Disease levels were very low at the other site used in 2001/ 2002 (site 4 Blairnathort). There were
no differences in light leaf spot control at either assessment timing. All the Punch C treatments
were disease free throughout the season. There were traces of disease at the end of the season in
the Folicur treatments but this was not significantly different from the Punch C treatments. There
were no differences in vigour from any of the treatments. Despite the low disease levels present at
this site there were significant (P = 0.035) yield responses from the autumn fungicide treatments.
Full rate Folicur yielded significantly less than the three quarter or half rate treatments. The half
dose rate of Punch C was the highest yielding of the Punch C treatments but this yield increase
was not significantly better than the three quarter or full dose rate treatments.
These yield responses (shown in table 24) from fungicide treatments were significantly (P =
0.035) better than the control treatment that was untreated in the autumn and over sprayed in the
05
101520253035
UT
0.4 Pun
chC
0.6 Pun
ch C
0.8 Pun
ch C
0.2 Carb
enda
zim
0.5 San
ction
% P
lant
s af
fect
ed
3.83.944.14.24.34.44.5
Yiel
d t/h
a
LLS pre T2 LLS post T2 Yield
50
spring with the treatment plots (treatment 2). The totally untreated control (treatment 1) that was
not sprayed in either the autumn or the spring however yielded significantly better than the
control that was over sprayed in the spring implying that the Folicur over sprayed at half dose rate
may have had a yield reducing effect. It is interesting that the half and three quarter dose rate
Punch C treatments yielded better than the untreated control plots as well as the untreated in
autumn only control. This further demonstrates that dose rates of triazoles need to be carefully
selected and that despite the variable disease control demonstrated at reduced dose rates,
increasing the dose rate is not necessarily the answer to this reduced efficacy. There were
significant negative impacts on the vigour of the crop as a result of high rate Folicur treatments.
Reviewing the efficacy, crop safety and yield data generated in the course of this project it is clear
that because of the range of sensitivities in the P. brassicae population to triazole fungicides, the
efficacy of these fungicide treatments will be variable within and between sites. It was apparent
from the tebuconazole residue testing that reduced dose rate treatments will result in levels of
fungicide in the leaves that will not be effective at controlling the majority of P. brassicae
isolates that were assayed for sensitivity in the course of this work. Unfortunately increasing the
dose rate is not as straight forward a solution to this as might be thought. High dose rates of
Folicur had significant impacts on the vigour of the crop and caused visible stunting of plants at
the Kames site. This reduction in vigour was reflected in reduced yields from the full does rate
treatments and there was also evidence that even lower doses can cause yield reductions where
the benefits in disease control are not sufficient to mitigate the vigour effect ( Site 4). In contrast,
although the P. brassicae isolates assayed in this work were generally less sensitive to Punch C
than they were to Folicur there were no crop safety issues with this product at the full dose rate
treatments evaluated. Disease control in the field trials was generally comparable to that seen
with Folicur which implies that the difference in sensitivity is not often large enough to be noted
in a reduction in efficacy. Folicur did give significantly better control than Punch C at the
Blairnathort site in 2001 (Site 2). Isolates from this site were amongst the most sensitive to
tebuconazole of the isolates tested in the project and this may explain the increased efficacy of
Folicur at this site. Punch C out yielded Folicur at both sites in 2002, although not significantly.
The addition of additional partner fungicides with alternative modes of action such as Dithane,
Thiovit or Bravo did not significantly improve disease control or alter the sensitivity of the P.
brassicae isolates assayed from the trials. This is not to imply that a mixture stategy of alternative
mode of action fungicides is not an effective way to manage fungicide resistance. Rather it
51
probably reflects the lack of efficacy of the partner fungicides evaluated. Thiovit, Dithane and
Bravo showed no significant disease control and therefore as a result add nothing to the light leaf
spot control shown from triazole fungicides and cannot therefore be expected to be an effective
anti-resistance strategy.
MBC as a mixing partner was slightly different. As straight Bavistan very little light leaf spot
control was demonstrated in the trials and straight Sanction was not significantly better or worse
than the formulated mixure product Punch C. In contrast to Thiovit, Bravo and Dithane, however,
there may be isolates of P. brassicae that are sensitive to the MBC component in Punch C and
Bavistan, particularly in lower disease pressure areas of the UK. The low levels of disease control
seen in these trials from the MBC component imply that a significant proportion or possibly the
majority of the P.brassicae population was resistant to MBC fungicides at the sites utilised, but it
may still represent a potential mixing partner fungicide strategy for managing resistance in areas
where efficacy is retained. Previous work (Sutherland and Griffin-Walker, 1994) has shown how
widespread resistance to MBC fungicides is in the P. brassicae poulation, which is unfortunate as
there are no other effective potential mixing partners to form alternative anti-resistance strategies
with. The strobilurin fungicides do not generally show much efficacy against light leaf spot and
are unlikely to gain Approval for use of the crop.
The survey of light leaf spot, sampled from winter oilseed rape across Scotland and tested for
sesnitivity, showed that isolates with reduced sensitivity (higher MIC values) were as likely to be
found in all the main arable regions of Scotland and were not restricted to high pressure areas
such as the north east. The recommendations drawn from this project are therefore applicable to
all regions in Scotland. Dose rates of half the full commercial dose rate or less are likely to show
very variable degrees of efficacy and will show poor disease control in many cases. This is
because a significant proportion of the P. brassiace population in Scotland will not be controlled
by the levels of fungicide residues that such reduced dose rate treatments will deposit in the crop.
Increasing the dose rate of Folicur too far caused crop damage. Three quarter does rate sprays
were generally significantly more effective than the half dose rate sprays and did not cause such
significant crop damage. Punch C did not have the same crop safety issues at higher dose rates,
although a full dose rate yielded less than the three quarter dose rate, suggesting that the three
quarter rate is optimal. There were no effective mixing partners demonstrated in this work and the
widespread occurrence of MBC resistance makes the use of MBC in mixtures with triazoles as an
alternative mode of action anti-resistance strategy a questionable approach. It does, however,
52
represent the only mixing partner with any efficacy at present and has to be given consideration
because of this.
The development of triazole resistance is having a direct effect on the levy payers, with less
effective disease control and poor returns. Resistance will also have implications for other
HGCA funded research such as variety testing and the PASSWORD project. The UK variety list
is based on comparisons of varieties untreated and treated with triazole fungicides. If any of the
variety test sites has a triazole resistant light leaf spot population then this could favour resistant
but lower yielding varieties over susceptible but higher yielding varieties. It could also affect
potential new variety screening. The PASSWORD project aims to develop a pest and disease
management system for supporting winter oilseed rape decisions. If triazole resistance is
recognised on a farm this will affect the management decisions taken. The extent of triazole
resistance needs to be established so that this can be built into the PASSWORD project.
A future area of study, leading from this project, has to be a determination of the distribution of
triazole and MBC resistance throughout the whole of the UK so that the efficacy of the very
limited range of products which control light leaf spot can be protected. Limited evidence shows
that P. brassicae may still be more sensitive to triazole fungicides in England. An isolate from
Cambridgeshire tested in this project was amongst the most sensitive assayed. Similarly more
isolates from England may remain sensitive to MBC fungicides. If this is the case then the use of
triazole plus MBC mixtures may represent an effective anti-resistance strategy. In the past
growers have placed very little value on the selection of fungicides for anti-resistant reasons.
Yield and disease control properties are far more important to individual growers than any longer
term protection strategies designed to protect the fungicides they rely on. It is critical that anti-
resistance strategies are promoted by consultants and advisors, particularly in cases like this
where the cost and efficacy penalties in the short term of using such a strategy compared to a
straight triazole programme are minimal, if present at all.
53
7. CONCLUSIONS
The P. brassicae population is very variable in its sensitivity to triazole fungicides. The
sensitivity of the isolate assayed in the course of this work ranged at least forty fold from an MIC
values of 0.5 ppm to 20 ppm tebuconazole. There was no link between area surveyed and the
mean sensitivity of isolates assayed. Less sensitive isolates were isolated from commercial crops
throughout Scotland and were as common in all the regions surveyed. There was no link
determined between the recorded crop history and the sensitivity of the isolates – the variety
sampled did not influence the sensitivity of the isolates and nor did previous fungicide history.
Previous treatment with a triazole fungicide or a triazole plus fungicide mixture did not
significantly alter the sensitivity of isolates compared to isolates assayed from untreated crops.
This may reflect the almost ubiquitous use of triazoles or triazole plus MBC mixtures to control
light leaf spot in oilseed rape and the consequent high levels of expose of the whole population to
these fungicide groups.
Isolates were generally slightly less sensitive to Punch C than they were to Folicur. This would
tend to demonstrate that the MBC component of the mixture is largely ineffective as a result of P.
brassiace resistance to the MBC group of fungicides. The field trials showed however that the
difference in sensitivity between Punch C and Folicur seen in the assays for sensitivity was
seldom translated into a significant difference in disease control in the field. Only at a site with a
high proportion of tebuconazle sensitive isolates was Punch C significantly less effective in light
leaf spot control.
Comparison with historical data from DuPont (UK) Ltd shows that the proportion of isolates that
will grow on a discriminatory dose of 10 ppm flusilazole in 1995 has increased in 2000 to 2002,
but that the shift in sensitivity has not been large. No current isolates in this project grew on a
20ppm discriminatory dose. This is in contrast to MBC resistance where resistant isolates will
continue to grow in concentrations in excess of 2000 ppm.
The range in sensitivity within the P. brassiacae population was still large enough to cause
problems in light leaf spot control in the field and the reason for this was clearly demonstrated
with the tebuconazole residue testing that was done. A month after treatment with reduced dose
rate Folicur levels of tebuconazole in the leaves were no greater than in untreated control plots.
Even in the full dose rate treatment sampled a month after spraying the tebuconazole levels were
54
still low enough that the majority of the P. brassicae isolates assayed would have been able to
grow. This demonstrated that dose rate is likely to be very critical in the efficacy of fungicides in
the control of light leaf spot.
Similar results were found in the field trials. Full and three quarter rate Folicur treatment tended
to give significantly better control than half dose rate treatments. However, there were crop safety
issues involved in increasing the dose rate and a full dose rate treatment caused significant losses
in crop vigour that were reflected in yield. Given the current levels of reduced sensitivity to
tebuconazole in the Scottish P. brassicae population dose rates of below half dose rate Folicur
will almost certainly be ineffective in controling light leaf spot. A three quarter dose rate probably
represents a compromise between this reduced disease efficacy and the crop damage seen at
higher rates. There were no crop safety issue involved in increasing the dose rate of Punch C and
although the P. brassiace population is generally less sensitive to this product than it is to Folicur
the difference is seldom large enough to translate into a reduction in efficacy in the field. Three
quarter dose rate of Punch C was optimal for yield in the trials.
It was not possible to recommend a successful anti resistance strategy through the use of partner
fungicides with alternative modes of action in the course of this work. This was because of the
lack of any alternative fungicides with any efficacy against light leaf spot. Thiovit, Barvo and
Dithane were evaluated but did not show any significant efficacy against P. brassicae. MBC
fungicides are similarly weak as an anti-resistant strategy because of their widespread lack of
efficacy where resistant strains of P. brassiacae are present. Where there are still resistant isolates
in the population they may still represent an effective anti-resistant strategy and may prolong the
period of efficacy of the triazoles by avoiding an over reliance on the triazole component which
will select for less sensitive members of the population which is probably what has happened in
the Scottish situation where triazole fungicides have been used almost exclusively for a number
of years.
Limited evidence shows that P. brassicae may still be more sensitive to triazole fungicides in
England. An isolate from Cambridgeshire tested in this project was amongst the most sensitive
assayed. Similarly more isolates from England may remain sensitive to MBC fungicides. If this is
the case then the use of triazole plus MBC mixtures may represent an effective anti-resistance
strategy. In the past growers have placed very little value on the selection of fungicides for anti-
resistant reasons. Yield and disease control properties are far more important to individual

55
growers than any longer term protection strategies designed to protect the fungicides they rely on.
It is critical that anti-resistance strategies are promoted by consultants and advisors, particularly
in cases like this where the cost and efficacy penalties in the short term of using such a strategy
compared to a straight triazole programme are minimal, if present at all.
56
8. REFERENCES
Bowen HM, Snowden JP, Thomas LA, 1993. Pesticide usage in Scotland, arable crops 1992.
SOAFD, Edinburgh, 76 pp.
DEFRA, 2001. Final results of the June 2000 Agricultural and Horticultural Census: England
Regions and Counties. URL:http://www.defra.gov.uk/esg/work-
htm/publications/cs/census/analyses/surrent/xls/crop/xls.
Doughty KJ, Petinon S, McCartney HA, 1995. A comparison of the effects of fungal disease on
the growth and field yield of two winter oilseed rape (Brassica napus L. ) cultivars.
Aspects of Applied Biology, 42, Physiological responses of plants to pathogens, pp. 43 –
51.
Gladders P, 1998. Disease management in oilseed rape. In: Proceedings of the 6th HGCA
Research and Development Conference on Cereals and Oilseeds, 1998 (Management
Through Understanding: Research into Practice, Cambridge, UK, London, UK: Home-
Grown Cereals Authority, 10.10-10.11.
Gladders P, Freer B, Green M, Hardwick NV, Jones OW, Sutherland KG, 1998. Roles of
varieties and fungicides in managing light leaf spot and canker in winter oilseed rape.
Home Grown Cereals Authority Project Report OS28, 109pp.
Fitt BDL, Gladders P, Figueroa L, Murray G, 1994. Forecasting light leaf spot (Pyrenopeziza
brassicae) on winter oilseed rape. Proceedings Brighton Crop Protection Conference.
Farnham, UK: British Crop Protection Council, 265-270.
Fitt BDL, Gladders P, Turner JA, Sutherland KG, Welham, SJ, 1996. Predicting risk of severe
light leaf spot (Pyrenopezia brassicae) on winter oilseed rape in the UK. Proceedings
1996 Brighton Crop Protection Conference – Pests and Diseases, p 239 – 244.
57
Fitt BDL, Gladders P, Turner JA, Sutherland KG, Welham, SJ, 1997. Predicting risk of severe
light leaf spot (Pyrenopezia brassicae) on winter oilseed rape in the UK. GCIRC bulletin,
13, March 1997, p 72 – 74.
Fitt BDL, Gladders P, Turner JA, Sutherland KG, Welham SJ, Davies JML, 1997b. Prospects for
developing a forecasting scheme to optimise use of fungicides for disease control on
winter oilseed rape in the UK. Optimising pesticide applications. Aspects of Applied
Biology 48, 135-142.
Freer JBS, Gladders P, Hardwick NV, Sutherland KG, 1998. The effcet of site, season and
cultivar on disease management strategies for winter oilseed rape grwon in England and
Scotland. Proceedings Brighton Crop Protection Conference Farnham, UK: British Crop
Protection Council, 1047 – 1052.
Ilott TW, Ingram DS, Rawlinson CJ, 1997. Studies of fungicide resistance in Pyrenopeziza
brassicae, cause of light leaf spot disease of oilseed rape and other brassicas.
Transactions of the British Mycological Society, 88, 515 – 523.
Jeffery DC, Jenkins PD, Jones DG, 1994. Comparative studies of light leaf spot (Pyrenopeziza
brassicae) epidemics on the growth and yield of winter oilseed rape. Annals of Applied
Biology, 124, 19-25.
Jones, DR, 1994. Strategies for management of fungicide resistance:cereals. Fungicide Resistance
BCPC Monograph No 60, 357 – 364.
Oxley, SJP, 1999. Optimising input and performance of triazole fungicides in winter wheat by
monitoring residual activity HGCA Research report 204 project 1936.
Sansford CE, Fitt BDL, Gladders P, Lockley KD, Sutherland KG, 1996. Oilseed rape: disease
development, forecasting and yield loss relationships. Home Grown Cereals Authority
Project Report OS17, 185 pp.
Scottish Executive, 2001. Final Results of the June 2000 Agricultural Census. Scottish Executive.
URL: http://www.scotland.gov.uk /agri/documents/agcen-jun00-01.asp.
58
Su H, Fitt BDL, Welham J, Sansford CE, Sutherland KG, 1998a. Effects of light leaf spot
(Pyrenopeziza brassicae) on yield of winter oilseed oilseed rape (Brassica napus). Annals
of Applied Biology, 132, 371 – 386.
Su H, Sansford CE, Fitt BDL, Gladders P, Lockley KD, Sutherland KG, Welham SJ, 1998b.
Estimating yield loss from light leaf spot (Pyrenopeziza brassicae) on winter oilseed
oilseed rape (Brassica napus) in the UK. Integrated Control in Oilseed Crops, IOBC
Bulletin Vol. 21 (5), 23 - 26.
Sutherland KG, Griffin-Walker V, 1994. Resistance of light leaf spot (Pyrenopeziza brassicae)
of winter oilseed rape to MBC fungicides. Proceedings Brighton Crop Protection
Conference Farnham, UK: British Crop Protection Council, 463-468.
Sutherland KG, Fitt BDL, Steed JM, Welham SJ, Gladders P, Turner JA, 1998. Development and
control of light leaf spot (Pyrenopeziza brassicae) epidemics in winter oilseed rape in the
UK. Proceedings Brighton Crop Protection Conference Farnham, UK: British Crop
Protection Council, 1053 - 1058
Sutherland K, 1999. Light leaf spot control - can we be more efficient? Proceedings HGCA
Agronomy Roadshows, 18.1-18.5.
Sylvester-Bradley R, 1985. Revision of a code for stages of development in oilseed rape
(Brassica napus L.) Aspects of Applied Biology, 10, 395 – 400.
Wale SJ, Brokenshire T, Oxley S, Sutherland K, Munro JM, 1990. Fungicidal control of light
leaf spot (Pyrenpezia brassicae) on oilseed rape in Scotland. Proceedings 1990 Crop
Protection in Northern Britain Conference, 289-294.
Urech, PA, 1994. Fungicide resistance management: needs and success factors. Fungicide
Resistance BCPC Monograph No 60, 349 – 356.

59
9. APPENDICES
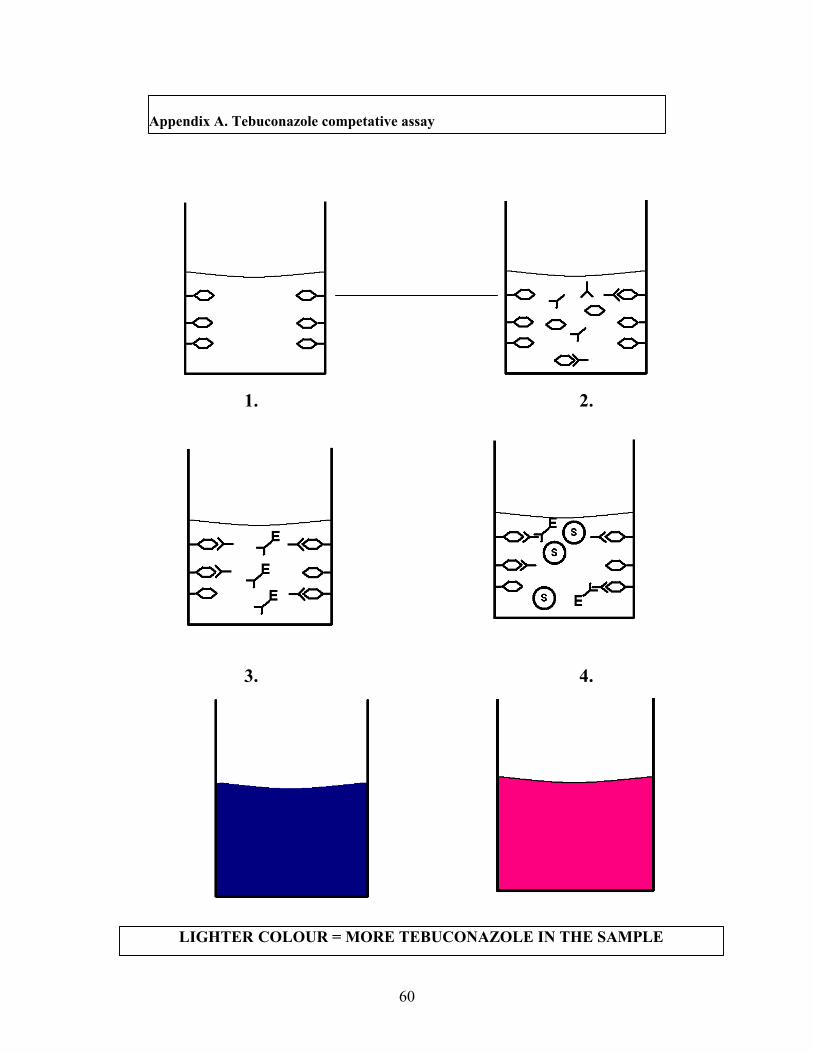
60
1. 2.
3. 4.
Appendix A. Tebuconazole competative assay
LIGHTER COLOUR = MORE TEBUCONAZOLE IN THE SAMPLE

61
Appendix A. Summary of competitive ELISA
1. 1.Coat wells with a known concentration of tebuconazole. In the kit the plate is supplied pre-
coated.
2. Add sample and specific antibody. If the sample contains tebuconazole it will compete with
the tebuconazole coated onto the wells to bind the antibody. Some antibody molecules will
bind to the tebuconazole on the well and some to the tebuconazole in the sample. Antibody
bound to tebuconazole in the sample is removed by washing.
3. A conjugate, which in this case is an antibody labelled with an enzyme, is added to the wells.
The conjugate is able to recognise and bind to the specific antibody that is bound to the
tebuconazole in the well.
4. Unbound conjugate is removed by washing. A substrate for the enzyme is added. The
product of the enzyme-substrate reaction is coloured and can be visualised or the absorbance
measured with a spectrophotometer.
The 'free' tebuconazole and the bound tebuconazole compete for the antibody. If there is a high
level of tebuconazole in the sample most of the antibody will bind to the 'free' tebuconazole and
be removed by washing. Thus, when the conjugate is added there is no, or very little, antibody
bound to the tebuconazole in the wells. Therefore there is nothing for the conjugate to bind to
and the colour production is very low.
High level of tebuconazole in the sample = low colour.
Low level of tebuconazole in the sample = high colour

62
Sample preparation and competition ELISA protocol
A. Preparation of extract
1. Place 1g of leaf material in a heavy duty polythene bag. Add 4ml of 80% methanol and
homogenise using a hand held homogeniser (Bioreba) for 3 - 4 minutes.
2. Heat seal the bag and incubate at 40C overnight (for at least 16 hours).
3. Add 60ml distilled H2O to the extract in the bag and shake gently to mix.
4. Filter the sample through a double layer of muslin.
5. The sample(s) is/are then ready for use in the tebuconazole assay.
B. Competition ELISA
1. Coat plates with Tebuconazole-NH-BSA conjugate 1µg/ml in coating buffer (9µl of stock in
100mls). Add 100µl per well. Incubate overnight at 40C.
2. Wash 4 times with PBST and pat dry on paper towels.
3. Block with PBSTM (5% non-fat milk powder) at 200µl/well. Incubate at 370C for 2 hours.
4. Meanwhile cross-adsorb the sera in PBST-4%BSA for 30 - 60 minutes at 370C.
5. Wash plate 4 times with PBST and pat dry on paper towels.
6. Add to plate (i) 50µl of cross-adsorbed sera diluted at 1/5000
(ii) 50µl of standard/samples in solvent.
Cover plate with plastic film and place on shaker at room temperature for 2 hours.
7. Wash 4 times with PBST and pat dry on paper towels.
8. Add 100µl/well of goat anti-Rabbit IgG-HRP conjugate in PBST and incubate at 370C for 1
hour.
9. Wash plate 4 times with PBST and pat dry on paper towels.

63
10. Add 100µl/well of K-blue substrate (or alternative TMB substrate) to the wells. Incubate in
the dark at room temperature for 15 minutes.
11. Stop the reaction by adding 50µl/well H2SO4 (10%). Gently shake the plate to mix the
substrate and stop solution and read at 450nm.Appedices
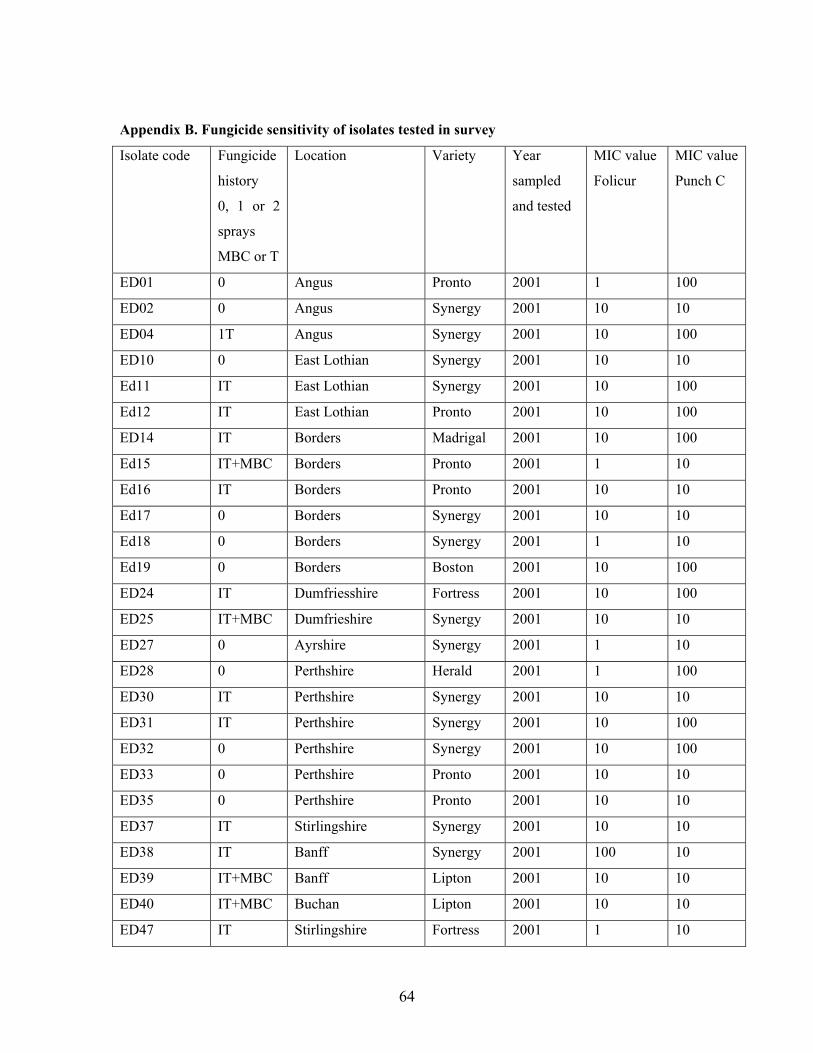
64
Appendix B. Fungicide sensitivity of isolates tested in survey
Isolate code Fungicide
history
0, 1 or 2
sprays
MBC or T
Location Variety Year
sampled
and tested
MIC value
Folicur
MIC value
Punch C
ED01 0 Angus Pronto 2001 1 100
ED02 0 Angus Synergy 2001 10 10
ED04 1T Angus Synergy 2001 10 100
ED10 0 East Lothian Synergy 2001 10 10
Ed11 IT East Lothian Synergy 2001 10 100
Ed12 IT East Lothian Pronto 2001 10 100
ED14 IT Borders Madrigal 2001 10 100
Ed15 IT+MBC Borders Pronto 2001 1 10
Ed16 IT Borders Pronto 2001 10 10
Ed17 0 Borders Synergy 2001 10 10
Ed18 0 Borders Synergy 2001 1 10
Ed19 0 Borders Boston 2001 10 100
ED24 IT Dumfriesshire Fortress 2001 10 100
ED25 IT+MBC Dumfrieshire Synergy 2001 10 10
ED27 0 Ayrshire Synergy 2001 1 10
ED28 0 Perthshire Herald 2001 1 100
ED30 IT Perthshire Synergy 2001 10 10
ED31 IT Perthshire Synergy 2001 10 100
ED32 0 Perthshire Synergy 2001 10 100
ED33 0 Perthshire Pronto 2001 10 10
ED35 0 Perthshire Pronto 2001 10 10
ED37 IT Stirlingshire Synergy 2001 10 10
ED38 IT Banff Synergy 2001 100 10
ED39 IT+MBC Banff Lipton 2001 10 10
ED40 IT+MBC Buchan Lipton 2001 10 10
ED47 IT Stirlingshire Fortress 2001 1 10
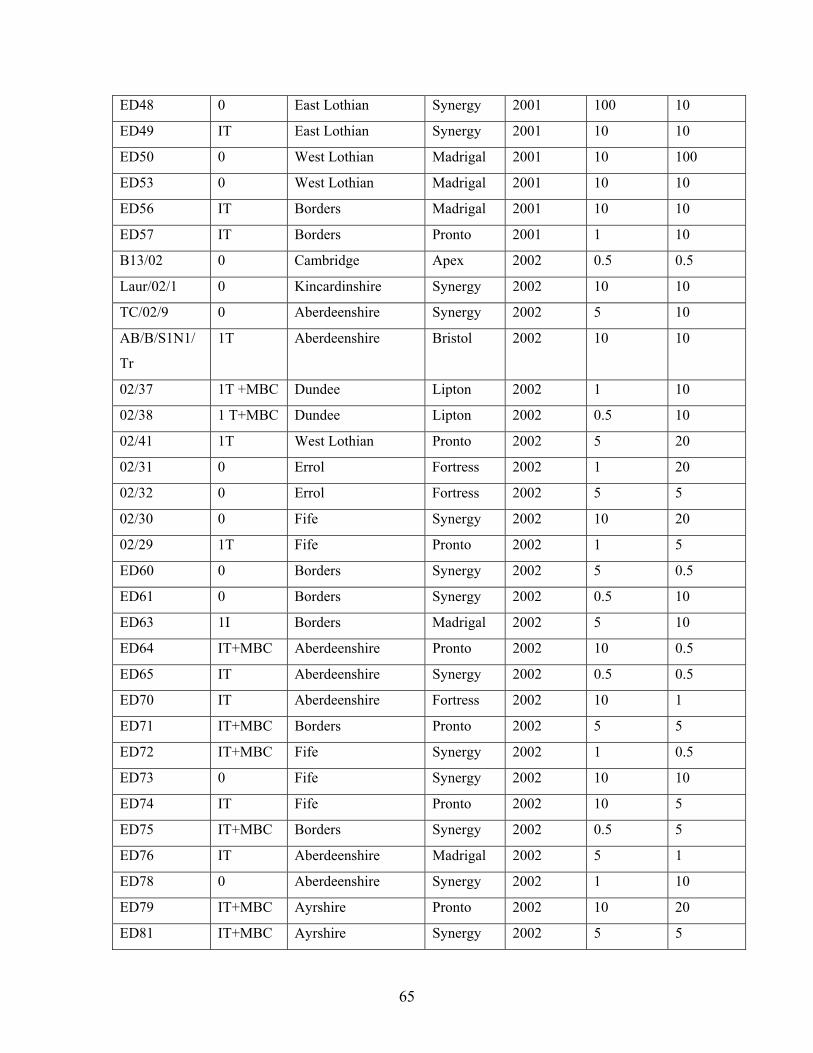
65
ED48 0 East Lothian Synergy 2001 100 10
ED49 IT East Lothian Synergy 2001 10 10
ED50 0 West Lothian Madrigal 2001 10 100
ED53 0 West Lothian Madrigal 2001 10 10
ED56 IT Borders Madrigal 2001 10 10
ED57 IT Borders Pronto 2001 1 10
B13/02 0 Cambridge Apex 2002 0.5 0.5
Laur/02/1 0 Kincardinshire Synergy 2002 10 10
TC/02/9 0 Aberdeenshire Synergy 2002 5 10
AB/B/S1N1/
Tr
1T Aberdeenshire Bristol 2002 10 10
02/37 1T +MBC Dundee Lipton 2002 1 10
02/38 1 T+MBC Dundee Lipton 2002 0.5 10
02/41 1T West Lothian Pronto 2002 5 20
02/31 0 Errol Fortress 2002 1 20
02/32 0 Errol Fortress 2002 5 5
02/30 0 Fife Synergy 2002 10 20
02/29 1T Fife Pronto 2002 1 5
ED60 0 Borders Synergy 2002 5 0.5
ED61 0 Borders Synergy 2002 0.5 10
ED63 1I Borders Madrigal 2002 5 10
ED64 IT+MBC Aberdeenshire Pronto 2002 10 0.5
ED65 IT Aberdeenshire Synergy 2002 0.5 0.5
ED70 IT Aberdeenshire Fortress 2002 10 1
ED71 IT+MBC Borders Pronto 2002 5 5
ED72 IT+MBC Fife Synergy 2002 1 0.5
ED73 0 Fife Synergy 2002 10 10
ED74 IT Fife Pronto 2002 10 5
ED75 IT+MBC Borders Synergy 2002 0.5 5
ED76 IT Aberdeenshire Madrigal 2002 5 1
ED78 0 Aberdeenshire Synergy 2002 1 10
ED79 IT+MBC Ayrshire Pronto 2002 10 20
ED81 IT+MBC Ayrshire Synergy 2002 5 5
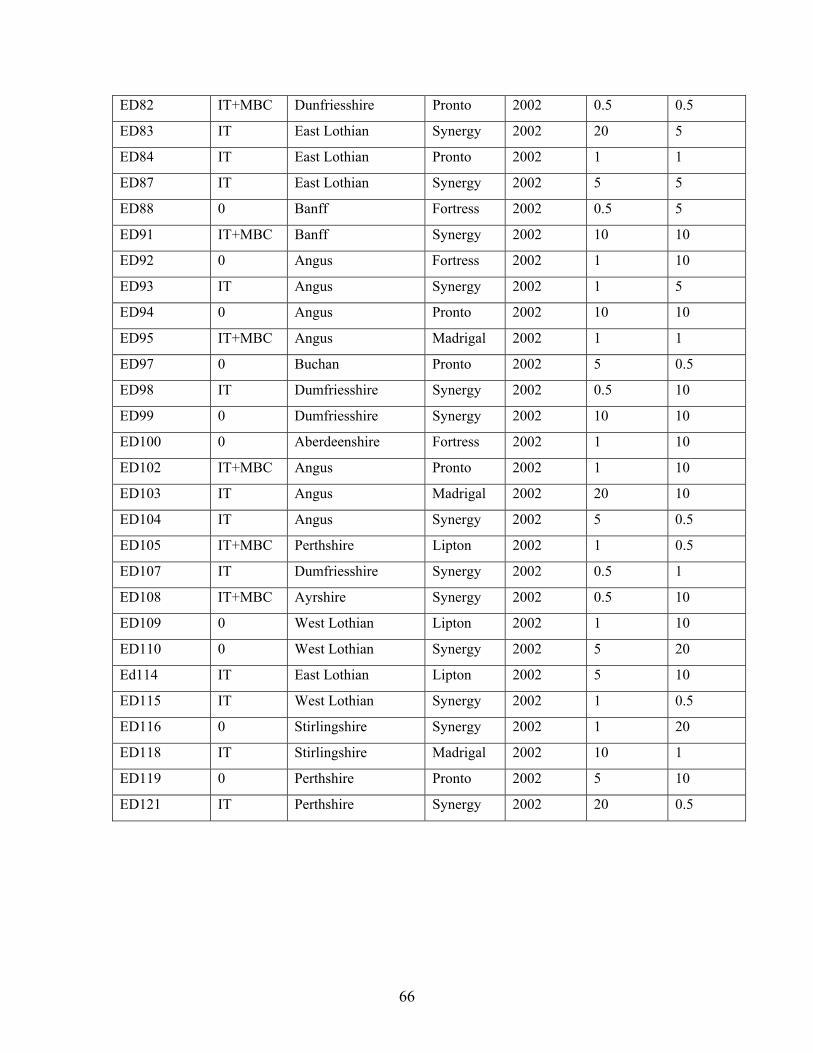
66
ED82 IT+MBC Dunfriesshire Pronto 2002 0.5 0.5
ED83 IT East Lothian Synergy 2002 20 5
ED84 IT East Lothian Pronto 2002 1 1
ED87 IT East Lothian Synergy 2002 5 5
ED88 0 Banff Fortress 2002 0.5 5
ED91 IT+MBC Banff Synergy 2002 10 10
ED92 0 Angus Fortress 2002 1 10
ED93 IT Angus Synergy 2002 1 5
ED94 0 Angus Pronto 2002 10 10
ED95 IT+MBC Angus Madrigal 2002 1 1
ED97 0 Buchan Pronto 2002 5 0.5
ED98 IT Dumfriesshire Synergy 2002 0.5 10
ED99 0 Dumfriesshire Synergy 2002 10 10
ED100 0 Aberdeenshire Fortress 2002 1 10
ED102 IT+MBC Angus Pronto 2002 1 10
ED103 IT Angus Madrigal 2002 20 10
ED104 IT Angus Synergy 2002 5 0.5
ED105 IT+MBC Perthshire Lipton 2002 1 0.5
ED107 IT Dumfriesshire Synergy 2002 0.5 1
ED108 IT+MBC Ayrshire Synergy 2002 0.5 10
ED109 0 West Lothian Lipton 2002 1 10
ED110 0 West Lothian Synergy 2002 5 20
Ed114 IT East Lothian Lipton 2002 5 10
ED115 IT West Lothian Synergy 2002 1 0.5
ED116 0 Stirlingshire Synergy 2002 1 20
ED118 IT Stirlingshire Madrigal 2002 10 1
ED119 0 Perthshire Pronto 2002 5 10
ED121 IT Perthshire Synergy 2002 20 0.5
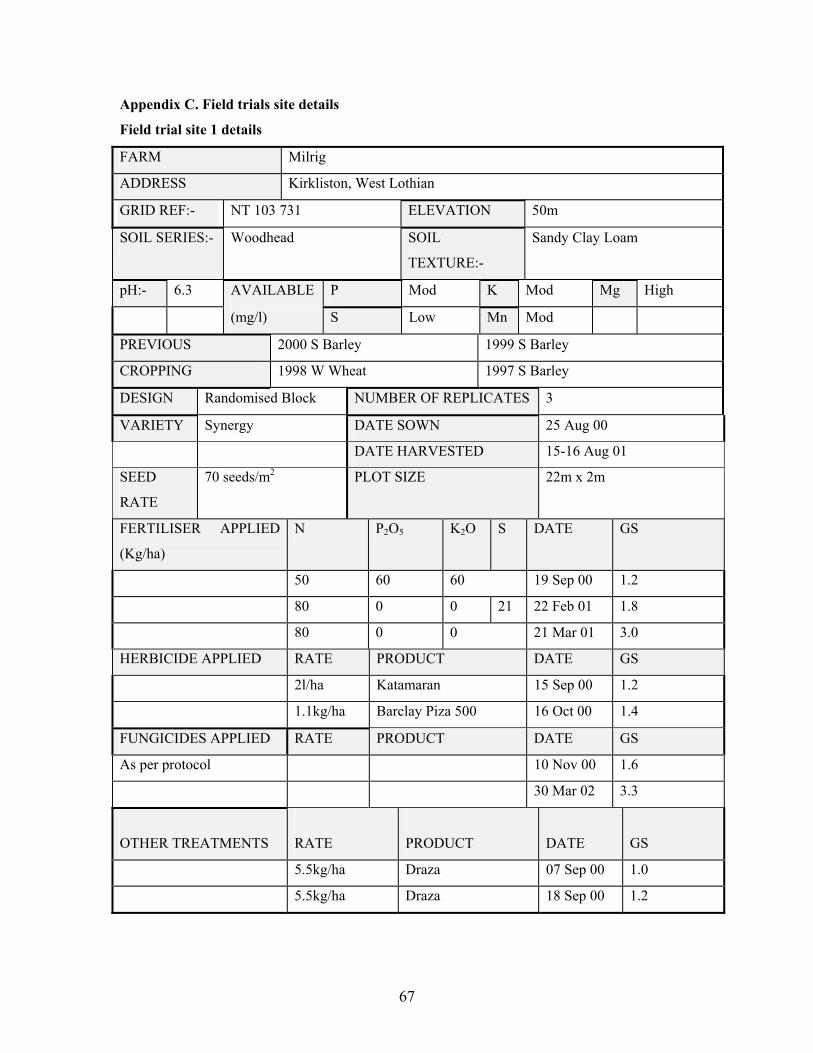
67
Appendix C. Field trials site details
Field trial site 1 details
FARM Milrig
ADDRESS Kirkliston, West Lothian
GRID REF:- NT 103 731 ELEVATION 50m
SOIL SERIES:- Woodhead SOIL
TEXTURE:-
Sandy Clay Loam
pH:- 6.3 AVAILABLE P Mod K Mod Mg High
(mg/l) S Low Mn Mod
PREVIOUS 2000 S Barley 1999 S Barley
CROPPING 1998 W Wheat 1997 S Barley
DESIGN Randomised Block NUMBER OF REPLICATES 3
VARIETY Synergy DATE SOWN 25 Aug 00
DATE HARVESTED 15-16 Aug 01
SEED
RATE
70 seeds/m2 PLOT SIZE 22m x 2m
FERTILISER APPLIED
(Kg/ha)
N P2O5 K2O S DATE GS
50 60 60 19 Sep 00 1.2
80 0 0 21 22 Feb 01 1.8
80 0 0 21 Mar 01 3.0
HERBICIDE APPLIED RATE PRODUCT DATE GS
2l/ha Katamaran 15 Sep 00 1.2
1.1kg/ha Barclay Piza 500 16 Oct 00 1.4
FUNGICIDES APPLIED RATE PRODUCT DATE GS
As per protocol 10 Nov 00 1.6
30 Mar 02 3.3
OTHER TREATMENTS
RATE
PRODUCT
DATE
GS
5.5kg/ha Draza 07 Sep 00 1.0
5.5kg/ha Draza 18 Sep 00 1.2
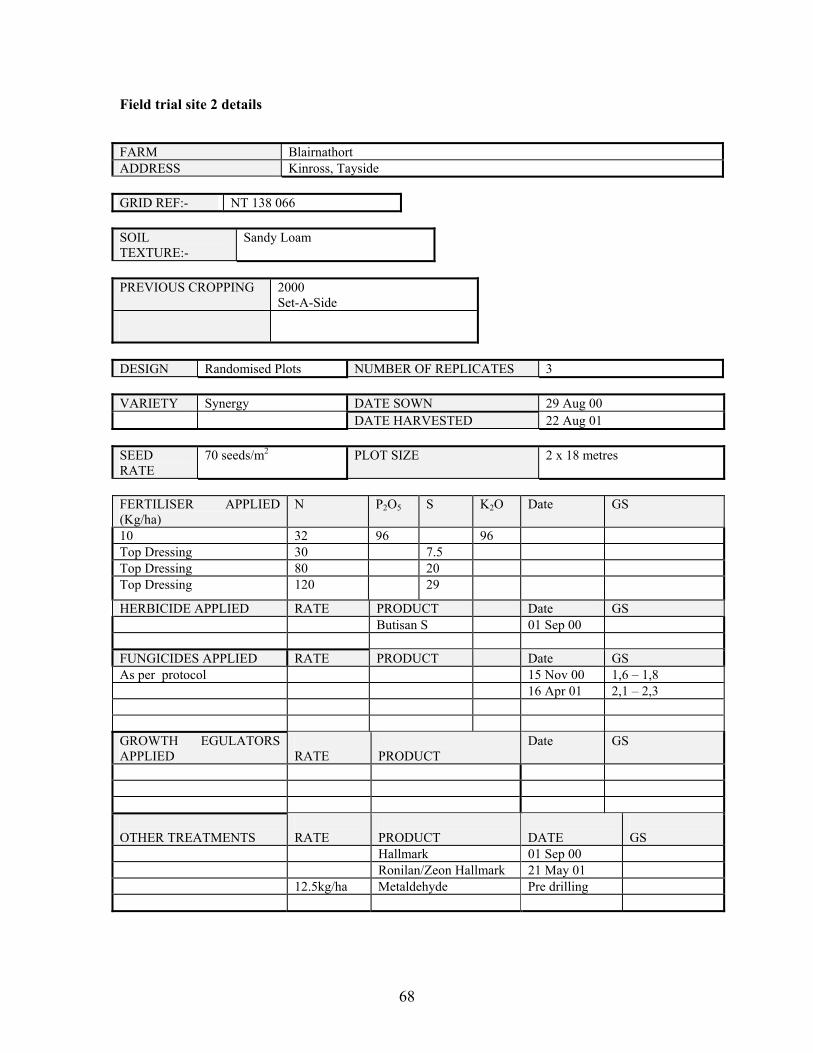
68
Field trial site 2 details
FARM Blairnathort ADDRESS Kinross, Tayside GRID REF:- NT 138 066 SOIL TEXTURE:-
Sandy Loam
PREVIOUS CROPPING 2000
Set-A-Side
DESIGN Randomised Plots NUMBER OF REPLICATES 3 VARIETY Synergy DATE SOWN 29 Aug 00 DATE HARVESTED 22 Aug 01 SEED RATE
70 seeds/m2 PLOT SIZE 2 x 18 metres
FERTILISER APPLIED (Kg/ha)
N P2O5 S K2O Date GS
10 32 96 96 Top Dressing 30 7.5 Top Dressing 80 20 Top Dressing 120 29
HERBICIDE APPLIED RATE PRODUCT Date GS Butisan S 01 Sep 00 FUNGICIDES APPLIED RATE PRODUCT Date GS As per protocol 15 Nov 00 1,6 – 1,8 16 Apr 01 2,1 – 2,3 GROWTH EGULATORS APPLIED
RATE
PRODUCT
Date GS
OTHER TREATMENTS
RATE
PRODUCT
DATE
GS
Hallmark 01 Sep 00 Ronilan/Zeon Hallmark 21 May 01 12.5kg/ha Metaldehyde Pre drilling
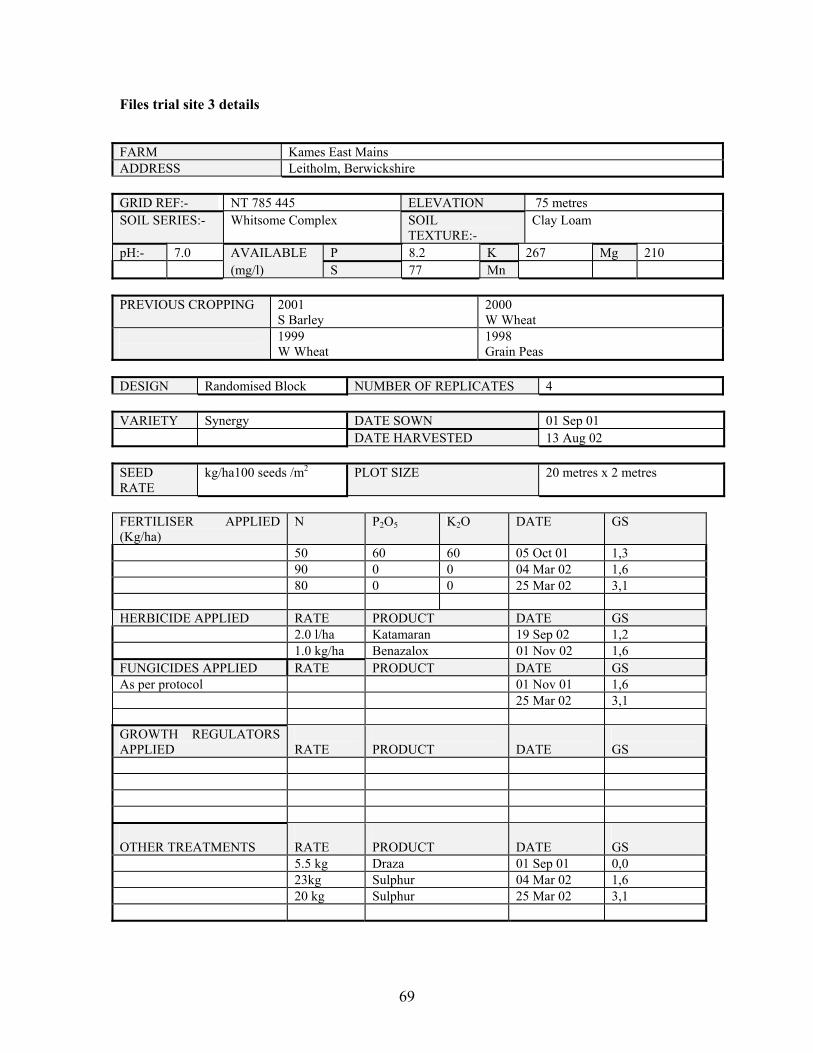
69
Files trial site 3 details
FARM Kames East Mains ADDRESS Leitholm, Berwickshire GRID REF:- NT 785 445 ELEVATION 75 metres SOIL SERIES:- Whitsome Complex SOIL
TEXTURE:- Clay Loam
pH:- 7.0 AVAILABLE P 8.2 K 267 Mg 210 (mg/l) S 77 Mn PREVIOUS CROPPING 2001
S Barley 2000 W Wheat
1999 W Wheat
1998 Grain Peas
DESIGN Randomised Block NUMBER OF REPLICATES 4 VARIETY Synergy DATE SOWN 01 Sep 01 DATE HARVESTED 13 Aug 02 SEED RATE
kg/ha100 seeds /m2 PLOT SIZE 20 metres x 2 metres
FERTILISER APPLIED (Kg/ha)
N P2O5 K2O DATE GS
50 60 60 05 Oct 01 1,3 90 0 0 04 Mar 02 1,6 80 0 0 25 Mar 02 3,1 HERBICIDE APPLIED RATE PRODUCT DATE GS 2.0 l/ha Katamaran 19 Sep 02 1,2 1.0 kg/ha Benazalox 01 Nov 02 1,6 FUNGICIDES APPLIED RATE PRODUCT DATE GS As per protocol 01 Nov 01 1,6 25 Mar 02 3,1 GROWTH REGULATORS APPLIED
RATE
PRODUCT
DATE
GS
OTHER TREATMENTS
RATE
PRODUCT
DATE
GS
5.5 kg Draza 01 Sep 01 0,0 23kg Sulphur 04 Mar 02 1,6 20 kg Sulphur 25 Mar 02 3,1
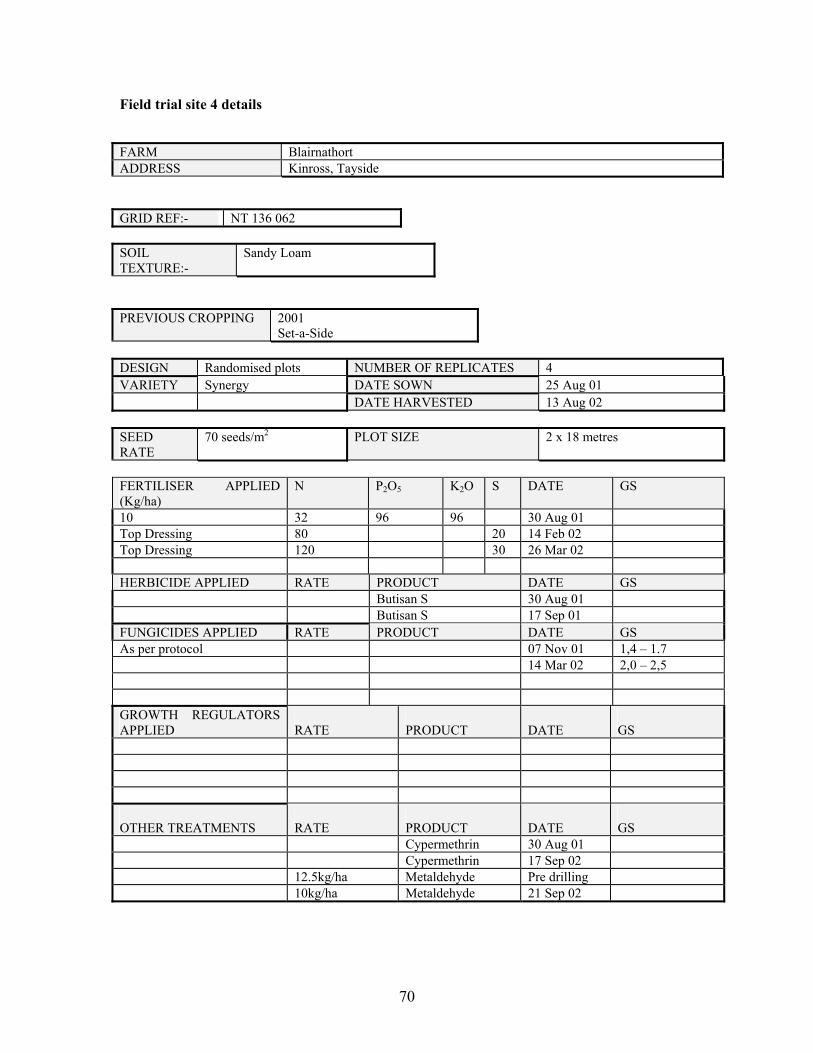
70
Field trial site 4 details
FARM Blairnathort ADDRESS Kinross, Tayside GRID REF:- NT 136 062 SOIL TEXTURE:-
Sandy Loam
PREVIOUS CROPPING 2001
Set-a-Side DESIGN Randomised plots NUMBER OF REPLICATES 4 VARIETY Synergy DATE SOWN 25 Aug 01 DATE HARVESTED 13 Aug 02 SEED RATE
70 seeds/m2 PLOT SIZE 2 x 18 metres
FERTILISER APPLIED (Kg/ha)
N P2O5 K2O S DATE GS
10 32 96 96 30 Aug 01 Top Dressing 80 20 14 Feb 02 Top Dressing 120 30 26 Mar 02 HERBICIDE APPLIED RATE PRODUCT DATE GS Butisan S 30 Aug 01 Butisan S 17 Sep 01 FUNGICIDES APPLIED RATE PRODUCT DATE GS As per protocol 07 Nov 01 1,4 – 1.7 14 Mar 02 2,0 – 2,5 GROWTH REGULATORS APPLIED
RATE
PRODUCT
DATE
GS
OTHER TREATMENTS
RATE
PRODUCT
DATE
GS
Cypermethrin 30 Aug 01 Cypermethrin 17 Sep 02 12.5kg/ha Metaldehyde Pre drilling 10kg/ha Metaldehyde 21 Sep 02


![[BIRU] the Maze Runner (the Scorch Trials) BluRay](https://img.pdfslide.us/doc/110x75/5695cff91a28ab9b02905cc1/biru-the-maze-runner-the-scorch-trials-bluray.jpg)