Embed Size (px)
Citation preview

September 2013
Project Report No. 520
Optimising the use of grain stirrers to enhance on-floor drying
by
D M Bruce1, T J Wontner-Smith2, D I Bartlett3 and S K Cardwell2
1David Bruce Consulting Ltd, 54 High Road, Shillington, Hitchin, Herts SG5 3LL
2Food and Environment Research Agency, Sand Hutton, York YO41 1LZ 3BioMeasurements Ltd, 14 Taylors Close, Meppershall, Bedfordshire SG17 5NH
This is the final report of a 36 month project (RD-2008-3615) which started in April 2010. The work was funded by a contract for £102,811 from HGCA. While the Agriculture and Horticulture Development Board, operating through its HGCA division, seeks to ensure that the information
contained within this document is accurate at the time of printing, no warranty is given in respect thereof and, to the maximum extent
permitted by law, the Agriculture and Horticulture Development Board accepts no liability for loss, damage or injury howsoever caused
(including that caused by negligence) or suffered directly or indirectly in relation to information and opinions contained in or omitted from
this document.
Reference herein to trade names and proprietary products without stating that they are protected does not imply that they may be
regarded as unprotected and thus free for general use. No endorsement of named products is intended, nor is any criticism implied of
other alternative, but unnamed, products.
HGCA is the cereals and oilseeds division of the Agriculture and Horticulture Development Board.

CONTENTS
1. ABSTRACT ......................................................................................................................... 2
2. SUMMARY ........................................................................................................................... 3
2.1. Introduction .............................................................................................................. 3
2.2. Development of the new model ............................................................................... 3
2.3. Validation of the model ............................................................................................ 5
2.4. Simulations to explore the performance, effectiveness, energy saving and cost saving potential of stirring in normal on-floor drying ............................................... 6
2.5. Development of user guide-lines to show how to achieve the full range of benefits from stirring ........................................................................................................... 7
2.6. Conclusions .............................................................................................................. 8
3. TECHNICAL DETAIL ......................................................................................................... 10
3.1. Introduction ............................................................................................................ 10
3.2. Development of integrated model of drying and stirring ..................................... 11
3.3. Validation ................................................................................................................ 17
3.3.1. Stage 1 – behaviour of stirred bed drier ............................................................. 18
3.3.2. Stage 2 – experiments in bin ............................................................................. 21
3.3.3. Stage 3 - validation against published dataset for drying with elevated air
temperature ....................................................................................................... 48
3.3.4. Stage 4 – Experiment on a commercial site ....................................................... 49
3.4. Simulation runs and results .................................................................................. 60
3.4.1. Basis of this study .............................................................................................. 60
3.4.2. Simulations carried out ...................................................................................... 63
3.4.3. Results and discussion ...................................................................................... 65
3.5. Development of user guidelines ............................................................................ 82
3.5.1. User guidelines .................................................................................................. 83
3.5.2. Assuming a stirring system is available, how should it best be used? ................ 87
3.6. Conclusions ............................................................................................................ 89
3.7. Acknowledgements ................................................................................................ 91
3.8. References .............................................................................................................. 91

1
APPENDIX A. PARAMETERS FOR DRIER, CROP, WEATHER AND ENERGY FOR SIMULATION RUNS .................................................................................................................... 93
APPENDIX B. TABLES 10 TO 30 ................................................................................................ 94

2
1. ABSTRACT
Grain stirring by vertical augers is a method of mixing grain in bulk stores. It is used to remove the
gradients in moisture content (m.c.) that develop when drying a deep bed, and before or after
drying. The stirring process adds an extra dimension to bulk drying because it can be used in
various ways, e.g. speeding up the drying of the upper layers to reduce risk from fungi, reducing
over-drying of the lower layers, and allowing higher temperature air to be used that can increase
drying rate. The aim of this project was to examine how stirring influences drying, and how the
potential advantages can be best exploited, with a particular focus on potential to save costs for
users. A simulation model of bulk drying was used for the study, plus a new element to simulate
the action of stirring on the grain bed. This model was validated successfully against a 25t wheat
drying experiment at The Food and Environment Research Agency (Fera) in 2010, drying of two
such bins in 2012, one stirred and one static, a published drying test for an 86t bin using higher air
temperature, and data from a farm bulk store in 2012, one block of which was stirred, one static.
The simulation model generated performance data for drying wheat from m.c. values of 24 – 16%
to a target of 14.5%, at bed depths of 4, 3 and 2m using 20 years of weather data from Lincs. Risk
of fungal toxin was calculated, and only treatments giving 19 or 20 years without risk were counted
as successful. A range of drying approaches was tested.
When using the drier with r.h. in the plenum regulated to 62%, stirring the bed continuously
reduced the risk of fungal toxin Ochratoxin A (OA) substantially, compared with a static bed, and
hence allowed grain at 2% higher m.c. or 1m higher depth to be dried. But drying with stirring took
substantially longer and the fuel and electricity costs were higher. So, when using near ambient air
temperature, stirring was only helpful if otherwise there was a risk of OA as judged by the HGCA
Safe Storage Time Calculator.
Stirring allowed use of higher plenum air temperatures, within constraints of component design and
safety. Use of higher air temperature when stirring, e.g. 30°C, reduced drying time substantially
compared with using near ambient air temperature, Electricity cost was reduced because the fan
and stirrers were used for a shorter time but fuel use was generally increased.
Guidelines set out which drying problems would, and would not, be addressed by stirring, and how
to make best use of a stirring system.

3
2. SUMMARY
2.1. Introduction
Grain needs to be dried following harvest to avoid problems associated with fungi and mites during
subsequent storage. In most seasons, on-floor drying, using ambient or heated air can be effective
and economical but still requires considerable skill. In poor seasons, an on-floor system will incur
considerable costs and may not achieve good enough results, however skilful the operator.
In a conventional on floor drier, the grain is static and drying proceeds from bottom to top. Grain at
the top of the bed remains close to the initial moisture content (m.c.) until drying is nearly complete.
In contrast, when vertical augers mix the grain bed during drying, layers of wetter grain are mixed
into the mass, drying them more quickly and thus reducing the risk of spoilage by fungi. Other
benefits of stirring in terms of quality and cost are available, in principle, whatever the season. For
example, overdrying can be avoided so it may be possible to exploit different, and potentially more
energy-efficient, drying strategies. If a greater depth of grain can be used, this would allow more
grain to be dried with an existing drying floor.
This study examined stirring and how to integrate it with on-floor drying practice. The aim was to
calculate drying performance with and without the use of stirring (likely success, drying time and
cost) so as to help growers decide whether to invest in a stirring system and to show, with user
guidelines, how to get the maximum benefits from a stirring system. This was tackled by
developing and exploiting an integrated simulation model of stirring and drying, used with historical
weather records, to run a wide range of drying scenarios.
2.2. Development of the new model
“Storedry” is a simulation of bulk drying which has been used for several HGCA projects. The new
model of stirring was implemented as modifications to Storedry, and represented the essential
features of the action of vertical augers on the grain bed.
The first stage of the new stirring model considers the action of a single auger, embedded in a
grain mass but not moving laterally, which has been running for long enough to produce a stable
flow pattern of grain. A circulation zone is formed in the grain by the action of the stirrer. Grain is
lifted by the auger to form a cone at the bed surface. The moving mass of grain below the surface
also formed a cone that extends from the bottom of the auger to meet the cone on the surface
base to base (Figure 1). The assumption was made that the circulation of grain due to the action of
the auger was enough to completely mix the grain in the circulating zone. This is justified by the
slow lateral speed of augers that are lifting grain at quite high flow rates. The conical shape of the

4
circulating zone implied that differing proportions of the drying model’s grain layers were entrained
(i.e. drawn into the circulating zone), small amounts at the point and larger amounts at the widest
part of the cones. The m.c. and temperature in the circulating zone were calculated from the m.c.
and temperature of the grain in each layer and the mass of grain entrained from each layer. Lateral
distribution from the stationary auger was modelled by combining at each layer the appropriate
proportion of grain in the mixed volume with that not entrained by the auger.
Figure 1. Circulation zone formed by auger (green), with arrows indicating grain flow direction and speed.
Movement of the augers around the grain store was modelled as follows. Storedry was modified to
simulate drying in many “mini” grain beds in parallel, only one of which was stirred each hour. The
model allowed for 20 such beds, enough to allow a realistic pattern of auger movement around the
store to be defined. As the auger moved from one bed to the next, mixing of grain between the
mini-bed just stirred and the next in the stirring sequence was modelled by a similar procedure as
already described.
There is some evidence that stirring reduces air resistance, but only marginally unless the grain
was compacted or deteriorated. Such a reduction would allow more airflow if the fan were capable
of providing it. The stirring model was developed to allow a reduction in air resistance to occur.
In the new model, mixing and averaging was applied to physical parameters, i.e. moisture content
and temperature, but was not appropriate to biological quality attributes, i.e. the progress towards
the risk of Ochratoxin A (OA) and the loss of grain viability. So the new model takes a conservative
approach by finding the layer in the bed before stirring in which biological attributes are worst and
ascribing them to all the other layers in the bed after stirring.

5
The model allowed simulation of running the fan and heater for a time before starting stirring, and
of stirring to even out the bed once drying was finished. An option to start with a non-uniform bed
of grain was added, so that drying of grain in layers of different initial m.c. could be simulated.
Approximately 750 lines of code were needed to implement the changes described above.
2.3. Validation of the model
Validation was done in four stages. First, the model was run at ‘standard’ near-ambient drying
conditions and the results with stirring were compared qualitatively with results when stirring was
not used. This allowed the behaviour of the stirred bed drier to be checked to ensure it was
reasonable. Second, the measured conditions in experiments carried out on 25t bins of wheat at
the Food and Environment Research Agency (Fera) in 2010 and 2012 were used to run the model
to predict conditions of temperature and moisture content in the bed during drying. These
predictions were then compared with measurements. Third, an experiment reported in the literature
in an 86t bin of wheat using a higher air temperature, 38oC, was simulated and results compared
with those reported. The fourth stage was to measure performance on a commercial site of stirred
versus static drying and validate the model against these data.
The behaviour of the simulation model when run at ‘standard’ drying conditions was in line with
expectations from principles already well understood, in that the entrainment of grain into the
mixed zone reduced with increasing depth and the exhaust air relative humidity (r.h.) fell as stirred
drying proceeded and so gave a reduced drying rate. Agreement with the within-bed data from the
25t wheat drying experiments at Fera was good in the important respects, particularly drying time,
approach to and level of final m.c., effect of each mixing event on m.c. through the bed and rapid
reduction of m.c. of surface layers to a lower value. Within the bed, the simulated drying rate of the
middle layers was too fast, despite which, agreement was good in other respects. Simulation of the
experiment reported in the literature in which an 86t bin of wheat was dried and stirred gave results
which agreed very well with the measured overall performance. Wheat on the commercial site in
2012 needed little drying so the model was tested in low moisture removal conditions but results
did not raise any doubts about its performance.
The overall conclusion from the validation work was that the model was sufficiently good over the
range of m.c. encountered in the experiments and, because it was based on well-understood
physics of drying, could be used with confidence over a wider range than found in validation
experiments.

6
2.4. Simulations to explore the performance, effectiveness, energy saving and cost saving potential of stirring in normal on-floor drying
In this study, 21 sets of simulations of various drying systems were run to produce data on their
likely performance under a wide range of conditions. By comparing performance in various ways,
the benefits and drawbacks of one system versus another, or of one choice of operating condition
versus another, was shown. First, static and stirred beds were compared under input conditions
normal for a static bed drier. Then various approaches were used to find out how best to take
advantage of the stirring system. Bed depths of 2-4m and initial m.c. values of 24-16% were used.
To enable a fair comparison, stirred drying was compared with best performance from static bed
drying. This was found to be with the fan running continuously and a powerful heater set for 62%
r.h. in the plenum. Under these conditions, stirring was very effective in reducing the progress
towards risk of OA because, at higher values of initial m.c., stirring avoided the persistence of
wetter grain at a condition that favoured fungal growth. Where a static bed approach resulted in
risk of OA, stirring the same bed allowed drying without risk of OA from an initial m.c. of about 2%
m.c. higher or for a grain bed depth 1m deeper than the limit for static bed drying. Over-drying of
the bed as a whole was reduced by stirring. However, compared with static bed drying, stirring
made the drying considerably less efficient and so increased drying time and cost of fuel and
electricity. Drying is less efficient because air within the bed can only saturate as far as the
surrounding grain moisture allows. The higher the m.c. of the grain the more saturated the
surrounding air can become. Stirring the grain lowers the m.c. at the surface because drier grain is
brought up from lower levels, and so the amount of water that is carried away per unit of air exiting
the surface is also lowered.
In approaches where the r.h. in the plenum was regulated, drying performance was a compromise.
Stirring reduced over-drying and the risk of OA but increased drying time and electricity and fuel
costs. When the initial m.c., and hence the risk of OA, was not high, a useful approach was to stir
to eliminate m.c. gradients only when the target average m.c. had been reached. This approach
gave less over-drying than static bed drying and hence faster drying, lower fuel and electricity cost.
Drying with stirring down to 18% m.c. and then stirring only once the average m.c. was reached
gave a compromise between avoidance of OA risk and drying efficiency, and was effective for
grain not over 20% initial m.c.
Using fewer augers, and hence stirring any location less often, reduced drying time and improved
energy efficiency but the risk of OA increased at higher initial m.c.

7
Lower airflow increased drying efficiency but extended drying time, whilst higher airflow did the
opposite.
Regulating plenum air temperature rather than r.h., and heating that air to 20oC or more, resulted
in quicker drying, much reduced risk of OA and little over-drying. If using this approach, a plenum
temperature of 30oC produced the best compromise between drying speed, energy use and
tendency towards over-drying. Electrical energy use was greatly reduced at elevated air
temperatures because of the shorter drying time, but fuel energy use was increased compared with
static bed drying.
Drying rates achieved when drying with a static bed or continuous stirring and a regulated plenum
r.h. were in line with the rate expected for a bulk drier of 0.5% m.c. per 24h. This rate could be
increased substantially by using stirring together with plenum air temperature raised to 30oC and
above.
2.5. Development of user guide-lines to show how to achieve the full range of benefits from stirring
The first area explored is whether a stirring system is likely to help solve various drying problems,
e.g. high costs or slow drying rate, better than alternative investments. Addition of stirring to a
standard drier may only be justifiable after the implementation of several other approaches to
keeping the risk of OA low. These approaches include using a higher airflow (more fan capacity)
and an increase in the heater power available.
Then, drying problems are considered from the viewpoint of whether a stirring system retro-fitted to
the existing drier would be likely to be of benefit. In this scenario, the main problem that would be
addressed is when grain is at risk of OA according to the HGCA Grain Safe Storage Time (s.s.t.)
Calculator. If the s.s.t. is shorter than the time needed for the drying front to reach the surface, the
surface grain would be at risk of OA. Stirring throughout drying would reduce the risk very
substantially. However, the problem of high fuel and electricity costs would not be reduced by
simply stirring an existing drier, because stirring reduced drying efficiency.
If, however, the drier is designed to use stirring with higher plenum air temperature, drying rate can
be increased using this approach while OA risk and electricity cost can be reduced. The problem of
high fuel cost will not be solved because even at higher plenum temperatures, stirring did not
reduce fuel use.
8
If a stirring system is available, stirring the grain bed before drying can help the drying to be more
uniform across the store. Thereafter, whether stirring will be helpful depends on the grower’s
priorities for drying. If operation at elevated plenum temperature is an option and if short drying
time, low electricity cost or both are priorities, then the drier can be run with air temperature raised
to at least 30oC. This option will, however, increase fuel cost compared with static bed drying. If
initial m.c. is above 18%, sampling should be done to check OA risk using the s.s.t. calculator and
if there is a risk, stirring during drying will reduce it. If operation at higher temperatures is not
possible, or if fuel costs are priority, then plenum air r.h. regulation to around 62% without stirring
will give rapid drying. Fuel efficiency will be better than using higher temperature with stirring. Once
the average m.c. of the grain bed has reached the target of 14.5% (for example), drying can be
stopped and stirring used if it is necessary to even out gradients in the bed.
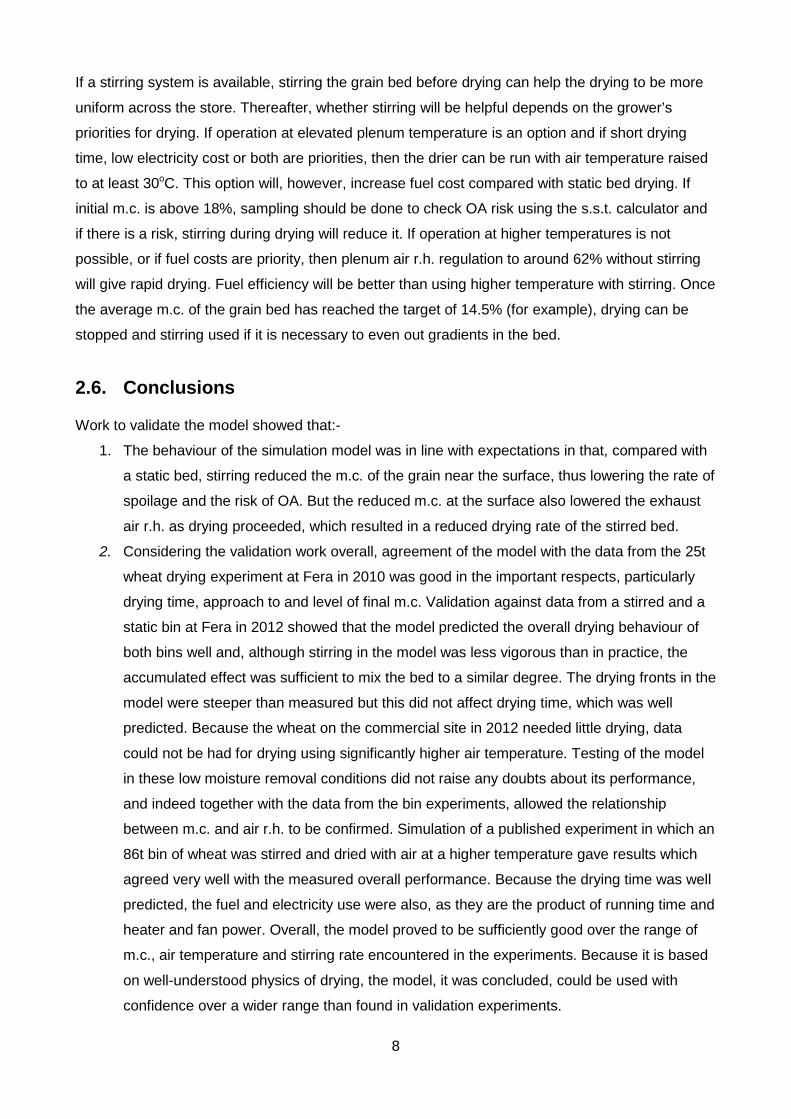
2.6. Conclusions
Work to validate the model showed that:-
1. The behaviour of the simulation model was in line with expectations in that, compared with
a static bed, stirring reduced the m.c. of the grain near the surface, thus lowering the rate of
spoilage and the risk of OA. But the reduced m.c. at the surface also lowered the exhaust
air r.h. as drying proceeded, which resulted in a reduced drying rate of the stirred bed.
2. Considering the validation work overall, agreement of the model with the data from the 25t
wheat drying experiment at Fera in 2010 was good in the important respects, particularly
drying time, approach to and level of final m.c. Validation against data from a stirred and a
static bin at Fera in 2012 showed that the model predicted the overall drying behaviour of
both bins well and, although stirring in the model was less vigorous than in practice, the
accumulated effect was sufficient to mix the bed to a similar degree. The drying fronts in the
model were steeper than measured but this did not affect drying time, which was well
predicted. Because the wheat on the commercial site in 2012 needed little drying, data
could not be had for drying using significantly higher air temperature. Testing of the model
in these low moisture removal conditions did not raise any doubts about its performance,
and indeed together with the data from the bin experiments, allowed the relationship
between m.c. and air r.h. to be confirmed. Simulation of a published experiment in which an
86t bin of wheat was stirred and dried with air at a higher temperature gave results which
agreed very well with the measured overall performance. Because the drying time was well
predicted, the fuel and electricity use were also, as they are the product of running time and
heater and fan power. Overall, the model proved to be sufficiently good over the range of
m.c., air temperature and stirring rate encountered in the experiments. Because it is based
on well-understood physics of drying, the model, it was concluded, could be used with
confidence over a wider range than found in validation experiments.
9
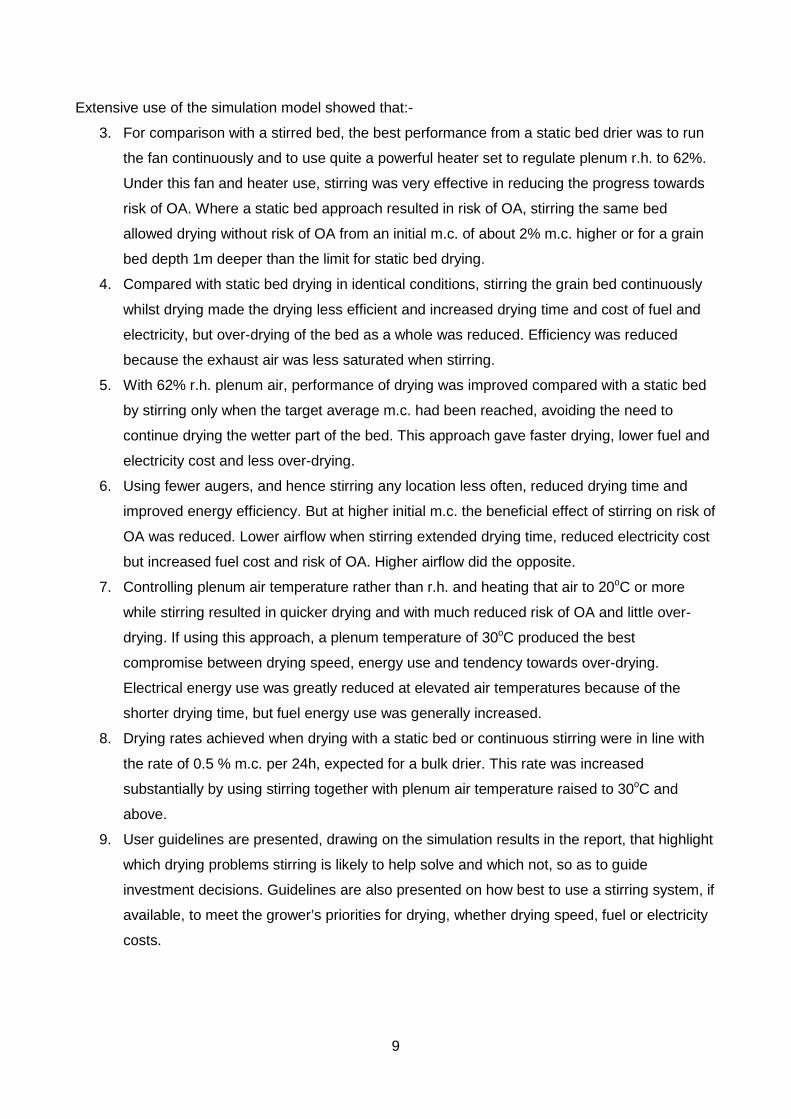
Extensive use of the simulation model showed that:-
3. For comparison with a stirred bed, the best performance from a static bed drier was to run
the fan continuously and to use quite a powerful heater set to regulate plenum r.h. to 62%.
Under this fan and heater use, stirring was very effective in reducing the progress towards
risk of OA. Where a static bed approach resulted in risk of OA, stirring the same bed
allowed drying without risk of OA from an initial m.c. of about 2% m.c. higher or for a grain
bed depth 1m deeper than the limit for static bed drying.
4. Compared with static bed drying in identical conditions, stirring the grain bed continuously
whilst drying made the drying less efficient and increased drying time and cost of fuel and
electricity, but over-drying of the bed as a whole was reduced. Efficiency was reduced
because the exhaust air was less saturated when stirring.
5. With 62% r.h. plenum air, performance of drying was improved compared with a static bed
by stirring only when the target average m.c. had been reached, avoiding the need to
continue drying the wetter part of the bed. This approach gave faster drying, lower fuel and
electricity cost and less over-drying.
6. Using fewer augers, and hence stirring any location less often, reduced drying time and
improved energy efficiency. But at higher initial m.c. the beneficial effect of stirring on risk of
OA was reduced. Lower airflow when stirring extended drying time, reduced electricity cost
but increased fuel cost and risk of OA. Higher airflow did the opposite.
7. Controlling plenum air temperature rather than r.h. and heating that air to 20oC or more
while stirring resulted in quicker drying and with much reduced risk of OA and little over-
drying. If using this approach, a plenum temperature of 30oC produced the best
compromise between drying speed, energy use and tendency towards over-drying.
Electrical energy use was greatly reduced at elevated air temperatures because of the
shorter drying time, but fuel energy use was generally increased.
8. Drying rates achieved when drying with a static bed or continuous stirring were in line with
the rate of 0.5 % m.c. per 24h, expected for a bulk drier. This rate was increased
substantially by using stirring together with plenum air temperature raised to 30oC and
above.
9. User guidelines are presented, drawing on the simulation results in the report, that highlight
which drying problems stirring is likely to help solve and which not, so as to guide
investment decisions. Guidelines are also presented on how best to use a stirring system, if
available, to meet the grower’s priorities for drying, whether drying speed, fuel or electricity
costs.

10
3. TECHNICAL DETAIL
3.1. Introduction
Grain needs to be dried following harvest to avoid problems associated with fungi and mites. In
most seasons, on-floor drying, using ambient or heated air can be effective and economical but still
requires considerable skill. In poor seasons, an on-floor system will incur considerable costs and
may not achieve good enough results, however skilful the operator.
In a conventional bulk drier, the grain is static and drying proceeds from bottom to top of the bed in
response to airflow. However good the drying conditions, grain at the top remains close to the
initial moisture content (m.c.) until drying is nearly complete. In normal practice for this “static bed”
drier, air relative humidity (r.h.) in the plenum is normally regulated to bring the whole bed to a m.c.
suitable for storage.
In drying with stirring, by contrast, the grain bed is mixed during drying using vertical augers.
Layers of wetter and of drier grain from upper and lower parts of the bed are gradually mixed into
the mass and approach a common m.c. By this means, the maximum m.c. of grain in the bed is
reduced more quickly than in a static bed, thus reducing the risk of spoilage by fungi. In a difficult
drying season when grain may arrive at the store wetter than usual and the weather may be less
good for drying, for example when ambient temperature is low and r.h. is high, the capability to dry
the wettest grain rapidly could make a crucial difference to the value of the grain. The importance
of rapid drying in controlling risk of fungal toxins is emphasised in the HGCA Grain Storage Guide
3rd edition, 2011. Other benefits of stirring in terms of maintaining quality and reducing cost are
available, in principle, whatever the season. For example, overdrying of the bottom of the bed can
be avoided, or at least reduced, so it may be possible to exploit different, and potentially more
energy-efficient, drying strategies. If stirring allows a greater depth of grain to be used without
compromising grain quality, this would allow more grain to be dried with an existing drying floor.
These potential advantages of stirring are quite well known, but there are drawbacks too. Clearly,
installing a stirring system on an existing drier to solve a drying problem requires a sizeable
investment, for which the grower would wish to know the benefits. A major investment in a new
store designed around stirring may need to be justified by savings in cost and/ or time. A small,
single auger stirrer is low cost but how much difference might it make to drying performance?
This study aimed to examine stirring and how to integrate it with on-floor drying practice to find out
how growers can get the maximum benefits from a stirring system, and establish guidelines for
operation. This was achieved by developing, validating and exploiting a well-established simulation
model of drying integrated with a new model of the stirring process. The integrated model was then
11
run extensively to generate data on how drier performance would be likely to be influenced by
initial m.c., bed depth, weather conditions, size of fan, conditions in the plenum and, of course, how
the stirring system is used in relation to these factors. The work focused on how costs of fuel and
electricity and drying time were affected by the factors just given. With this data and a better
understanding of how stirring the bed affects drying, this work aims to help growers make the best
decisions on whether to stir and how to stir.
It was convenient to structure this report using the milestones (MS), which are quoted in this report
from the project documents for completeness. MS 1 describes the new model of stirring, MSs 2
and 5 present the validation, MSs 3 and 4 describe the simulation work done with the model and
presents and analyses the resulting data, and MS6 develops guidelines to help in decisions on
whether stirring is likely to be helpful and how best to use a stirring system.
3.2. Development of integrated model of drying and stirring
Milestone 1. “Revise the simple simulation of mixing developed in project HGCA 3133 and adapt it for a single, self-propelled stirring auger, variable auger depth, and rate of mixing.” The new, integrated model of stirring and drying was implemented as modifications to the
simulation of bulk drying known as “Storedry”, which has been used for several HGCA projects
(Bruce et al. 2006, Nellist 1998A, 1998B) and was well established by extensive research at the
former Silsoe Research Institute (e.g. Nellist, 1987, Nellist & Bartlett, 1988, Nellist & Brook, 1987).
The model is written in FORTRAN computer language.
In the simulation of bulk drying, the grain bed is represented as a series of 100 layers, each thin
enough for certain simplifications to be made in the calculations of exchange of heat and moisture.
Air flows through each layer in turn. An inlet air condition is used for an hour, then the historical
record is read and the ambient temperature and relative humidity weather conditions for the next
hour are read and used. Depending on the particular control strategy being implemented, the
ambient air conditions may be altered by heating. The grain bed is ventilated with the air
representing the output from a fan, which will have an appropriate heating effect. The flow rate may
be specified, or it may be calculated to reflect the performance of a particular model of fan
operating against the resistance of the grain bed and duct system. Depending on the moisture and
temperature conditions of the grain in each layer and of the air entering the layer, the air may heat
or cool the grain and may dry or occasionally rewet it. If grain and air reach an equilibrium
condition, no further exchange takes place. The conditions of the air and grain in each layer up
through the bed are calculated each hour. Of the two methods for simulating the layer-by-layer
exchange of heat and moisture in the grain, the “four equation” approach was used here, as
12
opposed to the “equilibrium” approach used in HGCA project 2982 (Bruce et al., 2006) for
example. This was because the four equation approach, though demanding significantly more
computing time per drying run, was necessary when drying with the higher air temperatures that
may best exploit the stirring system. Once the temperature and moisture conditions of each layer
of the grain bed have been established for each time step, the effect on the grain quality in each
layer is calculated. These include progress towards spoilage by fungal activity. Drying is halted
when two grain moisture targets have been reached or a time limit of two months has expired. The
targets are for the average m.c. of the whole bed and for the wettest m.c. in the bed to have fallen
to or below specified values. At these times, various measures of performance and are calculated
and output as required. The program has not been fully described but Sharp (1984) describes the
theoretical basis and many of the features as they existed then.
Grain stirring was modelled in a simple way for HGCA project 2982, as appropriate to that project’s
requirements. The focus in that work was on how to avoid the upper layers of the grain bed
remaining at or around their initial moisture for most of the drying time, with the consequent risk of
production of fungal toxins. Stirring could avoid this situation by reducing the m.c. of the upper
layers more quickly and hence reduce the opportunity for fungal growth in these layers. The
“stirring” in that model was done at particular times during the drying process and not throughout
drying. At the specified times, e.g. once per 6h, the layers of grain were simply re-ordered in a
random manner, thus effectively mixing the grain bed. In this simple model, the process took place
in zero elapsed time. Each grain layer maintained its conditions of moisture content, temperature
and progress towards spoilage, so any gradients developed by drying were destroyed. The
differences in moisture and temperature between adjacent layers resulted in transfer of heat and
moisture to and from the air in subsequent ventilation so that the sharp layer-to-layer differences
were lost and the gradients in the bed were gradually re-established.
Though useful for the “quick look” at stirring required by HGCA project 2982, this model was not
adequate for the present study with its focus on energy use and cost. The shortcomings of the
previous model for this study are as follows.
• Instantaneously mixing of the whole bed is unrealistic and does not allow accounting for
energy expended as the stirring system runs
• It was not possible to account for the impact of the number of stirring augers in a given area
of drying bed on drying performance
• Lateral redistribution of grain arising from the vertical stirring augers was not modelled
• The changes in the bed arising from drying during stirring were not available
• The exhaust humidity was not well enough calculated. This was because the moisture
content of surface layers, which determines the exhaust humidity, was determined by the
layer that happened to end up on the surface after shuffling.

13
The action of stirrers moving through a grain bed is complex. The main action is the vertical lifting
of grain near the auger and subsequent sinking further out from the auger, which is a complex
pattern of particle flow that results in lateral as well as vertical flows. Add to this the effect of the
movement of augers around the grain store, which leads to further lateral grain flow following the
auger movement, and irregular stirring of any particular area of the store. Hence, the particle flow
patterns are three-dimensional and time dependent.
As explained above, the drying model, “Storedry”, represents the grain bed as a series of layers in
the vertical direction, so it is a one-dimensional model. Hence, it would have been inappropriate to
develop a model of stirring as a three-dimensional process, which it really is, because such a
model could not be integrated into the drying framework. Instead, a one-dimensional stirring model
was developed to integrate with the drying calculations, but which nonetheless represented the
essential features of the action of vertical augers on the grain bed.
The first stage of the new stirring model considers the action of a single auger, embedded in a
grain mass and running but not moving laterally, which has been running for long enough to
produce a stable flow pattern of grain. Observation of this pattern in commercial devices and in an
experiment reported below, shows that grain is lifted by the auger to form a cone at the bed
surface, down the faces of which grain flows freely. (Once the auger has passed, the slope is
static.) Grain is then drawn below the surface level as grain in the bed descends to replace that
drawn upwards by the auger. Grain enters and leaves the vertical flow driven by the auger
throughout its length but the main point of entry is at the bottom of the auger and most of the
entrained grain exits at the top. Grain being removed by the auger from the point of entry results in
a flow downwards from the footprint of the surface cone. The result is a circulation in the grain
mass.
Although it is possible to calculate the shape of the descending mass within the grain bed, this is a
very complex problem in particle flow. Flow is controlled by the properties of bulk materials,
particularly by internal friction between the particles and the compressive stresses in the bulk grain
resulting from its weight. The result is slip surfaces within the bulk between regions of flowing and
of static particles. The material properties and the normal stresses determine the angle to the
horizontal at which material will ‘slip’ against itself. (The angle in the bulk differs from the angle that
the material forms when forming an unconstrained sloping face on which there is no normal
stress.) So, based on the overall situation described, it was assumed that the moving mass of grain
below the surface also formed a cone that extended from the bottom of the auger to meet the cone
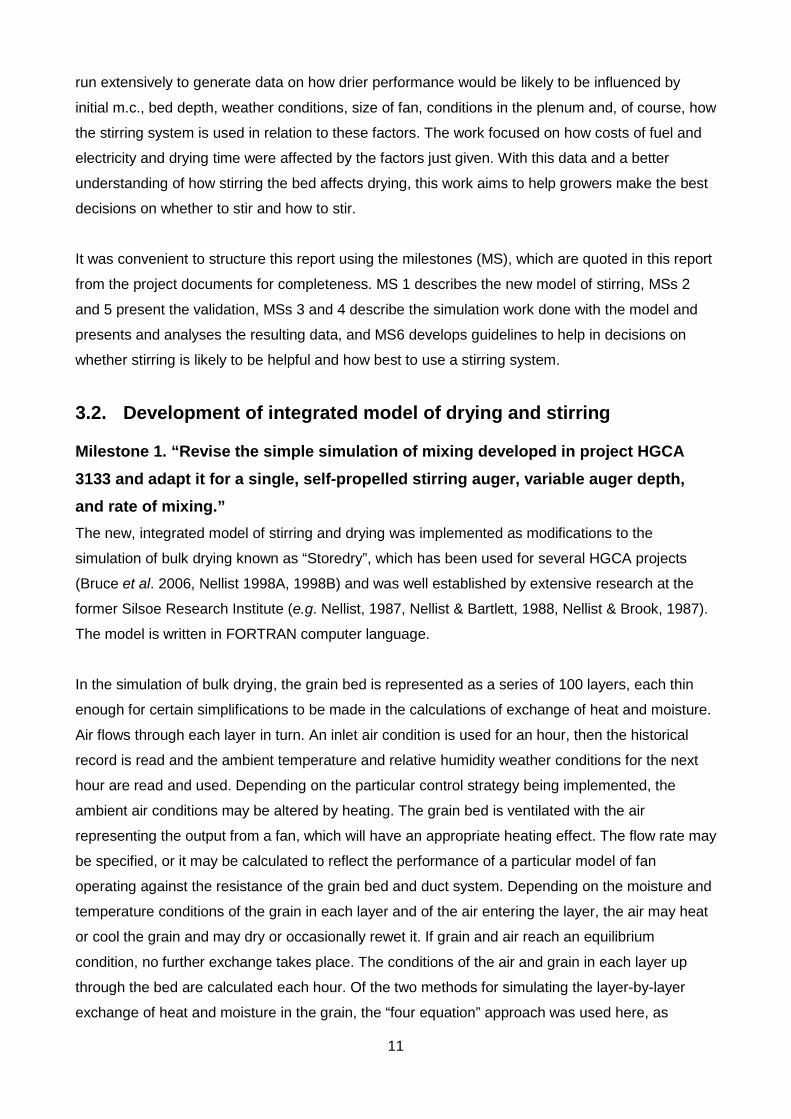
on the surface base to base. A partly dried bed is shown in Figure 1, with the yellow colour
representing grain already dried and the blue colour yet to be dried.
14
Drying air
Figure 1. Schematic of a partly dried bed of grain showing airflow, stirring auger, grain already dried (yellow)
and yet to be dried (blue).
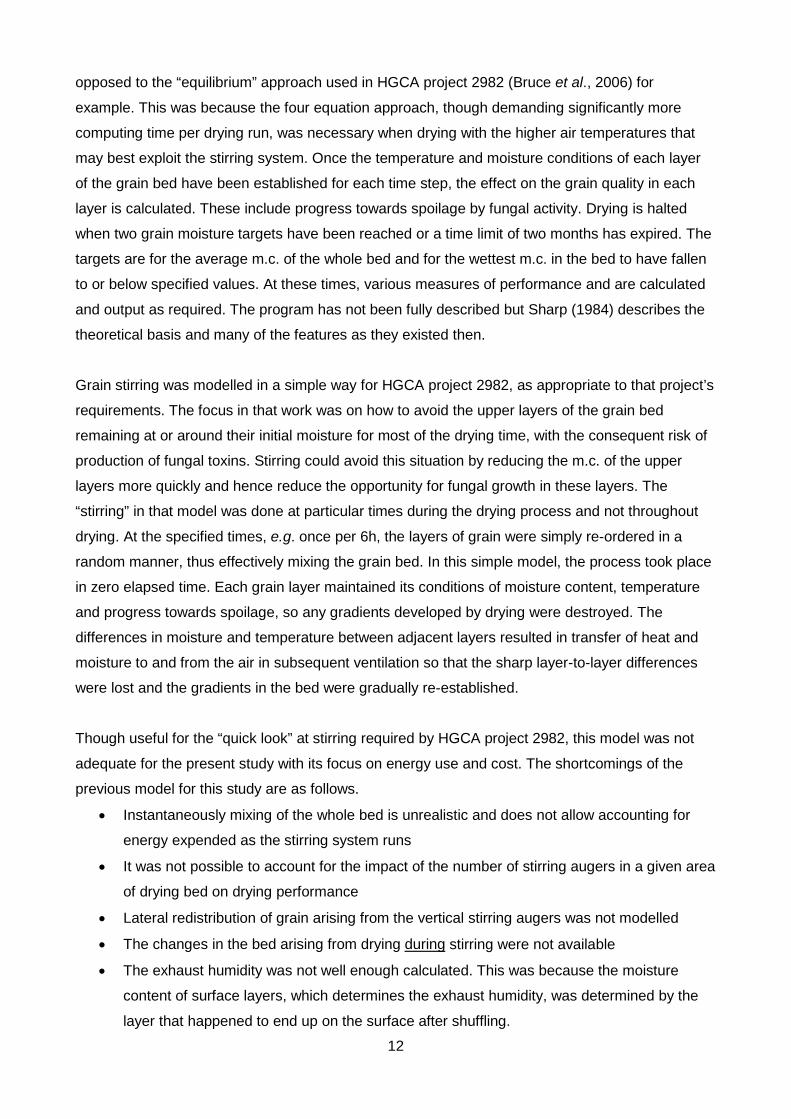
In Figure 2, the circulation zone formed as a result of the action of a stationary auger is shown as
green, with arrows indicating grain flow direction and speed. The rest of the bed is undisturbed
except that the level beyond the cone has fallen, shown by the white ‘layer’ of displaced grain.
Figure 3 shows the final state of the bed after lateral redistribution, the colours illustrating the
differing proportions in each layer of mixed grain from the circulating zone and undisturbed grain.
Figure 2. Circulation zone formed by auger (green), with arrows indicating grain flow direction and speed.
The rest of the bed is undisturbed except that the level beyond the cone has fallen, shown by the white
‘layer’ of displaced grain.

15
The assumption was made that the circulation of grain due to the action of the auger was enough
to completely mix the grain in the circulating zone, and thus to produce a volume of grain at a
uniform moisture and temperature. This is justified by the slow lateral speed of augers that are
lifting grain at quite high flow rates. The conical shape of the circulating zone implied that differing
proportions of the drying model’s grain layers were entrained. The m.c. and temperature in the
circulating zone were calculated from the m.c. and temperature of the grain in each layer and the
mass of grain entrained from each layer. Once this was known, the effect of lateral distribution from
the stationary auger was modelled by combining at each layer the appropriate proportion of grain
in the mixed volume with that not entrained by the auger as shown in Figure 3 which illustrates
differing proportions in each layer of mixed grain from the circulating zone and undisturbed grain
using colour. Dried grain is represented in yellow, grain at the original surface m.c. is represented
in blue and grain at intermediate m.c.s in various shades of green.
Figure 3. Bed after lateral redistribution in the simulation, the colours illustrating the differing proportions in
each layer of mixed grain from the circulating zone and undisturbed grain.
Stirring systems move the augers within the store so as to mix the whole area of bed with only a
small number of augers. The model is based on that fraction of the store effectively stirred by one
auger. So if there are four augers the store area simulated is ¼ of the whole.
Movement of the augers around the grain store was modelled as follows. Storedry was modified to
simulate drying in many grain beds in parallel, rather than just one. These ‘mini-beds’ had the
same number of layers and were all ventilated in the same way, so moisture and temperature
changes were calculated in each bed for each hourly timestep. However, only one of the beds was
stirred each hour. Given the computing effort is much greater than for the single bed model, the

16
number of beds in the sequence for stirring was limited to 20 for one stirring auger. This is enough
to allow a realistic pattern of auger movement around the store to be defined. The sequence can
overlap itself and does not have to include all beds an equal number of times so various patterns of
movement can be specified. (An option was added to use a timestep of 0.25h if needed, so that the
experimental data from the Food and Environment Research Agency (Fera) could be modelled as
a four bed sequence stirred over a 1 hour period.)
Each mini-bed had a surface area that was as wide as the cone produced by a single auger, 1.0m
based on experimental data from the project, and as long as the distance moved by the auger in
the one hour timestep. So the number of beds in the sequence is found by dividing the area of the
part of the store to be simulated by the area of each bed. As the auger moved from one bed to the
next, mixing of grain between the mini-bed just stirred and the next in the stirring sequence was
modelled by a similar procedure as already described: a proportion of the each layer from one of
the mini-beds was mixed with the appropriate layer of the other to represent the grain mixing when
the auger was operating at the edge of both mini-beds. However, side-to-side redistribution
between beds along the current auger track and those in adjacent tracks was too complex to
include.
The literature on stirring is not conclusive about the effect of stirring on air resistance of the bed.
There is some evidence that stirring reduces resistance, but only marginally unless the grain was
compacted or deteriorated (Anon., 1994). Such a reduction would allow more airflow if the fan were
capable of providing it. The stirring model was developed to allow a reduction in air resistance to
occur. The best way to do this would be for airflow resistance to be expressed as a function of bed
porosity because, if stirring has any effect on the bed air resistance, it will be as a result of
increased porosity. However, in Storedry, the resistance of the bed is calculated from grain depth
and seed size and the porosity of the bed is not explicitly used. So the approach taken was to
increase in airflow after a mini-bed was stirred by a user-determined multiplier. Settling of the grain
bed after stirring would occur over time, which would gradually increase the porosity towards the
original level, so the airflow was reduced at each time step after stirring again by a multiplier. This
reduced the airflow towards its original value which, unless the bed was stirred again, would be
reached in a user-set number of hours. The reduction in airflow as this settling occurred was
continued even if stirring was off.
In the model of stirring developed for HGCA project 2982, grain quality attributes were calculated
for each layer. These attributes, namely the progress towards the risk of Ochratoxin A (OA) and
the loss of grain viability, followed that layer when it was re-shuffled. In the new model, the mixing
and averaging of moisture content and of temperature did not allow the grain quality attributes of
individual layers to be preserved through the stirring process. Whereas averaging was appropriate

17
for physical parameters such as moisture content and temperature, it was not appropriate for grain
quality parameters for the following argument. If a grain layer were very close to the spoiled
condition, i.e. in which fungi would be about to produce OA, mixing and averaging that layer with
another where the grain was still in prime condition would produce grain which was only half way to
spoilage condition. This is not realistic because individual grains in the mixture would still harbour
fungi at the critical level and would still be at high spoilage risk. So the new model takes a
conservative approach by finding the layer in the bed before stirring in which biological attributes
are worst and ascribing them to all the other layers in the bed after stirring.
The model had to be able to simulate drying with the auger not operating, or operating
intermittently. A time-based arrangement allowed the auger to be run a specified times, e.g. turned
on after 150h of drying. A control arrangement was also developed that modelled the commercial
practice of running fan and heater for a time before starting stirring. Stirring was started only when
a user-set temperature had been reached in the grain bed. At this time, a second fan could be
started in parallel with the first, to provide increased airflow while stirring.
An option to start with a non-uniform bed of grain was added, such that the m.c. of all grain layers
could be specified individually.
Approximately 750 lines of code were needed to implement the changes described above.
3.3. Validation
Milestone 2. “Plan and make measurements in the The Food and Environment Agency (Fera) grain store on stirring in bin, and on drying with and without stirring. Validate the stirring model using the data.” Milestone 5. “Plan and make measurements on a commercial floor store drier with a stirring system, and validate the model using the data” Validation was done in four stages. First, the model was run at ‘standard’ near-ambient drying
conditions and the results with stirring were compared qualitatively with results when stirring was
not used. This allowed the behaviour of the stirred bed drier model to be checked to ensure it was
reasonable. Second, two experiments were undertaken at Fera, where grain bins of about 30t
capacity were available. In experiment A in 2010, the mixing pattern of a single, fixed auger was
studied in a bin with two layers of different initial moisture content. The bin was then dried with
stirring. In experiment B in 2012, two bins were dried, one with and one without stirring. Measured
conditions for ingoing air and grain from each experiment were used as inputs to the model so that
the predicted temperature and moisture content in the bed during drying could be compared with
measurements. In the third stage of validation, an experiment reported in the literature on an 80t

18
bin and using a higher air temperature, 38oC, was simulated and results compared with those
reported. The fourth and final stage of validation was to measure drying performance with and
without stirring in side-by-side bays in a commercial floor store and compare predictions made
using the model with the data.
3.3.1. Stage 1 – behaviour of stirred bed drier
Drying with a static bed, i.e. not stirred, resulted in a drying zone developing such that grain
nearest the air entry dried first, towards a moisture content at equilibrium with the incoming air,
while further downstream the grain was continuing to dry, and near the air exhaust, grain was not
changed from its initial condition. Although a target average m.c. may be reached, the lower part of
the bed will in general be drier and the upper part wetter. (If grain were to be stored in situ, it might
be necessary to continue drying to bring the upper part to a m.c. suitable for storage.)
Figure 4 shows the m.c. (always expressed on a wet weight basis in this report) versus drying time
in such a drier, with a bed depth of 3m. The development of the drying zone is illustrated. At 100h
for example, grain at 2.5m and deeper had already reached equilibrium of about 14.4%, grain at
1.5m and shallower was unchanged from initial m.c. and at 2.0m the m.c. was around 15%. At the
end point when the average m.c. of 15% was achieved after 216h, a spread of m.c. remained in
the bed, with the surface remaining near 19.5% and grain at 0.5m remaining at 15.8%.
14
15
16
17
18
19
20
0 50 100 150 200 250
Drying time, h
Moi
stur
e co
nten
t, %
wb bed avg
3.0 m2.5 m2.0 m1.5 m1.0 m0.5 m0.0 m
Figure 4. Moisture content at 7 depth locations and average moisture content versus time in a static bed 3m
deep.
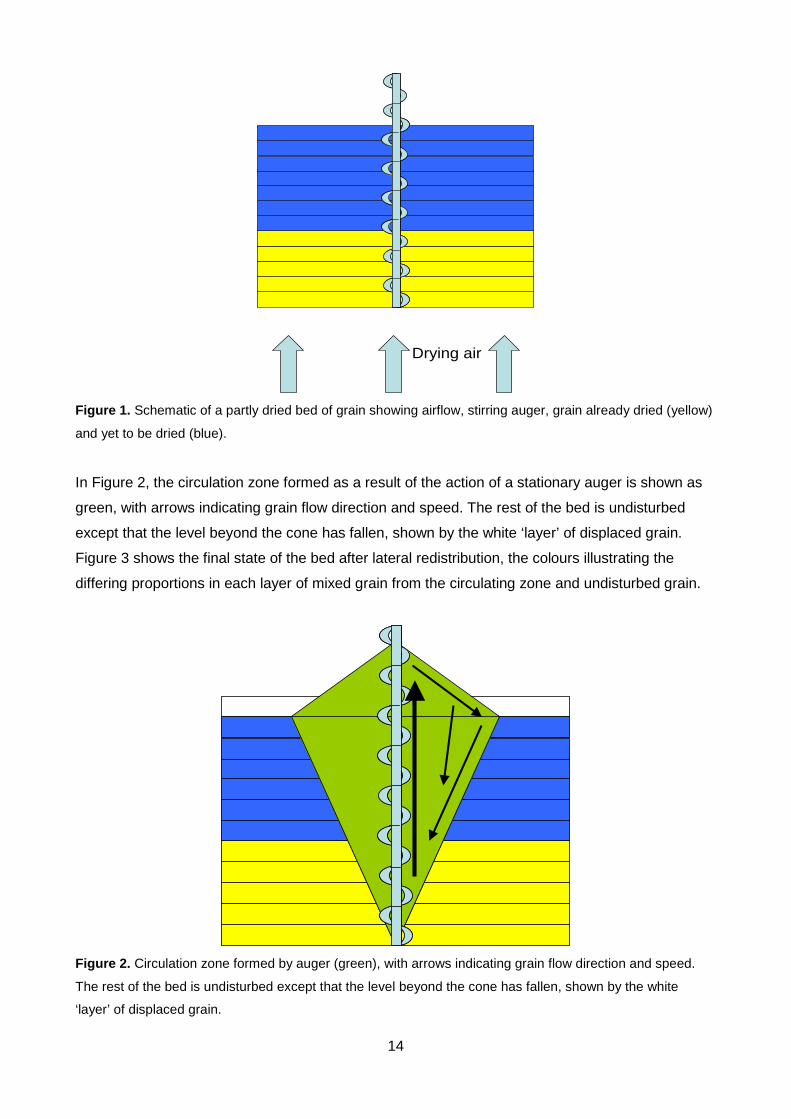
Figure 5 shows the effect of stirring the bed once for 4h at 100h. The differences in moisture were
substantially removed by the stirring, shown by the fact that grain at 2.5 and 2.0m was made wetter
19
while grain at 1.0m and shallower was immediately reduced in m.c. At 3.0m, grain was unaffected
by stirring since a very small proportion of it was entrained in the mixed “cone”. Immediately after
stirring ended, the drying zone began to re-establish itself as the deeper grain dried towards
equilibrium. It is noted that the average bed m.c. was unaffected by stirring, as would be expected
because no loss of moisture took place at that point in time. When the bed reached an average
m.c. of 15% at 233h, moisture differences again existed although the wettest grain was less wet
than in the static bed of Figure 4. It is also noted that drying to the same final average m.c. took
longer in the bed stirred once. This is discussed later.
14
15
16
17
18
19
20
0 50 100 150 200 250
Drying time, h
Moist
ure c
onte
nt, %
wb bed avg3.0 m2.5 m2.0 m1.5 m1.0 m0.5 m0.0 m
Figure 5. Moisture content at 7 depth locations and average moisture content versus time in a bed 3m deep
stirred once at 100h.
In Figure 6, the stirring was continuous once initiated at 100h. Before this time, the behaviour was
identical to that in Figures 4 and 5. Stirring results in the upper layers of the bed, down to 2.0m,
have become indistinguishable from each other while the layer at 2.5m was similar but, being
nearer the air inlet and being dried continuously by incoming air, followed a lower moisture
trajectory than the rest of the bed. This appears reasonable given that the moisture content of the
lower layers was being continuously reduced by drying but also being increased by mixing with
wetter grain from above. In the lowest region of the bed, where the smallest proportion of grain was
exchanged with the rest of the bed because of the conical shape of the mixing zone, the effect of
the drying was most intense. At 3.0m, the grain was unaffected by stirring, for reasons previously
explained. While drying was continued, the lower region of the bed would be expected always to
be driest but if stirring were continued once drying was stopped, the grain would finally become
uniform.

20
14
15
16
17
18
19
20
0 50 100 150 200 250 300 350Drying time, h
Moi
stur
e co
nten
t, %
wb
bed avg3.0 m2.5 m2.0 m1.5 m1.0 m0.5 m0.0 m
Figure 6. Moisture content at 7 depth locations and average moisture content versus time in a bed 3m deep
stirred continuously from 100h.
In Figure 6, drying to the target average of 15% took almost 350h, compared with 233 h of Figure 5
when less stirring was used. The explanation for this is as follows. The air exhausting from the bed
carries away the moisture so the more saturated it is, the more efficiently it is being used for drying.
Given that the energy needed to pump each unit of air is the same, efficiency requires that exhaust
saturation be as high as possible. (In practice exhaust air should be removed from the store to
prevent any condensation or re-absorption.)
Figure 7 shows the exhaust air relative humidity (r.h.) versus drying time for the standard grain
bed, static and stirred from 100h after the start of drying, and with drying continuing until a target
average bed m.c. of 15% is reached. The static bed showed a steady exhaust r.h. until the leading
edge of the drying zone reached the surface at about 210h, whereupon the r.h. began to fall
towards that of the inlet air but for only a short time because drying to the required average m.c.
was complete. Thus, for nearly all the drying time, the exhaust r.h. was consistently high, which
means that the drying potential of the incoming air was well used. In the stirred bed, the r.h. started
to fall earlier, as a result of the fall in m.c. of the well-mixed upper region of the bed, with which the
exhaust air would be equilibrated. Early in the drying, there was no difference in the efficiency with
which the drying potential of the air was used but once stirring started the stirred bed used the
incoming air less efficiently. As a result of this, the average moisture content fell slower in the
stirred bed and it took longer to reach the target under the conditions simulated. This principle
would apply whatever air speed, temperature rise etc. were used, but the use of stirring might allow
air and bed conditions to be used that would lead to problems in a static bed. Here, for example,
the range of moisture content in the static bed once the average was achieved was too wide to be
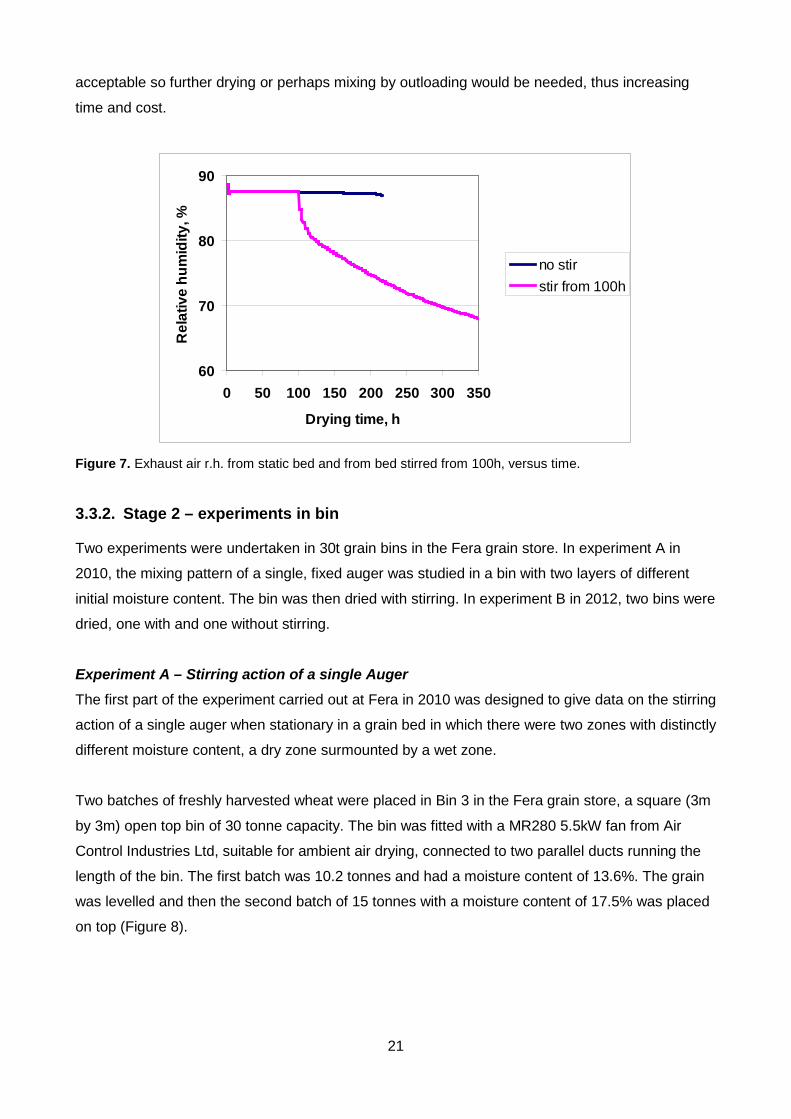
21
acceptable so further drying or perhaps mixing by outloading would be needed, thus increasing
time and cost.
60
70
80
90
0 50 100 150 200 250 300 350
Drying time, h
Rel
ativ
e hu
mid
ity, %
no stirstir from 100h
Figure 7. Exhaust air r.h. from static bed and from bed stirred from 100h, versus time.
3.3.2. Stage 2 – experiments in bin
Two experiments were undertaken in 30t grain bins in the Fera grain store. In experiment A in
2010, the mixing pattern of a single, fixed auger was studied in a bin with two layers of different
initial moisture content. The bin was then dried with stirring. In experiment B in 2012, two bins were
dried, one with and one without stirring.
Experiment A – Stirring action of a single Auger The first part of the experiment carried out at Fera in 2010 was designed to give data on the stirring
action of a single auger when stationary in a grain bed in which there were two zones with distinctly
different moisture content, a dry zone surmounted by a wet zone.
Two batches of freshly harvested wheat were placed in Bin 3 in the Fera grain store, a square (3m
by 3m) open top bin of 30 tonne capacity. The bin was fitted with a MR280 5.5kW fan from Air
Control Industries Ltd, suitable for ambient air drying, connected to two parallel ducts running the
length of the bin. The first batch was 10.2 tonnes and had a moisture content of 13.6%. The grain
was levelled and then the second batch of 15 tonnes with a moisture content of 17.5% was placed
on top (Figure 8).

22
Figure 8. Bin 3 after loading and levelling.
A “Grain Butler” single auger machine, kindly loaned by BDC Systems Ltd and fitted with a 2.93 m
auger, was fixed to a ladder (Figure 9) across the bin top so that it would be secure and not move
when used. When the bin was filled initially with the two batches of grain the boundary between
drier and wetter grain was not high enough for the auger to reach and so it was decided to dry the
bin for a period to drive the dry-wet boundary sufficiently far up for the mixing test. After drying for
102h this had been achieved, according to temperature readings used to track the drying zone.
4 m
1.7 m
1 m
2.1 m
2.6 m
15 tonnes at 17.5% m.c.
10.2 tonnes at 13.6% m.c.

23
Figure 9. Single auger stirrer unit secured across the bin.
The dimensions were recorded of the grain cone that formed around the auger after it had been
working for a long enough time (Figure 10). The diameter of the cone was found to be 1.0m so this
value has been used in the model as the width of the zone stirred by the auger each hour.
Figure 10. Grain cone formed by running the auger
24
Because the mixed region below the grain bed surface was not directly observable, samples were
taken by probe down into the grain bed within and without the surface cone. It was hoped that the
moisture contents would show not only the location of the edge of the mixed zone below the
surface but also confirm the mixing of the entrained grain from the two zones of differing moisture
content.
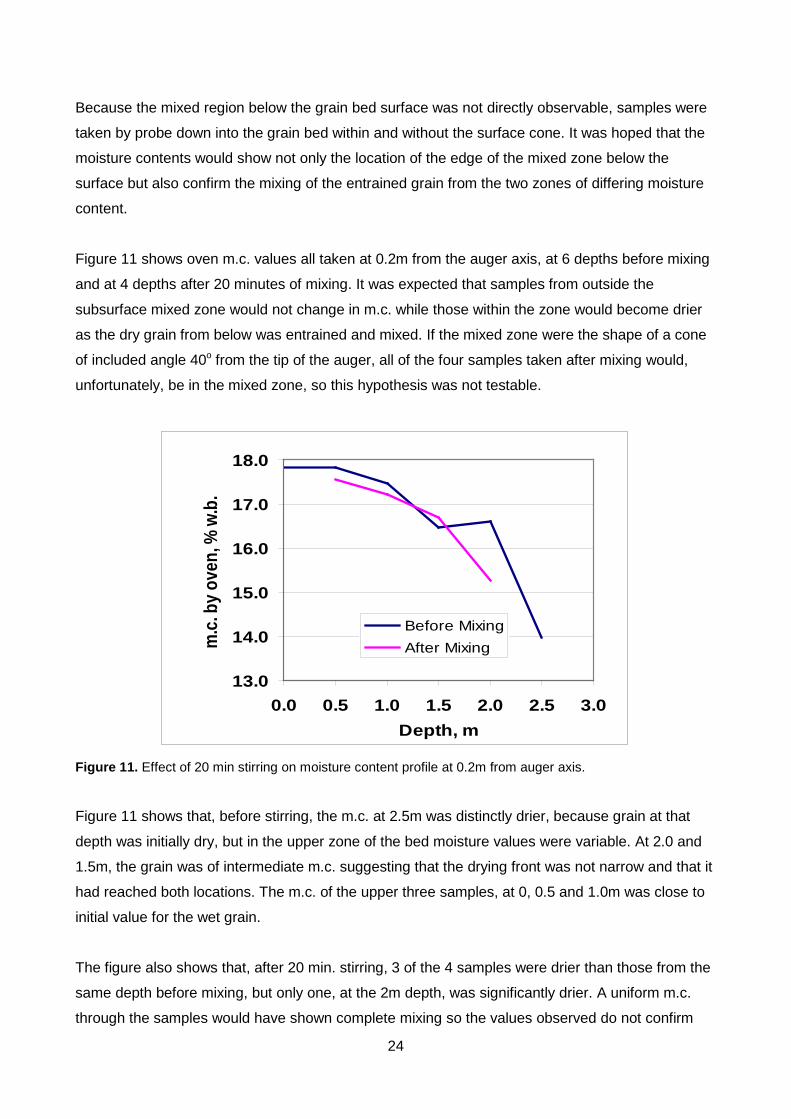
Figure 11 shows oven m.c. values all taken at 0.2m from the auger axis, at 6 depths before mixing
and at 4 depths after 20 minutes of mixing. It was expected that samples from outside the
subsurface mixed zone would not change in m.c. while those within the zone would become drier
as the dry grain from below was entrained and mixed. If the mixed zone were the shape of a cone
of included angle 40o from the tip of the auger, all of the four samples taken after mixing would,
unfortunately, be in the mixed zone, so this hypothesis was not testable.
13.0
14.0
15.0
16.0
17.0
18.0
0.0 0.5 1.0 1.5 2.0 2.5 3.0Depth, m
m.c.
by o
ven,
% w
.b.
Before MixingAfter Mixing
Figure 11. Effect of 20 min stirring on moisture content profile at 0.2m from auger axis.
Figure 11 shows that, before stirring, the m.c. at 2.5m was distinctly drier, because grain at that
depth was initially dry, but in the upper zone of the bed moisture values were variable. At 2.0 and
1.5m, the grain was of intermediate m.c. suggesting that the drying front was not narrow and that it
had reached both locations. The m.c. of the upper three samples, at 0, 0.5 and 1.0m was close to
initial value for the wet grain.
The figure also shows that, after 20 min. stirring, 3 of the 4 samples were drier than those from the
same depth before mixing, but only one, at the 2m depth, was significantly drier. A uniform m.c.
through the samples would have shown complete mixing so the values observed do not confirm

25
that mixing was complete. Once the auger had been run and the grain below had been disturbed,
the measurements could not be repeated.
Moisture content values were also recorded from a probe pushed down into the grain bed, but
these measurements did not establish any clearer a picture than the oven m.c. values so they are
not presented here.
Experiment A - drying with stirring The auger was then removed from the ladder so that it could move freely and the grain was dried
with stirring. The auger stirring device was used intermittently to stir the bin rather than
continuously because it was self-propelled and had to be supervised. The supplier recommended
one hour of stirring per 24h so four periods of stirring each of 1h were carried out over 4 days while
the bin was being dried. No heat was added to the air because the fan alone was known to heat
the air by about 3oC. Samples for oven moisture analysis were taken daily before and immediately
after the period of stirring. The samples were taken at depth intervals of 0.5m, starting at the
surface and sampling down to 2.5m, this last being in the zone of initially dry grain. The bed depth
was effectively 3.6m so the lowest metre of grain was not sampled. The length of the auger was
2.93m.
The bed was dried for about 4d without stirring to move the dry-wet boundary up through the bed
to a depth where the auger would mix dry and wet grain when operated. Temperature
measurements were used to judge when this had been achieved. During two periods of 2d each,
drying was stopped and only cooling with a low air flow took place. This was necessitated to avoid
the drying front progressing too far when labour was not available for sampling. These two periods
were cut out from the overall record to leave only the measurements obtained when a drying
airflow was used. This was considered reasonable because cooling flows are small enough to
achieve virtually no drying. However, the temperature and r.h. traces were affected so there were
discontinuities in these traces which made their interpretation difficult.
The simulation was run using the measured air temperature, relative humidity and flow, and initial
grain depths and initial moisture contents of the two grain batches. Each one hour period of stirring
was modelled by 15 min stirring for each of four mini-beds, where a mini-bed represented one
quarter of the bin. This was done four times to match the times when stirring was done during the
experiment, at 102h, 122h, 158h and 181h.
Experiment A - results and discussion Figure 12 shows the grain m.c. versus drying time for samples taken down through the bed at the
centre of the bin to 2.5m depth. Figure 13 is the equivalent for samples taken from 0.5m from the

26
side of the bin. Before drying started, the samples at 2.5m depth revealed the dry layer while grain
at the other depths was initially wetter. As drying progressed to the first stirring time at 102h, grain
at 2.5m (yellow trace), which was within a metre of the inlet duct, underwent some wetting and
some drying but did not change substantially. At 2.0m depth, drying started after 1d and
progressed. At 1.5m, drying started at 2d and, at 1.0m and less from the surface, there was no
change in m.c. before stirring.
13
14
15
16
17
18
19
0 1 2 3 4 5 6 7 8 9 10
Drying time, days
Moi
stur
e co
nten
t, %
wet
bas
is
0 m 0.5 m
1.0 m 1.5 m
2.0 m 2.5 m
1 hr stir
Figure 12. Moisture content versus time at 6 depths at centre of bin showing four times when bin was stirred.
Stirring, first at 102h and stirring on the subsequent three occasions, was highly effective in
disrupting the layers of grain at the bin centre (Figure 12) judging by the m.c. samples from the six
depths. It is particularly noteworthy that, after only 1h of stirring, the m.c. in the top 1m of the bed
dropped immediately and none of the grain sampled remained at the initial m.c. It was evident that
mixing was thorough enough for the surface grain to have been incorporated and not just moved to
a lower depth. Had this initial m.c. been high enough for there to have been a risk of OA, which it
was not in this experiment, such a fall in m.c. would have eliminated the risk almost immediately.
Moisture traces from the bin centre showed that grain at 2.5m and at 0.5m must have been moved
up because wetter grain reached 2.5m, which can only have come down from above, while drier
grain arrived directly at 0.5m. On subsequent stirs, the situation was reversed but the changes got
smaller as the mixing evened out the bed. At the side of the bin, Figure 13, the layer disruption was
similar though not as complete, as shown by the observation that grain at 2.5m was not disturbed

27
until the second stirring period and, from the second stir onwards, the m.c. at the 2.0m level
remained wetter than the rest of the bed. This was probably because the physical size of the motor
unit prevented the auger getting close to the side of the bin so there may have been little or no
mixing at the depth of the tip of the auger close to the side face of the bin.
13
14
15
16
17
18
19
0 1 2 3 4 5 6 7 8 9 10
Drying time, days
Moi
stur
e co
nten
t, %
wet
bas
is
0 m
0.5 m
1.0 m
1.5 m
2.0 m
2.5 m
1 hr stir
Figure 13. Moisture content versus time at 6 depths at edge of bin showing four times when bin was stirred
In Figure 14, grain moisture content at three depths, 0.5, 1.5 and 2.5m, averaged for the centre
and side bin samples, are compared with values from simulation. Data values are shown as points,
simulated traces as lines. Overall, agreement was acceptably good for the purpose of this
investigation. The initial m.c. values were calculated from daily samples rather than being taken
from the sampling on intake. Considering the three depths in detail allows some observations to be
made. At 0.5m below the surface, both measured and simulated m.c.s were steady until disturbed
by stirring. Thereafter both fell sharply and approached the final condition. Experimental points
were a little lower than simulated values. At 1.5m the simulated m.c. fell after about 50h drying and
was approaching equilibrium before stirring started. The measured m.c. started to fall later and fell
more slowly and so a significant difference opened up. This was investigated further, below. Both
were disturbed by stirring and after 2 stirring periods, both were approaching steady values. At
2.5m, measured and simulated values were steady until the first stirring, showing that the initial
m.c. of this dry zone was close to the equilibrium value. However, the steady values differed,
showing that the equilibrium m.c. in the model differed from that in experiment. The simulated m.c.
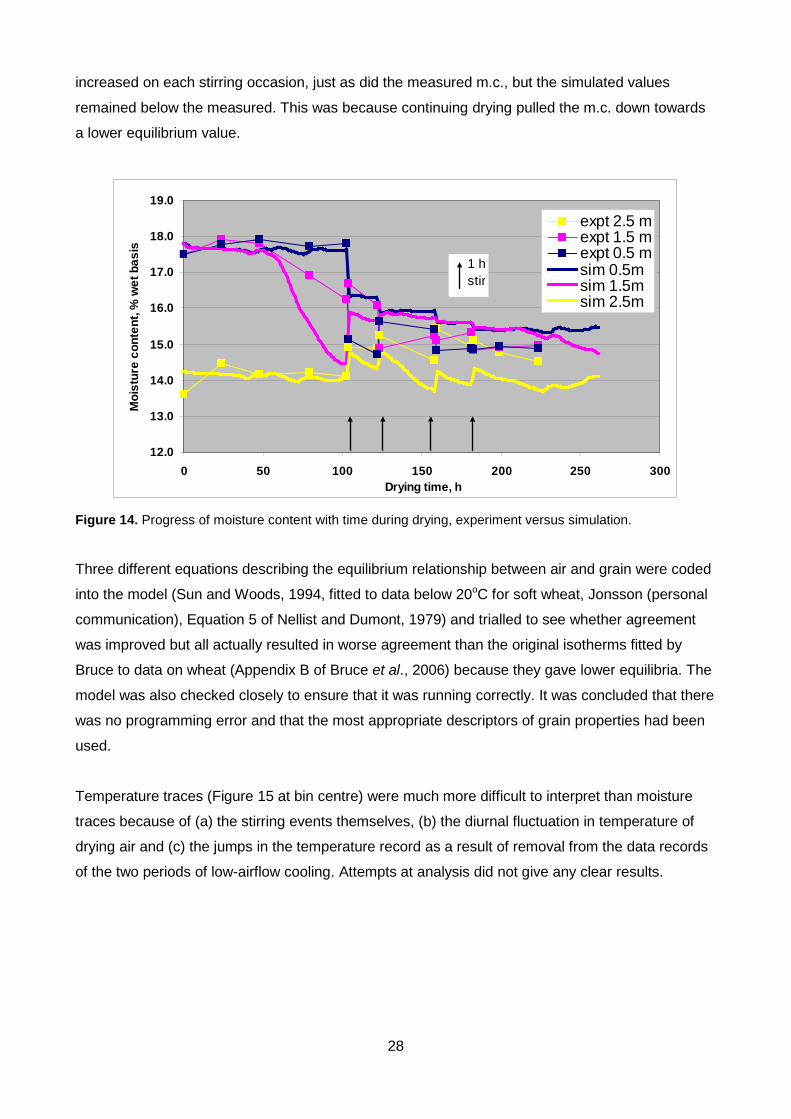
28
increased on each stirring occasion, just as did the measured m.c., but the simulated values
remained below the measured. This was because continuing drying pulled the m.c. down towards
a lower equilibrium value.
12.0
13.0
14.0
15.0
16.0
17.0
18.0
19.0
0 50 100 150 200 250 300Drying time, h
Moi
stur
e co
nten
t, %
wet
bas
is
expt 2.5 mexpt 1.5 mexpt 0.5 msim 0.5msim 1.5msim 2.5m
1 h stir
Figure 14. Progress of moisture content with time during drying, experiment versus simulation.
Three different equations describing the equilibrium relationship between air and grain were coded
into the model (Sun and Woods, 1994, fitted to data below 20oC for soft wheat, Jonsson (personal
communication), Equation 5 of Nellist and Dumont, 1979) and trialled to see whether agreement
was improved but all actually resulted in worse agreement than the original isotherms fitted by
Bruce to data on wheat (Appendix B of Bruce et al., 2006) because they gave lower equilibria. The
model was also checked closely to ensure that it was running correctly. It was concluded that there
was no programming error and that the most appropriate descriptors of grain properties had been
used.
Temperature traces (Figure 15 at bin centre) were much more difficult to interpret than moisture
traces because of (a) the stirring events themselves, (b) the diurnal fluctuation in temperature of
drying air and (c) the jumps in the temperature record as a result of removal from the data records
of the two periods of low-airflow cooling. Attempts at analysis did not give any clear results.

29
8
12
16
20
24
0 1 2 3 4 5 6 7 8 9 10 11
Time, d
Tem
pera
ture
in g
rain
, o C Duct avg
2.1 m
1.8 m
1.5 m
1.2 m
0.9 m
0.6 m
0.3 m
Surface
Fan on/off
Stirring
Figure 15. Temperatures at centre of bin versus time
The exhaust air r.h. was measured by a sensor at the bed surface. The trace was not
straightforward to interpret for the reasons given above. The sensor had to be removed for the
stirring and, once replaced, took longer than the temperature sensors did to settle. Between stirs 3
and 4, an error was made in that the r.h. sensor was not replaced on the surface but remained on
the walkway of the bin. Figure 16 shows that up to the first stirring, the r.h. was around 86%,
whereas simulated exhaust r.h. was 80%. This latter value is considered (P9 of McLean, 1989) to
be in equilibrium with wheat at 17.6%, and the experimental grain was 17.8% so the experimental
value was unexpectedly high. After the first stir, the measured r.h. fell to 76-74%, somewhat high
considering the grain at the surface was around 15-16%. It was in good agreement with the
simulation which gave a m.c. at the surface of 16.3% and an exhaust r.h. of 74.7% after the first
stir. The next two periods were not steady, one because the sensor was not correctly in place.
After the fourth stir, the measured r.h. settled to about 70%, again high for a final measured m.c. of
14.7%.

30
0
20
40
60
80
100
3 4 5 6 7 8 9
Time, d
Rel
ativ
e hu
mid
ity a
t gra
in s
urfa
ce, % Fan on/off
Stirring
RH surface
r.h. sensor not in grain
Figure 16. Effect of four stirring events on relative humidity at bed surface.
Overall, it was concluded from Experiment A that the simulation reproduced the experiment
adequately well though with distinct areas of difference. The rapid fall in m.c. at the bed surface
and approach to a common value for the whole bed was well modelled, though the tendency of the
lowest layers to continue dry below the mixed average of the rest of the bed was stronger in the
model than in the experimental data. It may be that the model of the stirring action incorporates a
smaller proportion of grain from the lowest layers of the bed into the mixed zone than does a real-
life stirring system.
Experiment B – drying in bin with and without stirring Two bins were used, in one of which a single auger stirring device, used in Experiment A and
previously described, was used to stir the grain in one of the bins. The other bin was not stirred.
Bin 3, with the stirrer, was loaded with 25t of wheat via a conveyor, to a depth of 0.8m below the
top edge. This wheat was freshly harvested and had a m.c. of about 20.5% wet basis. Five tonnes
of this material was loaded into Bin 4, which was topped up with 20t wheat from a second load of
freshly harvested wheat via the conveyor, to a depth of 0.8m below the top edge as before.
The second batch had a m.c. of about 16.5%. That the m.c. was much lower than the first load was
unexpected, the supplier having been asked for two loads of similar m.c. It was decided that, given
continuing warm weather and consequent drying of standing wheat in the area, the chance of
obtaining a replacement load of higher m.c. wheat was low. So it was accepted that the unstirred

31
bin would start with two levels of m.c. No heat was added to the air because the fan alone was
known to heat the air by between 3 and 4oC.
For each bin, two poles were inserted into the surface fitted with thermocouples attached at 0.3m
intervals down to 2.4m depth. One pole was inserted at the centre of the bin and another 0.5 m
from the side. Samples for oven moisture analysis were taken by sampling spear near the same
central and side locations at depth intervals of 0.5m down to 2.5m. Initially, these samples were
taken at least every other day, before and immediately after the period of stirring. The bed depth
was effectively 3.6m so the lowest metre of grain was not sampled.
Initially, air speed was measured at 9 locations at the grain surface by a “Casella” rising disc
anemometer at least every other day. After 9 days the air speed was also measured at 5 locations
across the drying fan intake by vane anemometer. For the stirred bin, readings were taken before
and after every stirring operation. The interval between grain sampling and flow readings was
increased as drying neared completion. Sensors for relative humidity, dry bulb temperature and
static pressure were installed in the air duct at the bottom of the bin to measure conditions of air
entering the grain. At the surfaces of the bins, an r.h. sensor and thermocouple inserted just below
the surface measured the air conditions exhausting from the bin. For the stirred bin, these sensors
and the two poles were removed before stirring and re-inserted afterwards. Stirring was done for
45-60 min every 48h until drying had slowed down towards the end of the process. Stirring was not
done for four days after starting the fan because, until that time, grain being dried was below the tip
of the stirring auger, 2.93m below the grain surface. In each bin, the fan was run continuously until
the wheat was close to equilibrium with the incoming air. After the fans were turned off, the grain
was sampled for bulk density determination.
Experiment B - results Air flow vs time in Bin 3. The mean of flow measurements at the grain surface was 34.5 m3/min, and as the bin was loaded
with 25.0 t of wet grain, (calculated to be 19.88 t of dry matter), the specific airflow for Bin 3 was
0.0230 m3/s/t wet matter. The readings made at the inlet to the fan gave an airflow 6% lower than
the surface flow, which is a good agreement considering the low flow and limitations of the rising
disc meter. For Bin 4, mean surface flow was 32.6 m3/min. The bin held 25t of wet grain of two
different batches, so that the specific airflow for Bin 4 was 0.0217 m3/s/t wet matter. Bin 4 was
calculated to be holding 20.69 t dry matter.
For the stirred bin, Bin 3, airflow fell by about 7% over the whole drying period. Looking at
individual stirring events, on average over eight such events the flow after stirring was 14% lower
than that before stirring, and the flow recovered to its pre-stirring level before the next stirring

32
event. The bed was walked on for grain sampling. Stirring involved an operator walking on the
grain surface to manoeuvre the single auger device so it was not possible to say what part of the
flow decrease after stirring was due to the operator’s weight compacting the grain and what part to
any disturbance to grain packing when stirred. For the static bin, Bin 4, the flow fell by about 6%
from its initial value during drying. This grain bed was also walked on for sampling and flow
measurement. So the airflow in both bins reduced by a similar percentage over the drying period
but stirring as done here led to an immediate reduction in airflow, followed by a slow recovery.
Grain depths in Bins 3 and 4 were reduced over the drying period by 0.46m and 0.27m,
respectively. Bulk density after drying, of un-compacted samples, was 0.69 and 0.68 kg/hl at 15.5
and 14.7% wet basis m.c., respectively.
Ingoing temperature and r.h. vs. time. Daily temperature fluctuations of about 5oC were measured, and the mean daily temperature in the
building housing the bins fell gradually during the period of drying from a peak of 19oC at 4d from
start of drying to 10oC after 36d. Because of the temperature rise provided by the fan, the
temperature of air entering the grain was about 3oC higher. Relative humidity of the air entering the
grain was close to 60% for the first 20d, increased to about 70% for 3 days, and then fell to about
60% again for the rest of the drying time. Daily fluctuation was between 10 and 20% points r.h.
Grain m.c. vs. time. Unfortunately, because the initial m.c. of the grain was different between the two bins, the drying
cannot simply be compared, but comparison is possible through use of simulation and this is
described later. Figure 17 shows grain moisture data from the centre of Bin 3. The points are the
measured values, and light lines are shown to help clarify, for two data points close together, which
data point was the m.c. before stirring and which was following stirring. The stirring events are
indicated by vertical lines below the m.c. traces. There was little effect on measured m.c. for the
first 3d of ventilation time, in that the m.c. remained close to its initial value of 20.5% w.b. Some
drying was being achieved but the grain being dried was below 2.5m, the maximum depth at which
samples were taken. In Figure 17 there is a disturbance of the m.c.s at the first stirring event at 4d
showing that by this time the dried zone had reached the level penetrated by the auger, some 3m
down. For clarity Figure 18 shows only the m.c. traces at 2.0m depth and at the surface in the
centre of Bin 3. Falls in m.c. caused by stirring are particularly clear at 7 and 9d, while at 5d stirring
brought drier grain to 2m but wetter grain to the surface.

33
13
15
17
19
21
0 5 10 15 20 25 30 35 40
Drying time, d
Moi
stur
e co
nten
t, %
w.b
.
0mcentre
0.5mcentre
1mcentre
1.5mcentre
2mcentre
2.5mcentre
Stirreron/off
Depth
Figure 17. Moisture content versus drying time. Samples from centre of stirred bin, Bin 3, before and after
stirring. Stirring events are shown by spikes on time axis. Points are joined by lines to show which sample
was before and which after stirring.
13
15
17
19
21
0 5 10 15 20 25 30 35 40
Drying time, d
Moi
stur
e co
nten
t, %
w.b
.
0mcentre
2mcentre
Stirreron/off
Depth
Figure 18. Moisture content versus drying time. Samples taken from centre of stirred bin, Bin 3, before and
after stirring. For clarity, only data from 0 and 2m depth are shown.

34
Figure 19 shows grain moisture data from the side of Bin 3. Stirring at 4d did not bring up any dried
grain, showing that drying was slower at the sides.
13
15
17
19
21
0 5 10 15 20 25 30 35 40
Drying time, d
Moi
stur
e co
nten
t, %
w.b
.
0mside
0.5mside
1mside
1.5mside
2mside
2.5mside
Stirreron/off
Depth
Figure 19. Moisture content versus drying time. Samples from side of stirred bin, Bin 3, before and after
stirring.
Because stirring was mostly done once every 2d, allowing time between stirring events for
moisture gradients to develop, the ‘before’ and ‘after’ measurements show quite large changes in
m.c. at many sampling depths. The centre of Bin 3, Figure 17, dried rapidly between days 4 and
11, and stirring events at 5, 7 and 9d each produced much change in the m.c. at each sampled
depth. Most of the depths sampled showed a reduction in m.c. at each stirring, as drier material
from lower in the bed was brought up. After 11d, drying was slower and after 30d continuous
ventilation the bed approached constant m.c.. At the side of the bin, Figure 19, the fall in moisture
was more steady, stirring was effective and drying continued until the fan was turned off after 36d.
Figures 20 and 21 present the m.c. data vs. time for the centre and side sampling locations in the
static bin, Bin 4.

35
14
15
16
17
18
0 2 4 6 8 10 12 14 16 18 20 22
Drying time, d
Moi
stur
e co
nten
t, %
w.b
.
0mcentre
0.5mcentre
1mcentre
1.5mcentre
2mcentre
2.5mcentre
Depth
Figure 20. Moisture content versus drying time. Samples from centre of the static bin, Bin 4.
14
15
16
17
18
0 2 4 6 8 10 12 14 16 18 20 22
Drying time, d
Moi
stur
e co
nten
t, %
w.b
.
0mside
0.5mside
1mside
1.5mside
2mside
2.5mside
Depth
Figure 21. Moisture content versus drying time. Samples from side of the static bin, Bin 4.
The static bin reached a steady m.c. after about 22d of continuous ventilation. Initial m.c. data, at
approximately 16.5%, show that the wheat in Bin 4 was drier than that in Bin 3, but the data do not
show the wetter material, at about 20.5% m.c., present below the sampling depth. The wheat

36
sampled over the first 6d of ventilation rose in m.c. This was because moisture was being
evaporated from the wetter grain and the consequent high humidity of the air passing through the
bed re-wetted that grain. After 9d, grain at 2m depth had started to dry and as the drying front
moved up through the bed, samples at successively lower depths showed drying. By 20d, grain at
2.5m and 2.0m depths was rewetting, following the incoming r.h. and thereafter it was decided that
the bed had reached steady conditions. At the side of the bin, the picture was very much the same,
Figure 21.
Exhaust r.h. vs. time The r.h. of air exhausting from Bin 3 is shown in Figure 22.
50
55
60
65
70
75
80
85
90
95
100
0 5 10 15 20 25 30 35 40
Drying time, d
Exha
ust r
elat
ive
hum
idity
, %
Measured r.h.
Stirring event
Figure 22. Relative humidity of air exhausting from the stirred bin, Bin 3, versus drying time.
At each stirring event, the r.h. fell because the sensor was removed from the surface of the bed to
the walkway while the bed was stirred. From an initial level of 92% or so, the r.h. of the exhaust air
fell steadily over the 36d of drying. At most stirring events the r.h. was lower following stirring
because lower moisture grain was brought up to the surface by the auger. The exhaust trace from
Bin 4, Figure 23, shows a much lower starting r.h. than for Bin 3, because of the lower m.c. in Bin
4, but which remained steady for some 7d and then rose for 4 days as a wetting front reached the
surface. This was due to moisture evaporated from the layer of wet grain at the bottom of the bin
leaving the surface. Thereafter, the exhaust r.h. fell steadily to that of the incoming air as the drying
front reached the top of the bed.

37
50
55
60
65
70
75
80
85
0 5 10 15 20 25
Drying time, d
Exha
ust r
elat
ive
hum
idity
, %
Figure 23. Relative humidity of air exhausting from the static bin, Bin 4, versus drying time.
Experiment B - simulation and discussion The simulation was set up to match the initial state of the experimental grain beds. The measured
conditions of ingoing air over the drying period (flow rate, temperature and relative humidity in the
duct) were used in the drying simulation. Predictions by the simulation of grain conditions within the
grain bed and of air conditions in the bed and exhausting from it were compared with measured
values from the experiment. For the simulation of Bin 3, the stirring model was activated at the time
when the grain had been stirred in the experiment, so that the events would line up on a time
basis. Simulations of both bins were allowed to run to the end of the available data for the ingoing
air rather than being stopped when the m.c. met that of the measured bed.
Stirred bin. Figure 24 shows for the centre of Bin 3 the measured m.c. data, as points joined by
thin lines, and the m.c. from the simulation, as thick lines. The colours indicate depths.

38
13
15
17
19
21
0 5 10 15 20 25 30 35 40
Drying time, d
Moi
stur
e co
nten
t, %
w.b
.
0m centre
0.5m centre
1m centre
1.5m centre
2m centre
2.5m centre
0.01m
0.5m
1m
1.5m
2m
2.5m
Stirrer on/off
Depth
Figure 24. Progress of moisture content at centre of stirred bin, Bin 3. Experiment (points and thin lines) vs
simulation (thick lines). Stirring events - spikes on time axis.
Though the picture is rather cluttered, it is clear that the simulated m.c. lines fall to a level close to
the measurements by the end of the experimental data, but about 0.4% m.c. below the measured
values. The time needed to dry the experimental bin was well matched by the simulation. At each
stirring event, marked on the time axis by a black spike, between 7 and 22d, the simulated grain
bed was disturbed with the result that wetter material at shallow depths became drier, by
incorporation of grain from below, and deeper grain increased in m.c. as it was mixed with wetter
material from above. This is easier to see in Figure 25 which shows only data points and simulated
lines for 0 and 2m depth.

39
13
15
17
19
21
0 5 10 15 20 25 30 35 40
Drying time, d
Moi
stur
e co
nten
t, %
w.b
.
0mcentre
2mcentre
0.01m
2m
Stirreron/off
Depth
Figure 25. Progress of moisture content at 0 and 2m depth at centre of stirred bin, Bin 3. Experiment (points
and thin lines) vs simulation (thick lines). Stirring events - spikes on time axis.
The simulated grain at 2.5m depth dried rapidly, followed by that at 2.0m and then 1.5m. This
difference with depth did not develop in the experiment, in which the m.c. was more consistent
between depths. In Figure 26, for the side of Bin 3, the experimental values are more spread out,
and are more closely resembled by those from the simulation. (The simulation does not attempt to
model differences in location across a bin.) In Figure 26, the strong drying tendency of the grain at
2.5m between stirring events is seen in the points and the lines.

40
13
15
17
19
21
0 5 10 15 20 25 30 35 40
Drying time, d
Moi
stur
e co
nten
t, %
w.b
.
0m side
0.5m side
1m side
1.5m side
2m side
2.5m side
0.01m
0.5m
1m
1.5m
2m
2.5m
Stirrer on/off
Depth
Figure 26. Progress of moisture content at side of stirred bin, Bin 3. Experiment (points and thin lines) vs
simulation (thick lines). Stirring events - spikes on time axis.
Figure 27 shows simulated lines and experimental points only for 2m depth and the surface taken
from the side, so as to present a simplified picture.
13
15
17
19
21
0 5 10 15 20 25 30 35 40
Drying time, d
Moi
stur
e co
nten
t, %
w.b
.
0mside
2mside
0.01m
2m
Stirreron/off
Depth
Figure 27. Progress of moisture content at 0 and 2m depth at side of stirred bin, Bin 3. Experiment (points
and thin lines) vs simulation (thick lines). Stirring events - spikes on time axis.
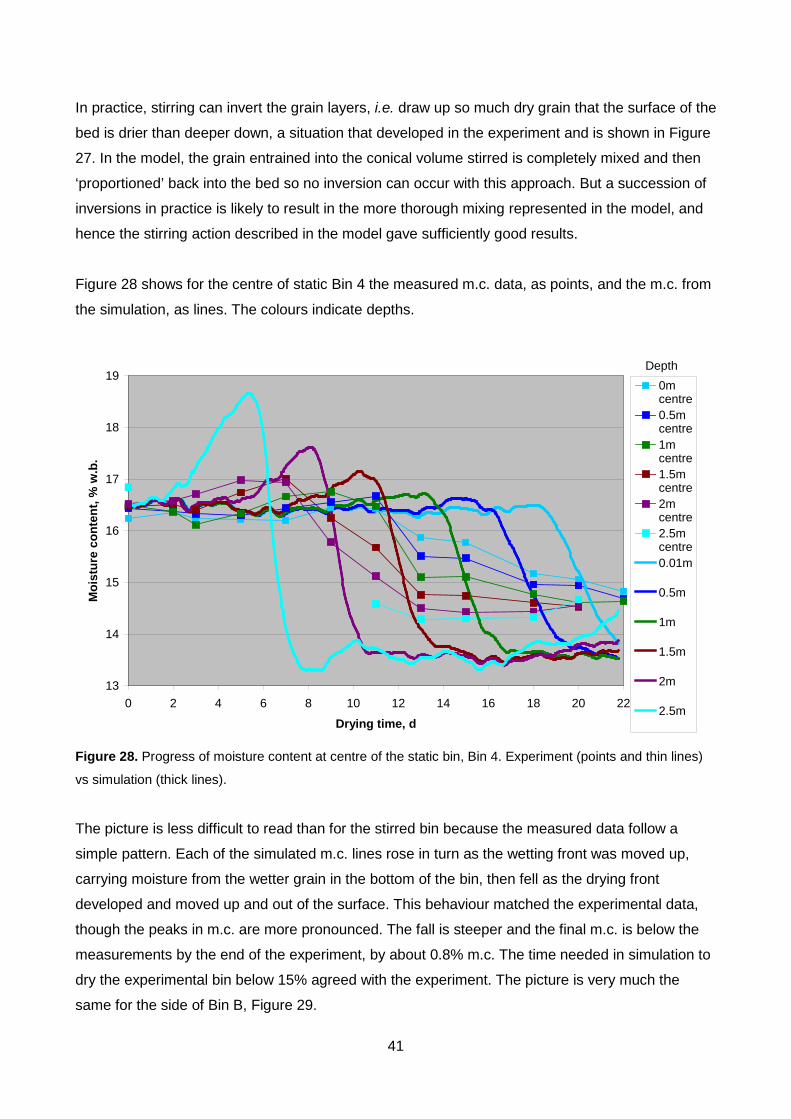
41
In practice, stirring can invert the grain layers, i.e. draw up so much dry grain that the surface of the
bed is drier than deeper down, a situation that developed in the experiment and is shown in Figure
27. In the model, the grain entrained into the conical volume stirred is completely mixed and then
‘proportioned’ back into the bed so no inversion can occur with this approach. But a succession of
inversions in practice is likely to result in the more thorough mixing represented in the model, and
hence the stirring action described in the model gave sufficiently good results.
Figure 28 shows for the centre of static Bin 4 the measured m.c. data, as points, and the m.c. from
the simulation, as lines. The colours indicate depths.
13
14
15
16
17
18
19
0 2 4 6 8 10 12 14 16 18 20 22
Drying time, d
Moi
stur
e co
nten
t, %
w.b
.
0mcentre0.5mcentre1mcentre1.5mcentre2mcentre2.5mcentre0.01m
0.5m
1m
1.5m
2m
2.5m
Depth
Figure 28. Progress of moisture content at centre of the static bin, Bin 4. Experiment (points and thin lines)
vs simulation (thick lines).
The picture is less difficult to read than for the stirred bin because the measured data follow a
simple pattern. Each of the simulated m.c. lines rose in turn as the wetting front was moved up,
carrying moisture from the wetter grain in the bottom of the bin, then fell as the drying front
developed and moved up and out of the surface. This behaviour matched the experimental data,
though the peaks in m.c. are more pronounced. The fall is steeper and the final m.c. is below the
measurements by the end of the experiment, by about 0.8% m.c. The time needed in simulation to
dry the experimental bin below 15% agreed with the experiment. The picture is very much the
same for the side of Bin B, Figure 29.

42
13
14
15
16
17
18
19
0 2 4 6 8 10 12 14 16 18 20 22
Drying time, d
Moi
stur
e co
nten
t, %
w.b
.
0mside0.5mside1mside1.5mside2mside2.5mside0.01m
0.5m
1m
1.5m
2m
2.5m
Depth
Figure 29. Progress of moisture content at side of the static bin, Bin 4. Experiment (points and thin lines) vs
simulation (thick lines).
Overall, the spread of m.c. that developed in the simulation between about day 5 and day 21 was
greater than that measured.because drying in the model took somewhat less time and depth than
in practice, resulting in a steeper drying front. This steepness, which has been noted in previous
work, would be important if the task were to predict m.c. at specific depths and times. But in terms
of the bed as a whole, the simulation completed drying in a similar time and to a similar moisture
level as was observed. The final m.c. was lower in the simulation, which is a consequence of the
relationship used in the mathematical model at the core of the simulation to describe the
equilibrium relationship between moist air and moist grain. Several relationships for this air-grain
property are available from the literature and an alternative, and entirely suitable, relationship was
tried in this case to find out if its use would improve the model’s fit to the data. The result was a
lower final m.c., i.e. worse agreement with the experiment. This suggested that the air-grain
equilibrium equation used in the simulation was at least a satisfactory one.
Air temperatures measured in the grain bed for Bin 3 are shown in Figure 30, for a 5 day period
from 12d. This shows the diurnal change in the temperature in the duct, followed by those in the
grain bed.

43
10
12
14
16
18
20
22
12 13 14 15 16 17
Time, d
Tem
pera
ture
, C
Duct
2.1 m
1.8 m
1.5 m
1.2 m
0.9 m
0.6 m
0.3 m
Surface
Stirreron/off
Depth
Figure 30. Measured temperatures at centre of stirred bin, Bin 3.
A lag can be seen between a change in the duct and the corresponding change in each level in the
bed, as the temperature change propagated up through the grain. Stirring was done during days
13 and 16, most clearly shown in the disturbance of the temperature at the surface level. It is clear
that the temperature in the bed very quickly recovered its characteristic pattern after stirring. The
simulated temperatures for comparison are in Figure 31, and show a very similar pattern, the
temperatures in the grain following the duct temperatures with a time lag. Stirring resulted in only a
small and short-lived disturbance to this pattern. There is good agreement between the simulated
and measured temperatures.
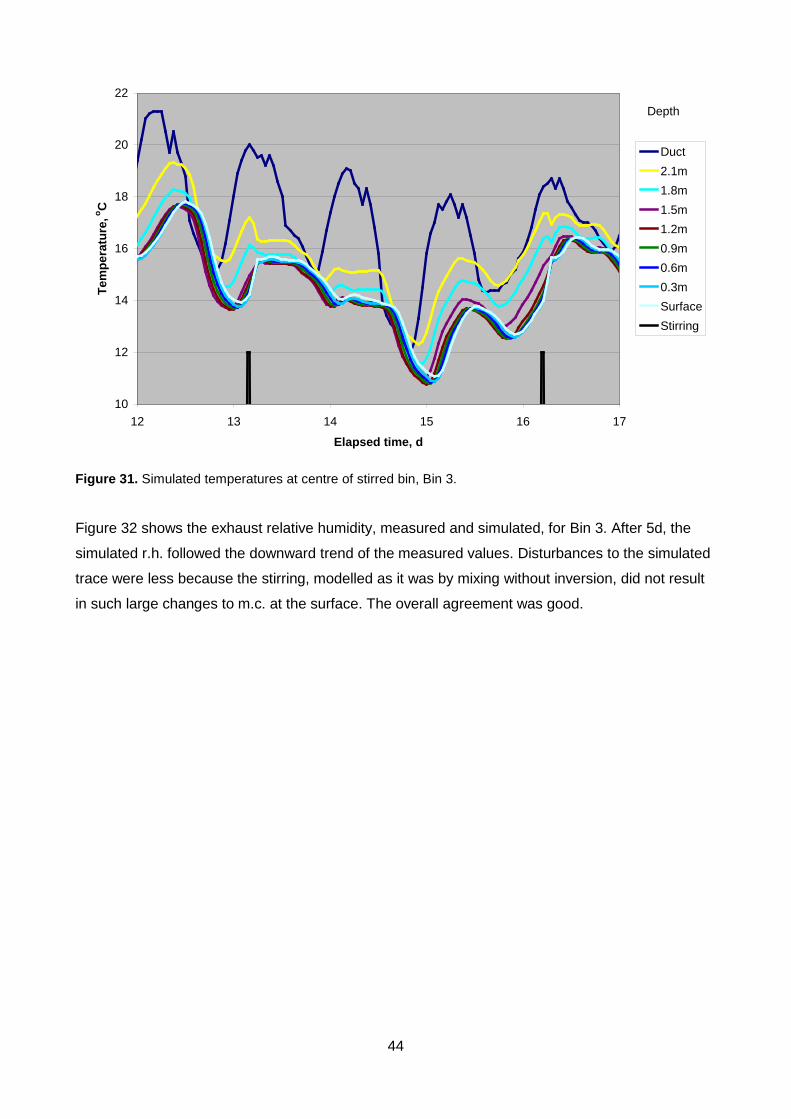
44
10
12
14
16
18
20
22
12 13 14 15 16 17
Elapsed time, d
Tem
pera
ture
, oC
Duct2.1m1.8m1.5m1.2m0.9m0.6m0.3mSurfaceStirring
Depth
Figure 31. Simulated temperatures at centre of stirred bin, Bin 3.
Figure 32 shows the exhaust relative humidity, measured and simulated, for Bin 3. After 5d, the
simulated r.h. followed the downward trend of the measured values. Disturbances to the simulated
trace were less because the stirring, modelled as it was by mixing without inversion, did not result
in such large changes to m.c. at the surface. The overall agreement was good.

45
50
55
60
65
70
75
80
85
90
95
100
0 5 10 15 20 25 30 35 40
Drying time, d
Exha
ust r
elat
ive
hum
idity
, %
Measured r.h.Simulated r.h.Stirring event
Figure 32. Relative humidity of exhaust air from stirred bin, Bin 3, versus time. Measured and simulated
traces are shown.
For Bin 4, Figure 33 shows agreement was less good between simulated and measured r.h.
versus drying time in that the measured r.h. showed a rise as the moisture lower in the bed was
lost from the bed, but in the simulated bed this moisture was lost more gradually such that the r.h.
stayed around the initial level for longer, before falling as the main drying front reached the surface.
The overall result, in terms of moisture lost in the experimental time, was satisfactory. The
difference may have resulted from the fact that the bottom of the bin, holding the 5t of wetter grain,
is a tapering shape with two air ducts across it. Because of this shape, airflow in this zone is not
the simple, one-dimensional upward flow that is modelled.

46
55
60
65
70
75
80
85
0 5 10 15 20 25
Drying time, d
Exha
ust r
elat
ive
hum
idity
, %
Simulated
Measured
Figure 33. Relative humidity of exhaust air from the static bin, Bin 4, versus time. Measured and simulated
traces are shown.
Because m.c. of grain in the two bins was not the same, direct comparison is not meaningful. So,
to allow some comparison, the static bin was simulated with the initial m.c. of the stirred one, i.e.
uniform m.c. of 20.5%. Small changes in other parameters, e.g. airflow and bulk density, were
made to make the two bins’ starting conditions very similar. Results are shown in Figure 34.

47
13
14
15
16
17
18
19
20
21
22
0 5 10 15 20 25 30 35 40
Drying time, d
Moi
stur
e co
nten
t, %
w.b
.
Av m.c. stirred
Surface m.c. stirred
Av m.c. unstirred
Surface m.c. unstirred
Figure 34. Simulated average and surface m.c. versus time, for the stirred bin and the static bin with same
starting starting condition.
Drying was simulated until the weather data ran out, with the result that grain in the static bed
rewetted in damper weather after 25d. The average m.c. of the stirred and static treatments
followed the same path until 10d when the drying rate of the stirred treatment slowed. The result
was that the static treatment reached 14.5% m.c. in 18.7d while the stirred treatment took 29.5d.
The surface m.c. lines show that the m.c. of the static bed remained close to its initial value while
the stirred surface started to dry after 5d. As previously noted, this was because air leaving the
stirred bed was less humid and thus did less drying.
Reviewing this third stage of validation, it is clear that the simulation predicted sufficiently well the
drying times and final moisture content of the grain in both stirred and static bins. Because the
drying time was well predicted, the fuel and electricity use would also be, as they are the product of
running time and heater and fan power. Prediction of moisture content within the bed during drying
was good although the drying front was predicted to be steeper than measured, a difference
reflected in the exhaust relative humidity. Despite this, the experiment confirmed the predicted
difference in exhaust humidity over time between stirred and static beds. It is concluded that the
measurements supported simulated drying, both with stirring and without, sufficiently well for the
model to be used with confidence in the near-ambient conditions of the experiment.

48
3.3.3. Stage 3 - validation against published dataset for drying with elevated air temperature
Next, the validity of the model at an elevated air temperature was tested using published
measurements on a circular bin of capacity about 100t fitted with a stirring system (McLean, 1993).
Two sets of measurements are given but detailed study of the first set revealed an inconsistency in
the data – insufficient energy use was recorded to raise the temperature of the reported airflow by
the measured temperature rise. Given that the energy use or airflow was incorrect, the first data
set was of little value, so only the second set was used. This was the more interesting case
because it used a large temperature rise. Drying air was heated to about 38oC which would result
in serious overdrying near the air inlet of a static bed.
86t of wheat in a bed of 4.57m depth and at a uniform m.c. of 18.6% w.b. was stirred continuously
and dried to an average m.c. of 14.4%, as measured by sampling when the bin was discharged.
Air temperature was raised from ambient to a constant 38.1oC by a propane heater. An airflow of
0.049 m3/(s.t) was used, close to that recommended for near ambient drying. The average r.h. of
the heated air was 22.7% but no diurnal variation is reported so the air condition had to be
assumed to be constant for purposes of simulation. No measurements from within the bed were
reported and so performance from the simulation was compared with reported overall performance
measures, Table 1.
Table 1. Comparison of drier performance from McLean (1993) and simulation.
Drying time to
measured final
m.c., h
Energy use (as
propane), MJ
Energy use (as
electricity for fan and
stirrers), MJ
Moisture
range, %
points
Static pressure
needed in plenum
chamber, Pa
Experiment 73 19380 2900 5.8 1500
Model 77 18840 2960 7.7 1560
Agreement was very good on drying time to the reported final m.c., for the energy used for air
heating (propane) and for the electrical energy used by the fan and stirring system. The range in
m.c. from the simulation was wider but sampling on discharge, the method used in the experiment,
would have resulted in some mixing so the extremes would not have been maintained, whereas
the moisture values were well defined in the simulation. Pressure drop through the bed was very
well predicted. These results show the model is able to predict drying with stirring at air
temperatures raised considerably above ambient levels.
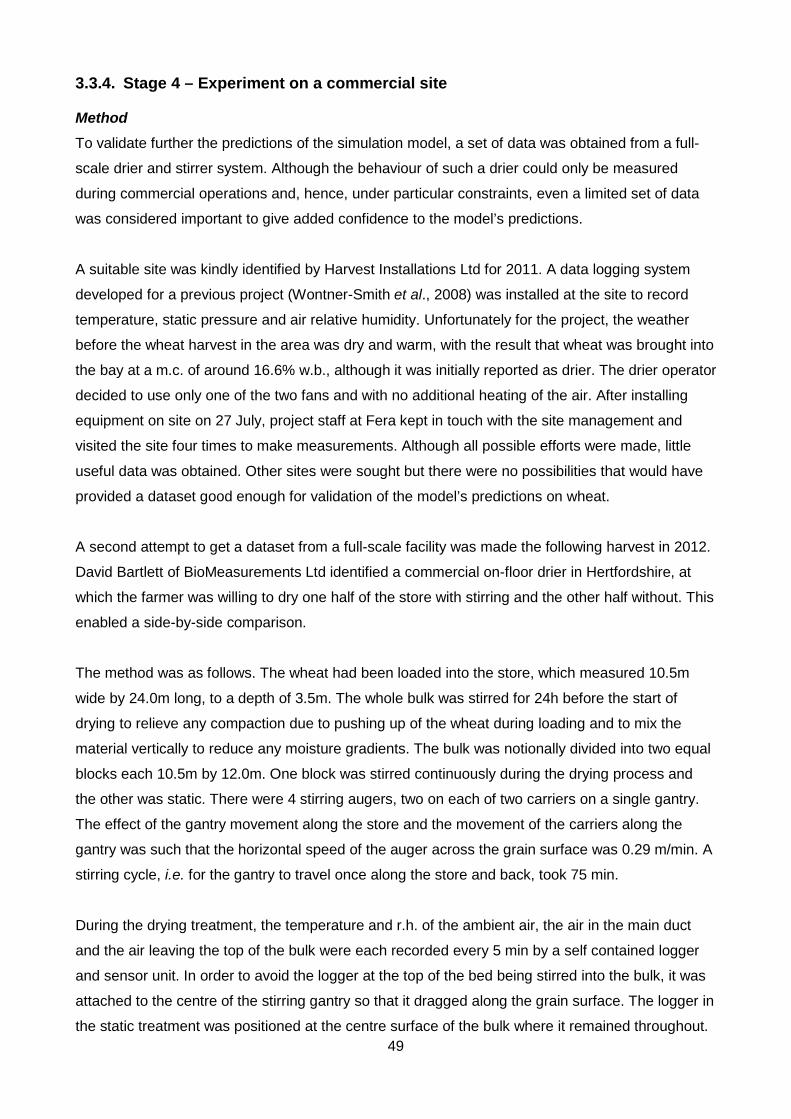
49
3.3.4. Stage 4 – Experiment on a commercial site
Method To validate further the predictions of the simulation model, a set of data was obtained from a full-
scale drier and stirrer system. Although the behaviour of such a drier could only be measured
during commercial operations and, hence, under particular constraints, even a limited set of data
was considered important to give added confidence to the model’s predictions.
A suitable site was kindly identified by Harvest Installations Ltd for 2011. A data logging system
developed for a previous project (Wontner-Smith et al., 2008) was installed at the site to record
temperature, static pressure and air relative humidity. Unfortunately for the project, the weather
before the wheat harvest in the area was dry and warm, with the result that wheat was brought into
the bay at a m.c. of around 16.6% w.b., although it was initially reported as drier. The drier operator
decided to use only one of the two fans and with no additional heating of the air. After installing
equipment on site on 27 July, project staff at Fera kept in touch with the site management and
visited the site four times to make measurements. Although all possible efforts were made, little
useful data was obtained. Other sites were sought but there were no possibilities that would have
provided a dataset good enough for validation of the model’s predictions on wheat.
A second attempt to get a dataset from a full-scale facility was made the following harvest in 2012.
David Bartlett of BioMeasurements Ltd identified a commercial on-floor drier in Hertfordshire, at
which the farmer was willing to dry one half of the store with stirring and the other half without. This
enabled a side-by-side comparison.
The method was as follows. The wheat had been loaded into the store, which measured 10.5m
wide by 24.0m long, to a depth of 3.5m. The whole bulk was stirred for 24h before the start of
drying to relieve any compaction due to pushing up of the wheat during loading and to mix the
material vertically to reduce any moisture gradients. The bulk was notionally divided into two equal
blocks each 10.5m by 12.0m. One block was stirred continuously during the drying process and
the other was static. There were 4 stirring augers, two on each of two carriers on a single gantry.
The effect of the gantry movement along the store and the movement of the carriers along the
gantry was such that the horizontal speed of the auger across the grain surface was 0.29 m/min. A
stirring cycle, i.e. for the gantry to travel once along the store and back, took 75 min.
During the drying treatment, the temperature and r.h. of the ambient air, the air in the main duct
and the air leaving the top of the bulk were each recorded every 5 min by a self contained logger
and sensor unit. In order to avoid the logger at the top of the bed being stirred into the bulk, it was
attached to the centre of the stirring gantry so that it dragged along the grain surface. The logger in
the static treatment was positioned at the centre surface of the bulk where it remained throughout.

50
Spot measurements of grain moisture profile were made at intervals during the drying process.
These samples were taken at 0.5m vertical intervals at the centre of each of the treatment blocks
using a plastic tube connected to a domestic vacuum cleaner. Three determinations of moisture
content were made on whole grain at each sampling point using a “Protimeter” moisture meter.
The meter was calibrated with reference to oven determinations made by Fera on samples of the
grain taken from the bulk, one of which was dried in an oven to reduce its m.c. to around 10% w.b.
On each visit to site to take moisture samples, spot measurements of air speed through the bulk
were made with a “Casella” rising disc anemometer.
The drying plan had been to use additional heat to speed the process but, because the weather
conditions were warm and dry, and the m.c. of the wheat was less than 17% w.b., the farmer
decided to use ambient air with no additional heating. Part way through the drying process the
weather became unfavourable so the process was stopped for nine days and was resumed when
the weather improved.
Results Measured air speed close to the grain surface was 3.70 m/min for static and 3.48 m/min for stirred
treatments on 23/8/2012, two days after the start of drying. Airflow was measured in this way on
three occasions, at 26h, 66h and 130h. It was stable until the last reading when it had risen by
between 5% (static) and 15% (stirred). It is difficult to measure the airflow in a stirred bed
accurately because of the unevenness of the surface created by the stirrer. The initial values were
used for the simulation, in which the airflow is required to be constant.
Although the whole store had been stirred for 24h before the initial samples of grain were taken,
moisture gradients were nonetheless present through the bed. This shows that further stirring
would be needed if uniformity of m.c. were required. The points in Figure 35 and Figure 36 show
m.c. at eight locations down through the bed, based on three determinations on each sample
extracted.
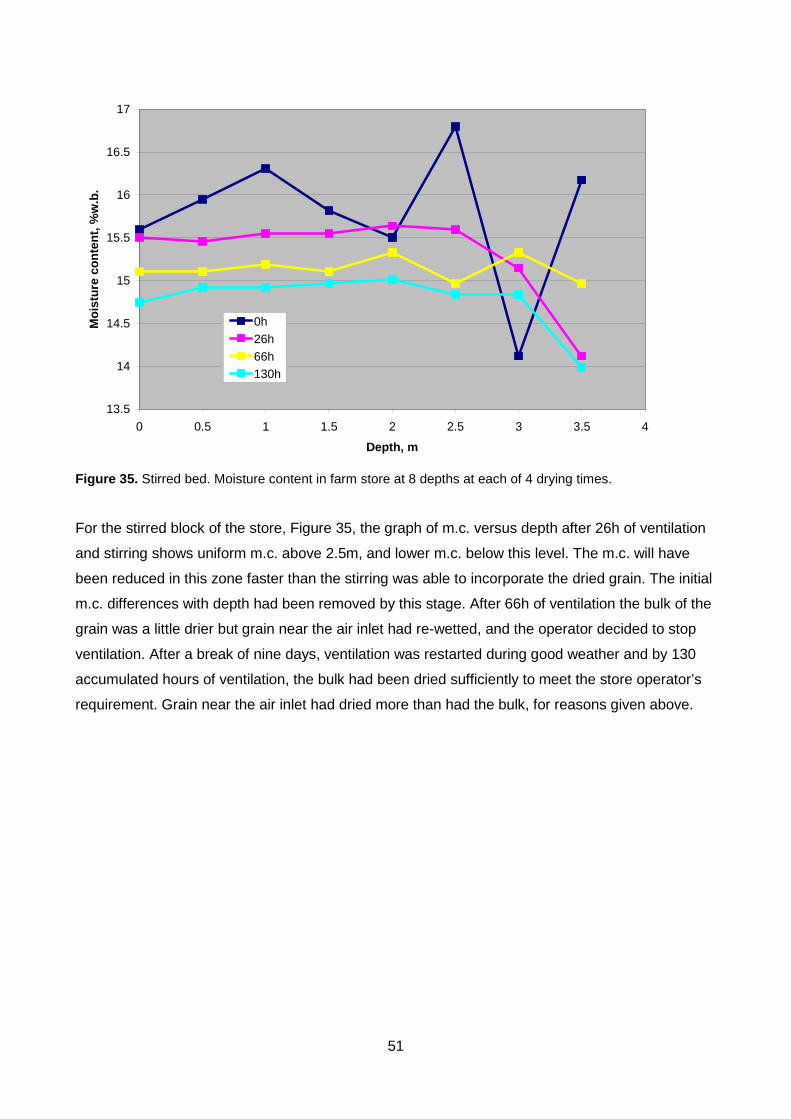
51
13.5
14
14.5
15
15.5
16
16.5
17
0 0.5 1 1.5 2 2.5 3 3.5 4
Depth, m
Moi
stur
e co
nten
t, %
w.b
.
0h26h66h130h
Figure 35. Stirred bed. Moisture content in farm store at 8 depths at each of 4 drying times.
For the stirred block of the store, Figure 35, the graph of m.c. versus depth after 26h of ventilation
and stirring shows uniform m.c. above 2.5m, and lower m.c. below this level. The m.c. will have
been reduced in this zone faster than the stirring was able to incorporate the dried grain. The initial
m.c. differences with depth had been removed by this stage. After 66h of ventilation the bulk of the
grain was a little drier but grain near the air inlet had re-wetted, and the operator decided to stop
ventilation. After a break of nine days, ventilation was restarted during good weather and by 130
accumulated hours of ventilation, the bulk had been dried sufficiently to meet the store operator’s
requirement. Grain near the air inlet had dried more than had the bulk, for reasons given above.

52
13.5
14
14.5
15
15.5
16
16.5
17
0 0.5 1 1.5 2 2.5 3 3.5 4
Depth, m
Moi
stur
e co
nten
t, %
w.b
.
0h26h66h130h
Figure 36. Static bed. Moisture content in farm store at 8 depths at each of 4 drying times.
For the static block of the store (Figure 36), the effect of ventilation was to move the initial moisture
profile up through and then out of the bed, and gradually to reduce the m.c. of the wettest grain. By
the end, 130h, the grain near the air inlet had reached much the same m.c. as in the stirred part of
the store, and the profile up through the bed was also similar to that in the stirred treatment. Drying
in both blocks was quite slow because heating was not used.
Measured exhaust conditions of temperature and relative humidity for the stirred and static blocks
of the store are shown in Figure 37. The r.h. trace for the stirred block shows a daily fluctuation
around a steady level of about 72%, a fluctuation probably due to the sensor being exposed to the
airspace above the grain as it was pulled over the grain surface by the stirrer gantry. The
temperature trace shows a smaller variation for the same reason. There was also a smaller
variation in r.h., not clearly visible in the graph, due to the close approach of a stirring auger to the
sensor. The exhaust r.h. for the static block started higher than in the stirred block, fell to a similar
level after about 24h of ventilation, then rose slowly until about 100h, then fell to match the stirred
bed condition.
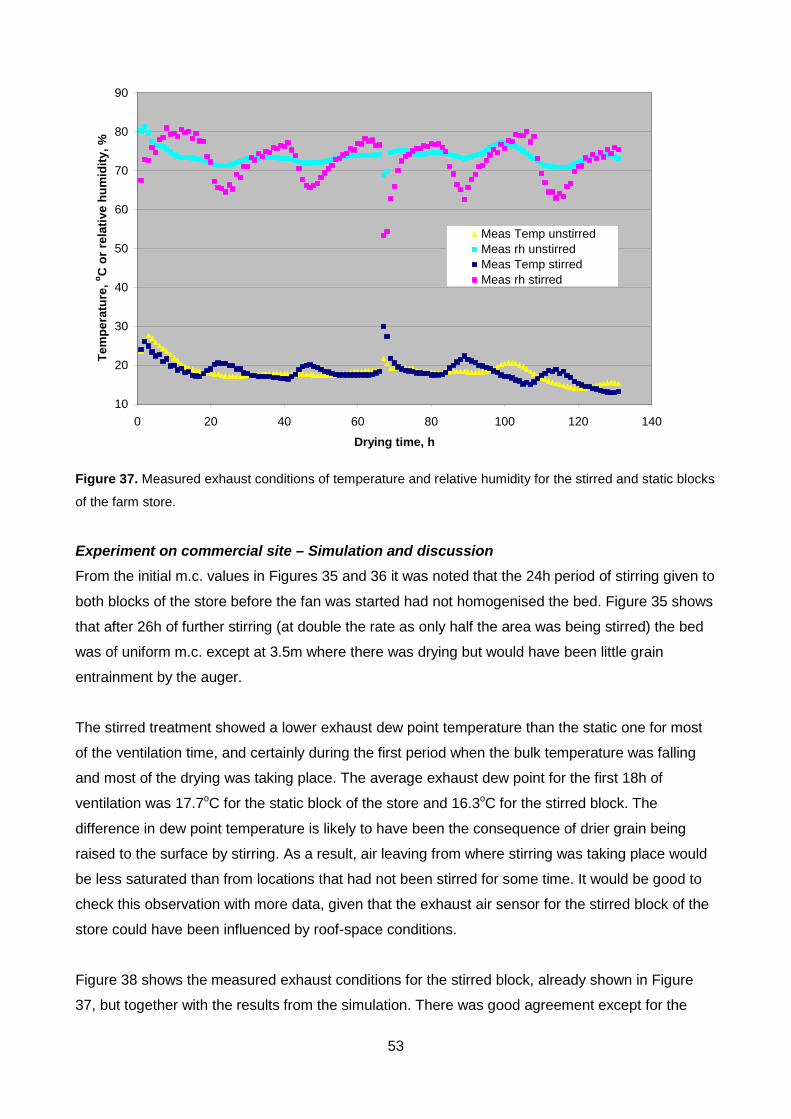
53
10
20
30
40
50
60
70
80
90
0 20 40 60 80 100 120 140
Drying time, h
Tem
pera
ture
, o C o
r rel
ativ
e hu
mid
ity, %
Meas Temp unstirredMeas rh unstirredMeas Temp stirredMeas rh stirred
Figure 37. Measured exhaust conditions of temperature and relative humidity for the stirred and static blocks
of the farm store.
Experiment on commercial site – Simulation and discussion From the initial m.c. values in Figures 35 and 36 it was noted that the 24h period of stirring given to
both blocks of the store before the fan was started had not homogenised the bed. Figure 35 shows
that after 26h of further stirring (at double the rate as only half the area was being stirred) the bed
was of uniform m.c. except at 3.5m where there was drying but would have been little grain
entrainment by the auger.
The stirred treatment showed a lower exhaust dew point temperature than the static one for most
of the ventilation time, and certainly during the first period when the bulk temperature was falling
and most of the drying was taking place. The average exhaust dew point for the first 18h of
ventilation was 17.7oC for the static block of the store and 16.3oC for the stirred block. The
difference in dew point temperature is likely to have been the consequence of drier grain being
raised to the surface by stirring. As a result, air leaving from where stirring was taking place would
be less saturated than from locations that had not been stirred for some time. It would be good to
check this observation with more data, given that the exhaust air sensor for the stirred block of the
store could have been influenced by roof-space conditions.
Figure 38 shows the measured exhaust conditions for the stirred block, already shown in Figure
37, but together with the results from the simulation. There was good agreement except for the

54
daily fluctuation, which was not present in the simulated values because effects of roof-space were
not simulated in the model.
10
20
30
40
50
60
70
80
90
0 20 40 60 80 100 120 140
Drying time, h
Tem
pera
ture
, o C o
r rel
ativ
e hu
mid
ity, %
Meas Temp stirredMeas rh stirredSim Temp stirredSim rh stirred
Figure 38. Measured and simulated exhaust conditions of temperature and relative humidity for the stirred
block of the farm store.
For the static bed, Figure 39 shows both measured and simulated values.

55
10
20
30
40
50
60
70
80
90
0 20 40 60 80 100 120 140
Drying time, h
Tem
pera
ture
, o C o
r rel
ativ
e hu
mid
ity, %
Sim Temp unstirredSim rh unstirredMeas Temp unstirredMeas rh unstirred
Figure 39. Measured and simulated exhaust conditions of temperature and relative humidity for the static
block of the farm store.
Temperatures were in good agreement but over the whole experiment, and particularly at the start,
the r.h. from the simulation was lower than that measured. The r.h. of the exhaust is determined by
the m.c. of the grain in the few layers near the surface, before it exhausts, because air and grain
will reach a moisture equilibrium. In the simulation, the grain m.c. profile through the bed,
measured in the experiment before ventilation started, was used as a starting condition. As it
happens, the m.c. of the sample from the surface differed between the two parts of the store – for
the stirred and static blocks the surface layer m.c. was 15.6 and 14.3%, respectively, although the
bed m.c. averages were much more similar for the two blocks, at 15.8 and 15.4%, stirred and static
respectively. The lower surface layer m.c. for the static block gave rise to a significantly lower
exhaust r.h. in the model. The difference between model and experiment reduced over the
ventilation time, suggesting that the m.c. measured at the surface may not have applied throughout
the top 0.25m of the bed, as had to be assumed.
The simulated m.c. at 3.45m depth, very near the bottom of the bed where air enters, is shown in
Figure 40, together with the r.h. measured in the inlet air duct (and used directly in the simulation).

56
13
14
15
16
17
0 20 40 60 80 100 120 140
Drying time, h
Moi
stur
e co
nten
t, %
w.b
.
40.0
45.0
50.0
55.0
60.0
65.0
70.0
75.0
80.0
85.0
90.0
Rel
ativ
e hu
mid
ity, %
m.c. at 3.45m depth
Measured duct rh, %
Figure 40. Relative humidity of air in the inlet duct and m.c. by simulation close to this depth.
The m.c. tends to follow the r.h. of the incoming air, as would be expected. There is a short lag
because adsorption and desorption take time, as the grain moves towards equilibrium with the air
condition to which it is exposed. Experimental m.c. data and simulated values for the stirred bed
are shown in Figure 41. For clarity the simulated value at 3.5m depth, shown in Figure 40, is not
shown in Figure 41.

57
14
14.5
15
15.5
16
16.5
17
0 20 40 60 80 100 120 140Drying time, h
Moi
stur
e co
nten
t, %
w.b
.Average32.521.510.50.05Average3.532.521.510.50
Depth
Figure 41. Experimental m.c. data (points) and simulated m.c. (lines) for the stirred block of the farm store.
The data show rapid drying over the first 26h, then slower to 66h and to the end of ventilation. Note
that the break in ventilation at 66h cannot be seen in the elapsed ventilation time. Once drying was
underway, the m.c. values were within a range of 0.5% points m.c. so overall there was good
mixing although there was some inversion, e.g. at 3m depth the m.c. at 26h was less than at 66h.
Simulated values converged rapidly and stayed together, showing good mixing by the model.
Drying was a little slower than measured after 26h and a difference of about 0.5% points m.c.
remained at the end of ventilation. This difference was due to the equation used in the model for
the moisture equilibrium between air and grain. An alternative, and equally valid, equation was
used to simulate this experiment, and the result was closer agreement. But as mentioned in the
analysis of Experiment B at Fera, this alternative equation gave significantly worse results in the
simulation of that experiment. It was concluded that the moisture equilibrium relationship used in
the simulation model was sufficiently good.
Even though the stirring in the farm trial was twice as intense as if the whole bed had been stirred,
stirring in the model produced a more uniform bed than measured in the farm trial. Recalling that,
in the Fera bin experiments, stirring in the model was less intense than in the experiment, these
results taken together suggest that stirring implemented in the model was sufficient to be effective
without being too intense.

58
Figure 40 also describes the static block of the store, in that the duct conditions were the same and
the grain at 3.45m depth was not entrained by the stirring auger. The experimental data for the
static side are shown in Figure 42.
13
14
15
16
17
0 20 40 60 80 100 120 140Drying time, h
Moi
stur
e co
nten
t, %
w.b
.
Average32.521.510.50.05Average3.532.521.510.50
Depth
Figure 42. Experimental m.c. data (points) and simulated m.c. (lines) for the static block of the farm store.
Given that it was at a m.c. less than 16% m.c., the wheat started, and remained during the
experiment, close to equilibrium m.c. with typical ambient conditions. Hence, changes in the r.h. of
the incoming air lead to drying and rewetting fronts being pushed up through the bed by the air.
These fronts caused the m.c. to move up and down, and are present in the simulated lines as well
as the measured data. This situation can be contrasted with the experiment in the Fera bin where,
once drying started in Bin B (Figure 28), the simulated lines all fell, in succession, until near the
end. Only at that stage was the grain close to equilibrium with the incoming air, and absorption as
well as desorption started to occur. Overall, the spread of the data points at each sampling time in
the simulation agrees with the data. The final m.c. samples shows that the experimental grain dried
about 0.4% points m.c. more than the simulation predicted, which was expected given the lower
exhaust r.h. from the model than measured. The discrepancy is small and is, as previously
discussed, much influenced by the model’s air-grain equilibrium relationship.
As in comparison of the two bins in Experiment B at Fera, direct comparison between the two
blocks of the store is not quite straightforward. Although the two blocks are very similar, the m.c.
near the surface differed between the stirred block and the static, the static being wetter. The

59
simulation for the static block was re-run, using the initial moisture profile through the bed from
samples taken from the block to be stirred. The airflows were also equalised by a minor
adjustment. The first period of ventilation showed only small differences so the results used to
draw Figure 43 were from the second period.
15.1
15.2
15.3
15.4
15.5
15.6
15.7
15.8
15.9
16
12 13 14 15
Elapsed time, d
Moi
stur
e co
nten
t, %
w.b
.
Av m.c. stirredAv m.c. unstirredSurface m.c. stirredSurface m.c. unstirred
Figure 43. Progress of average bed and bed surface m.c. by simulation of stirred block of farm store, and of
static block at same initial conditions.
The static block dried a little faster, shown by the average m.c. of the static block gradually falling
below that of the stirred block. The reason for this is clear from the surface m.c. traces. That of the
static block remained high during this second period whereas for the stirred block, the surface m.c.
followed that of the bed as a whole. The air exhausting from the stirred surface would therefore
have had a lower r.h. at much the same temperature and so the bed dried slower.
In conclusion, farm-scale testing of the model, albeit in conditions of low moisture removal, did not
raise any doubts about its performance. Indeed, together with the data from the bin experiments,
the farm-scale work allowed the relationship between m.c. and air r.h. to be confirmed. And
although data for drying using significantly higher air temperature again was not obtained, this
aspect had been covered by simulation of published data.
Considering the validation work overall, agreement of the model with the data from the 25t wheat
drying experiment at Fera in 2010 was good in the important respects, particularly drying time,

60
approach to and level of final m.c. Validation against data from a stirred and a static bin at Fera in
2012 showed that the model predicted the overall drying behaviour of both bins well and, although
stirring in the model was less vigorous than in practice, the accumulated effect was sufficient to mix
the bed to a similar degree. The drying fronts in the model were steeper than measured but this did
not affect drying time, which was well predicted. Because the wheat on the test farm site in 2012
again needed little drying, data could not be had for drying using significantly higher air
temperature. Testing of the model in these low moisture removal conditions did not raise any
doubts about its performance, and indeed together with the data from the bin experiments, allowed
the relationship between m.c. and air r.h. to be confirmed. Simulation of a published experiment in
which an 86t bin of wheat was stirred and dried with air at a higher temperature gave results which
agreed very well with the measured overall performance. Because the drying time was well
predicted, the fuel and electricity use were also, as they are the product of running time and heater
and fan power. Overall, the model proved to be sufficiently good over the range of m.c., air
temperature and stirring rate encountered in the experiments. Because it is based on well-
understood physics of drying, the model, it was concluded, could be used with confidence over a
wider range than found in validation experiments.
3.4. Simulation runs and results
Milestone 3 and 4. “Run a range of simulations to explore the effectiveness and cost saving potential of stirring in normal on-floor drying. Simulate a wide range of options to study performance and hence potential for energy and capital cost saving:- single self-propelled auger to a multi-auger system, range of strategy (normal and significantly higher air temperature, increasing bed depth, temporary over-drying)” 3.4.1. Basis of this study
In this study, simulations of various drying systems were run to produce data on their likely
performance under a wide range of conditions. By comparing performance in various ways, the
benefits and drawbacks of one system versus another, or of one choice of operating condition
versus another, can be shown.
A model such as Storedry cannot predict drying accurately in every aspect, but the performance
predictions are likely to be substantially accurate because the model describes all the important
physical and biological phenomena occurring during drying in quantitative ways that reflect the
physical laws describing such phenomena. Changes in drier performance as a result of changes in
the inputs to the model are likely to reflect how the real-life drying system would respond.
Predictions from Storedry for very specific circumstances are compared with real-life data in this

61
report to test the model, and these give confidence that the predictions are correct. The sound
basis of the model, validated by these checks, allow it to be used over a wide range of
circumstances in a way that would be impossible by physical experiment.
Given that the basis of this work is the comparison of one drying system with another to find out
how performance can be improved, it is important to define the basis of this comparison. An
improved system of drying would be one that would save cost (capital cost and/or recurring cost),
save drying time, or produce improved grain quality, or some combination of these three. For two
drying approaches to be comparable for cost, time and grain quality, in both approaches the grain
bed would have to be dried to the required average m.c. for the batch, the wettest areas of the bed
would not be excessively moist at the end point, and these targets would be reached with a high
degree of certainty, irrespective of the weather conditions in a particular season.
In this work, each drying condition was simulated using 20 years of historical weather data so the
success could be expressed as the number of years out of the 20 in which all the targets were
reached. Success was, therefore, formally defined as meeting a target of 14.5% m.c. wet basis for
the average of the whole bed and of 15.0% m.c. for the wettest part of the bed, without spoilage,
within an elapsed time of 2 months, and in a sufficiently high proportion of the 20 years simulated.
19 or 20 out of 20 years was defined as “highly successful”, 15 to 18 out of 20 years as
“moderately successful”.
Spoilage was assessed using a spoilage index as described in the report of HGCA project RD-
2004-3133 (Bruce et al., 2006). It involves calculating how much of a ‘safe time before risk of
fungal toxins’ has elapsed, a calculation which depends on the m.c. and temperature of each part
of the grain bed. As was found in that report, if this index is not allowed to rise above 2.0, the grain
is not at risk of the main fungal toxin of concern in the UK, Ochratoxin A.
The simulations reported here allow direct comparison of a stirring drier with a drier in which the
bed is static. The main measures of performance were the drying time to the two m.c. targets
described above, the energy used in the form of electricity (for the drying fan, the extraction fan(s)
for the roof space and for the stirring system), fuel used for air heating, here assumed to be
propane gas. The costs of each were calculated based on assumed prices per unit of energy of
both electricity and gas and the net calorific value for propane (see Appendix A). Where the
average m.c. was below the target figure, the cost of lost weight of grain for sale was added to give
a total running cost. A value of grain at 14.5% was assumed (see Appendix A). Several measures
of performance were calculated to make comparison easier, such as overall cost per tonne of dried
grain and electricity cost per % moisture removed per dried tonne. Tables 10 to 30 (Appendix B)
give starting conditions and drying performance under those conditions.

62
Given that a well designed and operated drier can work well without the bed being stirred, a
decision to fit a grain stirring system to an existing drier or to specify a stirring system as part of a
new drier, must take into account the likely costs and benefits. Part of the purpose of this project
was to calculate any benefits of using stirring while drying so that such investment decisions could
be better informed. Such an investment decision should also consider the benefits of alternative
improvements to a drier that could be effective in improving performance, such as a replacement
fan or heater, or improved controls. It was beyond the scope of this project to consider all the
possible improvements, particularly because the calculations would differ between driers and
between growers. For example, one drier may have too low an airflow to be sufficiently effective so
a larger fan may be the most effective use of capital, while another may benefit most from a new
relative humidity sensor to improve control of the air conditions in the plenum. Savings in drying
time are also of differing value. In one case, a saving in drying time may be of low importance
because the grower stores the grain in situ once it has been dried, whereas another grower may
wish to dry several batches, in which case saving drying time may be crucial to his operations.
In this work, it was assumed that the static bed drier was designed such that, with a bed depth of
3m, the fan would deliver an airflow close to that recommended (Anon., 2011) of 180 m3/(h.t).
When a deeper bed was used, the airflow would be reduced because of the additional resistance,
and conversely it would be increased at bed depths less than 3m. This is how the airflow in a real-
life drier changes, as the resistance of the grain bed interacts with the air delivery capability of the
fan.
There are many approaches to controlling the fan and heater in a bulk drier. For example, r.h.
control of fan only with no additional heat, through continuous use of the fan with a modest size of
heater simply switched on, or auto control of heating aimed at regulating the r.h. in the plenum to a
preset level. Advanced strategies involve sampling the grain and reducing in stages the setpoint for
plenum r.h. as the m.c. in the bed falls. Each approach balances equipment (and hence capital
cost), energy use and duration of drying, while trying to give even drying and avoid risk of spoilage.
In this work, for comparison with a stirred bed, a strategy for fan and heater control for static bed
drying was needed that was as effective as possible without excessive capital cost. If a modest
capital investment in a larger fan or a larger heater, for example, would make a standard static bed
drier more effective, then this more effective drier should be the one to be compared with the
stirred bed drier. This approach is justified on the basis that one or more such improvements would
be cheaper than the option of installing a stirring system. A range of simulation runs was therefore
done to determine an effective strategy for fan and heater control in the static bed drier.

63
When comparing the two drying systems, it was expected that both would be successful to a high
degree in relatively easy drying scenarios, (successful being defined above as reaching the m.c.
targets within constraints of drying time and spoilage risk in a high proportion of the 20 years
simulated). Where both were successful, the benefits and disbenefits (including costs and others
such as uneven drying) were tabulated and some detailed comparisons made at particular
performance points.
But it was also apparent that in some scenarios, drying might be successful when grain stirring was
used but not without it (or indeed the converse). The comparison then highlights the extended
range of, for example, initial m.c. or bed depth over which the better system would allow drying to
be carried out with confidence. The performance of the successful drying system is tabulated and
commented on.
The simplest comparison of the two drying systems was where the only difference was the
availability of the stirring system on otherwise identical driers. All the other parameters, in particular
the fan characteristics, fan and heater control policy, bed depth and initial m.c., were the same for
both. This would reflect the situation where a stirring system is ‘retro-fitted’ to an existing drier. The
comparison then highlights whether and how a stirring system could be used to save marginal
cost, to save drying time, to minimise risk of spoilage or a combination of all three, when compared
with a static bed drier of the same, standard design.
A further comparison needed to be made, of a static bed drier with a drier designed from the outset
to operate with a stirring system, rather than using standard design parameters, and thus exploiting
to the best the potential of grain stirring. Again, comparison highlights whether and how a stirring
drier run at its best operating conditions could be used to save marginal cost, to save drying time,
to minimise risk of spoilage or a combination of all three, when compared with a static bed drier.
3.4.2. Simulations carried out
Table 3 gives details of the series of simulations carried out. Results are given in Tables 10 to 30
(Appendix B)

64
Table 3. Summary of simulation runs. Where there is more than one set of runs in an Approach, the factor
that was changed is in bold type.
Approach Results Specification
Static bed Table 10 Policy 18, 62% plenum air r.h. target, 15 Aug start, TC5 fan, static
bed
Approach 0 Table 11 Policy 18, 62%, 15 Aug, TC5 fan, bed stirred throughout
Static bed Table 12 Policy 18, 62%, 15 Sep start, TC5 fan, static bed
Approach 0 Table 13 Policy 18, 62%, 15 Sep, TC5 fan, bed stirred throughout
Approach 1 Table 14 Policy 18, 62%, 15 Aug, TC5 fan, bed only stirred once average mc
target reached
Approach 2 Table 15 Policy 18, 62%, 15 Aug, TC5 fan, bed stirred until max mc <18% then
not stirred then stirred once average mc target reached
Approach 3 Table 16 Policy 18, 62%, 15 Aug, TC5 fan, half the number of augers for given
bed area, stirred throughout
Approach 4 Table 17 Policy 18, 62%, 15 Aug, TC4 (smaller fan), bed stirred throughout
Table 18 Policy 18, 62%, 15 Aug, TC6 (larger fan), bed stirred throughout
Approach 5 Table 19 Policy 24, 15 Aug, TC5 fan, 20oC in plenum, stirred throughout +
extraction fan
Table 20 Policy 24, 15 Aug, TC5 fan, 30oC in plenum, stirred throughout +
extraction fan
Table 21 Policy 24, 15 Aug, TC5 fan, 40oC in plenum, stirred throughout +
extraction fan
Table 22 Policy 24, 15 Aug, TC5 fan, 50oC in plenum, stirred throughout +
extraction fan
Approach 6 Table 23 Policy 24, 15 Aug, TC4 fan, 20oC in plenum, stirred throughout +
extraction fan
Table 24 Policy 24, 15 Aug, TC4 fan, 30oC in plenum, stirred throughout +
extraction fan
Table 25 Policy 24, 15 Aug, TC4 fan, 40oC in plenum, stirred throughout +
extraction fan
Table 26 Policy 24, 15 Aug, TC4 fan, 50oC in plenum, stirred throughout +
extraction fan
Approach 7 Table 27 Policy 24, 15 Aug, 20oC in plenum, 1 TC3 fan & no stirring for 24h
then 2 TC3 fans and stirred, 180m2 bed + extraction fan
Table 28 Policy 24, 15 Aug, 30oC in plenum, 1 TC3 fan & no stirring for 24h
then 2 TC3 fans and stirred, 180m2 bed + extraction fan
Table 29 Policy 24, 15 Aug, 40oC in plenum, 1 TC3 fan & no stirring for 24h
then 2 TC3 fans and stirred, 180m2 bed + extraction fan
Table 30 Policy 24, 15 Aug, 50oC in plenum, 1 TC3 fan & no stirring for 24h
then 2 TC3 fans and stirred, 180m2 bed + extraction fan

65
In each of the 21 sets of runs, all combinations of five values of initial m.c., (24, 22, 20, 18 and
16%) and three of grain bed depth (4, 3 and 2m) were simulated. Weather conditions were those
from Waddington, Lincolnshire for the 20 years 1951-1970. Runs started on the 15th August each
year except where a comparison with starting on 15th September was required. Other conditions
are described in Table 3 and in Appendix A. In total, 6300 simulation runs were carried out.
Storedry produced 74 output values for each run, which were studied to find out whether or not the
run was successful. Success was defined as meeting a target of 14.5% m.c. for the average of the
whole bed and of 15.0% m.c. for the wettest part of the bed, without spoilage (spoilage index <2.0),
within an elapsed time of 2 months, and in 19 or all 20 of the 20 years simulated. For successful
runs, the average value of the most important measures of performance, averaged over the
successful 19 or 20 years, were tabulated.
3.4.3. Results and discussion
1. Finding a good control policy for fan and heater as the basis of comparison of stirred and static bed driers The performance of three such policies was investigated, all based on regulating the r.h. of the air
in the plenum by adding heat with a propane burner. This heat was in addition to the small heating
effect of the fan. This type of control, included in the approaches listed in the GSG 2nd edition (P10,
Anon., 2003), was chosen here because it gave a good balance between effectiveness and cost.
The three policies, using the numbering in Storedry, were:-
Policy 18, adding heat to reduce plenum r.h. to 62%, if achievable with the available heater power,
or accepting a higher r.h. with the maximum heater power being used. During warm, dry weather,
air at an r.h. of lower than 62% could occur.
Policy 19A. As above but making the r.h. setpoint dependent on the average m.c of the whole
bed. The setpoint r.h. was stepped down from 100% r.h. (i.e. no heating permitted) at 20% m.c. or
above, via 83% r.h. between 20 and 18% m.c. and 72% r.h. between 18 and 16% m.c., to 62% r.h.
below 16% m.c.
Policy 19. As Policy 19A but the m.c. used was the spot value at a depth of 0.3m from the surface.
Other policies were simulated, such as drying with continuous use of fan only or with a small
heater, or cutting off the fan at high atmospheric r.h., but these were found to give too few years of
successful drying to be considered suitable.
To compare the performance of these control policies, drying was simulated using Policies 18, 19
and 19A with historical weather data for Waddington, Lincs. Drying was started rather later in the
season, on 15th September, to ensure the conditions were sufficiently challenging. A bed depth of
3m, an airflow of 180 m3/(h.t) or 0.05 m3/(s.t), and initial m.c. values from 24 to 16% in 2% steps
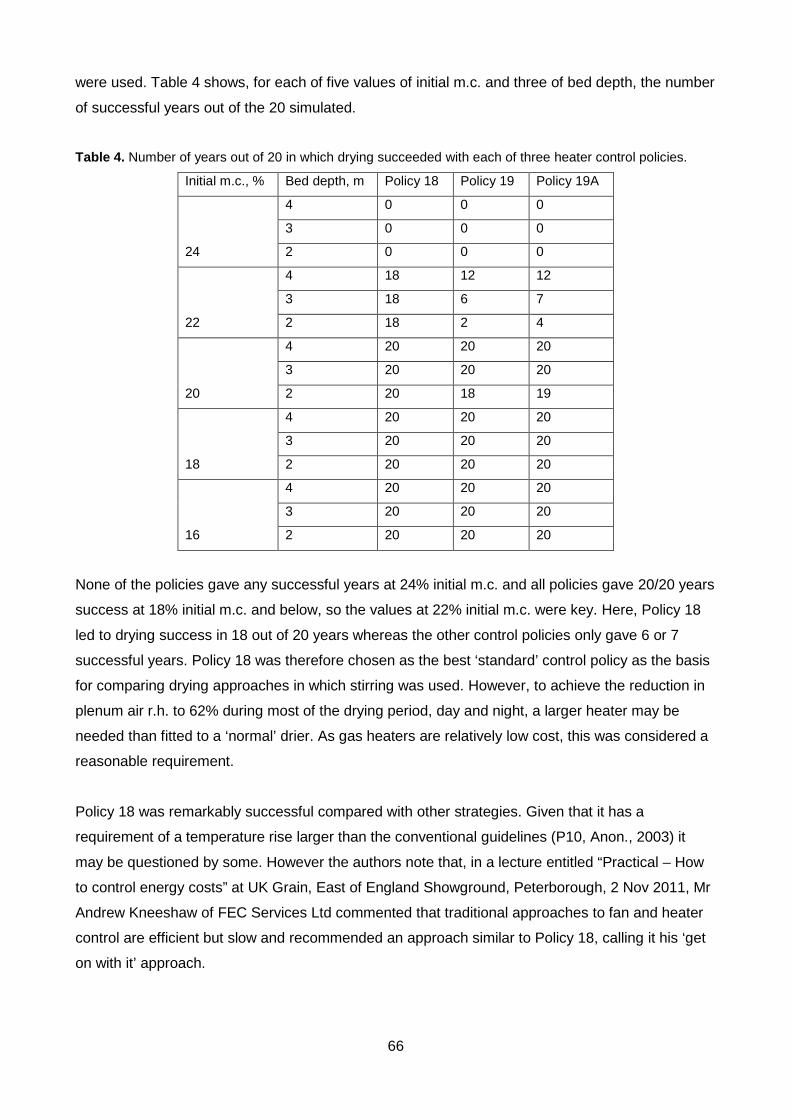
66
were used. Table 4 shows, for each of five values of initial m.c. and three of bed depth, the number
of successful years out of the 20 simulated.
Table 4. Number of years out of 20 in which drying succeeded with each of three heater control policies.
Initial m.c., % Bed depth, m Policy 18 Policy 19 Policy 19A
24
4 0 0 0
3 0 0 0
2 0 0 0
22
4 18 12 12
3 18 6 7
2 18 2 4
20
4 20 20 20
3 20 20 20
2 20 18 19
18
4 20 20 20
3 20 20 20
2 20 20 20
16
4 20 20 20
3 20 20 20
2 20 20 20
None of the policies gave any successful years at 24% initial m.c. and all policies gave 20/20 years
success at 18% initial m.c. and below, so the values at 22% initial m.c. were key. Here, Policy 18
led to drying success in 18 out of 20 years whereas the other control policies only gave 6 or 7
successful years. Policy 18 was therefore chosen as the best ‘standard’ control policy as the basis
for comparing drying approaches in which stirring was used. However, to achieve the reduction in
plenum air r.h. to 62% during most of the drying period, day and night, a larger heater may be
needed than fitted to a ‘normal’ drier. As gas heaters are relatively low cost, this was considered a
reasonable requirement.
Policy 18 was remarkably successful compared with other strategies. Given that it has a
requirement of a temperature rise larger than the conventional guidelines (P10, Anon., 2003) it
may be questioned by some. However the authors note that, in a lecture entitled “Practical – How
to control energy costs” at UK Grain, East of England Showground, Peterborough, 2 Nov 2011, Mr
Andrew Kneeshaw of FEC Services Ltd commented that traditional approaches to fan and heater
control are efficient but slow and recommended an approach similar to Policy 18, calling it his ‘get
on with it’ approach.

67
2. Comparison of stirred bed with static bed A comparison was made between a static bed drier and a drier with a continuously stirred bed.
Results for the static bed drier are presented in Table 10 and for the stirred drier in Table 11
(Appendix B). Drying was simulated using weather data from Waddington, Lincs, starting 15
August each year for 20 years. Other than the use throughout of stirring, both driers and conditions
were identical. In particular, for both driers the heater was controlled using Policy 18 with a setpoint
r.h. for plenum air of 62%.
First we compare drying success for combinations of initial m.c. and bed depth, based on
achieving all drying targets in either 19 or 20 years out of 20. This shows where stirring made a
crucial difference to drying success by avoiding risk of OA. The results are made easier to interpret
because there was a sharp upper limit to allowable bed depth. Particular values in Tables 10 and
11 illustrate the success of static bed and stirred bed drying on spoilage index. At 24% initial m.c.
and at 2m bed depth, both systems were successful. At this relatively shallow depth, a greater
airflow per tonne of grain was delivered by the fan than the recommended flow. More moisture was
removed from the bed per hour with the result that the static bed dried fast enough for the risk of
spoilage to be avoided. At depths of 3 and 4m however, the grain near the surface of the static bed
reached the ‘at risk’ condition before it had dried, so drying with a static bed failed in all 20 of the
years simulated. Stirring allowed the 3m, 24% bed to dry successfully in all 20 years, but an
increase in bed depth to 4m resulted in only 6 years success. Starting at 22% m.c., a 4m bed was
successfully dried with stirring but in only 2 years could the static bed dry successfully. As a
generalisation, for the stirred bed the maximum initial m.c. for drying to be successful was 2%
(m.c.) higher than for static bed both at 4m and at 3m.
Table 5 shows the results when drying grain at relatively high initial m.c. in deep beds. For a static
bed there was a sharp fall in success, from 19 to 2 years out of 20, between 3 and 4m bed depth at
22 % initial m.c. and between 2 and 3m at 24%. Similarly for a stirred bed at 24% initial m.c., only 6
years out of 20 were successful at 4m compared with 20 at 3m. The spoilage index values show
are averages of all the 20 years simulated to give an overall view of the drying treatment, but each
year was judged individually, success being when the index was less than 2.0.

68
Table 5. Effect of stirring on spoilage index and drying success. Spoilage index in bold shows where risk of
OA was too great.
Continuous fan, plenum
target r.h. = 62%
Spoilage index (and
successful drying years out of
20)
Initial grain m.c. and bed
depth Static bed Stirred bed
22%, 3m 1.6 (19) 0.89 (20)
22%, 4m 2.3 (2) 1.25 (20)
24%, 2m 1.7 (19) 0.94 (20)
24%, 3m 2.7 (0) 1.5 (20)
24%, 4m 3.7 (0) 2.1 (6)
Now we compare results for stirring and static bed where both approaches resulted in successful
drying. This comparison covers the range 24% initial m.c. at 2m bed depth, 22% at 2 and 3m, and
20, 18 and 16% at all three depths in Tables 10 and 11. In every case, stirred drying took longer to
achieve both the drying targets, i.e. average bed m.c. <=14.5% and maximum bed m.c. <=15.0%
and cost more per tonne of dried grain. However stirred drying gave significantly lower values of
spoilage index and resulted in less over-drying.
Where either drying system failed at high initial m.c., it was owing to spoilage having occurred
before moisture targets were met. The spoilage index had risen to be 2.0 or more, at which the
grain would be considered to be at risk from fungal toxins. From this description one might expect
a low spoilage index to be beneficial but this is not really the case, for the following reason.
Although a spoilage index much lower than 2 would leave a margin of safety, the risk from fungal
toxins is considered acceptably low provided the index is even marginally below 2. This is because
the condition that spoilage index be <2 is a “pass or fail” one. So a drying treatment that results in
a spoilage index well below 2 is no better in any practical, measurable way than one with a value
close to 2.
In static bed drying, when the target average m.c. of <=14.5% was reached, there was always a
very significant moisture gradient through the bed, such that the bottom of the bed was over-dried
to below target m.c. and the surface region was under-dried and, hence, still at risk. Hence, the
grain bed was not suitable for storage without further action. Drying was continued in all the
simulations until the target of the wettest layer being <=15% m.c. was reached. Stirring made the

69
bed more uniform so the wettest target was generally already achieved when the average m.c
target was reached. But when drying with a static bed, drying had to be continued for some time
after the average target was met to bring the wettest part of the bed, in the upper layers, below the
maximum m.c. target. This extra drying, done with the same plenum r.h. target of 62% resulted in
the lower part of the bed being over-dried. The costs of lost grain weight for sale, which were
included in the total costs of drying, were substantial for static bed drying. (The extra energy costs
to evaporate the addition water were also of course included, but in energy cost category.) The
total cost of drying included the value of the dry matter lost owing to respiration and activity of
fungi. The higher the initial m.c. of the grain, the higher was this dry matter loss, but it was never
more than 2% of total cost and less than 1% where the initial m.c. was less than 20% w.b. As it
was related to fungal activity, this element of cost responded to the various treatments much was
did the spoilage index.
Even given this over-drying element, overall cost was lower for static bed drying than for stirred
drying, and energy use was much lower. As the values of initial m.c. simulated were reduced, both
stirred and static bed driers showed a fall in energy use per tonne dried but static bed drying was
always lower in cost. Costs expressed as per % m.c. removed per dried tonne rose, especially
between starting at 18% and starting at 16%. This results from the extra difficulty of evaporating
water from drier grain as well as from the inefficiency with which the drying power of air is used in
drying lower m.c. grain.
Table 6 shows the drying time and costs for a 3m bed dried from 22% initial m.c. For the static bed
drier, this condition is at the limit for risk of fungal toxins, whereas for a stirred bed, the limiting
depth at this initial m.c. was 4m. All three conditions are shown. For the 3m bed depth, drying with
a stirred bed to the point where both drying targets were met (wettest m.c. <=15% and average
m.c. <=14.5%) took 46% longer than with a static bed. Electricity use was 91% greater, fuel cost
58% was more but over-drying cost was 88% lower. At 4m for the stirred bed, the electricity cost
was a little higher and the fuel cost was a little less than at 3m.
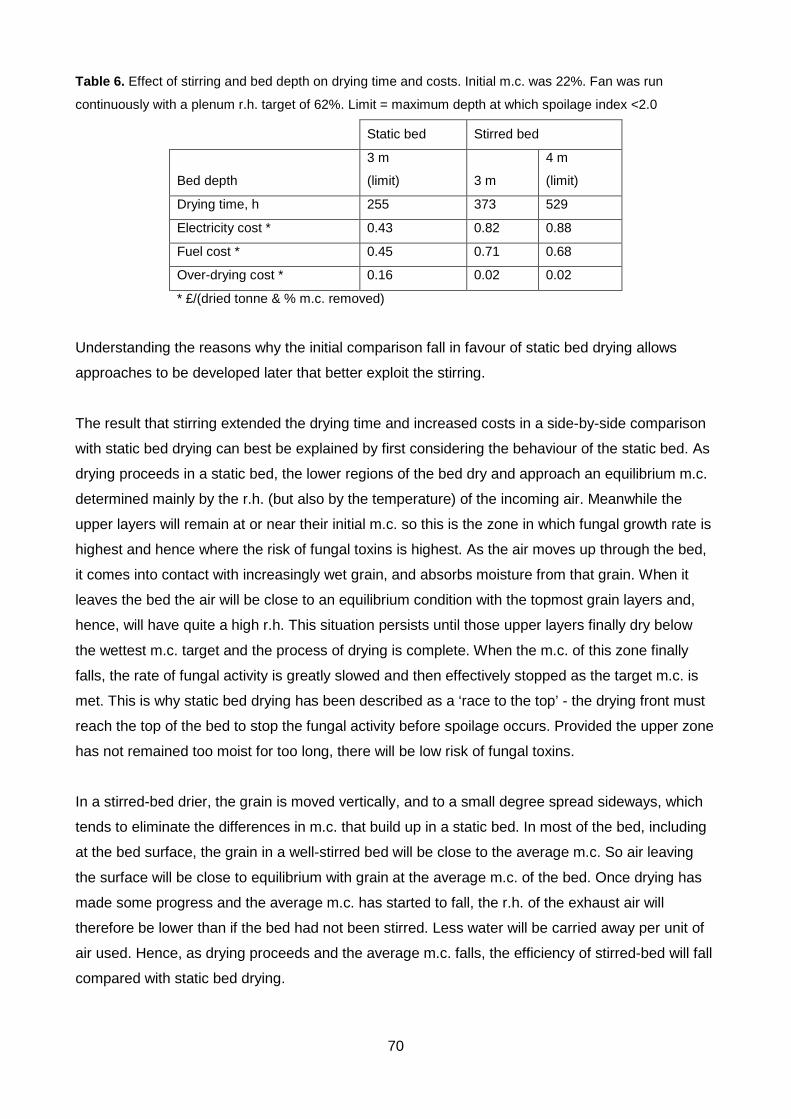
70
Table 6. Effect of stirring and bed depth on drying time and costs. Initial m.c. was 22%. Fan was run
continuously with a plenum r.h. target of 62%. Limit = maximum depth at which spoilage index <2.0
Static bed Stirred bed
Bed depth
3 m
(limit) 3 m
4 m
(limit)
Drying time, h 255 373 529
Electricity cost * 0.43 0.82 0.88
Fuel cost * 0.45 0.71 0.68
Over-drying cost * 0.16 0.02 0.02
* £/(dried tonne & % m.c. removed)
Understanding the reasons why the initial comparison fall in favour of static bed drying allows
approaches to be developed later that better exploit the stirring.
The result that stirring extended the drying time and increased costs in a side-by-side comparison
with static bed drying can best be explained by first considering the behaviour of the static bed. As
drying proceeds in a static bed, the lower regions of the bed dry and approach an equilibrium m.c.
determined mainly by the r.h. (but also by the temperature) of the incoming air. Meanwhile the
upper layers will remain at or near their initial m.c. so this is the zone in which fungal growth rate is
highest and hence where the risk of fungal toxins is highest. As the air moves up through the bed,
it comes into contact with increasingly wet grain, and absorbs moisture from that grain. When it
leaves the bed the air will be close to an equilibrium condition with the topmost grain layers and,
hence, will have quite a high r.h. This situation persists until those upper layers finally dry below
the wettest m.c. target and the process of drying is complete. When the m.c. of this zone finally
falls, the rate of fungal activity is greatly slowed and then effectively stopped as the target m.c. is
met. This is why static bed drying has been described as a ‘race to the top’ - the drying front must
reach the top of the bed to stop the fungal activity before spoilage occurs. Provided the upper zone
has not remained too moist for too long, there will be low risk of fungal toxins.
In a stirred-bed drier, the grain is moved vertically, and to a small degree spread sideways, which
tends to eliminate the differences in m.c. that build up in a static bed. In most of the bed, including
at the bed surface, the grain in a well-stirred bed will be close to the average m.c. So air leaving
the surface will be close to equilibrium with grain at the average m.c. of the bed. Once drying has
made some progress and the average m.c. has started to fall, the r.h. of the exhaust air will
therefore be lower than if the bed had not been stirred. Less water will be carried away per unit of
air used. Hence, as drying proceeds and the average m.c. falls, the efficiency of stirred-bed will fall
compared with static bed drying.

71
It is clear that the wetter the upper layers of grain, the more water each unit of air will carry away.
For this reason, a system in which grain at the surface is the last to dry will tend to make best use
of each unit of air pushed through the bed by the fan. Hence for the same air flow and conditions
entering the bed, a static bed will tend to dry more quickly, and hence use less energy from the fan
and heaters, than a bed that is constantly stirred.
It has been noted that in static bed drying, the need to continue drying until the uppermost grain
has reached the target means that the lower parts of the bed and, as a consequence, the bed as a
whole become over-dried. For the final stage of static bed drying, an improved strategy would be to
select a higher r.h. in the plenum than 62% so that the lower region of the bed would not continue
to dry and might rewet to a limited degree. Meanwhile the air reaching the upper region would still
be at a suitable r.h. to dry that grain. If this approach were successfully managed, the final average
m.c. would be closer to the target of 14.5%. This would reduce the loss of saleable weight of grain,
and hence reduce to some extent the costs due to over-drying. However, more management would
be needed to monitor the process, and the overall drying time might be extended. This approach
was not simulated for the present work.
The same comparison, of static with continuously stirred drying, was made starting on 15
September, Tables 12 and 13. The same trends were seen as for an August 15th start. Comparing
results for August and September starts (Tables 10-13), drying always took longer in the colder
and damper weather of September, but the limiting initial m.c. at which drying was successful did
not change. Fuel and electrical costs were higher starting in September because of the longer
drying time needed. For static bed drying, over-drying costs were lower in September because the
ambient air was less likely than in August to be well below the target plenum r.h.
We now look at the effect of grain depth and of initial m.c. on drying performance, using Tables 10
and 11. The effects of altering grain bed depth on drying performance followed the same trends for
static bed and for stirred driers, though the stirred drying in all instances took longer and cost more
overall, as already noted. Reducing grain depth from 4m to 2m resulted in greatly reduced drying
time. Of course the weight of grain dried on a given floor is also halved. As depth was reduced, the
resistance of the bed to airflow was reduced so the fan delivered more air. The bed also contained
less grain so the airflow per tonne of grain greatly increased. The fan and drying floor were sized to
give approximately the recommended airflow of 0.05 m3/(s.t) at bed depth of 3m. So for a 3m depth
of grain at initial m.c. of 20% over a 90 m2 floor, the airflow was 0.056 m3/(s.t). The flow through a
bed of 4m depth was reduced to 0.039 m3/(s.t) whereas using a bed depth of 2m increased the
airflow to 0.090 m3/(s.t). This higher airflow increased the speed of the drying front passing through
the shallower bed so drying was greatly speeded up. As a result of less fan energy being wasted to
force air through the grain bed itself, reduction in bed depth from 4 to 3 to 2m resulted in a small

72
reduction in electrical energy use per tonne and % removed. Fuel costs fell slightly as depth
reduced. Overall energy costs did not change strongly in response to bed depth changes.
For initial m.c. also, the effects on both drying systems were the same. As initial m.c. reduced from
24% to 16%, drying time was greatly reduced. Although drying from 24% to the 15% wettest grain
target required a reduction of 9% (m.c.) compared with a reduction of only 1% (m.c.) from 16% to
15%, the drying time was not reduced in proportion to the water loss because (a) it takes time to
move moisture up through the bed before any overall reduction is achieved, and (b) drying from
high m.c. is more efficient. It results in higher exhaust saturation so it makes better use of the air
delivered by the fan.
The total energy to dry grain increased, of course, as the initial m.c. rose. In Table 10, the total
energy for a 2m bed at 16% initial m.c. was 188 MJ/t, rising to 410 MJ/t at 24% initial m.c. But both
fuel and electricity costs per % of moisture content removed per dried tonne, shortened to £/(%.t),
were lower when drying high m.c. grain. In Table 10, as the initial m.c. changed from 16% to 24%
at 2m depth, the total drying cost for the static bed drier fell from 2.4 to 0.95 £/(%.t).
Summarising the comparison of static bed and stirred bed drying with identical design, weather
and plenum air heating control, based on Tables 10-13, a drier with continuous stirring was
successful in conditions of high initial m.c. in which static bed drying failed because of excessive
risk of fungal spoilage in the upper layers of the static bed. Generally, stirring allowed successful
drying at an initial m.c. about 2% (m.c.) higher than for static bed, or for a grain bed depth 1m
deeper than the limit for static bed drying. This was the case across the range of bed depth (4-2m)
and whether starting drying in mid-August or mid-September. However, static bed drying with
effective use of heat was successful at an initial m.c. of up to 20% at 4m bed depth, 22% at 3m
and 24% at 2m. In conditions where both systems dried the bed successfully, stirring resulted in a
longer drying time and in higher energy use and costs than drying with static bed, but with less
over-drying of the bottom of the bed. This was the case across the whole range of initial m.c. of 24-
16%, bed depth of 4-2m and starting time of mid-August or mid-September.
3. Alternative approaches to the use of stirring Now we investigate what approaches could be employed to obtain the benefit of lower spoilage
risk presented by stirring with the greater efficiency of exhaust air saturation in static bed drying.
The case of continuously stirred bed will be referred to as “Approach 0”. Tables 10 to 30 are given
in Appendix B.

73
Approach 1. Stir only when the target average m.c. has been reached. By drying without stirring and allowing a damp zone to persist in the upper layers, the efficiency of
air use could be maintained until the bed had reached the target average m.c. In general, at this
stage of drying, the upper region of the bed would be above the target m.c. for the wettest layer
and the lower region would be dried to below the average m.c target. If the bed were stirred at this
stage, the wetter grain at the surface would be mixed with the drier grain from below and thus bring
the whole bed to the same m.c., close to target. (Of course this mixing could in principle be done
by other means than a grain stirring system, such as moving the grain to another floor by bucket
loader, but such approaches are not considered as part of this work.)
Comparing Table 14, in which Approach 1 is implemented, with Table 10, the static bed case, we
see that the time to reach the average m.c. of 14.5% was the same, and only two or three hours of
stirring were needed to mix the wetter upper layers into the bed and reduce their m.c. to below the
target of 15%. To meet this wettest m.c. target without stirring took an extra 33 h of drying (at the
comparison point of 20% initial m.c. and 3m bed depth). Approach 1 reduced the drying time to
below that for the static bed across the range of depth and initial m.c. but the upper depth limit for
spoilage risk at 24% initial m.c. remained at 2m, whereas the continuously stirred bed had a limit of
3m. The fuel and electricity costs of Approach 1 were lower than with static bed drying because
both the targets were met sooner and because the short stirring time reduced electricity use for the
stirrer motors. Overall drying costs when stirring in this way were lower than for a static bed, partly
because of this lower energy use but also because there was less over-drying. Risk of spoilage
was a little lower than with static bed drying because the m.c. of the upper layers, where conditions
are most favourable for fungi, was reduced so quickly once stirring started.
The disadvantages of this approach are
1. The maximum m.c. and depth limits are lower than when stirring continuously. This
approach is static bed drying until the average m.c. target is reached, so conditions may
favour fungi in the upper layers during drying. Hence drying was not successful at 4m at
22% initial m.c. and at 3m at 24% initial m.c., whereas it was with continuous stirring.
2. In practice, the bed may have settled and become more compacted during drying to the
average m.c. target, and it might not be possible for the electric drive motors to start the
augers if they had been embedded in the grain bed.
Approach 2. Stir from the start of drying until the maximum m.c. in the bed reaches 18%, then stop stirring and start again only once the target average m.c. has been reached. This approach sought to control spoilage risks better than Approach 1, by stirring until the m.c. of
the wettest grain had dropped below the threshold of 18%. At this m.c. the risk of OA is eliminated
74
(Grain Storage Guide, 3rd edition, Anon., 2011, based on results of Northolt and Bullerman, 1982).
Thereafter, the approach was the same as Approach 1.
Comparing Approach 2 with Approach 1 (Table 15 with Table 14), the drying times with Approach
2 were longer, overall costs were higher, particularly at higher values of initial m.c., because more
stirring time was required until the 18% m.c. threshold was reached. However, risk of spoilage was
indeed lower over the range, and as a result drying was successful at up to the same m.c. and
depth limits as with continuous stirring, i.e. 24% initial m.c. at 3m depth and 22% m.c. at 4m, in
each case 2% points m.c. higher than with Approach 1 at the same bed depth.
Compared with continuous stirring (Table 11) Approach 2 saved considerable time and the
spoilage index was only a little higher. If initial conditions were close to the worst case, the higher
risk might be unacceptable, but otherwise Approach 2 could save time and cost compared with
continuous stirring.
Comparing Approach 2 with the static bed drier, (Table 15 with Table 10), the drying times were
slower for Approach 2 at high initial m.c. but faster below 20%. This is because the stirring made
drying less efficient initially but once the target average m.c. was met, stirring was very effective in
completing the drying by bringing the wettest grain below its target of 15%. Overall cost was higher
at high initial m.c. but lower below 20%. The over-drying component of cost was small with
Approach 2, as it was with Approach 1.
Approach 3. Use fewer stirring augers Clearly, if fewer stirring augers are used and if they are evenly active around the store, the time
between passes at any location in the store will increase. Electricity costs for running the augers
would also be reduced. Compared with stirring continuously with the normal number of augers per
unit area (Approach 0, Table 11), there were only marginal differences when drying while stirring
with half the number of augers per unit area (Table 16). Drying time was reduced by a small
margin and drying was less expensive by a small margin and the spoilage index was a little higher.
The explanation is that, as the number of augers per unit area is reduced, stirring at any location is
less frequent and more of the grain bed is undisturbed for longer. The bed effectively becomes
more like a static bed, so it is not surprising that the results show these trends. In this approach
stirring the bed to mix it, once the target average m.c. is achieved, would take longer so some time
advantage would be lost.
Approach 4. Use a lower or higher airflow. Drying was simulated with a smaller fan (Table 17) and with a larger fan (Table 18), in both cases
stirring continuously throughout drying, to compare with the results using a ‘standard’ Pellcroft

75
Typhoon TC5 fan used in Approach 0 (Table 11). The area of grain bed simulated was 90 m2 and
the fans used were the Typhoon TC4 and TC6 models for lower and higher airflows respectively.
At 20% initial m.c. and 3m bed depth, the airflows generated by the three fans were 0.047, 0.056
and 0.060 m3/(s.wet tonne).
Using a larger fan reduced drying time. For example at 20% initial m.c. and 3m bed depth, drying
time was reduced from 314h to 296h, a saving of 18h. At this performance point, over-drying costs
were marginally higher when drying with the larger fan, while total costs were slightly lower. With a
smaller fan, drying time was increased compared with the standard fan, e.g. at 20% initial m.c. and
3m bed depth, drying time was increased from 314h to 381h, an extra 67h. Fuel cost was
increased, electricity cost was decreased but the overall result was that cost was decreased by
5p/(%.t). The main effect of fan size was on the drying time, and the energy cost was not greatly
affected by changing the fan one ‘size’ up or down.
Approach 5. Use a higher drying air temperature at normal airflow. As background to this approach, it is noted that drying may be done in two essentially different
ways. The first is drying with the aim of bringing the grain into balance with the relative humidity of
the air. The second is drying with air that is heated and has a very low relative humidity, and where
drying is stopped well before grain reaches equilibrium. The first is the basis of a conventional
static bed drier while the second is what happens in a conventional heated-air drier in which grain
is constantly moving and drying air temperatures of about 40oC upwards are used.
Stirring the grain bed, because it moves the grain, allows the use of more intense drying
treatments that would over-dry the lower part of a static bed, and might cause the upper part of a
static bed to be so warm and damp that fungi would grow very rapidly. So instead of regulating the
plenum r.h. to achieve gradual, fairly slow drying, the temperature of the plenum air could be raised
while stirring to give faster drying. To explore this approach, plenum air temperatures of 20, 30, 40
and 50oC were used in simulations of continuously stirred beds. Results are given in Tables 19-22.
In conventional static bed drying, a temperature rise of no more than 5-10oC would be the
maximum possible to limit over-drying and to avoid excessively warm and damp surface
conditions. While a plenum temperature of 20oC may be within the normal range, depending on the
weather, maintaining this during the night would require more heat than usual, and above 20oC
plenum temperature a larger heater power than available in a standard bulk store would certainly
be needed. The heat power requirements are discussed below.
There are practical matters to be taken into account if considering drying with significantly higher
temperatures. Items such as fan motors and bearings, and sensors and cables, fittings etc. would
be subjected to those higher temperatures. Clearly, they must be able to function safely and

76
reliably. There are other hazards such as risk of fire, and locations where access for the operator is
not possible because the surfaces or air are too hot.
When using a plenum temperature setpoint of 20oC, Approach 5 succeeded in drying with very low
risk of fungal spoilage up to a bed depth of 3m at initial m.c. of 24%, the same limit as Approach 0.
At 30oC plenum temperature and above, grain at 4m depth could be dried successfully, so use of
Approach 5 extended the range of conditions in which drying was successful.
Table 7 shows the effect on drying times and energy costs when drying from 22% initial m.c. with a
bed depth of 3m. Drying time fell dramatically as drying air temperature rose, and at 30oC and
above, the stirred bed dried faster than the static bed. This rapid fall in drying times as drying
temperature rose was seen across the whole range of initial m.c. and depth (Tables 19-22). At
20% initial m.c. and 3m bed depth, drying time was reduced from 314h where 62% plenum r.h.
was maintained in Approach 0 to 278h at 20oC plenum temperature, to 80h, 53h and 42h at
plenum temperatures of 30, 40 and 50oC respectively.
Table 7. Effect of plenum air condition on performance for initial m.c. of 22% and bed depth 3m. Fan was run
continuously.
Static bed Stirred bed
Plenum air target 62% r.h. 20oC 30oC 40oC
Drying time, h 255 323 104 68
Electricity cost * 0.43 0.74 0.22 0.14
Fuel cost * 0.45 0.75 0.78 0.82
Over-drying cost * 0.16 0.01 0.12 0.24
* £/(dried tonne & % m.c. removed)
At higher drying air temperatures, the average m.c. fell below the target 14.5% before the
maximum m.c. target of 15% was met. This was because drying was so intense in the lower layers
of the bed that even constant stirring could not prevent significant over-drying of that grain. This is
seen in the ‘over-drying cost’ line of Table 7. It must be noted that at 50oC there is the possibility of
heat damage to the grain exposed directly to the full temperature.
The case of 22% initial m.c. and 3m depth in Table 7 shows how electricity cost was reduced as
plenum air temperature rose from 20 to 40oC whereas fuel cost increased a little. At the lower m.c.
of 20% and 3m, comparison of Tables 11 and 20 shows that the electricity cost of continuous
stirring (Approach 0), £0.93 per dried tonne and % m.c. removed, was substantially reduced to
£0.23 /(t.%) by increasing the drying air temperature to 30oC. This was because the fan and
stirrers were in operation for a much shorter time. The total energy used for drying was reduced
from 469 to 364 MJ/tonne dried by moving from 20 to 30oC plenum temperature, so drying at 30oC
77
was more efficient. But the fuel cost of Approach 0 did not change much as the temperature was
increased to 30oC, £0.88 to £0.81/(t.%). Much the same fuel was used but just over a shorter time.
The reduced total energy use was largely due to reduced electricity use. As the drying air
temperature was raised to 40 and then to 50oC (Tables 22 and 23), over-drying increased and the
total energy also increased. Fuel used /(t.%) was not much changed by the over-drying. This
meant a greater % m.c. was removed unnecessarily so fuel cost rose, up to £6.16 /dried t at 50oC
for 20% initial m.c. and 3m bed depth. Overall, the advantages of increased temperature were
most apparent at 30oC plenum temperature. At higher values, drying speed was further increased
but over-drying was excessive when using the simple policy here of drying until both targets were
met. More management of the drying process would be needed to avoid over-drying, commented
on further below.
Comparing drying with stirring at elevated temperature, Approach 5, with ‘normal’ static bed drying
at constant 62% plenum r.h., the temperature used by the stirred drier had to be 30oC or above to
improve on the drying time of the static bed at 20%, 3m. At 30oC, the total cost was also lower by a
small margin. Overall costs were greater at higher or lower drying air temperature than 30oC (albeit
explored here in rather large, 10oC steps). Heat losses would certainly increase fuel costs as
temperature was increased so it appears that 30oC may be somewhere near the optimum plenum
air temperature.
In normal near-ambient drying, there would be little heat wasted to the environment because the
temperature would only be raised by a few degrees. But where temperatures of 40 or even 50oC
are generated, heat would be lost before the air contacted the grain bed, from the hot upper and
side surfaces of the main duct, in heating the structure itself and to the ground. The simulation
model did not include any of these heat loss routes so the simulated energy use values will be less
than in reality, by an amount that depends on the drier design. Each drier will be different so a
generalised answer cannot be given. The higher the plenum air temperature the more important
would energy saving measures be to maximise the benefits of using an increased temperature.
Heat loss could be reduced by insulating the sides and top of the plenum and under the plenum
and lateral ducts. This would be easier and cheaper if done during construction than afterwards.
Insulating the plenum is likely to be cost effective. If there no grain on the other side of an un-
insulated plenum, there will be more heat loss from the exposed plenum wall than if grain is
present. Of course, grain there will be warmed and may need cooling later for safe storage.
The over-drying occurred because the lower part of the bed was being dried intensely and the
stirring system was not able to incorporate that grain into the bulk sufficiently quickly so the
difference was not removed by stirring. By the time the target maximum m.c. of 15% was reached,
some of the bed was well below the required average m.c. of 14.5%. Clearly, this situation could
78
be avoided, and the over-drying cost reduced and perhaps avoided, if the drying were made less
intense as the targets were approached. There would be various ways to do this, including turning
off the heaters and continuing to blow while stirring to mix the grain, or reducing the temperature
rise well before the target and continuing to dry but less intensely, or turning off both heaters and
fan and simply mixing the grain to eliminate the differences in the bed. In addition, it is clear that
the grain when dried at elevated temperature would need to be cooled to reach a temperature
suitable for sale, or prior to further cooling for safe storage. Cooling of warm grain will tend to
evaporate further moisture, so drying could be terminated at a higher m.c. to allow for this final
drying. However, the amount of drying would be small if grain were cooled rapidly with the drying
fan and the stirring system running. Slower cooling with no stirring would give more loss of
moisture, but some moisture and temperature gradients would develop in the grain bed as it cooled
so final stirring to even out such differences would be advisable.
As noted above, higher heater power would be required for some of the approaches described
here, assuming the same airflow from the fan. Where a target temperature of say 30oC is used,
there will be times of peak heat demand when raising the air temperature to the target demands
the greatest power. This will occur when the air is coldest. In the simulation, the power needed to
be able to achieve the target temperature during the drying weather conditions was found and
used in the simulation runs. It may be that the available heater is powerful but not powerful enough
always to reach the target temperature. What effect would this have on performance? An example
case of the effect on drying time of using less power than this maximum was explored. Results are
shown in Table 8 for 30oC target plenum temperature drying a bed of 3m depth and 90m2 area
from 20% initial m.c. with a 15th August start for each of the 20 years historical data for Lincs.
Table 8. Effect of heater power on drying time when stirring
Heater power, kW Average plenum
temp, oC
Drying time to both
targets, h
300 29.9 80.4
275 29.7 81.2
250 29.2 83.2
225 28.5 87.1
200 27.6 92.8
Results show that having less heater power available extended the drying time, which would in turn
increase the electrical energy used for running the fan and stirrers. More detailed investigation was
beyond the scope of this project.

79
Approach 6. Use a higher drying air temperature at reduced airflow. The use of higher drying air temperatures with normal airflow was highly effective in reducing
drying times, and hence electricity costs, but not in reducing fuel costs. If lower airflow were used,
lower heater power would be needed to achieve the set temperature and it was possible that
drying would still be accelerated sufficiently to present a good compromise between cost and
performance. Results in Tables 23-26 were generated using a smaller fan, the Pellcroft Typhoon
TC4 model, but otherwise with the same conditions as for Approach 5.
When using a plenum temperature setpoint of 20oC, Approach 6 succeeded in drying with very low
risk of fungal spoilage up to a bed depth of 3m at initial m.c. of 24%. At 30oC and above, 4m depth
could be dried successfully. Drying took longer but was still fast enough even at 24% initial m.c. to
avoid risk of fungal toxin formation. The limit was the same as in Approaches 0 and 5, so using a
smaller fan did not in this case reduce the upper limit of initial m.c.
Using 20oC (Table 23), the drying time of 325h at initial m.c. 20% and 3m bed depth was longer
than the 314h needed for Approach 0 (the control stirred treatment with plenum air setpoint of 62%
r.h., Table 11.) But as temperature was raised to 30, 40 and 50oC, the drying time dropped to 96h,
63h and 49h respectively (Tables 24-26). These drying times were longer than with Approach 5
using normal airflow but still represent a huge saving compared with Approach 0. As with the
normal airflow of Approach 5, fuel cost £/(t.%) with Approach 6 hardly changed with plenum
temperature over the temperature range but electricity cost fell as drying times reduced. The
minimum overall cost was £1.14 /(t.%) at 30oC plenum temperature, of which £0.82 was fuel and
£0.20 was electricity (Table 24).
Compared with the original fan (Table 20), the smaller fan (Table 24) gave a lower electricity cost
and a fuel cost nearly the same. For example at 30oC plenum temperature, 20% initial m.c. and 3m
bed depth, fuel cost was £0.81/(t.%) with the normal airflow versus 0.82 with smaller fan, where
electricity costs were £0.23/(t.%) and 0.20, respectively. Over-drying was reduced because drying
was slower while rate of incorporation of over-dried grain by the stirring rate was the same. Hence,
the lower fan size was in this case effective and cheaper to run. It is generally the case that drying
with a lower airflow is more efficient in terms of fan energy. Air resistance of the grain bed is non-
linear with air velocity so, at lower airflow, less energy is used to force air through the resistance
imposed by the bed. But the result of lower airflow is slower drying because the speed of the drying
zone up through the bed is linked to air speed.
Comparing overall drying costs at normal airflow and reduced airflow with the static bed drying, we
see they were similar at £1.18, 1.14 and 1.20 per dried tonne per % m.c. removed, respectively, at
20% initial m.c. and 3m depth. But the electricity and fuel elements of the overall cost were quite

80
different. Using Approach 6 with 30oC plenum air setpoint, 20% initial m.c. and 3m bed depth,
£0.82 was fuel and £0.20 was electricity, whereas for static bed drying at the same conditions, fuel
costs were £0.51 and electricity costs £0.49 per dried tonne per % m.c. removed. This means that
the best approach will depend on the relative cost of fuel and electricity for a grower; the more
expensive the electricity relative to fuel, the more energy cost would be saved by using an
approach of stirring with elevated air temperature.
Approach 7. Use a higher drying air temperature with low airflow for the first 24h then with higher flow. This approach was similar to that recommended by some of the equipment suppliers, in that the
grain bed was at first ventilated with a lower airflow at the elevated temperature but without stirring.
In this case, a fixed period of 24h ventilation without stirring was used. Thereafter, a higher airflow
was used until the target m.c. values were reached, by running a second identical fan in parallel
with the first and maintaining the temperature of the increased airflow using higher burner power.
In this set of runs, a bed area of 180m2 was used with one and then with two Pellcroft Typhoon
TC3 fans, which produced airflows of 0.023 and 0.039 m3/(s.tonne at 20% initial m.c.), respectively
in a bed of 3m depth. For comparison, the airflow for Approaches 0 and 5 was 0.056 m3/(s.t), and
for Approach 6 was 0.047 m3/(s.t).
When using 20oC air, this approach resulted in low risk of fungal spoilage at 4m bed depth and
22% (Table 27), but at 24% initial m.c., the depth had to be reduced to 2m to keep the risk low
enough. By raising the plenum temperature to 30oC (Table 28), the bed depth could be raised to
3m without compromising grain safety. At 24%, a depth of 4m was not suitable, even at 40 or 50oC
(Tables 29 and 30). Hence, Approach 7 reduced the upper limit of initial m.c. that could be dried
without risk compared with Approaches 5 and 6.
As in Approaches 5 and 6, the drying times fell rapidly as the plenum temperature setpoint was
raised from 20 to 50oC. Also, the lowest cost per % removed and per tonne dried was at 30oC,
above which, over-drying costs increased more than electricity costs reduced.
With the different fans used and the airflows they produced, Approach 7 was slower (130h at 20%
initial m.c. and 3m depth with plenum temperature of 30oC) than Approach 5 (80h) or Approach 6
(96h). The overall cost of drying, £1.16/(t.%), was between those of Approaches 5 and 6. But the
electricity cost was significantly lower at £0.14 per % removed per tonne dried, compared with
£0.23 and £0.20 per % removed per tonne dried for Approaches 5 and 6, respectively at this
comparison point. The over-drying cost for Approach 7 was higher and this brought up its total
cost. The reason why the low airflow treatment gave over-drying was that the store area was
doubled from 90 to 180m2 to bring the specific airflow down to the required low figure, and so the

81
interval between stirrings at each location was also doubled. Incorporation of over-dried grain at
the bottom of the bed was, therefore, less effective.
4. Drying rates The drying rate considered achievable in normal conditions by near ambient driers has been 0.5 %
m.c. per 24h (P55 of McLean, 1989). The drying rate achieved in the simulation runs was
calculated, using the final average m.c. and the time to achieve both the average and wettest m.c.
targets. The drying rate was most strongly influenced by bed depth because this determined how
much air was delivered from the fan, and this airflow in turn determined the drying rate. There was
also an influence of initial m.c. - the higher the value, the higher the overall drying rate. Drying
rates were calculated for each of the three depths but averaged over all the initial m.c. values at
which drying was successful. Results are given in Table 9.

82
Table 9. Drying rate, % m.c. per 24h, for each set of runs and bed depth.
Approach
and table
of results
Static
10
Ap.0
11
Static
12
Ap.0
13
Ap.1
14
Ap.2
15
Ap.3
16
Ap.4
17
Ap.4
18
Ap.5
19
Bed
depth, m
4 0.4 0.3 0.3 0.2 0.4 0.4 0.3 0.2 0.3 0.3
3 0.6 0.4 0.5 0.3 0.6 0.6 0.4 0.3 0.4 0.5
2 1.0 0.7 0.9 0.6 1.0 0.9 0.7 0.5 0.7 0.8
Table 9. continued
Approach
and table
of results
Ap.5
20
Ap.5
21
Ap.5
22
Ap.6
23
Ap.6
24
Ap.6
25
Ap.6
26
Ap.7
27
Ap.7
28
Ap.7
29
Ap7
30
Bed
depth, m
4 1.2 2.0 2.8 0.3 1.0 1.7 2.4 0.2 0.8 1.3 1.4
3 1.7 2.9 4.1 0.4 1.5 2.4 3.4 0.3 1.1 1.7 1.9
2 2.8 4.7 6.6 0.6 2.3 3.9 5.5 0.5 1.7 2.6 2.7
The ‘standard’ static bed treatment, Table 10, achieved the 0.5 %/24h at a bed depth between 3
and 4m, whereas the stirred version, Table 11, needed a bed depth less than 3m to do so. A rate
of up to 4.1% m.c. per 24h was achieved at 3m depth by raising the drying air temperature to 50oC
using stirring with Approach 5.
3.5. Development of user guidelines
Milestone vi. “From the results, develop user guide-lines to show how to achieve the full range of benefits from stirring” Results presented in this report show how stirring influences the performance of a bulk drying
system. There are also aspects of stirring that impact on the whole operation of drying that could
make a contribution to a grower’s operations. These are discussed to allow a potential user to
make good investment decisions.
The success of the drying process will be judged against a number of measures. Depending on the
grower’s business model, these measures and others will have differing weighting. Measures will
include the absence in the grain of fungal toxins produced by storage fungi (which means OA in

83
the UK), suitability for the market of the moisture content of the dried grain (average value, and
range within the store, particularly the wettest), marginal costs of the drying operation (costs of
electricity and fuel and labour), drying time (or more precisely the time until the store is available
for another batch of grain to be accepted), and the opportunity cost of the investment in the drying
equipment.
Freedom from toxins is likely to be the highest priority because the grain is not likely to be
acceptable to the market if OA is detectable. Stirring has been shown in this report to reduce the
spoilage index, which is linked to the risk of OA. But because the energy costs and drying time
using a standard bulk drier are increased by stirring, the use of stirring with a standard drier may
only be justifiable after the implementation of several other approaches to keeping the risk of OA
low. These approaches include using a higher airflow (more fan capacity), appropriate use of
supplementary air heating, possibly requiring increasing the heater power available, improved
instrumentation to measure the plenum air condition and to control the fan and heater operation,
increased area of standard drying floor or use of a solid floor with temporary air ducts and fans,
drying grain in two stages to extend the safe storage time. It is outside the scope of this report to
go into details of these options, but one or more of the options may prove better investments than
a stirring system.
3.5.1. User guidelines
It was not part of this project to investigate the more practical aspects of the use of stirring, so the
following is based on the authors’ understanding of stirring good practice.
To use stirring to best advantage, a decision is needed about whether stirring is required, and if so,
when to start and stop. It is assumed that the user is familiar with the HGCA’s Safe Storage Time
Calculator software package for cereals. This calculates the time, at a particular grain temperature
and moisture content, until there is an unacceptable risk of the fungal toxin OA being present in the
grain. (It also calculates the risks from insects, mites and loss of viability, but those do not concern
us here.) The safe storage time (s.s.t.) changes as the temperature and moisture change. To use
this calculator during drying, and hence to see if the grain in the drier is at risk, the user needs to
have an estimate of the drying time in a static bed until the surface m.c. falls. This happens when
the drying front has moved up through the bed and the grain near the surface starts to dry. If there
is no other way to estimate this time, it could be calculated on the basis that a well-designed drier
loaded and used as recommended by the suppliers, would be expected to remove 0.5% points of
moisture per 24h of operation. So by this estimate, drying from say 19.5% to 14.5% would take 10d
or 240h. For most of this time the surface would remain at the initial m.c.. So if the s.s.t. for grain at
19.5% and at a temperature measured in the store is longer than 240h, the drying front should
reach the surface and dry the last grain without risk of OA. If the s.s.t. were shorter than 240h, the

84
surface grain would be at risk of OA, and stirring would reduce this risk. Stirring throughout drying
would reduce the risk very substantially. But as shown in this report, stirring in this way extends the
drying time and costs more in electricity and fuel. So guidance is given as to when to start and stop
the stirring to avoid the risk of OA.
Explanatory notes for the following points are given below.
A. Retro-fit of stirring system to existing bulk drier If you have the following problems, the use of a grain stirring system as an add-on to your current
drying system may help.
A1. Grain at the m.c. and temperature in your store is at risk of OA according to the HGCA Grain
Safe Storage Time Calculator software package.
A2. Grain is compacted in the store, either from loading itself or a delay after loading during which
moist grain has become compacted.
A3. There are differences in m.c. of several % m.c. between grain at various levels in the store,
e.g. because wet grain has been loaded at the bottom, and drier grain loaded on top.
A4. Grain from various sources needs to be made into a uniform blend.
A5. Grain in part of the store has self-heated because of dampness.
A6. There are regions in the bed where airflow is low because of compaction or presence of fines
under a loading spout.
A7. The bed is stratified in m.c. between top and bottom. The grain near the air inlet may be dried
to below the target m.c. Although the bed as a whole has reached the target m.c., the grain near
the top of the bed may be too damp for safe storage.
If you have the following problems, a retro-fit grain stirring system will not help.
A8. Too much fuel is consumed for heating the drying air.
A9. The electricity used by the fan is too high.
A10. Drying is slow in a normal drying season.
A11. Drying is slow because the weather is poor for drying this season.
A12. Grain is significantly wetter in one location in the store so drying is slow there.
B. Drying system designed around stirring, with capability to use higher drying air temperature If you have the following problems, a grain stirring system designed to use stirring with higher air
temperature may help.
(In addition to items 1-7 for retro-fit stirring system)
B1 Faster drying is needed so that the grain can be outloaded quickly.

85
B2. More certainty is required that drying can be achieved year on year, irrespective of the weather
and with low risk of fungal toxins.
B3. The electricity used by the fan is too high.
B4. More drying capacity is needed from the existing store footprint.
B5. The fan is too small for the current drying requirement.
If you have the following problems, a grain stirring system designed to use stirring with higher air
temperature will not help.
B6. Too much fuel is consumed heating the drying air.
Explanatory notes A1. Stirring the grain bed means that all of the grain dries as soon as the fan and air condition
allows it. Grain near the bed surface, which in a static bed would stay undried until the process was
nearly completed, dries with the bulk. As the risk of fungal toxins reduces with m.c., the risk starts
to fall as soon as drying has started in a stirred bed. Even if drying takes longer overall, the risk of
OA is still very much reduced. By contrast, in a static bed the risk for the upper region is not
reduced as the bed dries because that region does not dry till last, and so drying must be
completed sooner than if the bed is stirred. If the m.c. at loading is such that the expected drying
time is longer than the safe storage time, drying with a static bed is a high risk option. Stirring
continuously will reduce the risk but cost more and take longer. Because the toxin is not produced
by the fungi at below 18% m.c., a compromise is to stir the bed until the grain is below 18% m.c.
and then complete drying to the target average m.c. without stirring. Stirring without further drying
will ensure the bed is sufficiently uniform.
A2. Of course compaction of the grain when loading should be avoided if possible. However, to get
the required bed depth, grain pushers are often used which (anecdotally) tend to compact the
grain. Stirring will reduce compaction, i.e. loosen the grain. Though the evidence is weak for the
effect of this on drying, stirring a compacted bed may allow a higher airflow to be delivered by the
fan. The grain will be loosened and become less dense. Less dense grain will permit more air to be
delivered from a given fan. But the bed will also become deeper when it is loosened. A deeper bed
will offer more resistance to the fan. Under these two opposing influences, the airflow delivered by
the fan may not change significantly. The result will also depend on the type of fan and where on
its pressure versus flow curve the fan is operating.
A3. In any part of the store, any differences between bottom, middle and top of the bed will be
reduced by stirring before drying. Starting with a uniformly moist grain through the depth of the bed
will make drying easier because wetter zones will have dried by contact with drier parts simply as a
result of being mixed by the stirring system.
A4. Stirring will tend to blend the grain in a vertical sense, so the grain to be blended must be
spread in layers. Stirring is most effective at incorporating grain into the bulk from the upper half of

86
the bed, and least effective at incorporating grain from the bottom of the bed. If it is vital that a
particular batch of grain be well mixed into the blend, avoid placing that material into the store first,
i.e. at the bottom of the bed.
A5. The removal of the heat requires at least a cooling airflow to be delivered through the bed once
the grain has been loosened. The temperature of the grain should be monitored to check that it is
falling quickly enough.
A6. While it would be better to avoid such issues than have to solve them, a stirrer would be
effective at dispersing material from one location. The stirrer augers would need to be run through
that region intensively to achieve results right down to the bottom of the bed.
A7. See A4. It will take a stirrer system longer to incorporate over-dried grain because it is at the
bottom, than to mix in under-dried grain which will be at the top.
A8. In a bulk drier operated with near-ambient air conditions, not only will stirring not save fuel, it
will use more. However fast or slowly grain is dried, the same mass of water must be evaporated.
So if the efficiency of drying is the same, the total amount of heat energy, and hence fuel, needed
to dry the batch will not change. A static bed drier is efficient because air leaves the grain bed after
contact with wettest grain near the surface, and hence the air is well saturated. This remains so
until near the end of static bed drying when the surface starts to dry, at which stage efficiency of
drying falls too. In a stirred bed the surface dries as the bulk dries, which is why the risk of fungal
toxins is controlled. However, the air leaving a stirred bed is not as well saturated so the efficiency
of drying is lower than for a static bed. This explains why a stirred bed drier using air at close to
ambient conditions will take more time to achieve the target m.c. and because the heater is running
for longer, stirring will use more fuel to dry over a given range of m.c.
A9. As explained in A8, drying takes longer so the fan as well as the stirring system, is run for
longer. Electricity use is therefore higher than with a static bed drier under the same, near-ambient
air conditions.
A10. As explained in A8 and A9, stirring the bed during drying makes the operation less efficient,
and hence take longer. So a drier which is too slow will be made worse by stirring the grain. The
problem may be that the fan is delivering insufficient air through the bed, in which case replacing
the fan with one of higher capacity against the resistance of the system would be more appropriate
than installing a stirrer system.
A11. Stirring would not speed up drying in a poor season, when drying would be slowed because
of cold or wet weather and perhaps because of higher initial m.c. However the use of stirring,
although it will not speed up drying, will reduce the risk of fungal toxins (see A1).
A12. Only a small amount of lateral movement, as opposed to vertical movement, is achieved by
auger stirring, so stirring will not be effective at redistributing across the store any wetter, or drier,
grain loaded into a particular region of the store.
B1. When air at higher temperature meets damp grain, drying is faster and the m.c. that the grain
will arrive at is lower. In a static bed, this would result in severe over-drying of the lower part of the

87
bed and condensation and rapid spoilage in the upper part. Stirring the bed allows the drying to
take place throughout the bulk at more or less the same rate. As the temperature of the air is
raised, the drying rate that can be achieved increases. At an air temperature of 30oC or over,
drying is faster than would be possible in a static bed. See also A1 because faster drying gives
reduced risk of fungal toxins.
B2. B1 explains why higher air temperatures when stirring can increase the drying rate throughout
the bulk. As the temperature of the air is raised by heating it, the relative humidity of the air is
greatly reduced. Hence the influence of the ambient humidity on drying rate diminishes. Hence,
provided the drying system has been designed for this, the use of higher drying air temperature
can allow drying to be successful irrespective of the weather.
B3. As the drying time is shorter when higher air temperature and stirring are used, the fan and
stirrers are running for less time and so use less electricity. However, air for cooling will need to be
supplied and the drying fan may need to be used for this if no cooling fan is fitted.
B4. By installing a stirred drier using higher temperature drying air, the drying capacity per m2 will
be increased, all else being equal.
B5. Stirring may help but a better option would be to replace the fan with one capable of delivering
the correct airflow.
B6. The explanation of A8 applies here. Even if the air temperature used for drying in a stirred bed
is higher, the level of saturation of the air leaving the surface of the stirred bed decreases as grain
of a higher m.c. at the surface is mixed with dried grain from lower in the bed. This means that the
efficiency of drying will be lower than for a static bed. Because the exhaust air is warm, each unit of
air leaving the bed carries away a considerable mass of water, much more per unit of air than for
the cool exhaust of a normal bulk drier. But the energy used to heat the drying air to the higher
temperature is also more. Overall, the energy per unit of water evaporated from the grain remains
higher than for a static bed, so more fuel is used in a given drying task.
3.5.2. Assuming a stirring system is available, how should it best be used?
1. If, because of problems A2 to A6 inclusive or other issues, stirring before drying is called for,
sufficient stirring time and passes through the grain should be allowed to achieve the amount of
mixing required. Stirring at the start of drying for up to 24h will have little effect on the drying time,
so the mixing achieved in that time can be considered as taking place pre-drying. Exactly how long
stirring needs to be done depends on the design of the stirring system, in particular auger
diameter, whether solid flight or coil flight, auger pitch, rotational speed, number of augers
operating, forward speed and route around the store. Details differ between stirring systems so no
general rule can apply, but to mix the grain adequately, one supplier suggests six passes over the
store of a four auger system are needed before the bed can be considered well mixed. Experience
in this project suggests 24h stirring was not sufficient, but that another 24h (with the stirrer working
only half the normal area) resulted in a well mixed bed. Grain sampling is advisable to ensure grain

88
is sufficiently well mixed to address the particular problem, especially if a requirement is that grain
from the bottom of the bed be mixed into the bulk.
2. Thereafter, advice depends on whether the drier can be operated at higher temperature and
what priority is given by the grower to the drying rate, fuel use and electricity use, because there
are trade-offs to be decided.
3. If operation at elevated plenum temperature is an option and if short drying time, low electricity
cost or both are priorities, then the drier can be run with air temperature raised to at least 30oC.
This option will increase fuel cost compared with static bed drying, particularly if the main air duct
has not been insulated. Heat loss from an uninsulated duct is likely to be significant, and hence
expensive. The higher the air temperature, the greater the heat loss will be. Any grain next to the
duct will be warmed. When using higher air temperature for drying, higher rate of water loss from
the bed will be achieved, which will lead to high humidity in the headspace above the grain bed.
Unless this moist air is removed sufficiently fast, there may be condensation of vapour onto the
structure which can drip onto the grain and cause locally severe re-wetting problems. Fans to clear
the headspace may be essential.
4. If operation at higher temperatures is not possible, or if fuel costs are priority, then plenum air
r.h. regulation to around 62% without stirring will give rapid drying (but see 5 below). Fuel efficiency
will be better than in option 3. Once the average m.c. of the grain bed has reached the target of
14.5% (for example), drying can be stopped and stirring started. As the grain is stirred, differences
in m.c. will be gradually removed and the upper layers not yet dried to the target will be mixed in,
but the average m.c. should not change. Without stirring, drying would need to continue to bring
the surface layers within the specification, which would add energy costs and possibly over-dry the
bed as a whole.
5. If the initial m.c. of the grain is above 20%, and particularly if it is much higher than this, drying
with a static bed, i.e. option 4, may take long enough that the grain is at risk of OA. In this
circumstance, the Safe Storage Time Calculator for sampled grain conditions will show that the risk
is too high, based on the grower’s expected or estimated drying time for the upper layers of the
bed. Drying can be started without stirring, and once the m.c. of the bulk has fallen by at least 1%
m.c., stirring will rapidly reduce the m.c. of the wettest grain, near the surface. After a long enough
period of stirring to mix the bed, the grain should be sampled to find the highest m.c. and the
temperature of the grain should be measured. The safe storage time of this grain should again be
estimated using the s.s.t. calculator. If the s.s.t. is greater than the expected remaining drying time,
stirring can be stopped and the static bed can be dried to the required average m.c. If drying is

89
slowed by poor weather, the check of m.c and s.s.t should be repeated. After drying, stirring will
even out differences in the bed if this is needed.
3.6. Conclusions
Work to validate the model showed that:-
1. The behaviour of the simulation model was in line with expectations in that, compared with
a static bed, stirring reduced the m.c. of the grain near the surface, thus lowering the rate of
spoilage and the risk of OA. But the reduced m.c. at the surface also lowered the exhaust
air r.h. as drying proceeded, which resulted in a reduced drying rate of the stirred bed.
2. Considering the validation work overall, agreement of the model with the data from the 25t
wheat drying experiment at Fera in 2010 was good in the important respects, particularly
drying time, approach to and level of final m.c. Validation against data from a stirred and a
static bin at Fera in 2012 showed that the model predicted the overall drying behaviour of
both bins well and, although stirring in the model was less vigorous than in practice, the
accumulated effect was sufficient to mix the bed to a similar degree. The drying fronts in the
model were steeper than measured but this did not affect drying time, which was well
predicted. Because the wheat on the test farm site in 2012 needed little drying, data could
not be had for drying using significantly higher air temperature. Testing of the model in
these low moisture removal conditions did not raise any doubts about its performance, and
indeed together with the data from the bin experiments, allowed the relationship between
m.c. and air r.h. to be confirmed. Simulation of a published experiment in which an 86t bin
of wheat was stirred and dried with air at a higher temperature gave results which agreed
very well with the measured overall performance. Because the drying time was well
predicted, the fuel and electricity use were also, as they are the product of running time and
heater and fan power. Overall, the model proved to be sufficiently good over the range of
m.c., air temperature and stirring rate encountered in the experiments. Because it is based
on well-understood physics of drying, the model, it was concluded, could be used with
confidence over a wider range than found in validation experiments.
Extensive use of the simulation model showed that:-
3. For comparison with a stirred bed, the best performance from a static bed drier was to run
the fan continuously and to use quite a powerful heater set to regulate plenum r.h. to 62%.
4. Under this fan and heater use, stirring was very effective in reducing the progress towards
risk of OA. This was because, at higher values of initial m.c., stirring avoided the
persistence of wetter grain at a condition that favoured fungal growth. Where a static bed
approach resulted in risk of OA, stirring the same bed allowed drying without risk of OA

90
from an initial m.c. of about 2% m.c. higher or for a grain bed depth 1m deeper than the
limit for static bed drying.
5. Compared with static bed drying in identical conditions, stirring the grain bed continuously
whilst drying made the drying less efficient and increased drying time and cost of fuel and
electricity, but over-drying of the bed as a whole was reduced. Efficiency was reduced
because the exhaust air was less saturated when stirring.
6. With 62% r.h. plenum air, performance of drying was improved compared with a static bed
by stirring only when the target average m.c. had been reached. Using stirring in this way
avoided the need to continue drying the static bed until the wetter, upper part of the bed
had dried, thus overdrying the bed as a whole. This approach gave faster drying, lower fuel
and electricity cost and less over-drying. Stirring while drying down to 18% m.c. and then
only stirring again once the average m.c. was reached gave a compromise between
avoidance of OA risk and drying efficiency, and was effective for grain not over 20% initial
m.c.
7. Using fewer augers, and hence stirring any location less often, reduced drying time and
improved energy efficiency. But at higher initial m.c., the beneficial effect of stirring on risk
of OA was reduced.
8. Lower airflow when stirring extended drying time, reduced electricity cost but increased fuel
cost and risk of OA. Higher airflow did the opposite. Total energy use was little affected.
9. Controlling plenum air temperature rather than r.h. and heating that air to 20oC or more
while stirring resulted in quicker drying and with much reduced risk of OA and little over-
drying. If using this approach, a plenum temperature of 30oC produced the best
compromise between drying speed, energy use and tendency towards over-drying.
Electrical energy use was greatly reduced at elevated air temperatures because of the
shorter drying time, but fuel energy use was generally increased.
10. Drying rates achieved when drying with a static bed or continuous stirring were in line with
the rate of 0.5 % m.c. per 24h, expected for a bulk drier using near-ambient air conditions.
This rate was increased substantially by using stirring together with plenum air temperature
raised to 30oC and above.
11. User guidelines are presented, drawing on the simulation results in the report, that highlight
which drying problems stirring is likely to help solve and which not, so as to guide
investment decisions. Guidelines are also presented on how best to use a stirring system, if
available, to meet the grower’s priorities for drying, whether drying speed, fuel or electricity
costs.
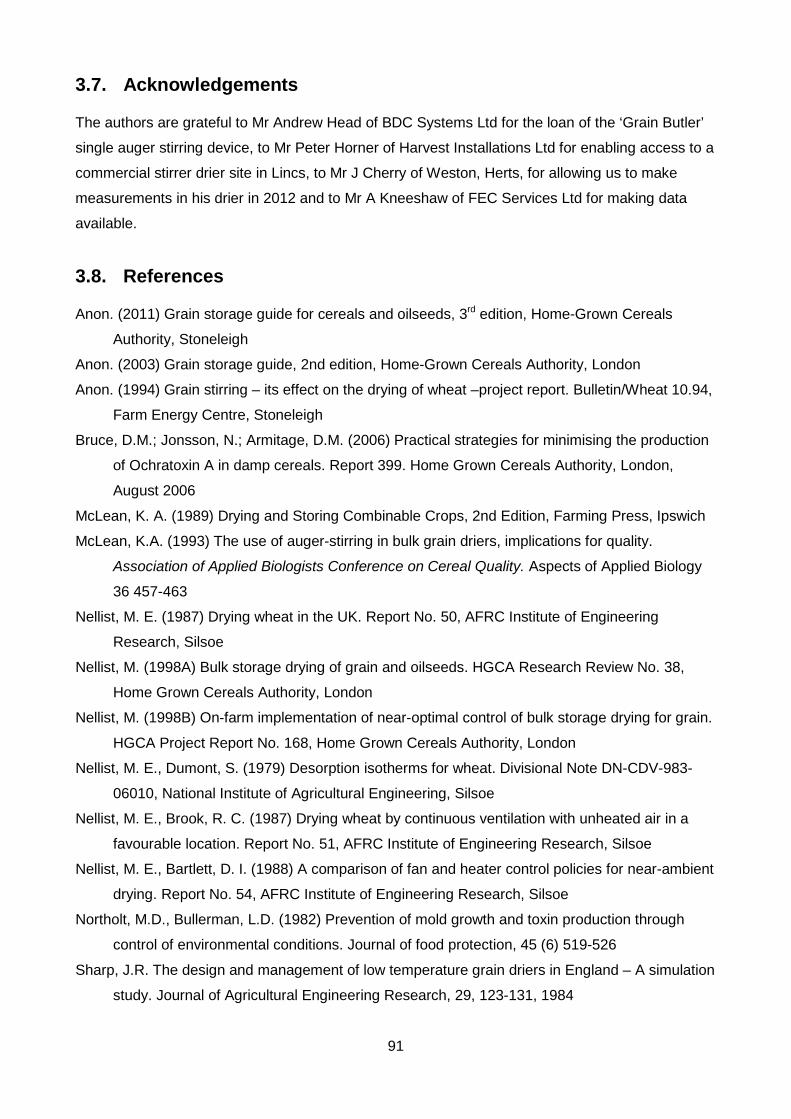
91
3.7. Acknowledgements
The authors are grateful to Mr Andrew Head of BDC Systems Ltd for the loan of the ‘Grain Butler’
single auger stirring device, to Mr Peter Horner of Harvest Installations Ltd for enabling access to a
commercial stirrer drier site in Lincs, to Mr J Cherry of Weston, Herts, for allowing us to make
measurements in his drier in 2012 and to Mr A Kneeshaw of FEC Services Ltd for making data
available.
3.8. References
Anon. (2011) Grain storage guide for cereals and oilseeds, 3rd edition, Home-Grown Cereals
Authority, Stoneleigh
Anon. (2003) Grain storage guide, 2nd edition, Home-Grown Cereals Authority, London
Anon. (1994) Grain stirring – its effect on the drying of wheat –project report. Bulletin/Wheat 10.94,
Farm Energy Centre, Stoneleigh
Bruce, D.M.; Jonsson, N.; Armitage, D.M. (2006) Practical strategies for minimising the production
of Ochratoxin A in damp cereals. Report 399. Home Grown Cereals Authority, London,
August 2006
McLean, K. A. (1989) Drying and Storing Combinable Crops, 2nd Edition, Farming Press, Ipswich
McLean, K.A. (1993) The use of auger-stirring in bulk grain driers, implications for quality.
Association of Applied Biologists Conference on Cereal Quality. Aspects of Applied Biology
36 457-463
Nellist, M. E. (1987) Drying wheat in the UK. Report No. 50, AFRC Institute of Engineering
Research, Silsoe
Nellist, M. (1998A) Bulk storage drying of grain and oilseeds. HGCA Research Review No. 38,
Home Grown Cereals Authority, London
Nellist, M. (1998B) On-farm implementation of near-optimal control of bulk storage drying for grain.
HGCA Project Report No. 168, Home Grown Cereals Authority, London
Nellist, M. E., Dumont, S. (1979) Desorption isotherms for wheat. Divisional Note DN-CDV-983-
06010, National Institute of Agricultural Engineering, Silsoe
Nellist, M. E., Brook, R. C. (1987) Drying wheat by continuous ventilation with unheated air in a
favourable location. Report No. 51, AFRC Institute of Engineering Research, Silsoe
Nellist, M. E., Bartlett, D. I. (1988) A comparison of fan and heater control policies for near-ambient
drying. Report No. 54, AFRC Institute of Engineering Research, Silsoe
Northolt, M.D., Bullerman, L.D. (1982) Prevention of mold growth and toxin production through
control of environmental conditions. Journal of food protection, 45 (6) 519-526 Sharp, J.R. The design and management of low temperature grain driers in England – A simulation
study. Journal of Agricultural Engineering Research, 29, 123-131, 1984

92
Sun, D.W.; Woods, J.L. (1994) The selection of sorption isotherm equations for wheat based on
the fitting of available data. J Stored products Research 30, 27-43
Wontner-Smith, T.J., Bruce D.M., Armitage, D.M., Cardwell, S.K., Jennings, P. (2008) Validation of
a model to avoid conditions favouring Ochratoxin A production during ambient-air drying.
Project report 440, HGCA

93
APPENDIX A. PARAMETERS FOR DRIER, CROP, WEATHER AND ENERGY FOR SIMULATION RUNS
These are the conditions unless otherwise stated in the particular case.
Drier Bed area ventilated by fan, m2 90
Number of fans 1
Fan Pellcroft Typhoon TC5, centrifugal
Airflow at 3m bed depth approx. 0.05 m3/(s.t at initial m.c.)
Bed depth, m 4, 3, 2
Crop Wheat
Moisture content, % wet basis
Initial 24, 22, 20, 18, 16
Vertical profile uniform
Target
Average 14.5
Wettest 15.0
Temperature, oC 20
Density, kg dry matter/m3 672
Value, £/tonne at 14.5% w.b. 160
Weather Historical records on hourly basis for Waddington, Lincs from 1951-1970
Starting date for drying 15 August each year
Energy Electricity is ‘Economy 7’ rate, off-peak is from 12 midnight to 7a.m.
On-peak electricity price, p/kWh 15
Off-peak electricity price, p/kWh 5
Propane gas (liquid) price, p/l 40
Calorific value of liquid propane gas, MJ/l 26.8
Stirring system Grain stirred every, h 6
Clearance between auger tip and floor, m 0.05
Power used by augers + gantry motors, kW 4.6
Power used by extraction fans, kW 1.2
(only used for runs at elevated plenum temperature)

94
APPENDIX B. TABLES 10 TO 30
Table 10. Static bed, 62% plenum air r.h. target, 15 Aug start, TC5 fan, Policy 18
Initi
al m
.c.,
% w
.b.
Bed
dep
th, m
Suc
cess
ful y
ears
of 2
0
Tim
e w
hen
aver
age
mc
targ
et m
et (w
atm
), h
Tim
e w
hen
both
targ
ets
met
(wbt
m),
h
Fan
time
wbt
m, h
Hea
ter t
ime
wbt
m, h
Stir
rer t
ime
wbt
m, h
Av
mc
wbt
m, %
wb
Max
spo
ilage
inde
x w
btm
Ove
rdry
ing
wbt
m, k
g/dr
ied
t
Tota
l ene
rgy
wbt
m, M
J/dr
ied
t
Fuel
cos
t wbt
m, £
/drie
d t
Ove
rdry
ing
cost
wbt
m, £
/drie
d t
Tota
l cos
t inc
l dm
loss
& o
verd
ryin
g w
btm
, £/d
ried
t
Fuel
cos
t wbt
m, £
/(drie
d t %
rem
oved
)
Ele
c co
st w
btm
, £/(d
ried
t % re
mov
ed)
Tota
l cos
t inc
l dm
loss
& o
verd
ryin
g w
btm
, £/(d
ried
t %
rem
oved
)
24 4 0 n/a
3 0 n/a
2 19 166 189 189 156 0 13.8 1.65 8.1 410 4.43 1.30 9.69 0.44 0.37 0.95
22 4 2 n/a
3 19 223 255 255 210 0 13.9 1.56 7.5 347 3.61 1.20 8.47 0.45 0.43 1.04
2 20 140 165 165 135 0 13.8 0.98 7.8 353 3.80 1.25 8.42 0.47 0.40 1.03
20 4 20 262 307 307 249 0 13.8 1.13 8.0 289 2.90 1.29 7.45 0.47 0.52 1.21
3 20 185 220 220 180 0 13.8 0.79 7.8 298 3.09 1.26 7.42 0.51 0.49 1.20
2 20 118 143 143 118 0 13.9 0.47 7.2 306 3.30 1.15 7.29 0.55 0.46 1.20
18 4 20 210 262 262 212 0 13.8 0.44 7.8 247 2.48 1.25 6.45 0.60 0.65 1.55
3 20 149 187 187 153 0 13.8 0.30 7.6 249 2.57 1.22 6.36 0.63 0.62 1.54
2 20 96 122 122 101 0 14.0 0.18 6.3 260 2.81 1.01 6.21 0.71 0.59 1.54
16 4 20 145 210 210 170 0 13.9 0.13 7.1 196 1.96 1.14 5.25 0.96 1.04 2.52
3 20 106 147 147 120 0 13.9 0.09 6.5 194 2.00 1.04 5.04 1.01 0.99 2.48
2 20 66 91 91 74 0 14.0 0.05 5.3 188 2.01 0.84 4.64 1.06 0.92 2.40
Note:
Average target for the bed as a whole was 14.5% m.c.
wbtm = when both targets met, 14.5% average and 15.0% wettest part
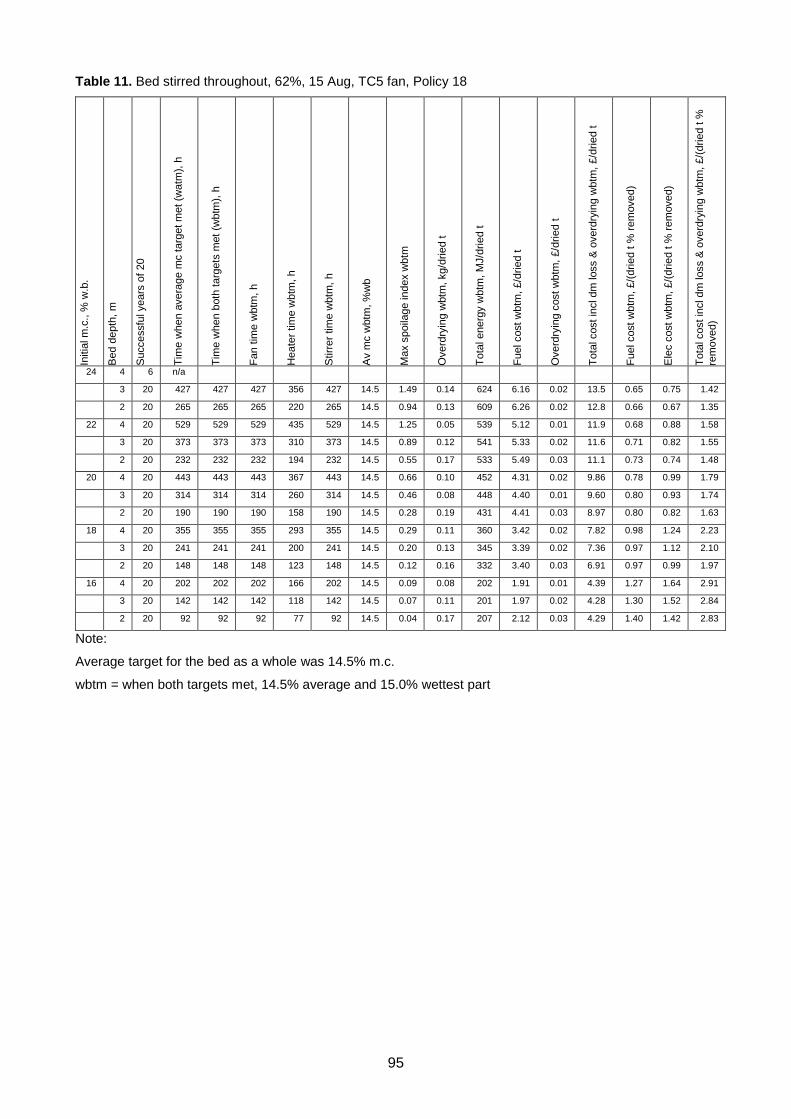
95
Table 11. Bed stirred throughout, 62%, 15 Aug, TC5 fan, Policy 18 In
itial
m.c
., %
w.b
.
Bed
dep
th, m
Suc
cess
ful y
ears
of 2
0
Tim
e w
hen
aver
age
mc
targ
et m
et (w
atm
), h
Tim
e w
hen
both
targ
ets
met
(wbt
m),
h
Fan
time
wbt
m, h
Hea
ter t
ime
wbt
m, h
Stir
rer t
ime
wbt
m, h
Av
mc
wbt
m, %
wb
Max
spo
ilage
inde
x w
btm
Ove
rdry
ing
wbt
m, k
g/dr
ied
t
Tota
l ene
rgy
wbt
m, M
J/dr
ied
t
Fuel
cos
t wbt
m, £
/drie
d t
Ove
rdry
ing
cost
wbt
m, £
/drie
d t
Tota
l cos
t inc
l dm
loss
& o
verd
ryin
g w
btm
, £/d
ried
t
Fuel
cos
t wbt
m, £
/(drie
d t %
rem
oved
)
Ele
c co
st w
btm
, £/(d
ried
t % re
mov
ed)
Tota
l cos
t inc
l dm
loss
& o
verd
ryin
g w
btm
, £/(d
ried
t %
rem
oved
)
24 4 6 n/a
3 20 427 427 427 356 427 14.5 1.49 0.14 624 6.16 0.02 13.5 0.65 0.75 1.42
2 20 265 265 265 220 265 14.5 0.94 0.13 609 6.26 0.02 12.8 0.66 0.67 1.35
22 4 20 529 529 529 435 529 14.5 1.25 0.05 539 5.12 0.01 11.9 0.68 0.88 1.58
3 20 373 373 373 310 373 14.5 0.89 0.12 541 5.33 0.02 11.6 0.71 0.82 1.55
2 20 232 232 232 194 232 14.5 0.55 0.17 533 5.49 0.03 11.1 0.73 0.74 1.48
20 4 20 443 443 443 367 443 14.5 0.66 0.10 452 4.31 0.02 9.86 0.78 0.99 1.79
3 20 314 314 314 260 314 14.5 0.46 0.08 448 4.40 0.01 9.60 0.80 0.93 1.74
2 20 190 190 190 158 190 14.5 0.28 0.19 431 4.41 0.03 8.97 0.80 0.82 1.63
18 4 20 355 355 355 293 355 14.5 0.29 0.11 360 3.42 0.02 7.82 0.98 1.24 2.23
3 20 241 241 241 200 241 14.5 0.20 0.13 345 3.39 0.02 7.36 0.97 1.12 2.10
2 20 148 148 148 123 148 14.5 0.12 0.16 332 3.40 0.03 6.91 0.97 0.99 1.97
16 4 20 202 202 202 166 202 14.5 0.09 0.08 202 1.91 0.01 4.39 1.27 1.64 2.91
3 20 142 142 142 118 142 14.5 0.07 0.11 201 1.97 0.02 4.28 1.30 1.52 2.84
2 20 92 92 92 77 92 14.5 0.04 0.17 207 2.12 0.03 4.29 1.40 1.42 2.83
Note:
Average target for the bed as a whole was 14.5% m.c.
wbtm = when both targets met, 14.5% average and 15.0% wettest part

96
Table 12. Static bed, 62%, 15 Sep, TC5 fan, Policy 18
Initi
al m
.c.,
% w
.b.
Bed
dep
th, m
Suc
cess
ful y
ears
of 2
0
Tim
e w
hen
aver
age
mc
targ
et m
et (w
atm
), h
Tim
e w
hen
both
targ
ets
met
(wbt
m),
h
Fan
time
wbt
m, h
Hea
ter t
ime
wbt
m, h
Stir
rer t
ime
wbt
m, h
Av
mc
wbt
m, %
wb
Max
spo
ilage
inde
x w
btm
Ove
rdry
ing
wbt
m, k
g/dr
ied
t
Tota
l ene
rgy
wbt
m, M
J/dr
ied
t
Fuel
cos
t wbt
m, £
/drie
d t
Ove
rdry
ing
cost
wbt
m, £
/drie
d t
Tota
l cos
t inc
l dm
loss
& o
verd
ryin
g w
btm
, £/d
ried
t
Fuel
cos
t wbt
m, £
/(drie
d t %
rem
oved
)
Ele
c co
st w
btm
, £/(d
ried
t % re
mov
ed)
Tota
l cos
t inc
l dm
loss
& o
verd
ryin
g w
btm
, £/(d
ried
t %
rem
oved
)
24 4 0 n/a
3 0 n/a
2 20 179 200 200 175 0 14.0 1.52 5.5 458 5.05 0.88 10.1 0.51 0.40 1.01
22 4 11 n/a
3 20 238 269 269 233 0 14.0 1.45 6.1 382 4.05 0.98 8.87 0.51 0.46 1.11
2 20 153 176 176 153 0 14.1 0.87 4.4 397 4.37 0.71 8.62 0.56 0.44 1.10
20 4 20 280 325 325 279 0 14.0 1.00 6.2 319 3.26 0.99 7.67 0.54 0.56 1.27
3 20 201 233 233 203 0 14.1 0.69 5.0 330 3.50 0.81 7.54 0.59 0.54 1.27
2 20 130 152 152 132 0 14.1 0.42 4.5 342 3.76 0.72 7.49 0.64 0.51 1.27
18 4 20 231 277 277 240 0 14.0 0.39 5.8 273 2.80 0.93 6.60 0.71 0.71 1.65
3 20 165 199 199 173 0 14.1 0.26 4.9 279 2.94 0.78 6.44 0.75 0.69 1.65
2 20 107 130 130 113 0 14.2 0.16 3.9 293 3.24 0.62 6.39 0.85 0.66 1.67
16 4 20 167 221 221 191 0 14.1 0.11 4.6 216 2.22 0.74 5.21 1.18 1.20 2.76
3 20 119 154 154 133 0 14.2 0.08 3.9 213 2.25 0.63 4.96 1.23 1.14 2.71
2 20 77 96 96 84 0 14.2 0.05 3.2 218 2.41 0.51 4.78 1.37 1.06 2.70
Note:
Average target for the bed as a whole was 14.5% m.c.
wbtm = when both targets met, 14.5% average and 15.0% wettest part

97
Table 13. Bed stirred throughout, 62%, 15 Sep, TC5 fan, Policy 18
Initi
al m
.c.,
% w
.b.
Bed
dep
th, m
Suc
cess
ful y
ears
of 2
0
Tim
e w
hen
aver
age
mc
targ
et m
et (w
atm
), h
Tim
e w
hen
both
targ
ets
met
(wbt
m),
h
Fan
time
wbt
m, h
Hea
ter t
ime
wbt
m, h
Stir
rer t
ime
wbt
m, h
Av
mc
wbt
m, %
wb
Max
spo
ilage
inde
x w
btm
Ove
rdry
ing
wbt
m, k
g/dr
ied
t
Tota
l ene
rgy
wbt
m, M
J/dr
ied
t
Fuel
cos
t wbt
m, £
/drie
d t
Ove
rdry
ing
cost
wbt
m, £
/drie
d t
Tota
l cos
t inc
l dm
loss
& o
verd
ryin
g w
btm
, £/d
ried
t
Fuel
cos
t wbt
m, £
/(drie
d t %
rem
oved
)
Ele
c co
st w
btm
, £/(d
ried
t % re
mov
ed)
Tota
l cos
t inc
l dm
loss
& o
verd
ryin
g w
btm
, £/(d
ried
t %
rem
oved
)
24 4 13 n/a
3 20 521 521 521 459 521 14.5 1.39 0.11 793 7.99 0.02 16.9 0.84 0.91 1.78
2 20 297 297 297 262 297 14.5 0.88 0.17 722 7.59 0.03 14.9 0.80 0.75 1.57
22 4 20 666 666 666 589 666 14.5 1.16 0.09 719 7.05 0.01 15.5 0.94 1.10 2.06
3 20 433 433 433 381 433 14.5 0.82 0.09 651 6.54 0.01 13.8 0.87 0.95 1.84
2 20 257 257 257 228 257 14.5 0.52 0.19 623 6.56 0.03 12.8 0.87 0.82 1.70
20 4 20 558 558 558 491 558 14.5 0.61 0.05 592 5.77 0.01 12.7 1.05 1.25 2.31
3 20 376 376 376 331 376 14.5 0.43 0.12 564 5.67 0.02 11.9 1.03 1.12 2.16
2 20 221 221 221 195 221 14.5 0.27 0.20 528 5.55 0.03 10.8 1.01 0.95 1.97
18 4 20 413 413 413 363 413 14.5 0.28 0.06 434 4.22 0.01 9.33 1.20 1.45 2.66
3 20 277 277 277 243 277 14.5 0.19 0.13 414 4.17 0.02 8.71 1.19 1.28 2.48
2 20 179 179 179 156 179 14.5 0.12 0.11 420 4.38 0.02 8.63 1.25 1.20 2.46
16 4 20 239 239 239 208 239 14.5 0.09 0.11 248 2.40 0.02 5.34 1.59 1.93 3.54
3 20 173 173 173 150 173 14.5 0.06 0.07 254 2.53 0.01 5.36 1.68 1.87 3.56
2 20 112 112 112 99 112 14.5 0.04 0.16 266 2.78 0.03 5.43 1.84 1.73 3.59
Note:
Average target for the bed as a whole was 14.5% m.c.
wbtm = when both targets met, 14.5% average and 15.0% wettest part
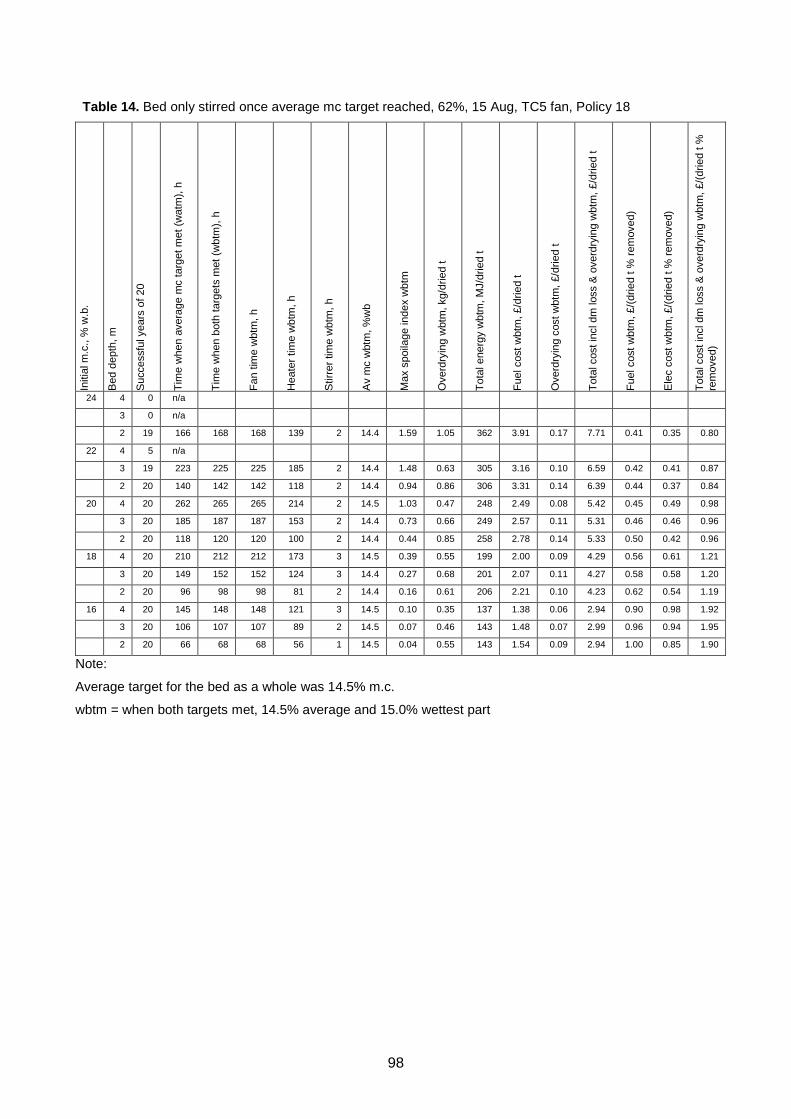
98
Table 14. Bed only stirred once average mc target reached, 62%, 15 Aug, TC5 fan, Policy 18
Initi
al m
.c.,
% w
.b.
Bed
dep
th, m
Suc
cess
ful y
ears
of 2
0
Tim
e w
hen
aver
age
mc
targ
et m
et (w
atm
), h
Tim
e w
hen
both
targ
ets
met
(wbt
m),
h
Fan
time
wbt
m, h
Hea
ter t
ime
wbt
m, h
Stir
rer t
ime
wbt
m, h
Av
mc
wbt
m, %
wb
Max
spo
ilage
inde
x w
btm
Ove
rdry
ing
wbt
m, k
g/dr
ied
t
Tota
l ene
rgy
wbt
m, M
J/dr
ied
t
Fuel
cos
t wbt
m, £
/drie
d t
Ove
rdry
ing
cost
wbt
m, £
/drie
d t
Tota
l cos
t inc
l dm
loss
& o
verd
ryin
g w
btm
, £/d
ried
t
Fuel
cos
t wbt
m, £
/(drie
d t %
rem
oved
)
Ele
c co
st w
btm
, £/(d
ried
t % re
mov
ed)
Tota
l cos
t inc
l dm
loss
& o
verd
ryin
g w
btm
, £/(d
ried
t %
rem
oved
)
24 4 0 n/a
3 0 n/a
2 19 166 168 168 139 2 14.4 1.59 1.05 362 3.91 0.17 7.71 0.41 0.35 0.80
22 4 5 n/a
3 19 223 225 225 185 2 14.4 1.48 0.63 305 3.16 0.10 6.59 0.42 0.41 0.87
2 20 140 142 142 118 2 14.4 0.94 0.86 306 3.31 0.14 6.39 0.44 0.37 0.84
20 4 20 262 265 265 214 2 14.5 1.03 0.47 248 2.49 0.08 5.42 0.45 0.49 0.98
3 20 185 187 187 153 2 14.4 0.73 0.66 249 2.57 0.11 5.31 0.46 0.46 0.96
2 20 118 120 120 100 2 14.4 0.44 0.85 258 2.78 0.14 5.33 0.50 0.42 0.96
18 4 20 210 212 212 173 3 14.5 0.39 0.55 199 2.00 0.09 4.29 0.56 0.61 1.21
3 20 149 152 152 124 3 14.4 0.27 0.68 201 2.07 0.11 4.27 0.58 0.58 1.20
2 20 96 98 98 81 2 14.4 0.16 0.61 206 2.21 0.10 4.23 0.62 0.54 1.19
16 4 20 145 148 148 121 3 14.5 0.10 0.35 137 1.38 0.06 2.94 0.90 0.98 1.92
3 20 106 107 107 89 2 14.5 0.07 0.46 143 1.48 0.07 2.99 0.96 0.94 1.95
2 20 66 68 68 56 1 14.5 0.04 0.55 143 1.54 0.09 2.94 1.00 0.85 1.90
Note:
Average target for the bed as a whole was 14.5% m.c.
wbtm = when both targets met, 14.5% average and 15.0% wettest part

99
Table 15. Bed stirred until max mc <18% then not stirred then stirred once average mc target reached,
62%, 15 Aug, TC5 fan, Policy 18
Initi
al m
.c.,
% w
.b.
Bed
dep
th, m
Suc
cess
ful y
ears
of 2
0
Tim
e w
hen
aver
age
mc
targ
et m
et (w
atm
), h
Tim
e w
hen
both
targ
ets
met
(wbt
m),
h
Fan
time
wbt
m, h
Hea
ter t
ime
wbt
m, h
Stir
rer t
ime
wbt
m, h
Av
mc
wbt
m, %
wb
Max
spo
ilage
inde
x w
btm
Ove
rdry
ing
wbt
m, k
g/dr
ied
t
Tota
l ene
rgy
wbt
m, M
J/dr
ied
t
Fuel
cos
t wbt
m, £
/drie
d t
Ove
rdry
ing
cost
wbt
m, £
/drie
d t
Tota
l cos
t inc
l dm
loss
& o
verd
ryin
g w
btm
, £/d
ried
t
Fuel
cos
t wbt
m, £
/(drie
d t %
rem
oved
)
Ele
c co
st w
btm
, £/(d
ried
t % re
mov
ed)
Tota
l cos
t inc
l dm
loss
& o
verd
ryin
g w
btm
, £/(d
ried
t %
rem
oved
)
24 4 1 n/a
3 20 340 342 342 282 213 14.4 1.55 0.62 483 4.84 0.10 10.5 0.51 0.56 1.10
2 20 214 216 216 179 137 14.4 0.97 0.89 485 5.08 0.14 10.2 0.53 0.51 1.07
22 4 20 404 407 407 332 218 14.5 1.34 0.55 400 3.90 0.09 8.83 0.52 0.62 1.17
3 20 286 288 288 236 157 14.4 0.94 0.70 399 4.00 0.11 8.63 0.53 0.58 1.14
2 20 179 181 181 150 102 14.4 0.59 0.99 401 4.20 0.16 8.42 0.55 0.53 1.11
20 4 20 316 320 320 260 131 14.5 0.74 0.41 309 3.02 0.07 6.72 0.55 0.64 1.21
3 20 223 225 225 186 96 14.4 0.52 0.60 311 3.15 0.10 6.63 0.57 0.60 1.19
2 20 141 143 143 119 63 14.4 0.32 0.88 313 3.31 0.14 6.53 0.59 0.55 1.17
18 4 20 214 218 218 177 5 14.5 0.37 0.52 204 2.05 0.08 4.39 0.58 0.63 1.24
3 20 151 153 153 125 3 14.4 0.26 0.64 203 2.09 0.10 4.30 0.59 0.59 1.21
2 20 97 99 99 82 2 14.4 0.16 0.64 208 2.24 0.10 4.28 0.63 0.54 1.21
16 4 20 145 148 148 121 2 14.5 0.10 0.39 137 1.37 0.06 2.94 0.90 0.98 1.92
3 20 106 107 107 89 2 14.5 0.07 0.46 143 1.48 0.07 2.99 0.96 0.94 1.95
2 20 66 68 68 56 1 14.5 0.04 0.57 143 1.54 0.09 2.94 0.99 0.85 1.90
Note:
Average target for the bed as a whole was 14.5% m.c.
wbtm = when both targets met, 14.5% average and 15.0% wettest part
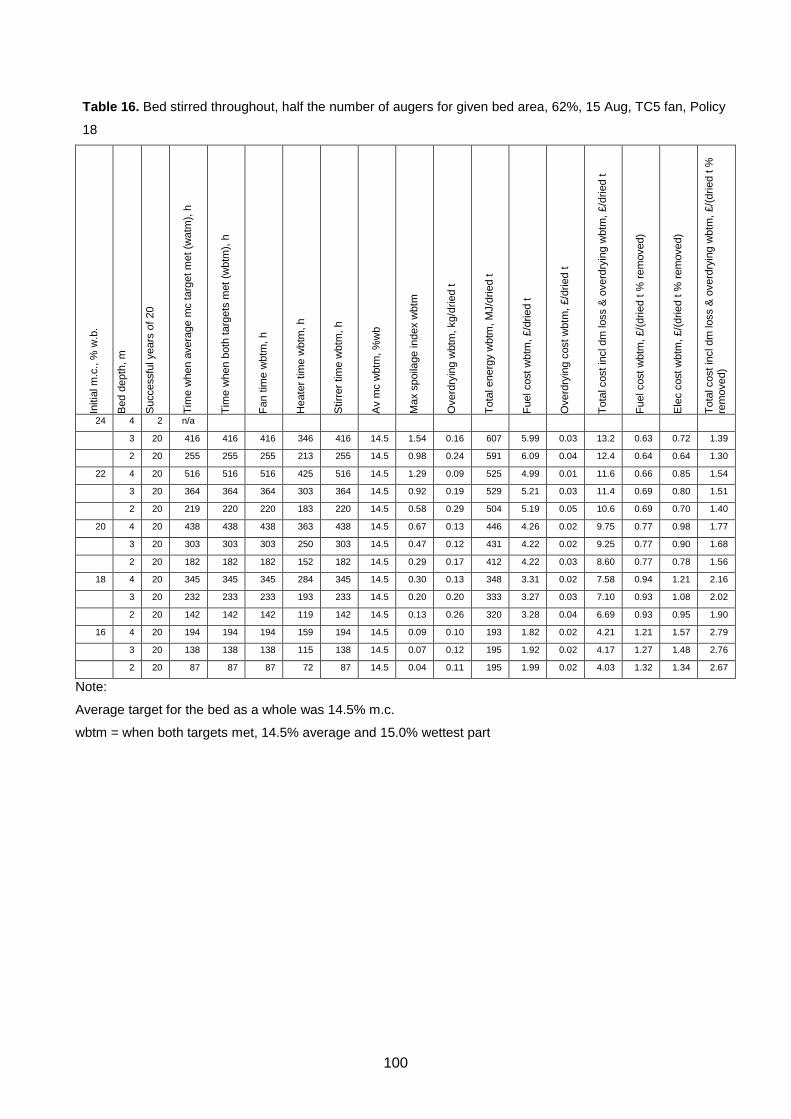
100
Table 16. Bed stirred throughout, half the number of augers for given bed area, 62%, 15 Aug, TC5 fan, Policy
18
Initi
al m
.c.,
% w
.b.
Bed
dep
th, m
Suc
cess
ful y
ears
of 2
0
Tim
e w
hen
aver
age
mc
targ
et m
et (w
atm
), h
Tim
e w
hen
both
targ
ets
met
(wbt
m),
h
Fan
time
wbt
m, h
Hea
ter t
ime
wbt
m, h
Stir
rer t
ime
wbt
m, h
Av
mc
wbt
m, %
wb
Max
spo
ilage
inde
x w
btm
Ove
rdry
ing
wbt
m, k
g/dr
ied
t
Tota
l ene
rgy
wbt
m, M
J/dr
ied
t
Fuel
cos
t wbt
m, £
/drie
d t
Ove
rdry
ing
cost
wbt
m, £
/drie
d t
Tota
l cos
t inc
l dm
loss
& o
verd
ryin
g w
btm
, £/d
ried
t
Fuel
cos
t wbt
m, £
/(drie
d t %
rem
oved
)
Ele
c co
st w
btm
, £/(d
ried
t % re
mov
ed)
Tota
l cos
t inc
l dm
loss
& o
verd
ryin
g w
btm
, £/(d
ried
t %
rem
oved
)
24 4 2 n/a
3 20 416 416 416 346 416 14.5 1.54 0.16 607 5.99 0.03 13.2 0.63 0.72 1.39
2 20 255 255 255 213 255 14.5 0.98 0.24 591 6.09 0.04 12.4 0.64 0.64 1.30
22 4 20 516 516 516 425 516 14.5 1.29 0.09 525 4.99 0.01 11.6 0.66 0.85 1.54
3 20 364 364 364 303 364 14.5 0.92 0.19 529 5.21 0.03 11.4 0.69 0.80 1.51
2 20 219 220 220 183 220 14.5 0.58 0.29 504 5.19 0.05 10.6 0.69 0.70 1.40
20 4 20 438 438 438 363 438 14.5 0.67 0.13 446 4.26 0.02 9.75 0.77 0.98 1.77
3 20 303 303 303 250 303 14.5 0.47 0.12 431 4.22 0.02 9.25 0.77 0.90 1.68
2 20 182 182 182 152 182 14.5 0.29 0.17 412 4.22 0.03 8.60 0.77 0.78 1.56
18 4 20 345 345 345 284 345 14.5 0.30 0.13 348 3.31 0.02 7.58 0.94 1.21 2.16
3 20 232 233 233 193 233 14.5 0.20 0.20 333 3.27 0.03 7.10 0.93 1.08 2.02
2 20 142 142 142 119 142 14.5 0.13 0.26 320 3.28 0.04 6.69 0.93 0.95 1.90
16 4 20 194 194 194 159 194 14.5 0.09 0.10 193 1.82 0.02 4.21 1.21 1.57 2.79
3 20 138 138 138 115 138 14.5 0.07 0.12 195 1.92 0.02 4.17 1.27 1.48 2.76
2 20 87 87 87 72 87 14.5 0.04 0.11 195 1.99 0.02 4.03 1.32 1.34 2.67
Note:
Average target for the bed as a whole was 14.5% m.c.
wbtm = when both targets met, 14.5% average and 15.0% wettest part
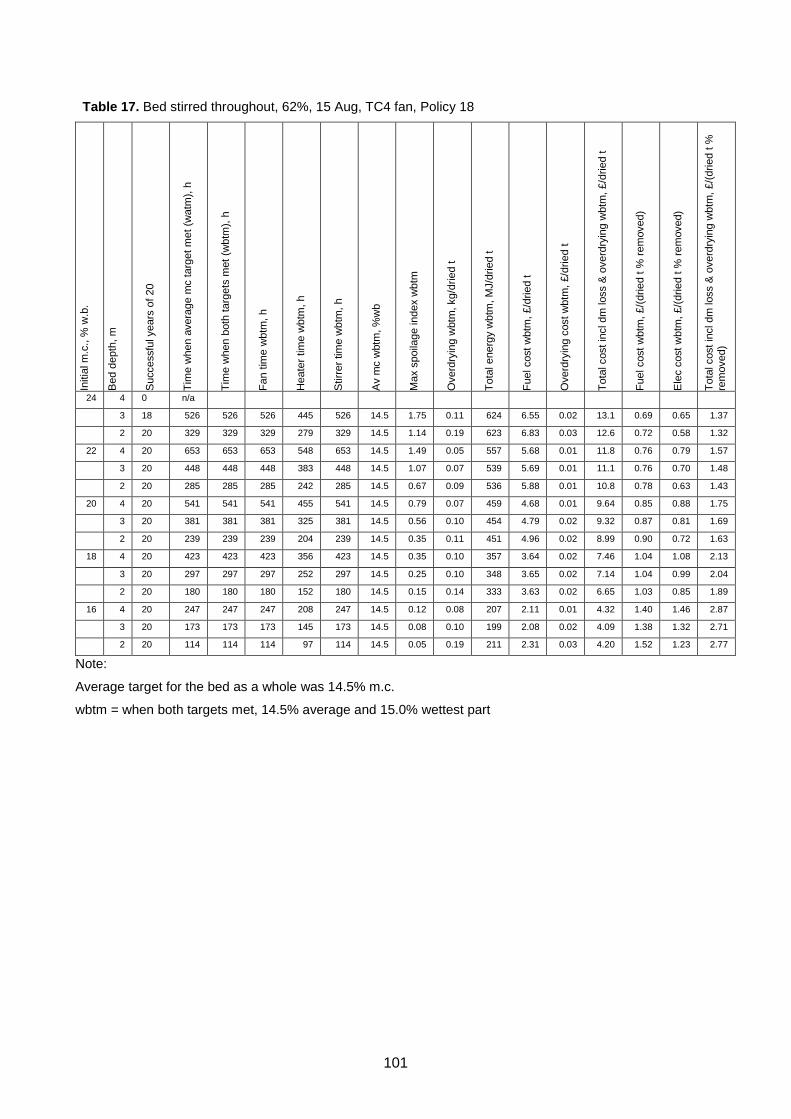
101
Table 17. Bed stirred throughout, 62%, 15 Aug, TC4 fan, Policy 18
Initi
al m
.c.,
% w
.b.
Bed
dep
th, m
Suc
cess
ful y
ears
of 2
0
Tim
e w
hen
aver
age
mc
targ
et m
et (w
atm
), h
Tim
e w
hen
both
targ
ets
met
(wbt
m),
h
Fan
time
wbt
m, h
Hea
ter t
ime
wbt
m, h
Stir
rer t
ime
wbt
m, h
Av
mc
wbt
m, %
wb
Max
spo
ilage
inde
x w
btm
Ove
rdry
ing
wbt
m, k
g/dr
ied
t
Tota
l ene
rgy
wbt
m, M
J/dr
ied
t
Fuel
cos
t wbt
m, £
/drie
d t
Ove
rdry
ing
cost
wbt
m, £
/drie
d t
Tota
l cos
t inc
l dm
loss
& o
verd
ryin
g w
btm
, £/d
ried
t
Fuel
cos
t wbt
m, £
/(drie
d t %
rem
oved
)
Ele
c co
st w
btm
, £/(d
ried
t % re
mov
ed)
Tota
l cos
t inc
l dm
loss
& o
verd
ryin
g w
btm
, £/(d
ried
t %
rem
oved
)
24 4 0 n/a
3 18 526 526 526 445 526 14.5 1.75 0.11 624 6.55 0.02 13.1 0.69 0.65 1.37
2 20 329 329 329 279 329 14.5 1.14 0.19 623 6.83 0.03 12.6 0.72 0.58 1.32
22 4 20 653 653 653 548 653 14.5 1.49 0.05 557 5.68 0.01 11.8 0.76 0.79 1.57
3 20 448 448 448 383 448 14.5 1.07 0.07 539 5.69 0.01 11.1 0.76 0.70 1.48
2 20 285 285 285 242 285 14.5 0.67 0.09 536 5.88 0.01 10.8 0.78 0.63 1.43
20 4 20 541 541 541 455 541 14.5 0.79 0.07 459 4.68 0.01 9.64 0.85 0.88 1.75
3 20 381 381 381 325 381 14.5 0.56 0.10 454 4.79 0.02 9.32 0.87 0.81 1.69
2 20 239 239 239 204 239 14.5 0.35 0.11 451 4.96 0.02 8.99 0.90 0.72 1.63
18 4 20 423 423 423 356 423 14.5 0.35 0.10 357 3.64 0.02 7.46 1.04 1.08 2.13
3 20 297 297 297 252 297 14.5 0.25 0.10 348 3.65 0.02 7.14 1.04 0.99 2.04
2 20 180 180 180 152 180 14.5 0.15 0.14 333 3.63 0.02 6.65 1.03 0.85 1.89
16 4 20 247 247 247 208 247 14.5 0.12 0.08 207 2.11 0.01 4.32 1.40 1.46 2.87
3 20 173 173 173 145 173 14.5 0.08 0.10 199 2.08 0.02 4.09 1.38 1.32 2.71
2 20 114 114 114 97 114 14.5 0.05 0.19 211 2.31 0.03 4.20 1.52 1.23 2.77
Note:
Average target for the bed as a whole was 14.5% m.c.
wbtm = when both targets met, 14.5% average and 15.0% wettest part

102
Table 18. Bed stirred throughout, 62%, 15 Aug, TC6 fan, Policy 18
Initi
al m
.c.,
% w
.b.
Bed
dep
th, m
Suc
cess
ful y
ears
of 2
0
Tim
e w
hen
aver
age
mc
targ
et m
et (w
atm
), h
Tim
e w
hen
both
targ
ets
met
(wbt
m),
h
Fan
time
wbt
m, h
Hea
ter t
ime
wbt
m, h
Stir
rer t
ime
wbt
m, h
Av
mc
wbt
m, %
wb
Max
spo
ilage
inde
x w
btm
Ove
rdry
ing
wbt
m, k
g/dr
ied
t
Tota
l ene
rgy
wbt
m, M
J/dr
ied
t
Fuel
cos
t wbt
m, £
/drie
d t
Ove
rdry
ing
cost
wbt
m, £
/drie
d t
Tota
l cos
t inc
l dm
loss
& o
verd
ryin
g w
btm
, £/d
ried
t
Fuel
cos
t wbt
m, £
/(drie
d t %
rem
oved
)
Ele
c co
st w
btm
, £/(d
ried
t % re
mov
ed)
Tota
l cos
t inc
l dm
loss
& o
verd
ryin
g w
btm
, £/(d
ried
t %
rem
oved
)
24 4 10 n/a
3 20 403 403 403 339 403 14.5 1.41 0.13 622 6.22 0.02 13.3 0.65 0.72 1.40
2 20 240 240 240 200 240 14.5 0.85 0.17 615 6.44 0.03 12.7 0.68 0.64 1.34
22 4 20 517 517 517 426 517 14.5 1.23 0.07 538 5.13 0.01 11.8 0.68 0.87 1.57
3 20 357 357 357 300 357 14.5 0.84 0.13 545 5.45 0.02 11.6 0.73 0.80 1.55
2 20 204 204 204 170 204 14.5 0.50 0.26 516 5.39 0.04 10.7 0.72 0.69 1.42
20 4 20 439 439 439 364 439 14.5 0.64 0.15 457 4.38 0.02 9.95 0.79 0.99 1.81
3 20 296 296 296 247 296 14.5 0.43 0.12 444 4.41 0.02 9.44 0.80 0.90 1.71
2 20 171 171 171 141 171 14.5 0.25 0.16 423 4.40 0.03 8.75 0.80 0.78 1.59
18 4 20 349 349 349 288 349 14.5 0.29 0.09 360 3.44 0.01 7.81 0.98 1.24 2.23
3 20 229 229 229 192 229 14.5 0.19 0.10 344 3.43 0.02 7.27 0.98 1.09 2.07
2 20 134 134 134 112 134 14.5 0.11 0.20 333 3.48 0.03 6.84 0.99 0.95 1.95
16 4 20 198 198 198 163 198 14.5 0.09 0.10 201 1.91 0.02 4.37 1.26 1.62 2.90
3 20 136 136 136 115 136 14.5 0.06 0.13 203 2.02 0.02 4.30 1.34 1.50 2.85
2 20 82 82 82 68 82 14.5 0.04 0.13 200 2.08 0.02 4.12 1.37 1.34 2.73
Note:
Average target for the bed as a whole was 14.5% m.c.
wbtm = when both targets met, 14.5% average and 15.0% wettest part
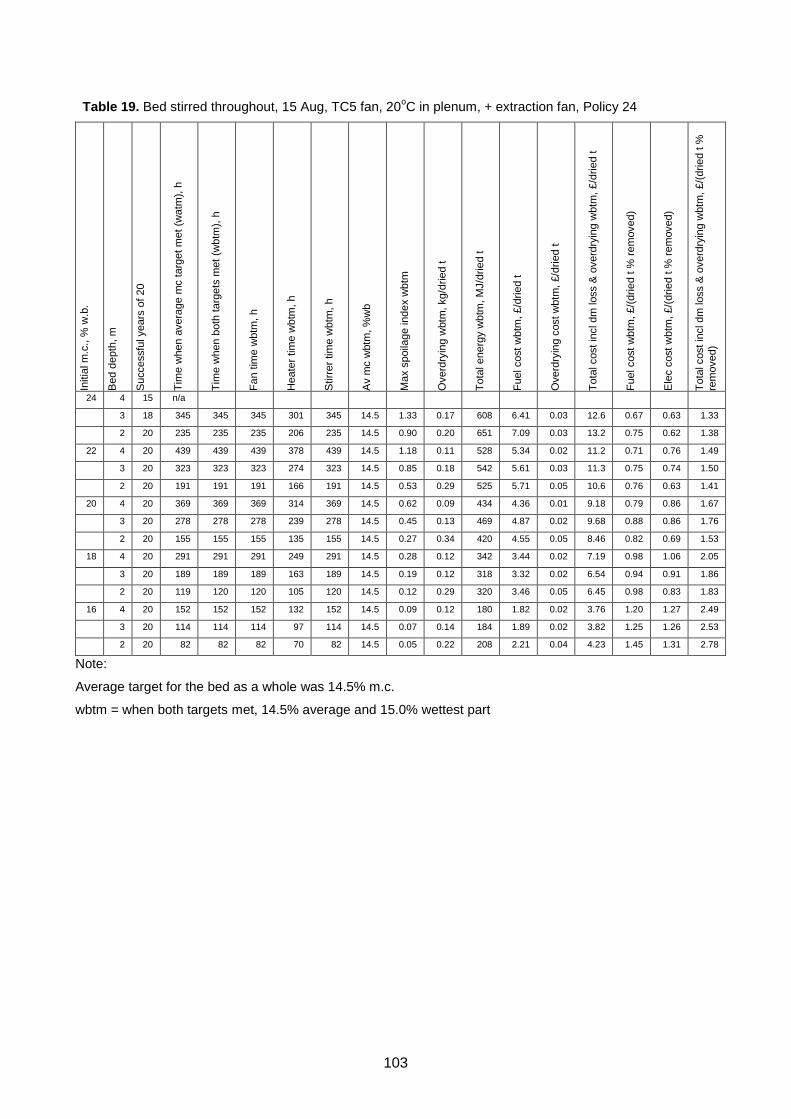
103
Table 19. Bed stirred throughout, 15 Aug, TC5 fan, 20oC in plenum, + extraction fan, Policy 24
Initi
al m
.c.,
% w
.b.
Bed
dep
th, m
Suc
cess
ful y
ears
of 2
0
Tim
e w
hen
aver
age
mc
targ
et m
et (w
atm
), h
Tim
e w
hen
both
targ
ets
met
(wbt
m),
h
Fan
time
wbt
m, h
Hea
ter t
ime
wbt
m, h
Stir
rer t
ime
wbt
m, h
Av
mc
wbt
m, %
wb
Max
spo
ilage
inde
x w
btm
Ove
rdry
ing
wbt
m, k
g/dr
ied
t
Tota
l ene
rgy
wbt
m, M
J/dr
ied
t
Fuel
cos
t wbt
m, £
/drie
d t
Ove
rdry
ing
cost
wbt
m, £
/drie
d t
Tota
l cos
t inc
l dm
loss
& o
verd
ryin
g w
btm
, £/d
ried
t
Fuel
cos
t wbt
m, £
/(drie
d t %
rem
oved
)
Ele
c co
st w
btm
, £/(d
ried
t % re
mov
ed)
Tota
l cos
t inc
l dm
loss
& o
verd
ryin
g w
btm
, £/(d
ried
t %
rem
oved
)
24 4 15 n/a
3 18 345 345 345 301 345 14.5 1.33 0.17 608 6.41 0.03 12.6 0.67 0.63 1.33
2 20 235 235 235 206 235 14.5 0.90 0.20 651 7.09 0.03 13.2 0.75 0.62 1.38
22 4 20 439 439 439 378 439 14.5 1.18 0.11 528 5.34 0.02 11.2 0.71 0.76 1.49
3 20 323 323 323 274 323 14.5 0.85 0.18 542 5.61 0.03 11.3 0.75 0.74 1.50
2 20 191 191 191 166 191 14.5 0.53 0.29 525 5.71 0.05 10.6 0.76 0.63 1.41
20 4 20 369 369 369 314 369 14.5 0.62 0.09 434 4.36 0.01 9.18 0.79 0.86 1.67
3 20 278 278 278 239 278 14.5 0.45 0.13 469 4.87 0.02 9.68 0.88 0.86 1.76
2 20 155 155 155 135 155 14.5 0.27 0.34 420 4.55 0.05 8.46 0.82 0.69 1.53
18 4 20 291 291 291 249 291 14.5 0.28 0.12 342 3.44 0.02 7.19 0.98 1.06 2.05
3 20 189 189 189 163 189 14.5 0.19 0.12 318 3.32 0.02 6.54 0.94 0.91 1.86
2 20 119 120 120 105 120 14.5 0.12 0.29 320 3.46 0.05 6.45 0.98 0.83 1.83
16 4 20 152 152 152 132 152 14.5 0.09 0.12 180 1.82 0.02 3.76 1.20 1.27 2.49
3 20 114 114 114 97 114 14.5 0.07 0.14 184 1.89 0.02 3.82 1.25 1.26 2.53
2 20 82 82 82 70 82 14.5 0.05 0.22 208 2.21 0.04 4.23 1.45 1.31 2.78
Note:
Average target for the bed as a whole was 14.5% m.c.
wbtm = when both targets met, 14.5% average and 15.0% wettest part
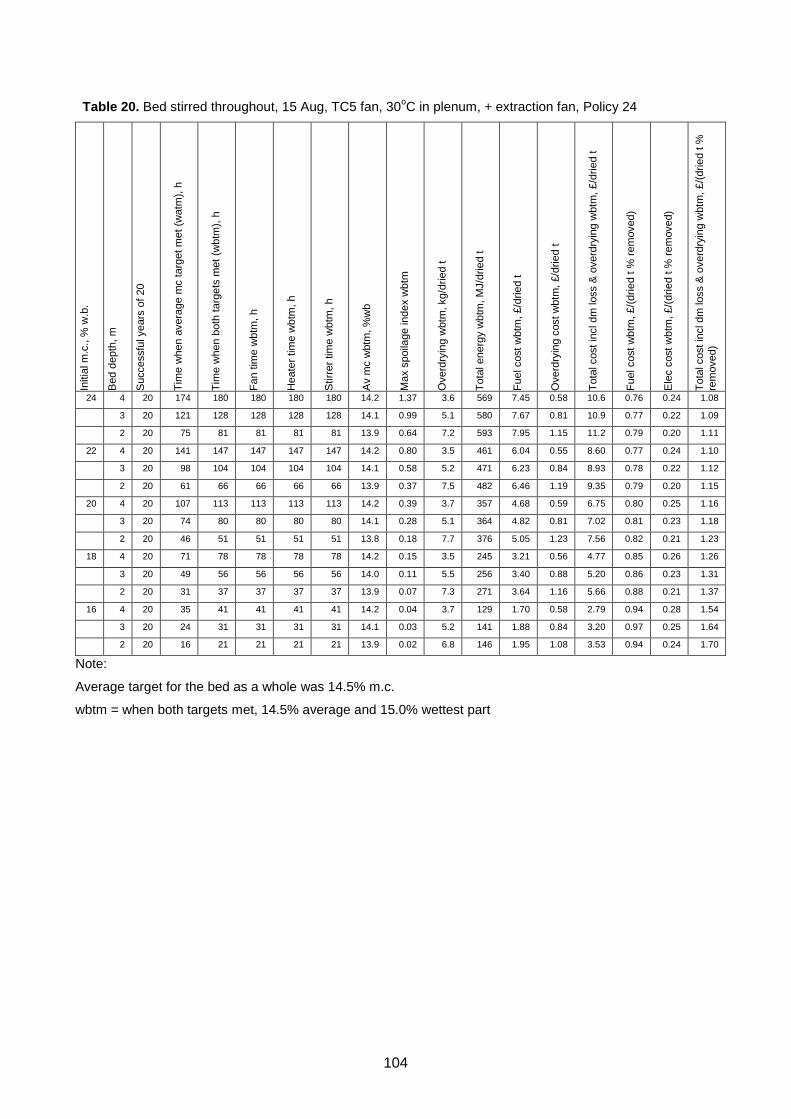
104
Table 20. Bed stirred throughout, 15 Aug, TC5 fan, 30oC in plenum, + extraction fan, Policy 24
Initi
al m
.c.,
% w
.b.
Bed
dep
th, m
Suc
cess
ful y
ears
of 2
0
Tim
e w
hen
aver
age
mc
targ
et m
et (w
atm
), h
Tim
e w
hen
both
targ
ets
met
(wbt
m),
h
Fan
time
wbt
m, h
Hea
ter t
ime
wbt
m, h
Stir
rer t
ime
wbt
m, h
Av
mc
wbt
m, %
wb
Max
spo
ilage
inde
x w
btm
Ove
rdry
ing
wbt
m, k
g/dr
ied
t
Tota
l ene
rgy
wbt
m, M
J/dr
ied
t
Fuel
cos
t wbt
m, £
/drie
d t
Ove
rdry
ing
cost
wbt
m, £
/drie
d t
Tota
l cos
t inc
l dm
loss
& o
verd
ryin
g w
btm
, £/d
ried
t
Fuel
cos
t wbt
m, £
/(drie
d t %
rem
oved
)
Ele
c co
st w
btm
, £/(d
ried
t % re
mov
ed)
Tota
l cos
t inc
l dm
loss
& o
verd
ryin
g w
btm
, £/(d
ried
t %
rem
oved
)
24 4 20 174 180 180 180 180 14.2 1.37 3.6 569 7.45 0.58 10.6 0.76 0.24 1.08
3 20 121 128 128 128 128 14.1 0.99 5.1 580 7.67 0.81 10.9 0.77 0.22 1.09
2 20 75 81 81 81 81 13.9 0.64 7.2 593 7.95 1.15 11.2 0.79 0.20 1.11
22 4 20 141 147 147 147 147 14.2 0.80 3.5 461 6.04 0.55 8.60 0.77 0.24 1.10
3 20 98 104 104 104 104 14.1 0.58 5.2 471 6.23 0.84 8.93 0.78 0.22 1.12
2 20 61 66 66 66 66 13.9 0.37 7.5 482 6.46 1.19 9.35 0.79 0.20 1.15
20 4 20 107 113 113 113 113 14.2 0.39 3.7 357 4.68 0.59 6.75 0.80 0.25 1.16
3 20 74 80 80 80 80 14.1 0.28 5.1 364 4.82 0.81 7.02 0.81 0.23 1.18
2 20 46 51 51 51 51 13.8 0.18 7.7 376 5.05 1.23 7.56 0.82 0.21 1.23
18 4 20 71 78 78 78 78 14.2 0.15 3.5 245 3.21 0.56 4.77 0.85 0.26 1.26
3 20 49 56 56 56 56 14.0 0.11 5.5 256 3.40 0.88 5.20 0.86 0.23 1.31
2 20 31 37 37 37 37 13.9 0.07 7.3 271 3.64 1.16 5.66 0.88 0.21 1.37
16 4 20 35 41 41 41 41 14.2 0.04 3.7 129 1.70 0.58 2.79 0.94 0.28 1.54
3 20 24 31 31 31 31 14.1 0.03 5.2 141 1.88 0.84 3.20 0.97 0.25 1.64
2 20 16 21 21 21 21 13.9 0.02 6.8 146 1.95 1.08 3.53 0.94 0.24 1.70
Note:
Average target for the bed as a whole was 14.5% m.c.
wbtm = when both targets met, 14.5% average and 15.0% wettest part

105
Table 21. Bed stirred throughout, 15 Aug, TC5 fan, 40oC in plenum, + extraction fan, Policy 24
Initi
al m
.c.,
% w
.b.
Bed
dep
th, m
Suc
cess
ful y
ears
of 2
0
Tim
e w
hen
aver
age
mc
targ
et m
et (w
atm
), h
Tim
e w
hen
both
targ
ets
met
(wbt
m),
h
Fan
time
wbt
m, h
Hea
ter t
ime
wbt
m, h
Stir
rer t
ime
wbt
m, h
Av
mc
wbt
m, %
wb
Max
spo
ilage
inde
x w
btm
Ove
rdry
ing
wbt
m, k
g/dr
ied
t
Tota
l ene
rgy
wbt
m, M
J/dr
ied
t
Fuel
cos
t wbt
m, £
/drie
d t
Ove
rdry
ing
cost
wbt
m, £
/drie
d t
Tota
l cos
t inc
l dm
loss
& o
verd
ryin
g w
btm
, £/d
ried
t
Fuel
cos
t wbt
m, £
/(drie
d t %
rem
oved
)
Ele
c co
st w
btm
, £/(d
ried
t % re
mov
ed)
Tota
l cos
t inc
l dm
loss
& o
verd
ryin
g w
btm
, £/(d
ried
t %
rem
oved
)
24 4 20 106 115 115 115 115 13.6 1.33 10.0 601 8.31 1.59 11.6 0.80 0.15 1.12
3 20 74 82 82 82 82 13.4 0.97 12.7 623 8.66 2.04 12.2 0.82 0.13 1.16
2 20 46 53 53 53 53 13.0 0.64 17.2 650 9.11 2.75 13.3 0.83 0.12 1.21
22 4 20 85 94 94 94 94 13.7 0.79 9.9 489 6.76 1.59 9.67 0.81 0.15 1.16
3 20 59 68 68 68 68 13.4 0.58 13.1 507 7.05 2.09 10.4 0.82 0.14 1.20
2 20 37 44 44 44 44 13.0 0.39 17.0 528 7.40 2.72 11.3 0.83 0.12 1.26
20 4 20 64 73 73 73 73 13.6 0.41 10.2 381 5.27 1.63 7.88 0.83 0.15 1.24
3 20 44 53 53 53 53 13.4 0.30 13.0 399 5.56 2.08 8.55 0.84 0.13 1.29
2 20 28 35 35 35 35 13.1 0.20 16.8 427 5.99 2.69 9.50 0.86 0.11 1.37
18 4 20 43 52 52 52 52 13.6 0.17 10.2 273 3.78 1.63 6.08 0.86 0.15 1.39
3 20 30 39 39 39 39 13.4 0.12 12.9 289 4.03 2.06 6.72 0.88 0.14 1.46
2 20 19 26 26 26 26 13.1 0.08 16.7 307 4.31 2.67 7.62 0.87 0.13 1.55
16 4 20 21 31 31 31 31 13.7 0.05 9.8 161 2.23 1.57 4.16 0.96 0.15 1.78
3 20 15 23 23 23 23 13.5 0.04 12.1 170 2.37 1.93 4.70 0.94 0.16 1.85
2 20 10 16 16 16 16 13.2 0.02 15.0 189 2.65 2.40 5.39 0.96 0.12 1.94
Note:
Average target for the bed as a whole was 14.5% m.c.
wbtm = when both targets met, 14.5% average and 15.0% wettest part

106
Table 22. Bed stirred throughout, 15 Aug, TC5 fan, 50oC in plenum, + extraction fan, Policy 24
Initi
al m
.c.,
% w
.b.
Bed
dep
th, m
Suc
cess
ful y
ears
of 2
0
Tim
e w
hen
aver
age
mc
targ
et m
et (w
atm
), h
Tim
e w
hen
both
targ
ets
met
(wbt
m),
h
Fan
time
wbt
m, h
Hea
ter t
ime
wbt
m, h
Stir
rer t
ime
wbt
m, h
Av
mc
wbt
m, %
wb
Max
spo
ilage
inde
x w
btm
Ove
rdry
ing
wbt
m, k
g/dr
ied
t
Tota
l ene
rgy
wbt
m, M
J/dr
ied
t
Fuel
cos
t wbt
m, £
/drie
d t
Ove
rdry
ing
cost
wbt
m, £
/drie
d t
Tota
l cos
t inc
l dm
loss
& o
verd
ryin
g w
btm
, £/d
ried
t
Fuel
cos
t wbt
m, £
/(drie
d t %
rem
oved
)
Ele
c co
st w
btm
, £/(d
ried
t % re
mov
ed)
Tota
l cos
t inc
l dm
loss
& o
verd
ryin
g w
btm
, £/(d
ried
t %
rem
oved
)
24 4 20 76 87 87 87 87 13.2 1.44 15.8 635 8.98 2.52 12.8 0.83 0.10 1.18
3 20 54 63 63 63 63 12.8 1.04 20.2 665 9.44 3.23 13.9 0.84 0.10 1.24
2 20 34 41 41 41 41 12.3 0.69 25.6 697 9.95 4.10 15.1 0.85 0.09 1.30
22 4 20 61 72 72 72 72 13.1 0.87 15.9 521 7.36 2.55 11.0 0.83 0.11 1.24
3 20 43 52 52 52 52 12.8 0.65 20.2 549 7.79 3.24 12.0 0.84 0.10 1.30
2 20 27 34 34 34 34 12.3 0.43 25.6 588 8.40 4.09 13.3 0.87 0.08 1.38
20 4 20 46 57 57 57 57 13.1 0.46 16.2 417 5.90 2.60 9.25 0.86 0.10 1.34
3 20 32 42 42 42 42 12.8 0.35 20.1 434 6.16 3.21 10.1 0.85 0.10 1.40
2 20 20 27 27 27 27 12.3 0.23 25.5 466 6.65 4.08 11.4 0.87 0.09 1.49
18 4 20 31 42 42 42 42 13.1 0.20 15.9 301 4.25 2.54 7.33 0.88 0.11 1.51
3 20 22 31 31 31 31 12.8 0.15 19.7 327 4.64 3.15 8.28 0.89 0.09 1.60
2 20 14 21 21 21 21 12.3 0.10 25.2 349 4.97 4.03 9.52 0.88 0.09 1.68
16 4 20 16 26 26 26 26 13.2 0.06 15.4 190 2.68 2.46 5.48 0.95 0.12 1.95
3 20 11 20 20 20 20 12.9 0.05 18.3 203 2.89 2.93 6.15 0.94 0.11 2.00
2 20 7 14 14 14 14 12.6 0.03 22.3 232 3.32 3.57 7.17 0.97 0.08 2.10
Note:
Average target for the bed as a whole was 14.5% m.c.
wbtm = when both targets met, 14.5% average and 15.0% wettest part
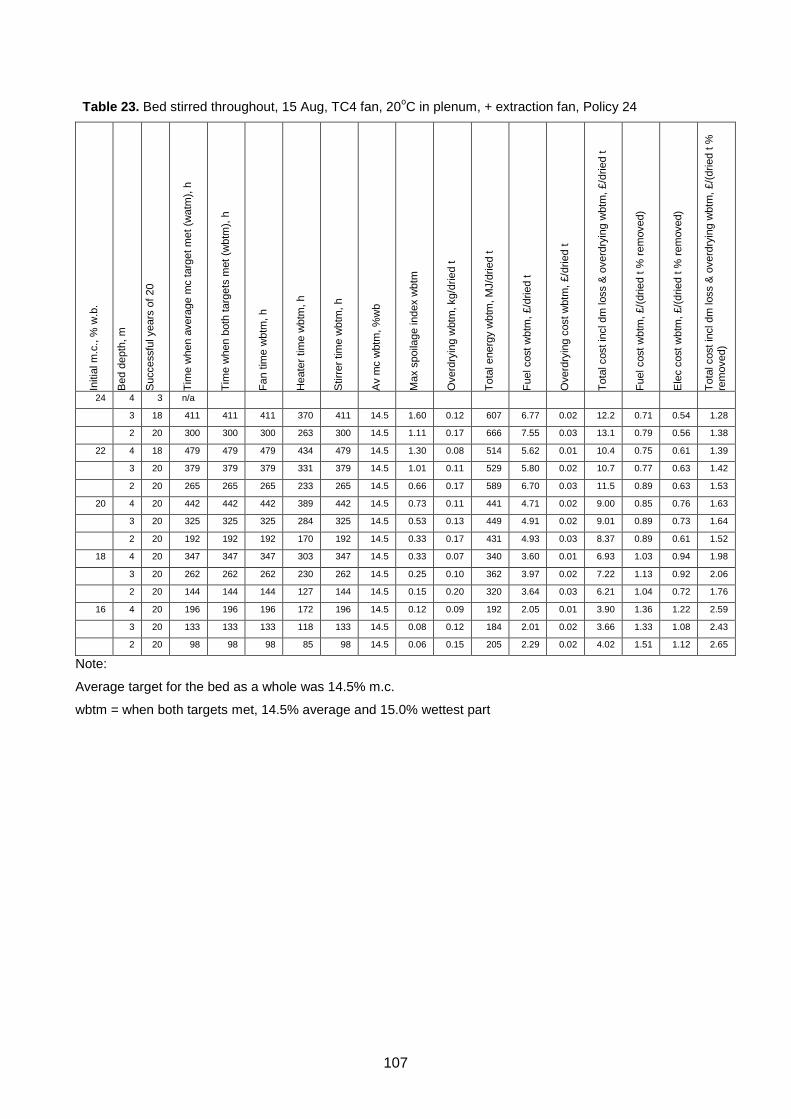
107
Table 23. Bed stirred throughout, 15 Aug, TC4 fan, 20oC in plenum, + extraction fan, Policy 24
Initi
al m
.c.,
% w
.b.
Bed
dep
th, m
Suc
cess
ful y
ears
of 2
0
Tim
e w
hen
aver
age
mc
targ
et m
et (w
atm
), h
Tim
e w
hen
both
targ
ets
met
(wbt
m),
h
Fan
time
wbt
m, h
Hea
ter t
ime
wbt
m, h
Stir
rer t
ime
wbt
m, h
Av
mc
wbt
m, %
wb
Max
spo
ilage
inde
x w
btm
Ove
rdry
ing
wbt
m, k
g/dr
ied
t
Tota
l ene
rgy
wbt
m, M
J/dr
ied
t
Fuel
cos
t wbt
m, £
/drie
d t
Ove
rdry
ing
cost
wbt
m, £
/drie
d t
Tota
l cos
t inc
l dm
loss
& o
verd
ryin
g w
btm
, £/d
ried
t
Fuel
cos
t wbt
m, £
/(drie
d t %
rem
oved
)
Ele
c co
st w
btm
, £/(d
ried
t % re
mov
ed)
Tota
l cos
t inc
l dm
loss
& o
verd
ryin
g w
btm
, £/(d
ried
t %
rem
oved
)
24 4 3 n/a
3 18 411 411 411 370 411 14.5 1.60 0.12 607 6.77 0.02 12.2 0.71 0.54 1.28
2 20 300 300 300 263 300 14.5 1.11 0.17 666 7.55 0.03 13.1 0.79 0.56 1.38
22 4 18 479 479 479 434 479 14.5 1.30 0.08 514 5.62 0.01 10.4 0.75 0.61 1.39
3 20 379 379 379 331 379 14.5 1.01 0.11 529 5.80 0.02 10.7 0.77 0.63 1.42
2 20 265 265 265 233 265 14.5 0.66 0.17 589 6.70 0.03 11.5 0.89 0.63 1.53
20 4 20 442 442 442 389 442 14.5 0.73 0.11 441 4.71 0.02 9.00 0.85 0.76 1.63
3 20 325 325 325 284 325 14.5 0.53 0.13 449 4.91 0.02 9.01 0.89 0.73 1.64
2 20 192 192 192 170 192 14.5 0.33 0.17 431 4.93 0.03 8.37 0.89 0.61 1.52
18 4 20 347 347 347 303 347 14.5 0.33 0.07 340 3.60 0.01 6.93 1.03 0.94 1.98
3 20 262 262 262 230 262 14.5 0.25 0.10 362 3.97 0.02 7.22 1.13 0.92 2.06
2 20 144 144 144 127 144 14.5 0.15 0.20 320 3.64 0.03 6.21 1.04 0.72 1.76
16 4 20 196 196 196 172 196 14.5 0.12 0.09 192 2.05 0.01 3.90 1.36 1.22 2.59
3 20 133 133 133 118 133 14.5 0.08 0.12 184 2.01 0.02 3.66 1.33 1.08 2.43
2 20 98 98 98 85 98 14.5 0.06 0.15 205 2.29 0.02 4.02 1.51 1.12 2.65
Note:
Average target for the bed as a whole was 14.5% m.c.
wbtm = when both targets met, 14.5% average and 15.0% wettest part

108
Table 24. Bed stirred throughout, 15 Aug, TC4 fan, 30oC in plenum, + extraction fan, Policy 24
Initi
al m
.c.,
% w
.b.
Bed
dep
th, m
Suc
cess
ful y
ears
of 2
0
Tim
e w
hen
aver
age
mc
targ
et m
et (w
atm
), h
Tim
e w
hen
both
targ
ets
met
(wbt
m),
h
Fan
time
wbt
m, h
Hea
ter t
ime
wbt
m, h
Stir
rer t
ime
wbt
m, h
Av
mc
wbt
m, %
wb
Max
spo
ilage
inde
x w
btm
Ove
rdry
ing
wbt
m, k
g/dr
ied
t
Tota
l ene
rgy
wbt
m, M
J/dr
ied
t
Fuel
cos
t wbt
m, £
/drie
d t
Ove
rdry
ing
cost
wbt
m, £
/drie
d t
Tota
l cos
t inc
l dm
loss
& o
verd
ryin
g w
btm
, £/d
ried
t
Fuel
cos
t wbt
m, £
/(drie
d t %
rem
oved
)
Ele
c co
st w
btm
, £/(d
ried
t % re
mov
ed)
Tota
l cos
t inc
l dm
loss
& o
verd
ryin
g w
btm
, £/(d
ried
t %
rem
oved
)
24 4 19 203 210 210 210 210 14.2 1.58 3.2 568 7.58 0.51 10.4 0.78 0.21 1.06
3 20 146 152 152 152 152 14.1 1.17 4.5 575 7.74 0.72 10.5 0.78 0.19 1.07
2 20 91 96 96 96 96 13.9 0.76 6.6 587 7.99 1.06 10.9 0.79 0.17 1.08
22 4 20 168 174 174 174 174 14.3 0.94 2.9 458 6.10 0.47 8.36 0.79 0.21 1.08
3 20 117 124 124 124 124 14.1 0.68 4.5 468 6.30 0.72 8.66 0.80 0.20 1.10
2 20 72 78 78 78 78 13.9 0.44 6.6 481 6.55 1.06 9.06 0.81 0.17 1.12
20 4 20 128 134 134 134 134 14.3 0.46 2.9 353 4.70 0.46 6.48 0.82 0.22 1.13
3 20 89 96 96 96 96 14.1 0.34 4.3 358 4.82 0.69 6.72 0.82 0.20 1.14
2 20 54 61 61 61 61 13.9 0.22 7.0 376 5.13 1.12 7.32 0.84 0.17 1.20
18 4 20 86 92 92 92 92 14.3 0.18 2.8 242 3.22 0.45 4.54 0.86 0.23 1.21
3 20 59 66 66 66 66 14.1 0.13 4.8 250 3.37 0.76 4.95 0.86 0.21 1.27
2 20 37 43 43 43 43 13.9 0.09 6.9 262 3.58 1.10 5.43 0.88 0.18 1.33
16 4 20 41 47 47 47 47 14.2 0.05 3.1 125 1.67 0.50 2.61 0.94 0.25 1.48
3 20 29 36 36 36 36 14.1 0.04 4.5 137 1.86 0.73 2.99 0.98 0.22 1.58
2 20 18 24 24 24 24 14.0 0.02 6.3 144 1.96 1.01 3.38 0.96 0.21 1.66
Note:
Average target for the bed as a whole was 14.5% m.c.
wbtm = when both targets met, 14.5% average and 15.0% wettest part

109
Table 25. Bed stirred throughout, 15 Aug, TC4 fan, 40oC in plenum, + extraction fan, Policy 24
Initi
al m
.c.,
% w
.b.
Bed
dep
th, m
Suc
cess
ful y
ears
of 2
0
Tim
e w
hen
aver
age
mc
targ
et m
et (w
atm
), h
Tim
e w
hen
both
targ
ets
met
(wbt
m),
h
Fan
time
wbt
m, h
Hea
ter t
ime
wbt
m, h
Stir
rer t
ime
wbt
m, h
Av
mc
wbt
m, %
wb
Max
spo
ilage
inde
x w
btm
Ove
rdry
ing
wbt
m, k
g/dr
ied
t
Tota
l ene
rgy
wbt
m, M
J/dr
ied
t
Fuel
cos
t wbt
m, £
/drie
d t
Ove
rdry
ing
cost
wbt
m, £
/drie
d t
Tota
l cos
t inc
l dm
loss
& o
verd
ryin
g w
btm
, £/d
ried
t
Fuel
cos
t wbt
m, £
/(drie
d t %
rem
oved
)
Ele
c co
st w
btm
, £/(d
ried
t % re
mov
ed)
Tota
l cos
t inc
l dm
loss
& o
verd
ryin
g w
btm
, £/(d
ried
t %
rem
oved
)
24 4 20 125 136 136 136 136 13.7 1.58 9.0 596 8.31 1.43 11.3 0.81 0.13 1.10
3 20 89 98 98 98 98 13.5 1.14 11.5 611 8.57 1.84 11.8 0.82 0.12 1.13
2 20 55 63 63 63 63 13.2 0.76 15.5 639 9.04 2.48 12.7 0.84 0.10 1.18
22 4 20 101 111 111 111 111 13.7 0.93 8.9 485 6.77 1.42 9.37 0.82 0.13 1.13
3 20 71 80 80 80 80 13.5 0.69 11.6 502 7.05 1.86 9.98 0.83 0.12 1.17
2 20 44 52 52 52 52 13.2 0.46 15.7 525 7.43 2.52 10.9 0.84 0.10 1.24
20 4 20 76 87 87 87 87 13.7 0.48 9.0 377 5.26 1.44 7.55 0.84 0.13 1.20
3 20 53 63 63 63 63 13.5 0.35 11.7 392 5.50 1.87 8.17 0.85 0.12 1.26
2 20 34 41 41 41 41 13.2 0.24 15.3 410 5.80 2.44 8.97 0.85 0.10 1.32
18 4 20 51 61 61 61 61 13.7 0.20 9.1 268 3.75 1.45 5.78 0.88 0.13 1.35
3 20 36 45 45 45 45 13.5 0.15 11.6 278 3.91 1.86 6.34 0.87 0.12 1.41
2 20 22 30 30 30 30 13.2 0.10 15.4 305 4.32 2.46 7.27 0.90 0.10 1.51
16 4 20 25 36 36 36 36 13.7 0.06 8.9 157 2.19 1.42 3.92 0.97 0.14 1.74
3 20 18 27 27 27 27 13.6 0.04 11.0 166 2.34 1.77 4.43 0.96 0.13 1.81
2 20 11 18 18 18 18 13.3 0.03 13.9 180 2.55 2.23 5.08 0.95 0.11 1.89
Note:
Average target for the bed as a whole was 14.5% m.c.
wbtm = when both targets met, 14.5% average and 15.0% wettest part

110
Table 26. Bed stirred throughout, 15 Aug, TC4 fan, 50oC in plenum, + extraction fan, Policy 24
Initi
al m
.c.,
% w
.b.
Bed
dep
th, m
Suc
cess
ful y
ears
of 2
0
Tim
e w
hen
aver
age
mc
targ
et m
et (w
atm
), h
Tim
e w
hen
both
targ
ets
met
(wbt
m),
h
Fan
time
wbt
m, h
Hea
ter t
ime
wbt
m, h
Stir
rer t
ime
wbt
m, h
Av
mc
wbt
m, %
wb
Max
spo
ilage
inde
x w
btm
Ove
rdry
ing
wbt
m, k
g/dr
ied
t
Tota
l ene
rgy
wbt
m, M
J/dr
ied
t
Fuel
cos
t wbt
m, £
/drie
d t
Ove
rdry
ing
cost
wbt
m, £
/drie
d t
Tota
l cos
t inc
l dm
loss
& o
verd
ryin
g w
btm
, £/d
ried
t
Fuel
cos
t wbt
m, £
/(drie
d t %
rem
oved
)
Ele
c co
st w
btm
, £/(d
ried
t % re
mov
ed)
Tota
l cos
t inc
l dm
loss
& o
verd
ryin
g w
btm
, £/(d
ried
t %
rem
oved
)
24 4 20 91 102 102 102 102 13.3 1.71 14.6 628 8.94 2.34 12.5 0.83 0.09 1.16
3 20 64 74 74 74 74 13.0 1.23 18.0 648 9.26 2.89 13.3 0.84 0.09 1.20
2 20 41 48 48 48 48 12.5 0.82 23.4 681 9.78 3.75 14.5 0.85 0.08 1.26
22 4 20 73 84 84 84 84 13.3 1.02 14.5 516 7.34 2.31 10.6 0.84 0.09 1.21
3 20 51 61 61 61 61 13.0 0.76 18.1 538 7.69 2.90 11.4 0.85 0.08 1.26
2 20 33 40 40 40 40 12.5 0.51 23.3 566 8.13 3.72 12.6 0.86 0.07 1.33
20 4 20 55 67 67 67 67 13.3 0.54 14.4 403 5.73 2.31 8.72 0.85 0.09 1.30
3 20 39 49 49 49 49 12.9 0.40 18.1 423 6.04 2.90 9.60 0.86 0.09 1.36
2 20 25 32 32 32 32 12.5 0.27 23.5 461 6.62 3.76 10.9 0.88 0.07 1.46
18 4 20 37 49 49 49 49 13.2 0.23 14.7 295 4.20 2.36 7.04 0.88 0.10 1.48
3 20 26 36 36 36 36 13.0 0.18 18.1 317 4.54 2.90 7.87 0.90 0.08 1.56
2 20 17 24 24 24 24 12.5 0.12 22.9 339 4.86 3.67 8.98 0.89 0.08 1.64
16 4 20 19 30 30 30 30 13.3 0.07 14.2 185 2.64 2.27 5.18 0.97 0.10 1.91
3 20 14 23 23 23 23 13.0 0.06 17.0 197 2.82 2.72 5.83 0.95 0.10 1.97
2 20 8 16 16 16 16 12.7 0.04 21.6 224 3.21 3.46 6.92 0.96 0.08 2.07
Note:
Average target for the bed as a whole was 14.5% m.c.
wbtm = when both targets met, 14.5% average and 15.0% wettest part

111
Table 27. 1 TC3 fan & no stirring for 24h then 2 TC3 fans and stirred, 15 Aug, 20oC in plenum, 180m2 bed +
extraction fan, Policy 24
Initi
al m
.c.,
% w
.b.
Bed
dep
th, m
Suc
cess
ful y
ears
of 2
0
Tim
e w
hen
aver
age
mc
targ
et m
et (w
atm
), h
Tim
e w
hen
both
targ
ets
met
(wbt
m),
h
Fan
time
wbt
m, h
Hea
ter t
ime
wbt
m, h
Stir
rer t
ime
wbt
m, h
Av
mc
wbt
m, %
wb
Max
spo
ilage
inde
x w
btm
Ove
rdry
ing
wbt
m, k
g/dr
ied
t
Tota
l ene
rgy
wbt
m, M
J/dr
ied
t
Fuel
cos
t wbt
m, £
/drie
d t
Ove
rdry
ing
cost
wbt
m, £
/drie
d t
Tota
l cos
t inc
l dm
loss
& o
verd
ryin
g w
btm
, £/d
ried
t
Fuel
cos
t wbt
m, £
/(drie
d t %
rem
oved
)
Ele
c co
st w
btm
, £/(d
ried
t % re
mov
ed)
Tota
l cos
t inc
l dm
loss
& o
verd
ryin
g w
btm
, £/(d
ried
t %
rem
oved
)
24 4 0 n/a
3 5 n/a
2 18 316 317 317 286 293 14.5 1.40 0.44 573 7.06 0.07 10.7 0.74 0.35 1.13
22 4 17 580 580 580 528 556 14.5 1.67 0.08 494 5.87 0.01 9.50 0.78 0.45 1.27
3 18 428 428 428 387 404 14.5 1.24 0.22 492 5.92 0.03 9.34 0.79 0.43 1.24
2 20 309 310 310 272 286 14.5 0.91 0.39 527 6.42 0.06 9.85 0.85 0.43 1.31
20 4 20 504 504 504 451 480 14.5 0.93 0.13 405 4.75 0.02 7.78 0.86 0.53 1.41
3 20 385 385 385 339 361 14.5 0.70 0.10 415 4.92 0.02 7.87 0.89 0.52 1.43
2 20 266 267 267 236 243 14.5 0.48 0.42 452 5.52 0.07 8.39 1.00 0.50 1.52
18 4 20 407 407 407 357 383 14.5 0.42 0.08 311 3.61 0.01 5.97 1.03 0.66 1.70
3 20 309 309 309 271 285 14.5 0.32 0.11 327 3.88 0.02 6.16 1.10 0.64 1.76
2 20 180 181 181 160 157 14.5 0.20 0.38 303 3.72 0.06 5.58 1.05 0.51 1.58
16 4 20 269 269 269 237 245 14.5 0.16 0.07 200 2.32 0.01 3.83 1.54 0.99 2.54
3 20 161 162 162 144 138 14.5 0.10 0.18 167 2.00 0.03 3.14 1.32 0.73 2.08
2 20 113 114 114 101 90 14.5 0.07 0.41 177 2.16 0.07 3.28 1.42 0.69 2.15
Note:
Average target for the bed as a whole was 14.5% m.c.
wbtm = when both targets met, 14.5% average and 15.0% wettest part

112
Table 28. 1 TC3 fan & no stirring for 24h then 2 TC3 fans and stirred, 15 Aug, 30oC in plenum, 180m2 bed +
extraction fan, Policy 24
Initi
al m
.c.,
% w
.b.
Bed
dep
th, m
Suc
cess
ful y
ears
of 2
0
Tim
e w
hen
aver
age
mc
targ
et m
et (w
atm
), h
Tim
e w
hen
both
targ
ets
met
(wbt
m),
h
Fan
time
wbt
m, h
Hea
ter t
ime
wbt
m, h
Stir
rer t
ime
wbt
m, h
Av
mc
wbt
m, %
wb
Max
spo
ilage
inde
x w
btm
Ove
rdry
ing
wbt
m, k
g/dr
ied
t
Tota
l ene
rgy
wbt
m, M
J/dr
ied
t
Fuel
cos
t wbt
m, £
/drie
d t
Ove
rdry
ing
cost
wbt
m, £
/drie
d t
Tota
l cos
t inc
l dm
loss
& o
verd
ryin
g w
btm
, £/d
ried
t
Fuel
cos
t wbt
m, £
/(drie
d t %
rem
oved
)
Ele
c co
st w
btm
, £/(d
ried
t % re
mov
ed)
Tota
l cos
t inc
l dm
loss
& o
verd
ryin
g w
btm
, £/(d
ried
t %
rem
oved
)
24 4 3 n/a
3 19 179 193 193 193 169 13.9 1.64 7.0 571 7.91 1.11 10.7 0.78 0.14 1.06
2 20 117 129 129 129 105 13.7 1.15 9.3 586 8.20 1.48 11.1 0.80 0.12 1.08
22 4 20 207 222 222 222 198 14.1 1.32 5.2 459 6.30 0.84 8.56 0.79 0.16 1.08
3 20 149 163 163 163 139 13.9 0.99 6.6 465 6.44 1.06 8.78 0.80 0.14 1.09
2 20 97 109 109 109 85 13.8 0.70 8.7 477 6.67 1.38 9.16 0.81 0.12 1.11
20 4 20 161 175 175 175 151 14.1 0.66 5.2 354 4.86 0.83 6.71 0.82 0.16 1.13
3 20 116 130 130 130 106 13.9 0.50 6.8 364 5.04 1.08 7.05 0.83 0.14 1.16
2 20 75 88 88 88 64 13.7 0.36 8.9 375 5.25 1.43 7.48 0.84 0.12 1.19
18 4 20 111 126 126 126 102 14.0 0.27 5.3 249 3.43 0.85 4.95 0.87 0.16 1.25
3 20 81 95 95 95 71 13.9 0.20 6.8 256 3.55 1.09 5.25 0.87 0.15 1.29
2 20 54 67 67 67 43 13.6 0.15 10.0 272 3.81 1.59 5.96 0.88 0.12 1.37
16 4 20 58 73 73 73 49 14.0 0.07 5.6 136 1.89 0.90 3.12 0.95 0.17 1.58
3 20 44 58 58 58 34 13.9 0.06 6.6 143 1.99 1.06 3.35 0.96 0.14 1.62
2 20 32 44 44 44 20 13.6 0.05 10.0 160 2.26 1.61 4.16 0.96 0.12 1.77
Note:
Average target for the bed as a whole was 14.5% m.c.
wbtm = when both targets met, 14.5% average and 15.0% wettest part

113
Table 29. 1 TC3 fan & no stirring for 24h then 2 TC3 fans and stirred, 15 Aug, 40oC in plenum, , 180m2 bed
+ extraction fan, Policy 24
Initi
al m
.c.,
% w
.b.
Bed
dep
th, m
Suc
cess
ful y
ears
of 2
0
Tim
e w
hen
aver
age
mc
targ
et m
et (w
atm
), h
Tim
e w
hen
both
targ
ets
met
(wbt
m),
h
Fan
time
wbt
m, h
Hea
ter t
ime
wbt
m, h
Stir
rer t
ime
wbt
m, h
Av
mc
wbt
m, %
wb
Max
spo
ilage
inde
x w
btm
Ove
rdry
ing
wbt
m, k
g/dr
ied
t
Tota
l ene
rgy
wbt
m, M
J/dr
ied
t
Fuel
cos
t wbt
m, £
/drie
d t
Ove
rdry
ing
cost
wbt
m, £
/drie
d t
Tota
l cos
t inc
l dm
loss
& o
verd
ryin
g w
btm
, £/d
ried
t
Fuel
cos
t wbt
m, £
/(drie
d t %
rem
oved
)
Ele
c co
st w
btm
, £/(d
ried
t % re
mov
ed)
Tota
l cos
t inc
l dm
loss
& o
verd
ryin
g w
btm
, £/(d
ried
t %
rem
oved
)
24 4 1 n/a
3 19 117 134 134 134 110 13.1 1.68 16.6 629 8.98 2.66 12.8 0.82 0.08 1.18
2 20 80 94 94 94 70 12.6 1.19 22.3 654 9.39 3.57 14.0 0.82 0.08 1.23
22 4 20 130 150 150 150 126 13.3 1.37 13.7 499 7.09 2.19 10.3 0.82 0.09 1.18
3 20 96 114 114 114 90 13.1 1.03 16.6 516 7.37 2.65 10.9 0.83 0.08 1.22
2 20 66 80 80 80 56 12.6 0.75 21.7 545 7.83 3.47 12.1 0.84 0.07 1.29
20 4 20 101 121 121 121 97 13.3 0.71 13.7 393 5.59 2.19 8.48 0.84 0.09 1.27
3 20 75 93 93 93 69 13.1 0.55 16.7 408 5.83 2.68 9.17 0.84 0.09 1.32
2 20 53 67 67 67 43 12.6 0.40 22.1 437 6.29 3.54 10.4 0.85 0.07 1.41
18 4 20 71 91 91 91 67 13.3 0.30 13.7 286 4.07 2.20 6.74 0.87 0.10 1.44
3 20 54 72 72 72 48 13.1 0.24 16.9 302 4.32 2.70 7.47 0.87 0.09 1.51
2 20 40 53 53 53 29 12.6 0.18 21.8 330 4.75 3.49 8.63 0.89 0.07 1.61
16 4 20 41 60 60 60 36 13.3 0.10 13.6 179 2.56 2.17 4.99 0.96 0.09 1.87
3 20 33 49 49 49 25 13.1 0.08 16.2 190 2.73 2.59 5.58 0.95 0.09 1.93
2 20 25 39 39 39 15 12.7 0.06 20.8 219 3.16 3.33 6.72 0.97 0.07 2.05
Note:
Average target for the bed as a whole was 14.5% m.c.
wbtm = when both targets met, 14.5% average and 15.0% wettest part

114
Table 30. 1 TC3 fan & no stirring for 24h then 2 TC3 fans and stirred, 15 Aug, 50oC in plenum, 180m2 bed +
extraction fan, Policy 24
Initi
al m
.c.,
% w
.b.
Bed
dep
th, m
Suc
cess
ful y
ears
of 2
0
Tim
e w
hen
aver
age
mc
targ
et m
et (w
atm
), h
Tim
e w
hen
both
targ
ets
met
(wbt
m),
h
Fan
time
wbt
m, h
Hea
ter t
ime
wbt
m, h
Stir
rer t
ime
wbt
m, h
Av
mc
wbt
m, %
wb
Max
spo
ilage
inde
x w
btm
Ove
rdry
ing
wbt
m, k
g/dr
ied
t
Tota
l ene
rgy
wbt
m, M
J/dr
ied
t
Fuel
cos
t wbt
m, £
/drie
d t
Ove
rdry
ing
cost
wbt
m, £
/drie
d t
Tota
l cos
t inc
l dm
loss
& o
verd
ryin
g w
btm
, £/d
ried
t
Fuel
cos
t wbt
m, £
/(drie
d t %
rem
oved
)
Ele
c co
st w
btm
, £/(d
ried
t % re
mov
ed)
Tota
l cos
t inc
l dm
loss
& o
verd
ryin
g w
btm
, £/(d
ried
t %
rem
oved
)
24 4 0 n/a
3 18 108 125 125 125 101 12.8 1.70 19.3 642 9.20 3.09 13.4 0.83 0.08 1.20
2 20 76 90 90 90 66 12.4 1.21 24.7 669 9.62 3.95 14.6 0.83 0.07 1.26
22 4 20 115 135 135 135 111 13.0 1.44 17.1 518 7.42 2.74 11.1 0.83 0.08 1.23
3 20 89 106 106 106 82 12.9 1.06 19.1 529 7.60 3.05 11.5 0.83 0.08 1.26
2 20 64 77 77 77 53 12.4 0.76 24.4 556 8.00 3.90 12.7 0.84 0.07 1.32
20 4 20 90 110 110 110 86 13.1 0.75 16.9 411 5.88 2.70 9.21 0.85 0.08 1.33
3 20 70 88 88 88 64 12.8 0.57 19.6 425 6.10 3.13 9.84 0.85 0.08 1.37
2 20 51 66 66 66 42 12.4 0.41 24.5 452 6.52 3.92 11.0 0.86 0.07 1.45
18 4 20 65 85 85 85 61 13.0 0.33 17.0 305 4.37 2.73 7.52 0.88 0.08 1.52
3 20 51 69 69 69 45 12.8 0.25 19.8 318 4.57 3.17 8.17 0.88 0.08 1.57
2 20 39 52 52 52 28 12.5 0.18 23.5 337 4.86 3.76 9.01 0.88 0.07 1.63
16 4 20 39 58 58 58 34 13.1 0.10 15.9 191 2.74 2.55 5.53 0.96 0.08 1.93
3 20 32 49 49 49 25 12.9 0.08 18.7 202 2.91 2.99 6.16 0.94 0.08 1.99
2 20 25 39 39 39 15 12.6 0.06 22.1 228 3.30 3.54 7.06 0.97 0.07 2.08
Note:
Average target for the bed as a whole was 14.5% m.c.
wbtm = when both targets met, 14.5% average and 15.0% wettest part