Embed Size (px)
Citation preview

Project Plan for Carbon Sequestration through Afforestation in the Lower Mississippi Alluvial Valley
David Clarke, Susan McGugin, Gary Schmirer, Sierra Towers Laboratory for Sustainable Business
Massachusetts Institute of Technology
Prepared for:
United States Business Council for Sustainable Development

Table of Contents
1.0 Executive Summary ............................................................................................................. 4 2.0 US BCSD Overview ............................................................................................................ 6
2.1 US BCSD Mission ........................................................................................................... 6 2.2 Sustainable Development................................................................................................. 6 2.3 US BCSD History ............................................................................................................ 6 2.4 Platforms .......................................................................................................................... 6
3.0 Project Overview ................................................................................................................. 7 4.0 The Carbon Story: Evolution of the Carbon Market ........................................................... 9
4.1 The Carbon Market .......................................................................................................... 9 4.2.1 Trading Forest Carbon Credits................................................................................ 11 4.2.2 Current and Potential Future Prices: ....................................................................... 12
4.3 The Forestry Carbon Offset Industry ............................................................................. 13 5.0 US BCSD Competitive Advantage.................................................................................... 15
5.1 ConocoPhillips: A Potential Partnership........................................................................ 15 6.0 Supply Potential ................................................................................................................. 16 7.0 Economics of Forestry Carbon Projects ............................................................................ 17
7.1 Landowners .................................................................................................................... 17 7.1.1 Returns from Afforestation ..................................................................................... 18 7.1.2 Opportunity Costs ................................................................................................... 19 7.1.3 Net Present Value of Afforestation......................................................................... 21
7.2 Aggregators .................................................................................................................... 22 7.2.1 AgraGate Model...................................................................................................... 22 7.2.2 C2i/GreenTrees model ............................................................................................ 23
8.0 Proposed US BCSD Business Model ................................................................................ 24 8.1 Customers: An Overview............................................................................................... 24 8.2 Marketing Strategy and Distribution Channels.............................................................. 25 8.3 Pricing ............................................................................................................................ 25 8.4 Operational Plan............................................................................................................. 26
8.4.1 Personnel................................................................................................................. 26 8.4.2 Management and Organization ............................................................................... 26

8.5 Financial Plan................................................................................................................. 26 9.0 Insurance Plan Potential..................................................................................................... 28 10.0 Conclusion and Next Steps for US BCSD......................................................................... 29
10.1 Marketing Strategy......................................................................................................... 30 Appendix 1 – US BCSD Members and Partners .......................................................................... 32 Appendix 2 – CCX Members ....................................................................................................... 33 Appendix 3 – Selected Potential Competitors .............................................................................. 38 Appendix 4 – Marketing Slides .................................................................................................... 45 Appendix 5 – Marketing Document ............................................................................................. 50

1.0 Executive Summary
As students of the Laboratory for Sustainable Business class at the MIT Sloan School of Management, we worked with the Unites States Business Council for Sustainable Development (US BCSD) on a project using afforestation for carbon sequestration. The US BCSD, based in Austin, Texas, began its operations in 2002 and is a partner organization of the World Business Council for Sustainable Development (WBCSD), a global network of 180 international companies with members from 30 countries and 20 major industrial sectors. The mission of the WBCSD is to play a major role in shaping business responses to the challenges of sustainable development. The US BCSD is a partner organization of the WBCSD and is a non-profit association of businesses. Its goal is to deliver highly focused and collaborative projects, helping its members and partners demonstrate leadership in the United States on sustainable development while realizing business value. Currently the US BCSD has four employees and 18 member companies. All operations are funded by membership fees of $10,000 per year and project investments from members, governments and foundations1. Our team was asked to look at the US BCSD’s existing afforestation project in the Lower Mississippi Alluvial Valley (LMAV) that began in the mid-1990s and design a new business model that would allow the US BCSD to market the project as a carbon sequestration
opportunity for US companies to use to offset their carbon emissions.
(LMAV is highlighted in yellow) and best drained sites. During the 1900s flood control efforts straightened and deepened rivers, drained swamps, and encouraged forest clearing on lower, wetter sites. Between 1950 and 1976, approximately one-third of the LMAV’s forests were converted to agriculture. Over the next fifteen years additional, less desirable land was cleared for soybean production. By the 1980s less than 20% of the original forest was left and many of the newer crops were deemed marginal because of flood conditions2.
1 Source: US BCSD website, http://www.usbcsd.org/aboutus.asp 2http://www.fs.fed.us/largewatershedprojects/annualreports/2002%20Annual%20Reports/LMAV_ANUUAL_FY02_C.pdf
The LMAV covers more than 24 million acres in parts of seven states extending from southern Illinois to the Gulf of Mexico. Historically, the LMAV was largely bottomland hardwood forests. Flooding of the Mississippi River and its tributaries shaped this land. Rich soils left by these floods produced a vast forested wetland sheltering a great diversity of wildlife. Settlers in the 1800s, searching for fertile farmland, cleared forests starting from the highest

In the 1990s the US BCSD was a leader in restoring this marginal crop land to its natural state. The US BCSD helped landowners convert their marginal crops to mixed cottonwood and hardwood forests where landowners traded their volatile income from marginal crops for a stable income stream from government land conservation checks, hunting licenses, the sale of pulp for paper and timber for building. Recently, the Council and its members have revisited this project and see opportunity for additional income streams due to the growing focus on the environment and the growing demand for carbon offset credits in the United States. We have helped the Council evaluate its approach in entering this market and have outlined potential opportunities and challenges. Our role has been to evaluate the market for carbon offsets, the land opportunities in the LMAV and calculate the value of such project for the US BCSD, businesses and landowners. We have created a business plan, marketing components and a carbon measuring tool for the US BCSD to develop and market this project to landowners and business members. We see an opportunity to tap in to the growing market but have found a variety of competitors already exist in the space and believe that without the certainty of regulation there are still a variety of unknowns that must be carefully considered before initiating this project.

2.0 US BCSD Overview3
The United States Business Council for Sustainable Development (US BCSD) is a non-profit association of businesses whose purpose is to deliver highly focused, collaborative projects that help its members and partners demonstrate leadership in the United States on sustainable development and realize business value. 2.1 US BCSD Mission The United States Business Council for Sustainable Development demonstrates the business value of sustainable development through:
• Creating initiatives that foster sustainable development while creating value for business • Offering networking and partnership opportunities • Providing a voice for business in the sustainable development field • Promoting public and agency credibility of our members
2.2 Sustainable Development The Brundtland Commission, formally the World Commission on Environment and Development (WCED) defines sustainable development as development that meets the needs of the present without compromising the ability of future generations to meet their own needs4. 2.3 US BCSD History Launched in 2002, the US BCSD is a partner organization of the World Business Council for sustainable Development (WBCSD), a global network of 180 international companies with members drawn from 30 countries and 20 major industrial sectors. The WBCSD plays a leading role in shaping the business response to the challenges of sustainable development. The US BCSD plays a complementary role by communicating those policies to the US business community and its stakeholders, and by implementing projects that apply sustainable development principles to real world problems. Prior to 2003, the US BCSD operated as the Business Council for Sustainable Development - Gulf of Mexico, established in 1993. The US BCSD believes that the success of its business should be measured by its contribution to economic, social, and environmental sustainability. 2.4 Platforms US BCSD leverages member participation and partner support to serve five platforms of activity: By-product Synergy, Ecosystem Services, Value and Supply Chain, Energy and Climate Change, and Water Resource Management.
3 http://www.usbcsd.org/aboutus.asp 4 See Our Common Future: Report of the World Commission on Environment and Development (1987) The United Nations, Oxford University Press, Oxford.

3.0 Project Overview
Over the course of the twentieth century thousands of acres of flood-prone forest land were cleared in the Lower Mississippi Alluvial Valley (LMAV) for the growth of soybeans. This land is not ideal for crops and is considered only marginally productive. Reforestation/afforestation of this marginal crop land has many positive implications for the environment. By planting forests many of the environmental services lost when the land was cleared can be restored. Reforestation/afforestation may also lead to higher water quality by reducing sediment load from tilling after harvests5 and by reducing run off due to erosion. Below is a map of the land use in the region6.
5 Aust W.M., Lea, and J.D. Gregory (1991) “Removal of floodwater sediments by a clear cut tupelo-cypress wetland”. Water Resources Bulletin 27:111-116, Virginia Tech University, Blacksburg, VA. 6 Source: http://soilphysics.okstate.edu/S257/book/mlra131/

There are several concerns when considering planting trees in these areas. First, there are only a few varieties of trees, such as eastern cottonwood and nuttall oak, which are also indigenous to the area that can withstand these flood-like conditions and can easily be planted7. The second concern is access to the land, which is mainly privately owned. Area landowners are a mix of large landowners whose holdings typically exceed 700 acres, and small owners whose holdings are often less than 200 acres. Ninety percent of the land in the LMAV is privately owned, and 70 percent of that is owned by people who do not live on their land8. The afforestation projects will only take place if the revenue from afforestation is greater than the costs associated planting the forest and loss of agricultural income. There are a variety of income sources once the land is forested, such as sale of timber or pulp for paper, hunting, as well as potential revenue from government conservation programs. We believe there is additional opportunity for income from the sale of carbon offsets. The growing concern for and focus on climate change suggest that there is huge market potential for carbon sequestration credit sales. There is extensive evidence of this in international markets and a growing focus in the United States as well. The US BCSD has operated a successful afforestation project in the LMAV since the mid-1990s. This project has led to the conversion of over 100,000 acres of marginal agricultural land from soybean production to mixed cottonwood and hardwood plantations. These forests have been used for hunting, harvesting timber for lumber and paper pulp. These forests have prevented erosion from flooding and have created ecosystems where wildlife can thrive9. The Council is now looking to enhance the economics of this project by exploring the feasibility of generating revenues from the carbon sequestered by these forests in the sale of carbon offset credits. US BCSD member companies have expressed interest in offsetting their current carbon emissions and the Council is exploring opportunities for its members.
7 Shabman, Zepp, Wainger, and King (200). “Incentives for reforestation of agricultural land: What will a market for carbon sequestration credits contribute?” Vol. 12 No. 2 8 “Private Landowners Hold the Key” (2006) Compass: Perspectives and Tools To Benefit Southern Forest Resources, Vol 3 No 6, USDA Forest Service, available online at http://www.srs.fs.usda.gov/compass/ 9 See http://www.usbcsd.org/ecosystem.asp

4.0 The Carbon Story: Evolution of the Carbon Market
4.1 The Carbon Market Due to the lack of a mandatory federal greenhouse gas (GHG) reduction program in the United States, a variety of climate change policy initiatives have emerged at the municipal, state, and regional levels. In August 2006, an outline of rules for the nation’s first regional mandatory cap-and-trade program to reduce carbon dioxide (CO2) emissions was released. Under the Regional Greenhouse Gas Initiative (RGGI10), seven Northeastern states have adopted a pact beginning in 2009 to cap CO2 emissions from power plants at current levels, with a goal of achieving a 10% reduction by 2019. In September 2006, Governor Arnold Schwarzenegger signed the Global Warming Solutions Act11, making California the first state in the United States to cap its GHG emissions. The bill would develop regulations and market mechanisms with the goal of reducing California’s GHG emissions by 25% by 2020. Under the bill, mandatory caps will begin in 2012 targeting significant emission sources in the state. Through the Chicago Climate Exchange (CCX12) trading platform, numerous cities have committed to reducing GHG emissions by 6% by 2010. The cities include Chicago, IL; Portland, OR; Berkeley, CA; Oakland, CA; Aspen, CO; and Boulder, CO. Additionally, two states, New Mexico and Illinois, have committed to the CCX reduction commitment. The mayors of 284 US cities representing over 48 million citizens have signed the United States Mayor’s Climate Protection Agreement13 urging their state governments, and the federal government, to enact policies and programs to meet or exceed the GHG emission reduction target suggested for the United States in the Kyoto Protocol. Several CO2 emission “registries” have emerged recently as well. The four primary emission registries that provide for forestry offset emission reduction credits in the United States include, the CCX, the Department of Energy (DOE) National Voluntary Reporting of Greenhouse Gases Program under section 1605(b) of the Energy Policy Act of 199214, the California Climate Action Registry (CCAR15), and the RGGI. Of these, the CCX is the most developed, and is also the only trading exchange platform for carbon offset credits currently operating in the United States. The CCX allows forestry carbon sequestration projects in its list of allowable offset types, comprising 6% of the total offset credits that have been traded since the exchange commenced in 2003. Total traded volume is 27.8 million tons of CO2 . The average price in 2003 was $.98 and has grown considerably in the
10 http://www.rggi.org/ 11 http://www.aroundthecapitol.com/billtrack/text.html?file=ab_32_bill_20060418_amended_sen.html 12 http://www.chicagoclimatex.com/ 13 http://www.seattle.gov/mayor/climate/default.html 14 http://www.pi.energy.gov/pdf/library/TechnicalGuidelines_March2006.pdf 15 http://www.climateregistry.org/PROTOCOLS/FP/

past five years. For all of 2007 through May 11, 2008 the average price had grown to $4.54 per ton and for the last 45 days the price has climbed to an average of $6.13/ton16. Below is a chart of offset credits issued on the CCX over the past five years, and a chart of trading prices and volumes over the same period17.
Offsets and Early Action Credits Issued as of 05/11/2008
(All figures presented in metric tons of CO2)
Vintage 2003 2004 2005 2006 2007 2008
Offsets Issued 3,392,400 4,094,300 5,751,100 8,532,800 6,319,600 14,900
Early Action Credits - 618,000 72,900 244,300 - -
Total 3,392,400 4,712,300 5,824,000 8,777,100 6,319,600 14,900
In addition to the CCX, there is a large 'over-the-counter' (OTC) market in the United States. These are voluntary transactions where the buyer purchases offset credits directly from a seller. These transactions usually occur online, and the price of the offset is determined by the two parties rather than by the market price on an exchange. Such OTC transactions are extremely difficult to monitor, however one report has estimated that the worldwide OTC market was 13.6 million tons of CO2, significantly higher than the volume traded on the CCX that year. The majority of these transactions were US-based involving domestic projects. Forestry projects are estimated to form 37% of these transactions18. 16 http://www.chicagoclimatex.com/offsets/projectReport.jsf 17 http://www.chicagoclimatex.com/market/data/summary.jsf 18 State of the Voluntary Carbon Market (2007) Ecosystem Marketplace and New Carbon Finance, available online at http://ecosystemmarketplace.com/

For reasons of corporate social responsibility and anticipation of future regulation, demand for voluntary carbon offsets is largely driven by businesses. Many OTC providers also market to consumers via the web (for example, www.terrapass.org and www.nativeenergy.com), while innovative product offerings such as credit card 'green reward' schemes are also beginning to appear (for example www.brighterplanet.com). Until mandatory US federal legislation is introduced (expected by 2010/11), this market is expected to continue to grow. (In other words, voluntary carbon markets are an interim opportunity until a regulated market is introduced). A major concern about voluntary carbon markets is the quality of the offsets being offered. The dimensions of quality include project certification, verification and monitoring, how carbon is accounted for, and avoiding double-counting of credits. According to one survey, these quality concerns are the most important issue for both buyers and sellers in this market19. Continuing efforts are being made to strengthen quality and accountability standards. 4.2 Trading and Marketing United States Forest Carbon Offset Projects 4.2.1 Trading Forest Carbon Credits The CCX is the only registry available to organizations located in the United States for trading carbon offset credits from afforestation. Broader goals of the CCX exchange include building market institutions and infrastructure, developing human capital in environmental trading and establishing the viability of a multi-sector and multi-national system for GHG emissions trading. See Appendix 2 to view CCX members. CCX members that cannot reduce their own emissions can purchase credits from those that make extra emission cuts or from verified offset projects. Eligible forest offset projects include forestation and forest enrichment, combined forestation and forest conservation projects, and urban tree planting20. Membership in the CCX includes five North American and four Brazilian integrated forest products companies operating both manufacturing facilities and managing forest lands21. The CCX has registered forest offset credits from Costa Rica, Brazil, and numerous states in U.S., and is currently considering registering forest offset projects in Belize and Bolivia. General eligibility requirements under the CCX forestry offset program include:
• Afforestation, reforestation and forest enrichment projects initiated on or after January 1, 1990 on unforested or degraded forest land.
• Demonstration that entity-wide forest holdings are sustainably managed. • Demonstration of long-term commitment to maintain carbon stocks in forestry. • Use of approved methods to quantify carbon stocks. • Independent third-party verification of carbon stocks
Concerns have been raised about the quality of CCX carbon offsets, however. For forestry projects, the major concern is the permanence of carbon sequestration. CCX forestry offset 19 ibid 20 http://www.chicagoclimatex.com/news/publications/pdf/CCX_Forest_Offsets.pdf 21 http://www.chicagoclimatex.com/about/members.html
contracts only last for a period of fifteen years. After the fifteen years, there is nothing to prohibit land use changes which might release the stored carbon into the atmosphere, reversing the supposed sequestration benefits of the project (see Appendix 5 for a demonstration of these effects). Other protocols such as the Kyoto's Clean Development Mechanism and voluntary schemes such as the Voluntary Carbon Standard offer a more rigorous treatment of permanence issues for forestry carbon offset projects. Barriers to trading and marketing forest offset projects include the transaction costs associated with these registries. The expected price of carbon will also be a determining factor in the economic analyses required to justify an investment. Forestry markets in the United States have been voluntary thus far. We believe when RGGI and California legislation comes on line in 2009, mandatory emission reduction targets, like those assigned to power plants in the Northeast, will motivate buyers in the carbon offset market. In the short-term this demand should raise carbon prices for forestry offset credits. The lack of federal regulation has stimulated a series of innovative approaches to establishing trading and marketing systems22. The CCX exchange platform is the best example of this innovation. On the other hand, the absence of long-term regulatory carbon constraints has kept buyers unmotivated in carbon markets, slowing the development of the required capital needed to sustain these markets. A well-defined, transparent, and credible government regulated compliance program for reducing GHG emissions in the United States will help create clear price signals that are needed to attract the level of capital required to sustain a United States carbon market. We are confident that this is imminent and will result in major growth to the market over the next several years. 4.2.2 Current and Potential Future Prices: Current prices in the voluntary carbon market vary significantly. On the CCX, the current trading range is approximately $6.00 per ton of CO2, up significantly from its long-term average of around $4.00. In the U.S. OTC market, prices range between $5.50 (www.carbonfund.org) and $18.00 (www.myclimate.org), reflecting wide variation in the strategies, source of projects and project quality, as well the lack of transparency in this market23. Meanwhile, in the European market for offsets generated by Kyoto Protocol Clean Development Mechanism projects, the price is currently around Euro16.5024, or US$24.00 at current exchange rates. In the future, as U.S. legislation is implemented, carbon emissions are constrained and demand for high quality carbon offsets increases accordingly, the price of carbon offsets can be expected to increase. For example, one market observer has predicted that the CO2 price in the U.S. could reach $35-40 by 2015 under current legislative proposals25.
22 http://www.fs.fed.us/ecosystemservices/pdf/forest-carbon-trading 23 Voluntary Offsets for Air-Travel Carbon Emissions: Evaluation and Recommendation of Thirteen Offset Companies (2006) Tufts Climate Initiative, Tufts University, Massachusetts 24 www.europeanclimateexchange.com 25 "Press release: US carbon market could reach US$1trillion by 2020" New Carbon Finance, Feb 14 2008,

4.3 The Forestry Carbon Offset Industry There are many players in the carbon credit field in the United States today. Although legislation is not yet present on a federal level, many states are stepping up their individual commitment to the reduction of carbon related emissions. On the federal level, the Lieberman-Warner Climate Security Act (S. 2191) is on the horizon, with hopes of passage in 2009-2010. Current players come in the form of offset aggregators (such as AgraGate26), firm sponsored projects (such as AIG Insurance investing in projects in China to offset their own emissions), and the OTC market (such as Delta Airlines selling offsets they obtain from their investment in the Conservation fund to their customers for carbon emissions from flying27). According to the CCX, an offset aggregator is an entity that serves as an administrative and trading representative on behalf of multiple project owners. An aggregator collects, combines, completes the administrative work and brokers the carbon credit. Small scale landowners may not generate enough offsets to overcome administrative costs and may find it advantageous to work with an aggregator to bring a project to the trading market. Aggregators are responsible for interacting with the market, explaining rules and requirements to project owners, and coordinating with approved verifiers. Contracts are signed directly between individual landowners and aggregators without direct market involvement. A few of aggregators in the LMAV area include C2i, PowerTrees (www.powertreecarboncompany.com), AgraGate (www.agragate.com). The market is fragmented so it is difficult to define the number of players existing. Given economies of scale and marketing costs, there may be a limit to the number of aggregators the market can retain. Consumers are also buying credits from projects other than forestry, such as projects dealing with energy, water, by-product synergy, eco-system services, green brownfields, and integrating the value chain.
available online at www.newcarbonfinance.com. 26 www.agragate.com 27 See www.delta.com/about_delta/global_good/conservation_fund/

The diagram below summarizes the forestry carbon offset industry. Also see Appendix 3 for a table outlining specifics of major aggregator and offset provider projects.

5.0 US BCSD Competitive Advantage
The US BCSD has existing relationships with its member companies who may want to purchase offsets for their own emissions. The competitive advantage is the existing relationships because the US BCSD has frequent contact with their members, and can bring this project to the table before the member seeks other avenues for offsetting emissions. Additionally, members pay a significant fee to the US BCSD ($10,000 annually) to learn about and partner on sustainable development projects. An afforestation project for the purpose of sequestering carbon fits this mission. The US BCSD can act as a broker for its member companies and as an intermediary between existing aggregators and companies interested in purchasing offsets. The US BCSD is a trusted source to its member companies. The field of aggregators is already somewhat crowded. The US BCSD can capitalize on the relationships they have with their member companies, which the crowded group of aggregators may have limited access. The brand of the World Business Council for Sustainable Development (WBCSD) is also a significant source of competitive advantage for the US BCSD. The WBCSD is a highly visible, well-respected global organization that has developed strong expertise in carbon and climate change issues, particularly in forestry carbon offsets. There is significant opportunity for the US BCSD to leverage this brand equity in its own business model. 5.1 ConocoPhillips28: A Potential Partnership ConocoPhillips is based out of Houston, Texas, with assets of $178 billion. ConocoPhillips is an integrated energy company with a global reach and claims it realizes the extent of its global impact. The company explains this is why it is committed to conducting its business in a safe, environmentally responsible and ethical manner. ConocoPhillips is the fifth-largest refiner and the sixth-largest reserves holder of non-government-controlled companies with operations in 37 countries. It is the third-largest integrated energy company in the United States, based on market capitalization, oil and natural gas reserves. The company claims it understands its responsibility to deliver energy in a safe, environmentally and socially responsible manner. ConocoPhillips emphasizes in its marketing that it is “committed to contributing to social, economic and environmental improvements in all the communities in which it operates.” The company is currently funding several environmental, social, health and education programs around the world. ConocoPhillips one of the members of the US BCSD that has helped drive this project forward. Although ConocoPhillips has made no commitment to purchasing offsets or funding any potential projects there are members that stand behind the US BCSD’s exploration of afforestation for carbon sequestration. In an interview with Sabrina Watkins, a manager at ConocoPhillips and the Chair of the
28 http://www.conocophillips.com/about/who_we_are/index.htm

Executive Committee for the US BCSD, the following points were made: She believes that the US BCSD has the opportunity to have higher standards than the CCX and is confident that its reputation and ties with both businesses and NGOs will help ensure the value of these projects. She expressed that she has seen a shift in conversation among businesses around sustainability and is confident that many will begin to make moves before any formal legislation is agreed upon. She also framed the energy industry in the United States and forecasted that if mandatory regulation is passed, then depending on how carbon is measured the companies in the United States will need anywhere from 70M tons to 400M tons of carbon offsets each year.
6.0 Supply Potential
The LMAV region originally comprised 20 million acres of bottomland hardwood forest, but the majority of this was cleared for agricultural use throughout the course of the 20th century. By the 1990s, less than 5 million acres of forest remained29. A percentage of the agricultural land is considered marginally productive, since it is prone to frequent flooding and is subject to a shortened growing season. This marginal agricultural land is the potential source of forestry carbon sequestration projects. It should be noted that a substantial proportion of this marginal land has already been reforested due to a federal government conservation program called the Conservation Reserve Program (CRP)30. An analysis of the total amount of land enrolled in the CRP shows that more than 1.6 million acres in Arkansas, Louisiana, Mississippi and Tennessee have already been converted (see table below). Nonetheless, it is estimated that there remains at least 500,000 acres that are suitable for reforestation in the LMAV31.
Table: Total Active CRP Contracts, 1993 to 200832 State Total CRP
contracts Total CRP acres
Avg acres per contract
Arkansas 5,404 231,487 43 Louisiana 4,586 303,474 66 Mississippi 20,418 899,997 44 Tennessee 8,019 235,172 29 Grand Total 38,427 1,670,130 43
It should also be noted, however, that landholdings are generally very small and diverse in this region. As shown above in the table, the size of land parcel enrolled in CRP contracts was only
29 Nature Conservancy (1992) The Forested Wetlands of the Mississippi River: An Ecosystem in Crisis, The Nature Conservancy, Baton Rouge, LA 30 See http://www.fsa.usda.gov/FSA/webapp?area=home&subject=copr&topic=crp 31 “Private Landowners Hold the Key” (2006) Compass: Perspectives and Tools To Benefit Southern Forest Resources, Vol 3 No 6, USDA Forest Service, available online at http://www.srs.fs.usda.gov/compass/ 32 http://content.fsa.usda.gov/crpstorpt/r1sumyr/r1sumyr.htm; MIT team analysis

43 acres on average. In addition, as noted in Section 3.0, many individual landowners hold less than 200 acres of total land33. This has important implications for the number and scale of contracts and negotiations with landowners that would be necessary to generate a large volume of carbon offsets (see section 8.5 below).
7.0 Economics of Forestry Carbon Projects
7.1 Landowners Incentivizing farmers is a critical component of the plan to convert agricultural land into forests. Since most of the agricultural land is privately-owned, afforestation will only occur if the “landowner’s revenue from the [afforested] land exceeds both the costs of reforesting the land forgone agricultural income”34. This section explores the economics of afforestation compared to alternative uses for the land. We conclude that positive returns for the current landowners from participation in afforestation projects are far from guaranteed. When reviewing the farmer’s economics, there are a few general components to consider:
• Returns from afforestation • Opportunity costs of afforestation
Both categories are reviewed in detail below. To calculate whether the landowner would initiate an afforestation project, we recommend calculating a net present value (NPV) of the investment. The NPV is the present value of all future cash flows subtracted by the present value of the investment cost. Future cash flows include any payments to the landowner resulting from carbon sequestration credits, hunting leases, government subsidies, and timber harvests. Costs include planting, harvesting, and most importantly, the opportunity costs of afforestation. Given that the LMAV is situated on a flood plain, the opportunity cost can be described as the return of growing soybeans. In order to account for the time value of money, a constant discount rate (based on the interest rate and risk associated with the investment) is used to discount cash inflow and outflows. The time horizon of this calculation should be long enough such that the NPV of any cash flows after the time horizon is negligible. Based on a survey of local lenders and the Federal Land Bank, two studies choose a discount rate of 7%35, while another uses a range of discount rates from 2.5% to 12.5%36. Though we do not expect investor preferences or the discount rate to remain 33 ibid. 34 Shabman, Zepp, Wainger King (2002) “Incentives for reforestation of agricultural land: What will a market for carbon sequestration credits contribute?” Journal of Sustainable Agriculture 17(2): 116-124 35 Amacher, Sullivan, Shabman and Zepp (1997) “Restoration of the Lower Mississippi Delta Bottomland Hardwood Forest, Economic and Policy Considerations” Research Bulletin 185, Virginia Water Resources Research Center, Virginia Tech University; Shabman, Zepp, Wainger and King (2002) “Incentives for reforestation of agricultural land: What will a market for carbon sequestration credits contribute?” Journal of Sustainable Agriculture 17(2): 116-124 36 Huang, C., Bates, R., Kronrad, G. D., and Cheng, S.: 2004, ‘Economic Analysis of Carbon Sequestration in Loblolly Pine, Cherrybark Oak, and Northern Red Oak in the United States’, Environmental Management. 33, Supplement 1.

constant over the next 80-100 years, we assume a discount rate of 7%. A standard formula for calculation the landowner net present value is37:
7.1.1 Returns from Afforestation The soils of the LMAV have high clay content and poor internal drainage, making the some of the land unsuitable for agriculture. By converting the land back to forest, the farmers can replace the low-yield soybean crop with fast growing trees. Studies have suggested that the economic output of a cottonwood-oak interplant will produce higher revenue than either species alone38. Reforestation creates a few types of revenue sources for the farmer: wood harvesting, hunting leases, government programs, and carbon sequestration credit sales. The cottonwood-oak regime allows the landowner to gain revenues every 10 years for each cottonwood harvest. Cottonwood is typically used for pulp and paper, rather than for timber. Around years 30 and 55, the landowner can thin the plantation and remove some of the trees. Absent poaching, fires, or some form of cheating, at the end of the oak growing period (approximately 70-100 years), there is a large timber harvest. Since hardwoods are used predominantly for construction and furniture, the carbon sequestered by these oaks will remain out of the atmosphere for a considerable additional period of time. There are major costs that are associated with the afforestation process39, including:
• Site Preparation and Chemical Treatment (year zero) • Cultivation (year one) • Cottonwood Planting (year one) • Cultivation (year two) • Oak Planting (year three) • Cottonwood Harvest (year ten) • Disking (years eleven and twelve) • Cottonwood Harvest (year twenty) • Oak Harvest (end of rotation – about year eighty)
In addition, if the stand of seedlings is flooded for at least two weeks in the summer or four weeks in the winter, replanting costs will occur (Shabman et al., 2002). As suggested by Hamel (2003), cottonwood-oak forests provide a new for multiple species of deer. A habitat for deer in the newly created forest is possible, creating an opportunity for hunting revenues as well. Landowners need to afforest a large amount of land to take advantage 37 See, for example, Shabman et al (2002) op. cit. 38 ibid; Amacher et al (1997) op.cit. 39 Amacher et al (1997) op. cit.

of this source of revenue. If neighboring plots are also afforested, this potential revenue increases. On the other hand, if the neighboring landowners start leasing their land as well, the price of hunting leases may decline since the demand for hunting leases is somewhat inelastic. Planting forests of any type in the LMAV can produce a revenue streams from the Water Resource Program or the Conservation Resource Program. In these programs, the government pays the landowner to stop planting crops. Carbon sequestration credit sales may help produce the returns necessary to produce a positive net present value to farmers. As the federal government considers a price on carbon, the profit potential for landowners increases. Studies have suggested that the average annual storage of the cottonwood-oak interplant is approximately 2.14 metric tons per acre for the first 15 years, 2.48 metric tons per acre for years 16-50, 2.31 metric tons for the next 20-30 years, and none afterwards40. According to the EPA41, “forest and agricultural sequestration options generate sizeable quantities of mitigation in the first couple of decades after implementation, but these effects diminish and even reverse in the out years.” After year 50, increasing the carbon stock becomes increasingly difficult. The Carbon Online Estimator provided by the USDA Forest Service42 shows that, in a 100 year period, 75% of potential carbon sequestration takes place in only 50 years. As the carbon stock in the biomass and soil become increasingly saturated, the rate of sequestration decreases. Carbon credit prices are a major source of uncertainty. Prices on the CCX are around $6.00 per ton today but have been under $2.00 per ton within the last year. A future regulatory cap on carbon emissions will be instrumental in determining the carbon price. If the US BCSD can prove to its members that its carbon credits are more trustworthy than other offsets on the market, the organization may be able to command a premium as other players in the OTC market currently do (see section 4.2.2 above). 7.1.2 Opportunity Costs Beside carbon credit prices, the opportunity costs of other land uses are a major concern for afforestation projects. The price of soybeans has increased dramatically in the last year, from approximately $7 to about $13 today. The rise in soybean prices is part of a general increase grain commodity prices. Conventional wisdom states that these commodity prices (including oil) are at all time highs, will continue to hit or at least remain at all time highs. Biofuels, demand from China and India, and high consumption of U.S. consumers are often blamed for this situation. Many observe the following graph43 and see a permanent change:
40 King, Wainger and Currie (1999). Effects of land use changes on carbon sequestration: Baseline estimates for U.S. agriculture and forestry. University of Maryland System Report #UMCEES-CBL-99-0299. Solomons, MD; Wainger, King, Shabman, and Zepp, (2000) The Benefits and Costs of Reforesting Economically Marginal Cropland in the Mississippi Delta. A report prepared for Delta Land Trust, Jackson, MS 41 Greenhouse Gas Mitigation Potential in U.S. Forestry and Agriculture (2005) U.S. Environmental Protection Agency, Washington, DC, EPA 430-R-05-006 42 http://ncasi.uml.edu/COLE/ 43 http://www.farmdoc.uiuc.edu/marketing/index.asp

Note that the prices are somewhat cyclical and usually return from its peaks. When the soybean price is high enough, landowners invest in a greater capacity for growing. There is a lag in the capacity building process before the there is an increase in output. Believing that high prices are here to stay, each landowner continues to expand soybean output while prices are high, causing supplies to increase and prices to decrease. Another perspective of soybean prices comes from examining the data from an inflation adjusted perspective. Taking inflation into account demonstrates that current soybean prices are substantially below historical highs. See the figure below demonstrating real soybean prices. We may be in a period that is analogous to 1972-73, which high and rising real prices that lead to a large, enduring glut of capacity caused a long period of low real prices. Similar to oil production there may be substantial delays in capacity increases.

7.1.3 Net Present Value of Afforestation The net present value calculation of Shabman et al.44 offers a useful template for calculating the net present value to the farmer. They calculate a present value to timber returns (including the cost of planting), hunting leases, carbon sequestration credits minus the opportunity cost of soybeans. Given a carbon price of $6 per ton and (at the time) expected soybean prices of $5 per bushel, an 80 year time horizon, and a discount rate of 7%, they calculated a negative NPV of $141 per acre. Given a higher carbon price of $20, they calculated positive NPV of $121 per acre. There are additional complicating factors for the farmer. First is the current status in Congress of the farm bill. Subsidies to farmers to grow crops are not going away anytime soon. Second is the unsteady stream of income to the farmer. An aggregator or some other party will need the capital to ensure that the landowner’s income does not vary too much. In order to take on this risk, the counterparty will take a percentage of the carbon credit revenue away from the landowner. Another economic concern involves the cost of maintaining a “carbon reserve pool.” If a natural or unnatural event destroys part of the forest plantation, releasing carbon in the atmosphere, there needs to be a way to ensure that additional carbon will be sequestered. Other concerns include additional costs of verification, monitoring, and fees of listing on an exchange. 44 Shabman, Zepp, Wainger and King (2002) “Incentives for reforestation of agricultural land: What will a market for carbon sequestration credits contribute?” Journal of Sustainable Agriculture 17(2): 116-124

7.2 Aggregators 7.2.1 AgraGate Model AgraGate Climate Credits Corporation45 was created to handle the Iowa Farm Bureau Federation (IFBF) Carbon Credit Aggregation Program, which began in 2003. As its name suggests, AgraGate acts as an aggregator on behalf of the IFBF, combining carbon credits from agricultural offset projects and selling them on the CCX. AgraGate has aggregated more than 1,000,000 acres from American farmers, ranchers and private forest owners in 16 states. In addition to their work as aggregator, AgraGate provides services to educate farmers about financial opportunities available through the sale of carbon credits, and manages a credit database system that provides tracking, reporting and certification46. Enrollees must complete and submit an “Application for Participation in Chicago Climate Exchange Soil Carbon Pool and Credit Sale Contract for Exchange Forestry Offsets (XFOs).” Aggregators may also contract with individuals to serve as associate aggregators. The associate aggregator is the link between the individual producer (usually a smaller producer) and an aggregator such as AgraGate. They are responsible for contracting with individual landowners, handling the necessary contractual paperwork, and performing direct field measurement of carbon sequestration potential in a manner that complies with the CCX carbon program. Landowners that have experience and confidence in these tasks, however, may choose to bypass the associate aggregator and sign up directly with any aggregator operating in their region. Larger producers may work directly with large aggregators. Offset verification costs are the responsibility of the offset project owners, but will be managed by the aggregator. A 10% service fee is retained by the Iowa Farm Bureau (AgraGate) and exchange offset registration fees will be deducted from pool proceeds prior to payment calculations. Aggregator fees generally break down as follows47: Carbon Reserve Pool 20% Aggregator’s fee 10% Associate Aggregator’s fee (if necessary) 10% Verification fee $0.12/ton CCX registration fee $0.15/ton CCX sales fee $0.05/ton A project owner who files a false certification report shall pay to the aggregator a penalty equal to twenty percent of the value of all offsets or allowances, as well as interest accrued from the
45 http:/www.agragate.com/ 46http://www.cdiowa.org/PHOTOS/2007%20Annual%20Conf/071129%20Basics%20of%20Carbon%20Credits%20AgraGate.pdf; also see http://texasforestservice.tamu.edu/uploadedFiles/Sustainable/enviro/TCEA%20Carbon%20Credits%20for%20Landowners.pdf 47 Following http://www.msforestry.net/pdf/Carbon.pdf

date of noncompliance, as well as all costs incurred by aggregator in enforcing the provision, inclusive of reasonable attorney fees. 7.2.2 C2i/GreenTrees model Research has uncovered another type of aggregator business model, which leverages government conservation payments to improve the economics of afforestation projects. The major proponent of this business model is GreenTrees48. According to their website and press releases, the focus of GreenTrees is on the LMAV and a mixed cottonwood-nuttall oak afforestation method, which appears to be based on the US BCSD’s own methodology. In this business model, the farmer receives all payments from the US Conservation Reserve Program (CRP49), as well as the future value of the cottonwood trees, which can be harvested after ten years. The costs of planting are shared between the USDA and GreenTrees, while the carbon credits generated by the nuttall oak trees are owned and sold by GreenTrees. Given the superior economics of this model, and since GreenTrees is also operating in the LMAV region, we suggest they are an important source of potential competition – or collaboration – for the US BCSD.
48 www.green-trees.com 49 http://www.fsa.usda.gov/FSA/webapp?area=home&subject=copr&topic=crp

8.0 Proposed US BCSD Business Model
Given the competitive advantages of the US BCSD - its relationships with corporate members plus the expertise and brand of the WBCSD - the proposed business model for the US BCSD is that of broker: connecting buyers who are seeking to purchase high quality forestry carbon offsets, with project developers and aggregators who meet quality standards that are certified by the US BCSD. This is outlined below in the diagram. The US BCSD would take a fee (percentage of the sale) for providing this service.
This strategy is predicated on finding buyers who are willing to pay a premium for the US BCSD 'certification', which would be based on WBCSD guidelines. This premium must be large enough to accommodate the US BCSD's broker fee, plus the project developer's additional cost of meeting the US BCSD standards, as well as providing an incentive for project aggregators to participate in the scheme. It is beyond the scope of this report to explore what premium is required, but this will be an important next step to explore. 8.1 Customers: An Overview The US BCSD's initial customer base will be its member companies, such as ConocoPhillips, who may be looking to purchase emissions offsets in the future. The US BCSD has a unique edge over aggregators looking to make supply-demand matches in that the US BCSD already has

partnerships in the business world through their membership base. The US BCSD may leverage this in the future to sign on other businesses that are in the market to purchase emissions offsets. The US BCSD can act as a broker between the business looking to purchase offsets, and those selling offsets, such as the CCX voluntary marketplace, or other OTC sellers. Continuing the role as a “hub for communications” is useful. To better determine the viability of scaling this project, the US BCSD should review the proposal with multiple members. Should the US BCSD wish to directly contact the landowners and bypass the existing aggregators, the organization can use connections with the farmers actively foresting, or with the potential to reforest or afforest, using the same network first established with the forestry project in which the US BCSD engaged in 1997. The US BCSD can explore connecting through the universities and forest agencies actively educating these farmers in the area of interest. Alternatively, the US BCSD may consider partnering with an existing aggregator such as AgraGate or an organization such as C2i who is already playing in this field and has connections with the landowners. The US BCSD may also consider brokering deals between the landowners and the forest product firms who have a vested interest in having the rights to future timber products. Given that farmers will likely only take on the task of reforestation or afforestation if the net present value is positive, it is also important to consider the desire for landowners to have a steady stream of payments over time. To reduce the risk of volatility inherent in forestry in the LMAV, landowners may be more interested in signing on to the project if they are guaranteed either an upfront payment or a steady stream of income over time. Forest product firms are likely more able to withstand volatility in exchange for the rights to future harvests. (Shabman, Zepp, Wainger, King) 8.2 Marketing Strategy and Distribution Channels For sourcing projects, marketing would be through liaison channels such as forestry agencies and universities (Universities of Georgia, Alabama, Tennessee, and the Arkansas Farm Service Agency (FSA)), as well as aggregators who are active in the LMAV region (such as C2i/GreenTrees). For potential customers, initial marketing efforts would be directed towards the member companies of the US BCSD. Relationship building and referral business are likely to be the major sources of additional customers beyond the core initial opportunity of the US BCSD members. 8.3 Pricing The most appropriate pricing model appears to be a percentage of the carbon sale price per ton. This is in line with current industry practice for aggregators. Regarding price point, the percentage fee that the US BCSD would be able to command is likely to vary with the sale price itself. For example, if the standard industry price is $6.00 per ton of CO2 (current CCX price), and US BCSD attracts buyers at $10 per ton, it will be able to attract aggregators to its scheme and charge a percentage fee for its services. If, however, it is able to attract buyers at $15 per ton (as do some OTC providers currently – see Section 4.2.2), then it is likely to be able to secure a higher percentage fee.

Determining the price premium and broker's fee the market is willing to bear is not possible without conducting market tests, so for the purposes of this document, the following indicative values are used:
CO2 price per ton US BCSD fee $10.00 5.0% $12.50 7.5% $15.00 10.0% $20.00 12.5% $25.00 15.0%
8.4 Operational Plan 8.4.1 Personnel In the initial phase, we suggest that a minimum of two key staff members are needed to establish this project: a scientist/project verifier, and a marketing/carbon finance specialist. These are distinct roles requiring very different skill sets, so it would seem unlikely that a single candidate could fill both functions. The project verifier would be responsible for defining the US BCSD standards and certifying projects for compliance with these standards. The marketing role would liaise with carbon offset buyers and project developers/aggregators regarding business terms, and be responsible for contract negotiation and signing. These are both skilled, highly specialized roles that will require a focused recruitment effort in order to secure the right candidates. It is important to note that there are several dimensions to verification and the US BCSD may want to allocate additional funds for verification and certification consulting fees. 8.4.2 Management and Organization Management structure is yet to be determined, but for the purposes of this document it is assumed that the CEO of the US BCSD would have overall responsibility for this project and its implementation. It is also strongly recommended that the US BCSD establish a management advisory board to oversee the project. This board should include such roles as a specialist from the WBCSD, a carbon finance expert, and an LMAV forestry expert. Experienced accounting and legal advisors will also be critical to ensuring the success of this project. 8.5 Financial Plan As outlined below in the table, our initial high-level estimate suggests that establishing this project will require a minimum of around $340,000 per year in costs. This is our first 'best guess' estimate, and should be treated as an indicative guideline only. Resource requirements will of course vary greatly with the volume and scale of offset projects and customers that participate in the project, and it is therefore difficult to predict in advance what future requirements will be.

US BCSD baseline costs US$ Staff
Scientist/auditor/verifier 80,000 Marketing/bus development 80,000 Overhead on costs @ 20% 32,000
Total staff costs 192,000 Travel (vehicles and air) 40,000 Marketing 20,000 materials, website, etc Legal fees 30,000 Other 60,000 computing, office space, telecoms, admin, etc TOTAL COSTS 342,000
Potential revenue forecasts are also extremely difficult to predict. We have therefore undertaken a scenario analysis using the price points outlined above in the pricing section, in order to determine breakeven points that would cover the estimated $342,000 in minimum baseline costs. To conduct this analysis, we took our indicative prices per ton of CO2 and associated US BCSD broker fees, and determined what volume of supply (in acres of land) would be required to earn $342,000 in revenue and therefore cover all project expenses. The results of this analysis are outlined below in the table. In all scenarios, it is assumed that one acre of land sequesters a total of 450 tons of CO2, and that the lifetime value of the sequestration credits is translated via forward contracts into upfront one-off payments, as is currently practiced in the industry50.
Breakeven annual revenue scenarios:
CO2 price per
ton
US BCSD
fee
Value of fee per ton ($)
Breakeven acreage required
Volume of CO2
$10.00 5.0% $0.50 1,520 684,000
$12.50 7.5% $0.94 811 364,800
$15.00 10.0% $1.50 507 228,000
$20.00 12.5% $2.50 304 136,800
$25.00 15.0% $3.75 203 91,200
50 See, for example, http://www.msforestry.net/pdf/Carbon.pdf

As shown in this table, if a price of $10 is achieved and the US BCSD is able to charge a brokerage fee of 5% on the transaction, it would need to source more than 1,500 acres of forestation projects per year in order to break even. This seems a large volume given the scale of landholdings in the LMAV region (see Section 6.) that is perhaps unlikely to be feasible with the proposed baseline resourcing. In addition, competitors’ pricing in the voluntary carbon market must be considered. For example, one provider – NativeEnergy – sells carbon offsets for $12.00 per ton. Presumably, they may be willing to purchase offsets from other carbon aggregators, and are therefore a direct competitor for the proposed US BCSD business. Given these competitive factors, we suggest that the US BCSD would need to achieve a price of around $15 per ton of CO2, and charge a brokerage fee of around 10%. This would require a project supply of around 500 acres per year to break even, which seems a reasonable initial target.
9.0 Insurance Plan Potential
American International Group, Inc (AIG) established their Office of Environment and Climate Change in 2006. Among their primary areas of activity is their commitment to support business units in the development of new climate change-related products and services. Some of their existing and upcoming insurance products include51:
• Risk Finance’s Carbon Credit Delivery Environmental Insurance to insure monetary losses resulting from the risk of non-delivery of or non-generation of carbon credits due to technological performance, credit or political risk. Coverage is intended for forward purchasers of carbon credits and investors in Clean Development Mechanism (CDM) and Joint Implementation (JI) Scheme of the Kyoto Protocol projects.
• Carbon credit Environmental Insurance endorsements for those on both sides of carbon emission offset instrument transactions.
• Renewable energy certificate Environmental Insurance for buyers and sellers of Renewable Energy Certificates (RECs).
• Forest carbon sequestration Environmental Insurance for losses of anticipated carbon credits due to physical damage to a forest.
Currently, insurance companies offer Standing Timber Coverage, which covers for loss due to fire or lightning. New policies will cover the loss of carbon credits, in addition to the cleanup and reforestry of the damaged forest. It is yet to be determined whether insurance companies will purchase replacement credits for the policy holder or provide money to the policy holder for replacing carbon credits on the open market themselves. It is possible that both options will be available and the policy holder will choose at policy inception. The new policies will include more perils (causes for loss) and a different valuation than the current Standing Timber Coverage
51 http://ir.aigcorporate.com/phoenix.zhtml?c=76115&p=irol-govresponsinitatives#footprint

policy. Current Standing Timber policies are valued based on the loss of timber. Future policies related to carbon credits will not be valued on the timber, but on the cost of the carbon credit (not both). Should a policy holder prefer to have a policy valued on the worth of the timber, the policy holder can change valuation methods in future policies (although not during an existing policy period). Policies will likely be multi-year, not annual, for approximately five to seven years. Until legislation is put into place, it has been indicated that a policy holder can choose whether it would like its policy to be valued according to CCX standards or the CDM standards of the Kyoto protocol. AIG has confirmed they have four "sustainability" products in the pipeline, and other insurers are sure to follow52. Either the farmers could purchase this type of plan, or the member companies invested in the offsets could purchase this type of plan to cover their risk of offset loss. AIG is willing and eager to form a relationship with the US BCSD to develop future insurance products in this arena.
10.0 Conclusion and Next Steps for US BCSD
We recommend that the US BCSD proceed into the afforestation carbon offset market with caution. Given the organization’s ties to carbon-emitting businesses, the US BCSD may enter as a broker, connecting buyers who are seeking to purchase high quality forestry carbon offsets with project developers and aggregators who meet quality standards that are certified by the US BCSD. There are both tremendous opportunities and major challenges associated with this new industry. The Opportunities:
• As domestic carbon markets develop, a large potential client base will begin looking for ways to offset its emissions, increasing the demand for carbon sequestration credits.
• Ever so slowly, the U.S. political establishment is moving toward accepting a cap-and-trade system for carbon. All of the major candidates for president endorse reducing emissions, but it is still up to the Senate to approve any international treaty like Kyoto and Congress to pass any national legislation.
• The US BCSD can use its connections with its member companies. The US BCSD must get a clear, unqualified understanding of how much its members are willing to pay to offset emissions and how much of a premium they are willing to pay for high quality offsets. For a set of carbon prices, the US BCSD should assess expected demand from its members. It should review the proposal with several of its member companies as soon as possible to determine general level of interest.
• The trusted brand name of the US BCSD can be leveraged to ensure that carbon-emitting companies will receive reliable carbon credits.
52 Telephone call with Karen O’Reilly, AIG Lexington Company 4/29/08.

• Afforestation has multiple benefits beyond reducing atmospheric carbon levels. It can create a bird habitat, contribute to biodiversity, prevent soil erosion and provide cleaner water to surrounding areas.
The Challenges:
• The environmental benefits are not guaranteed. Beyond helping members reduce their risk to carbon prices and litigation, the US BSCD must review environmental impact of afforestation. Afforestation does nothing to reduce the amount of carbon emissions. These emissions are permanent but planting trees is temporary. Encouraging companies to use less energy may have a more substantial environment benefit today since trees can take at least 50 years to maximize its sequestration of carbon emissions. Assuming that trees are used for paper, biofuels, or timber rather than preserved, afforestation may only delay the carbon problem our society is currently facing. When measuring the effect of afforestation on carbon, the US BSCD should also take into account and ensure minimization of the additional carbon emitted during planting, harvesting, transportation, and land upkeep.
• Economic benefits to farmers are not yet clear. There are major upfront costs to planting forests. Though real soybean prices are higher compared to where they were the last 20 years, some perceive that soybean prices at all-time highs and will only increase. On the other hand, though soybean prices are likely to increase, we are not convinced that prices will remain high. Elements of the current farm bill in Congress do not help make afforestation an appealing option.
• There is a crowded aggregator market. Given that the aggregators have already established working relationships with landowners around selling carbon credits, the US BCSD will need to convince them that they can play a useful role.
• As the market for carbon credits develops, moves away from the OTC markets, and becomes more efficient, the premium that the US BCSD can charge may decline. Increased competition between high-quality carbon offsets could decrease the potential US BCSD broker opportunity.
10.1 Marketing Strategy Marketing material has been developed for the US BCSD to use to educate landowners and businesses on the values and limits of afforestation. The marketing material consists of three distinct parts:
1. A slide deck that the US BCSD can use to explain the global carbon cycle, changes in the atmospheric levels of CO2 and potential benefits behind afforestation projects. These slides are intended to provide a simple but realistic overview of the entire sequestration process. (See appendix 4 for more details.)
2. An interactive model has been developed to be used to show landowners and businesses

sequestration potential under a variety of circumstances. This model has been made available to the US BCSD. (See Appendix 5 for overview.)
3. In addition to the slides and model, a supplementary document explaining the slides and the model in more detail has been created for the use of the US BCSD. (See appendix 5 to view the document.)

Appendix 1 – US BCSD Members and Partners US BCSD Members
BakerBotts Baker Hughes Battelle BrownFlynn ConocoPhillips Conservation Capital Cook Composites and Polymers (CCP) The Dow Chemical Company ENSR Holcim Lafarge Marathon Oil Co. Owens Corning Shell Texas Molecular Temple-Inland Thompson & Knight URS Fairmount Minerals Partners for Environmental Progress (PEP)
US BCSD Partners Chicago Waste To Profit Network China Business Council for Sustainable Development The Foundation for Sustainable Development The Home Depot Foundation McKnight Foundation National Fish and Wildlife Foundation National Industrial Symbiosis Programme (UK) United States Army US Environmental Protection Agency World Business Council for Sustainable Development

Appendix 2 – CCX Members Members Participant Members Associate Members Aerospace & Equipment Offset Aggregators Architecture/Planning Rolls-Royce 3Degrees Mithun, Inc. United Technologies Corporation Ag Business Solutions LLC Perkins & Will, Inc. AgraGate Climate Credits Corporation Automotive BGC Brokers LP Consulting Ford Motor Company Black River Commodity Energy Fund LLC DOMANI LLC CARBONyatra Ecos Beverage Manufacturing Carbon Farmers LLC First Environment, Inc. New Belgium Brewing Company Carbon Green LLC Global Change Associates Carbon Market Solutions Ltd. Natural Capitalism Solutions Chemicals Carbon Resource Management Ltd. RenewSource Partners LLC Dow Corning Carbon-TF B.V. Rocky Mountain Institute DuPont Cargill, Inc Potash Corporation C-Green Aggregator Ltd. Consumer Products Rhodia Energy Brasil Ltda China Energy Conservation and Environmental CPI Card Group Protection Technology Investment Ltd. Collective Wellbeing LLC Coal Mining CIA Inversionista El Faro, S.A. Jim Walter Resources, Inc. Community Energy Inc. Cultural Exchange PinnOak Resources LLC Conservation Services Group Supported International Immersion CP Holdings LLC Programs Commercial Interiors Delta P2/E2 Center LLC Knoll, Inc. Ecology and Environment Inc. Documentary Production Steelcase Inc. ecolutions GmbH & Co. KGaA Cloverland Inc. Econergy International Counties Eco-nomics Incorporated Embassy King County, Washington Ecoreturm LLP Embassy of Denmark, Washington D.C. Miami-Dade County, Florida Ecosecurities Capital Ltd. Sacramento County, California Environmental Carbon Credit Pool LLC Energy Broker Environmental Credit Corp. Amerex Energy Diversified Manufacturing FC Stone, LLC Eastman Kodak Company First Capitol Risk Management LLC Energy Services Flatlander Environmental Orion Energy Systems Ltd. Electric Power Generation FORECON EcoMarket Solutions LLC Prenova, Inc. AGL Hydro Partnership Foretell Business Solutions Private Limited Sieben Energy Associates Allegheny Energy Inc. Geosyntec Consultants Inc Thermal Energy International Alliant Energy Corporate Services Inc. Greenoxx Global Environmental Program

Members Participant Members Associate Members American Electric Power Grey K Environmental Offshore Fund Ltd Energy Supplier American Municipal Power-Ohio Grey K Trading Limited BlueStar Energy Services Inc. Associated Electric Cooperative, Inc. GT Environmental Finance MXenergy Holdings Inc. Avista Corporation Heath & Associates, Inc. Central Vermont Public Service Highland Energy, Inc. Engineering DTE Energy Inc Intrepid Technologies, Inc. Rumsey Engineers, Inc. Duquesne Light Company Jay James Castino Vanasse Hangen Brustlin, Inc. Green Mountain Power Kentucky Corn Growers Association Hoosier Energy Rural Electric Cooperative, Inc. LandGas Technology LLC Environmental Services Manitoba Hydro Liaoning Negfa Weiye Pipe Network Construction & Pennsylvania Recycling Markets Center NRG Power Marketing Inc. Operation Co. Ltd. Resource Recycling Systems Puget Sound Energy, Inc. Madhya Pradesh Rural Livelihoods Project Reliant Energy Services Inc. MGM International Financial Services TECO Energy, Inc. Microgy, INC Access Industries, Inc. Mickelson & Company LLC Coghill Capital Management LLC Mountain Association for Fintura Corporation Electronics Community Economic Development G.C. Anderson Partners LLC Motorola, Inc. National Carbon Offset Coalition MB Investments LLC Sony Electronics Inc. Natsource MAC 77 Ltd. Wood Creek Capital Management Square D/Schneider Electric N.A. North Dakota Farmers Union LLC Phase 3 Developments & Environmental Services Investments, LLC Financing Agency Atlantic County Utilities Authority Rajasthan Renewable Energy Ohio Air Quality Development Lancaster County Solid Waste Corporation Authority Management Authority Reclamation Technologies Inc Veolia Environmental Services North America Corp.
Reliance Energy Ltd. Food Services
Wasatch Integrated Waste Management Authority
Rice Dairy LLC Lobster.com
Waste Management, Inc. Standard Carbon LLC Southeast Carbon Management LLC Foundation Ethanol Production SunOne Climate Solutions LLC Nathan Cummings Foundation Corn Plus LLP Tatanka Resources LLC Tennessee Timber Consultants Inc Green Power Marketer Financial Institutions TerraCarbon LLC Green Mountain Energy Company Bank of America Corporation Xi'an Zhongyang Electric Corporation Information Technology Food and Agricultural Products & Services Offset Providers Open Finance LLC Agrium U.S. Inc. Arreon Carbon UK Ltd Intercontinental Exchange

Members Participant Members Associate Members Cargill, Incorporated Beijing Shenwu Thermal Energy Monsanto Company Trading Co. Ltd. Brokerage Cape May County Municipal Hill & Kehne, LLC Food Processing Utilities Authority Meister Cheese Co. LLC CNX Gas Corporation Legal Services Premium Standard Farms CO2 Australia Coadys Barristers & Solicitors Smithfield Foods, Inc. CommonWealth Resource Management Corp. Foley & Lardner LLP Cumberland County Improvement Authority Levenfeld Pearlstein LLC Forest Products Dhariwal Industries Ltd. Sullivan & Cromwell LLP Abitibi-Consolidated East Central Solid Waste Commission Weil, Gotshal & Manges LLP Aracruz Celulose S.A. Gallo Cattle Company Arcelor Mittal Florestas Ltda Granger Holdings LLC Non-Governmental Organization Cenibra Nipo Brasiliera S.A. Greater Lebanon Refuse Authority American Coal Ash Association International Paper Hubei Sanhuan Development Corporation Delta Institute Klabin S.A. Lugar Stock Farm Houston Advanced Research Masisa S.A. Montgomery Regional Solid Waste Authority Center MeadWestvaco Corp. Precious Woods Holding, Ltd Midwest Energy Efficiency Neenah Paper Incorporated Public Utility District No 1 of Chelan County, WA Alliance Stora Enso North America RCM International LLC Rainforest Alliance Suzano Papel E Celulose SA Rivanna Solid Waste Authority World Resources Institute Tembec Industries Inc. Sexton Energy LLC Temple-Inland Inc Sustainable Forestry Management Ltd. Printing The Andhyodaya Cushing & Company Healthcare Vessels Coal Gas Inc. The Big Print LLC Baxter International Inc. Weber County Private Colleges Manufacturing Liquidity Providers Presidio School of Management Bayer Corporation AGS Specialists LLC Duratex S.A. Amerex Energy Professional Associations Honeywell International Inc. Ameresco, Inc. Confederation of British Industry Interface, Inc. Atrium Carbon Fund LP Renewable Fuels Association Ozinga Bros., Inc. B of A Commodities Inc. The Professional Risk Managers' Smurfit-Stone BGC Brokers LP International Association Black River Clean Energy Municipalities Investment Fund LLC Real Estate City of Aspen Black River Commodity Fund Ltd ProLogis Logistics Services, Inc. City of Berkeley Black River Commodity Energy Fund LLC City of Boulder Black River Commodity Select Fund LLC Religious Organizations

Members Participant Members Associate Members City of Chicago Breakwater Trading LLC Jesuit Community of Santa Clara City of Fargo Brane Strom LLP University City of Oakland Cargill Power Markets LLC City of Melbourne, Australia CCM Master Qualified Fund Ltd Renewable Energy City of Portland CSS Investment Partners I, LP Airtricity Inc. Digilog Global Environmental American Renewable Energy Natural Gas Master Fund Ltd Econergy International Companhia de Gas de Sao Paulo - Congas Direct Energy Marketing Limited Reknewco Ltd. DRW Holdings LLC Sustainable Energy Partners LLC Petrochemicals Eagle Market Makers, Inc. Petroflex Industria e Comercio SA Engler Properties 1 Ltd Retiring/Offsets Evolution Markets LLC Carbonfund.org Pharmaceuticals EXO Investments CO2 Australia Abbott FCT Europe Ltd. Offset Collective, Inc. First Bank and Trust Planet C Recreation First New York Securities LLC TerraPass Inc. Aspen Skiing Company Fortis Energy Marketing & Trading GP The Global Warming Project Inc. Friedberg Mercantile Group Ltd. The Sustainable Group Retail Galtere International Master Fund LP Safeway, Inc. GFI Securities LLC Social Investment GLG Global Utilities Fund Generation Investment States Grand Slam Trading Inc. Management LLP State of Illinois Green Dragon Fund KLD Research & Analytics State of New Mexico Grey K Environmental Fund LP Pax World Grey K Environmental Offshore Fund Ltd. Steam Heat Grey K Trading Limited Technology Concord Steam Corporation Haley Capital Management Millennium Cell ICAP Energy LLC Polar Refrigerant Technology Steel Infinium Capital Management LLC Roanoke Electric Steel Corp. Ironworks Partners LP Transportation Services Jane Street Global Trading LLC Valera Global Inc. Technology JP Morgan Ventures Energy Corporation Freescale Semiconductor Juice Energy Inc. IBM Koch Supply & Trading Intel Corporation Kottke Associates, LLC STMicroelectronics Lehman Brother Commodity Services Marquette Partners, LP Transportation Marsus Capital LLC

Members Participant Members Associate Members Amtrak Matlock Research and Investments San Joaquin Regional Rail Commission Millennium Environmental Trading LLC MSM Capital Partners LLC University Natsource LLC Hadlow College Newedge Financial Inc. Michigan State University Octavian Special Master Fund LP University of California, San Diego Option Insight Partners University of Idaho ORBEO University of Iowa Penson GHCo University of Minnesota Peregrine Financial Group, Inc. University of Oklahoma Rand Financial Services, Inc. Tufts University Serrino Trading Company Shatkin Arbor, Inc. Spectron Energy Services Limited Stark Investments SUEZ Energy Marketing NA Swiss Re Financial Products Corp. Taconic Opportunity Fund LP TEP Trading 2 Ltd. The League Corporation TradeLink LLC Tradition Financial Services Ltd. TransMarket Group LLC Universal Carbon Fund LLC U.S. Energy Savings Corp. Wexford Catalyst Trading Limited Wexford Spectrum Trading Limited

Appendix 3 – Selected Potential Competitors Organization
Name Markets Used Partnerships Projects Funding Position Location
AgraGate Climate Credits
Corporation CCX Iowa Farm Bureau
Federation (IFBF)
To date, More than 1,000,000 acres aggregated from American farmers, ranchers and private forest owners in
16 states. The Exchange Forestry Offset (XFO) contract combines both afforestation and sustainably managed
provisions in a single document. Participants could initially enroll under
afforestation provisions and later transition to the sustainably managed
contract. Aggregate will help producers take advantage of the new
market in four ways: Provide essential services that educate
farmers, ranchers and forest owners about the financial opportunities available to them through carbon
credits. Provide a means for participants to
easily register their credits. Manage the trading program in a way that will provide superior results for
participants. Manage a credit database system that
provides highly reliable credit tracking, reporting and certification.
Returns proceeds to the landowner less a
service fee.
Offset aggregator Iowa

Organization Name Markets Used Partnerships Projects Funding Position Location
Asociacion contra el Cambio
Climatico Greenoxx:
Greenoxx Global Environmental
Program (GGEP)
Clean Development Mechanism
(CDM) of the Kyoto Protocol, Chicago Climate Exchange (CCX)
(Regulated Voluntary
market), CCB Standard, VCS Standard, OTC (Non regulated
Voluntary markets)
Greenoxx NGO, Greenoxx Consulting
Forestry and avoided deforestation projects (forest conservation): Renewable Wood Supplies for
Industrial Use Saint-Gobain - Brazil, Banking Pension Fund Forestry
Project - Uruguay, Notary Pension Fund Forestry Project - Uruguay,
Soroteca Agroflorestal Project - Brasil, Tectona Agroflorestal Project - Brasil
Environmental Grantmakers Association
(EGA), based in New York, a project of the Rockefeller Family
Fund
Offset aggregator Uruguay
C2i: GreenTrees Fund I
US Department of Agriculture, various state conservation
programs
New alternative silviculture process for rapid, low cost forestation of
marginal farmlands in the Mississippi Valley
Commercial and government funding
Offset aggregator
Mississippi Valley
Carbon Market Solutions
CCX, Joint Implementation (JI) of the Kyoto
Independent Forestry Services Ltd (IFS) Advisory, brokerage and trading Privately owned Aggregator,
educator, funder New Zealand
Econergy International Corporation
CDM & voluntary trading among US and
European actors
Provide services for project preparation and registration, as well as brokerage of credits into voluntary or
regulatory markets. Renewable energy producer; develop, build, own and operate renewable power plants for
GHG emissions reduction
Private and public financing, favorable
tax schemes, preferred permitting and
licensing regimes, and consumer choice
Aggregator, educator, funder Brazil

Organization Name Markets Used Partnerships Projects Funding Position Location
Environmental Synergy, Inc.
(ESI)
US Fish and Wildlife Service, The
Conservation Fund, The Trust for Public
Land, Winrock International,
TerraCarbon LLC
Plants indigenous trees in the United States for the purpose of carbon
sequestration; provides services to assess, enhance and report entity and
project level terrestrial carbon sequestration activities
Client funded Offset aggregator Atlanta, GA
First Capital Risk Management CCX
Methane Collection and Destruction: Livestock and other anaerobic digester
operations, Landfill and wastewater operations; Agricultural Practices: No-till, strip-till, or ridge-till, Grass cover
planting; Forestry Practices: Forestation, Forest conservation;
Renewable Energy: Displacement of CO2 emissions
Risk management fees Offset aggregator Illinois
FORECON EcoMarket
Solutions LLC CCX Forecon, Inc.
Consulting and aggregation: carbon, water and conservation-related asset
management services
Consulting, carbon stock accounting and
training fees
Offset aggregator New York
Lugar Stock Farm Inc CCX
604-acre family-owned farm. Active corn, soybean, and hardwood tree farm
in Marion County, Indiana growing grain for ethanol production that
reduces dependence on oil. A third of the farm is a classified hardwood tree farm, including significant acreage in black walnut trees that were planted in
recent years.
Utilizes risk management tools such
as federal crop insurance and
commodity markets
Offset provider Marion County, Indiana
Mountain Association for
Community Economic
Development
CCX
Invest, educate, provide technical assistance, conduct research, support
public policy for private forest landowners in the Appalachian region
of Kentucky
Various private and government funding
partners
Aggregator, educator, funder
Eastern Kentucky and
Central Appalachia
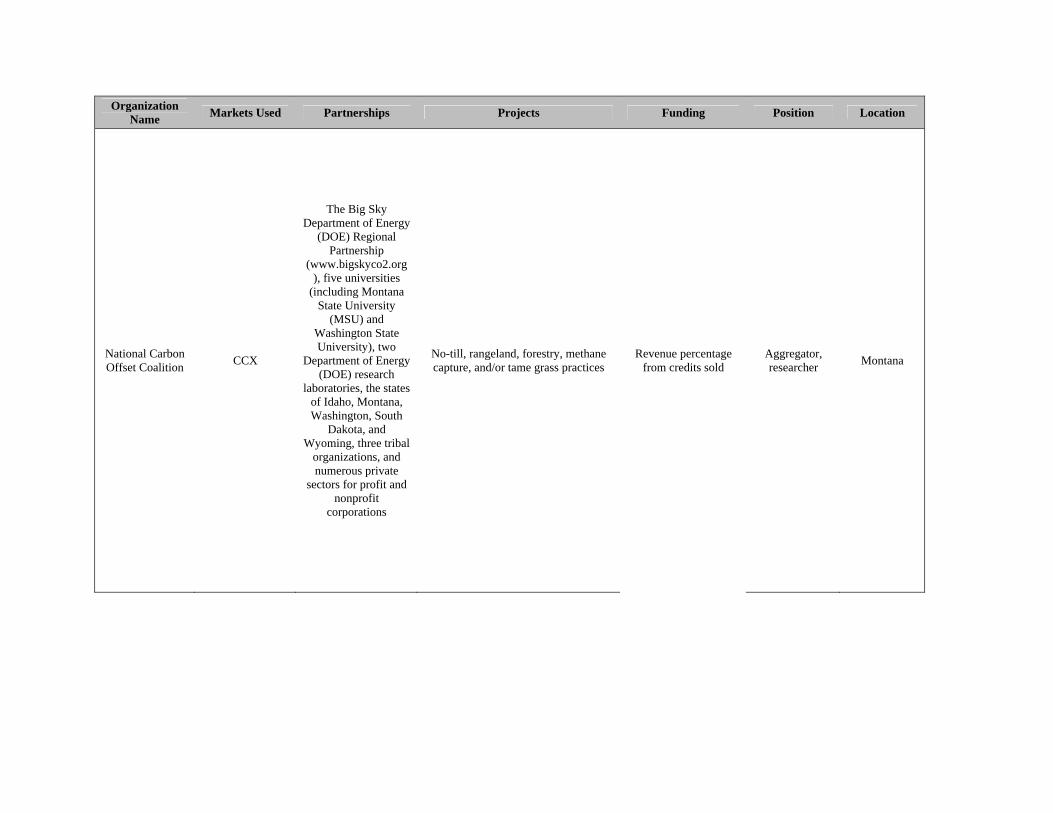
Organization Name Markets Used Partnerships Projects Funding Position Location
National Carbon Offset Coalition CCX
The Big Sky Department of Energy
(DOE) Regional Partnership
(www.bigskyco2.org ), five universities
(including Montana State University
(MSU) and Washington State University), two
Department of Energy (DOE) research
laboratories, the states of Idaho, Montana, Washington, South
Dakota, and Wyoming, three tribal
organizations, and numerous private
sectors for profit and nonprofit
corporations
No-till, rangeland, forestry, methane capture, and/or tame grass practices
Revenue percentage from credits sold
Aggregator, researcher Montana

Organization Name Markets Used Partnerships Projects Funding Position Location
Power Tree Carbon Company
The Conservation Fund, The Nature
Conservancy, Ducks Unlimited, Old South
Woodlands LLC, Central Arkansas
Resources Conservation and
Development Council and The Carbon Fund
Bayou Bartholomew, Bayou Pierre, Black Bear Plantation, Spanish Lake,
Walsh Lake, White River
A voluntary consortium of 25
leading U.S. power companies, has
established a multi-million dollar fund to
undertake six bottomland hardwood reforestation projects
in Louisiana, Mississippi and
Arkansas.
Offset provider LMAV

Organization Name Markets Used Partnerships Projects Funding Position Location
Precious Woods Holding Ltd. Switzerland
CCX
Forest Stewardship Council (FSC), World
Wide Fund For Nature (WWF),
WWF Switzerland, WWF Woodgroup
Switzerland, Greenpeace, Certified
Forest Products Council, Food and
Agriculture Organization of the
United Nations (FAO), Rainforest
Alliance, Smartwood, SGS, USDA Forestry Lab, Associação dos Produtores Florestais
Certificados na Amazônia (PFCA)
Sustainable Management of Existing Tropical Forests, Reforestation,
Carbon and Energy, Timber Trade/Sales in Costa Rica
(reforestation), Brazil, Nicaragua, Gabon, Holland, and Switzerland.
Shares of Precious Woods Holding Ltd. have been traded on
the SWX Swiss Exchange in Zurich
Offset provider Switzerland
Standard Carbon LLC CCX
Habitat Bank, Cascade Land Conservancy, Washington
Biodiversity Council, Carbon Campaign,
Invite Designer, Iowa Farm Bureau
CCX approved projects Consulting fees Aggregator, consulter,
funder Washington

Organization Name Markets Used Partnerships Projects Funding Position Location
Tennessee Timber
Consultants CCX Timber Management Management fees Offset
aggregator
Lexington, Centerville
and Franklin Tennessee
TerraCarbon LLC CCX Environmental
Synergy, Inc. (ESI)
Provides transaction advisory and asset management services to clients who develop or invest in forestry carbon
offset projects in the U.S. and internationally
Fees from technical, regulatory, and
financial expertise
Offset aggregator Illinois
The Delta Pollution
Prevention and Energy
Efficiency (P2/E2) Center (Delta P2/E2
Center)
CCX
The Delta Institute, The Illinois
Conservation and Climate Initiative
(ICCI), The Michigan Conservation and Climate Initiative
(MCCI), Delta Carbon Program
Provide technical services and financing to reduce pollution, trade
carbon credits (buy and sell on behalf of clients), and cut energy costs. Pools
and trades carbon credits generated from carbon sequestration projects on
behalf of farmers and landowners.
Supported by private and public grants, as
well as program- related investments.
Funders include: Great Lakes Protection Fund,
LaSalle Bank, Joyce Foundation, U.S. Environmental
Protection Agency
Offset aggregator
Illinois & Michigan

Appendix 4 – Marketing Slides
Carbon Off‐SetsSequestration Through Afforestation
Global Carbon Cycle Defined:
The continuous process by which carbon is exchanged between organisms and the environment. Carbon dioxide is absorbed from the atmosphere by plants and algae and converted to carbohydrates by photosynthesis.
Carbon is then passed into the food chain and returned to the atmosphere by the respiration and decay of animals, plants, and other organisms. The burning of fossil fuels also releases carbon dioxide into the atmosphere.

Global Carbon Cycle
Global Carbon Cycle:Comprised of 4 major reservoirs (sinks)
1. The Atmosphere‐ carbon exists primarily as CO2 in atmosphere
2. Terrestrial Biosphere‐ including freshwater systems and non‐living organic material, such as soil carbon
3. The Oceans‐ including dissolved inorganic carbon and living and non‐living marine biota
4. The Sediments‐ which includes fossil fuels
Trees vs. Agriculture
• The U.S. net carbon sink (>90% of which is occurs on forest lands) currently offsets 12% of greenhouse gas emissions. (EPA 2005)
• Over 90% of the carbon sink in the U.S. occurs on forest land while the agricultural sector is a net emitter of greenhouse gases.
• Accounting for carbon sequestration and non‐carbon emissions in forests and agriculture, the net offset is 6%/year.

Afforestation
• IPCC defines afforestation as the planting of new forests on lands that, historically, have not contained forests.
• Afforestation enhances carbon sequestration because land use is shifted away from low carbon storage use like crops.
• Carbon stored in forest soil and biomass (roots, trunks, branches and leaves)
• Rates of accumulation vary over time and tree type, ranging from 2.2 to 9.5 tonnes of CO2 per acre/year.
Conversion Rates of Land Use• Carbon stocks for agriculture on land estimated by USDA is 5 Ton/hectare and IPCCestimates that forests hold 86 Ton/hectare.
• Carbon stocks in soil vary from region to region, the sequestration potential is greater in regions with low carbon concentration in the soil.
Implementation of Afforestation: Potential Issues
• Little consistent global baselines for measuring carbon
• No established regulations in the U.S.
• Few conclusive studies calculate exact benefits
• Limited quantitative information on cost‐benefit analysis
• Majority of investment required upfront and more funds needed over time (Phase costs)

Phase I: involves selection of land for planting. At this phase, depending on land use (we use cropland as the base), minimal CO2 is sequestered.
Phase II: involves clearing the land and preparing it for planting. In this phase no CO2 is sequestered. Depending on methods used for clearing, varying amounts of CO2 are emitted.
Phase III: when actual planting occurs, it is recommended that only non-chemical fertilizers are used to limit CO2 emissions and other negative environmental impacts. Depending on the methods used, varying degrees of CO2 are emitted.
Phase IV: tree growth and CO2 sequestration in biomass and soil begin. CO2 sequestration increases as trees grow and plateaus as trees reach maturity.
Phase V: when the forest reaches maturity and the reductions and emissions of carbon dioxide level off to approximately net zero.
Figure 2
Phase I‐ Select land for planting (some CO2 being sequestered on existing land)
Phase II‐ Clear land (CO2 emission amount varies with clearing method)
Phase III‐ Plant (using non‐chemical fertilizers, CO2 emissions varies with planting methods)
Phase IV‐ Growth begins (CO2 neutral)
Phase V‐ Tree growth (CO2 sequestration through maturity)
Afforestation Phases
Environmental Benefits
• In locations with low carbon soil stocks (after prolonged cultivation) afforestation yields substantial carbon sequestration rates.
• EPA finds at $30/tCO2 mitigation potential of afforestation= 749 MtCO2 annualized over 100 yrs.
• Multi‐species plantations will create full ecosystems and may be more adaptable to climate change.
• Certain uses of mature trees prolongs emission of carbon back into atmosphere

Potential Uses for Mature Trees
Paper products (immediate CO2 emission), timber for building (minimal immediate CO2 emission), hunting land (minimal CO2 emission over time)
Verification & Certification
• Essential to any market‐based carbon trading program is the ability to accurately account for carbon concentrations and inventories.
• Verification requires measuring carbon stored below ground in soils and above ground in plants and trees at varying scales.
• Field data are required to support carbon accounting, to measure and verify carbon stocks, mitigate potential losses, and to validate models of the carbon cycle for terrestrial systems.
• Many companies have methods for verifying carbon offsets including Morgan Stanley, but they are not all using the same metrics.

Appendix 5 – Marketing Document
US Business Council for Sustainable Development
Carbon Offsets: Sequestration through Afforestation
Supplementary Marketing Document on Afforestation and Carbon Credits
May 2008
1.0 Introduction Forests play an essential role in the global carbon cycle by sequestering carbon emissions. Reforestation, avoided deforestation and afforestation are recognized as having the potential to make substantial contributions to sequestration efforts. The focus of this study is afforestation. The Intergovernmental Panel on Climate Change (IPCC) defines afforestation as the planting of new forests on land that historically have not contained forests, namely crop land. This document contains basic information to inform the development of marketing materials for the US BCSD’s afforestation and carbon sequestration projects. It also describes a modeling tool that is intended to accompany the marketing component by offering a more quantitative evaluation of the sequestration benefits of afforestation projects. 2.0 Basic Marketing Materials In order for all participants to understand the values and limitations to afforestation, we recommend the US BCSD begin by offering an overview of the carbon cycle as a whole and how it ties in to afforestation. This will allow landowners and businesses to gain a more thorough understanding of the projects. The following is the paper form of a slide presentation to be used in explaining and marketing any proposed projects. 2.1 Global Carbon Cycle The American Heritage Science Dictionary defines the Global Carbon Cycle as the continuous process by which carbon is exchanged between organisms and the environment. Carbon dioxide (CO2) is absorbed from the atmosphere by plants and algae and converted into oxygen and sugars by photosynthesis. Carbon is then passed into the food chain and returned to the atmosphere by the respiration and decay of animals, plants and other organisms. The most substantial emissions of carbon do not come from this natural process but rather from the burning of fossil fuels. Carbon, in the form of CO2, is the major greenhouse gas (GHG) released into the atmosphere as a result of human activities. The continued release of GHGs is causing a slow but steady

increase in the earth’s temperature. This rise in temperature disrupts climates around the world and raises sea levels. The increased temperatures are leading to major changes in ecosystems for animal and plant life and intense challenges in the agricultural system. The concentration of CO2 in the atmosphere has increased more than 30% since the start of the industrial revolution (mid-1800s) and is expected to continue increasing. (2) Most of the increase in atmospheric CO2 concentrations comes from the use of fossil fuels (coal, oil, and natural gas) for energy. About 25% of the increase over the last 150 years, however, was caused by changes in land use such as the clearing of forests and the cultivation of soils for food production. (2) The IPCC has developed a Carbon Flow Diagram to explain the flux in carbon both into and out of the atmosphere. It is important to note that the total carbon numbers have increased since the time that this diagram was developed and published however the IPCC is the authority on this issue and therefore its numbers have been chosen to represent the Cycle.
The Global Carbon Cycle is comprised of four major reservoirs or sinks: the earth’s atmosphere, terrestrial biosphere, oceans and fossil fuels. In the atmosphere, carbon exists primarily in the form of CO2. The terrestrial biosphere includes freshwater systems, plant life, and non-living organic material such as carbon in the soil. Oceans include dissolved inorganic carbon and living and non-living marine biota. Fossil fuels such as coal, oil and natural gas are used for energy. 2.2 Introduction to Using Forests to Sequester Carbon
Figure 1

Even though carbon can be removed from the atmosphere and sequestered in forests and forest products, currently many forests are being cleared. This clearing presents a major challenge for carbon sequestration. While the global community emits more carbon into the atmosphere each year there are fewer trees that are capable of removing that carbon from the atmosphere. Therefore the current levels of carbon dioxide in the atmosphere are increasing. There are a variety of practices that could reduce the current levels of carbon in the atmosphere. The major options include: afforestation, reforestation and the avoidance of deforestation. Although afforestation is the focus of this paper a brief description of the other two options is provided below: 2.3 Reforestation and the Avoidance of Deforestation Reforestation is the reestablishment of a forest, either by natural regeneration or by planting in an area where a forest was recently removed. Forests are removed naturally by disease and fires or by humans through deforestation. Deforestation is when forests are cleared for human use in pulp for paper, wood for timber, and other alternative land use such as farming. When the forest is destroyed, the ecosystem it supports and associated animal habitats are lost as well. Avoiding forest clearing is a crucial way to protect the environment. In addition to sequestering carbon, forests have the following functions: regulation of the water cycle, production of soil, protection of soil, a habitat for animals, generation of oxygen and protection against natural disasters. (2) 2.4 Afforestation Again, afforestation is the process of establishing a forest by planting trees or their seeds on land that has never been a forest, or has not been a forest for a long time. In various arid, tropical, or sensitive areas, forests cannot re-establish themselves without assistance due to a variety of environmental factors. One of these factors is that once forest cover is destroyed these zones become barren; the land dries out quickly and is inhospitable to new tree growth. Other critical factors include overgrazing by livestock and overharvesting of forest resources. Together these problems may lead to degradation of the land and the loss of topsoil. In the absence of topsoil, forests cannot grow until the very long process of soil creation has been completed; this process is further complicated by erosion. The only way that forests can be established in these areas is through afforestation. (4) Afforestation is important in creating ecosystems for plants and animals and in preventing soil erosion and floods. It also greatly enhances carbon sequestration because land use is shifted away from uses that store minimal carbon, such as farming. Once a forest is established, carbon is stored in the soil and the biomass (comprised of tree trunks, roots, branches and leaves). Rates of accumulation vary considerably over time and tree type, ranging from the 2.2 to 9.5 potential tonnes of CO2 sequestered per acre per year. (5) Afforestation has five phases as shown below in Figure 2, beginning with existing land and ending with a mature forest.

3.0 Carbon Sequestration Model 3.1 Background for the Model In order to model the carbon sequestered, it is not sufficient to only account for the carbon sequestered per tree. Initial planting emits CO2 into the atmosphere. Once tree growth begins, so does sequestration of carbon. During the growth and maturity phases, several factors may slow, halt, or reverse the sequestration of carbon dioxide. For example, if several trees become diseased and die, the carbon sequestered is released back into the atmosphere over many years. On the other hand, a forest fire will cause a more immediate release of CO2 into the air. Once the trees reach maturity there are a variety of actions available. One option is to leave the forest in its mature state, preserving the ecosystem and allowing all of the carbon to remain stored in the soil and biomass. Alternatively, the timber can be harvested for production of furniture and building supplies. Harvesting trees for timber results in the emission of carbon from the removal and treatment of wood. The sequestered carbon remains in the timber until
Phase I: involves selection of land for planting. At this phase, depending on land use (we use cropland as the base), minimal CO2 is sequestered.
Phase II: involves clearing the land and preparing it for planting. In this phase no CO2 is sequestered. Depending on methods used for clearing, varying amounts of CO2 are emitted.
Phase III: when actual planting occurs, it is recommended that only non-chemical fertilizers are used to limit CO2 emissions and other negative environmental impacts. Depending on the methods used, varying degrees of CO2 are emitted.
Phase IV: tree growth and CO2 sequestration in biomass and soil begin. CO2 sequestration increases as trees grow and plateaus as trees reach maturity.
Phase V: when the forest reaches maturity and the reductions and emissions of carbon dioxide level off to approximately net zero.
Figure 2

this new product is destroyed or discarded, causing the release of the carbon stored. Ideally, the timber will be harvested in small batches with new trees replanted in order to maintain the forest and further reduce CO2 levels. The trees can also be harvested for paper which results in some level of immediate emissions from the processing of the wood. The release of sequestered CO2 depends greatly on the use of the paper and how it is recycled or discarded. Other uses of the trees include biofuels from both dead trees and living ones. 3.2 Model Description We created a carbon sequestration model to analyze the cycle of carbon resulting from afforestation. The model is a flexible tool to obtain an idea of how much carbon is stored and released in an acre of land. The tool shows user that the path of carbon sequestration is more complicated than simply the amount of carbon currently stored in the soil and biomass. Effects of harvest, fire, and other events are included in the model. We have taken into account initial conditions such as the carbon sequestered prior to afforestation. Secondary effects such as the carbon emitted using machines to clear the land or plant trees are also included. Overall, the model is meant to be illustrative of the decisions made in the afforestation process. 3.3 Sample Model Outputs Using the inputs described in the appendix, the model tracks the following carbon data:
• Carbon sequestered in soil • Carbon sequestered in biomass • Cumulative net carbon sequestered
The cumulative net carbon sequestered is the key figure to review. This number is the sum of the soil and biomass carbon sequestered subtracted by the carbon released and emitted resulting from previous harvests. A beginning value of zero is assigned. To make this idea more clear, we examine below a few examples of the model output. Figure 3 assumes that no events disturb the carbon sequestration path after afforestation. Carbon sequestered in soil and biomass initially declines to about zero since carbon is emitted during conversion to forest. As the trees mature, the carbon sequestered increases before leveling out at maturity. Unlike the other two values, the “net carbon” becomes negative because carbon is emitted during conversion from the land’s previous use. Afterwards, the net carbon captured increases by the sum of the soil and biomass carbon sequestered.

Figure 4 demonstrates a scenario in which the acre of land is harvested for paper in year 20. The carbon sequestered in soil and biomass decreases to very low level. Note that the drop in net carbon in year 20 results from carbon emissions via the harvest of the old trees and planting of the new trees, not the release of carbon from the harvested trees. In this example, 95% of the carbon sequestered in the paper is released over ten years, beginning two years after the harvest.
Figure 5 demonstrates two events after the initial planting. In year 30 the trees are harvested for timber and replanted. In year 45 the 15-year old trees are harvested for biofuels. In this example, the carbon sequestered in the soil and biomass then decreases to near zero. The harvest and subsequent land preparation causes the emission of carbon, decreasing the net carbon in both year 30 and year 45. Since the biofuel harvest may have prevented additional petroleum use for fuel, we specified that a net 40% of carbon is released. This example
Figure 3
Figure 4

specifies that the carbon from the biofuels is released in year 46 only. For the timber harvest, the carbon is released beginning 35 years after the harvest, continuing for the next 50 years as the wood decomposes. This slows down the increase in net carbon beginning in year 65.
4.0 Appendix All inputs are in units of tons of carbon per acre. There are both user and non-user defined inputs to this analysis. Carbon Stored in Undisturbed Forest Conditions: Using the Carbon Online Estimator (COLE) developed by the National Council for Air and Stream Improvement (NCASI) and USDA Forest Service, we can obtain tables that demonstrate the amount of carbon sequestered both in biomass and in the soil for multiple tree types in any county in the United States. (5) Paul Van Deusen, a creator of COLE, explained that numbers used in his work are only “ballpark” estimates. In this paper’s model, a user can choose to “plant” one of the types of trees in the COLE report. Carbon Sequestered before Afforestation: Here the user enters the amount of carbon stored both in biomass and in the soil depending on the current use of the land. The user can also specify whether the land is currently grassland, a brownfield, or used in agriculture. Carbon Released in Conversion: Now the user types in the amount of carbon that is released from the soil or biomass during the initial conversion to forest. For simplicity, the COLE data assumes that no carbon is sequestered before afforestation. Thus we assume that after 11 years, the carbon sequestered follows the path specified in the COLE data. Carbon Sequestered After Fire/Harvest: Similar to the “Carbon Sequestered before Afforestation,” this entry allows the user to decide how much carbon remains after carbon is
Figure 5

removed. Carbon Emitted During Land Preparation/Harvest: The next step has the user specify the secondary effects of afforestation. Every time the land is either harvested or subsequently prepared for planting, extra carbon is emitted by the human activity involved. Harvest/Fire Release Parameters: For fires and the three uses of tree harvest (timber, paper, and biofuels), the user specifies how much carbon is effectively released. For example, if the user believes that a harvest for timber utilized for building houses will prevent significant carbon emissions from steel production, the user can decide that less than 100% of the carbon sequestered from the harvested wood is released. Subsequently, the user can decide how many years after the harvest the carbon will be released. Paper, for example, may be stored for a few years before the carbon is no longer sequestered. Finally, the user enters the number of years in which the carbon is released. We assume that a constant amount of carbon is released in each year during the release period. Year/type of event: After the initial planting, the user has to specify the number, timing, and types of events that take place. The user chooses the year number in which each event takes place. Subsequently, there is a choice as to the type of event: fire, harvest for timber, harvest for paper, and harvest for biofuel. 5.0 References
(1) Houghton Mifflin: American Heritage Science Dictionary, 2005. (2) Woods Hole Research Center: http://www.whrc.org/carbon/index.htm (3) Rain forest coalition on avoided deforestation:
http://www.rainforestcoalition.org/documents/ChomitzAvoidedDeforestationrev1.3.pdf (4) http://www.ipcc.ch/# (Fourth Assessment report on Climate Change- forestry Section) (5) EPA GHG Report 2005:
http://www.epa.gov/climatechange/emissions/downloads/08_LULUCF.pdf (6) COLE Development Group: COLE 1605(b) Report for Arkansas, Kentucky, Louisiana,
Mississippi, Missouri, and Tennessee.