Embed Size (px)
Citation preview
Auburn
u•
1V
e
•
1
y
Project Number ST 2019-6
Final Report
A FIELD STUDY OF STRIPPING POTENTIALOF ASPHALT CONCRETE MIXTURES
sponsored by
The State of Alabama Highway DepartmentMontgomery, Alabama
Frazier Parker, Jr.
Highway Research CenterHarbert Engineering CenterAuburn University, Alabama 36849-3501
August 1989
.
f.'l1
nnr 1
IIr 1
II
fl\ .1l.
1I
IIl
.r.'j~! .
LIi j
l j
!.. 1LJ
A FIELD STUDY OF STRIPPING POTENTIALOF ASPHALT CONCRETE MIXTURES
Final ReportProject Number ST 2019-6
by
Frazier Parker, Jr.
Auburn University Highway Research CenterAuburn University, Alabama
sponsored by
The State of Alabama Highway DepartmentMontgomery, Alabama
August 1989

1
I
II
[ 1
\ 1
[ 1
\J
IIJU1I"IIUL1
U1I
The contents of this report reflect the views of the author who is responsible for
the facts and accuracy of the data presented herein. The contents do not necessarily
reflect the official views or policies of the State of Alabama Highway Department or
Auburn University. This report does not constitute a standard, specification, or
regulation.
i
11i
jl
11ilL
; 1~.
1
j
l)LI
~ J
1
1I
l j
LJ
ABSTRACT
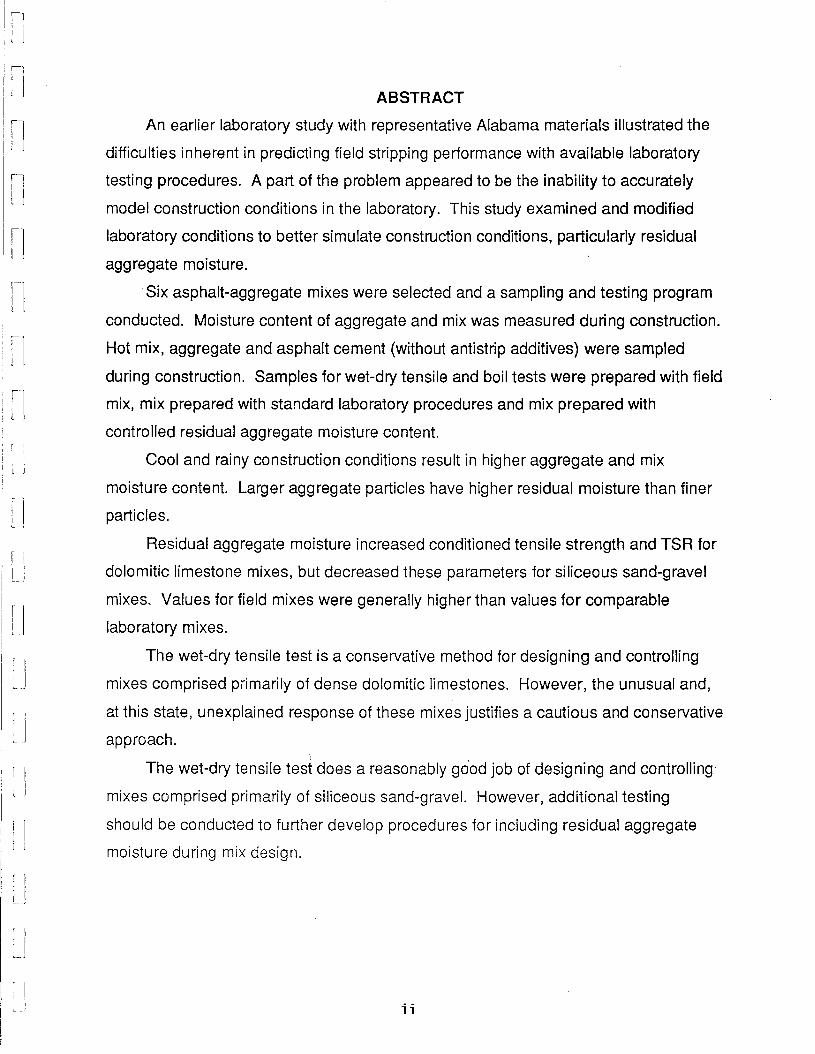
An earlier laboratory study with representative Alabama materials illustrated the
difficulties inherent in predicting field stripping performance with available laboratory
testing procedures. A part of the problem appeared to be the inability to accurately
model construction conditions in the laboratory. This study examined and modified
laboratory conditions to better simulate construction conditions, particularly residual
aggregate moisture.
Six asphalt-aggregate mixes were selected and a sampling and testing program
conducted. Moisture content of aggregate and mix was measured during construction.
Hot mix, aggregate and asphalt cement (without antistrip additives) were sampled
during construction. Samples for wet-dry tensile and boil tests were prepared with field
mix, mix prepared with standard laboratory procedures and mix prepared with
controlled residual aggregate moisture content.
Cool and rainy construction conditions result in higher aggregate and mix
moisture content. Larger aggregate particles have higher residual moisture than finer
particles.
Residual aggregate moisture increased conditioned tensile strength and TSR for
dolomitic limestone mixes, but decreased these parameters for siliceous sand-gravel
mixes. Values for field mixes were generally higher than values for comparable
laboratory mixes.
The wet-dry tensile test is a conservative method for designing and controlling
mixes comprised primarily of dense dolomitic limestones. However, the unusual and,
at this state, unexplained response of these mixes justifies a cautious and conservative
approach.I ,
The wet-dry tensile test does a reasonably good job of designing and controlling
mixes comprised primarily of siliceous sand-gravel. However, additional testing
should be conducted to further develop procedures for including residual aggregate
moisture during mix design.
ii
-I
1
II
IIi I
I
II
!.Jl
uU
1
U
I
TABLE OF CONTENTS
INTRODUCTION. . . . . . . . . . . . . . . . . . . . . . . . . . . . . . . . . . . . . . . . . . . . . . . . . . . . . . 1Background .. . . . . . . . . . . . . . . . . . . . . . . . . . . . . . . . . . . . . . . . . . . . . . . . . . . . 1
Stripping Mechanisms. . . . . . . . . . . . . . . . . . . . . . . . . . . . . . . . . . . . . . . 2Detachment . . . . . . . . . . . . . . . . . . . . . . . . . . . . . . . . . . . . 3Displacement. . . . . . . . . . . . . . . . . . . . . . . . . . . . . . . . . . . . . . . . . . 3Spontaneous Emulsification. . . . . . . . . . . . . . . . . . . . . . . . . . . . . 3Hydraulic Scour and Pore Pressure . . . . . . . . . . . . . . 3
Factors Which Influence Stripping '. . . . . . . . . . . .. 3Asphalt Characteristics. . . . . . . . . . . . . . . . . . . . . . . . . . . . . . . . . . 4Aggregate Characteristics .... . . . . . . . . . . . . . . . . . . . . . . . . . . . 4Mixture Design. . . . . . . . . . . . . . . . . . . . . . . . . . . . . . . . . . . . . . . . . 6Construction Practices. . . . . . . . . . . . . . . . . . . . . . . . . . . . . . . . . .. 7Traffic. . . . . . . . . . . . . . . . . . . . . . . . . . . . . . . . . . . . . . . . . . . . . . . .. 10Environmental Factors. . . . . . . . . . . . . . . . . . . . . . . . . . . . . . . . .. 10
Test Methods . . . . . . . . . . . . . . . . . . . . . . . . . . . . . . . . . . . . . . . . . . . . . .. 11Tests on Loose Mixture . . . . . . . . . • . . . . . . . . . . . . . . .. 11Tests on Compacted Mixture . . . . . . . . . . . .. 12
OBJECTIVES. . . . . . . . . . . . . . . . . . . . . . . . . . . . . . . . . . . . . . . . . . . . . . . . . . . . . . . .. 14
SCOPE 15
PLAN OF STUDY . . . . . . . . . . . . . . . . . . . . . . . . . . . . . . . . . . .. 16Selection of Materials 16Field Sampling . . . . . . . . . . . .. 19
Indirect Tensile Specimens. . . . . . . . . . . . . . . . . . . . . . . . . . . . . . . ... 20Boil Test Samples. . . . . . . . . . . . . . . . . . . . . . . . . . . . . . . . . . . . . . . . . . 20Moisture Content Samples 21
Laboratory Testing. . . . . . . . . . . . . . . . . . . . . . . . . . . . . . . . . . . . . . . . . . . . . . . 21Moisture Content Measurement .. . . . . . . . . . . . . . . . . . . . . . . . . . . . . 21Wet-Dry Indirect Tensile Test , 22.Mix Preparation with Controlled Moisture Content . . . . . . . . . . . . .. 23Boil Test. . . . . . . . . . . . . . . . . . . . . . . . . . . . . . . . . . . . . . . . . . . . . . . . . . . 25
PRESENTATION AND ANALYSIS OF RESULTS. . . . . . . . . . . . . . . . . . . . . . . .. 26Tests for Measuring Moisture Conte,nt . . . . . . . . . . . . . . . . . . . . . . . . . . . . .. 26Field Moisture Contents. . . . . . . . . . . . . . . . . . . . . . . . . . . . . . . . . . . . . . . . . .. 41Indirect Tensile Tests. . . . . . . . . . . . . . . . . . . . . . . . . . . . . . . . . . . . . . . . . . . .. 46
Dolomitic Umestone Mixes. . . . . . . . . . . . . . . . . . . . . . . . . . . . . . . . . .. 46Siliceous Gravel Mixes. . . . . . . . . . . . . . . . . . . . . . . . . . . . . . . . . . . . .. 56Comparison of TSR and VSI 69Prediction of Stripping Propensity with TSR . . . . . . . . . . . . . . . . . . .. 72
Boil Tests. . . . . . . . . . . . . . . . . . . . . . . . . . . . . . . . . . . . . . . . . . . . . . . . . . . . . .. 76
CONCLUSIONS AND RECOMMENDATIONS " 79
REFERENCES. . . . . . . . . . . . . . . . . . . . . . . . . . . . . . . . . . . . . . . . . . . . . . . . . . . . . . .. 82
APPENDIX. . . . . . . . . . . . . . . . . . . . . . . . . . . . . . . . . . . . . . . . . . . . . . . . . . . . . . . . . .. 84
iii
'I
~
r t
i J
C I
r I
[I
i IL_
l j
lJIU
LJ
INTRODUCTION
Although moisture susceptibility of asphalt concrete paving mixtures has been a
recognized problem for several decades, the quantification of stripping potential during
material selection and mix design has remained difficult. A completed laboratory study
(1) with representative Alabama materials illustrated the difficulties inherent in
predicting field stripping performance with available laboratory testing procedures. A
part of the problem appears to be the inability to accurately model construction
conditions in the laboratory, particularly incomplete drying and partial coating of
aggregate. This study will examine laboratory tests for quantification of stripping
potential with emphasis on the influence of residual moisture on and/or in the
aggregate. When possible, test results from specimens of laboratory and field mixed
materials will be compared.
Background
The process of stripping in asphalt concrete is most often thought of as a loss of
adhesion between asphalt binder and aggregate. This was first considered to be an
adhesion problem in 1932. (2). Researchers still consider adhesion to be the
dominant failure mode; however, some have added that stripping may also be a result
of a ioss of cohesion (3). The Asphalt Institute defines stripping as "the breaking of the
adhesive bond between the aggregate surface and the asphalt cement." The one
factor common in all proposed stripping mechanisms is the presence of water.
Adhesion improving additives may be added to the asphalt or aggregate to
overcome poor adhesion between the asphalt binder and aggregate surfaces. Many
tests have been developed to evaluate the properties that affect stripping and to
1
! I
I I
[I
UU
[1
UI
evaluate the effectiveness of adhesion improving additives. However, stripping is a
complex phenomenon, influenced by many factors, and no test has been universally
accepted as a predictor of stripping.
Failure caused by stripping occurs in two stages: loss of strength in the asphalt
concrete followed by failure of the pavement under traffic (4). Many pavements
experience stripping within the mix without subsequent structural failure of the
pavement. Indications are that a stripped pavement's loss of strength will be
minimized if the pavement structure has sufficient rigidity, or if the stripped material is
located deep enough in the pavement structure so that applied stresses are small (4).
Damage is usually minimal if only the coarse aggregat~ strips; however, if the fine
particles strip, severe damage can result (5). Asphalt which is not bonded to
aggregate may flush or bleed to the pavement surface and cause a loss of skid
resistance (6).
Stripping may manifest itself in several forms before complete disintegration
occurs. Excessive deformation may occur due to a loss of shear strength; it may
appear as cracking, rutting, corrugations or shoving (7). If stripping becomes
excessive, loss of strength and excessive deformation can lead to complete
disintegration of the pavement, often in the form of pot holes (4).
Stripping Mechanisms
Adhesion, or the lack of it, can involve the interac: on of many parameters and
can be explained in terms of mechanical, chemical and Lhermodynamic phenomena.
There are five different mechanisms, having wide accel ltance, by which stripping can
be explained: detachment, displacement, spontaneous emulsification, pore pressure
2
rli1II
iJ
III \
U
L J
! IL
U
lJ
J1
and hydraulic scour (4). These mechanisms can act individually or together to cause
stripping in asphalt concrete mixtures.
Detachment. Detachment is the separation of asphalt from aggregate surfaces
with the asphalt coating remaining intact (8). Detachment is usually explained by the
thermodynamic replacement of the asphalt by a thin film of water. .
Displacement. Stripping by displacement occurs at the three phase interface
between water, asphalt and aggregate, (Le., at some point where water penetrates the
asphalt film). It is a retraction of that asphalt-- water interface over the aggregate
surface (8). There is a belief that displacement is a function of viscosity; that is, high
viscosity binders show a higher resistance to displacement (9).
Spontaneous Emulsification. Spontaneous emulsification is the formation of
an inverted emulsion with water and asphalt, where asphalt is the continuous phase
and water the discontinuous phase (4). Emulsification may result in the loss of
adhesion between the aggregate and asphalt binder and/or the loss of cohesion in the
asphalt.
Hydraulic Scour and Pore Pressure. Hydraulic scour and pore pressure
are mechanical phenomenon. They occur when the pavement is saturated; vehicle
tires press water into the pavement in front of the tire and immediately suck it out
behind the tires (10). This water movement and pore pressure cycling is believed to
contribute to the stripping of asphalt films from aggregate.
Factors Which Influence Stripping
Stripping is affected by many factors. Some of the facwrs that have been
identified are: material characteristics (asphalt and aggregate), mixture design,
3
Cl( I
n
'1. I
11
1 ILJ
LJ
UiII
~ )
J1
construction practices, traffic, and environment.
Asphalt Characteristics. The viscosity of an asphalt is the most common
factor affecting an asphalt's stripping properties (4). High viscosity asphalts resist
pulling along an air-- water interface and pulling of the asphalt film increases with
decreased viscosity (3). A low viscosity asphalt has a higher "wetting power" and is
therefore more desirable from the standpoint of coating (8).
There has been speculation that asphalt composition and compatibility between
asphalt and aggregate may be a factor in the susceptibility of mixes to stripping.
However, there are no definitive studies that demonstrate the nature or the magnitude
of effect. Gharaybeh (11) concludes that there was no statistically significant (ex: = 5%)
difference between the two most widely used Alabama sources of AC-20 when
combined with five typical aggregate combinations. Hazlett (12) tested a limestone mix
with eight sources of asphalt cement and observed wide variations in stripping
susceptibility as measured by retained tensile strength. Dukatz and Phillips (13)
indicated differences in retained tensile strength of about 10% for two sources of
AC-20, but this difference was overshadowed by the effects of aggregate source.
Aggregate Characteristics. Some aggregate properties that are suspected
to affect the quality of the adhesive bond in an asphalt-aggregate mixture are:
mineralogy (chemical composition), surface texture, absorption, surface age, surface
coatings, and particle shape.
Mineraology (chemical composition) is generally recognized as the dominant
factor affecting stripping (8). Aggregates are generally classified as hydrophilic,
4
'nl'I
lil
U
lJ
uu
"water loving" or hydrophobic, "water hating." Hydrophilic aggregates usually have
high silica content and an acidic surface. They have a greater affinity for water than
asphalt and are considered to be more susceptible to stripping. Hydrophobic
aggregates usually have high carbonate content and a basic surface. They have a
greater affinity for asphalt than water and are generally considered more resistant to
stripping. Contrary to these beliefs, some hydrophilic aggreates have been observedf
to be highly resistant to stripping, and some hydrophobic aggregates have stripped (4).
This inconsistent response, as measured in laboratory tests, was observed in the
completed study (1) for a siliceous gravel and a dolomitic limestone mix.
Surface texture affects how well asphalt will spread over a particle surface and
how well that film holds onto the particle. Surface texture first affects the wettability of
the aggregate. Liquid asphalt spreads easier over a smooth surface. Slick particles
will, therefore, coat better initially. However, the smooth particle may not develop a
good physical bond with the asphalt. Aggregates with rough microtexture can create
stronger bonds with asphalt by providing a means for mechanical interlock between
asphalt and aggregate. Asphalt which penetrates into pores and surface irregularities
is resistant to displacement (8).
Aggregate absorption or porosity is related to surface texture. Absorptive
aggregates can be good or bad depending on the presence of water. Highly
absorptive aggregates when dry can create strong bonds by allowing asphalt to
penetrate into particles. However, if absorbed moisture is present it may interfere with
the forma.tion of a good bond between asphalt and aggregate surface. Aggregate with
large surface pores, such as limestone, exhibit stronger mechanical bonds than
']
i 1
I
I
[J
II, I,
1
[1
aggregates with smaller and fewer surface pores, such as quartz (4).
Another factor which may contribute to increased stripping susceptibility is the
age of crushed surfaces. Some freshly crushed aggregates have shown poor stripping
resistance (10, 14). Contamination of the fresh face by weathering can provide better
stripping resistance (4). Stockpile age of a week, or more, usually provides sufficient
time for exposure and reorientation of surface molecules (10).
Coatings on the surface of an aggregate can hasten or inhibit stripping. Coatings
of clay, silt, dust from crushing, and water have been found detrimental to stripping
resistance (10). Coatings of ferruginous materials, oil and fatty acids have been found
beneficial to stripping resistance (4).
Particle shape affects how well the asphalt will coat the aggregate. Rounded
particles are coated by asphalt with a more uniform film thickness than angular
particles. Sharp corners on angular particles, where the asphalt film is usually
thinnest, tend to be vulnerable to ruptures in the asphalt coating. The rupture then
allows water to enter between the asphalt aggregate interface.
Mixture Design. Three mix parameters that lab tests indicate may influence
stripping propensity are gradation, asphalt film thickness (asphalt content) and voids
(1, 11, 13). Gradation alone is probably not that important, although well graded
mixtures tend to show less tendacy to strip than mixes with basically one size material.
Gradation, as it relates to asphalt film thickness and the voids in a mix, is important.
Mixes with finer gradations (surface mixes) tend to have larger asphalt film thicknesses
and lower stripping propensity. Coarser gradations (base/binder mixes) tend to have
smaller asphalt film thicknesses and greater stripping propensity.
6
nL •
n:1
11
[ j
[i
IIl)
LJ
l j
LJ
)' ]L.
IJJ
I
Gradation will also affect the nature of the voids in a compacted mix. Although
voids are normally controlled at 6-8% for indirect tensile strength retention tests,
coarser gradations will produce fewer but larger voids. Larger voids will permit easier
access (greater permeability) to water and, thus, increase potential for stripping. The
effect of void size on permeability is apparent during vacuum saturation. It is much
easier to achieve 60-80% saturation for a coarse mix with 6-8% voids than for a fine
mix with 6-8% voids.
Tensile strength ratio is a function of voids with higher voids resulting in lower
retained strength (13). This influence is minimized in laboratory testing procedures
where voids are controlled at 6-8%, but implications are that field performance will be
affected by compaction.
Construction Practices. Compaction and weather conditions during
construction influence the susceptibility of an asphalt pavement to stripping.
Inadequate compaction will result in excessive and interconnecting air voids which
allow penetration of water and, therefore, increase the potential for stripping (10). If
rain immediately follows construction, stripping is more likely, since the asphalt
viscosity remains low for several hours after construction (4).
One aspect of field construction that has received little attention in stripping
research is the effect of residual aggregate moisture. It is often evident that aggregates
are not completely dried. Steam rising from trucks hauling hot mix or water draining
from truck beds is positive evidence 01' residual moisture in '(he aggregates. When
excessive moisture is present in a mix, popping or snappin~ sounds can be heard as
the steam escapes from the coated aggregate or the mix may slump and lack stability
7
11I,
rj!
j 1
U
1\
!JL.
UU
(15).
The occurrence of residual moisture is obviously dependent on environmental
conditions and p,roduction rate. In saturated aggregate stockpiles, the excess moisture
in and on the aggregates will tax the drying system. Typically, when saturated
aggregate passes through the dryer, the fine particles come out essentially dry
throughout, however, the coarse particles may exit surface dry, but hold moisture in
internal pores. According to Lottman (16), when saturated aggregate is heated by the
hot gases, escaping water vapor consumes some of the heat energy and prevents the
aggregate from reaching optimum drying temperature. Larger particles, which contain
the greater percentage of total moisture, give off large amounts of vapor and are slower
'to reach a uniform temperature. However, the fine aggregates heat up and dry out
faster due to their larger surface area to mass ratio. If the dryer retention time is too
short, the internal temperature of large particles will remain relatively cool and the
moisture in deep pores will not be vaporized.
In batch plants, aggregates leave the dryer and are segregated over screens into
separate hot bins. This creates a temperature differential with hotter, drier fine
aggregates in separate hot bins from the incompletely dried and cooler coarse
aggregates. In the hot bin, the coarse aggregates may stop loosing water vapor.
However, the absence of steam and dry particle surfaces does not mean that all
internal moisture is gone. Vapor loss may, in fact, completely subside in the hot bin if
internal aggregate temperatures remains low. However, as the segregated
aggregates are batched into the pug mill and sprayed with hot asphalt cement, the
heat, which is transferred to the coarse aggregate from the asphalt cement and hotter
8
2.
9
Energy expended liberating the residual moisture will result in heat loss
and a lower mixing temperature. At a lower mixing temperature the asphalt
viscosity increases and reduces its wetting power or ability to coat the
aggregate.
Escaping steam also impedes the asphalt from bonding with the aggregate
particle. Some aggregates have a greater affinity for water than for asphalt.
Moisture emerging from the internal pores displaces the asphalt film at the
aggregate surface forming a water layer around the particle and preventing
the asphalt from achieving intimate contact with particle surface. This
leaves the asphalt coating unbound to the aggregate and vulnerable to
stripping.
3. As the asphalt becomes more viscous as the mix cools, steam continuing to
emerge from the internal pores will cause ruptures or blisters in the asphalt
coating. The rupture in the asphalt film then provides an avenue for
external water to enter between the asphalt film and aggregate surface.
In drum plants a similar situation can develop. Reynolds (17) explains that when
the aggregates meet the asphalt spray in the drum all the particles are quickly coated.
Aggregate temperature at this point is usually between 1800 F and 200 0 F. The escape
of vapor from aggregates causes the asphalt to foam slightly and increase in volume.
fines, elevates the temperature within the larger particles enough to resume the drying
process. The release of steam from the deep pores of the aggregate in the pugmill is
likely to initiate stripping damage. Three consequences result from the escaping
steam.
1.
I, ]
•
f. ·1I
[1
1)
I
II
I j
l j
U
l]U
U
UcJ
II
il[1
i I
[ 1
I ]
r 1
1
]
j
1
I
i j
j
lJ
IJJ
This foaming is considered to aid the coating process. However, when the mix is
transferred to the surge or storage bin, the temperature of the mix is elevated. The
remaining internal moisture driven out at this time may disrupt the asphalt-aggregate
bond and initiate stripping.
Existing laboratory models do not account for the effect of residual moisture. Test
procedures usually begin with heating of the aggregates in a convection oven
overnight. This essentially assures that all moisture will be driven off. This modeling
inconsistency may contribute to poor correlations with known field performance for
some absorptive aggregate.
Traffic. The effects of loading on stripping susceptibility are not completely
defined. Some theories include dynamic pore pressure and hydraulic scour (caused
by traffic on wet pavements) as mechanisms which act to strip asphalt from aggregate
surfaces. Some field investigations have shown that stripping appears to be more
severe in areas of heaviest loading, Le., wheel paths. This observation is primarily
visual and the appearance of uncoated aggregate in wheel paths may be the evidence
of stripping rather than the cause, Le., cyclic hydraulic pressure may simply scour away
the stripped and loosened asphalt coatings.
Jimenez (18) proposed a test procedure which conditions specimens by
submerging and cycling the pore water pressure to simulate this condition. However,
most procedures ignore the effects of traffic loading.
Environmental Factors. The primary environmental factor that affects
stripping is water. Water can come from within the mix (in or on aggregate particles), it
can enter the pavement from the environment (through precipitation or transpiration) or
10
nl[-j
I]i ]
[I
[ j
[1
1
1 II "
Il )
i ILJ
r ]
I1 I~J
LJ
it can be trapped in the pavement when a layer is placed on a damp surface. In
laboratory stripping models, water is introduced externally by saturation of samples.
Other climatic factors which occur in the field such as oxidation, temperature
fluctuations, and freezing are sometimes simulated in the'laboratory conditioning
procedures.
Test Methods
Many tests have been developed to determine the susceptibility of asphalt
concrete to moisture. The two basic types of tests are those run on loose mixtures and
those run on compacted samples. None have, to date, received wide acceptance
because of often highly variable results and lack of correlation with field performance.
Tests on Loose Mixture. Tests run on loose mixtures subject a coated
sample to some moisture conditioning and evaluate the percent coating retained.
Quantitative or qualitative means are used to determine the percent coating retained.
The most widely used of these is the boil test. The boil test has been standardized as
ASTM 03625. A similar procedure is the Texas Boil Test (12, 14) which was used in
the previously completed study (1) and in this study.
In the boil test procedure, loose mix samples are immersed in boiling water and
stirred 'for a set period of time. The sample is then evaluated based on the 'percentage
of the asphalt coating that is retained on the aggregate.
The primary advantage of the boil test is its expedient nature. The methodology
is relatively simple and requires no special equipment, rr aking it an ideal field test.
The greatest pitfall of the boil test is the obvious dii erences between field and
laboratory conditions.
11
nL J
nII
1
, 1Iii
I'! I
II[I
lJ
II
IIlJ
U
J\
L J
1. Sample preparation does not resemble several aspects of field construction
(aggregate drying, mixing, compaction)
2. Boiling water does not reflect field environmental conditions.
Another disadvantage of the boil test is the subjective qualitative nature of the sample
rating, Le., the determination of asphalt coating retention is a subjective visual rating.
Tests on Compacted Mixture.· Tests on compacted samples are usually run
to compare an engineering property, such as strength, before and after moisture
conditioning. The immersion compression test is used to assess the loss of
compressive strength due to the action of water. Currently the most widely used of this
type test is the indirect tensile test. Variations of this type test are described in
references 14 and 19-24. The procedure proposed by Tunnecliff and Root (22) was
used in this study.
Lottman (19) developed a moisture conditioning procedure to evaluate the effects
of stripping on tensile strength of asphalt mixtures using the indirect tensile test.
Tunnicliff and Root (22) simplified the Lottman procedure by deleting the requirements
for freeze-thaw cycles.
The basic wet-dry indirect tensile test procedure involves testing and comparing
a group of conditioned (wet) specimens and a group of control (dry) specimens. The
specimens are prepared by Marshall or Hveem procedures. The conditioned group is
subject to accelerated moisture conditioning to promote stripping. Both conditioned
and control groups are then loaded to determine tensile strength and/or modulus of
elasticity. The ratio of the strengths or moduli from the conditioned and control groups
provides an indication of stripping susceptibility.
12

I 1I,
I
I
I
r I
II
[,
i I
11
l1
l]
LI
1II jl_
.1 IL
The wet-dry indirect tensile test has become a popular stripping test partly
because of the simulation of field conditions.
1. The laboratory procedure uses actual materials in true field proportions.
Specimens made of field mix or cores can also be tested. With laboratory
prepared specimens it is impossible to match the rapid and partial drying of
aggregates or the vigorous mixing action of a pugmill or drum mixer.
2. The compacted specimens with controlled void content can model densified
pavement. The 6-8% voids criteria is a midrange value between as
constructed and after traffic compaction.
3. The critical environmental conditions which lead to stripping in the field
(water saturation and realistic temperatures) can be simulated by moisture
conditioning procedures.
Special conditions that may be variable from plant to plant or job to job, such as mixing
of asphalt with partially dried aggregate in a drum mixer or storage at elevated
temperatures in a silo, could be simulated on an individual basis but would be
inappropriate for standard test methods.
The use of a basic engineering property (tensile strength) as a measure of
stripping is a second reason for the appeal of the wet-dry indirect tensile test. It has a
scientific basis and allows for a quantitative assessment of a mix. This attribute plus
simulation of field conditions has led to increased popularity of the wet-dry indirect
tensile test.
13

I
!I
1-1
! I
r I
I
iI! I
lJlJ
[I
ljl1
lJ
: j
IIl __
OBJECTIVES
The objectives of the research were as follows:
1. To examine the influence on stripping test results of differences between
laboratory specimen preparation conditions and field conditions, with
emphasis on the effects of aggregate residual moisture. '
2. To develop modifications to existing laboratory test procedures in order to
better simulate field conditions and improve their reliability as predictors of
stripping propensity of asphalt-aggregate mixtures.
3. To examine criteria for separating stripping from nonstripping mixes with
emphasis on consideration of aggregate material type (siliceous or
carbonate) as a factor in the criteria.
An auxiliary objective added during the research was to investigate methods for
measuring moisture content of asphalt-aggregate mixtures.
14
n',', I!j
nl,I,~·,n',1I
nf]
i1
[ ]
I
i )I J
[1
l j
L1
lI
SCOPE
Test methods examined will be limited to wet-dry indirect tensile and boil test.
For the wet-dry indirect tensile test, only the moisture conditioning procedures
proposed by Tunnecliff and Root (22) was considered.
Six mixes comprised of four siliceous gravel and two dolomitic limestone mixes
were tested. Two of the gravel mixes had base/binder gradations and two had surface
gradations. The dolomitic limestone mixes had base/binder gradations. Mix designs
were used for actual mixes sampled during production; except for one limestone mix
where no field sampling was conducted. Although asphalt cements being used with
the gravel mixes contained liquid antistripping additives, provisions were made to
sample mix and asphalt without antistrip additives. Therefore, all mixes tested
contained no antistrip additives.
Tests were conducted on mix sampled during actual production and on
laboratory prepared mix. For laboratory prepared mixes, standard techniques and a
technique developed to incorporate controlled residual moisture were used. Testing of
cores, as contained in the initial plan of study, w~s discontinued after the initial project
was sampled and tested. This decision was made because inconsistencies in the
voids of cores and laboratory prepared specimens (6-8%) made comparisons of
strength retention values rather meaningless. In addition coring with water may
adversly affect core strength and placement of thin lifts (surface mix) precluded
samples of adequate thickness for indirect tensile testing.
Moisture content tests were determined with microwave oven, distillation and
conventional oven procedures. The moisture contents used in comparing and
analyzing test results were those determined with the microwave oven.
15
nilIflIII)
[I
[ ]
I][ I
r 1
II
U
[1
lJi j
U
PLAN OF STUDY
To accomplish project objectives six asphalt-aggregate mixes were selected and
a program of sampling and testing conducted. Tests were conducted on aggregate
constituents and on asphalt-aggregate mixtures.
Selection of Materials
In a completed study of stripping of Alabama mixes (1), the wet-dry indirect
tensile and boil tests indicated potential for stripping opposite from observed field
performance for two mixes. A gravel mix from the northwest part of the state gave high
retained tensile strengtll and coating, although this a.nd similar mixes have a reputation
for severe stripping. A dolomitic limestone mix gave low retained tensile strength and
coating, although this and similar mixes apparently have no history of stripping
problems in Alabama.
Speculation was that the inconsistent behavior was caused by a failure of test
procedures to duplicate field conditions. For the gravel mix, which contained porous
gravel, the most likely specific cause seemed to be residual moisture in the aggregate.
For the dolomitic limestone mix no specific causes were apparent, although
inconsistent results for similar materials has been observed by others.
To study the influence of construction conditions on the predictability of the test
procedures, materials with characteristics similar to those that exhibited inconsistent
behavior in the completed study were chosen. The same dolomitic limestone was
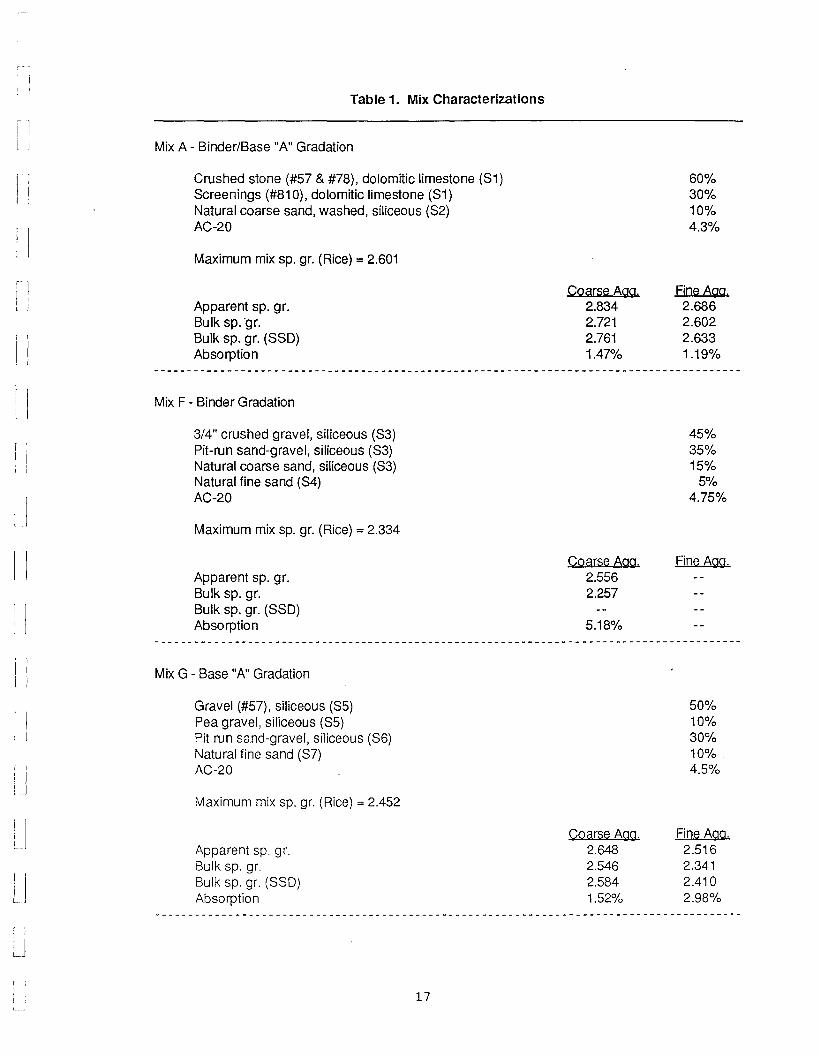
sampled, but it was nofpossible to test the same pc 'ous gravel. Table 1 describes the
six mixes sampled and tested.
The initial plan was to sample only base/binder mixes, since the completed study
16
IIII11
11
11
[I
r I
I j
[ I
i I
l j
! J
lJLI
LJ
Table 1. Mix Characterizations
Mix A - Binder/Base "A" Gradation
Crushed stone (#57 & #78), dolomitic limestone (S1)Screenings (#810), dolomitic limestone (S1)Natural coarse sand, washed, siliceous (S2)AC-20
Maximum mix sp. gr. (Rice) =2.601
Apparent sp. gr.Bulk sp. 'gr.Bulk sp. gr. (SSD)Absorption
Mix F - Binder Gradation
3/4" crushed gravel, siliceous (S3)Pit-run sand-gravel, siliceous (S3)Natural coarse sand, siliceous (S3)Natural fine sand (S4)AC-20
Maximum mix sp. gr. (Rice) = 2.334
Apparent sp. gr.Bulk sp. gr.Bulk sp. gr. (SSD)Absorption
Mix G - Base "A" Gradation
Gravel (#57), siliceous (S5)Pea gravel, siliceous (S5)Pit run sand-gravel, siliceous (S6)Natural fine sand (S7)AC-20
Maximum mix sp. gr. (Rice) = 2.452
Apparent sp. gr.Bulk sp. gr.Bulk sp. gr. (SSD)Absorption
17
Coarse Agg.2.8342.7212.7611.47%
Coarse Agg.2.5562.257
5.18%
Coarse Agg.2.6482.5462.5841.52%
60%30%10%4.3%
FjneAgg.2.6862.6022.6331.19%
45%35%15%
5%4.75%
Fine Agg.
50%10%30%10%4.5%
Fine AgO.2.5162.3412.4102.98%
11,I,
f•.' 'jII
"
:1
III
j
]
)
i]
IIlj
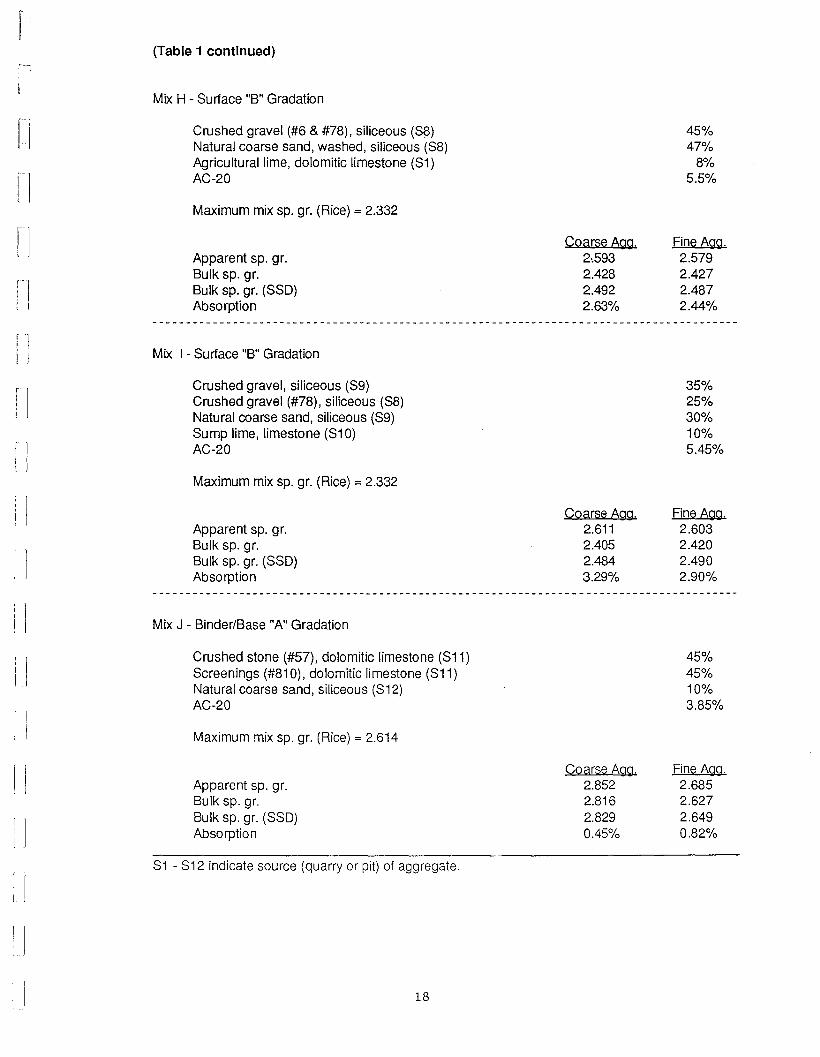
(Table 1 continued)
Mix H - Surface "B" Gradation
Crushed gravel (#6 & #78), siliceous (88)Natural coarse sand, washed, siliceous (88)Agricultural lime, dolomitic limestone (81)AC-20
Maximum mix sp. gr. (Rice) = 2.332
Apparent sp. gr.Bulk sp. gr.Bulk sp. gr. (SSD)Absorption
Mix 1- Surface "B" Gradation
Crushed gravel, siliceous (S9)Crushed gravel (#78), siliceous (S8)Natural coarse sand, siliceous (S9)Sump lime, limestone (S10)AC-20
Maximum mix sp. gr. (Rice) =2.332
Apparent sp. gr.Bulk sp. gr.Bulk sp. gr. (SSD)Absorption
Mix J - Binder/Base "A" Gradation
Crushed stone (#57), dolomitic limestone (S11)Screenings (#810), dolomitic limestone (S11)Natural coarse sand, siliceous (812)AC-20
Maximum mix sp. gr. (Rice) = 2.614
Apparent sp. gr.Bulk sp. gr.Bulk sp. gr. (SSD)Absorption
S1 - 812 indicate source (quarry or pit) of aggregate.
18
Coarse Agg.2,5932.4282.4922.63%
Coarse Agg.2.6112.4052.4843.29%
Coarse Agg.2.8522.8162.8290.45%
45%47%
8%5.5%
Fine Agg.2.5792.4272.4872.44%
35%25%30%10%5.45%
Fine Agg.2.6032.4202.4902.90%
45%45%10%3.85%
Fine Agg.2.6852.6272.6490.82%
[I
UtJ
l j
u
indicated they were more susceptible to stripping (lower retained coating and TSR)
than surface mixes. However, because of difficulties in identifying suitable jobs with
base/binder mix for sampling, two surface mixes with porous gravel were sampled.
These surface mixes may indicate lower propensity for stripping than comparable
base/binder mixes because of the larger asphalt film thickness and finer voids
structure, but differences between laboratory and field conditions should be consistent
with base/binder mixes.
Mix A is essentially the same as the base/binder Mix A in the completed study (1 ).
The source of the dolomitic limestone is the same, but 10% natural coarse siliceous
sand was used in lieu of 100% dolomitic limestone. Mix J is a similar base/binder mix
with dense dolomitic limestone from the Birmingham area. The dolomitic limestone for
mixes A and J are from the same geologic formation. Similar mixes have no history of
stripping problems.
Mixes F, H and I contain porous siliceous gravel from the northwestern part of the
state and have a history of stripping problems. The materials are similar to Mix D from
the completed study which produced high coating and tensile strength retention. Mix F
is a binder and H and I are surface mixes.
Mix G contains siliceous gravel from the southwestern part of the state. This
material tends to be less porous than the gravel for Mixes F, H and I and does not have
the reputation for severe stripping. Stripping and raveling are occasionally observed
for this and similar materials which leads to the classification as a moderate stripper.
Field Sampling
In order to compare field and laboratory conditions, a field sampling and testing
19
l1
n
r I1I
[1
[ I
1 ) .
[ I
IIIIl1
I ILJ
program was conducted. Hot mix was sampled and specimens prepared for wet-dry
indirect tensile and boil tests. Mix constituents (aggregate and asphalt cement) were
sampled during production for laboratory specimen fabrication. Mositure content of
aggregate and of mix was measured during production to provide a picture of the
drying process.
Indirect Tensile Specimens. Hot mix was sampled at the exit of the pugmill
for fabrication of indirect tensile specimens. Approximately fifty pounds of hot mix was
obtained and placed in a closed insulated box to minimize heat and moisture loss.
The initial temperature of the sample varied from plant to plant between 2750 F and
325 0 F. The hot mix was immediately taken into the field lab where samples were
quickly measured into heated molds and compacted to between six and eight percent
voids by automatic Marshall hammers. The number of blows required to achieve the
proper void content was determined by a trial and error process for each mix.
Typically, six to twelve specimens could be compacted before the mix cooled below an
acceptable level (a drop of 30 0 F or greater from initial temperature was considered
unacceptable). When the molds could be handled, specimens were extracted and
sealed individually in plastic wrap to prevent loss of moisture. At least two sets of
specimens were compacted for each mix, except Mix J which was not sampled during
construction. All specimens were transported to the laboratory where conditioning and
testing were completed within two days.
Boil Test Samples. Field boil test samples were attained from the pugmill
and sealed immediately in air-tight containers to avoid me .sture loss. The samples
were transported to the laboratory where the mix was divided into test size portions
20
[I
II1nn, ]
[I
: I
r 1
! I
II
I )
11
l j
lJUIIU
and tested within one week.
Moisture Content Samples. Samples were taken at several locations to
provide an indication of the moisture content in the aggregate and hot mix throughout
the drying, mixing and placement processes. Aggregate samples were typically taken
from the cold feed belt and hot bins. Mix samples were taken at the'pugmill and at the
spreader. Samples were placed in sealed containers and moisture contents
determined occasionally in the field, but normally transported to the laboratory for
testing.
Laboratory Testing
Wet-dry indirect tensile and boil tests were the basic tests utilized for evaluating
mix stripping propensity. Moisture content measurements were also an integral part of
the laboratory testing program since the influence of residual aggregate moisture was
a major consideration.
Moisture Content Measurement. Moisture content measurements
conducted in this study utilized a microwave oven to dry samples. This procedure
provides quick and consistent results without the cumbersome apparatus and
hazardous solvents used in the distillation procedure: Moisture or Volatile Distillates in
Bituminous Mixtures (ASTM 01461). The microwave procedure used for this research
is similar to ASTM 04643, a recently adopted procedure for determining moisture
contents of soils. The procedure, detailed in the appendix, involves calibration of a
common kitchen type microwave and the use of the oven ir' the same manner as a
conventional oven for drying aggregate and mix.
A comparison of test results from the microwave procedure, and the distillation
21
I]11
! I
I
[ I
:1
r II ,
i I
[I
III
j
I
J
LI
procedure and a conventional oven is contained in the next chapter. Based on these
comparative test results, the microwave procedure was deemed to be adequate for this
study.
Wet-Dry Indirect Tensile Test. The conditioning and testing followed the
procedures suggested by Tunnicliff and Root (22). Field mix specimens were prepared
as previously described. Laboratory mix specimens were generally prepared
according to ASTM 01559, but mixes with controlled moisture contents required
special treatment. The procedure for preparing mix with controlled moisture content is
described in the following section.
Bulk specific gravity and void content of compacted specimens were determined
in accordance with ASTM 02726 and ASTM 03203, respectively. Specimens were
compacted to 7 ± 1% air voids. Specimens were divided into two groups of three
having approximately the same average air void content. One group was set aside as
control, the specimens in other group are subjected to accelerated moisture
conditioning.
Specimens in the moisture conditioned group were first partially saturated with
distilled water by submersion and application of a vacuum. After specimens achieved
60-80% saturation, they were placed in a 140° F water bath for 24 hours.
At the end of the conditioning period, all specimens were placed in a 77° F water
bath for one hour. Specimens were then measured for thickness and loaded
diametrically until failure at a deformation rate of 2 inches per minute.
Tensile strength of each specimen was ca!culaled from the maximum applied
load using the formula:
22
il, -,
I
!I
St=ZE-1tdt
..................... (1)
[ I
i ]
[ I
[I
l j
l j
[ ]
l j
l j
[J
[I
LJ
lj
where:
St = tensile strength, psi
P = maximum load, pounds
d = specimen diameter, inches
t = specimen thickness, inches
Tensile strength ratio was calculated by dividing the average tensile strength of
conditioned specimens by the average tensile strength of control specimens.
TSR =average conditioned strength (2)average control strength
After tensile testing, representative specimens for each group (conditioned and
control) were split along the failure surface and the percent of asphalt coating visually
retained. The VSI is a ratio of the percent coating retained of conditioned to control
specimens, and provides an indication of the relative degree of stripping caused by the
conditioning.
Mix Preparation with Controlled Moisture Content. Incomplete drying of
aggregate during mix production can result in "wet" mix. It proved difficult to simulate,
in a controlled manner, partial drying in the laboratory. A review of literature on the
subject revealed a method developed by Western Laboi"atories in their efforts to study
laydown problems of "wet" mixes (15). The concern of hat research was not stripping,
but rather the effects of residual moisture on stability of the mix. Nonetheless, the
23
[
II[I
)
rjI
I][I
i I
l J
r jL
I I1L
l )
!.1L.
j
U
procedure used to fabricate laboratory samples seemed applicable to this research.
The procedure described below was Llsed to prepare mix with residual moisture.
For each set of specimens, sampled stockpile aggregates were combined
according to job mix proportions. Aggregates were graded by size over eight sieves to
the specified percentages. The aggregates for the entire set was then split at the No.4
sieve into a coarse portion and a fine portion. The coarse aggregate portion (+ #4
sieve) was placed in a can filled with tap water and set in a water bath at 1400 F
overnight. This soaking period allowed the coarse aggregate to achieve saturation
and served as a warm up phase in the heating process. The fine aggregates were
combined in another can and placed in a convection oven at 4250 F overnight.
At the end of the soaking period, the saturated coarse aggregate and water were
emptied into a household 6-quart pressure cooker. Hot water was added, as required,
to cover all aggregates. The pressure cooker and contents were heated on a hot plate
at 15 psi pressure until the rocker valve began to release pressure. Typically, this
phase took 30 minutes. Meanwhile, asphalt cement, standard 4 inch compaction
molds, and a large mixing bowl were heated to 3000 F. When the coarse aggregate
had reached pressure, the fine aggregate and asphalt cement were combined in the
mixing bowl. Pressure on the cooker was released, and the coarse aggregate was
drained over a colander. Once the water had drained, the aggregate dried quickly on
the surface and was added to the mixing bowl. Mixing was accomplished by a large
mixer until all particles were coated.
The mixture was then divided into four molds, a moisture content dish and a boil
test specimen. The moisture content sample was immediately weighed and placed in
24
nl I
n'""IIl'n,,'
Iij
:,'1:!i!;'
",·'1J
',''I:j
i
[ I
!)l)l j
uUlj
IIU
U
the microwave oven. Two molds were covered while the other two specimens were
compacted simultaneously with a twin hammer automatic Marshall compactor. The
covered samples were compacted immediately after the first pair was completed. The
boil test specimen was sealed to prevent moisture loss until tested with the procedure
described in the following section.
The moisture content of the mix achieved by this procedure depended on the
absorption of the coarse aggregate and the length of time the aggregate was allowed
to drain. It was difficult to achieve a specific moisture content but variations were
obtained by slightly adjusting the time between draining and mixing the coarse
aggregate.
Boil Test. Boil tests were run on field samples, standard laboratory prepared
samples and laboratory samples prepared with controlled moisture contents. The boil
test procedure used in this study is an adaptation of several procedures including
ASTM 03625, but most closely resembles the procedure by Kennedy, Roberts and Lee
(25).
The sample is placed in boiling water for 10 minutes, and stirred with a glass rod
at three minute intervals. Stripped asphalt is skimmed from the surface with tissue.
After 10 minutes the sample is cooled to room temperature, the water decanted and the
sample spread to dry on a paper towel.
A panel of judges subjectively rated the percent aspr,alt coating retained. A
lighted magnifying glass was used to examine samples. Tle average of the ratings is
rounded to the nearest 5%.
25
PRESENTATION AND ANALYSIS OF RESULTS
Results are presented in four sections. Moisture content measured with three
methods (microwave, distillation and conventional oven) are presented and analyzed
in the first section. In the second section, moisture contents measured during mix
production and placement are analyzed. Results from indirect tensi0n tests on
moisture conditioned and control samples prepared with field mix, conventional
laboratory mix and special "wet" laboratory mix are presented and analyzed in the third
section. In the final section, boil test results are presented and analyzed.
Tests for Measuring Moisture Content
The only standardized method for measuring moisture content of
asphalt-aggregate mixtures is the distillation procedure (ASTM 01461). This
procedure is time consuming, requires toxic materials, and is generally not suited for
field or routine production testing. However, the alternative, heating of the mixture
either by conventional or microwave ovens to remove moisture, has not been generally
accepted. This is primarily because of concern that heat will drive off light ends from
the asphalt. In the course of this study, data on the various methods were accumulated
and analyzed to select a method for moisture content determination.
Moisture contents determined with microwave, conventional oven and distillation
procedures are listed in Table 2. The top portion of the table is for asphalt-aggregate
mixtures and the bottom portion for aggregate only. The data from Table 2 were
plotted and analyzed to establish trends for and relationships between the various
methods of moisture content measurement.
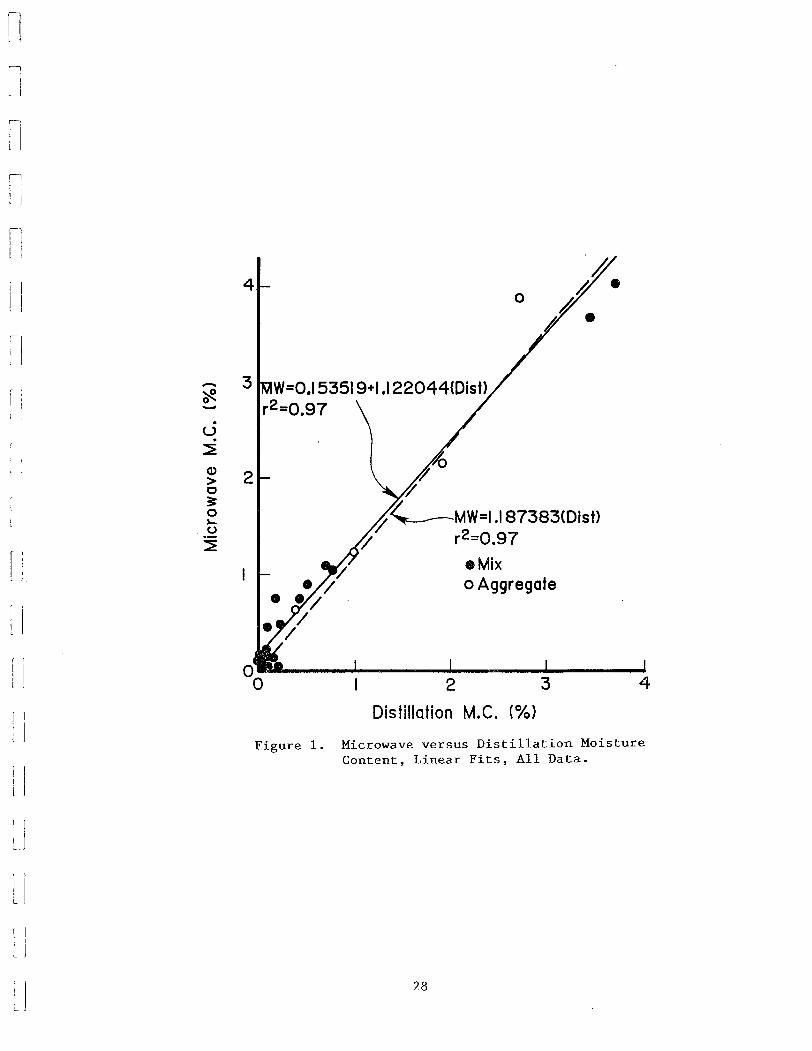
Figure 1 ShOY'IS a plot of microwave versus distillation moisture content with
26
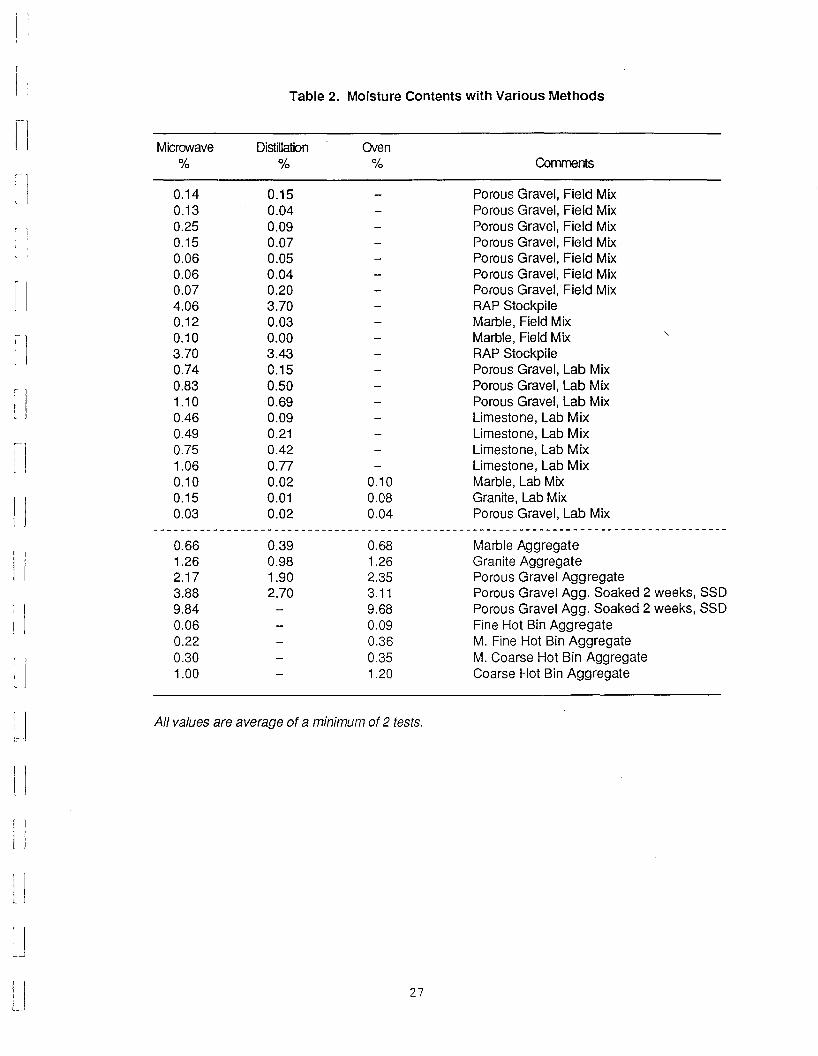
All values are average of a minimum of 2 tests.
Table 2. Moisture Contents with Various MethodsIf1
j]
I
j I
]
I- j
f],
! j
[ I
)
r j
! I~- -
'. J!I
l
j
j
U
Microwave%
0.140.130.250.150.060.060.074.060.120.103.700.740.831.100.460.490.751.060.100.150.03
0.661.262.173.889.840.060.220.301.00
Distillation%
0.150.040.090.070.050.040.203.700.030.003.430.150.500.690.090.210.420.770.020.010.02
0.390.981.902.70
Oven%
0.100.080.04
0.681.262.353.119.680.090.360.351.20
Comments
Porous Gravel, Field MixPorous Gravel, Field MixPorous Gravel, Field MixPorous Gravel, Field MixPorous Gravel, Field MixPorous Gravel, Field MixPorous Gravel, Field MixRAP StockpileMarble, Field MixMarble, Field MixRAP StockpilePorous Gravel, Lab MixPorous Gravel, Lab MixPorous Gravel, Lab MixLimestone, Lab MixLimestone, Lab MixLimestone, Lab MixLimestone, Lab MixMarble, Lab MixGranite, Lab MixPorous Gravel, Lab Mix
Marble AggregateGranite AggregatePorous Gravel AggregatePorous Gravel Agg. Soaked 2 weeks, SSDPorous Gravel Agg. Soaked 2 weeks, SSDFine Hot Bin AggregateM. Fine Hot Bin AggregateM. Coarse Hot Bin AggregateCoarse Hot Bin Aggregate
i II'Il .. ,
27
nl~I
4
•o
28
2 3
Distillation M.e. (%)
~~
~
7 ~MW=I.l87383(Dlst)II r2=O.97
.Mixo Aggregate
Microwave versus Distillation MoistureContent, Linear Fits, All Data.
W=O.I 5351 9+1.1 22044<Dist>r2=O.97
Figure 1.
2
4
3-~-.U.~
<D>o3=o~
.0
~
f j
! I
[I
U
I
Lj
j
1.1·\;1
(
! I
[1
!I

-1I
I
II
I
II
l I
II
[ I
II
r 1
l][I
J[I
[I
III
I
unconstrained and constrained (through the orgin) linear regression equations fit to the
data. The unconstrained fit has an intercept of about 0.15 on the microwave axis and
both equations have slopes greater than one, indicating that microwave moisture
contents are larger. Since moisture contents of asphalt-aggregate mixtures are
normally less than about 1%, as demonstrated by the distribution of data points in
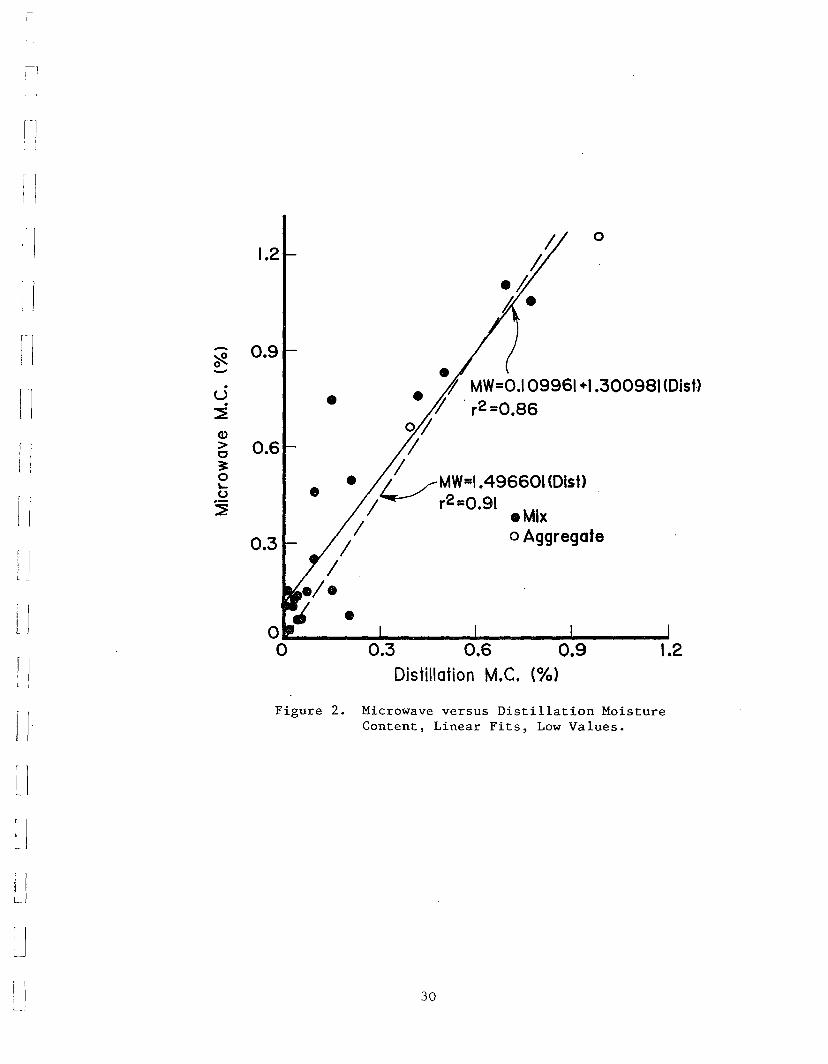
Figure 1, the reduced data set shown in Figure 2 was analyzed. The unconstrained
linear regression equation has an intercept of about 0.11 on the microwave axis and
both equations have slopes greater than one; again indicating that microwave
moisture contents are larger. The equations for the reduced data set also have !ower
coefficients of determination (r2) than the equations for the total data set.
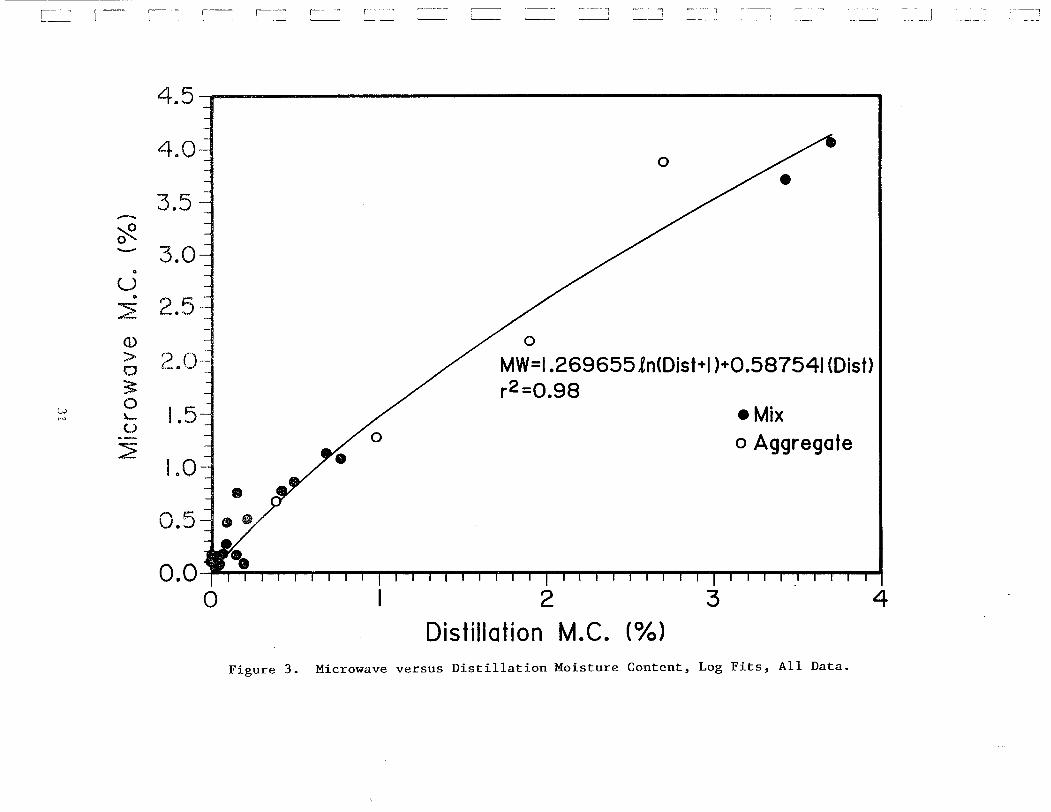
Examination of Figures 1 and 2 indicated that curves through the orgin might
provide a better fit of the data than straight lines. Relationships of the form
y = a[ln(x+1)] (3)
and
y = a[ln(x+1)]+bx " (4)
were tried. The latter provided the best fit. For small values of x, the a[ln(x+1)] terril is
dominate and provides the desired curved shape through the origin. As x increases,
the bx term becomes more dominate and the relationship approaches a straight line.
The curves fit to all the data and to only the lower values, using equation 4, are
shown in Figures 3 and 4, respectively. The goodness of fit, as measured by the
coefficient of determination, is only slightly better for tht,se equations than for the linear
equations. However, visually the log relationships seer 1 to fit the data better,
particularly for the low values.
29
i1r- I: I
i j
! )I ,
I II
[-I -~-
[).
u.~
(l)
[i >c3=0'-
l ju~
[J
,r I1
IIIIlJ
JU
U
/, 0
1.2 hehbl e
0.9
e
0.6
0.3
e0~ "" ""' """ .....1
o 0.3 0.6 0.9 1.2Distillation M.e. (%)
Figure 2. Microwave versus Distillation MoistureContent, Linear Fits, Low Values.
30
I~-"" [ ~~~, r- , -~ ,-'-" r-- -'~-_.~._- -,, -------1
I
oMW=I.2696551n(Dist+1 )+0.587541 (Dist)r2 =0.98
4.5
4.0
3.5..-...
~.......... 3.0-0
u0
2.5L())
> r:> 0-0
(_0 .
~
w 01.5>-' ~
U--:2
1.0-
3 •0.5
0.0I
0
o
2Distillation M.e. (%)
3
eMixo Aggregate
4
Figure 3. Microwave versus Distillation Moisture Content, Log Fits, All Data.
i ,.......,-"~~----'cl ~1 C"~]1 c u ·1 c-J_ ~ ---------! c _
1.50 i ,
1.25 -I 0
-~.......... 1.00
•u•
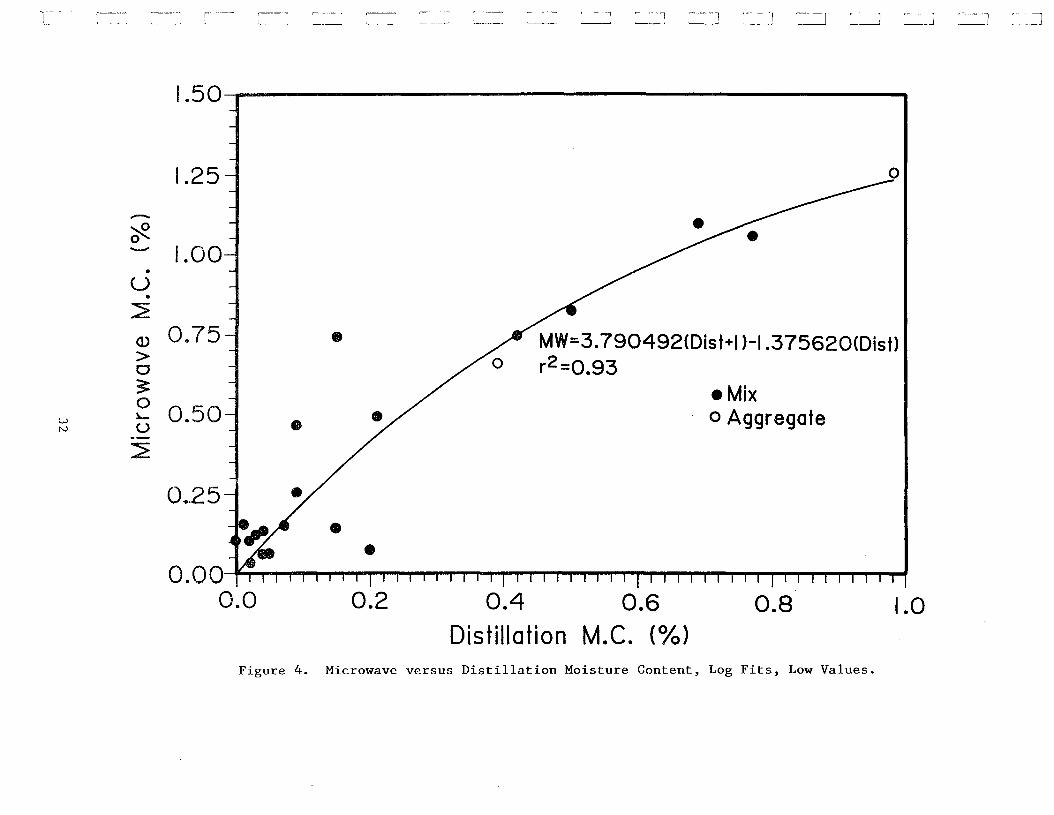
2Q) 0.75 • MW=3.790492(Dist+1 )-1.375620(Distl> r2 =O.9303: eMix0
o Aggregatew lo... 0.50 •N U--2
O~.25-L / •
e"""Ia-
0.000.0 0.2 0.4 0.6 0.8 1.0
Distillation M.e. (%)
Figure 4. Microwave versus Distillation Moisture Content, Log Fits, Low Values.
fl[I
II
[ I
[J
rI
[1
i j
f 1I ]
I I\ I
l 'l]tl:J
The shape of the curves may provide an indication of the reason(s) for
differences in measured values. If evaporation of light ends by the microwave was the
primary reason for the differences, then the differences should be relatively constant,
and there would not be a tendency for the relationship to go through the origin (0,0).
However, the cluster of points about the origin strongly suggests the relationship
should go through or close to the orgin. The tendency of the relationship to approach a
straight line as moisture content increases, and the fact that microwave moisture
contents tend to be larger for smaller moisture contents suggests the primary difference
may be the efficiency of moisture removal. The microwave heats aggregate from within
and appears to be more efficient in removing moisture. At small moisture contents, a
small amount of moisture not removed during distillation or a small additional amount
of moisture removed by the microwave would mean large percentage differences in
moisture content, thus, the curved relationship near the origin. However, as the total
amount of moisture in the sample increases, the difference in the moisture removed
would have smaller relative influence; thus, a linear relationship develops.
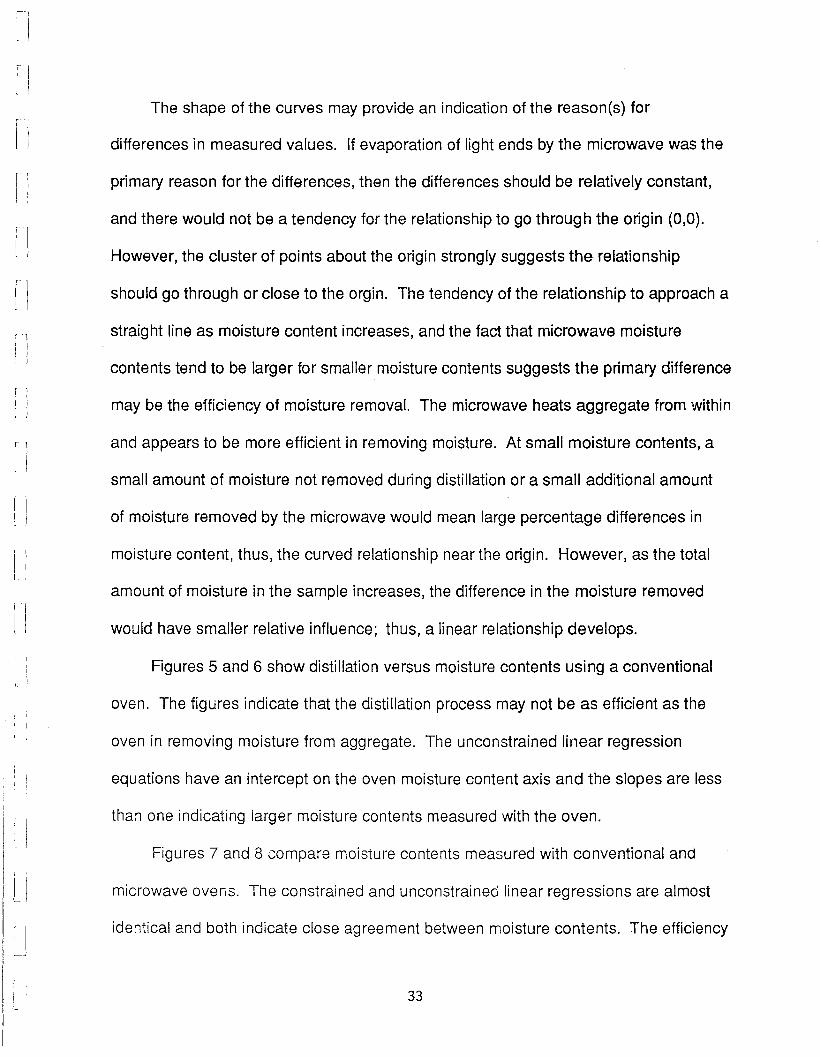
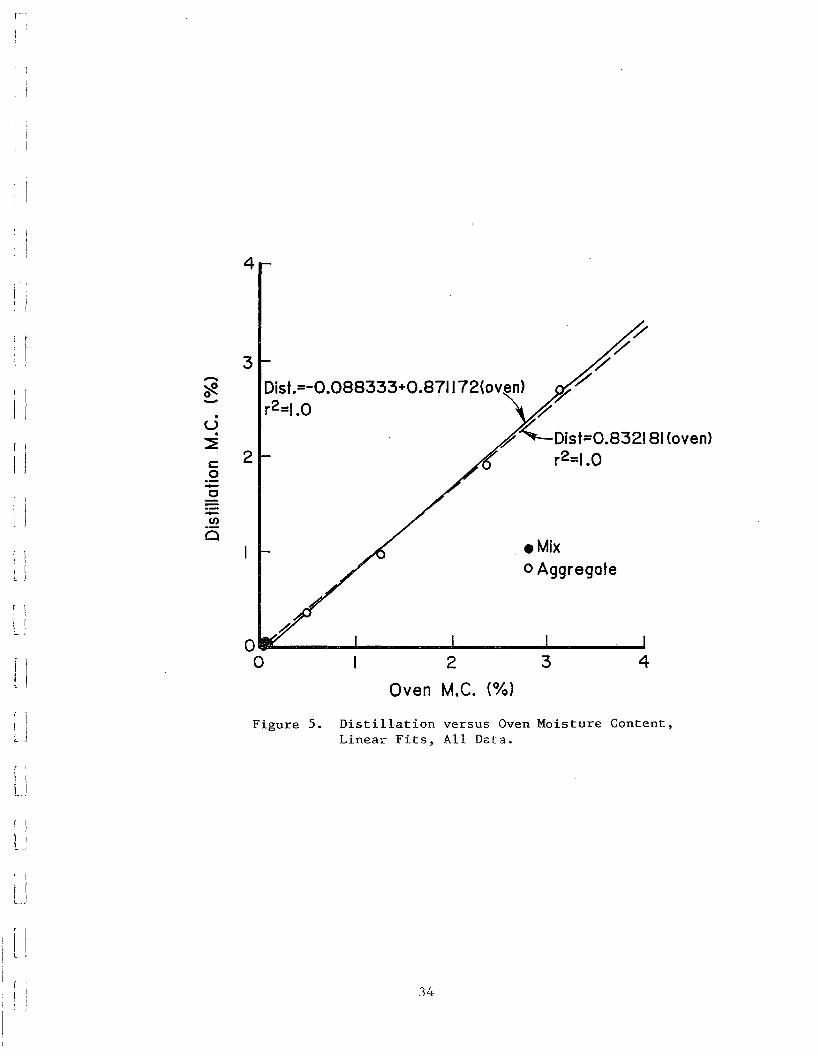
Figures 5 and 6 show distillation versus moisture contents using a conventional
oven. The figures indicate that the distillation process may not be as efficient as the
oven in removing moisture from aggregate. The unconstrained linear regression
equations have an intercept on the oven moisture content axis and the slopes are less
tha:l one indicating larger moisture contents measured with the oven.
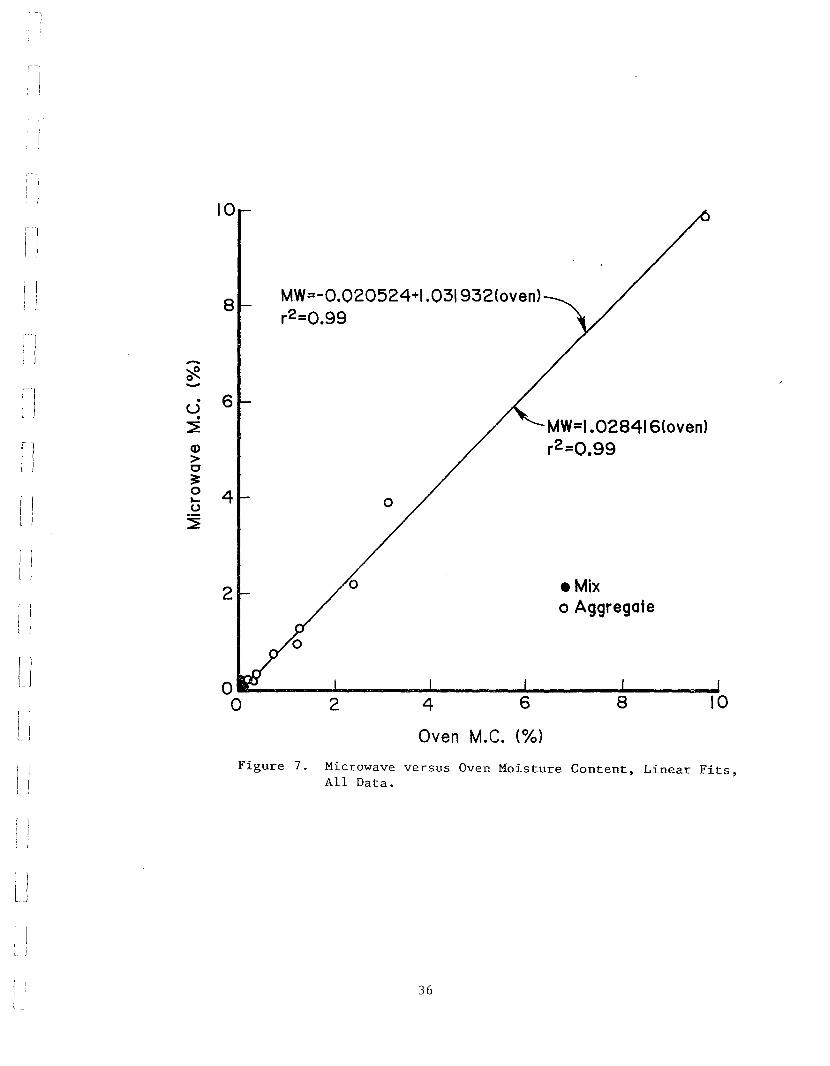
Figures 7 and 8 compare moisture contents measured with conventional and
microwave ovens. The constrained and unconstrained linear regressions are almost
identical and both indicate close agreement between moisture contents. The efficiency
33
r 1
II~ 1I I
I !4
4
.Mixo Aggregate
/"~
~~
~~
~~Dist=0.832181(oven)t r2=I.O
2 3Oven M.e. (%)
Distillation versus Oven Moisture Content,Linear Fits, All D~ta.
Dist.=-O.088333+0.871172(oven)1"2=1.0
Figure 5.
O.....---""'-----.......----J..---~o
3-~-.U.~
c 20-0-(J)
0
I 1
lJ
r \
" jL
[ j
I
U
U
LI
[ I
I\[ )
'II Ii IL_.J
rIL
34
n
1.2
.Mixo Aggregate
0.6 0.6
Oven M.e. (%)
0.3
o ~
Dist=-0.054846+0.784365(oven) ----.,~r2=0.98
~b-
Dist=0.727079(oven)~h-r2 =0.98 /../.. 0
/./'
/'/'
/'/'
/'/
OlQl,.IIIII::.--..I.----"'----_...L- ...._o
1.2
0.9
0.3
0.6
r]-~
r~ -,.
)I •U.~
c0.--c--.~
Q
Figure 6. Distillation versus Oven Moisture Content,Linear Fits, Low Values.
35
I I
il,
II1 I
f-j -~-rJ .
:1 Ul .
~
ri (J)
>0~0
rI
~
I UI
~l
! iI!
Ur 1
LJ
[ J
[ j
J
_J
IJ
10
8
6
4
2
MW=-0.020524+I.031932(oven)r2 =0.99
MW=I.028416(oven)r2 :O.99
• Mixa Aggregate
Oven M.C. (%)
Figure 7. Microwave versus Oven Moisture Content, Linear Fits,All Data.
36
1[i[ !
j I
i )0
1.2
[ j MW=-0.00631 5+0.92231 5(oven)r2=0.97 0
f I- 0.9
'* MW=0.9J 5344(oven). r2 =0.99u
IJ.~
Q)
> 0.60
II 3:0~
0
[J
~
0.3 -Mix
U 0o Aggregate
i J.1
0"L0 0.3 0.6 0.9 1.2
JOven M.e. (0/0)
Figure 8. Microwave versus Oven Moisture Content,Linear Fits, Low Values.
j
J37
nI, ,
r I
I )
r I
fl11l
I
, I
1
j
]
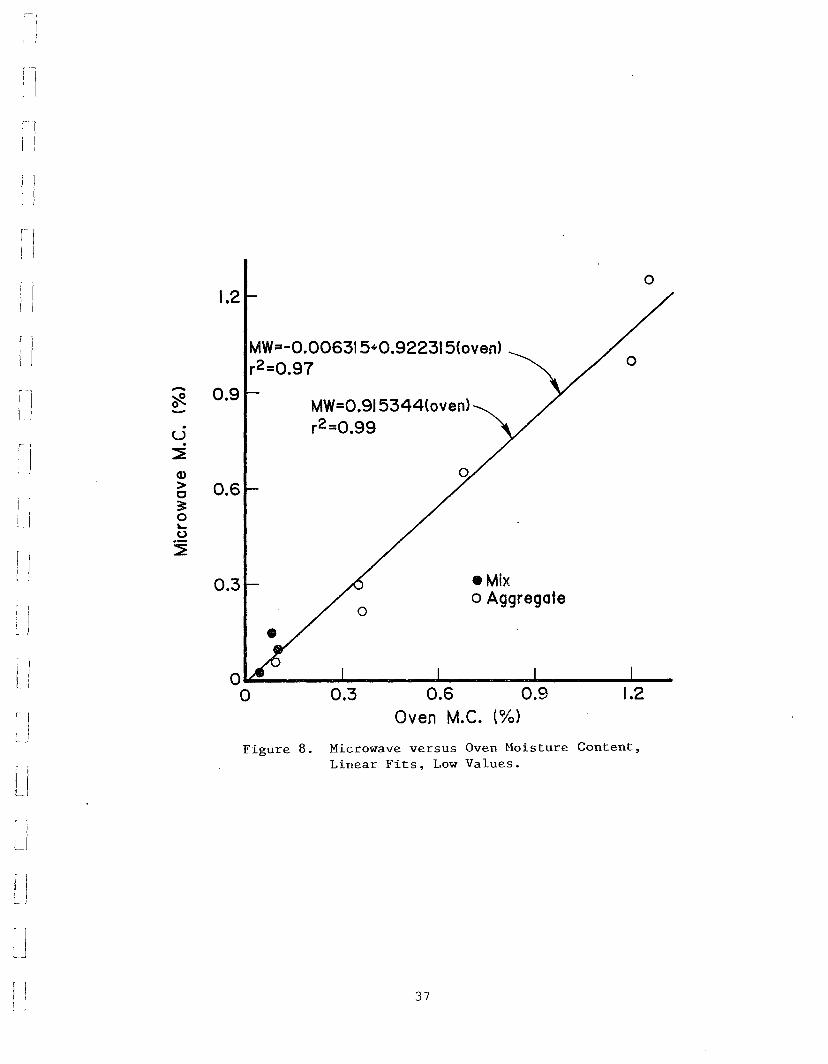
of the two methods in removing moisture from aggregate is apparently similar. For all
the data, including one sample at about 10% moisture content, the microwave moisture
content is slightly higher (Figure 7). But, for only low values (Figure 8) the microwave
moisture content is slightly smaller.
The comparisons with conventional oven moisture contents are primarily for
aggregate only (Figures 5 - 8). The comparisons of microwave and distillation (Figures
1 - 4) show no apparent difference between asphalt-aggregate and aggregate only,
although there are only four data points for aggregate.
In summary, Figures 1 - 8 show the following:
Microwave M.e. > Distillation M.e.,
Oven M.e. > Distillation M.e. and
Oven M.e. "" Microwave M.e.
Two proposed reasons for the differences between the distillation moisture
content and microwave or oven moisture contents are as follows:
1. The distillation process is not as efficient in removing moisture and may
leave some residual moisture in the aggregate.
2. The microwave and conventional oven may drive of volatiles from the
asphalt cement.
The shape of the curves in Figures 3 and 4, and their apparent tendency toward the
orgin suggests that incomplete drying in the distillation prc~ess may be the more
important factor.
The magnitude of weight loss in asphalt cement duri ,g heating can be used to
substantiate the above speculation. Table 3 was extracted from a paper by
38
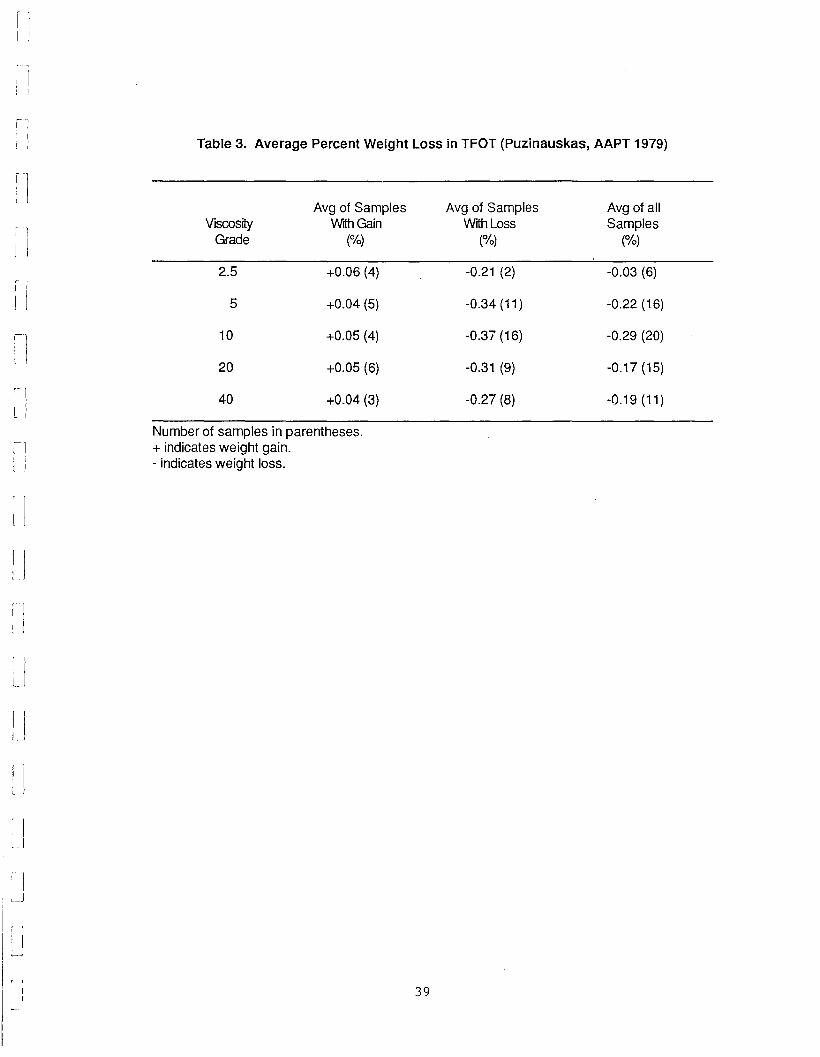
Table 3. Average Percent Weight Loss in TFOT (Puzinauskas, AAPT 1979)
11Avg of Samples Avg of Samples Avg of all
; IViscosity With Gain With Loss Samples
Grade (%) (%) (%)
2.5 +0.06 (4) -0.21 (2) -0.03 (6)r I
! I 5 +0.04 (5) -0.34 (11) -0.22 (16)
1110 +0.05 (4) -0.37 (16) -0.29 (20)
20 +0.05 (6) -0.31 (9) -0.17 (15)
II 40 +0.04 (3) -0.27 (8) -0.19 (11)I
Number of samples in parentheses.+ indicates weight gain.- indicates weight loss.
II
39
I
f I
II
11
r )
]
)
1
~ ]
I
I
I
J
~ j
U
, Il.
Puzinauskas (26) and gives percent weight loss in the thin film oven test (TFOT). The
average percent weight loss for all grades of asphalt cement is (0.03 - 0.29%) and the
average for only those samples losing weight is (0.21 - 0.37%).
If the average for only those AC-20 samples losing weight is used, 0.31 %, a
typical example will illustrate the relative influence of weight loss in the asphalt cement.
For example, assume the moisture content for a 500 gm sample of mix with 6% asphalt
cement was measured in the microwave as 0.2%. The mass of asphalt in the sample
would be 0.06 x 500 gm =30 gms. The mass loss for the asphalt cement would then
be 30 x 0.0031 =0.093 gms. The total water and light end volatile loss in the moisture
sample would be 500 x 0.002 ~ 1 gm. If the light end volatile loss is subtracted from
the total loss, the true water loss would be 0.907 gms and the true water content would
be (0.907 + 500)100 = 0.18%. This constitutes a 10% difference.
The above calculation is intended only to illustrate the approximate difference
that could be caused by a loss of light end volatiles. Conditions in a TFOT sample and
a moisture content sample of asphalt-aggregate mix are quite different. The asphalt
film thickness and, thus, the exposed asphalt surface is much greater in the sample of
mix. However, the temperature and time in the moisture content test are less and
should somewhat counteract the effect of the larger exposed surface. In the TFOT the
sample is heated to 325°F for 5 hours while the moisture content tests were run at
235°F for about 2-1/2 hours. Two samples each of an AC-10, AC-20 and AC-30 from
the same source were heated at 235°F for 2-1/2 hours to see if weight losses
comparable to TFOT los~es would be achieved. The average percent weight losses
were 0.05%, 0.13% and 0.05% for the AC-1 0, AC-20 and AC-30, respectively.
40
r. I
11
lI[ Il
I
I
j
~ I
I
i jI,
'IL
I
I
1
t1
After examining and analyzing the moisture content data, the microwave method
was selected for use in the study. Moisture contents reported for the remainder of the
report will be measured with the microwave.
Field Moisture Contents
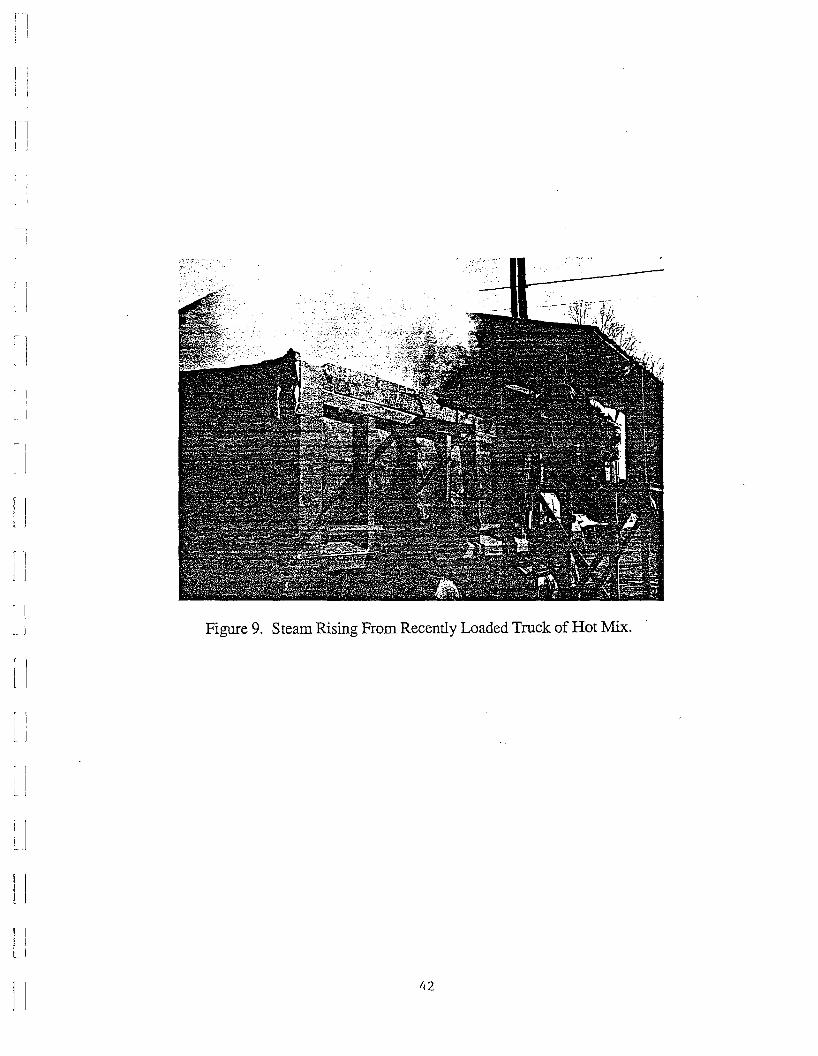
Residual moisture in hot mix asphalt concrete is a reality. Figure 9 shows the not
uncommon phenomenon of steam rising from a recently loaded truck of mix.
Conditions for and the consequences of residual moisture were discussed earlier.
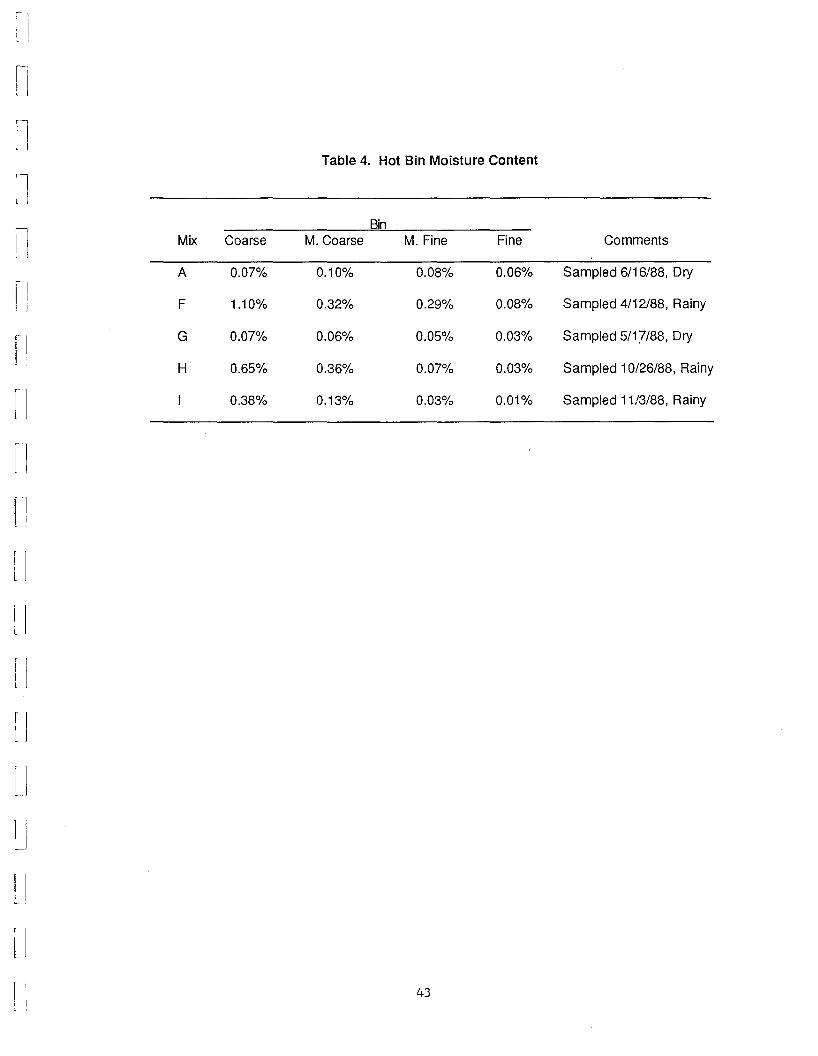
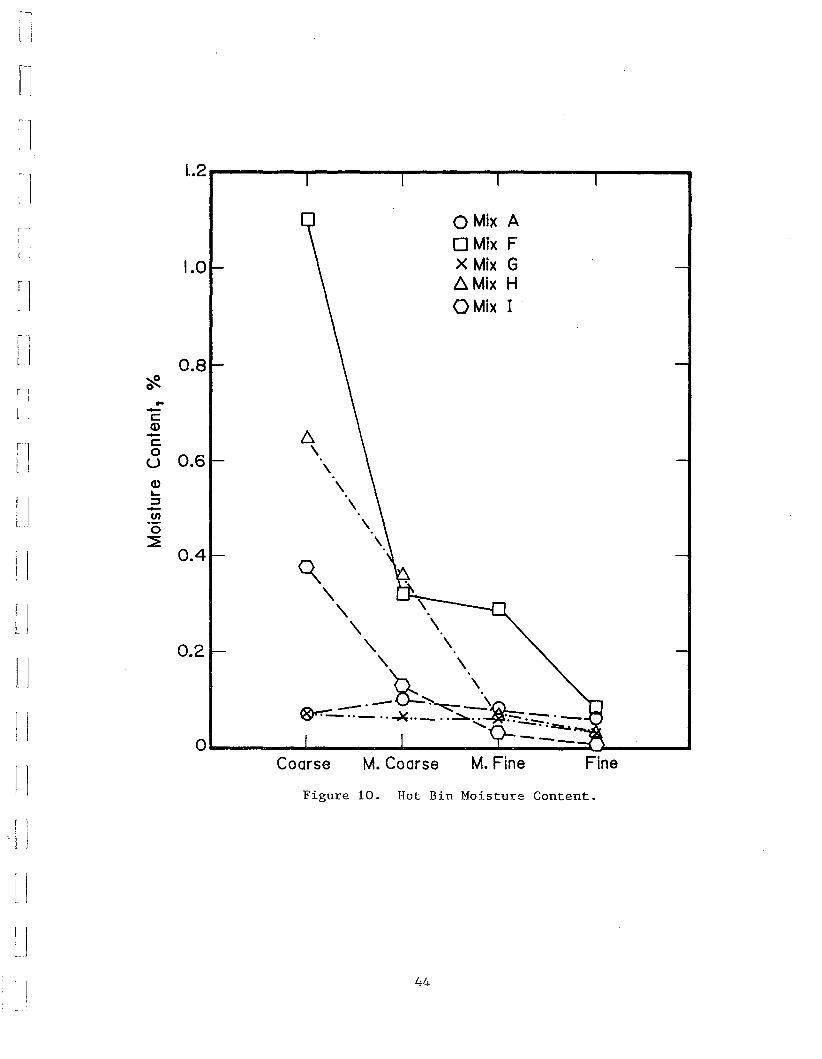
Hot bin and mix moisture contents were measured for the five mixes sampled in
the i~ield. Hot bin moisture contents are listed in Table 4 along with comments. It can
be noted that there is a direct correlation between the amount of residual moisture in
the aggregate and the weather conditions, hot and dry or cool and rainy.
The moisture contents are plotted in Figure 10 to illustrate the influence of particle
size. The data confirms the strong influence of particle size and provides justification
for the laboratory process used to prepare "wet" mixes.
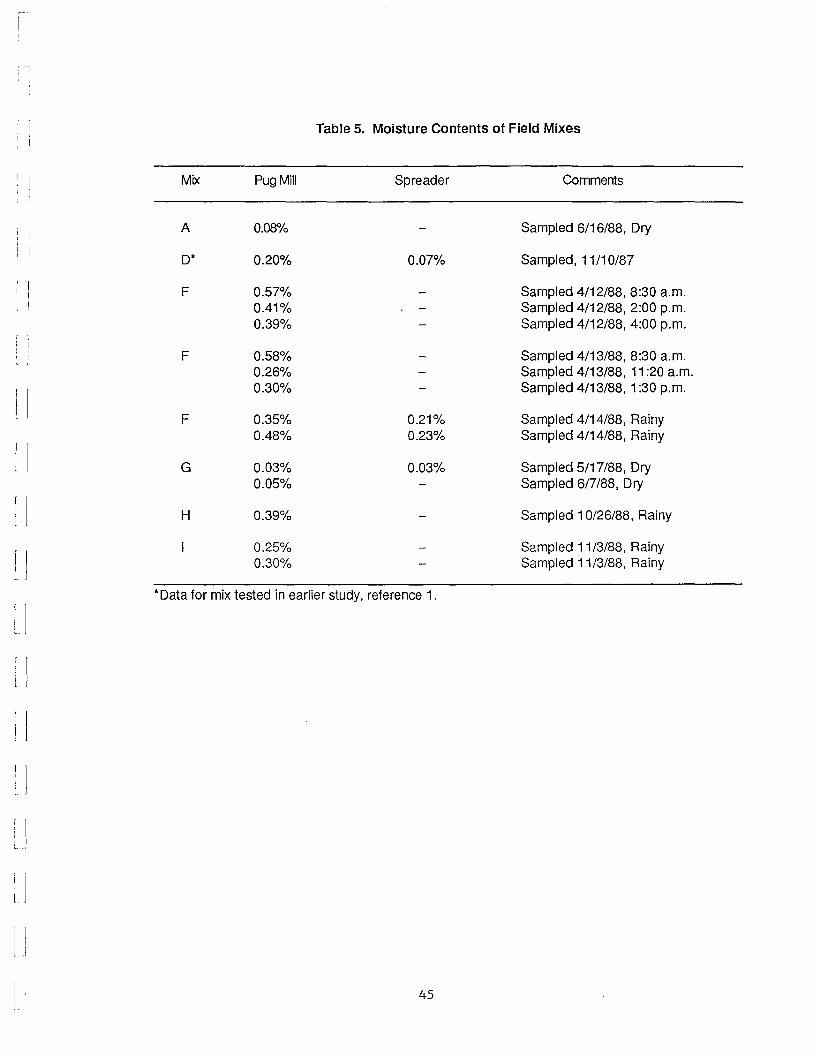
Moisture contents for field mixes are listed in Table 5. Again there is a positive
correlation between weather conditions and moisture content. For mix F there is also
evidence that plant startup may lead to higher moisture content in the mix, but as plant
conditions stabilize the moisture content decreases and stabilizes. For mixes D and F
there are indications that moisture is lost during hauling and spreading.
To summarize, field moisture measurements confirm the presense of moisture,
the concentration in coarse particles and the dependence on weather and plant
operating conditions. Construction variability may provide an explanation for the
observed inconsistencies in stripping occurance between and within projects which
41
f I
II
1
[ I
']
, j
[ )
~I
l j
1.1..1:1
L
I III
!
Figure 9. Steam Rising From Recently Loaded Truck of Hot Mix.
42
r,
. I
l]
1nn·
!.l
flI
11
IIII[ I
lI[ j
l]
Table 4. Hot Bin Moisture Content
BinMix Coarse M. Coarse M. Fine Fine Comments
A 0.07% 0.10% 0.08% 0.06% Sampled 6/16/88, Dry
F 1.10% 0.32% 0.29% 0.08% Sampled 4/12/88, Rainy
G 0.07% 0.06% 0.05% 0.03% Sampled 5/17/88, Dry
H 0.65% 0.36% 0.07% 0.03% Sampled 10/26/88, Rainy
0.38% 0.13% 0.03% 0.01% Sampled 11/3/88, Rainy
43
nn
FineM. Fine
o Mix ADMix FX Mix G6- Mix HOMix I
M. Coarse
Figure 10. Hot Bin Moisture Content.
6\
\\
\\
\
Coarse0----......----------...----"-"'---....
1.•2 ....----r----..,....---.....,...---.....,.---~
1.0
0.2
0.8
*'...-c:Q)-c:0
0.6uQ)~
:::J-(I)0~
0.4
n11
~l
j
I
I
[ 1
l j
II
lJII
c ~ j
l 1
44
[1
r \
[I
[ ]
[ j
u)
l)l)lJ! I[I
IL.
Table 5. Moisture Contents of Field Mixes
Mix Pug Mill Spreader Comments
A 0.08% Sampled 6/16/88, Dry
D* 0.20% 0.07% Sampled, 11/10/87
F 0.57% Sampled 4/12/88, 8:30 a.m.0.41% Sampled 4/12/88, 2:00 p.m.0.39% Sampled 4/12/88, 4:00 p.m.
F ·0.58% Sampled 4/13/88,8:30 a.m.0.26% Sampled 4/13/88, 11 :20 a.m.0.30% Sampled 4/13/88,1 :30 p.m.
F 0.35% 0.21% Sampled 4/14/88, Rainy0.48% 0.23% Sampled 4/14/88, Rainy
G 0.03% 0.03% Sampled 5/17/88, Dry0.05% Sampled 6/7/88, Dry
H 0.39% Sampled 10/26/88, Rainy
0.25% Sampled 11/3/88, Rainy0.30% Sampled 11/3/88, Rainy
*Data for mix tested in earlier study, reference 1.
45
: 1I I
II
[ I
i1
11
IIr I!
]
[ I
,fj1
I
r Il J
U
·1 )t
I.JL
~. j.1
L
have basically the same mix.
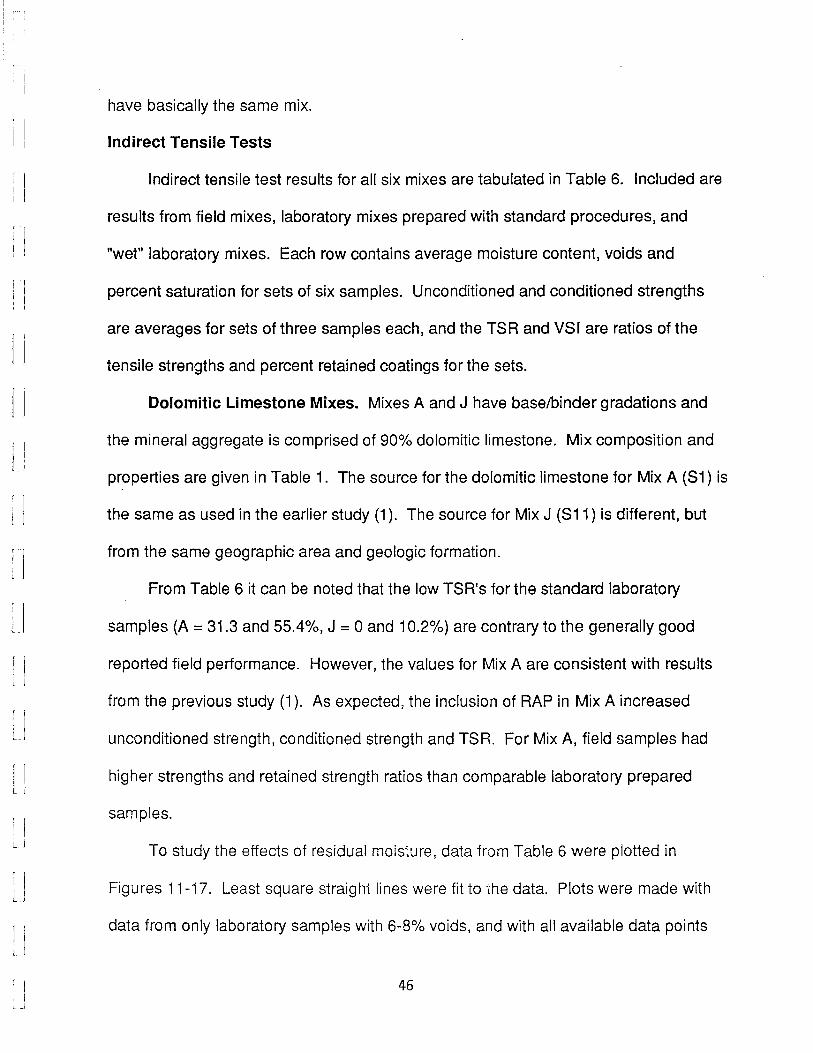
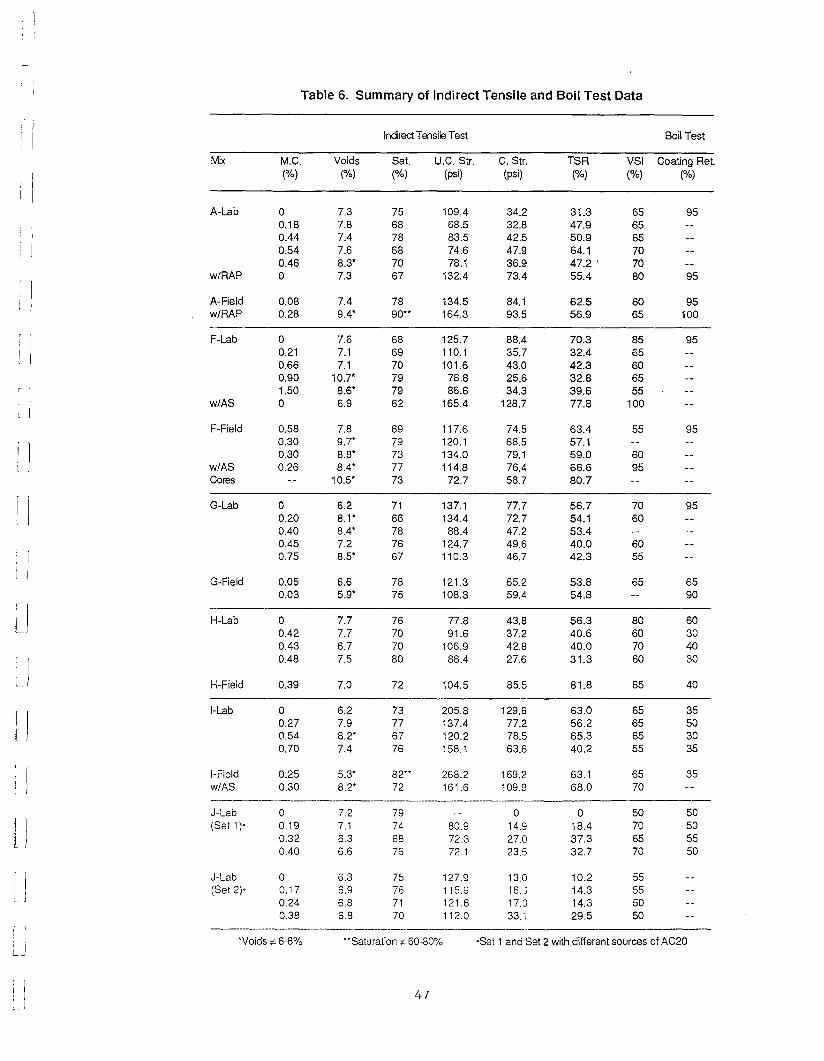
Indirect Tensile Tests
Indirect tensile test results for all six mixes are tabulated in Table 6. Included are
results from field mixes, laboratory mixes prepared with standard procedures, and
"wet" laboratory mixes. Each row contains average moisture content, voids and
percent saturation for sets of six samples. Unconditioned and conditioned strengths
are averages for sets of three samples each, and the T8R and V81 are ratios of the
tensile strengths and percent retained coatings for the sets.
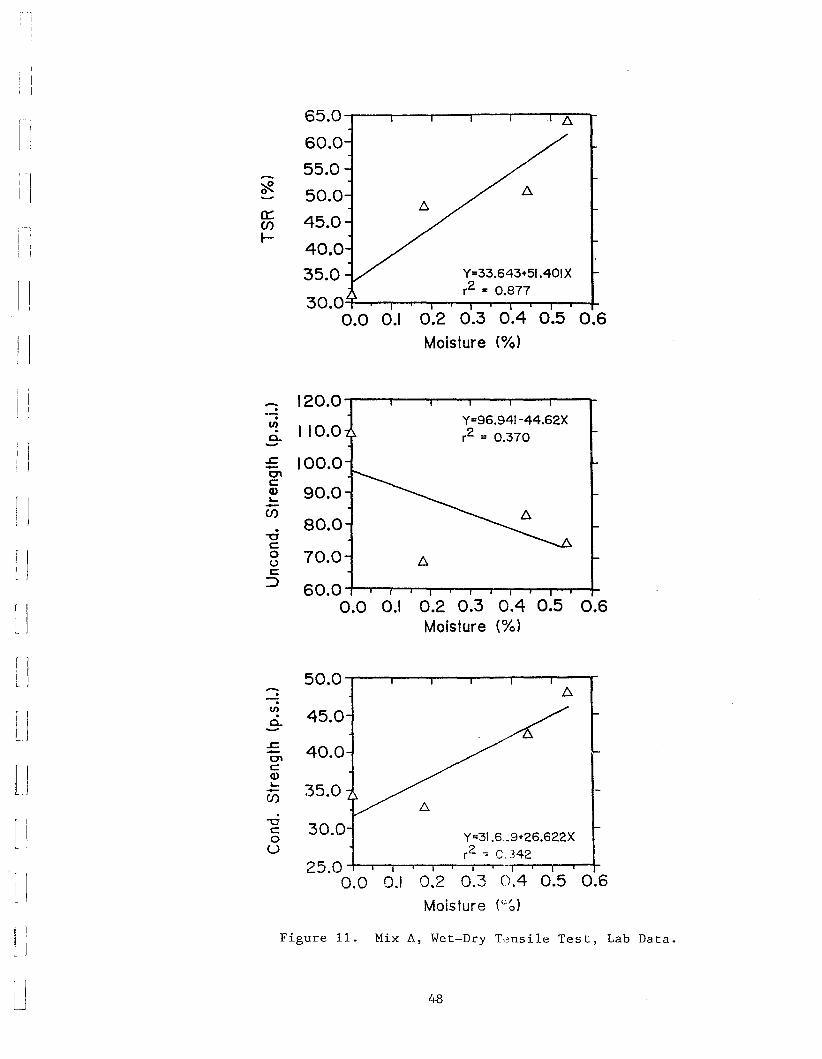
Dolomitic Limestone Mixes. Mixes A and J have baselbinder gradations and
the mineral aggregate is comprised of 90% dolomitic limestone. Mix composition and
properties are given in Table 1. The source for the dolomitic limestone for Mix A (81) is
the same as used in the earlier study (1). The source for Mix J (811) is different, but
from the same geographic area and geologic formation.
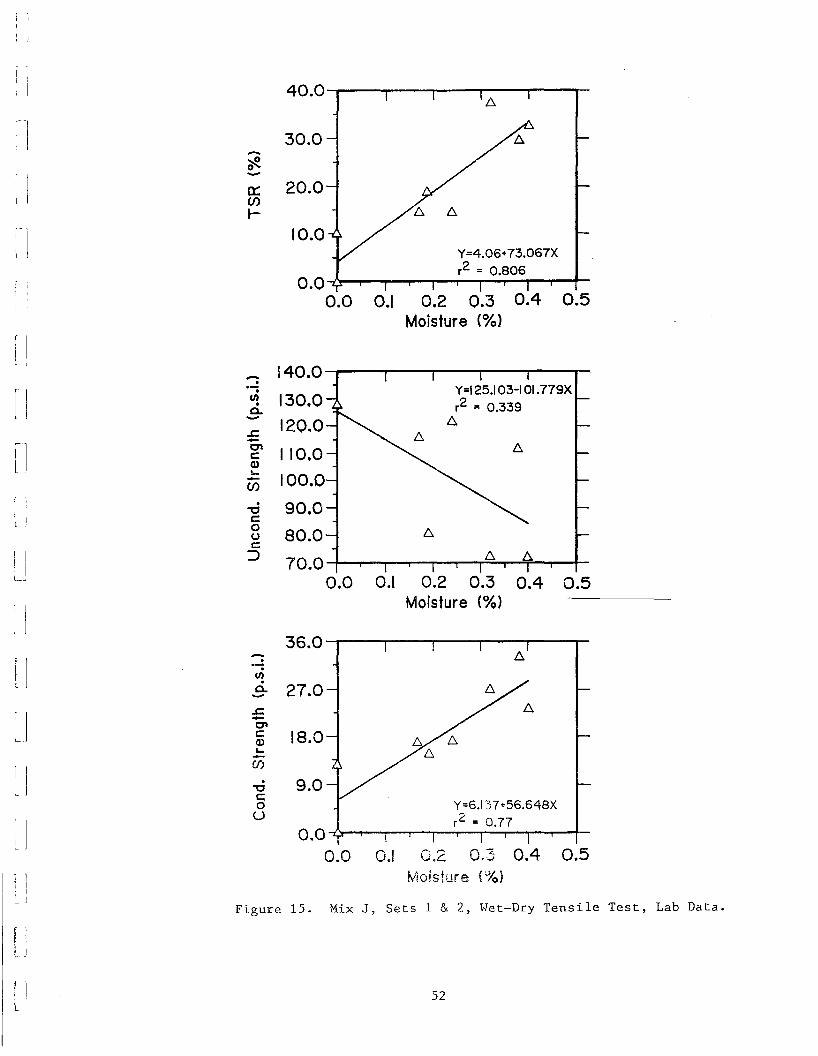
From Table 6 it can be noted that the low T8R's for the standard laboratory
samples (A =31.3 and 55.4%, J =0 and 10.2%) are contrary to the generally good
reported field performance. However, the values for Mix A are consistent with results
from the previous study (1). As expected, the inclusion of RAP in Mix A increased
unconditioned strength, conditioned strength and T8R. For Mix A, field samples had
higher strengths and retained strength ratios than comparable laboratory prepared
samples.
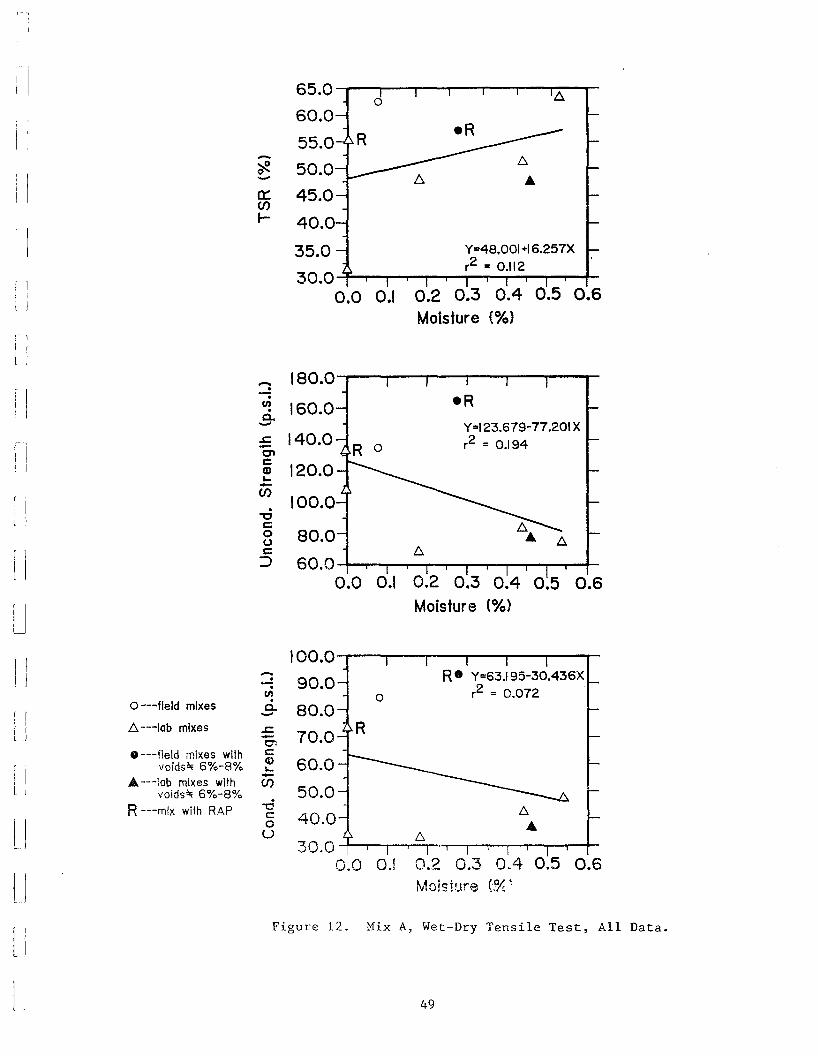
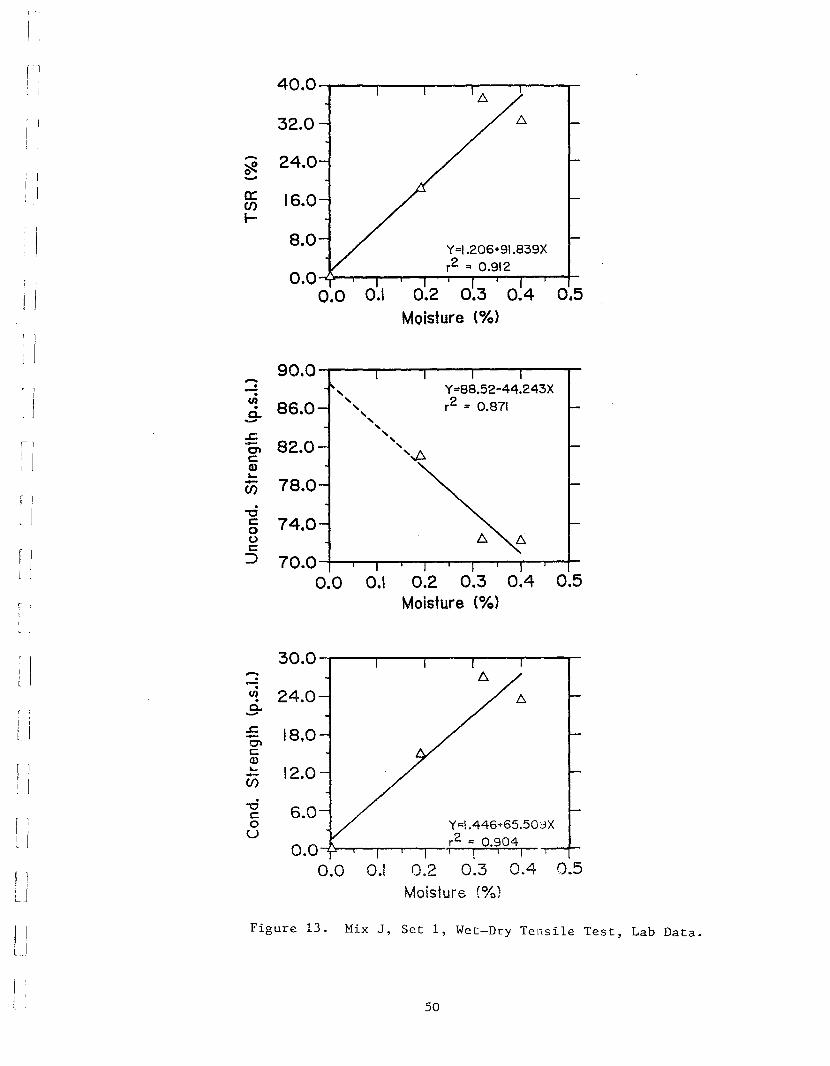
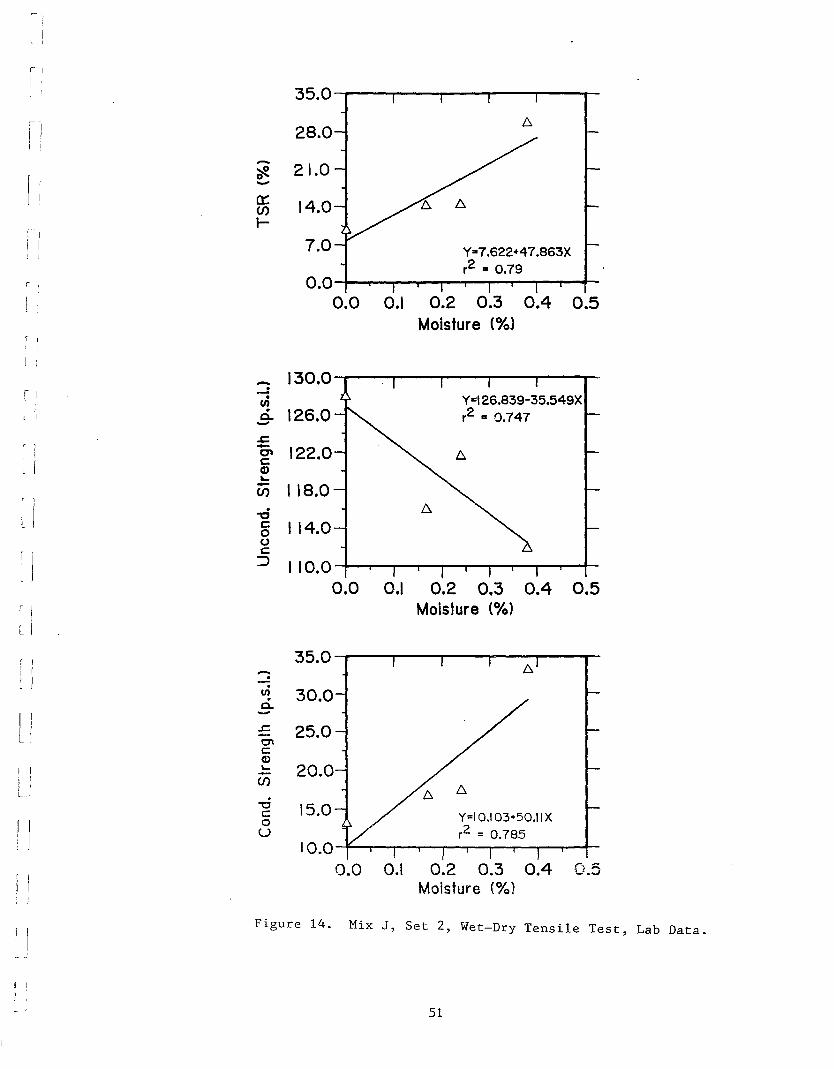
To study the effects of residual moisture, data from Table 6 were plotted in
Figures 11-17. Least square straight lines were fit to 'the data. Plots were made with
data from only laboratory samples with 6-8% voids, and with all available data points
46
, I
I
65.0
Il 60.0
[] - 55.0~ 50.00:: 45.0
jenI-
40.0
r I35.0
30.00.0 0.1 0.2 0.3 0.4 0.5 0.6
II Moisture (%)
120.0-·· Y=96.941-44.62X(I)
110.0c.. r2 = 0.370
II --'= 100.0-0\c:Q) 90.0
I~-en· 80.0
"'0'c:
j0 70.0uc:
:::> 60.0
1
0.0 0.1 0.2 0.3 0.4 0.5 0.6Moisture (%)
I 50.0-··]
(I)
45.0·c..--'= 40.0-O'l
i ] cQ)~
35.0-U)
II "0-30.0c
Y=31.6_9+26.622X0l J U r2 = C.:342
, I25.0
0.0 0.1 0.2 0.3 0.4 0.5 0.6
Moisture (<;6)
J Figure 11. Mix A, Wet-Dry Tensile Test, Lab Data.
48
Y=48.001 +16.257Xr2 = 0.112
oR
0.2 0.3 0.4 0.5 0.6Moisture (%)
65.0 _-...,.....-~--r---r-~--r--r-
60.0
55.0
50.0
45.0
40.0
35.030.0 ~-,....--r---,---,---.---..,.--r--r---.,---.,~r--f-
0.0 0.1
-~-a::en....
I
I I
i 1
[1
II
I]oR
Y=123.679-77.201 Xr2 .. 0.194
0.2 0.3 0.4 0.5 0.6Moisture (%)
80.0
60.0 -f--r--..,..--r----r---T--'T'---,---r-"""'T"""-'-""'-+-
0.0
120.0
100.0-dc:o()c
::::)
_ 180.0__-..,..----,----,--...,--.,..-----.r--
--:U! 160.00..-
.J:: 140.0-C'lCQ)~-(j)
f ).l
!.JIl
R. Y=63.195-30.436Xr2 = 0.072
I ' I "". I • ~0.2 0.3 0.4 0.5 0.6Moisture {~~
o
I00.0-r---r-----r----,--...,--.,..-----,r--
90.0
80.0
70.0
60.0
50.0
40.0
30.00.0 O.l
·"0c::o
U
.J::-O'lc/U~-en
·.-·en·0..-• ---field mixes with
voidsll;; 6%-8%A ---lob mixes with
voids~ 6%-8%R ---mix with RAP
o ---field mixes
6. ---lab mixeslJ
f. jl
l)
'.!. Il
Figure 12. Mix A, Wet-Dry Tensile Test, All Data.
49
40.0
r -I32.0
- 24.0~
I -a:: 16.0(/)
l-
i I 8.0
j0.0
0.0 0.\ 0.2 0.3 0.4 0.5Moisture (%)
i90.0- Y=88.52-44.243X
j...: ,ui 86.0
,r2 = 0.871,
0.. ,- ,,~
,"
]- 82.0 ,at '...Ac:G)'"-- 78.0(/)
) -0c: 74.000c:
j :::> 70.00.0 0.\ 0.2 0.3 0.4 0.5
l )
Moisture (%)
30.0J -..-.
"! 24.00-
J
-..s::: 18.0-Olc:CD
J
.... 12.0-(/)-d 6.0c:
Y=I.446+65.50::lX11 )
0II U
r2 = 0.904l 0.0 i I i I0.0 0.1 0.2 0.3 0.4 0.5
Moisture: (%)
Figure 13. Mix J, Set 1, Wet-Dry Tensile Test, Lab Data.
50
']I
35.0
II 28.0
- 21.0~
[ I -0:: 14.0(J)
t-i- I 7.0 Y"'7.622+47.863Xi i
r2 '" 0.79
r '!
0.00.0 0.1 0.2 0.3 0.4 0.5. I
Moisture (%)
1)- 130.0· Y=126.839-35.549X·(/)
r2 .. 0.747ci.. 126.0-.t::
r j - 122.0 f::"C\cCD...- 118.0(J)
j -dc 114.00()c
j:::> 110.0
0.0 0.1 0.2 0.3 0.4 0.5
JMoisture (%)
35.0I
j -·~ 30.0·a.-U .J:: 25.0-0'\c:CD... 20.0-(f)·"'0 15.0c
:1 J
0u
~ 10.00.0 0.1 0.2 0.3 0.4 0.5
11Moisture (%)
Figure 14. Mix J, Set 2, Wet-Dry Tensile Test, Lab Data.
l!
51
40.0
II 30.0-~
i I-0::: 20.0U).- L:::,.
[I10.0
Y=4.06+73.067X
0.0r2 = 0.806
r I 0.0 0.1 0.2 0.3 0.4 0.5Moisture (%)
[l-: 140.0
[I.- Y=125.1 03-1 01.779X·en 130.0· r2 = 0.339c..- 120.0 L:::,..c.
rl -C\ 110.0 D-c:Q)"-- 100.0U)
[I · 90.0"0c:0
80.0uc:
U::J 70.0
0.0 0.1 0.2 0.3 0.4 0.5
IIMoisture (%)
36.0
lJ- L:::,.··en·c.. 27.0-.c.-C\c: 18.0Q)"--
l]!J)
· 9.0"0c:0 Y=6.137+56.648X
r Iu r2 = 0.77
0.00.0 0.1
to" ,..... 0-:1, 0.4 0.5V't~ c"-J
Moisture (%)
Figure 15. Mix J, Sets 1 & 2, Wet-Dry Tensile Test, Lab Data.
52
nI', J
:1 75.0
6-60.0
:1 -~ 45.0-
r-i0::CI) 30.0.-
~' 115.0
Y~II.24+75.50IX
0.0r2 ~ 0.534
0.0 0.1 0.2 0.3 0.4 0.5 0.6
Moisture (%)
1 140.0-:. Y=113.206-72.228X(/)
f).
124.0 r2 = 0.304Q. l::..--'= l::..- l::..0' 108.0c:
'I Q)...-CI) 92.0
[ j
-d l::..c: 76.00 6- l::..0 l::..c:::> 60.0
] 0.0 0.1 0.2 0.3 0.4 0.5 0.6Moisture (%)
) ]
50.0-·I j ·(/)
40.0L ci..-..c- 30.00'c:Q)...
20.0-CI)
·'"010.0.c:
0 Y=13.018+51.251 XU
r2 = 0.468
1I 0.00.0 0.1 0.2 0.3 0.4 0.5 0.6
LJMoisture (%1
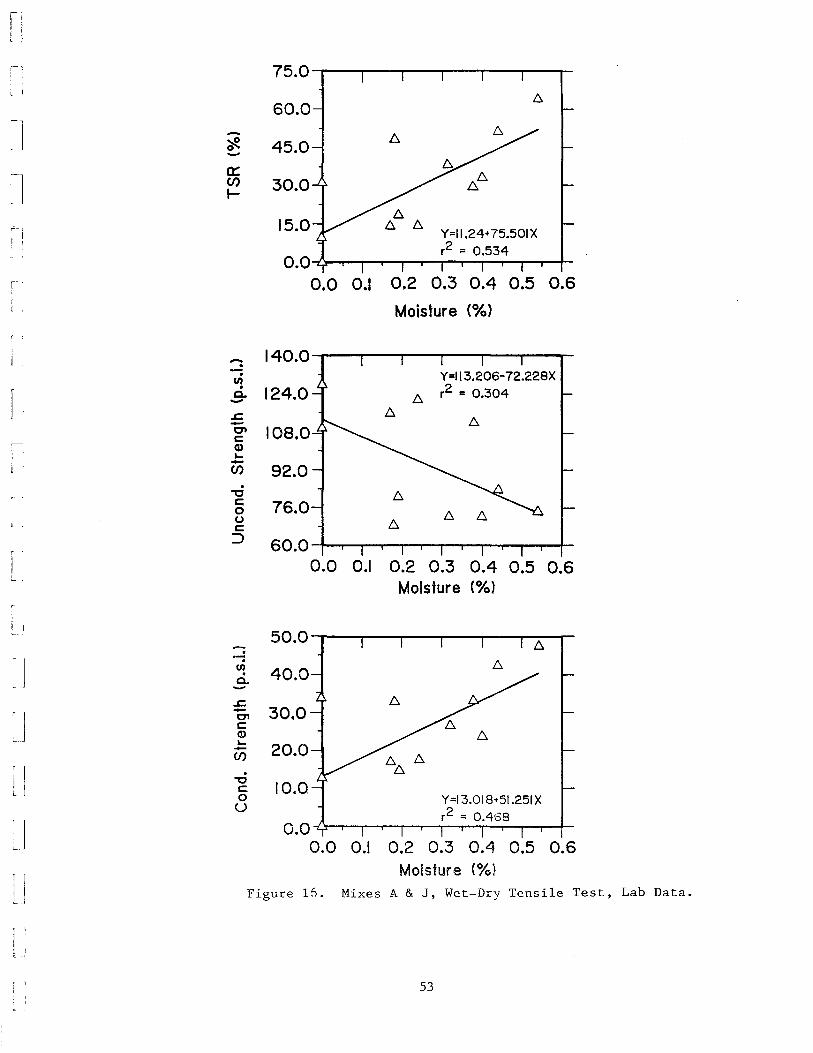
Figure 15. Mixes A & J, Wet-Dry Tensile Test, Lab Data.
J
53
80.0
64.0 0
'I -~ 48.0-0:::
32.0(f) t::.t::.....16.0 t::.
t::. t::. Y=18.487+59.344X
~I 0.0r2 = 0.301
0.0 0.1 0.2 0.3 0.4 0.5 0.6
]
Moisture (%)
140.0
I- 0··tn 120.0·0-
r] .c1 - 100.01 0'l c
Q)"- 80.0-
I I(f)
il · t::.L "'C
C 60.00 Y=118.824-86.3X
I()
r2 = 0.397c::J 40.0
0.0 0.1 0.2 0.3 0.4 0.5 0.6
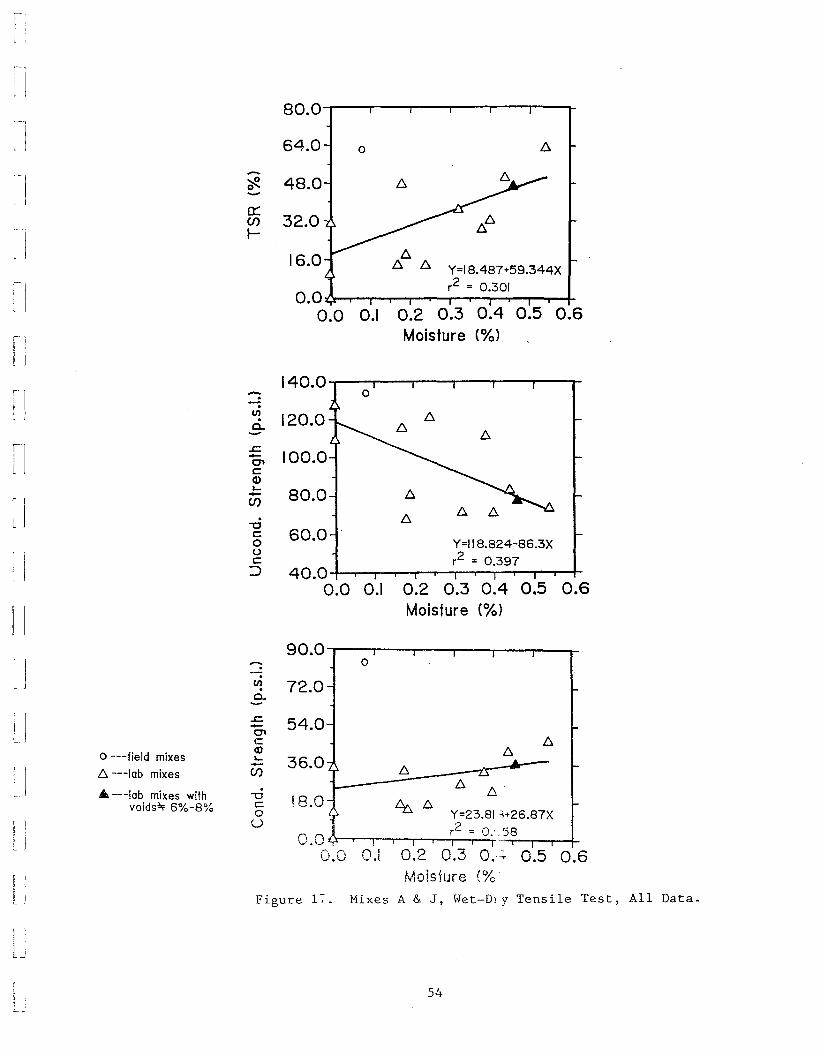
U Moisture (%)
90.0 I I I
j - 0
·tn 72.0-·0--]
.c 54.0--0'C t::.
o ---field mixesQ) 6..... 36.0- .. -
I- t::. '-t::. ---lab mixes (f) ""LS"
• ---lab mixes with - t::. /::; ."'C 18.0voids~ 6%-8% c ~ 6. ~
0 Y=23.81'1+26.87X
J
ur2 = 0 .. 580.0 I I I I I
0.0 0.1 0.2 0.3 o~ 0.5 0.6
jMoisture (%
Figure 1-:-. Mixes A & J, lolet-Dl y Tensile Test, All Data.
J
54
:1I i
r )
rI 1
I I
!I~ I
I
~1
: I
I
~ I
.
[.1••. jI
l j
III.. j.1
I
lI
which included field samples as well as samples that did not have the specified 6-8%
voids.
Equations for both mixes and all data sets, unexpectedly, show that TSR
increases as moisture content increases. For only laboratory data (Figures 11, 13, 14,
15 and 16), the coefficients of determination (r2) indicate good correlations, with values
ranging from 0.912 for Mix J, set 1 to 0.534 for Mixes A and J combined. When field
samples and samples with voids "# 6-8% are included (Figures 12 and 17), r2 values
are lower but the trend remains the same. However, the poorer correlations are
probably due, in part, to variability in mix type, sample preparation and test conditions.
In all cases, except for Mix A with all data included (Figure 12), the increase in
TSR as moisture content increases is the result of decreasing unconditioned strength
and increasing conditioned strength. The r2 = 0.072 for the exception suggests that
there is no relationship between conditioned strength and moisture content. However,
examination of the data points in Figure 12 reveals that the field mixes and mixes with
RAP are quite different from the laboratory mixes and are responsible for the poor
correlations and the negative slope of the line for conditioned strength.
TIW causes or reasons why residual aggregate moisture in the dolomitic
limestones produces asphalt-aggregate bonds that are more resistant to the
detrimental effects of water is not known. However, the evidence, increasing TSR and
conditioned strength for two aggregate and three asphalt cement sources, strongly
suggests that the observed trends are real. The explanation is likely a surface
chemistry phenomenon resulting from unusual chemical composition and/or crystal
structure.
55
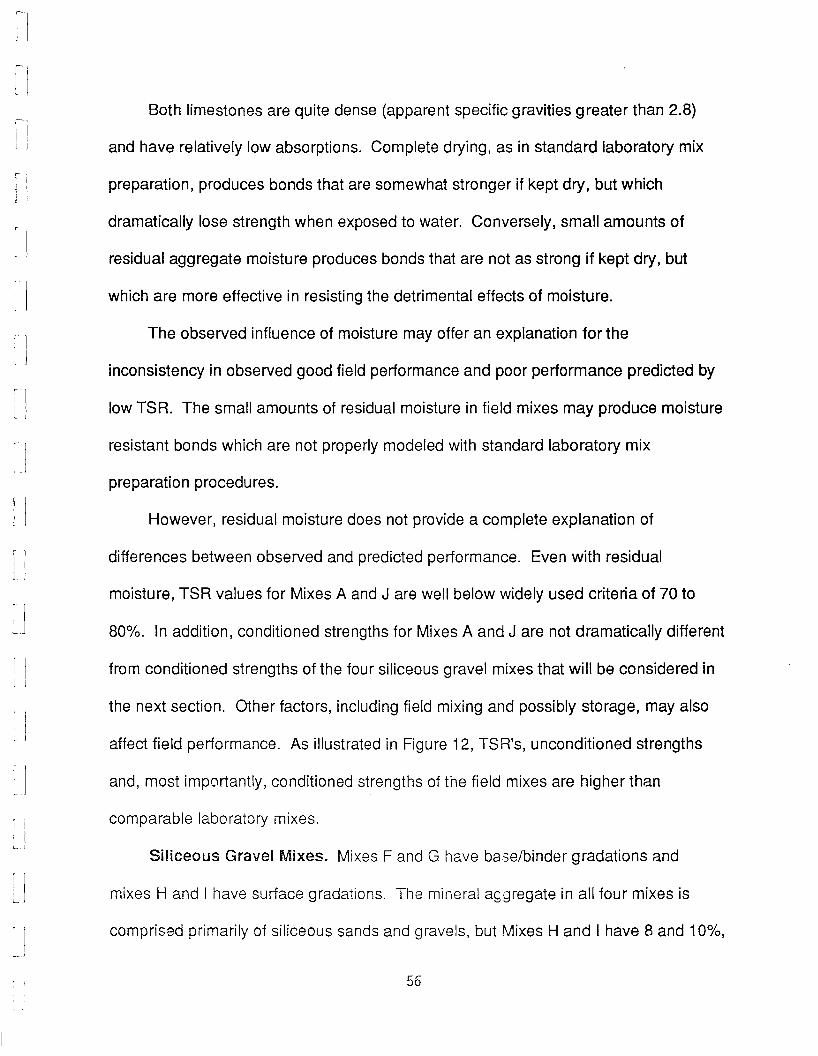
IIrl" I
I
'I
Both limestones are quite dense (apparent specific gravities greater than 2.8)
and have relatively low absorptions. Complete drying, as in standard laboratory mix
preparation, produces bonds that are somewhat stronger if kept dry, but which
dramatically lose strength when exposed to water. Conversely, small amounts of
residual aggregate moisture produces bonds that are not as strong if kept dry, but
which are more effective in resisting the detrimental effects of moisture.
The observed influence of moisture may offer an explanation for the
inconsistency in observed good field performance and poor performance predicted by
low TSR. The small amounts of residual moisture in field mixes may produce moisture
resistant bonds which are not properly modeled with standard laboratory mix
preparation procedures.
However, residual moisture does not provide a complete explanation of
differences between observed and predicted performance. Even with residual
moisture, TSR values for Mixes A and J are well below widely used criteria of 70 to
80%. In addition, conditioned strengths for Mixes A and J are not dramatically different
from conditioned strengths of the four siliceous gravel mixes that will be considered in
the next section. Other factors, including field mixing and possibly storage, may also
affect field performance. As illustrated in Figure 12, TSR's, unconditioned strengths
and, most importantly, conditioned strengths of the field mixes are higher than
comparable laboratory mixes.
Siliceous Gravel Mixes. Mixes F and G have base/binder gradations and
mixes H and I have surface gradations. The mineral aggregate in all four mixes is
comprised primarily of siliceous sands and gravels, but Mixes H and I have 8 and 10%,
56
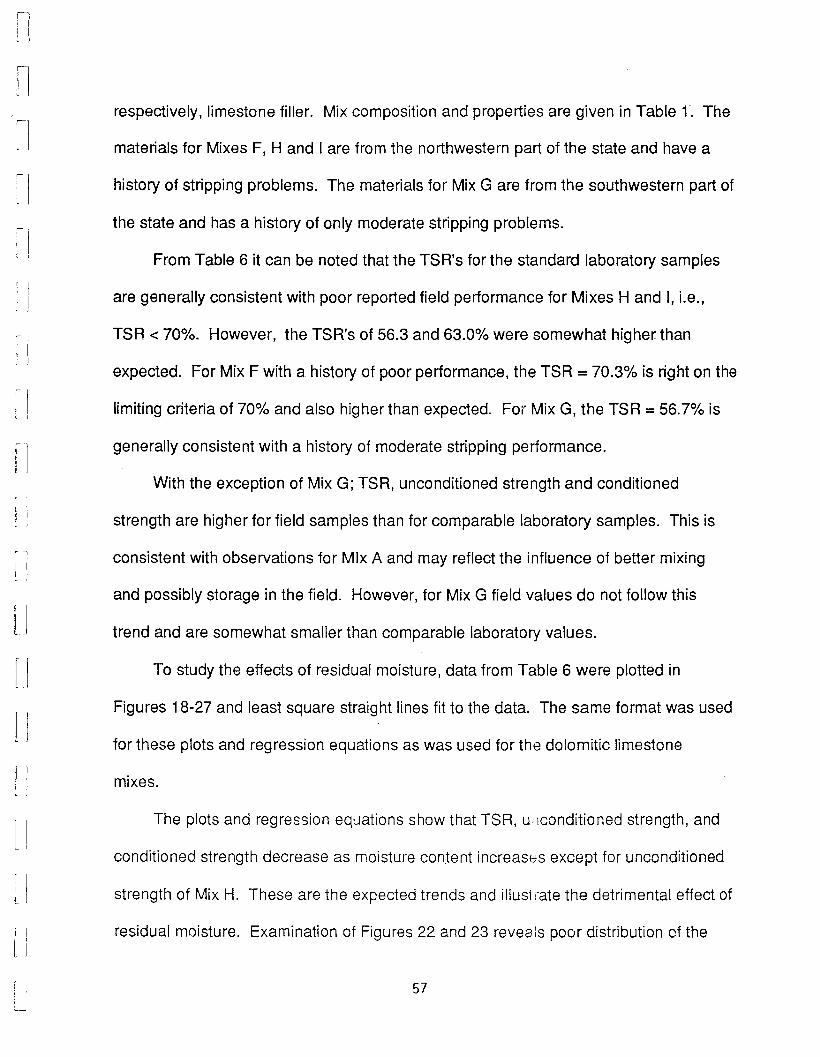
'1jl
~)
II~I
j
I
I
1)
!IIIl
i II
I I
I IL J
respectively, limestone filler. Mix composition and properties are given in Table r. The
materials for Mixes F, H and I are from the northwestern part of the state and have a
history of stripping problems. The materials for Mix G are from the southwestern part of
the state and has a history of only moderate stripping problems.
From Table 6 it can be noted that the TSR's for the standard laboratory samples
are generally consistent with poor reported field performance for Mixes H and I, i.e.,
TSR < 70%. However, the TSR's of 56.3 and 63.0% were somewhat higher than
expected. For Mix F with a history of poor performance, the TSR = 70.3% is right on the
limiting criteria of 70% and also higher than expected. For Mix G, the TSR = 56.7% is
generally consistent with a history of moderate stripping performance.
With the exception of Mix G; TSR, unconditioned strength and conditioned
strength are higher for field samples than for comparable laboratory samples. This is
consistent with observations for Mix A and may reflect the influence of better mixing
and possibly storage in the field. However, for Mix G field values do not follow this
trend and are somewhat smaller than comparable laboratory values.
To study the effects of residual moisture, data from Table 6 were plotted in
Figures 18-27 and least square straight lines fit to the data. The same format was used
for these plots and regression equations as was used for the dolomitic limestone
mixes.
The plots and regression equations show that TSR, U!lconditioned strength, and
conditioned strength decrease as moisture content increas8s except for unconditioned
strength of Mix H. These are the expected trends and illustrate the detrimental effect of
residual mQisture. Examination of Figures 22 and 23 reveals poor distribution of the
57
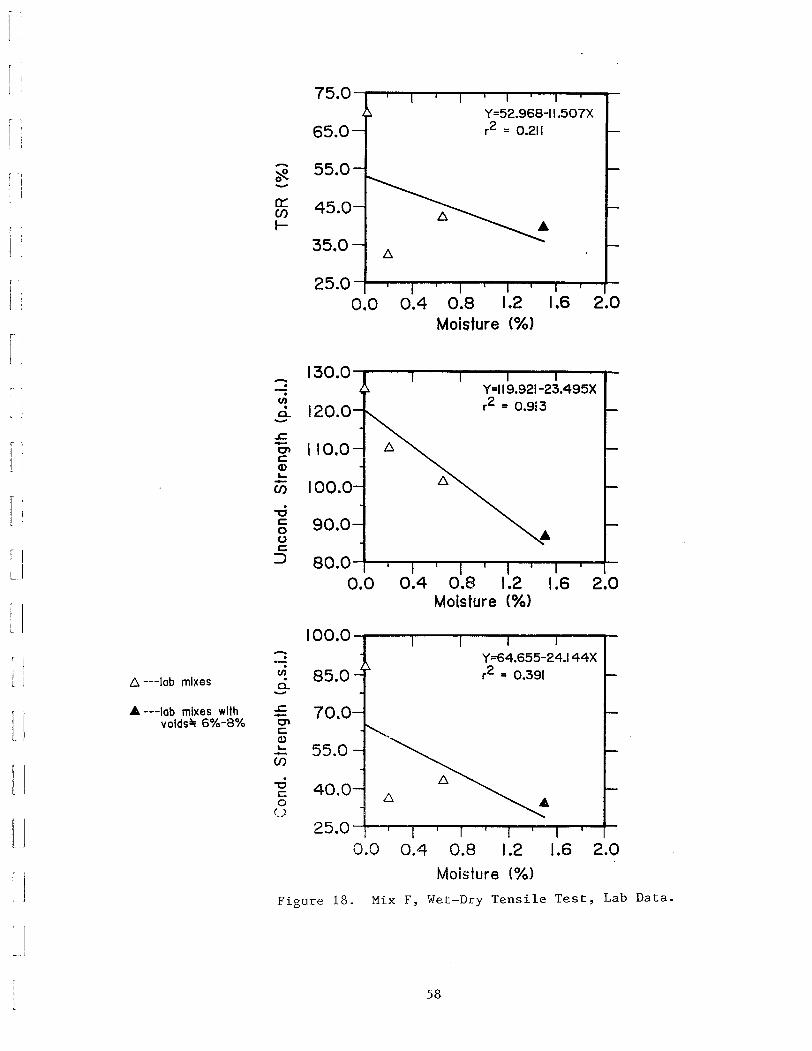
Y=119.921-23.495Xr2 = 0.9i3
Y=64.655-24.144Xr2 = 0.391
1.2 1.6 2.0Moisture (%)
0.4 0.8 1.2 1.6 2.0Moisture (%)
0.4 0.8 1.2 1.6 2.0Moisture (%)
Mix F, Wet-Dry Tensile Test, Lab Data.
25.0 -r-...,--,-~~-r-~~.....,... -4--
0.0
Figure 18.
75.0Y=52.968-11.507X
65.0 r2 = 0.211
- 55.0~-0:: 45.0(f).-
35.0D.
- 130.0··(J)· 120.0c..
J:::.- 110.001c:Q)...- 100.0(f)
·""Cc: 90.000c:
::) 80.00.0
100.0-··D. ---lob mixes
(J) 85.0·c..-A ---lob mixes with J:::. 70.0-volds~ 6%-8% 01
c:(1)... 55.0-(f)
·""C 40.0c:0u
25.00.0 0.4 0.8
~ 1
Ii
j
I
j
j
LJ
r II
r I
j j
1
r I
J~~ I
I I
[ I
58
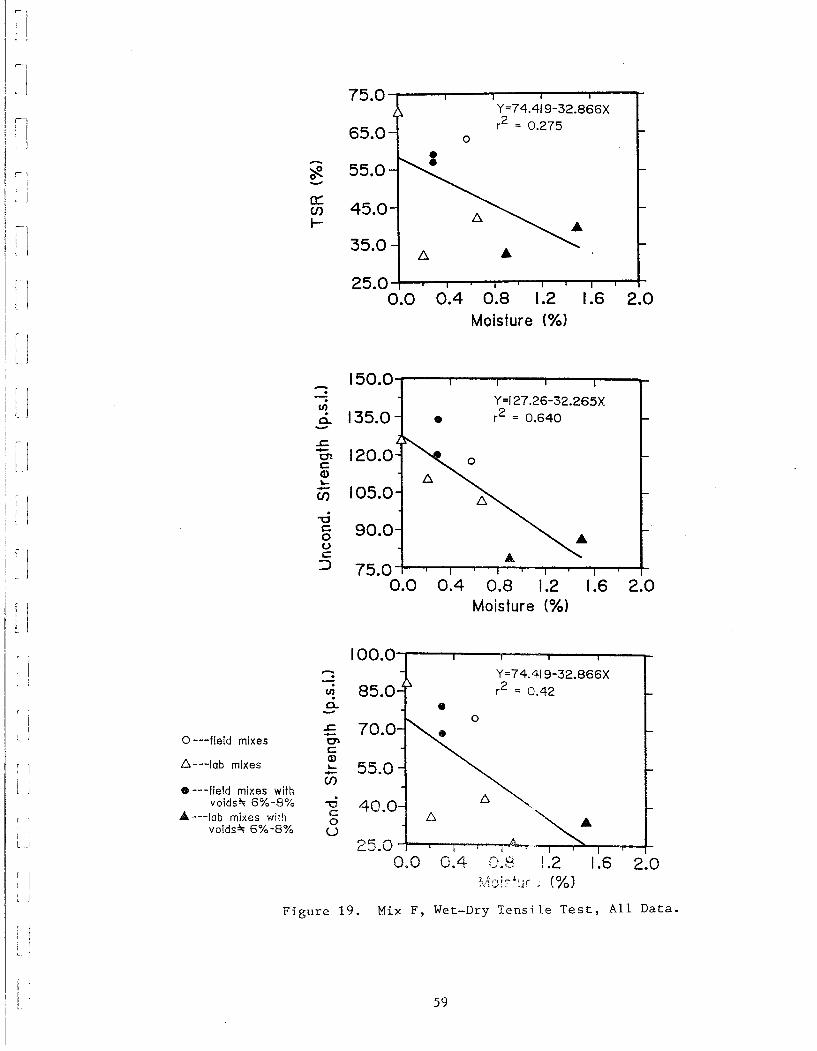
2.0
o
0.4
Y=74.419-32.866Xr2 = 0.42
•
59
- 150.0·· Y=/27.26-32.265X
U)· 135.0 r2 = 0.640c- •-.r:.- 120.0C'\c:Q)~- 105.0U)
-dc: 90.00uc:
::> 75.00.0 0.4 0.8 1.2 1.6 2.0
Moisture (%)
Figure 19. Mix F, Wet-Dry Tensile Test, All Data.
100.0-·· 85.0U)·c--.r:. 70.0-o ---field mixes C'\c:
!:::. ---lab mixesQ)
55.0~-U)• ---field mixes with
voids~ 6%-8%.
"'0 40.0At. ---lab mixes with c
0voids~ 6%-8% U
25.00.0
,r-"l
j I 75.0Y=74.419-32.866X
1 65.0 r2 c 0.275
" I 0
- 55.0"*-0::: 45.0U).....
35.0~ •
25.00.0 0.4 0.8 1.2 1.6 2.0
Moisture (%)
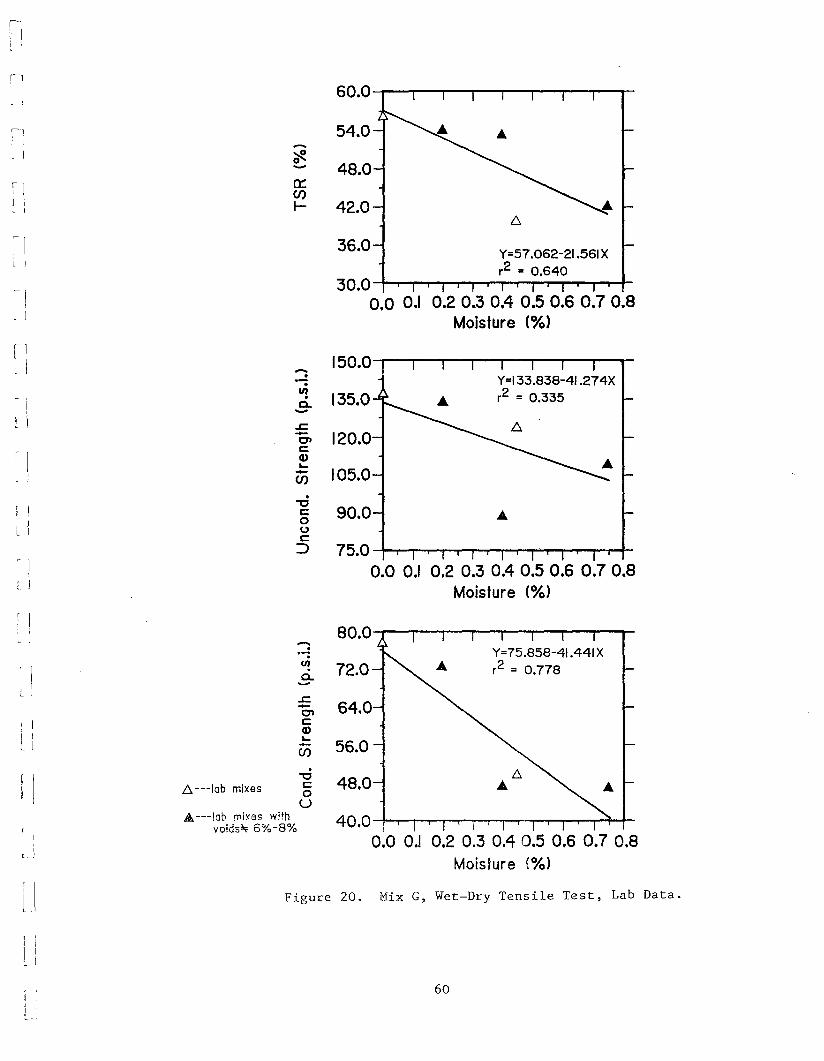
0::U)
I- 42.0
l: I -
~-54.0
48.0
75.0 -+-,--,-...,.....,r--r-...,.....,.--.--~~...-.-__.-J-
0.0 0.1 0.2 0.3 0.4 0.5 0.6 0.7 0.8Moisture (%)
III
L I
-:.-.II!0..-
..c-O'lc::Q)'-U)
-dc::o(.)c:::J
36.0
135.0
120.0
105.0
90.0
Y=57.062-21.561 Xr2 = 0.640
Y=133.838-41.274Xr2 = 0.335
."0c:: 48.0ou
Figure 20. Mix G, Wet-Dry Tensile Test, Lab Data.
r I'e I
! IiiiL ]
!. I,!L
l j
1
1
IL
-:.-.til
0..-..c:-O'lc::Q)'--U)
.6. ---lab mixes
.A ---lab mixes withvoids=< 6%-8%
80.0-r--.,..---.--....-....,..-------
72.0
64.0
56.0
40.0 -+-,..-,-...,..-r-r-..,.....-,--r-T'~...-r-~l-+-
0.0 0.1 0.2 0.3 0.4 0.5 0.6 0.7 0.8Moisture (%)
60
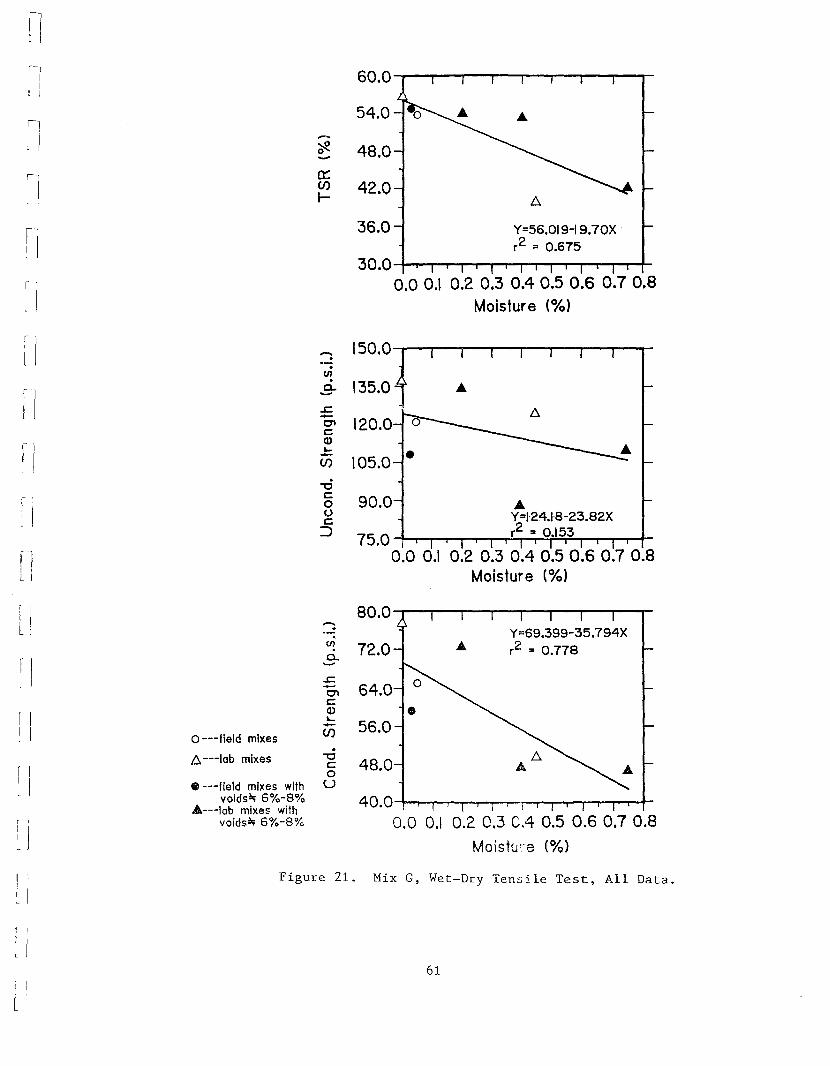
•
48.0
64.0
56.0
90.0
75.0 -lil-r-~..,.....,-.-..,...~-.-~::,:::..,........_....-I-0.0 0.1 0.2 0.3 0.4 0.5 0.6 0.7 0.8
Moisture (%)
40.0 -r-r--r....,.-r--l'"....,.-r-'I""....,.-'!"'""'T"--.-.,.....,-r----r--+_
0.0 0.\ 0.2 0.3 CA 0.5 0.6 0.1 0.8Moistu'"e (%)
~ 72.0
.""Cc:o
U
.s::-O'lc:Q)I.--en
30.0-+-r--r'~~~r--r'~r--r'__~.........f-
0.0 0.1 0.2 0.3 0.4 0.5 0.6 0.7 0.8Moisture (%)
.s::-~ 120.0Q)
J=en 105.0
:-J·en·.9- 135.0
·""Cc:ouc::
:::>
60.0
54.0
-~ 48.0-0::en 42.0l- t:,.
36.0 Y=56.019-19.70Xr2 ;: 0.675
Figure 21. Mix G, Wet-Dry Tensile Test, All Data.
o ---field mixes
t:,. ---lab mixes
• ---field mixes withvoids~ 6%-8%
A---Iab mixes withvoids~ 6%-8%
~I
~ j
j
IIlI
lJ
l J
j
'j
II
61
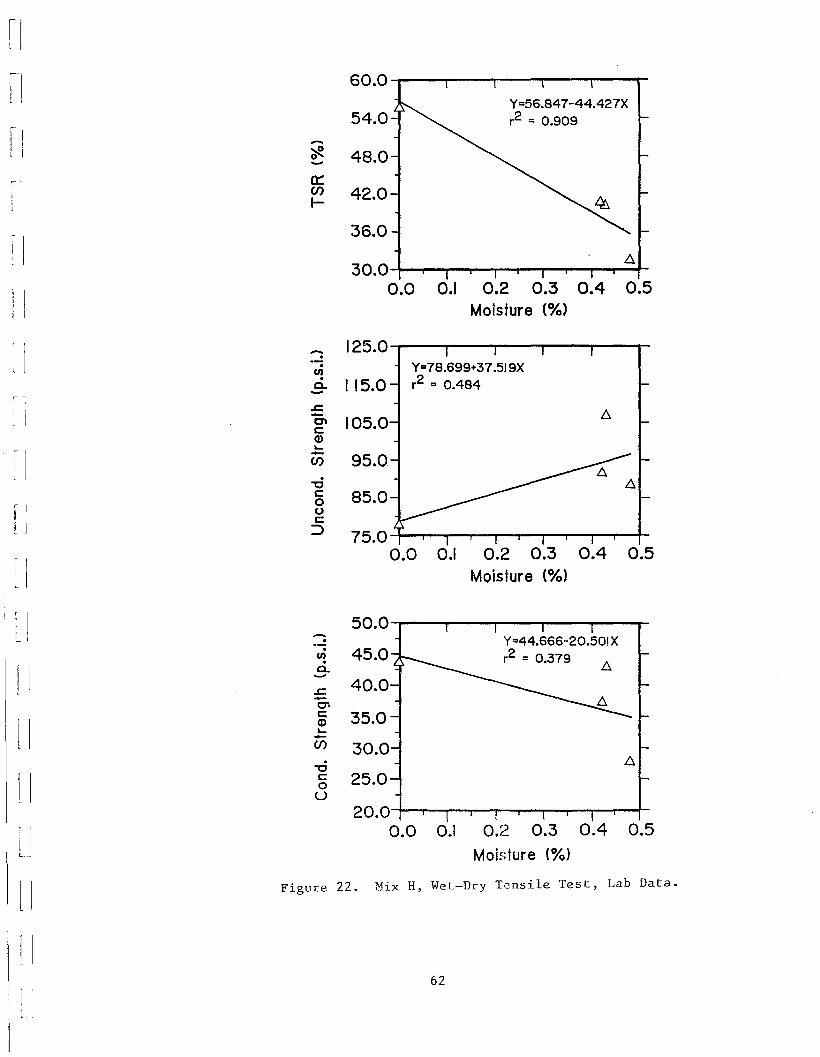
60.0.,.----,.----,-----r-----,...--t-
0.5
0.5
0.5
Y::;56.847-44.427Xr2 ::; 0.909
Y=44.666-20.501 Xr2 ::; 0.379
0.1 0.2 0.3 0.4Moisture (%)
0.1 0.2 0.3 0.4Moisture (%)
0.1 0.2 0.3 0.4Moisture (%)
Y::;78.699+37.519Xr2 ::; 0.484
A30.0 -+-....,....-r--,----r---r-~-..,..__,.--,.---f-
0.0
75.0 -+--,--...,..--,...--r---,.----r----r-~~~
0.0
85.0
40.0
35.0
30.0
25.0
20.0-t--,---,---r-....,....-,----,---,...---,----,---1-0.0
125.0-r---r---,----,-----,---
."'Cc:o
U
oJ:-0'c:Q)~-U)
50.0-r---r---r--..,..--...,-..---.en 45.0ci.-
54.0
~c:ooc:
::>
-~_ 48.00::~ 42.0
36.0
oJ:-g' 105.0Q)~-U) 95.0
-.enci. 115.0-
11
'."'" It
1
l I
~ II
i ]
]
LI
, IL
fl
nl,',-1j:
l
Figure 22. Mix H, Wet-Dry Tensile Test, Lab Data.
62
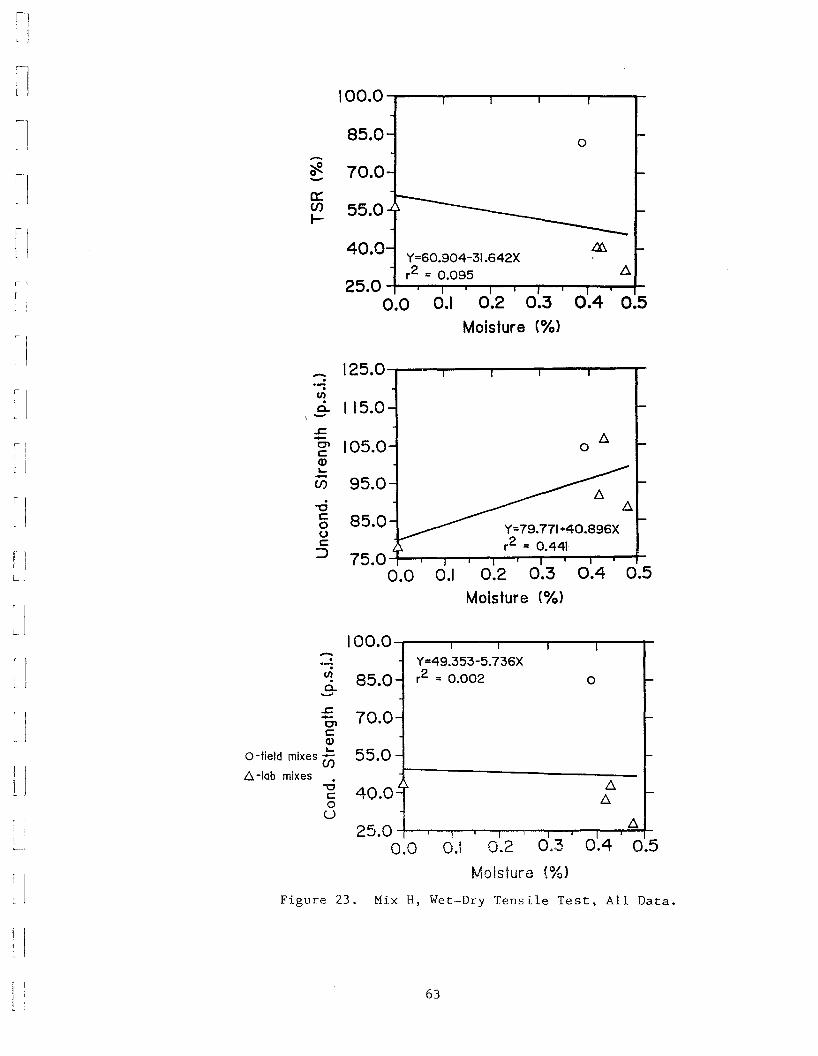
100.0 _r_--,.---,.--.......---r----,-
125.0_r_---,---,.---r----r---r
o
0.4 0.5
55.0
85.0
70.0
40.0 Y::60.904-31.642X
r2 :: 0.09525.0 -+-...,..--,--,-...,.....-r--r-~~--r--+-
0.0 0.1 0.2 0.3Moisture (%)
115.0
.-.
~-
·....lJ)·0.,-
[)
, 1
l 1o
0.1 0.2 0.3 0.4 0.5Moisture (%)
85.0
75.0 ~__._--.-.,.__..,.....__r_"""""T"........,r--.,.._-r-__t_'
0.0
·-0c:ooc:
::>
.c-~ 105.0Q)....(i) 95.0
ci.. 85.0-- o.. 100.0"---"""-I--r--,--"'--.--or-,--'
Y::49.353-5.736Xr2 :: 0.002
.r:.-0'1c:Q)
f' I ' ....0- Ie d mixes (i)6. -lab mixes
-0c:o
U
70.0-
55.0 -
40.0~
25.0 -t--r---r-r---r---;---,-or--r---r=A"'t-I I 0',3 0~4 50.0 o.! 0.2 O.
Moisture {%)
Figure 23. Mix H, Wet-Dry Tensile Test, All Data.
63
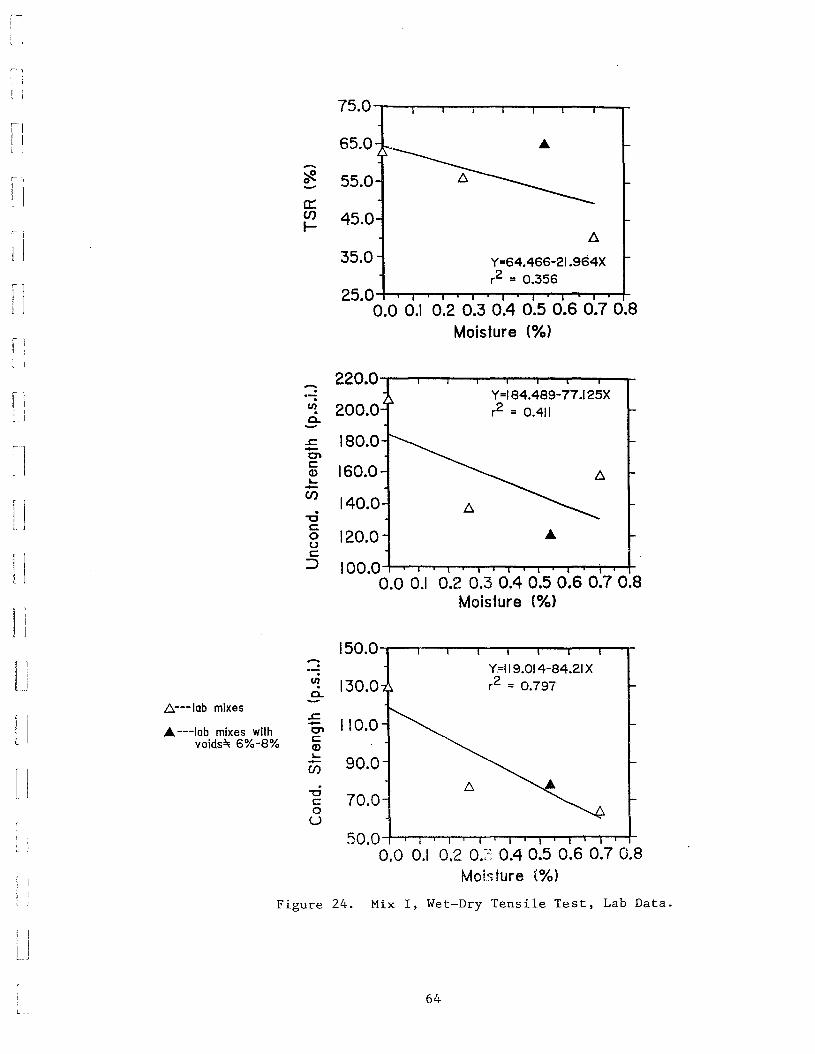
l, I
75.0 -,-----r--...---r----..-~....,....._-_
65.0
-~_ 55.0a::~ 45.0
35.0A
Y=64A66-21.964Xr2 = 0.356
25.0 -+--.~~-,......,.-,........-...---r....-,..-p....-.,....J...
0.0 0.1 0.2 0.3 0.4 0.5 0.6 0.7 0.8Moisture (%)
II~ .
fl
t j
1
]
- 220.0· Y=184A89-77.125X·U) 200.0 r2 = 00411·Q.-
..c:. 180.0-0\c:: 160.0Q)....-U)
140.0·"'CC.0 120.0uc:J 100.0
0.0 0.1 0.2 0.3 0.4 0.5 0.6 0.7 0.8Moisture (%)
50.0 -+-.....-r-,.......,--,,--,..--.-...--.r--.--.-.,.--,-....-..-~
0.0 0.1 0.2 O.:~ 0.4 0.5 0.6 0.7 0.8Moisture {%)
150.0-· Y=119.014-84.21 X·U) 130.0 r2 = 0.797Q.
A---Iab mixes..c:.
110.0-... ---lab mixes with 0\
voids~ 6%-8% c::Q)....
90.0-U)
"'C 70.0c:0U
IIi j
l j
Figure 24. Mix I, Wet-Dry Tensile Test, Lab Data.
64L_ ~
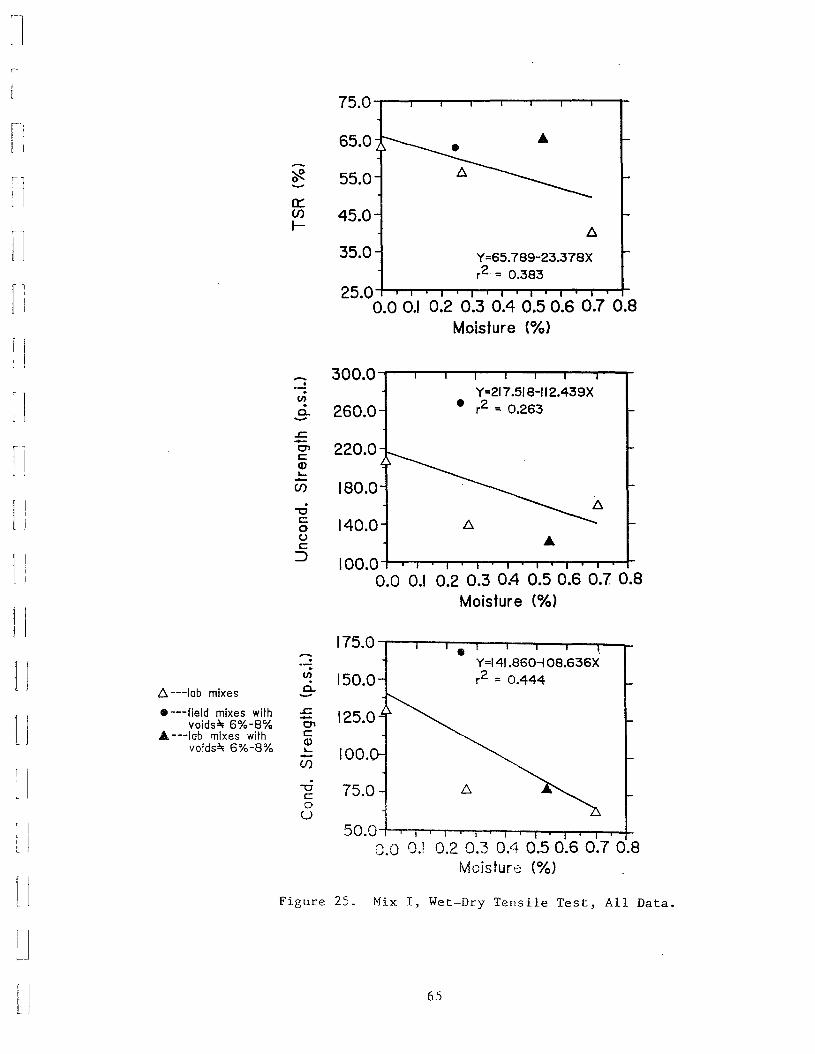
r,
[I
65.0
300.0 -r--r---r_r---'--'""T"""---r--,---r-
25.0 ;-T'""'T--.-...,..-..,...-r--r--r-""'-T'""'T--r--r-..,.-.,..-f-
0.0 0.1 0.2 0.3 0.4 0.5 0.6 0.7 0.8Moisture (%)
t::.
Y=65.789-23.378Xr2 = 0.383
Y=217.5IS-112.439X
• r2
'" 0.263
55.0
35.0
45.0
260.0
-.-!·tI)·a.-
0::U)
r-
I
II
11
fl
11
Figure 25. Mix I, Wet-Dry Tensile Test, All Data.
Y=141.860-IOS.636Xr2 = 0.444
O.f) 0,.1 0.2 0.3 O.'~ 0.5 0.6 0.7 0.8Moisture (%)
100.0 -t-1r-r-..,......,.--.-.,.--r--r-~-,--.,....,..-r-..-+-
0.0 0.1 0.2 0.3 0.4 0.5 0.6 0.7 0.8Moisture (%)
140.0
150.0
"'CCo
U
.s::.-0'CQ)L.-
tI).a.-.
·"'Cc::o()c
::J
.s::.-g' 220.0Q)L.-U) 180.0
6. ---lab mixes
• ---field mixes withvoids~ 6%-8%
... ---lob mixes withvoids"" 6%-8%
IIU
11
IIr I
]
1j
1J
I
J
65
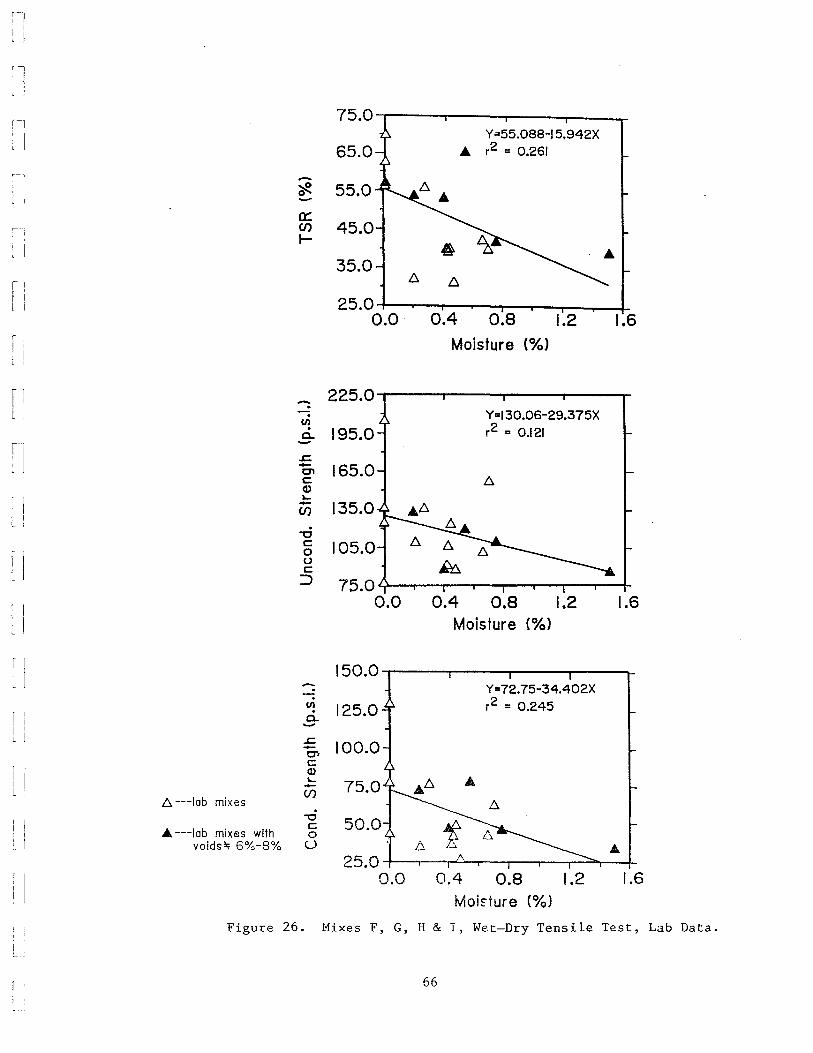
'1I
I I, J
'1, i
75.0
II Y=55.088-1 5.942X
65.0 .. r2 = 0.261
'-1 -I
rJ!. 55.0-0:.:
'I U) 45.0.....e I ~ A
35.0il
D. D.II 25.0L I
0.0 0.4 0.8 1.2 1.6Moisture (%)
fl 225.0-·LI · Y=130.06-29.375XU)
r2 = 0.121· 195.0a..-.s:=.- 165.00\c:CI)I-- 135.0U)
·"'Cc: 105.00uc:
::) 75.00.0 0.4 0.8 1.2 1.6
Moisture (%)
150.0- Y=72.75-34.402X·· r2 = 0.245U) 125.0·! I a..
l I -.s:=. 100.0-0\
I Ic:CI)L- Ar - 75.0L J (/)
D. ---lab mixes D.
l j
"'C 50.0A ---lab mixes with
c:0
voids'" 6%-8% U Do A25.0
I0.0 0.4 0.8 1.2 1.6
J Mois-ture (%)
Figure 26. 11ixes F, G, H & I, Wet-Dry Tensile Test, Lab Data.
66
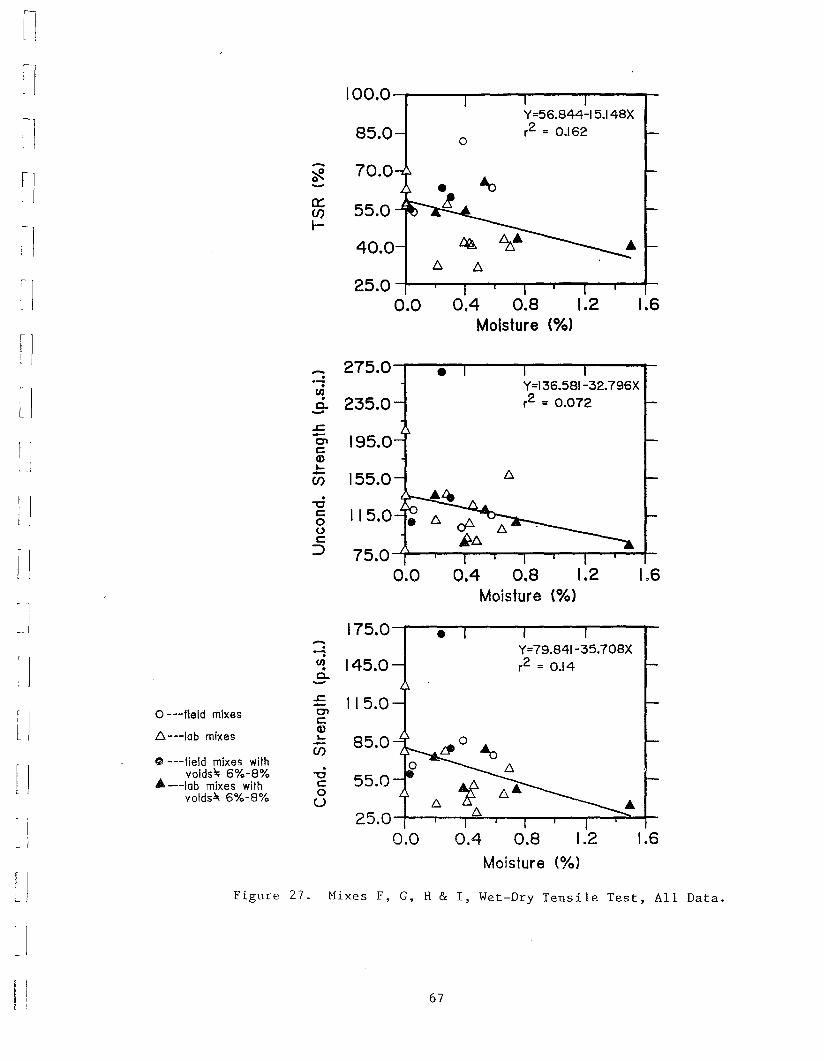
100.0Y=56.844-15.148X
85.0 r2 = 0.1620
- 70.0~-a:: 55.0CJ)I-
40.0b. b.
25.00.0 0.4 0.8 1.2 1.6
Moisture (%)
- 275.0 •...:Y=136.581-32.796X·tI1 235.0 r2 = 0.072a.-
.c- 195.0C'lcQ)I-- 155.0CJ)
·'"0c 115.000c
::> 75.00.0 0.4 0.8 1.2 1.6
Moisture (%)
175.0 •-: Y=79.841-35.708X.-· r2 = 0.14tI1 145.00--.c 115.0-o ---field mixes C'lc
.6. ---lab mixesQ)I- 85.0-if)
C ---field mixes withvolds~ 6%-8% -0 55.0A ---lab mixes with cvolds~ 6%-8% 0
U 6- A25.0
0.0 0.4 0.8 1.2 1.6
Moisture (%)
Figure 27. Mixes F, G, H & I, Wet-Dry Tensile Test, All Data.
1l ,,ll~1
tl~I
~1
fl
II
~ I
~ I
~)
l j
III
l)
67
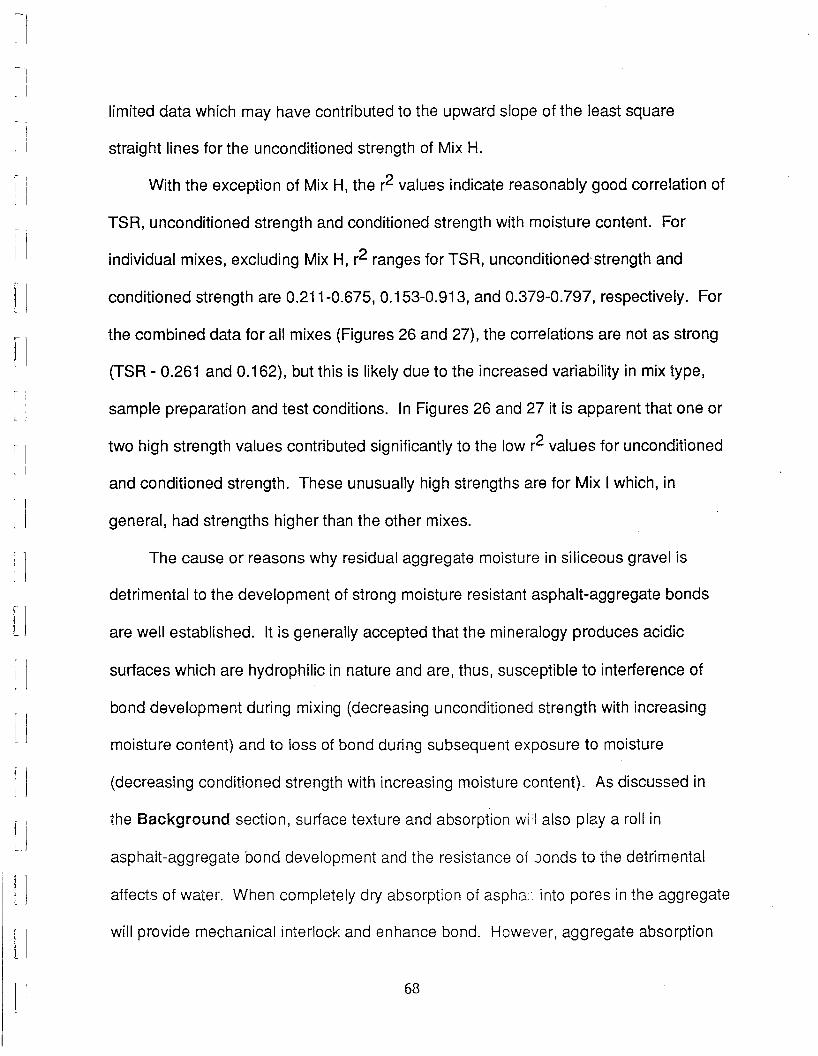
~I~I
I
, I
r'
, I
I
j
\
]
j
L I1 I
II
I
1
l '
limited data which may have contributed to the upward slope of the least square
straight lines for the unconditioned strength of Mix H.
With the exception of Mix H, the r2 values indicate reasonably good correlation of
TSR, unconditioned strength and conditioned strength with moisture content. For
individual mixes, excluding Mix H, r2 ranges for TSR, unconditioned-strength and
conditioned strength are 0.211-0.675, 0.153-0.913, and 0.379-0.797, respectively. For
the combined data for all mixes (Figures 26 and 27), the correlations are not as strong
(TSR - 0.261 and 0.162), but this is likely due to the increased variability in mix type,
sample preparation and test conditions. In Figures 26 and 27 it is apparent that one or
two high strength values contributed significantly to the low r2 values for unconditioned
and conditioned strength. These unusually high strengths are for Mix I which, in
general, had strengths higher than the other mixes.
The cause or reasons why residual aggregate moisture in siliceous gravel is
detrimental to the development of strong moisture resistant asphalt-aggregate bonds
are well established. It is generally accepted that the mineralogy produces acidic
surfaces which are hydrophilic in nature and are, thus, susceptible to interference of
bond development during mixing (decreasing unconditioned strength with increasing
moisture content) and to loss of bond during subsequent exposure to moisture
(decreasing conditioned strength with increasing moisture content). As discussed in
the Background section, surface texture and absorption wit also playa roll in
asphalt-aggregate bond development and the resistance of oonds to the detrimental
affects of water. When completely dry absorption of aspha into pores in the aggregate
will provide mechanical interlock and enhance bond. However, aggregate absorption
68
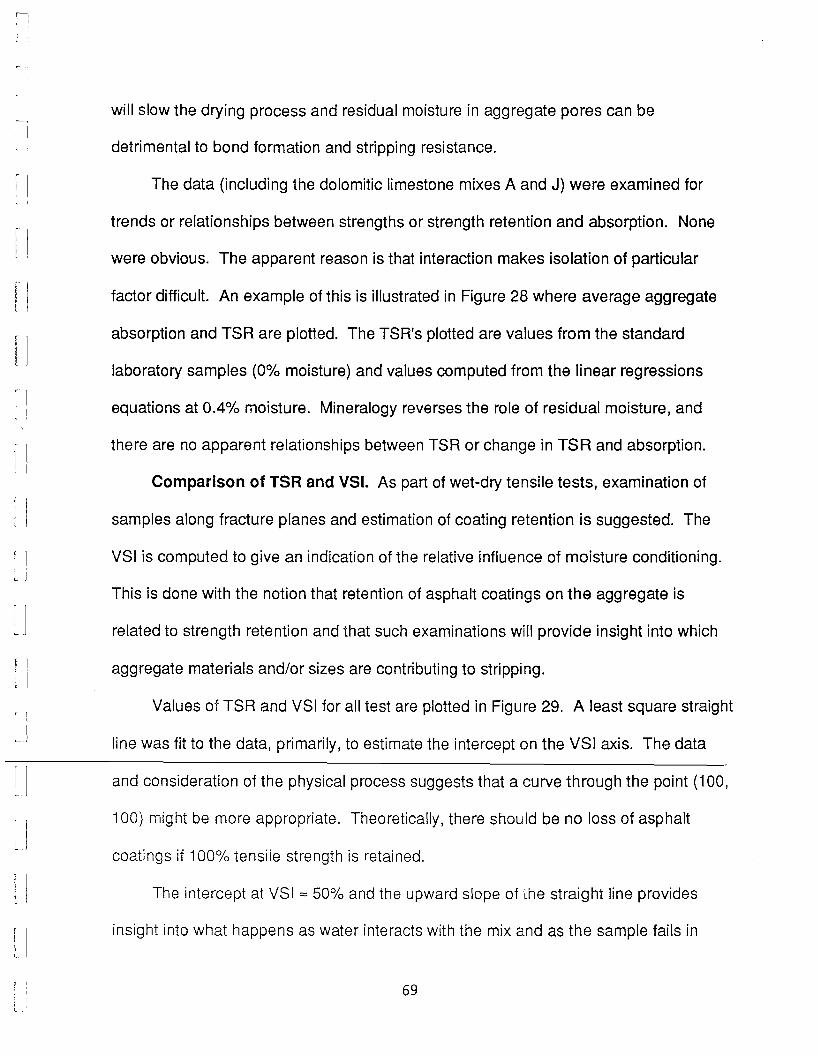
iI ,'. I
I
I
I
I
11
)
I
l J
1
I
will slow the drying process and residual moisture in aggregate pores can be
detrimental to bond formation and stripping resistance.
The data (including the dolomitic limestone mixes A and J) were examined for
trends or relationships between strengths or strength retention and absorption. None
were obvious. The apparent reason is that interaction makes isolation of particular
factor difficult. An example of this is illustrated in Figure 28 where average aggregate
absorption and TSR are plotted. The TSR's plotted are values from the standard
laboratory samples (0% moisture) and values computed from the linear regressions
equations at 0.4% moisture. Mineralogy reverses the role of residual moisture, and
there are no apparent relationships between TSR or change in TSR and absorption.
Comparison of TSR and VSI. As part of wet-dry tensile tests, examination of
samples along fracture planes and estimation of coating retention is suggested. The
VSI is computed to give an indication of the relative influence of moisture conditioning.
This is done with the notion that retention of asphalt coatings on the aggregate is
related to strength retention and that such examinations will provide insight into which
aggregate materials and/or sizes are contributing to stripping.
Values of TSR and VSI for all test are plotted in Figure 29. A least square straight
line was fit to the data, primarily, to estimate the intercept on the VSI axis. The data
and consideration of the physical process suggests that a curve through the point (100,
100) might be more appropriate. Theoretically, there should be no loss of asphalt
coatings if 100% tensile strength is retained.
The intercept at VSI "" 50% and the upward slope of the straight line provides
insight into what happens as water interacts with the mix and as the sample fails in
69
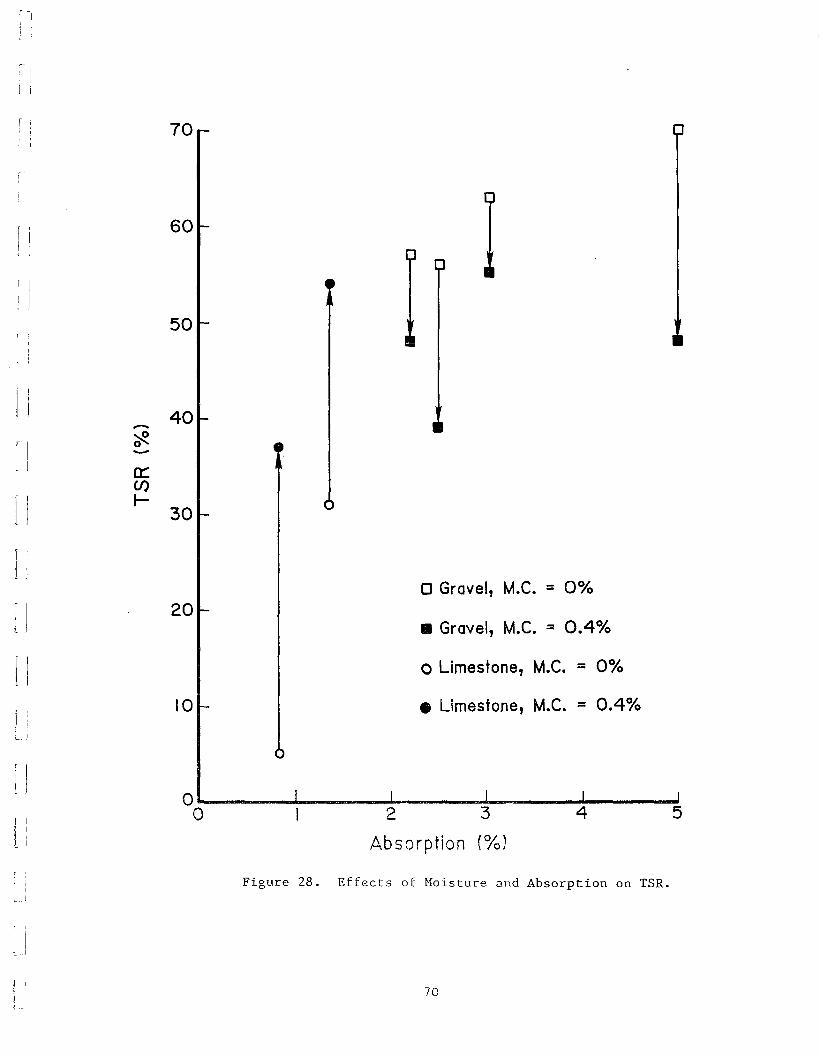
II 70i i! I
[ I
11
60
oO"-----01----21------..&3---.......4---~5
Absorption (%)
50II
j I
1] 40-1j
~-0::CJ)
11I-
30
j jI
20
tl
U
I
IjL
10
o Gravel, M.C. = 0%
• Gravel, M.C. = 0.4%
o Limestone, M.C. = 0%
• Limestone, M.e. = 0.4%
.
.11
. Ic .. J
Figure 28. Effects of Moisture and Absorption on TSR .
70
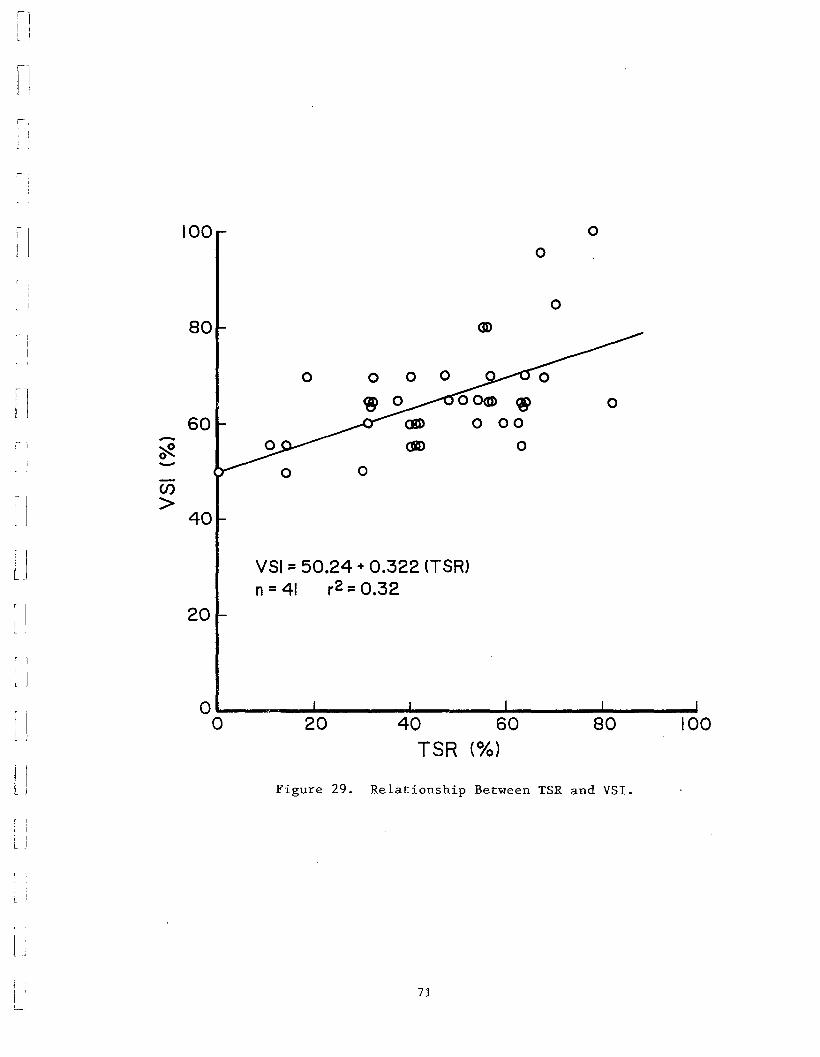
10080
oo
40 60TSR (%)
20
Figure 29. Relationship Between TSR and VSI.
0 .....---....--_....._--....._-_.....&._-_......o
100
0
80
0 0 0
o~ ~ 0
60 0 00- 0~- 00U)
>40
VSI =50.24 + 0.322 (TSR)n =41 r2 =0.32
20
\],I,
:1~I
I
~ I
~I
1
[]
I
I
~ 1
I
I
t I
1 jL
LI
L
71
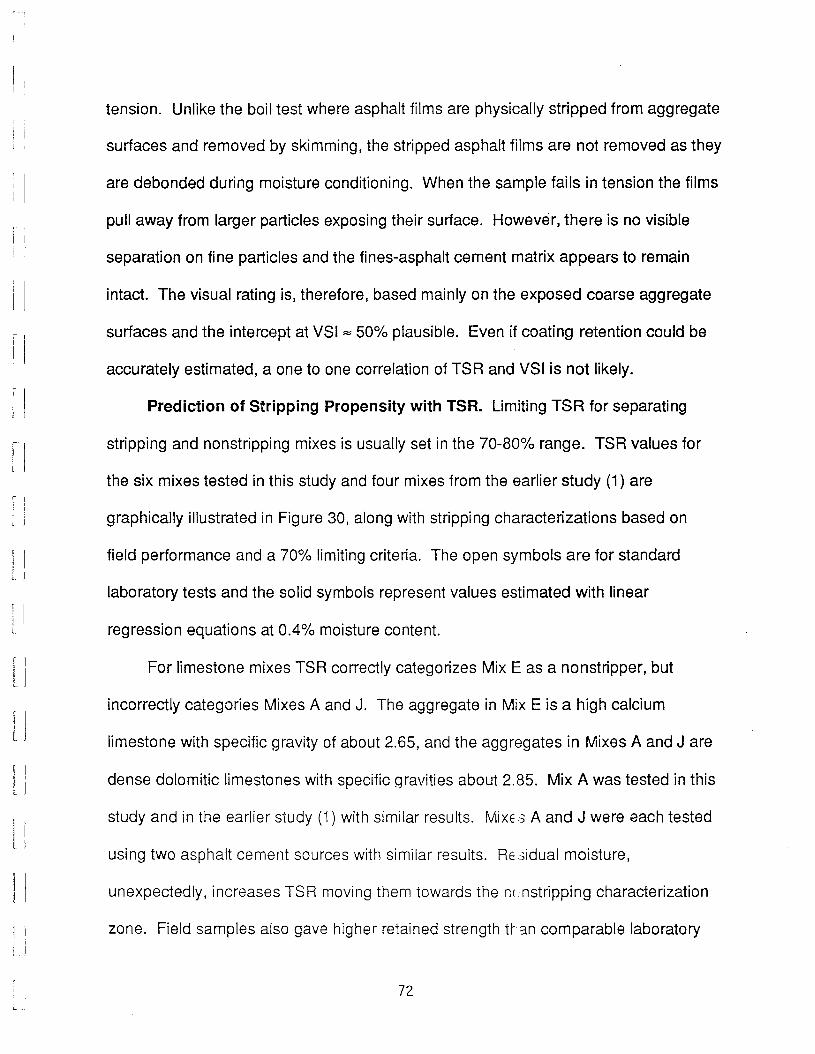
I :I I
1
, I
I
I
j I
I
I
: I
I
\
I
I jl
I
lI11!
1 IJ
tension. Unlike the boil test where asphalt films are physically stripped from aggregate
surfaces and removed by skimming, the stripped asphalt films are not removed as they
are debonded during moisture conditioning. When the sample fails in tension the films
pull away from larger particles exposing their surface. However, there is no visible
separation on fine particles and the fines-asphalt cement matrix appears to remain
intact. The visual rating is, therefore, based mainly on the exposed coarse aggregate
surfaces and the intercept at VSI ::::: 50% plausible. Even if coating retention could be
accurately estimated, a one to one correlation of TSR and VSI is not likely.
Prediction of Stripping Propensity with TSR. Limiting TSR for separating
stripping and nonstripping mixes is usually set in the 70-80% range. TSR values for
the six mixes tested in this study and four mixes from the earlier study (1) are
graphically illustrated in Figure 30, along with stripping characterizations based on
field performance and a 70% limiting criteria. The open symbols are for standard
laboratory tests and the solid symbols represent values estimated with linear
regression equations at 0.4% moisture content.
For limestone mixes TSR correctly categorizes Mix E as a nonstripper, but
incorrectly categories Mixes A and J. The aggregate in Mix E is a high calcium
limestone with specific gravity of about 2.65, and the aggregates in Mixes A and J are
dense dolomitic limestones with specific gravities about 2.85. Mix A was tested in this
study and in the earlier study (1) with similar results. MixES A and J were each tested
using two asphalt cement sources with similar results. Residual moisture,
unexpectedly, increases TSR moving them towards the n( nstripping characterization
zone. Field samples also gave higher retained strength Han comparable laboratory
72
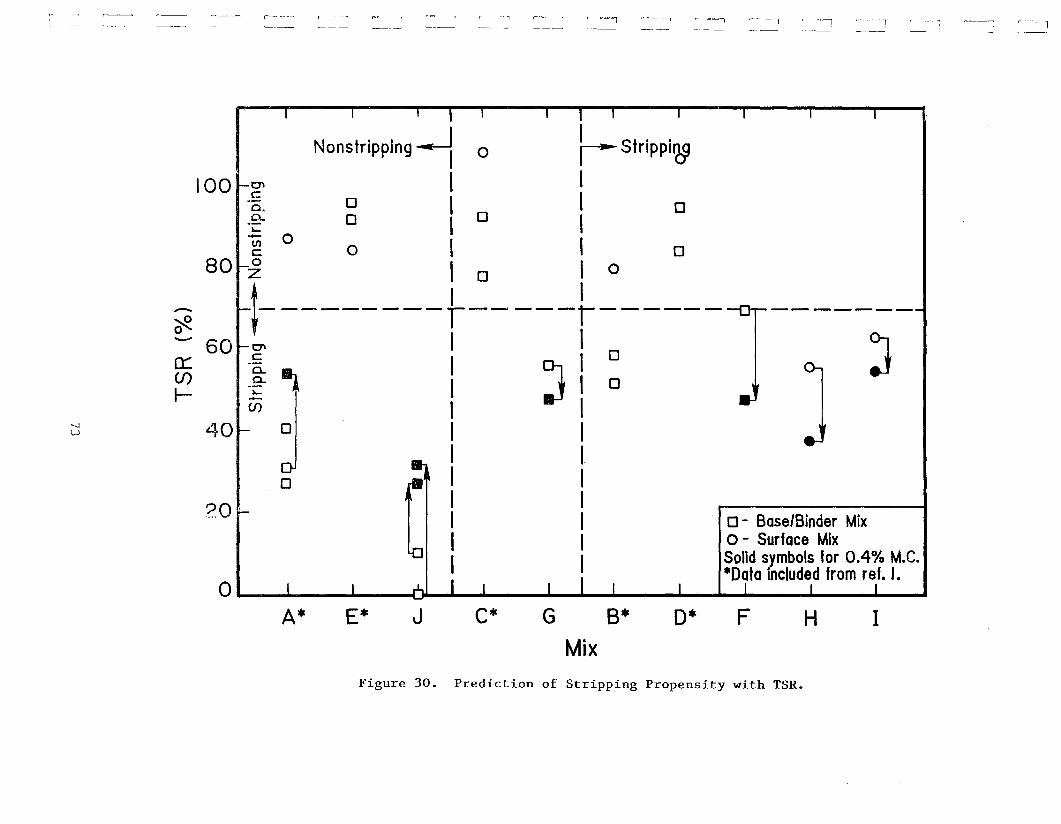
l·-'·O ..~-""" r~-~~~ r~
!-_-r----~ ~-- - -1 1 1
Nonstripplng--i 0 ~Strippi~100 J-Ol , I
~. 0 I I 0.§- 0 I 0 I- 0~ 0 I I 0
80~~ I 0 I 0* ~--------t-----~----------------- 60 Ol , 0 ~cr.: .~. J I ~ .J(J) .9- J 1 0~ ~ ,
l.j 40J-(J) 0 1
I.
o [1 I, I2 0 ~ I 0 - Base/Binder Mix
I 0 - Surface Mix1 Solid symbols for 0.4% M.e.• *Data included from ref. I.o _
A* E* J C* G B* 0* F H I
MixFigure 30. Prediction of Stripping Propensity with TSR.
I" I
. It I
f. I!
fl
rIt
1.·1!
~... 1l
i ]IIU
II
samples.
This evidence indicates that the low retained strength measured for Mixes A and
J is real. The evidence also suggests that the poor correlation with field performance
may be due to inadequate simulation of field conditions. Residual moisture and field
conditions (mixing and possibly storage) have a positive effect on strength retention.
Based on this evidence the wet-dry tensile tests should not be used to determine the
need for antistrip agents in mixes that are comprised of predominately dense dolomitic
limestones. This recomendation assumes that such mixes are truely not prone to
stripping, as is the prevailing consensus. Inclinations that such mixes might actually
strip in the field should lead to a study that will verify their performance.
For siliceous gravel Mixes C and G, one is catagorized as a stripper and one a
nonstripper. Residual moisture reduces TSR and field samples had a slightly smaller
TSR than comparable laboratory samples for Mix G. The variable predictions are
considered consistent with the characterization of Mixes C and G as moderately
susceptible to stripping.
Mixes B, 0, F, H and I are characterized as susceptible to stripping, and
predictions for all but Mix 0 are consistent with this characterization. The behavior of
Mixes F, H and I lead to the conclusion that the prediction rather than the
characterization is incorrect for Mix O. A unique combination of aggregate mineralogy,
surface texture and porosity apparently results in moisture resistant bonds w:th asphalt
when the aggregate is completely dry. However, residual moisture would likely have
the same detrimental effect for Mix 0 as it did for Mixes F, H and I.
As with the dolomitic limestones, field samples for the siliceous gravel mixes
74
~-I
flI '{ ~
'·'-1Iii', ,
ilII
,
J
11L
generally had higher TSR's than comparable laboratory samples. This would
somewhat counteract the effects of residual moisture and move the points toward the
nonstripping characterization zone. It is just such conflicting trends that may result in
the erratic occurrence of stripping. A mix with a given aggregate combination certainly
does not strip all the time. On a particular project stripping usually does not occur
uniformly, but rather it usually occurs sporadically. This may be due, in part, to variable
moisture conditions in the pavement, but variable stripping propensity of the mix may
also be a factor. For a mix to be susceptible to moisture damage likely requires that
several conditions, of which residual moisture is one of the more important, occur
simultaneously. It is this variability in mix production conditions that leads to the need
for antistripping additives.
The response of Mixes B, G, F, H and I indicate that the standard wet-dry tensile
test (22) is adequate for evaluating the stripping propensity of siliceous gravel mixes.
However, the effect of residual moisture and the response of Mixes C and 0 indicate
otherwise. There are two approaches to the problem. Antistrip additives may be
required in all predominatly siliceous gravel mixes or the test procedure may be
modified to account for the effects of residual moisture. The former will provide a short
term solution, but the latter is the preferred solution. ImplerT1entation of a modified test
procedure will require 1) selection of a realistic moisture content range for testing, 2)
refinement of laboratory mix preparation procedur~s for cOltrolling residual aggregate
moisture content, and 3) additional testing and field observdions to verify the apparent
influence of residual moisture.
75
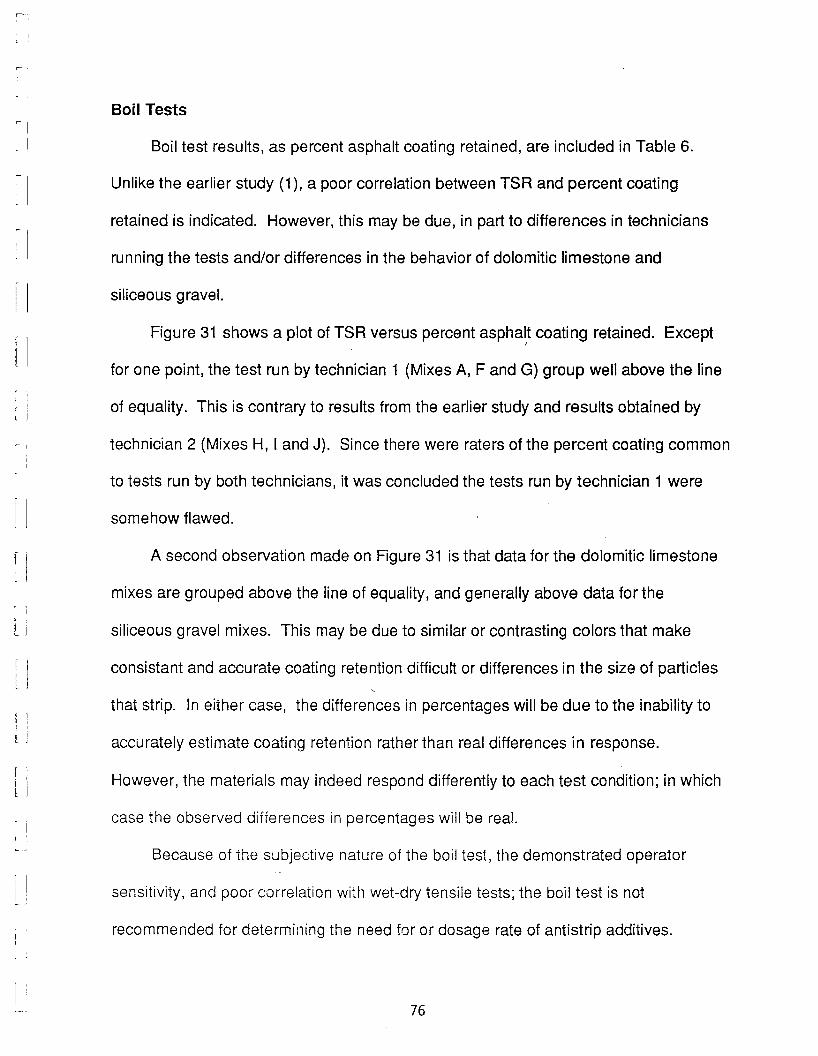
~l
~I
~1
I
I
I
r I[
Boil Tests
Boil test results, as percent asphalt coating retained, are included in Table 6.
Unlike the earlier study (1), a poor correlation between TSR and percent coating
retained is indicated. However, this may be due, in part to differences in technicians
running the tests and/or differences in the behavior of dolomitic limestone and
siliceous gravel.
Figure 31 shows a plot of TSR versus percent aspha~t coating retained. Except
for one point, the test run by technician 1 (Mixes A, F and G) group well above the line
of equality. This is contrary to results from the earlier study and results obtained by
technician 2 (Mixes H, I and J). Since there were raters of the percent coating common
to tests run by both technicians, it was concluded the tests run by technician 1 were
somehow flawed.
A second observation made on Figure 31 is that data for the dolomitic limestone
mixes are grouped above the line of equality, and generally above data for the
siliceous gravel mixes. This may be due to similar or contrasting colors that make
consistant and accurate coating retention difficult or differences in the size of particles
that strip. In either case, the differences in percentages will be due to the inability to
accurately estimate coating retention rather than real differences in response.
However, the materials may indeed respond differently to each test condition; in which
case the observed differences in percentages will be real.
Because of the subjective nature of the boil test, the demonstrated operator
sensitivity, and poor correlation with wet-dry tensile tests; the boil test is not
recommended for determining the need for or dosage rate of antistrip additives.
76

'III
'I~I
~I
~ j
~ I·: I
I.·. 1[ I
fl
fl
I
I I):
1.
j
i Il j
II
However, because of its simplicity it has value as a field test for quality control and
should be used primarily as an indicator of change during construction as outlined in
reference 1.
77
•II!l ~ 0
o•
80
60
•• •40 0
@
0
20
Technician I ... Limestone -.- Gravel -0
Technician 2 - Limestone -e0 - Gravel -0
0 20 40 60 80 100
TSR (%)
100;1!
r ~I
~ I -I
~
01~
r I.--00
U
r 1 -0.ca..(/)
, I «II -0
Q)
j~
0-Q)
0::
'IJ
j Il
Figure 31. Relationship Between Asphalt Coating Retained andTSR.
78
~Il I
'II
~ I
rl
i• I
f Il i
, I
L !
CONCLUSIONS AND RECOMMENDATIONS
Mix production conditions can affect stripping propensity. Residual aggregate
moisture is a major factor, but mixing and possibly storage may also contribute. Lack
of simulation of field conditions in standard laboratory tests can lead to poor correlation
between observed and predicted mix performance.
Aggregate and mixture moisture contents were measured during production.
Comparison of several methods for measuring moisture content lead to the adoption of
the microwave oven method. Moisture contents were dependent on environmental
conditions (temperature and rainfall) with higher moisture contents during cool rainy
conditions. Moisture contents also appeared to be higher during plant startup, and
although not measured, rate of production will also influence aggregate drying.
Residual moisture is higher in coarse particles than in fine particles.
A procedure was developed for preparing mix with controlled aggregate residual
moisture. The moisture content that can be realistically maintained during mix
preparation is depen~ent on aggregate absorption. Higher residual moisture can be
obtained with higher absorptive aggregate.,
Wet-dry tensile test results indicated that residual moisture affects dolomitic
limestone mixes differently than siliceous gravel mixes. Residual aggregate moisture
increases conditioned strength and TSR for dolomitic limestone mixes, but decreases
these parameters for siliceous sand-gravel mixes. Values for field mixes were also
generally higher than values for comparable laboratory mb,es. This difference is one
of the reasons for poor correlation between predicted and )bserved stripping
propensity.
79
r~
i ;
f'l'I! .
1]
]
The wet-dry tensile test does a reasonably good job of evaluating mixes
comprised primarily of siliceous sand-gravel with a history of moderate to severe
stripping problems. High retained strength ratios obtained with standard test
conditions for some mixes indicate a need for modifications to consider the influence of
residual moisture during mix design. Implementation of a modified testing procedure
during mix design will require 1) selection of a realistic moisture content range for
testing, 2) refinement of the laboratory mix preparation procedure for controlling
residual aggregate moisture content, and 3) additional testing and field observations to
verify the apparent influence of residual moisture. Development of a procedure for
including residual moisture would identify problems during mix design rather than after
production begins.
The influence of residual moisture on retained tensile strength accentuates the
need for routine testing during mix production. Residual moisture content will vary
during production and routine testing will indicate when conditions are developing that
could lead to unacceptable retained tensile strength levels. A set of retained tensile
strength samples should be tested for each 5000 tons of mix produced. Should daily
moisture content measurements indicate moisture content 0.1 % larger than the
previous days measurements, a set of retained tensile strength samples should be
immediately prepared and tested.
The unusual and, at this state, unexplained response of mixes containing dense
dolomitic limestone provides justification for caution and conservatism during mix
design and construction. Vvhile there are no perceived performance problems, and
while residual moisture has an apparently beneficial effect on retained tensile strength;
80

r 'II
I
flf I!I I[ I
I
11
U
II
I
I
I
, II 'Ic ,
the continued use of current mix design and construction control procedures is
recommended until a more refined procedure that includes the influence of residual
moisture is developed and verified. During mix design this approach may occasionally
lead to the overuse of antistripping additives, but lack of knowledge vindicates the
conservative approach.
The boil test is simple and easy to perform, but consistent testing techniques and
sample evaluation are difficult to maintain. The boil test should only be considered as
a field control test to indicate changes during mix production.
81
'1l I
I, I
r I
t I
i t
, I
JJ
j
I
I
( II 'LI
t j
REFERENCES
1. Parker, F., "Stripping of Asphalt Concrete - Physical Testing," Report #1, Project930-111, Alabama Highway Department, Montgomery, Alabama, January, 1987.
2. Nicholson, V., "Adhesion Tension in Asphalt Pavements, Its Significance andMethods Applicable in Its Determination," Proceedings, Association of AsphaltPavement Technologists, Vol. 13, 1932.
3. Fromm, H.J., "The Mechanisms of Asphalt Stripping from Aggregate Surfaces,"Proceedings, Association of Asphalt Paving Technologists, Vol. 43,1974.
4. Taylor, M.A. and N.P. Khosla, "Stripping of Asphalt Pavements: State of the Art,"Transportation Research Record 911, 1983.
5. Kennedy, T.W., F.L. Roberts, and W.L. Lee, "Evaluation of Moisture Susceptibilityof Asphalt Mixtures Using the Texas Freeze-Thaw Pedestal Test," Proceedings,Association of Asphalt Paving Technologists, Vol. 51, 1982.
6. McGennis, RB., RB. Machemehl, and T.W. Kennedy, "Moisture Effects onAsphalt Concrete Mixtures," Research Report 253-1, Center for TransportationResearch, Bureau of Engineering Research, The University of Texas at Austin.
7. Kennedy, T.W., RB. McGennis, and F.L. Roberts, "Investigation of MoistureDamage to Asphalt Concrete and the Effect of Field Performance- A Case Study,"Transportation Research Record 911, 1983.
8. Majidzadeh, K. and F.N. Brovald, "State of the Art: Effects of Water onBitumen-Aggregate Mixtures," Highway Research Board Special Report 98,1968.
9. Majidzadeh, K. and RR Stadler, Jr., "Effects of Water on Behavior of SandAsphalt-Mixtures Under Repeated Loading," Highway Research Record 273,1969.
10. The Asphalt Institute, "Cause and Prevention of Stripping in Asphalt Pavements,"Educational Series (ES-1 0), January, 1981.
11. Gharaybeh, F.A., "Evaluation of Tests to Assess Stripping Potential for AsphaltConcrete Mixtures," Ph.D. Dissertation, Auburn University, August, 1987.
12. Hazlett, D.G., "Evaluation of iv10isture Susceptibility Tests for Asphaltic Concrete,"Report 3-C-2-1 02, Texas Department of Highways and Public Transportation,August, 1985.
13. Dukatz, E.L. and R.S. Phillips, "The Effect of Air Voids on the Tensile StrengthRatio," Proceedings, Association of Asphalt Paving Technologist, Vol. 56, 1987.
82
r
;-1
I 14.
r-·~.
15.
r I
I 16.
Kennedy, T.W., F.L. Roberts, and K.W. Lee, "Evaluation of Moisture Effects onAsphalt Concrete Mixtures," Transportation Research Record 911, 1983.
Sonderegger, P.E., "Residual Moisture in Asphaltic Concrete," Proceedings,Association of Asphalt Paving Technologists, Vol. 30, 1961.
Lottman, R.P., "Aggregate Heating and Drying Variations in Asphalt Plants,"Proceedings, Association of Asphalt Paving Technologists, Vol. 30, 1961.
[ il I
, 17. Reynolds, W.H., "Stripping in Asphalt Concrete Hot Mix Pavements,"Proceedings, Workshop in Pavement Rehabilitation, Federal HighwayAdministration, FHWA-TS-84-224, 1984.
18. Jimenez, R.A., "Testing for Debonding of Asphalt from Aggregate,"Transportation Research Record 515,1974.
r II .
, I
r I
~ 1I
19.
20.
Lottman, Robert P., "Predicting Moisture-Induced Damage to Asphaltic Concrete,"National Cooperative Highway Research Program, Report No. 192,Transportation Research Board, Washington, D.C., 1978.
Lottman, Robert P., "Predicting Moisture-Induced Damage to AsphalticConcrete-Field Evaluation," National Cooperative Highway Research Program,Report No. 246, Transportation Research Board, Washington, D.C., 1982.
21. Lottman, Robert P., "Laboratory Test Method for Predicting Moisture-InducedDamage to Asphalt Concrete," Transportation Research Record No. 843,Transporation Research Board, Washington, D.C., 1982.
l j
C I
I)
I:..- ,I
22.
23.
24.
25.
26.
Tunnicliff, D.G. and R.E. Root, "Use of Antistripping Additives in AsphalticConcrete Mixtures," National Cooperative Highway Research Program, ReportNo. 274, Transportation Research Board, 1984.
_______, "Prediction of Moisture-Induced Damage to BituminousPaving Mixtures Using Molded Specimens," Test Method Tex-531-C, Texas StateDepartment of Highways and Public Transportation, August, 1984.
_______, "Method of Test for Evaluating the Moisture Susceptibility ofBituminous Mixtures by Diametral Tensile Splitting," GHD-66, State of GeorgiaDepartment of Transportation, January, 1985.
Kennedy, T.W., F.L. Roberts, and K,W. Lee, "Evaluation of Moisture Susceptibilityof Asphalt Mixtures Using the Texas Boiling Test," Transportation ResearchRecord 968, 1984.
Puzinauskas, V.P., "Properties of Asphalt Cements," Proceedings, Association ofAsphalt Paving Technologist, Vol. 48, 1979.
83
~I, I
:1
11
. I
~ IC I. I
, I
Ij
~ !
I:
i I
l j
APPENDIX
MICROWAVE OVEN METHOD FOR DETERMINATION OFMOISTURE CONTENT OF BITUMINOUS MIXTURES
84
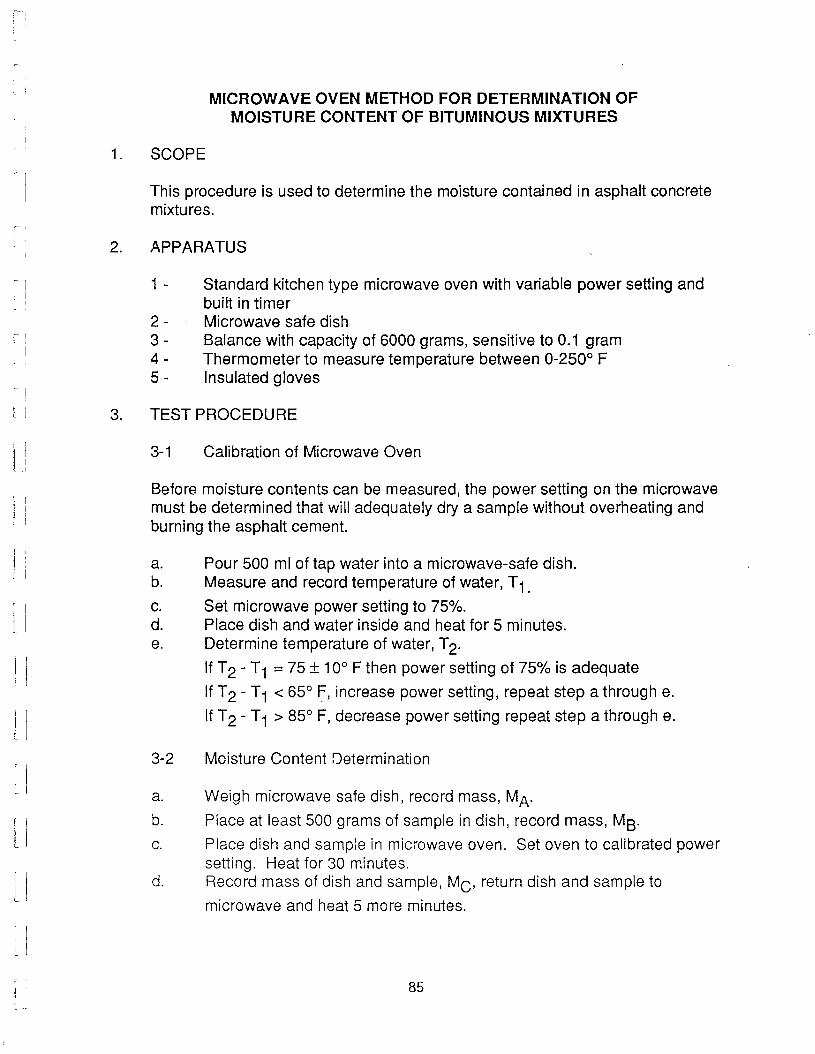
r-- ,
1.
2.
MICROWAVE OVEN METHOD FOR DETERMINATION OFMOISTURE CONTENT OF BITUMINOUS MIXTURES
SCOPE
This procedure is used to determine the moisture contained in asphalt concretemixtures.
APPARATUS
1 - Standard kitchen type microwave oven with variable power setting andbuilt in timer
2 - Microwave safe dish3 - Balance with capacity of 6000 grams, sensitive to 0.1 gram4 - Thermometer to measure temperature between 0-250° F5 - Insulated gloves
3. TEST PROCEDURE
3-1 Calibration of Microwave Oven
Before moisture contents can be measured, the power setting on the microwavemust be determined that will adequately dry a sample without overheating andburning the asphalt cement.
a. Pour 500 ml of tap water into a microwave-safe dish.b. Measure and record temperature of water, T1.
c. Set microwave power setting to 75%.d. Place dish and water inside and heat for 5 minutes.e. Determine temperature of water, T2'
If T2 - T1 =75 ± 10° F then power setting of 75% is adequate
If T2 - T1 < 65° F, increase power setting, repeat step a through e.
If T2 - T1 > 85° F, decrease power setting repeat step a through e.
3-2 Moisture Content Determination
a. Weigh microwave safe dish, record mass, MAo
b. Place at least 500 grams of sample in dish, record mass, MB'
c. Place dish and sample in microwave oven. Set oven to calibrated powersetting. Heat for 30 minutes.
d. Record mass of dish and sample, MC' return dish and sample to
microwave and heat 5 more minutes.
85
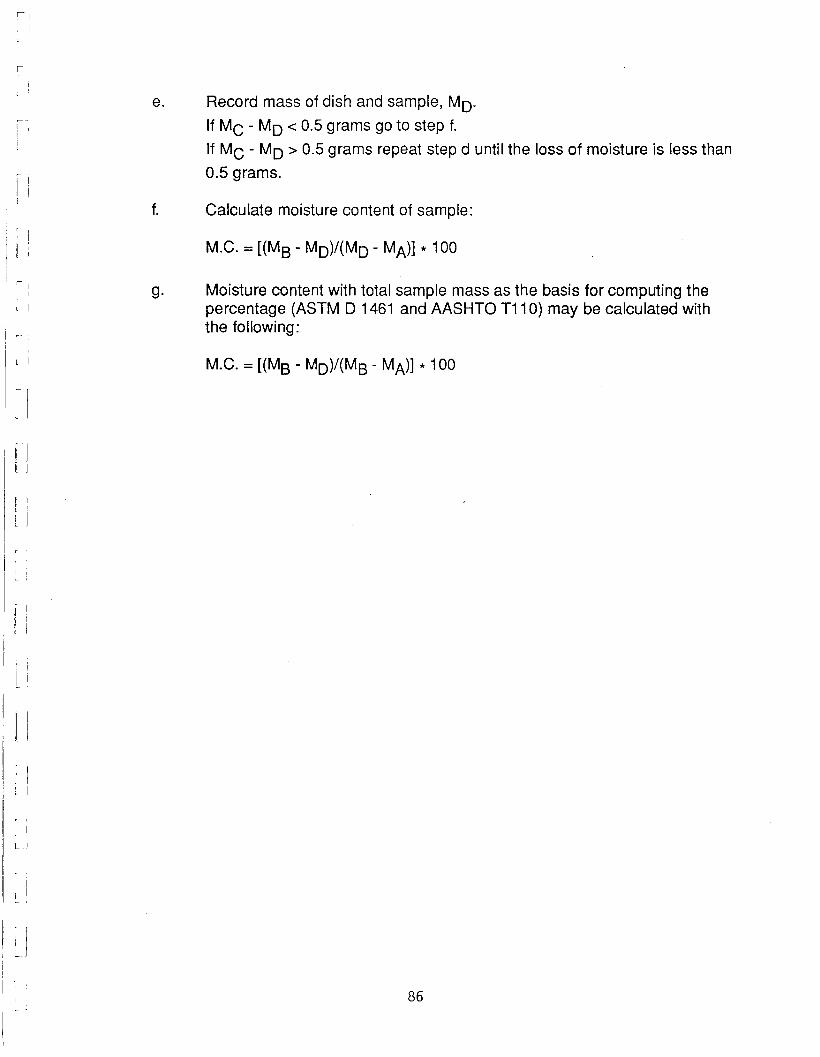
C I
I Ii
l I
l j
e.
f.
g.
Record mass of dish and sample, MO
If MC - MO < 0.5 grams go to step f.
If MC - MO > 0.5 grams repeat step d until the loss of moisture is less than
0.5 grams.
Calculate moisture content of sample:
M.C. = [(MS - MO)/(MO - MA)] * 100
Moisture content with total sample mass as the basis for computing thepercentage (ASTM 0 1461 and AASHTO T11 0) may be calculated withthe following:
M.C. = [(MS - MO)/(MS - MA)] * 100
86

I
" I
~.'. j[!
\i
[I
[1
l1
, '
I I
~ J