Embed Size (px)
Citation preview

PROJECT MANAGEMENT

PROJECT MANAGEMENT
• Project management is not new. It has been in use for hundreds of years

WHAT IS PROJECT MANAGEMENT
• A project is a temporary endeavor undertaken to create a unique product, service, or result --- PMBOK
• "Any task which has a definable beginning and definable end, and requires the expenditure of one or more resources, in each of the separate but inter-related and inter dependent activities which must be completed to achieve the objectives for which the task or project was instituted". Dr RL Martino
• Management can be defined as: -
"The process of planning, organising, directing, co-ordinating and controlling the activities to achieve the laid down targets".

WHAT IS PROJECT MANAGEMENT
• “The most effective and efficient use of resources (of manpower, materials, money, machinery, facilities, information and technology) so that organisational goals and objectives can be achieved within the allotted budget, on schedule and at the desired performance level while adhering to the ever changing environmental factors like political, economical, social, technological and legal”.
RESOURCES
MEN
MATERIAL
MONEY
MACHINERY
METER
MINUTE
INFO TECH
PROCESS
EFFICIENT
AND
EFFECTIVE
OUTPUT
GOALS
AND
OBJECTIVES
WITH IN
ALLOTTED
BUDGET
ON
SCHEDULE
AT DESIRED LEVEL
OF PERFORMANCE
ECONOMICAL TECHNOLOGICAL
SOCIAL POLITICAL LEGAL
ENVIRONMENT

Lack of Project Management
• Poorly managed projects or the absence of project management may result in:
• Missed deadlines
• Cost overruns
• Poor quality
• Rework
• Uncontrolled expansion of the project
• Loss of reputation for the organization
• Unsatisfied stakeholders
• Failure in achieving the objectives for which the project was undertaken

RELATIONSHIP OF PROJECT, PROGRAM & PORTFOLIO
PORTFOLIO
PROGRAM
PROJECTS

Importance of Project Manager
• Distinct from that of a Functional manager or Operations manager - Leads the team that is responsible for achieving the project objectives.
• Project Manager/Conductor of Orchestra • Membership and roles
• Responsibility for team.
• Knowledge and skills

Project Managers Competencies

Project Life Cycle

Project Life Cycle
Post Accomplishment
Time
Abstract
Concrete
Feasibility Studies

Choices/
Alternatives
Detailed
Project
Report
Feasibility Study
Approved
Alternative
PROJECT FORMULATION
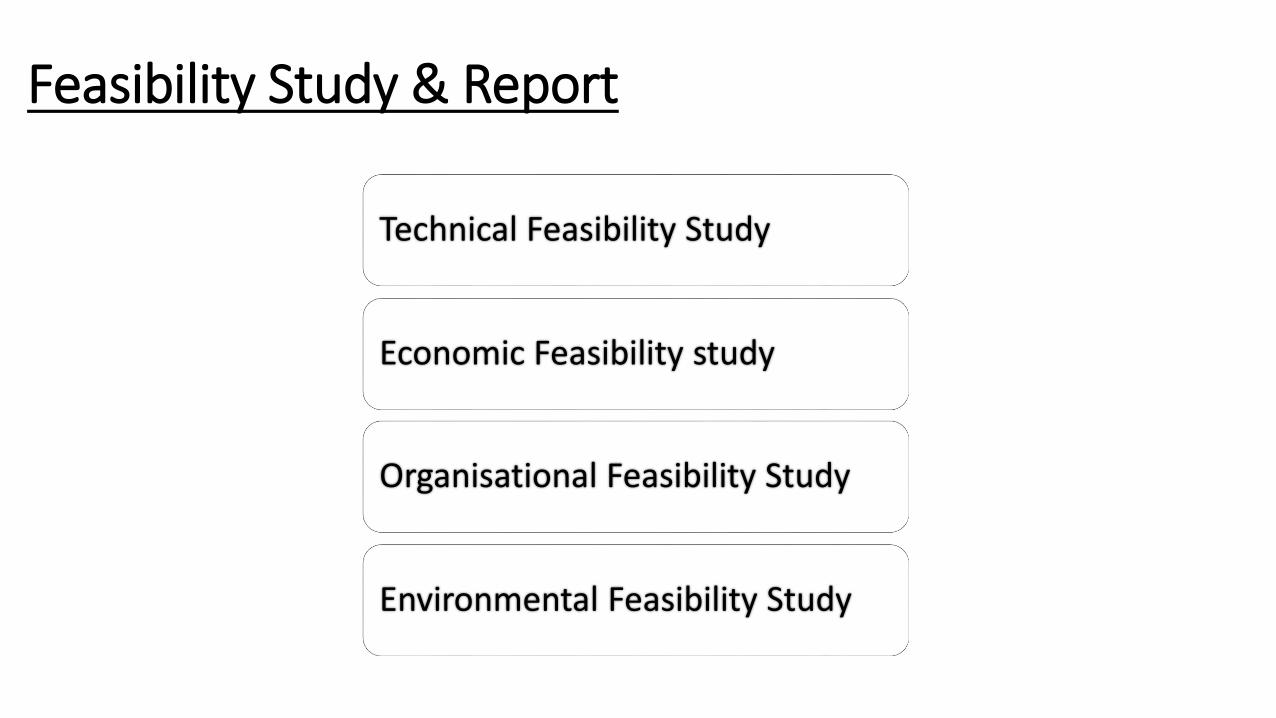
Technical Feasibility Study
Economic Feasibility study
Organisational Feasibility Study
Environmental Feasibility Study
Feasibility Study & Report

The process of defining the necessary tasks to reach the
objectives, making cost estimates and preparing
schedules & budgets. It also involves assigning overall
segments of the plan to individuals, with a minimum of
overlap problems.
Project Planning
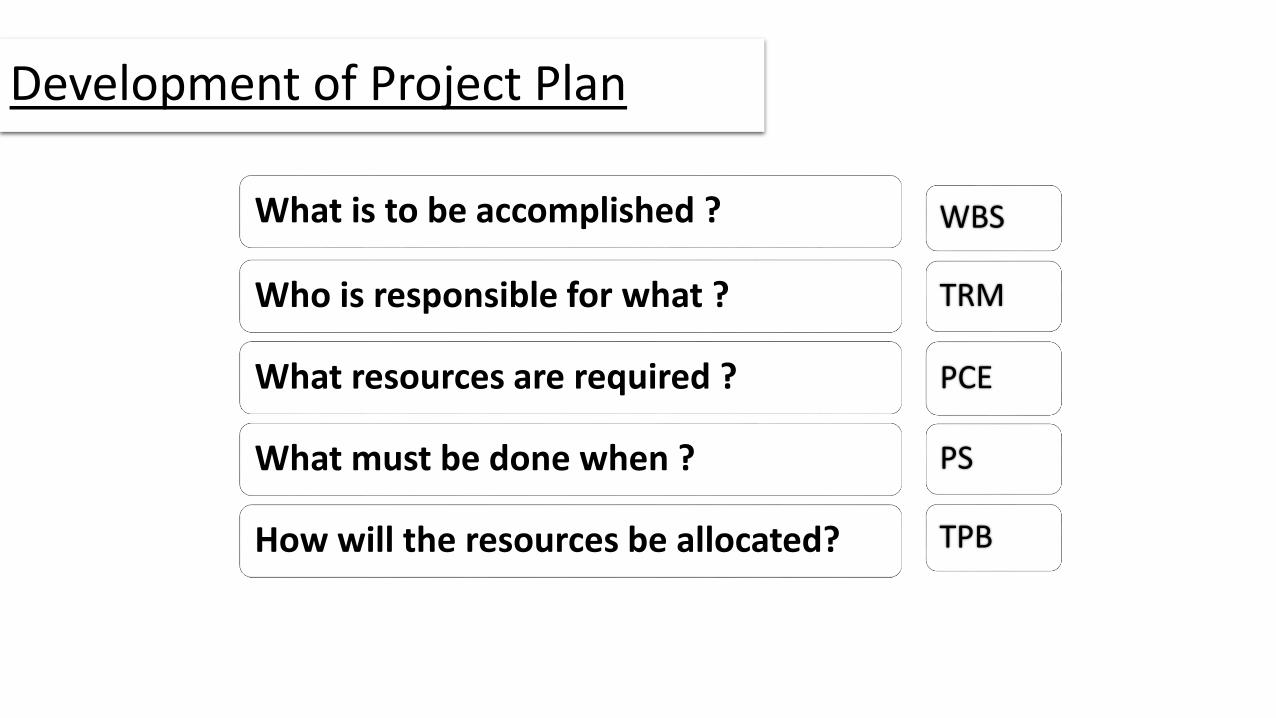
Development of Project Plan
What is to be accomplished ?
Who is responsible for what ?
What resources are required ?
What must be done when ?
How will the resources be allocated?
WBS
TRM
PCE
PS
TPB

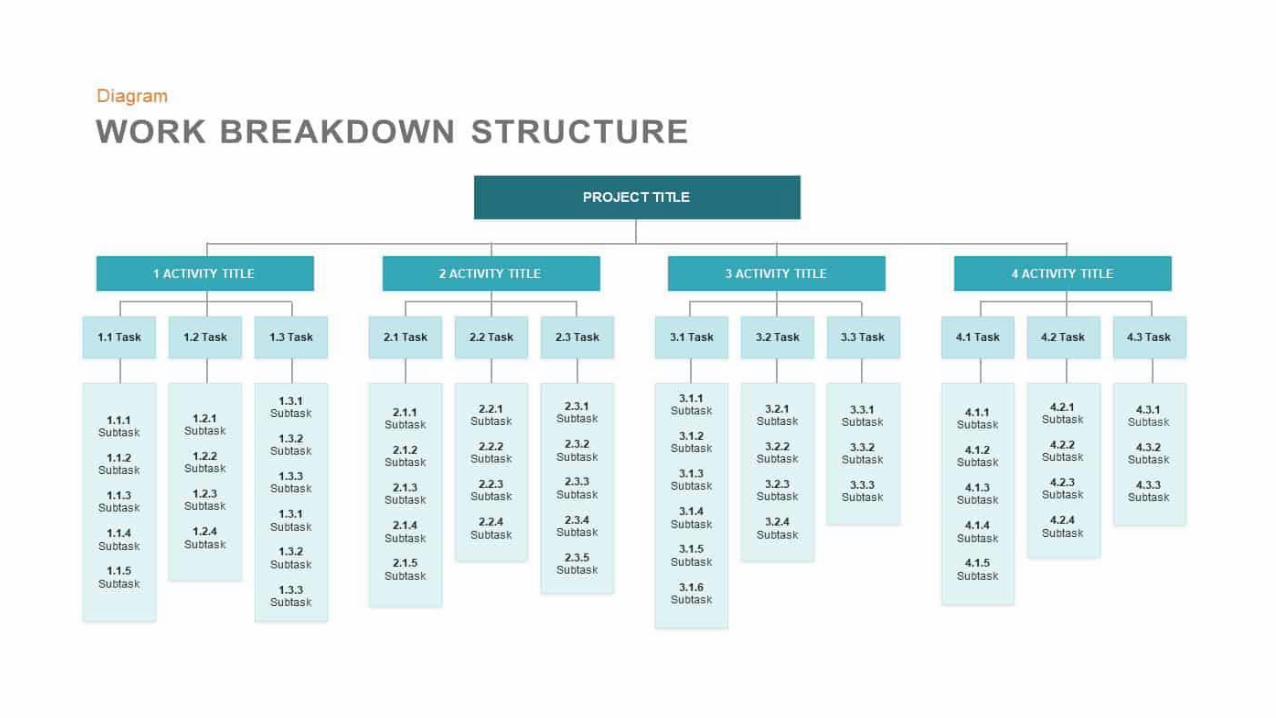
Work Breakdown Structure
• Hierarchical decomposition of the total scope of work to be carried out by the project team to accomplish the project objectives and create the required deliverables.
• Work Breakdown Structure (WBS) is the process of subdividing project deliverables and project work into smaller, more manageable components. The key benefit of this process is that it provides a framework of what has to be delivered. This process is performed once or at predefined points in the project.
• The WBS provides the relationships among all the project deliverables and their various components.

Work Breakdown Structure
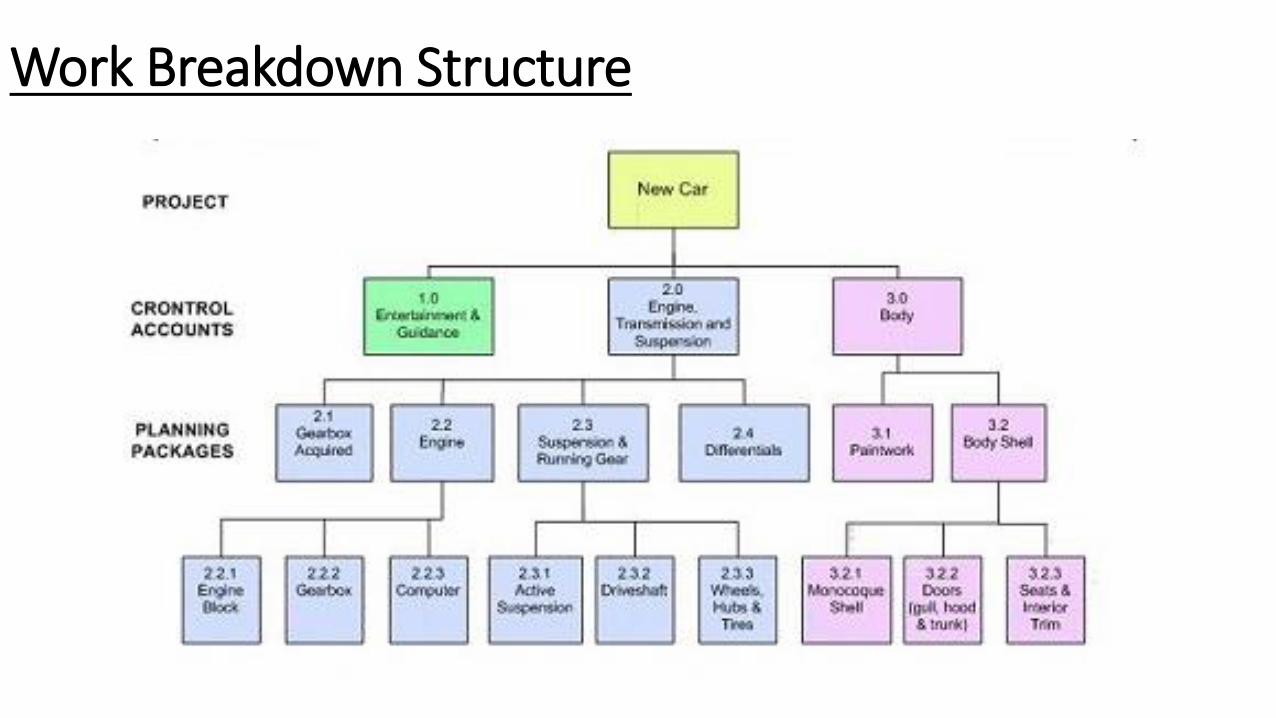
Work Breakdown Structure

Work Breakdown Structure

Work Breakdown Structure
Systematic & logical breakdown
Neither too many or too few levels.
Breakdown to Work Control Package(WCP).
WCP - Responsibility can be assigned.
WCP - Can be costed and time assigned.
Unique number for identification.
Sum total of cost of all WCPs is cost of project.
Work Breakdown Structure
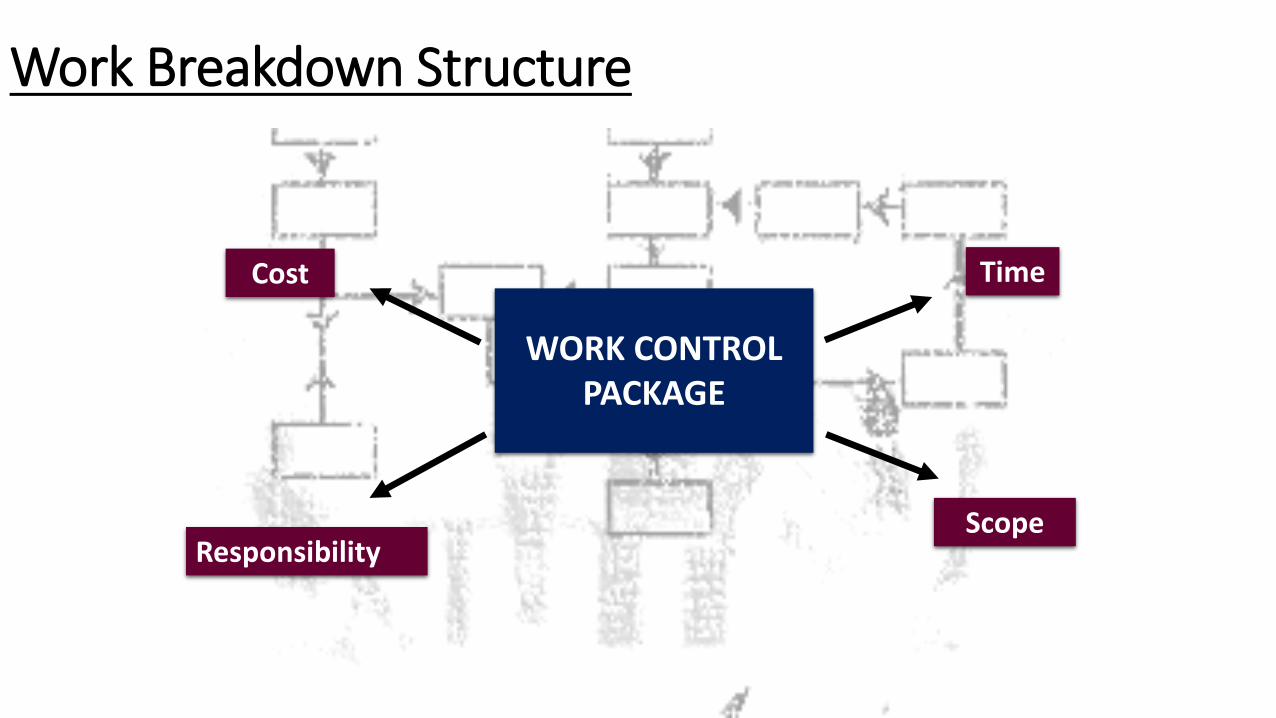
WORK CONTROL PACKAGE
Scope Responsibility
Time Cost
Work Breakdown Structure
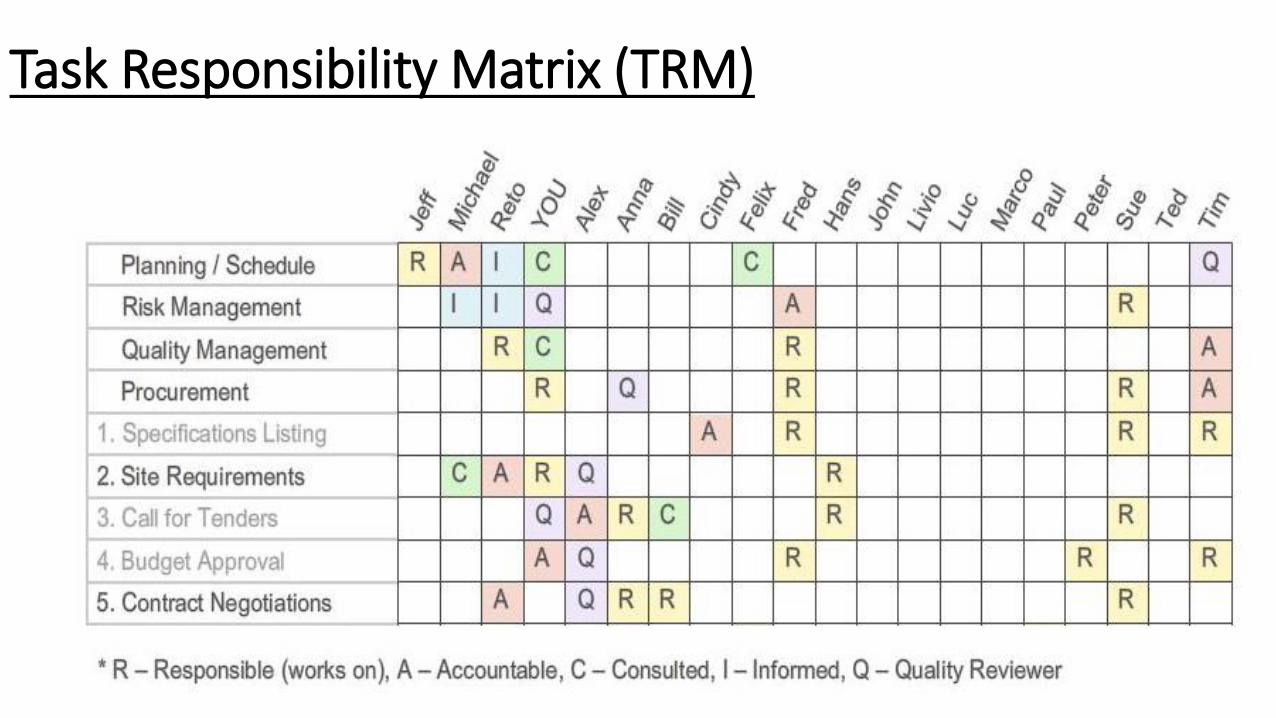
Task Responsibility Matrix (TRM)

Each row of TRM shows persons involved and nature of responsibility for WCP
Each column shows the Work Packages for which a single individual is
responsible and the responsibility Project personnel can easily identify their responsibility Mutual Agreement Enables monitoring of how effectively responsibility is being executed
Merits of TRM

Project Cost Estimates (PCE)
Forecasted Worked out from WCP/WBS Historical data/ estimation methods used A detailed cost estimate is the basis of a project budget Standard for Comparison with Baseline

Direct Labour – staff expenses. Direct non-labour – material expenses. Overheads – direct overheads (electricity, transport). General Administration – indirect overheads(office). Contingency Reserve. Profits (only for commercial organisation). Total Cost [sum of all above].
Project Cost Estimates

Project Master schedule is prepared by integrating the WCP and TRM with the Project Schedule
Two levels of schedule planning
• Project level
• Task Level
Complete and comprehensive in scope
Include key milestones / Interface events linking all tasks
Useful in Progress evaluation & Management reporting
Project Schedule (PS)

Project Schedule - Networks
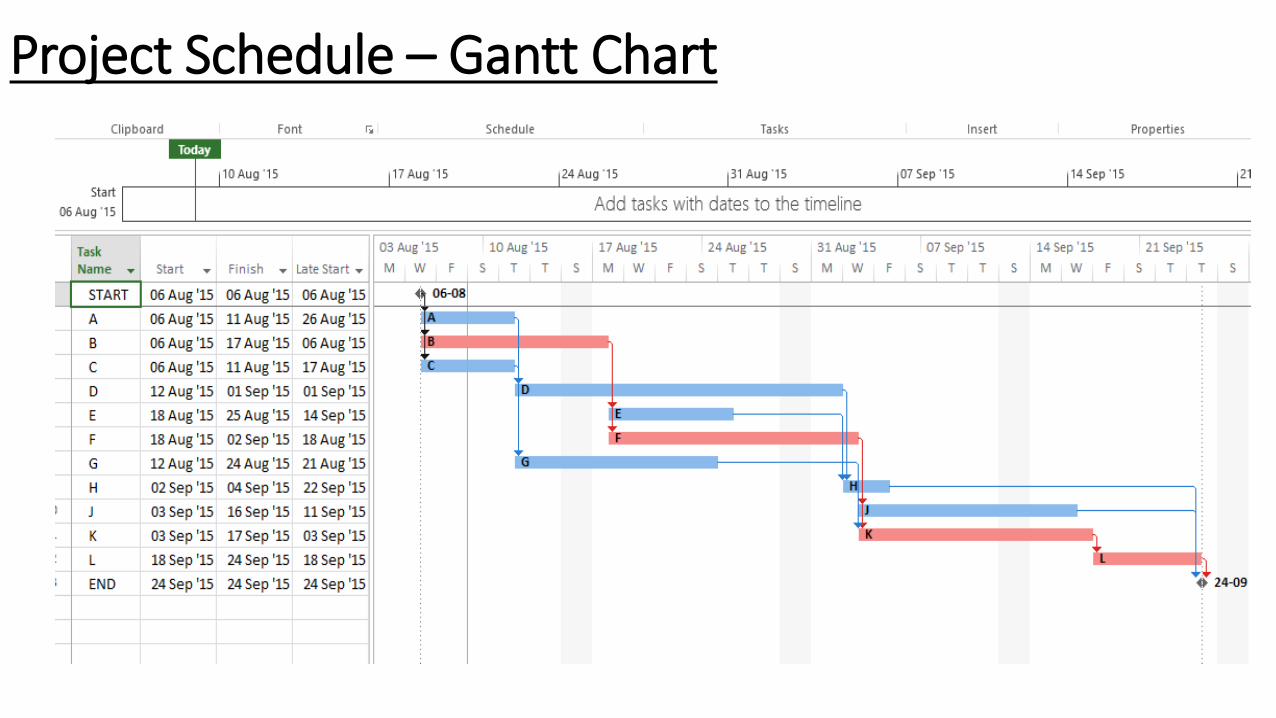
Project Schedule – Gantt Chart

Time Phased Budget (TPB)


DETAILED PROJECT REPORT
Project Plan in Executable Format
• Project Plan in Executable Format
Elaborate and Systemic adoption of Feasibility
report
• Elaborate and Systemic adoption of Feasibility report
A tool for implementation
• A tool for implementation
Involves in-depth planning and detailed examination of
all aspects
• Involves in-depth planning and detailed examination of all aspects
Preparation invariably the task of competent and
professional consultants
• Preparation invariably the task of competent and professional consultants

Project Summary
Justification, History and Related Works
Technical Plan
Management Plan
Risk Analysis & Contingency Plans
Procurement and Logistics Plan
Reliability and Quality Assurance Provisions
SUGGESTED PARTS OF DPR

Schedules
Resources Requirements
Financial Plan
Systems Plan
Environment, Safety & Health Protection Plan
SUGGESTED PARTS OF DPR
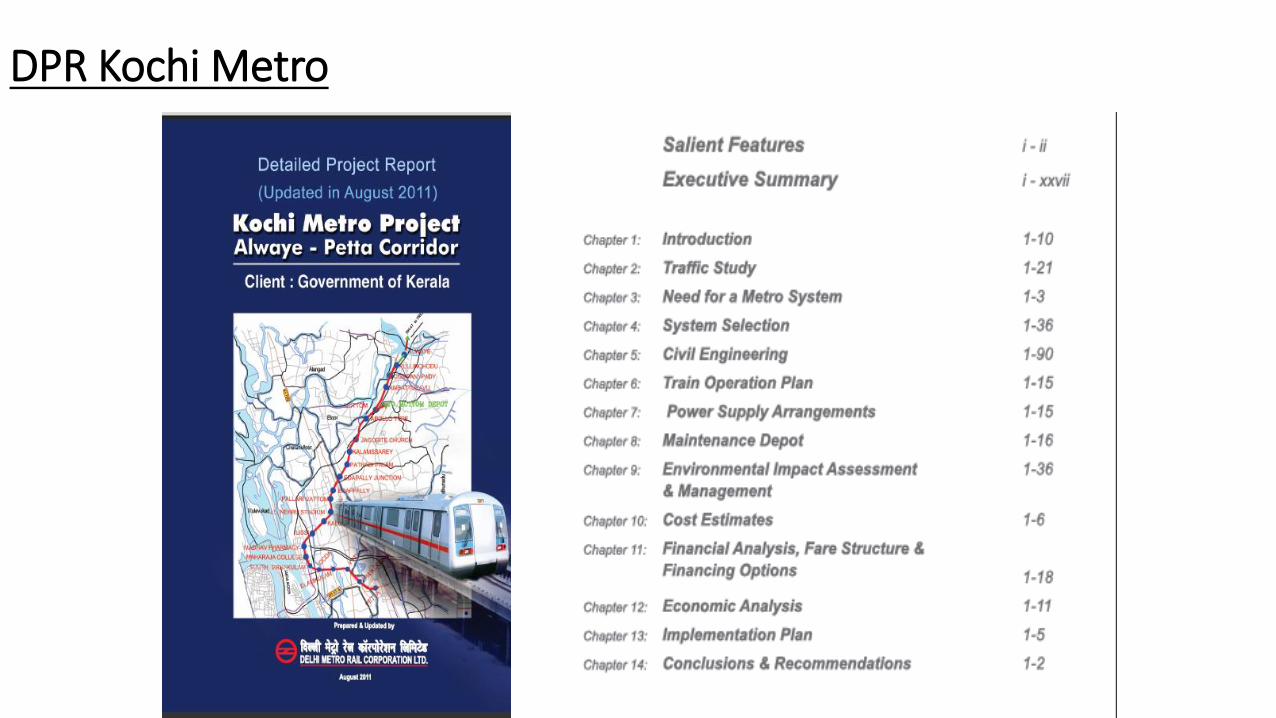
DPR Kochi Metro

PROJECT SCHEDULING USING NETWORKS
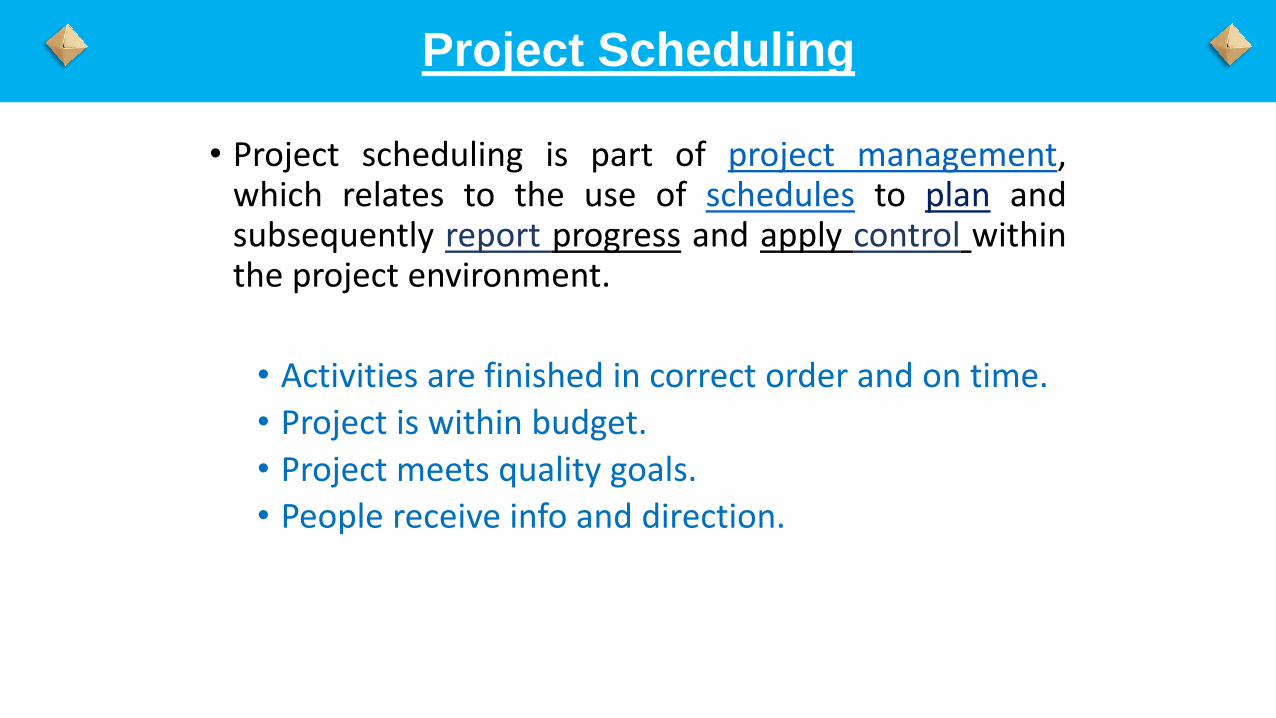
• Project scheduling is part of project management, which relates to the use of schedules to plan and subsequently report progress and apply control within the project environment.
• Activities are finished in correct order and on time.
• Project is within budget.
• Project meets quality goals.
• People receive info and direction.
Project Scheduling

The Flow Chart
Gantt Chart
The Milestone Chart
Networks
AOA
AON
Scheduling Tools and Techniques

Each uses a different estimate of activity times
Consider activity relationships and inter-dependencies
PERT by US Navy Special Office with Lockheed Martin and Booz, Allen & Hamilton - Polaris missile pgme (1958)
CPM by DuPont & Remington Rand Univac for chemical plants (1957)
For planning and control of projects
Network techniques developed in 1950’s
Evolution of Network Concept

Used for jobs that have some past experience
Like plant maint
/overhaul, building constr
Tasks with precedence -
where activity time estimates
can be predicted with considerable
certainty
Focus is on arriving at an
optimum project
schedule that minimises the
cost
Tasks where time estimates
are certain
DETERMINISTIC
Critical Path Method (CPM)

One-time unique tasks – construction of dams, refineries, bridges etc.
Tasks of huge proportion – construction / devp of ships / tanks / aircrafts
R&D projects –
development of radars / missiles/spl software
Organizing large events – conferences / rallies
Tasks where time
estimates tend to be quite
uncertain
PROBABILISTIC
Focus is on minimizing
time required at optimum
cost
Program Evaluation Review Technique (PERT)

• Identify all essential events / activities.
• Establish interrelationships to satisfy sequencing.
Drawing the network
• Time required for completing each activity.
• Determine project duration and critical activity.
• Compute the probability of completing the Project or part project in a given specified time.
Network Analysis
• Translate plan into a time schedule based on resources required.
• Examine economics (expedite the activities by incurring additional cost) before finalizing the schedule.
Resource Allocation and
Scheduling
• Periodic updating to monitor Project progress.
• Amending schedules to ensure timely completion. Project control
Stages in Application of PERT/CPM

Activities are linked together in the logical sequence they need to be carried out
Gives a clearer picture of the required sequence of events and activities
A simple concept to map and understand work flows of the project
Networks

Use the network to help plan, schedule, monitor, and control the project
Compute the longest time path through the network – ‘CRITICAL PATH’
Assign time & cost estimates to each activity
Draw the network connecting all activities
Develop relationships among the activities
Define the project and prepare the WBS...WCP
Steps in making networks

2 Types
Arrow Diagramming Method (ADM)
Activity on Arrow (AoA)
Precedence Diagramming Method (PDM)
Activity on Node (AoN)
Network Diagrams

AOA NETWORKS

Shows how tasks will flow from beginning to end
Depicts correct sequence of tasks & their relationships
Activity Activity Activity Event
ADM (AOA) Network Diagram

Representation
Activities – Arrows
Events – Circles (one activity to another)
Duration – along the Arrow
Also called Activity On Arrow
Can Show only Finish to Start relationships
ADM (AOA) Network Diagram

• Only one Start & one End Node.
• List Activities.
• Decide precedence relationships.
• Logic flow from left to right.
• No crossing of arrows/ loops, No danglers
• If Start of an activity is hanging, connect to ‘Start’ of the project.
• Finish of all the activities should be controlling some activity.
• If not, then connect to ‘Finish’ of the project.
General Rules of Drawing Network

• Project Data …. • A, B, C start the project
• D, G, E follow B
• F follows A, D
• H follows C, E
• J follows F
• K follows H
• L follows F, G
• J, L, K end the project
Draw an AoA
Network for
the Project
Lets Draw

Activity Dependency Remarks Duration
A - Starts Project 6
B - Starts Project 4
C - Starts Project 8
D Follows B - 8
E Follows B - 6
F Follows A & D - 2
G FollowsB - 10
H Follows C and E - 12
J After F Ends Project 8
K Follows H Ends Project 6
L >F and >G Ends Project 4
Tabulating Network Data

1 2
7
5
6 9
4
3
A D
G
Dx
E H
Dx
B
C
J
8 F
11 K
10
Dx
Dx
L
Too many cross overs … complex!
Possible AoA Network ……

Paths? 1. A-F-J
2. A-F-L
3. B-D-F-J
4. B-D-F-L
5. B-G-L
6. B-E-H-K
7. C-H-K
5 3
1 2
7
6 8
4
A
B
C
D
E
F
G
J
K
L
H
Dx
Lets Draw Simpler AoA Network ……
1 2
7
5
6 9
4
3
A D
G
Dx
E H
Dx
B
C
J
8 F
11 K
10
Dx
Dx
L

NETWORK ANALYSIS
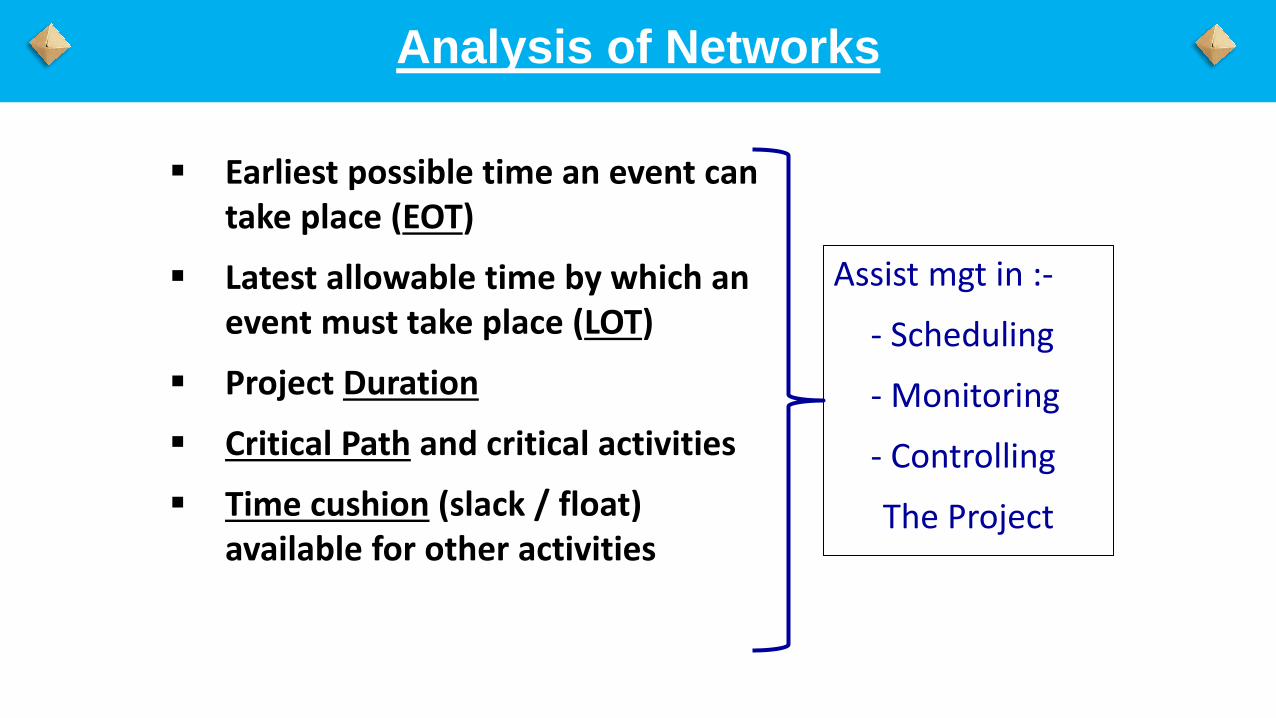
Earliest possible time an event can take place (EOT)
Latest allowable time by which an event must take place (LOT)
Project Duration
Critical Path and critical activities
Time cushion (slack / float) available for other activities
Assist mgt in :-
- Scheduling
- Monitoring
- Controlling
The Project
Analysis of Networks

Forward Pass Project Duration
Backward Pass Critical Path
Forward & Backward Pass Computation

Activity Dependency Remarks Duration
A - Starts Project 6
B - Starts Project 4
C - Starts Project 8
D Follows B - 8
E Follows B - 6
F Starts after A & D - 2
G Controlled by B - 10
H After C and E - 12
J After F Ends Project 8
K Follows H Ends Project 6
L >F and >G Ends Project 4
Tabulating Network Data

1 2
7
5
6 8
4
3
0 4
12
10
14
14
22
26
A
C
G
H
L
K
F J
B
D
E
6
4
8
8
10
2 8
12
6
4
6
12
6
22
20 26
EOT of Head Event= EOT of Tail Event + Duration
Rule
Merge Event
Take Largest EOT
Forward Pass

1 2
6
5
7 8
4
3
0 4
12
10
14
14
22
26
A
C
G
H
L
K
F J
B
D
E
6
4
8
8
10
2 8
12
6
4
6
26 20
18
22 10
16
4 0
18
20
8
10
Rule
Burst Event
Take Smallest LOT
4
LOT of Tail Event= LOT of Head Event - Duration
Backward Pass

• Event with same Earliest & Latest Occurrence Time (EOT = LOT)
Critical Event
• Path connecting critical events from start to end - Longest path. Critical Path
• All activities on the critical path. Critical
Activities
Critical Events, Path, Activities

1 2
6
5
7 8
4
3
0 4
12
10
14
14
22
26
A
C
G
H
K
L
F J
B
D
E
6
4
8
8
10
2 8
12
6
4
6
26 20
18
22 10
16
4 0
1 2
4 6
8
Project Duration = sum of durations of all activities on the Critical Path
Any delay in Critical Activity causes a delay in proj completion
Critical Path
1-2-4-6-8
B – E – H – L
Duration
4+6+12+4
= 26
Critical Events, Path, Activities

• Refer to the amount of time cushion, or scheduling flexibility, that is
associated with activities on the project schedule.
• Float may occur when there are two or more activities happening
concurrently.
• Utilisation
• To economize & consume resources efficiently.
• Appraise the effect of slippages.
Floats

1. Total Float
2. Free Float
Types of Float

8 25
10 28
3 4 12
8 28 12 16 20 24
Q P R
TF = LOThead – D – EOTtail Activity ‘Q’ Conducted
FF = EOThead – D – EOTtail Activity ‘Q’ Conducted
TF=8
FF=5
8
8
28
25
20
20
EOT EOT
LOT LOT

1 2
6
5
7 8
4
3
0 4
12
10
14
14
22
26
A
C
G
H
K
L
F J
B
D
E
6
4
8
8
10
2 8
12
6
4
6
26 20
18
22 10
16
4 0
1 2
4 6
8
Determine the Total, Free & Independent Floats in the Project Schedule
Floats – Lets Draw

1 2
6
5
7 8
4
3
0 4
12
10
14
14
22
26
A
C
G
H
K
L
F J
B
D
E
6
4
8
8
10
2 8
12
6
4
6
26 20
18
22 10
16
4 0
1 2
4 6
8
Float utilization – appraise the impact of slippages along a Path
TF 10
FF 6
TF 4
FF 0
TF 2
FF 2
TF 6
FF 0
TF 4
FF 4
TF 6
FF 6
Analyse Schedule Flexibility:Lets Draw
ACTIVITY ON NODE / PRECEDENCE DIAGRAMMING METHOD

AOA
AON Only
Activities.
No Events.
Start & End
Nodes.

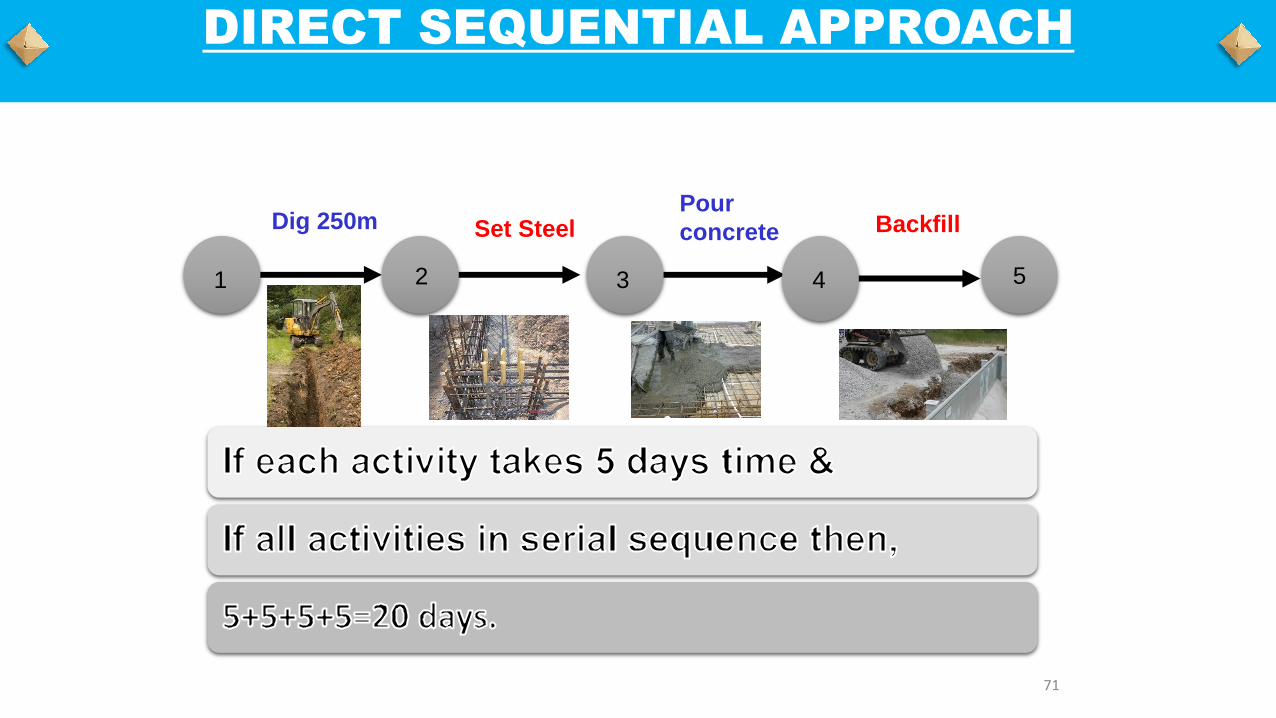
A 250 M long foundation needs to be build
CASTING A FOUNDATION
71
5
Dig 250m Set Steel Pour
concrete Backfill
1 2 3 4
DIRECT SEQUENTIAL APPROACH

• 1st day dig 50m only.
• 2nd day set steel for this 50m dug patch and continue digging
further for 2nd 50m patch only.
• 3rd day: -
• Pour concrete on the 1st 50m patch where steel has been set.
• Set steel on the 2nd day’s dug patch.
• Continue digging 3rd 50m patch.
• 4th day: -
• Backfill 1st 50m of completed patch.
• Pour concrete on the 2nd 50m patch where steel has been set.
• Set steel on 3rd days digging.
• Dig next 4th patch of 50m.
• Continue till job gets completed.
STAGGERED SEQUENTIAL APPROACH

Day 2 Day 5 Day 6 Day 7 Day 8
Day 1
Day 4 Day 3
20 ACTIVITIES, 21 EVENTS, 12 DUMMIES
50 m
50 m
50 m 50 m 50 m 50 m 50 m
50 m 50 m 50 m 50 m
50 m 50 m
50
m 50 m 50 m 50
m
50 m 50 m
50 m
AOA NETWORK

SS +1
DIG
SET STEEL
POUR
CONCRETE
BACKFILL
SS +1
SS +1
5 days
5 days
5 days
5 days
In AOA, precedence relationship- FS
NEW RELATION

PRECEDENCE RELATIONSHIPS

TASK A
TASK B
4 DAYS
TASK A
TASK B
2 DAYS
START TO START
ACTIVITY A STARTS AND
THEN ACTIVITY B STARTS
AFTER 2 DAYS
SASB = 2
FINISH TO FINISH
ACTIVITY A FINISHES AND
THEN ACTIVITY B FINISHES
AFTER 4 DAYS
FAFB = 4
PRECEDENCE RELATIONSHIP WITH LAG

TASK A
TASK B
8 DAYS
TASK A
TASK B
2 DAYS
START TO FINISH
ACTIVITY A STARTS AND
THEN ACTIVITY B
FINISHES AFTER 8 DAYS
SAFB = 8
FINISH TO START
ACTIVITY A FINISHES
AND THEN ACTIVITY B
STARTS AFTER 2 DAYS
FASB = 2
PRECEDENCE RELATIONSHIP WITH LAG

FINISH TO FINISH
ACTIVITY B
FINISHES 2 DAYS
BEFORE FINISH OF A
FAFB = -2
FINISH TO START
ACTIVITY B STARTS 4
DAYS BEFORE
FINISH OF A
FASB = -4
6 DAYS
6 DAYS
TASK A
TASK B
- 4
6 DAYS
3
DAYS
TASK A
TASK B - 2
PRECEDENCE RELATIONSHIP WITH LEAD

• Represents the amount of time an activity can be delayed without delaying the overall project duration
Total Float
(TF)
• Represents the amount of time that an activity can be delayed without delaying the Early Start Time of any immediate successor activity within the network path
Free Float
(FF)
TIME FEATURES OF ACTIVITIES IN AON

8 25
10 28
3 4 12
TF=8
25
FF=5
8 28 12 16 20 24
Q P R EST
LST
EFT
LFT
DURATION
EOT3
LOT3
EOT4
LOT4
AOA AON
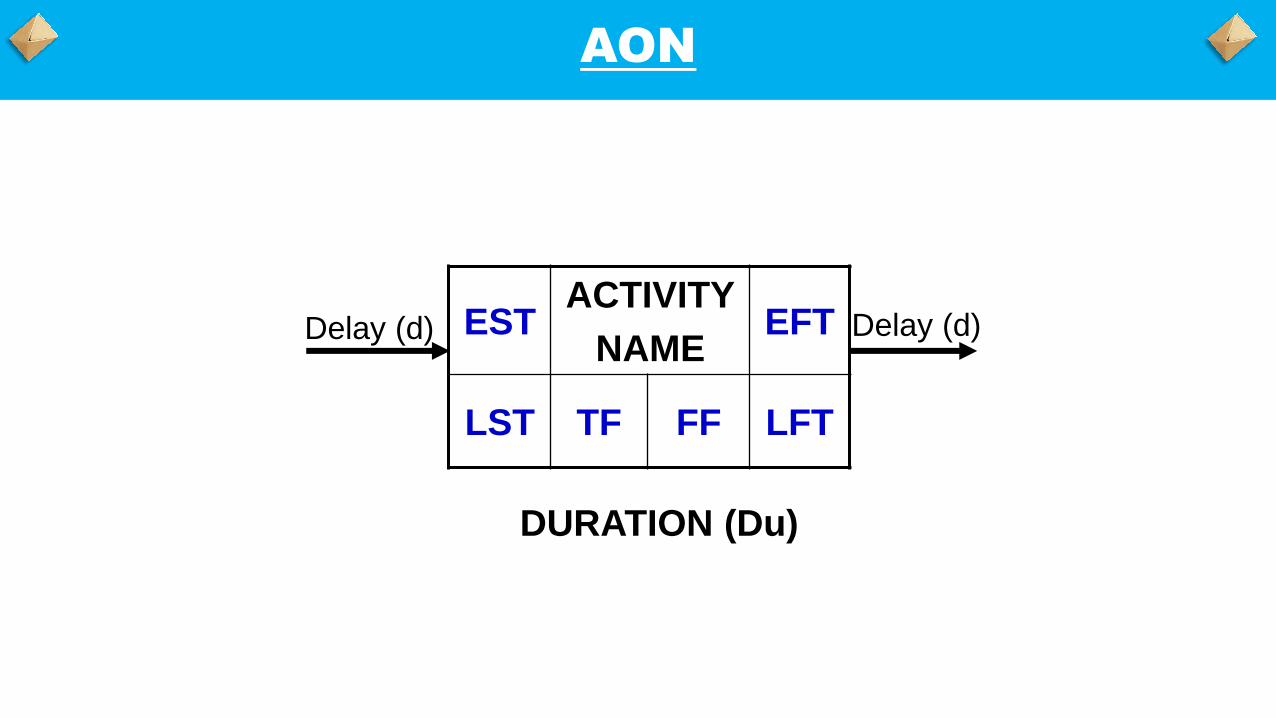
EST ACTIVITY
NAME EFT
LST TF FF LFT
DURATION (Du)
Delay (d) Delay (d)
AON

8 Q 25
10 8 5 28
12
AON

• Only one Start & one End Node.
• Logic flow from left to right.
• Avoid crossing of arrows.
• No danglers, No loops.
• If Start of an activity is hanging, connect to ‘Start’ of
the project.
• Finish of all the activities should be controlling
some activity. If not, then connect to the ‘Finish’ of the
project.
•Forward and Backward Pass
RULES – AON NETWORKS

• List of imp activities are: -
• (A) Leveling of Area Starts Project 02 wks.
• (B) Constr of B Wall & Gate ---do--- 24 wks.
• (C) Constr of R/W, Tarmac Starts 1wk after A 36 wks.
• (D) Constr of Hangar, ATC ---do--- 48 wks.
• (E) Fence and Watch Tower Follow B 06 wks.
• (F) Storm Water Drains Follow C 12 wks.
• (G) Runway Lights & Beacon Follow C & D 24 wks.
Finishes project
• (H) Security Lights & Alarm Contrl by E 06 wks.
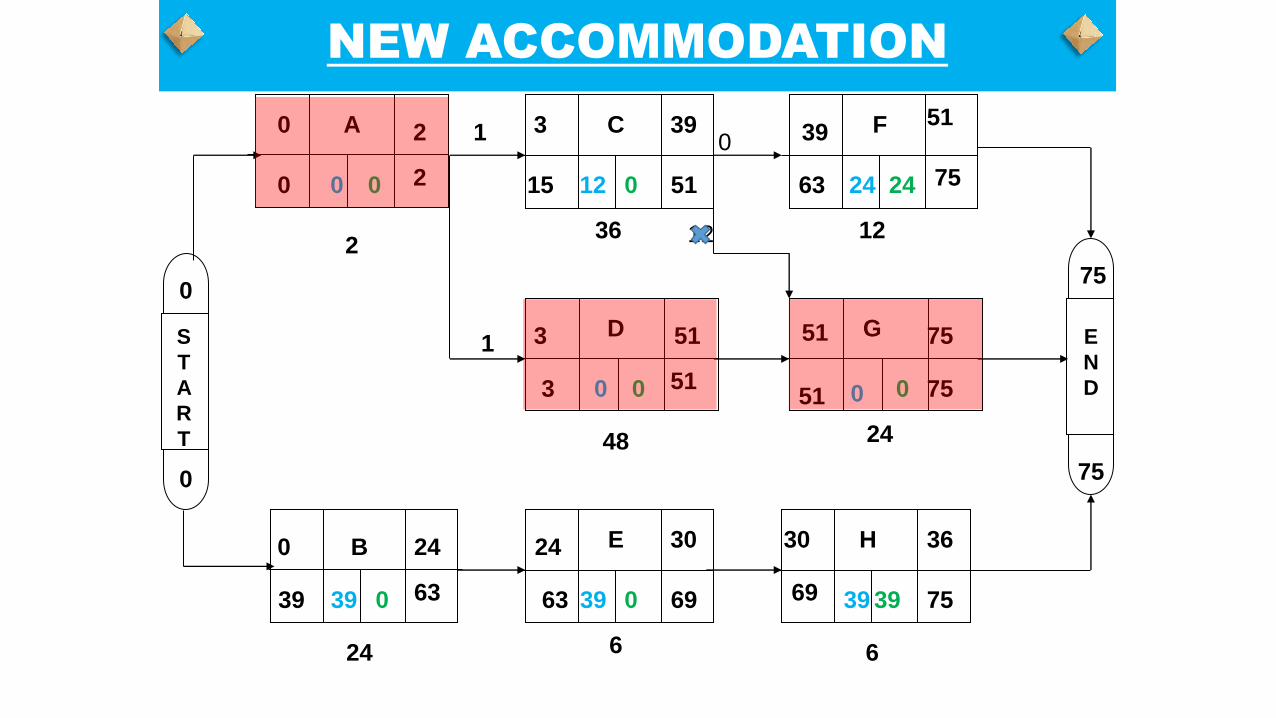
EX - NEW ACCOMMODATION

Sl
No
Activity Duration
(Wks)
Precedence Remarks
1 A 02 - Starts the project
2 B 24 - Starts the project
3 C 36 Start 1wk after A FASC =1
4 D 48 Start 1wk after A FASD =1
5 E 06 B FBSE =0
6 F 12 C FCSF =0
7 G 24 C & D FCSG=0, FDSG=0
8 H 06 E FESH=0
TABLE

S
T
A
R
T
A
B
C
D
E
F
G
H
E
N
D
2
24
36
48
6
12
24
6
1
1
NEW ACCOMMODATION

• Two parts to the analysis
• Forward Pass
• Calculates the DURATION of the Project
• Backward Pass
• Calculates the SLACK / FLOAT for each task
• Shows the CRITICAL PATH
NETWORK ANALYSIS

S
T
A
R
T
A
B
C
D
E
F
G
H
E
N
D
2
24
36
48
6
12
24
6
1
1
0
0 2 3
3
39
51
0 24 24 30
39
39 51
51 51
30
75
36
75
51
75
36
NEW ACCOMMODATION

S
T
A
R
T
A
B
C
D
E
F
G
H
E
N
D
2
24
36
48
6
12
24
6
1
1
0
0 2 3
3
39
51
0 24 24 30
39 51
51
30
75
36
75
75
75
75
75
69
51
63
69 63
51 3
51
63
51 15
2
14 2 0
63 39
0
NEW ACCOMMODATION

STARTING TOTAL FLOAT = LST-EST
FINISHING TOTAL FLOAT = LFT-EFT
EST ACTIVITY EFT
LST TF FF LFT
Du
d d
CALCULATION OF TOTAL FLOATS

ESTB – de – ESTA
EFTB –de – EFTA
ESTB – de – EFTA
EFTB –de – ESTA
A B
A B
A B
A B
de
de
de
de
1.
2.
3.
4.
CALCULATION OF FREE FLOATS
S
T
A
R
T
A
B
C
D
E
F
G
H
E
N
D
2
24
36
48
6
12
24
6
1
1
0
0 2 3
3
39
51
39 51
51 75
75
0 24 24 30 30 36
75
75 51 51 3
2 0 75 63 51 15
75 69 69 63 63 39
0
0 0 12 0 24 24
0 0 0 0
39 0 39 0 39 39
12
0
NEW ACCOMMODATION

ADVANTAGES OF AON OVER AOA