Embed Size (px)
Citation preview
TCM Substitution
Preliminary Air Emission Reduction Analysis
December 2, 2014
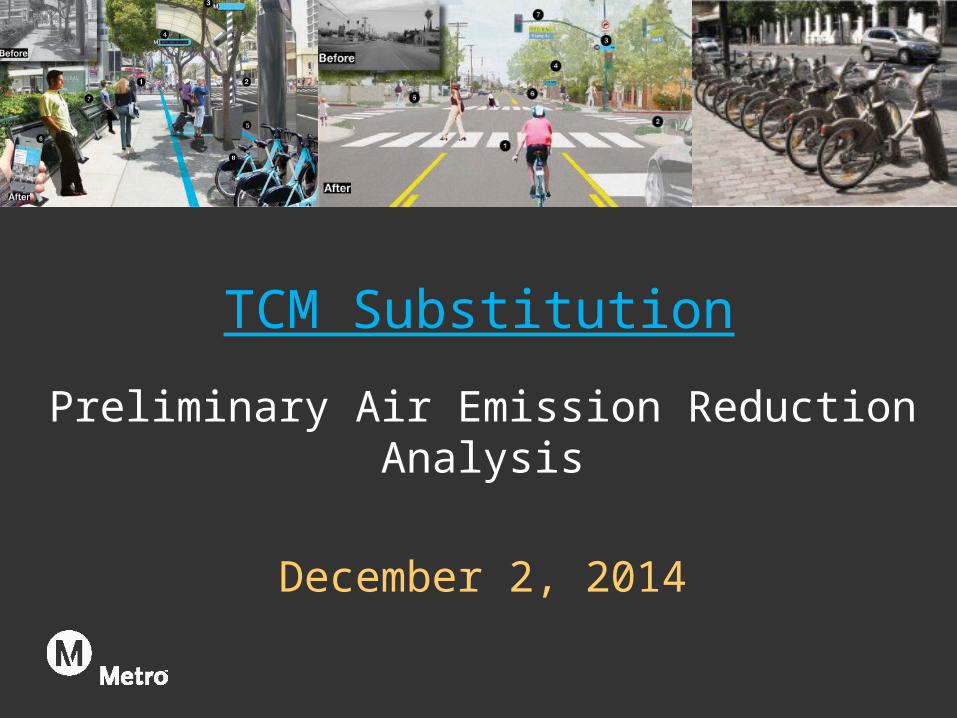
• Project LAE0332: Long Beach Park and Ride Lot Facility needs to be replaced– Total number of Parking Spaces: 400
• Metro is considering the substitution of LAE0332 with following seven (7) projects– Two (2) PRL projects: LAF1414, LA0G598
– Five (5) Class I & Class II bike path/lane projects: LAF3515, LAF5514, LAF5518, LAF5627, LAEG1130
– Total number of Parking Spaces: 162
– Total length of Bike path/lane: 10 miles
Introduction
Project Details
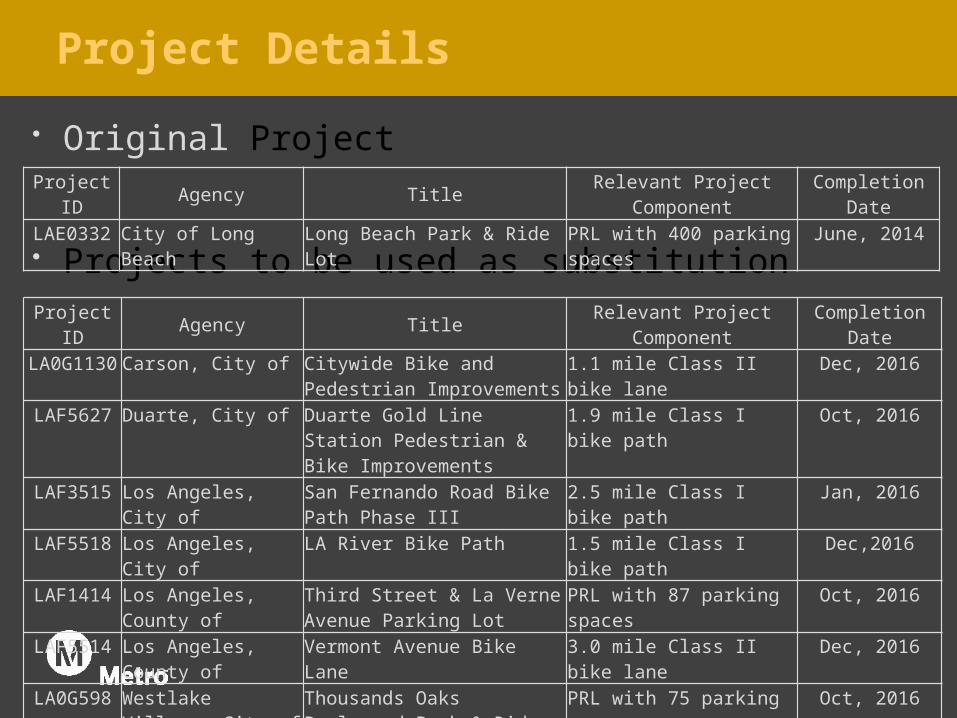
• Original Project
• Projects to be used as substitution
Project ID Agency Title Relevant Project Component Completion DateLAE0332 City of Long Beach Long Beach Park & Ride Lot PRL with 400 parking spaces June, 2014
Project ID Agency Title Relevant Project Component Completion DateLA0G1130 Carson, City of Citywide Bike and Pedestrian
Improvements1.1 mile Class II bike lane Dec, 2016
LAF5627 Duarte, City of Duarte Gold Line Station Pedestrian & Bike Improvements
1.9 mile Class I bike path Oct, 2016
LAF3515 Los Angeles, City of San Fernando Road Bike Path Phase III
2.5 mile Class I bike path Jan, 2016
LAF5518 Los Angeles, City of LA River Bike Path 1.5 mile Class I bike path Dec,2016LAF1414 Los Angeles, County of Third Street & La Verne Avenue
Parking LotPRL with 87 parking spaces Oct, 2016
LAF5514 Los Angeles, County of Vermont Avenue Bike Lane 3.0 mile Class II bike lane Dec, 2016LA0G598 Westlake Village, City
ofThousands Oaks Boulevard Park & Ride Facility
PRL with 75 parking spaces Oct, 2016
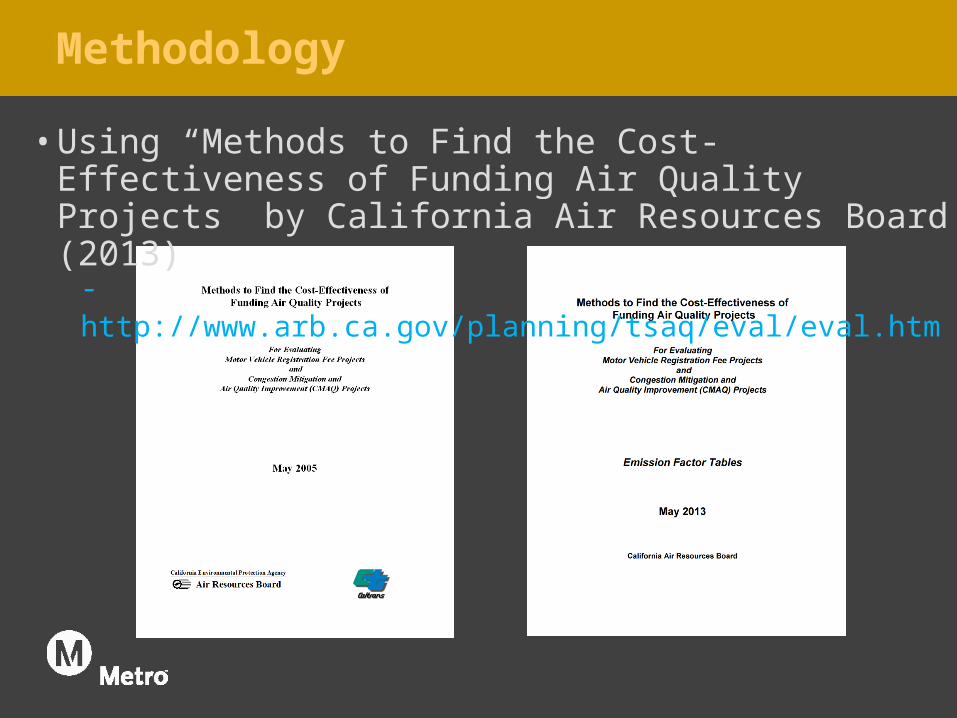
Methodology
• Using “Methods to Find the Cost-Effectiveness of Funding Air Quality Projects” by California Air Resources Board (2013)
- http://www.arb.ca.gov/planning/tsaq/eval/eval.htm
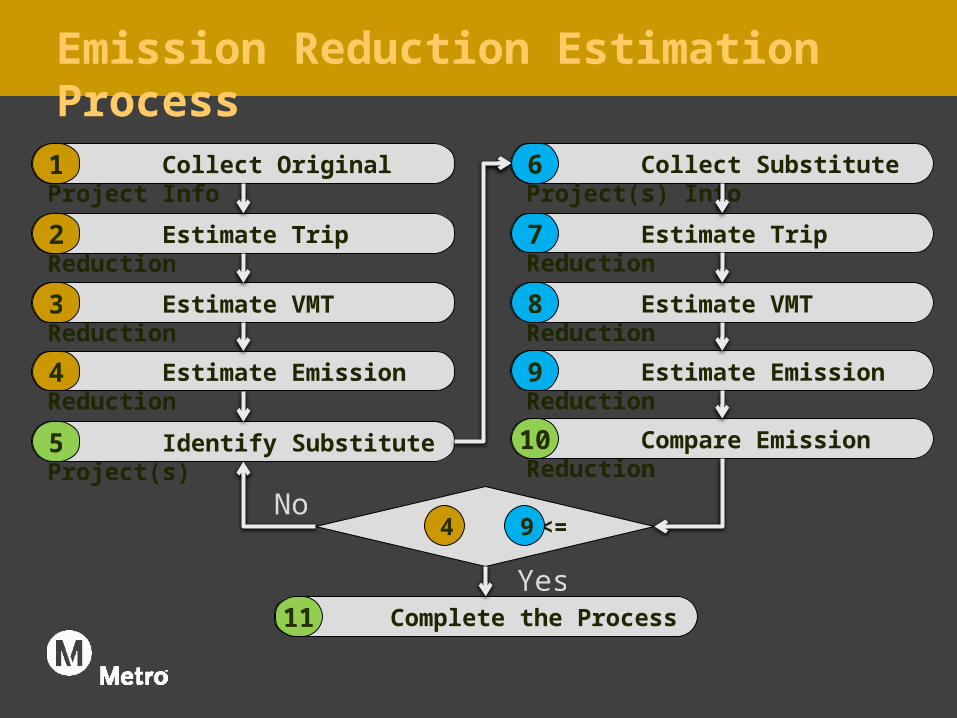
Emission Reduction Estimation Process
Collect Original Project Info1
<= 94
Estimate Trip Reduction2
Estimate VMT Reduction3
Estimate Emission Reduction4
Collect Substitute Project(s) Info6
Estimate Trip Reduction7
Estimate VMT Reduction8
Estimate Emission Reduction9
Identify Substitute Project(s)5 Compare Emission Reduction10
Complete the Process11Yes
No
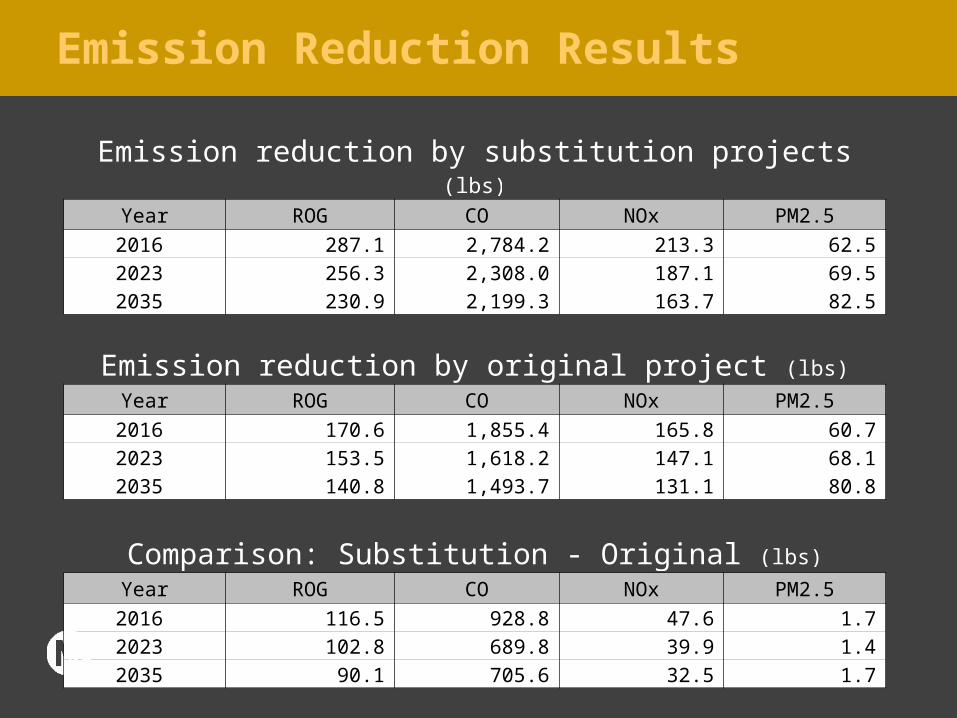
Emission Reduction Results
Emission reduction by substitution projects (lbs)Year ROG CO NOx PM2.5
2016 287.1 2,784.2 213.3 62.52023 256.3 2,308.0 187.1 69.52035 230.9 2,199.3 163.7 82.5
Emission reduction by original project (lbs)Year ROG CO NOx PM2.5
2016 170.6 1,855.4 165.8 60.72023 153.5 1,618.2 147.1 68.12035 140.8 1,493.7 131.1 80.8
Comparison: Substitution - Original (lbs)Year ROG CO NOx PM2.5
2016 116.5 928.8 47.6 1.72023 102.8 689.8 39.9 1.42035 90.1 705.6 32.5 1.7
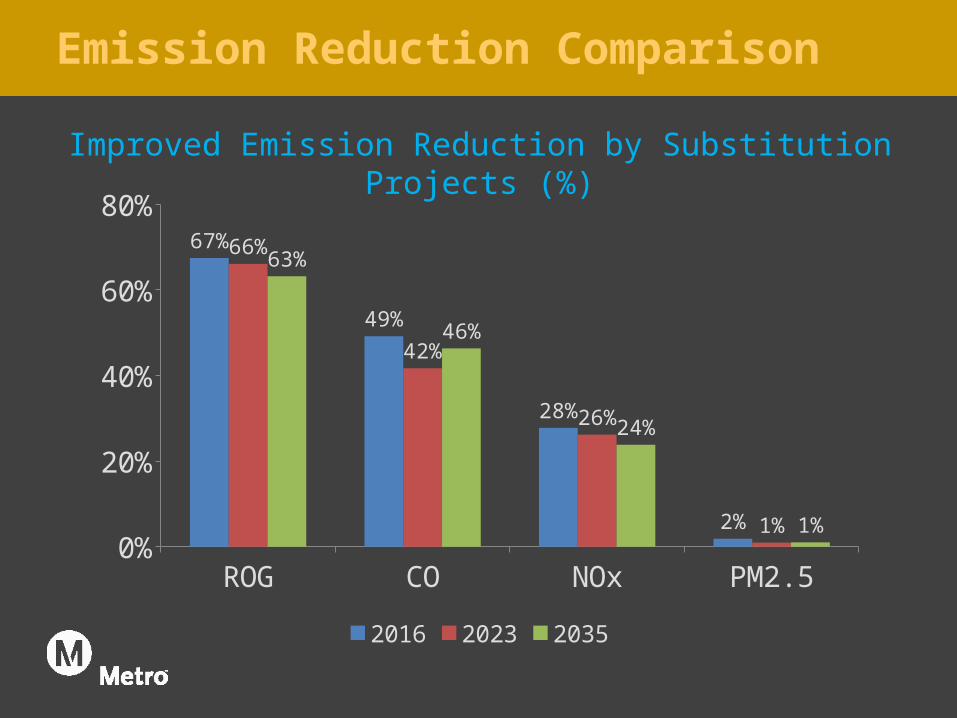
Improved Emission Reduction by Substitution Projects (%)
Emission Reduction Comparison
ROG CO NOx PM2.50%
20%
40%
60%
80%67%
49%
28%
2%
66%
42%
26%
1%
63%
46%
24%
1%
2016 2023 2035
Next Steps
• Collect comments from TCWG meeting
• Incorporate comments into the emission reduction analysis
• Prepare TCM Substitution Report
• TCM Substitution Request