Embed Size (px)
Citation preview
Financial Results
Q3 FY16
6 February 2016
Agenda
Key performance highlights
Jet Airways performance highlights
JetLite performance highlights
2
Key highlights
Highest ever quarterly and period profit
Jet Group’s domestic pax grew by 24.4% in 9MFY16 outpacing the industry pax growth of 20.2%
737 utilization at 13+ hours – amongst the highest in the world
Higher aircraft utilization has resulted in additional capacity equivalent of nine 737 aircraft without any addition to the fleet
Jet Airways, together with Etihad Airways, now has the largest market share in Indian international traffic
Many of the firsts in Indian aviation industry:
– Fare Lock: Value proposition to guests
– Best Price Promise
– IFE streaming
3
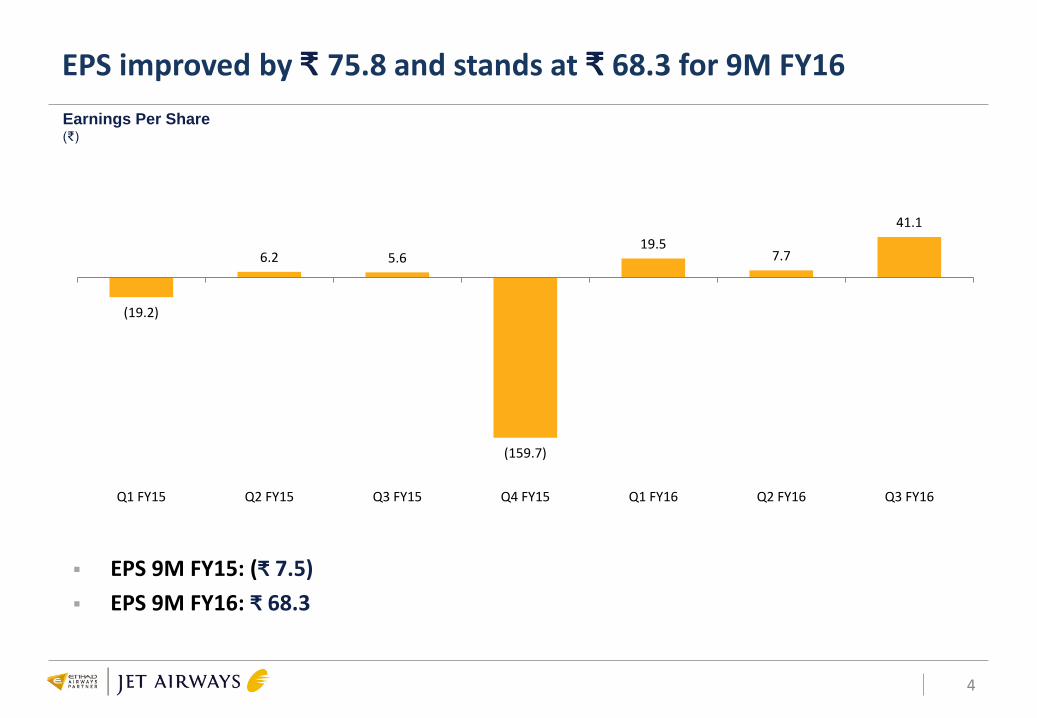
EPS improved by ₹ 75.8 and stands at ₹ 68.3 for 9M FY16
4
Earnings Per Share (₹)
(19.2)
6.2 5.6
(159.7)
19.5 7.7
41.1
Q1 FY15 Q2 FY15 Q3 FY15 Q4 FY15 Q1 FY16 Q2 FY16 Q3 FY16
EPS 9M FY15: (₹ 7.5)
EPS 9M FY16: ₹ 68.3
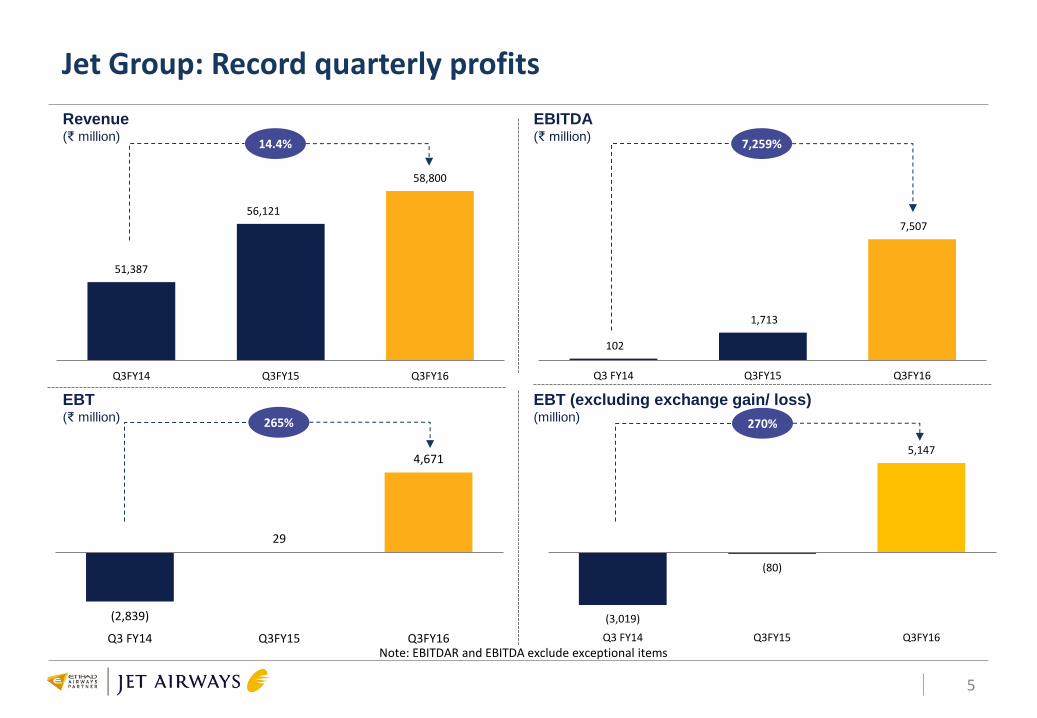
(3,019)
(80)
5,147
Q3 FY14 Q3FY15 Q3FY16
51,387
56,121
58,800
Q3FY14 Q3FY15 Q3FY16
102
1,713
7,507
Q3 FY14 Q3FY15 Q3FY16
(2,839)
29
4,671
Q3 FY14 Q3FY15 Q3FY16
Jet Group: Record quarterly profits
5
Revenue (₹ million)
EBITDA (₹ million)
EBT (₹ million)
EBT (excluding exchange gain/ loss) (million) 265%
14.4%
Note: EBITDAR and EBITDA exclude exceptional items
270%
7,259%
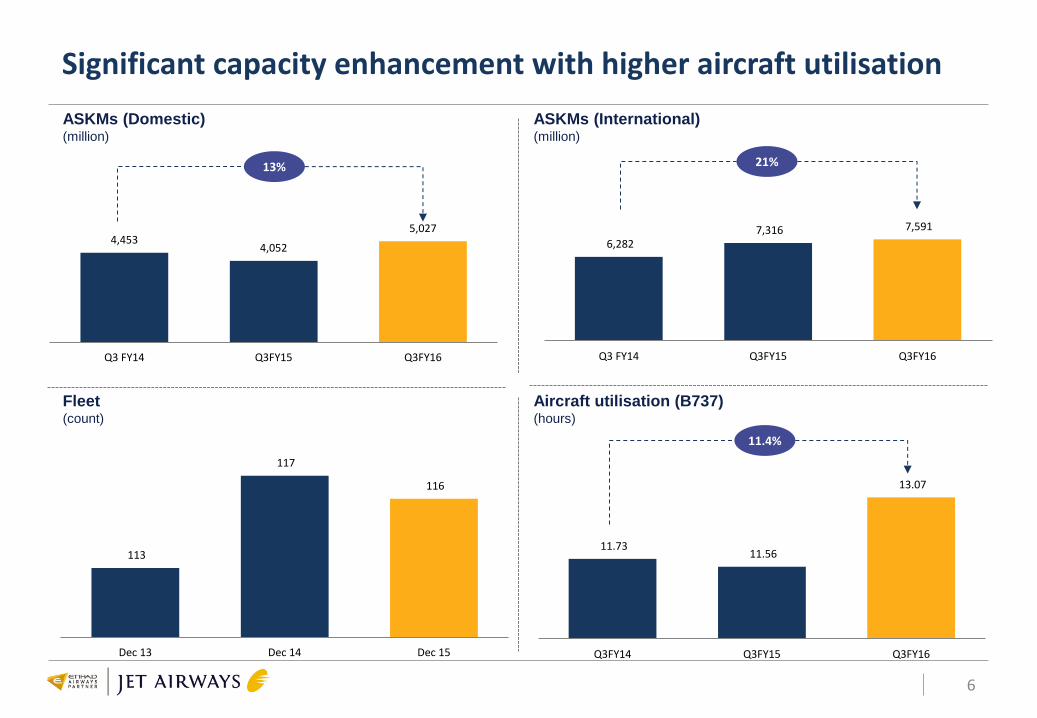
4,453 4,052
5,027
Q3 FY14 Q3FY15 Q3FY16
Significant capacity enhancement with higher aircraft utilisation
6
ASKMs (Domestic) (million)
ASKMs (International) (million)
Fleet (count)
Aircraft utilisation (B737) (hours)
6,282 7,316 7,591
Q3 FY14 Q3FY15 Q3FY16
13% 21%
113
117
116
Dec 13 Dec 14 Dec 15
11.4%
11.73 11.56
13.07
Q3FY14 Q3FY15 Q3FY16
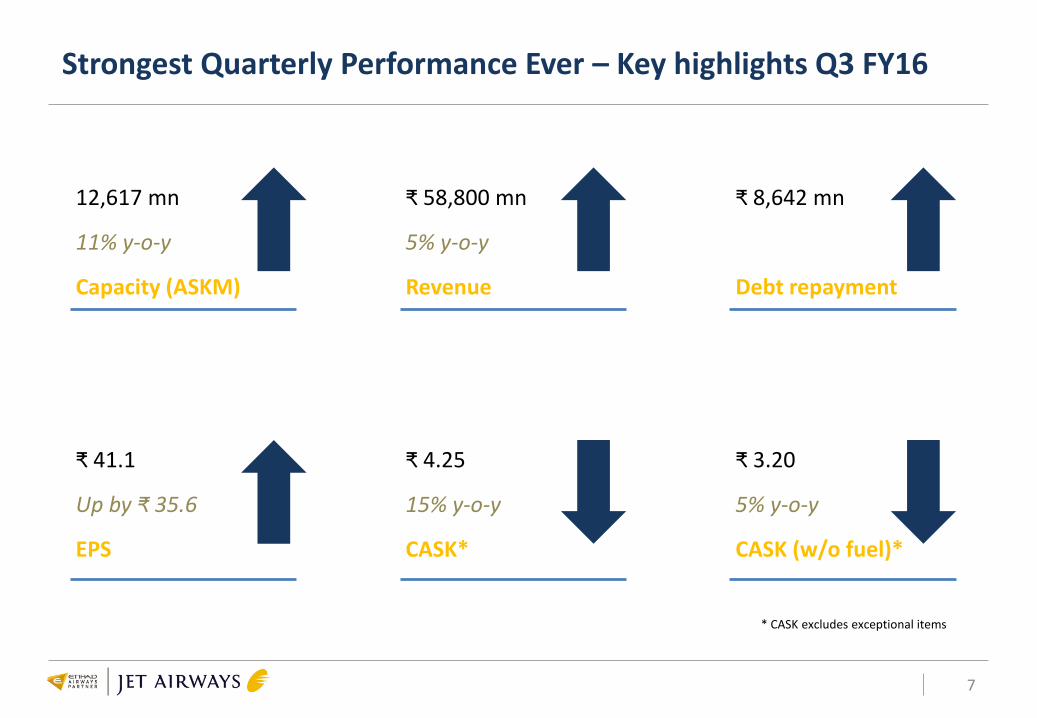
Strongest Quarterly Performance Ever – Key highlights Q3 FY16
7
12,617 mn
11% y-o-y
Capacity (ASKM)
₹ 58,800 mn
5% y-o-y
Revenue
₹ 8,642 mn
Debt repayment
₹ 41.1
Up by ₹ 35.6
EPS
₹ 4.25
15% y-o-y
CASK*
₹ 3.20
5% y-o-y
CASK (w/o fuel)*
* CASK excludes exceptional items
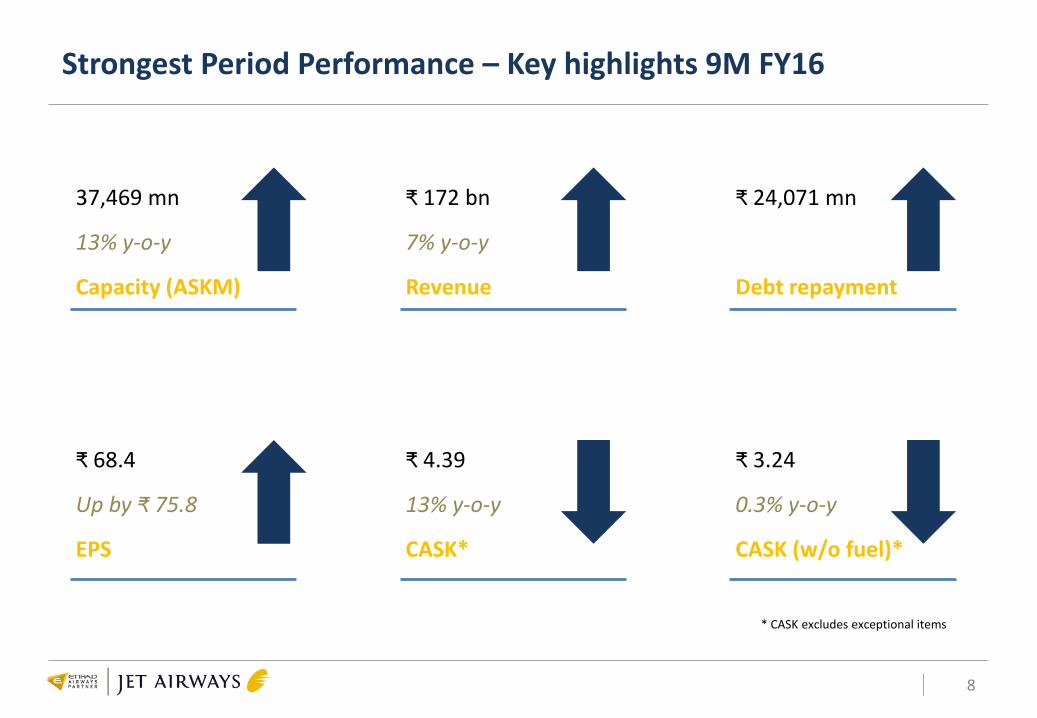
Strongest Period Performance – Key highlights 9M FY16
8
37,469 mn
13% y-o-y
Capacity (ASKM)
₹ 172 bn
7% y-o-y
Revenue
₹ 24,071 mn
Debt repayment
₹ 68.4
Up by ₹ 75.8
EPS
₹ 4.39
13% y-o-y
CASK*
₹ 3.24
0.3% y-o-y
CASK (w/o fuel)*
* CASK excludes exceptional items
9
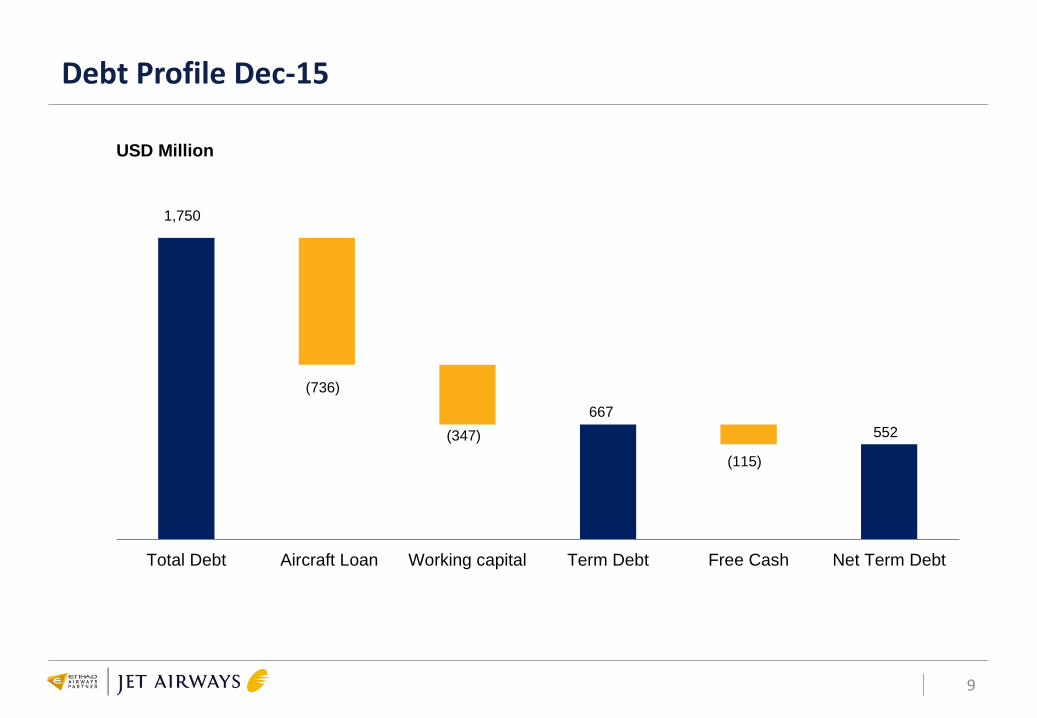
1,750
(736)
(347)
667
(115)
552
Total Debt Aircraft Loan Working capital Term Debt Free Cash Net Term Debt
USD Million
Debt Profile Dec-15
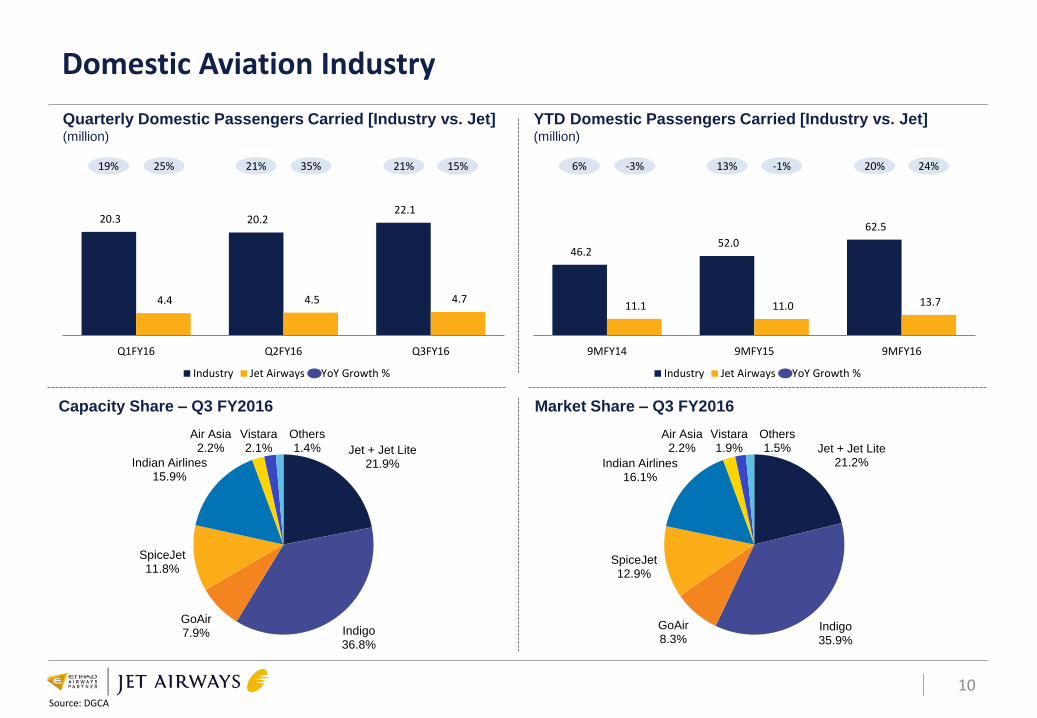
Domestic Aviation Industry
10
Jet + Jet Lite 21.2%
Indigo 35.9%
GoAir 8.3%
SpiceJet 12.9%
Indian Airlines 16.1%
Air Asia 2.2%
Vistara 1.9%
Others 1.5%
Quarterly Domestic Passengers Carried [Industry vs. Jet] (million)
20.3 20.2 22.1
4.4 4.5 4.7
Q1FY16 Q2FY16 Q3FY16
Industry Jet Airways YoY Growth %
Market Share – Q3 FY2016
Source: DGCA
19% 25% 21% 35% 21% 15%
YTD Domestic Passengers Carried [Industry vs. Jet] (million)
46.2 52.0
62.5
11.1 11.0 13.7
9MFY14 9MFY15 9MFY16
Industry Jet Airways YoY Growth %
6% -3% 13% -1% 20% 24%
Jet + Jet Lite 21.9%
Indigo 36.8%
GoAir 7.9%
SpiceJet 11.8%
Indian Airlines 15.9%
Air Asia 2.2%
Vistara 2.1%
Others 1.4%
Capacity Share – Q3 FY2016
JET GROUP - PERFORMANCE HIGHLIGHTS
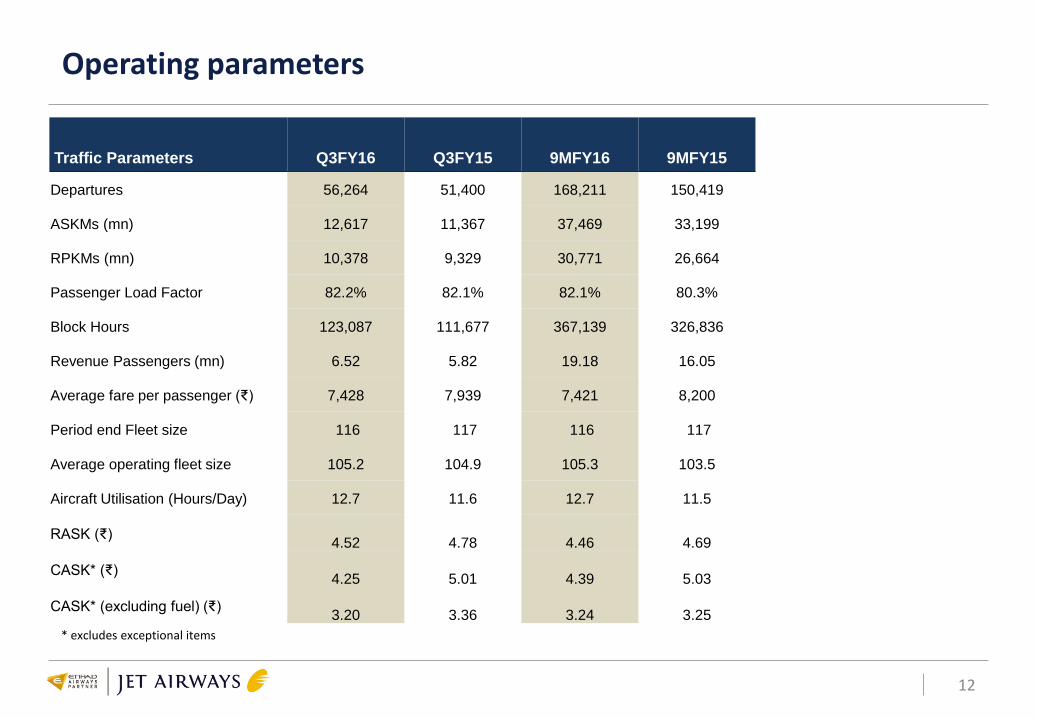
Operating parameters
12
Traffic Parameters Q3FY16 Q3FY15 9MFY16 9MFY15
Departures 56,264 51,400 168,211 150,419
ASKMs (mn) 12,617 11,367 37,469 33,199
RPKMs (mn) 10,378 9,329 30,771 26,664
Passenger Load Factor 82.2% 82.1% 82.1% 80.3%
Block Hours 123,087 111,677 367,139 326,836
Revenue Passengers (mn) 6.52 5.82 19.18 16.05
Average fare per passenger (₹) 7,428 7,939 7,421 8,200
Period end Fleet size 116 117 116 117
Average operating fleet size 105.2 104.9 105.3 103.5
Aircraft Utilisation (Hours/Day) 12.7 11.6 12.7 11.5
RASK (₹)
4.52
4.78
4.46
4.69
CASK* (₹)
4.25
5.01
4.39
5.03
CASK* (excluding fuel) (₹)
3.20
3.36
3.24
3.25
* excludes exceptional items
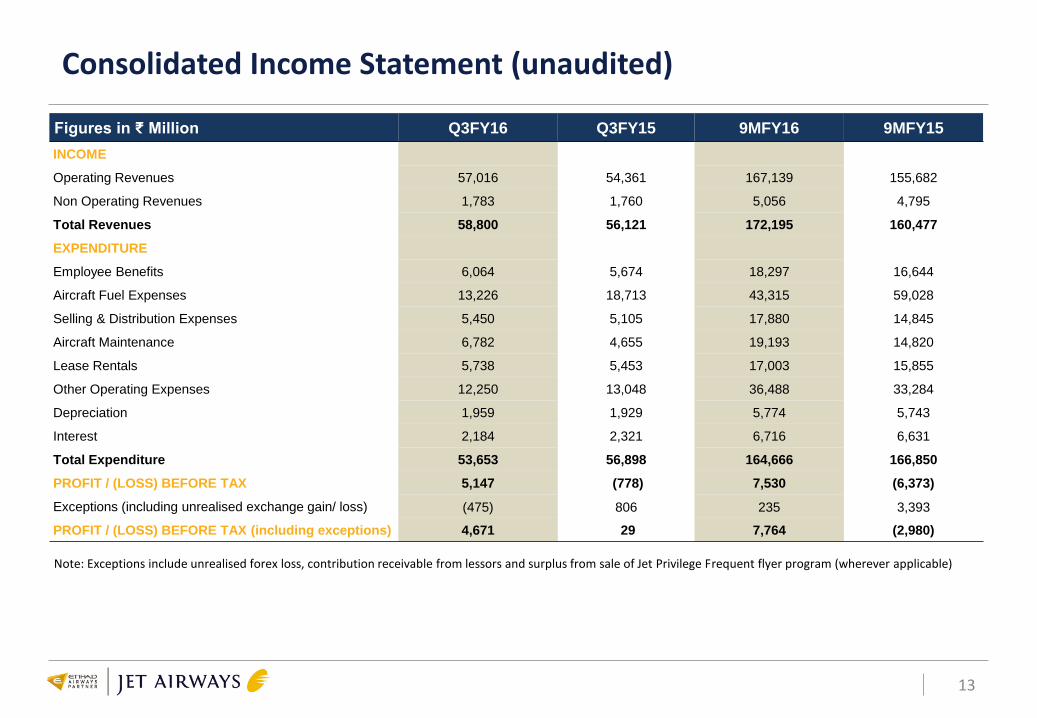
Consolidated Income Statement (unaudited)
13
Figures in ₹ Million Q3FY16 Q3FY15 9MFY16 9MFY15
INCOME
Operating Revenues 57,016 54,361 167,139 155,682
Non Operating Revenues 1,783 1,760 5,056 4,795
Total Revenues 58,800 56,121 172,195 160,477
EXPENDITURE
Employee Benefits 6,064 5,674 18,297 16,644
Aircraft Fuel Expenses 13,226 18,713 43,315 59,028
Selling & Distribution Expenses 5,450 5,105 17,880 14,845
Aircraft Maintenance 6,782 4,655 19,193 14,820
Lease Rentals 5,738 5,453 17,003 15,855
Other Operating Expenses 12,250 13,048 36,488 33,284
Depreciation 1,959 1,929 5,774 5,743
Interest 2,184 2,321 6,716 6,631
Total Expenditure 53,653 56,898 164,666 166,850
PROFIT / (LOSS) BEFORE TAX 5,147 (778) 7,530 (6,373)
Exceptions (including unrealised exchange gain/ loss) (475) 806 235 3,393
PROFIT / (LOSS) BEFORE TAX (including exceptions) 4,671 29 7,764 (2,980)
Note: Exceptions include unrealised forex loss, contribution receivable from lessors and surplus from sale of Jet Privilege Frequent flyer program (wherever applicable)
JET AIRWAYS - STANDALONE PERFORMANCE HIGHLIGHTS
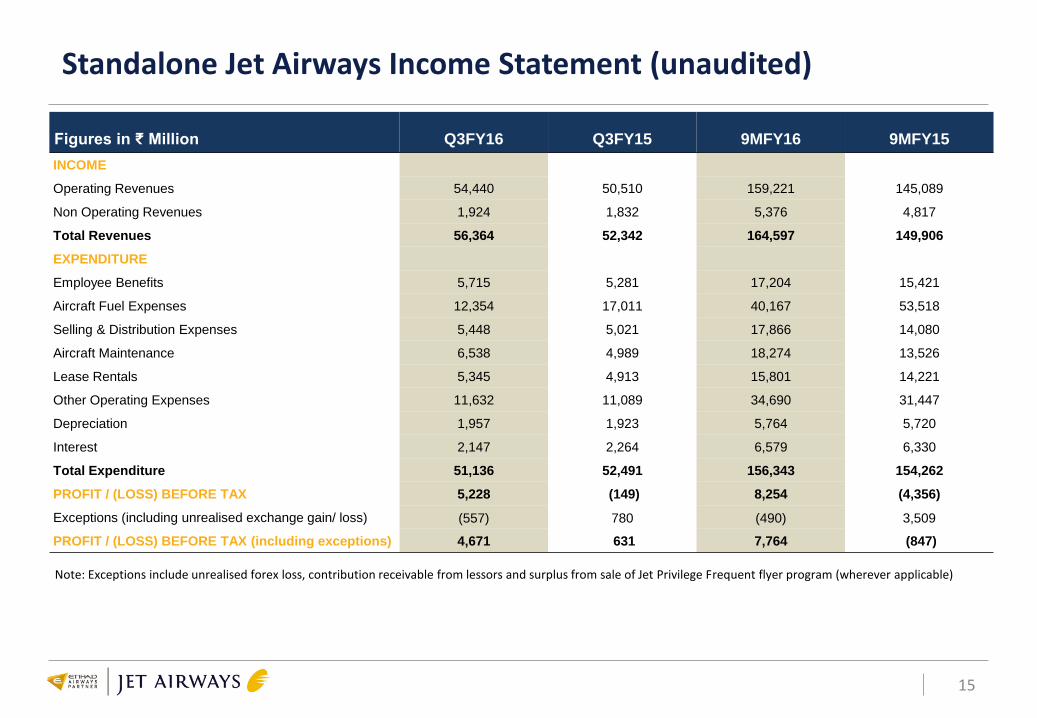
Standalone Jet Airways Income Statement (unaudited)
15
Figures in ₹ Million Q3FY16 Q3FY15 9MFY16 9MFY15
INCOME
Operating Revenues 54,440 50,510 159,221 145,089
Non Operating Revenues 1,924 1,832 5,376 4,817
Total Revenues 56,364 52,342 164,597 149,906
EXPENDITURE
Employee Benefits 5,715 5,281 17,204 15,421
Aircraft Fuel Expenses 12,354 17,011 40,167 53,518
Selling & Distribution Expenses 5,448 5,021 17,866 14,080
Aircraft Maintenance 6,538 4,989 18,274 13,526
Lease Rentals 5,345 4,913 15,801 14,221
Other Operating Expenses 11,632 11,089 34,690 31,447
Depreciation 1,957 1,923 5,764 5,720
Interest 2,147 2,264 6,579 6,330
Total Expenditure 51,136 52,491 156,343 154,262
PROFIT / (LOSS) BEFORE TAX 5,228 (149) 8,254 (4,356)
Exceptions (including unrealised exchange gain/ loss) (557) 780 (490) 3,509
PROFIT / (LOSS) BEFORE TAX (including exceptions) 4,671 631 7,764 (847)
Note: Exceptions include unrealised forex loss, contribution receivable from lessors and surplus from sale of Jet Privilege Frequent flyer program (wherever applicable)
JETLITE (INDIA) LIMITED PERFORMANCE HIGHLIGHTS
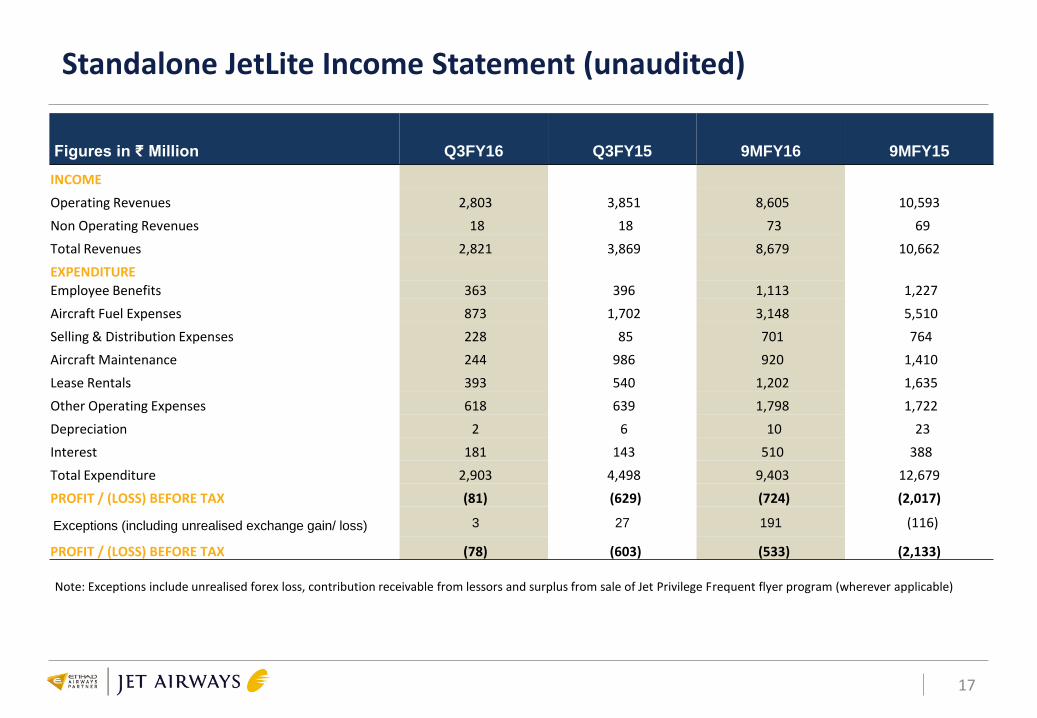
Standalone JetLite Income Statement (unaudited)
17
Figures in ₹ Million Q3FY16 Q3FY15 9MFY16 9MFY15
INCOME
Operating Revenues 2,803 3,851 8,605 10,593
Non Operating Revenues 18 18 73 69
Total Revenues 2,821 3,869 8,679 10,662
EXPENDITURE
Employee Benefits 363 396 1,113 1,227
Aircraft Fuel Expenses 873 1,702 3,148 5,510
Selling & Distribution Expenses 228 85 701 764
Aircraft Maintenance 244 986 920 1,410
Lease Rentals 393 540 1,202 1,635
Other Operating Expenses 618 639 1,798 1,722
Depreciation 2 6 10 23
Interest 181 143 510 388
Total Expenditure 2,903 4,498 9,403 12,679
PROFIT / (LOSS) BEFORE TAX (81) (629) (724) (2,017)
Exceptions (including unrealised exchange gain/ loss) 3 27 191 (116)
PROFIT / (LOSS) BEFORE TAX (78) (603) (533) (2,133)
Note: Exceptions include unrealised forex loss, contribution receivable from lessors and surplus from sale of Jet Privilege Frequent flyer program (wherever applicable)

Many of the firsts in Indian aviation industry
18
BEST PRICE PROMISE
FARE LOCK MOBILE
BOARDING PASS APPLE WATCH
APP IFE
STREAMING #JETINSTANT
Revenue opportunities: Best Price Promise , Fare Lock
Enhanced guest experience: Mobile boarding pass, IFE streaming, mobile POS collection of excess baggage charges in Mumbai and Delhi
Connected traveler: Apple watch app, #Jetinstant
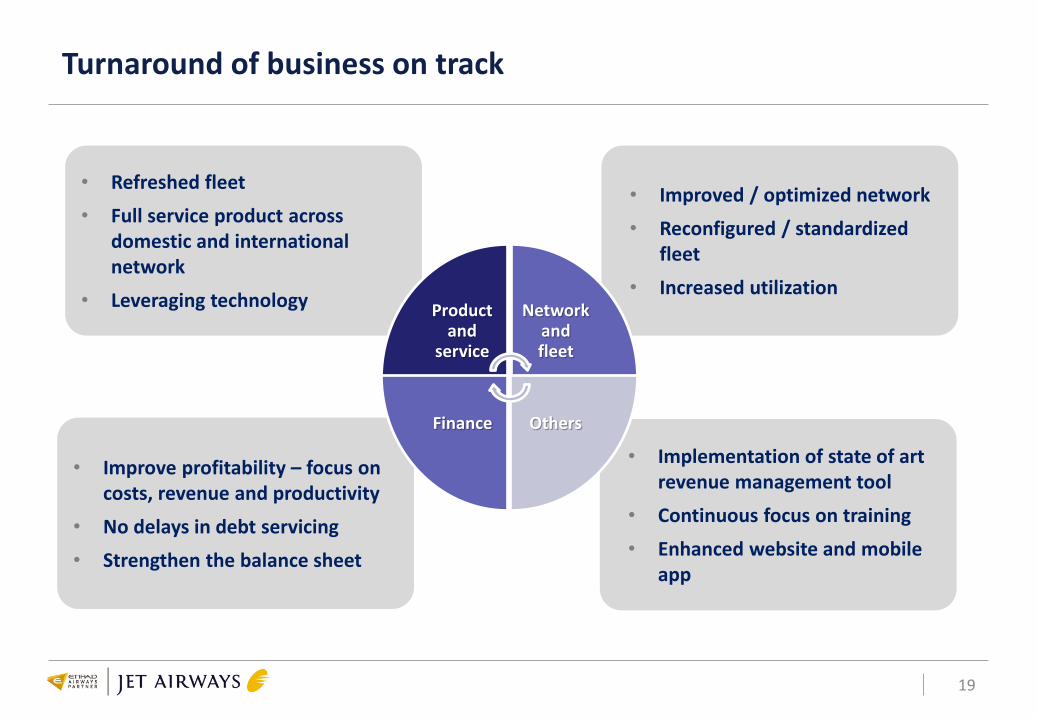
Turnaround of business on track
19
• Implementation of state of art revenue management tool
• Continuous focus on training
• Enhanced website and mobile app
• Improve profitability – focus on costs, revenue and productivity
• No delays in debt servicing
• Strengthen the balance sheet
• Refreshed fleet
• Full service product across domestic and international network
• Leveraging technology
• Improved / optimized network
• Reconfigured / standardized fleet
• Increased utilization Product
and service
Network and fleet
Others Finance
20
Thank You!
Disclaimer
21
Certain statements in this release concerning Jet Airways’ future growth prospects are forward-looking statements, which involve a number of risks, and uncertainties that could cause actual results to differ materially from those in such forward-looking statements. The risks and uncertainties relating to these statements include, but are not limited to, risks and uncertainties regarding fluctuations in earnings, our ability to manage growth, intense competition in the aviation business including those factors which may affect our cost advantage, wage increases, our ability to attract and retain professionals, time and cost overruns on various parameters, our ability to manage our international operations, liability for damages, withdrawal of governmental fiscal incentives, political instability, legal restrictions on raising capital, and general economic conditions affecting our industry. Jet Airways may, from time to time, make additional written and oral forward-looking statements, including our reports to shareholders. Jet Airways does not undertake to update any forward-looking statement that may be made from time to time by or on behalf of the company.