Embed Size (px)
Citation preview
Classified as Internal
Project final report H100 Hydrogen Characterisation Final Report Report Number 0431389-02 14th May 2019
A consolidated summary report by Environmental Resources Management (ERM) and Health & Safety Laboratory (HSL)
Classified as Internal
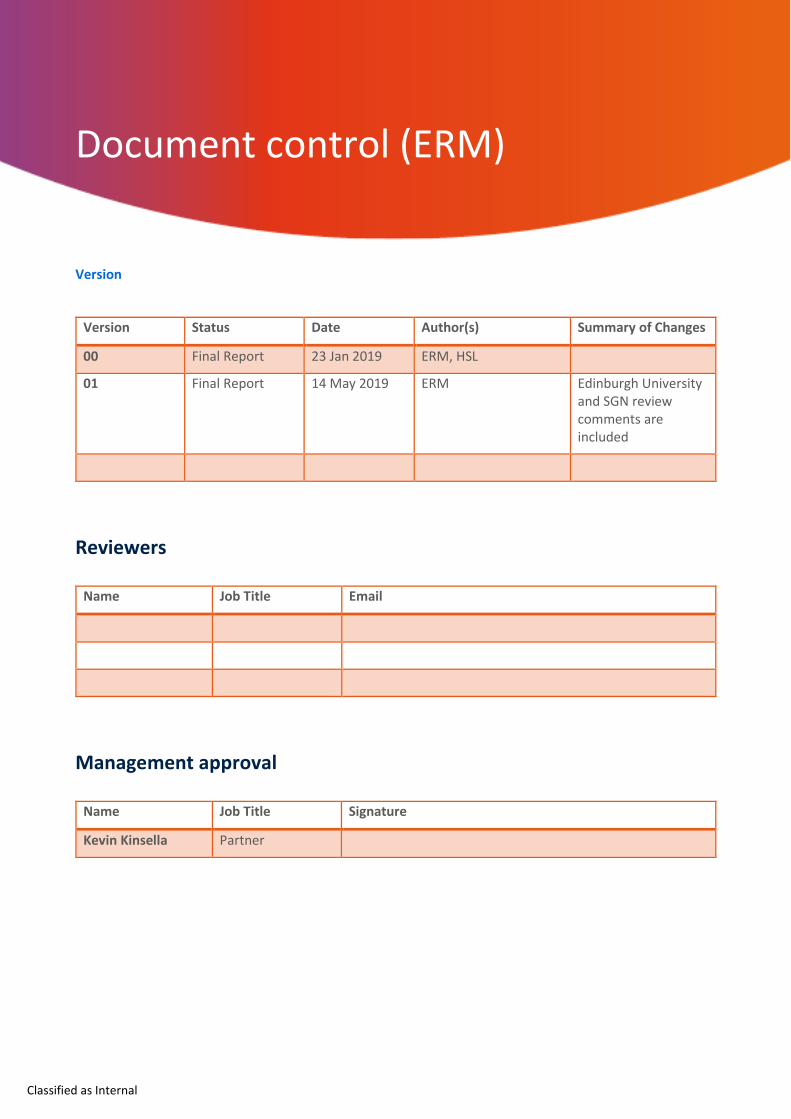
Document control (ERM)
Version
Version Status Date Author(s) Summary of Changes
00 Final Report 23 Jan 2019 ERM, HSL
01 Final Report 14 May 2019 ERM Edinburgh University and SGN review comments are included
Reviewers
Name Job Title Email
Management approval
Name Job Title Signature
Kevin Kinsella Partner
3
Classified as Internal
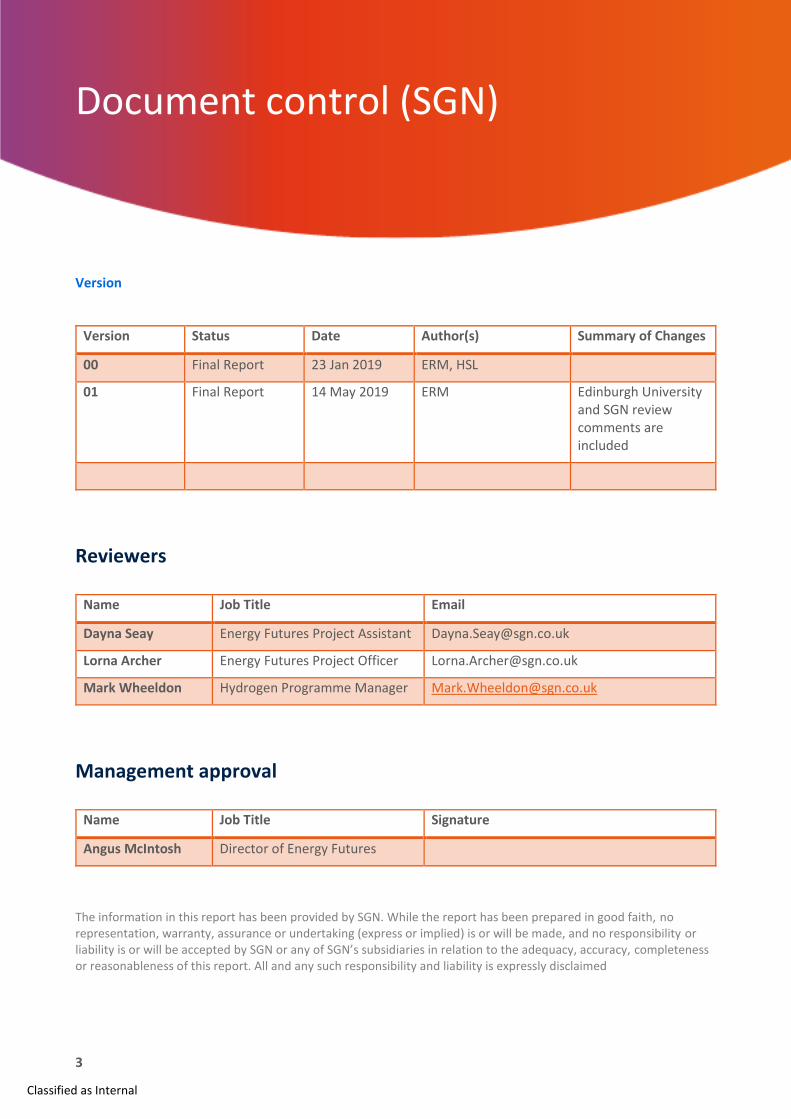
Document control (SGN)
Version
Version Status Date Author(s) Summary of Changes
00 Final Report 23 Jan 2019 ERM, HSL
01 Final Report 14 May 2019 ERM Edinburgh University and SGN review comments are included
Reviewers
Name Job Title Email
Dayna Seay Energy Futures Project Assistant [email protected]
Lorna Archer Energy Futures Project Officer [email protected]
Mark Wheeldon Hydrogen Programme Manager [email protected]
Management approval
Name Job Title Signature
Angus McIntosh Director of Energy Futures
The information in this report has been provided by SGN. While the report has been prepared in good faith, no representation, warranty, assurance or undertaking (express or implied) is or will be made, and no responsibility or liability is or will be accepted by SGN or any of SGN’s subsidiaries in relation to the adequacy, accuracy, completeness or reasonableness of this report. All and any such responsibility and liability is expressly disclaimed
4
Classified as Internal
Contents Reviewers .............................................................................................................................................. 2
Management approval ........................................................................................................................... 2
Reviewers .............................................................................................................................................. 3
Management approval ........................................................................................................................... 3
Acronyms .............................................................................................................................................. 9
1. ...... Introduction ............................................................................................................................... 12
1.1. Project Background ............................................................................................................................... 12 1.2. Project Application ................................................................................................................................ 12
1.2.1. Distribution Network Releases ................................................................................................ 13
1.2.2. Local Hydrogen Storage Site .................................................................................................... 13
1.2.3. Emergency Procedures ............................................................................................................ 14
1.3. Scope of Work ....................................................................................................................................... 14 1.4. Report Overview ................................................................................................................................... 15
2. ...... Hydrogen Releases-Theoretical Background ................................................................................ 16
2.1. General Considerations ......................................................................................................................... 16 2.2. Literary Survey....................................................................................................................................... 17
2.2.1. Effects of Diffusion .................................................................................................................. 17
2.2.2. Effects of Buoyancy ................................................................................................................. 19
3. ...... Below Ground Behaviour of Gas Releases ................................................................................... 21
3.1. Risk Scenarios Where Gas Flows Through A Porous Medium .............................................................. 21
3.1.1. Flow Scenarios ......................................................................................................................... 21
3.1.2. Distribution of gas escaping from an open surface ................................................................. 24
3.1.3. Leak flow rate .......................................................................................................................... 25
3.1.4. Effects of impermeable cover.................................................................................................. 26
3.2. Risk Scenarios Where Gas Flows Through Low Resistance Service Ducts ............................................ 26
3.2.1. Pressure drops for flows in unperforated service ducts ......................................................... 27
3.2.2. Flows in perforated ducts ........................................................................................................ 27
3.2.3. Leak point and entry into duct separated by a porous medium ............................................. 28
4. ...... Experimental Work ..................................................................................................................... 28
4.1. Flow Rates for a Leaks into Media with Different Permeability ........................................................... 29
4.1.1. Equipment ............................................................................................................................... 29
4.1.2. Results ..................................................................................................................................... 29
5
Classified as Internal
Contents
4.2. Effects of the Water Content of the Ground on Gas Flow .................................................................... 32
4.2.1. Equipment ............................................................................................................................... 32
4.2.2. Results ..................................................................................................................................... 32
4.3. Distribution of Surface Gas Flux Near a Buried Leak ............................................................................. 34
4.3.1. Method .................................................................................................................................... 34
4.3.2. Results: Surface flux near a point source ................................................................................ 35
4.3.3. Results: Surface flux near a line source ................................................................................... 38
4.4. Distribution of Surface Gas Flux where Gas Escapes at the Edge of an Impermeable Cover ............... 39
4.4.1. Equipment ............................................................................................................................... 39
4.4.2. Results ..................................................................................................................................... 41
5. ...... QRA for the Low Pressure Gas Distribution System ...................................................................... 44
5.1. Release Probability ................................................................................................................................ 44
5.1.1. Leak Frequency ........................................................................................................................ 44
5.2. Movement of Gas and Ability to Enter a Building ................................................................................. 48
5.2.1. Modes of Ingress to a Building ................................................................................................ 48
5.2.2. Release Assessment from Upstream of the Meter ................................................................. 50
5.2.3. Movement of gas from below ground releases ...................................................................... 50
5.2.4. Movement of gas from above ground releases ...................................................................... 51
5.3. Gas build-up within buildings ................................................................................................................ 53 5.4. Ignition Probability of Gas in Building Events ....................................................................................... 55
5.4.1. Ignition Energy ......................................................................................................................... 55
5.4.2. Ignition Sources ....................................................................................................................... 56
5.5. Consequence Assessment ..................................................................................................................... 58 5.6. Risk Assessment Summary .................................................................................................................... 59
6. ...... QRA for the high pressure hydrogen supply source ...................................................................... 60
6.1.1. Overview .................................................................................................................................. 60
6.1.2. Hazard Identification and Failure Cases .................................................................................. 60
6.1.3. Frequency Assessment ............................................................................................................ 60
6.1.4. Weather Data .......................................................................................................................... 63
6.1.5. Harm Criteria ........................................................................................................................... 64
6.1.6. Consequence Assessment ....................................................................................................... 66
6
Classified as Internal
Contents
6.1.7. Risk Analysis Approach and Acceptance Criteria ..................................................................... 67
7. ...... Review of Emergency Policy and Procedures ............................................................................... 69
7.1. General Findings .................................................................................................................................... 69 7.2. Detailed Findings ................................................................................................................................... 70
8. ...... Conclusions ................................................................................................................................ 76
8.1. Below Ground Gas Dispersion ............................................................................................................... 76 8.2. Risk Assessment .................................................................................................................................... 77 8.3. Emergency Procedures .......................................................................................................................... 77 8.4. Implications for H100 Project ................................................................................................................ 77
9. ...... References ................................................................................................................................. 78
Appendix I - General Analysis of Flows with an Open Surface ................................................................ 80
Appendix II - Example Calculations for Uncovered Gas Escapes- Various Hole Sizes ................................ 95
Appendix III - Example Calculations with an Impermeable or Semi-Permeable Cover ............................. 99
Appendix IV - Tracking to Danger through Service Ducts...................................................................... 107
Appendix V - Flow from a Buried Source Below a Free Surface ............................................................ 112
Appendix VI - Source Under a Free Surface above an Impermeable Layer ............................................ 115
Appendix VII - Solution of One-Dimensional Flow Equations ( Scenario 5) ............................................ 117
Appendix VIII - Analysis of Mixed Regime Flows .................................................................................. 118
7
Classified as Internal
List of Tables
Table 3.1: Summary of below ground gas flow scenarios ............................................................................. 233 Table 3.2: Rate of pressure loss for gas flow in a duct with typical surface roughness ................................ 277 Table 3.3: Example flow rates to a vulnerable target along perforated ducts of different lengths................ 28 Table 4.1: Maximum distance (in Metres) to lower threshold criteria for credible release scenarios and a range of hole sizes ......................................................................................................................................... 433 Table 5.1: SGN Public Reported Escape Events ( 2016/17) ........................................................................... 466 Table 5.2: Probability quantification method for location specific influencing factors .................................. 49 Table 5.3 Increased Distance of Travel Factor for Hydrogen ........................................................................ 511 Table 5.4: HyHouse gas release rates ............................................................................................................ 533 Table 5.5: Hole size distribution cases used for sensitivity assessment ....................................................... 544 Table 5.6: Gas concentrations in building for different hole sizes ................................................................ 544 Table 5.7: Occupancy and location assumptions for ignition source modelling ........................................... 577 Table 5.8: Calculated Ignition Probabilities ................................................................................................... 577 Table 5.9: Ignition risk factor for different hole size distributions .................................................................. 58 Table 6.1: Probability of ignition of hydrogen cloud adopted by various partners in HyQRA benchmarking study .............................................................................................................................................................. 611 Table 6.2: Default ignition probabilities proposed by HyRAM ...................................................................... 611 Table 6.3: Ignition probability (Cox, Lees and Ang) ....................................................................................... 622 Table 6.4: Immediate ignition probabilities (BEVI) ........................................................................................ 622 Table 6.5: Thermal dose impact criteria ........................................................................................................ 644 Table 6.6: Thermal radiation criteria for 30s exposure ................................................................................. 644 Table 6.7: PADHI Decision matrix .................................................................................................................... 68 Table 7.1: Detailed findings summary table .................................................................................................. 700 Table 7.2: Findings from review of Management Procedure ........................................................................ 700 Table 7.3: Findings from review of Work Procedure ..................................................................................... 733

8
Classified as Internal
List of Figures
Figure 1.1: Typical Industrial QRA Process .............................................................................................................. 13 Figure 1.2: Project phases........................................................................................................................................ 14 Figure 2.1: Permeability of Unconsolidated Grounds and Rocks ................................ Error! Bookmark not defined. Figure 2.2: Hydrogen concentrations in the plane of the source- Release rate 0.0166 litre/s . Error! Bookmark not defined. Figure 2.3: Gas concentration after 240 hours: methane at 0.016/s ...................................................................... 19 Figure 2.4: Gas concentration after 240 hours: PA13 (propane 60%) at 0.0055l/s ................................................. 19 Figure 2.5: Buoyancy induced pressure gradients and flow for releases of light and heavy gases ......................... 20 Figure 3.1: Scenario 1- Open Ground- Flow limited by porous medium ................................................................. 21 Figure 3.2: Scenario 5 - semi-permeable cover- high porosity channel (along service line or road) ...................... 22 Figure 3.3: Surface gas flux as a function of distance .............................................................................................. 25 Figure 3.4: Schematic showing gas flow under an impermeable cap and escape close to the edge ...................... 26 Figure 3.5: Sealing of a service duct ........................................................................................................................ 27 Figure 4.1: Side and end views of the experimental rig .......................................................................................... 29 Figure 4.2: Pressure/flow curves for leaks into media with different permeability ................................................ 30 Figure 4.3: Pressure/flow curves for nitrogen, methane and hydrogen ................................................................. 31 Figure 4.4: Mixed flow - gas outflow through the ground and a (smaller) turbulent leak to danger ..................... 32 Figure 4.5: Effects on permeability of adding 40 mm water ................................................................................... 33 Figure 4.6: Time dependence of effects of water on permeability ......................................................................... 33 Figure 4.7: Further test of the time dependence of effects of water on permeability ........................................... 34 Figure 4.8: Method of installing a single point source ............................................................................................ 35 Figure 4.9: Typical results during measurement of surface gas flux ....................................................................... 36 Figure 4.10: Distribution of surface gas flux at long distances ................................................................................ 37 Figure 4.11: Divergence from the homogeneous theory near the source ............................................................. 38 Figure 4.12: Surface gas flux observations for a line source ................................................................................... 38 Figure 4.13: Variation of surface flux for a line and point source ........................................................................... 39 Figure 4.14: Arrangement used to study the flow of gas escaping from under an impermeable cover ................. 40 Figure 4.15: Distribution of gas escaping beyond the edge of an impermeable layer ............................................ 41 Figure 4.16: Comparison of natural gas and hydrogen at the edge of an impermeable layer ................................ 42 Figure 5.1: Number of leaks upstream of meter resulting in Gas in Buildings (>20% LFL) and ignitions ................ 45 Figure 5.2: Leak Frequency breakdown by hole size from EGIG ............................................................................. 47 Figure 5.3: Leak frequency breakdown by hole size from UKOPA .......................................................................... 47 Figure 5.4: QRA model structure for low pressure distribution system .................................................................. 49 Figure 5.5: Comparison of above ground releases of hydrogen and natural gas (75mbar; 100 mm hole) ............. 52 Figure 5.6: Gas concentrations recorded in the HyHouse experiments .................................................................. 53 Figure 5.7: Minimum Ignition Energy for Methane and Hydrogen at varying concentrations ............................... 55 Figure 5.8 Theoretical ignition source layout corresponding to HyHouse results .................................................. 56 Figure 5.9: Extended structure of consequence model to be quantified at a later stage ....................................... 58 Figure 5.10: Flame speed for different gas in air concentrations ............................................................................ 59 Figure 6.1: Energy institute ignition probability 'Curve 5' - Small plant (Gas/LPG) ................................................. 62 Figure 6.2: Overpressure-lethality relationship from API 752 ................................................................................. 65 Figure 6.3: Overpressure-lethality relationship from CIA guidance ........................................................................ 66 Figure 6.4: Downwind flammable cloud dispersion distance for varying release pressures and hole sizes (wind speed 2m/s) ............................................................................................................................................................. 67 Figure 6.5: Downwind jet fire consequence distances for varying release pressures and hole sizes (wind speed 5m/s) ........................................................................................................................................................................ 67

9
Classified as Internal
Acronyms AA Advise Against ACH Air Changes per Hour BEVI Besluit Externe Veiligheid Inrichtingen (Dutch Safety Legislation) CFD Computational Fluid Dynamics DAA Do not Advise Against EGIG European Gas Pipeline Incident Data Group ERM Environmental Resources Management Ltd. FIM/FID Flame Ionisation Monitor/ Detector FRED Failure Rates and Event Data GIB Gas in Building GSMR Gas Safety Management Regulations HSE Health and Safety Executive HSL Health and Safety Laboratory IGEM Institution of Gas Engineers and Managers LEL Lower Explosive Limit LFL Lower Flammable Limit LPG Liquefied Petroleum Gas LUP Land Use Planning MCPIPIN Monte Carlo PIPeline Integrity (software) MW Molecular Weight NG Natural Gas OGP International Association of Oil and Gas Producers PADHI Planning Advise for Developments near Hazardous Installations PCAG Planning Case Assessment Guidance PE Polyethylene PPE Personal Protective Equipment PPM Parts per million PRE Public Reported Events PSR Pipeline Safety Regulations PSSR Pressure System Safety Regulations QRA Quantitative Risk Assessment RIDDOR Reporting of Injuries, Diseases and Dangerous Occurrences Regulations RIDGAS Gas related incidents reported in Great Britain RIVM Rijksinstituut voor Volksgezondheid en Milieu (Dutch National Institute for Health and
Environment) SQRT Square root TGC Tokyo Gas Company UKOPA United Kingdom Onshore Pipeline Operators Association

10
Classified as Internal
Executive Summary
H100 is a feasibility and FEED study that is looking to develop site specific evidence in support of a future small scale first of a kind demonstration of a 100% hydrogen distribution network. The study will build on prior work that has been undertaken in this area and establish the technical and commercial viability of a 100% hydrogen network demonstration project. As part of the study, an investigation into how hydrogen behaves is required for uncontrolled releases from the network above and below ground.
The industry currently has a good understanding of how natural gas behaves when it escapes below and above ground and how it tracks into property along other service routes and in different subsoil types. This work package is to develop the same level of understanding for hydrogen, based on physical testing and mathematical models, and use that to develop a quantitative risk assessment (QRA) to compare the risks against those of natural gas and support the development of effective emergency response procedures.
To perform the work, ERM have teamed with the UK Health and Safety Laboratory (HSL). ERM are leading the project and are responsible for the QRA and Emergency Response aspects whilst HSL are performing the test program and developing the mathematical models. There is a close working relationship between ERM and HSL, who have developed this report in collaboration.
This report describes the work conducted by ERM and HSL to develop an understanding of the upstream safety implications of implementing the H100 project. The work undertaken provides:
• an improved understanding of hydrogen behaviour for above and below ground releases (below ground releases based on theoretical and experimental research conducted by HSL, above ground releases modelled using established consequence modelling software);
• an assessment of the comparative risk of flammable levels of hydrogen entering, accumulating and igniting within a building against that for natural gas (gas accumulation based on HyHouse results, ignition modelling conducted using ERM’s hydrogen ignition model for domestic properties - IgnHyte);
• a risk model that will include risks downstream of the meter at a later stage, providing comparative risk results for the entire demonstration project;
• a prioritised plan to provide updated documents for Emergency Response which specifically reflects the different nature and risks associated with hydrogen as opposed to natural gas.
11
Classified as Internal
Executive Summary
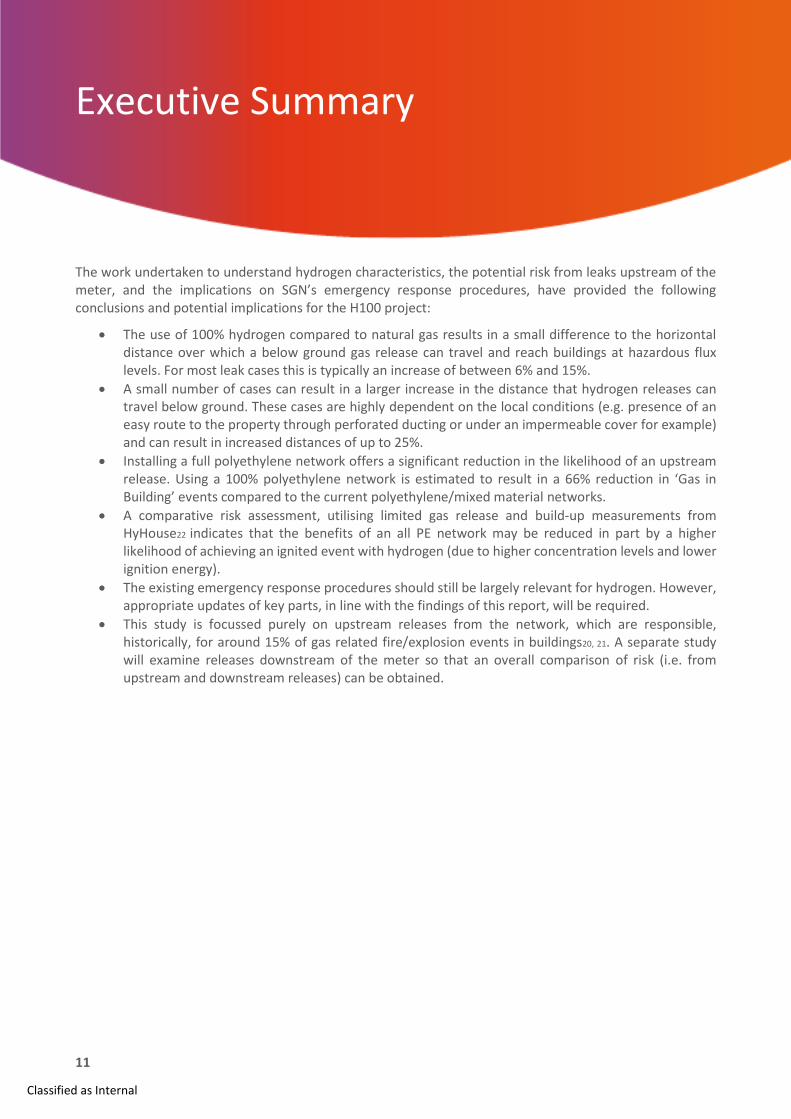
The work undertaken to understand hydrogen characteristics, the potential risk from leaks upstream of the meter, and the implications on SGN’s emergency response procedures, have provided the following conclusions and potential implications for the H100 project:
• The use of 100% hydrogen compared to natural gas results in a small difference to the horizontal distance over which a below ground gas release can travel and reach buildings at hazardous flux levels. For most leak cases this is typically an increase of between 6% and 15%.
• A small number of cases can result in a larger increase in the distance that hydrogen releases can travel below ground. These cases are highly dependent on the local conditions (e.g. presence of an easy route to the property through perforated ducting or under an impermeable cover for example) and can result in increased distances of up to 25%.
• Installing a full polyethylene network offers a significant reduction in the likelihood of an upstream release. Using a 100% polyethylene network is estimated to result in a 66% reduction in ‘Gas in Building’ events compared to the current polyethylene/mixed material networks.
• A comparative risk assessment, utilising limited gas release and build-up measurements from HyHouse22 indicates that the benefits of an all PE network may be reduced in part by a higher likelihood of achieving an ignited event with hydrogen (due to higher concentration levels and lower ignition energy).
• The existing emergency response procedures should still be largely relevant for hydrogen. However, appropriate updates of key parts, in line with the findings of this report, will be required.
• This study is focussed purely on upstream releases from the network, which are responsible, historically, for around 15% of gas related fire/explosion events in buildings20, 21. A separate study will examine releases downstream of the meter so that an overall comparison of risk (i.e. from upstream and downstream releases) can be obtained.
H100 Hydrogen Characterisation - Final Report
12 May 2019
1. Introduction
1.1. Project Background
The H100 project will construct and operate the first 100% hydrogen network that will distribute hydrogen to a small local community in Scotland. The site chosen will produce hydrogen via electrolysis, and include seasonal and diurnal storage, processing and a distribution network. Three sites are currently under consideration for the location of the trial, all in Scotland.
As part of this project, it is necessary to understand the characteristics of hydrogen, both in terms of its release and dispersion characteristics as well as any implications for emergency response arrangements. This will then enable a comparative risk assessment to be conducted to evaluate the difference in supplying hydrogen to homes compared to natural gas. The study aims to provide both theoretical and experimental evidence to enhance our understanding in these areas.
A significant part of the work undertaken in this study includes an investigation into how hydrogen behaves for uncontrolled releases from the network below and above ground. This has been investigated using physical testing, the development of mathematical models and the performance of a comparative risk assessment between natural gas and hydrogen. In addition, the current emergency procedures for dealing with gas escapes have been reviewed to determine their applicability to hydrogen.
This report described the work conducted by ERM and HSL to develop an understanding of the upstream (of the meter) safety implications of implementing the H100 project as part of a wider body of studies. The work undertaken provides:
• an improved understanding of hydrogen behaviour for above and below ground releases (below ground releases based on theoretical and experimental research conducted by HSL, above ground releases modelled using established consequence modelling software);
• an assessment of the comparative risk of flammable levels of hydrogen entering a building against that for natural gas (gas accumulation based on HyHouse results, ignition modelling conducted using ERM’s hydrogen ignition model for domestic properties - IgnHyte);
• a risk model for upstream releases that can be extended to also include risks downstream of the meter at a later stage. This model can be quantified once site specific information is available to give overall risk results for the entire demonstration project;
• a prioritised plan to provide updated documents for Emergency Response which specifically reflects the different nature and risks associated with hydrogen as opposed to natural gas.
Whilst the project is focussed on developing an improved understanding of risk for the H100 project, opportunities for the development of generalised solutions for broader application have been taken wherever relevant.
1.2. Project Application
The work conducted for this project can be considered in terms of the primary areas of application for the H100 project:
• Assessment of the comparative risk for the distribution network
• Assessment of the risk at the high pressure storage location
• Assessment of suitability of emergency response procedures for operation of the H100 project
H100 Hydrogen Characterisation - Final Report
13 May 2019
1.2.1. Distribution Network Releases
Work has been undertaken to enable a comparative risk assessment of supplying hydrogen vs natural gas through a distribution network to domestic property. The scope of work is directed toward an assessment of the physical risks to people from the distribution system upstream of the meter. The potential for a fire or explosion event can be considered in five stages and the comparative risk of hydrogen and natural gas can be considered at each:
1. Probability of release from network including hole size distribution and estimated release rates 2. Movement of flammable gas in the event of a release and the likelihood of gas entering a domestic
property 3. Gas build-up within a domestic property in the event of a release entering the property 4. Probability of ignition in the event of a flammable atmosphere being present 5. Consequences of an ignited release
Each of the first four areas are considered in this report using a mixture of original research and reviews of existing literature to provide an overall estimate of the comparative risk for the H100 project. The consequences of an ignited release inside a building (stage 5) is not considered at this time.
The risk profile of the H100 project will be influenced by the detailed design and layout of the project. The information presented in this report is expected to be refined as part of a site specific assessment as the project progresses and site specific information becomes available.
1.2.2. Local Hydrogen Storage Site
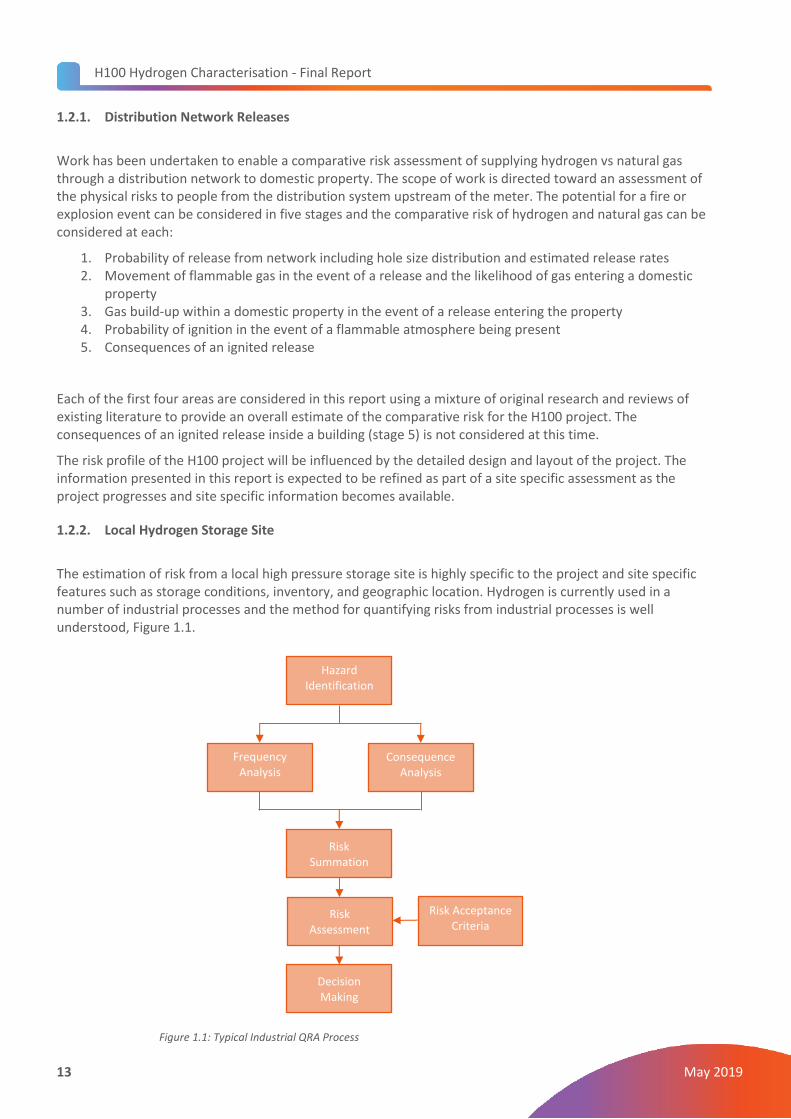
The estimation of risk from a local high pressure storage site is highly specific to the project and site specific features such as storage conditions, inventory, and geographic location. Hydrogen is currently used in a number of industrial processes and the method for quantifying risks from industrial processes is well understood, Figure 1.1.
Hazard Identification
Frequency Analysis
Consequence Analysis
Risk Summation
Risk Assessment
Decision Making
Risk Acceptance Criteria
Figure 1.1: Typical Industrial QRA Process
H100 Hydrogen Characterisation - Final Report
14 May 2019
The principal influencers of risk are the frequency and potential consequences of uncontrolled releases as shown in Figure 1.1. The information presented in this report outlines the QRA methodology and a comparison of frequencies and consequences for typical process conditions for natural gas and hydrogen. The detailed risk assessment will be based on the site specific features of the H100 project.
1.2.3. Emergency Procedures
SGN’s emergency procedures are based around response to events involving the loss of containment of natural gas. These procedures have been reviewed for applicability to use on a hydrogen network. The findings of this review are presented by exception in this report, with a qualitative assessment of priority to ensure fit for purpose emergency procedures are in place for the H100 project.
1.3. Scope of Work
The scope of work is directed toward an assessment of the physical risks to people from the distribution system upstream of the meter on domestic property as well as the source of supply of hydrogen (e.g. high pressure storage site). The risk assessment of the distribution system is a comparative risk assessment against the existing supply of natural gas.
The risk profile of the H100 project will be influenced by the detailed design and layout of the project. The information presented in this report is expected to be used as part of a project specific assessment which will build as the project progresses.
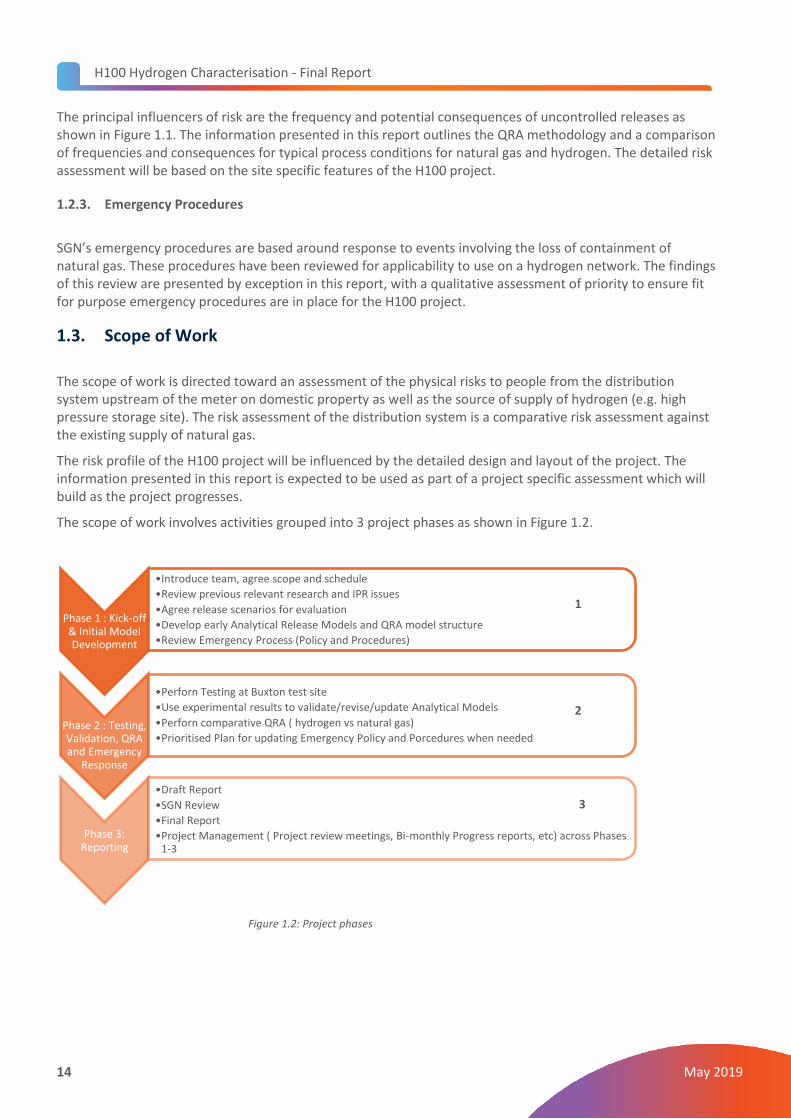
The scope of work involves activities grouped into 3 project phases as shown in Figure 1.2.
Figure 1.2: Project phases
Phase 1 : Kick-off & Initial Model Development
•Introduce team, agree scope and schedule
•Review previous relevant research and IPR issues
•Agree release scenarios for evaluation
•Develop early Analytical Release Models and QRA model structure
•Review Emergency Process (Policy and Procedures)
Phase 2 : Testing, Validation, QRA and Emergency
Response
•Perforn Testing at Buxton test site
•Use experimental results to validate/revise/update Analytical Models
•Perforn comparative QRA ( hydrogen vs natural gas)
•Prioritised Plan for updating Emergency Policy and Porcedures when needed
Phase 3: Reporting
•Draft Report
•SGN Review
•Final Report
•Project Management ( Project review meetings, Bi-monthly Progress reports, etc) across Phases 1-3
1
2
3
H100 Hydrogen Characterisation - Final Report
15 May 2019
The work undertaken is based on a mix of original research and application of existing studies. Available information has been used to attempt to determine the comparative risk of using hydrogen, however some significant areas of uncertainty remain. These are highlighted in this report for clarity and to enable the assessment to be further refined as new information becomes available.
This document represents the ‘Hydrogen Characteristics Report’ and describes the work conducted throughout the project.
1.4. Report Overview
This report includes the following sections:
Section 2 - provides an overview of the existing literature and understanding of the key theoretical aspects of relevance to the project. It discusses the approach to release scenario assessment, drawing on existing theoretical models as well as highlighting the importance of the experimental testing in understanding release behaviour.
Section 3 - outlines the behaviour of gas from below ground releases. This provides a generalised approach to assessing below ground releases that is substantiated by experimental evidence. It raises a number of practical considerations for the H100 project as well as directly feeding into the Quantitative risk Assessment (QRA).
Section 4 - provides a description of the experimental work undertaken and the results from those experiments.
Section 5 - discusses the QRA of the low pressure distribution system. This includes identification of the key influencing factors on the overall risk. A number of theoretical and experimental sources are used to provide a comparative assessment of the risk between hydrogen and natural gas. It also outlines the approach to a site specific QRA which will be conducted later in the H100 project.
Section 6 - presents the approach to the QRA for the high pressure storage system. It also provides some indicative results to help with design and planning of the H100 project.
Section 7 - provides the output of the review of the existing emergency policy and procedures for dealing with gas escapes (in relation to hydrogen).
Section 8 - summarises the conclusions from all aspects of the report.
H100 Hydrogen Characterisation - Final Report
16 May 2019
2. Hydrogen Releases-Theoretical Background
2.1. General Considerations
The work for below ground releases includes analysis of low-pressure leaks and flows through porous ground in a range of circumstances, i.e. :
• where there is a cavity around the leak point and where there is not.
• where the ground is covered by an impermeable or semi-permeable cover or where it is not.
• where there is there is a channel of more porous ground (e.g. along the line of a road) or where there is not.
• where there is a very low resistance path for flow towards a target (e.g. a vented service duct) and where there is not.
The analytical work is supported by experimental work at a realistic scale, using natural gas and hydrogen. The amount of openly published research on leaks from gas pipelines operating at pressures up to 75 mbar is relatively limited. The fluid mechanical fundamentals of gas flow in porous media under the influence of diffusion, pressure gradients and variable density are fairly well established (see below) but the application of these methods to the assessment of transport in real conditions is wholly dependent on a knowledge of the properties of the ground.
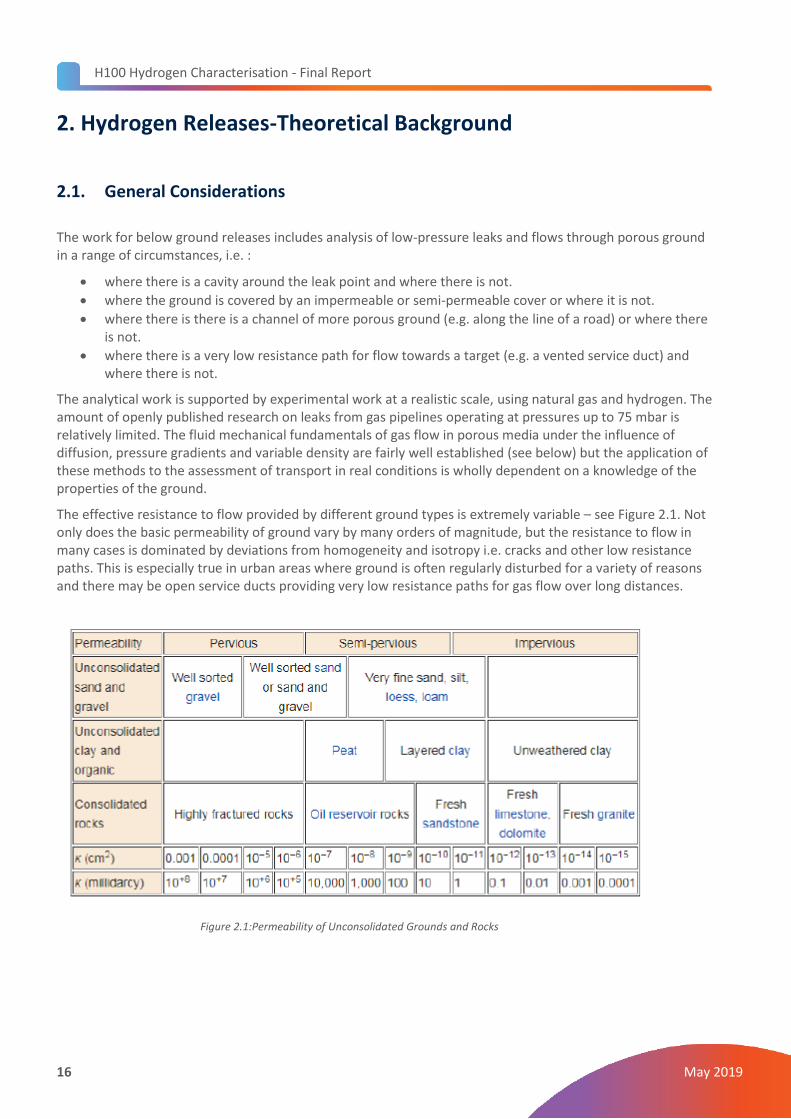
The effective resistance to flow provided by different ground types is extremely variable – see Figure 2.1. Not only does the basic permeability of ground vary by many orders of magnitude, but the resistance to flow in many cases is dominated by deviations from homogeneity and isotropy i.e. cracks and other low resistance paths. This is especially true in urban areas where ground is often regularly disturbed for a variety of reasons and there may be open service ducts providing very low resistance paths for gas flow over long distances.
Figure 2.1:Permeability of Unconsolidated Grounds and Rocks
H100 Hydrogen Characterisation - Final Report
17 May 2019
2.2. Literary Survey
The most comprehensive and thorough studies of gas flow from small, low pressure leaks in nominally homogeneous ground were carried out by Okamoto and Gomi of the Technology Development Department of the Tokyo Gas Company (TGC) [1] [2].
This work involved real scale experiments with methane, hydrogen and a 60%/40% propane-air mixture (PA13), as well as corresponding numerical solution of governing equations.
The leakage rates used were small (1 l/minute = 0.016 litres/s) with the source covered to a depth of 1.2 m by pit sand and thinner, upper layers of crushed stone and asphalt. The properties of the ground (e.g. porosity, permeability and diffusion coefficient) were carefully measured. The porosity of the sand varied during the experimental campaign between about 2 × 10⁻¹²𝑚2 and 3 × 10⁻¹¹𝑚2.These variations were caused by variable moisture content (and consequent porosity).
The tests were run for long periods of time (200-600 hours). These were sufficient for approximately steady-state conditions to be established.
Gas concentrations were monitored at a large number of sample points at different distances from the buried source and at different depths: this allowed comprehensive comparison with theoretical predictions.
Excellent agreement was obtained between the solutions of the momentum and mass conservation equations and measurements. Some significant general features of the results are summarised below:
1. After a long period of time gas was transported horizontally by a distance approximately equal to twice the burial depth for both methane and hydrogen – before diffusing or being advected to the surface.
2. The edges of the volume flooded by gas were affected by diffusion giving a wide range of concentrations from ~100% close to the source to ~0% close to the ground. This broadening of the boundary between gas and air is most significant for small leaks imposing very low advective flows – the significance of diffusion is discussed further below.
3. Even for the small gas flow rates used it was noticed that the flow of (dry) gas led to local drying of the soil and corresponding increases in permeability.
4. The effect of buoyancy on flow of the heavy gas PA13 was noticeable but differences between methane and hydrogen were not large. Again the effects of buoyancy are most significant at very low leakage flow rates – the significance of buoyancy is discussed further below.
2.2.1. Effects of Diffusion
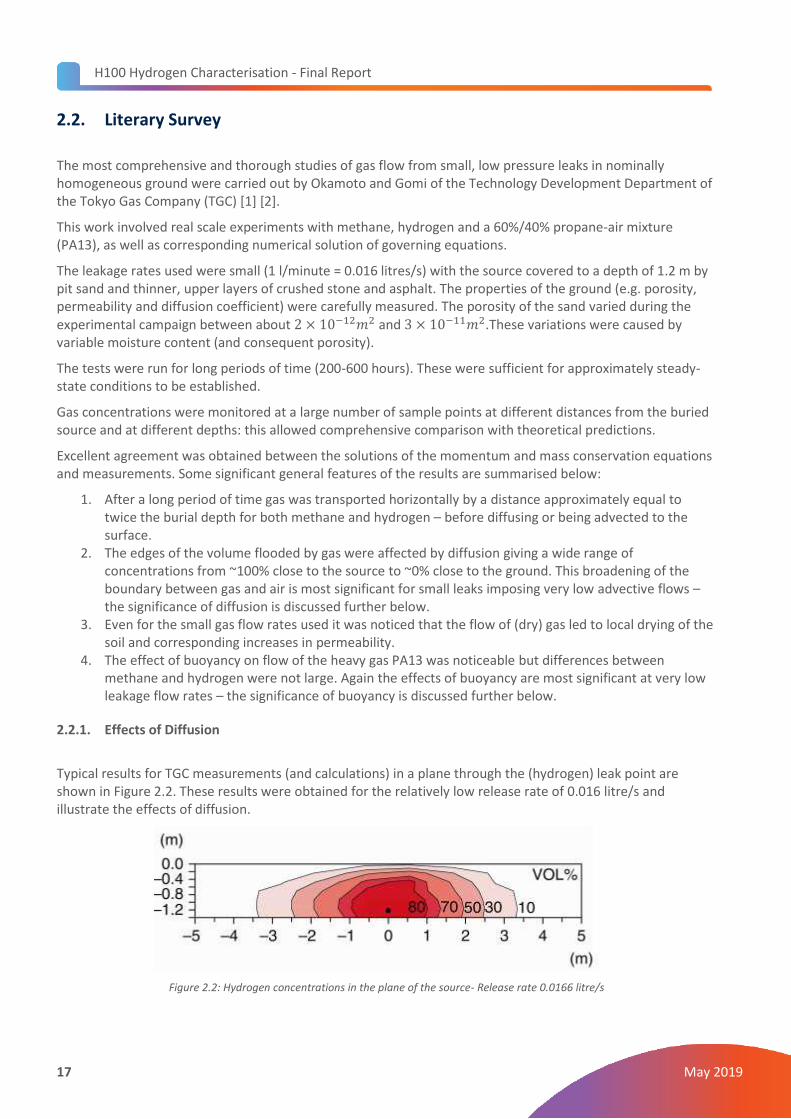
Typical results for TGC measurements (and calculations) in a plane through the (hydrogen) leak point are shown in Figure 2.2. These results were obtained for the relatively low release rate of 0.016 litre/s and illustrate the effects of diffusion.
Figure 2.2: Hydrogen concentrations in the plane of the source- Release rate 0.0166 litre/s

H100 Hydrogen Characterisation - Final Report
18 May 2019
The effects of diffusion can be understood as follows:
Total hydrogen flux from the surface = 0.0166 l/s = 1.66 × 10⁻⁵m3/s
Total area over which main release concentrated ~ 1.5 x 1.5 m = 2.25 m2
Advective hydrogen flux = 1.66 × 10⁻⁵ / 2.25 = 7.4 × 10⁻⁶m/s
In equilibrium the advective flux of hydrogen towards the surface driven by the excess source pressure is balanced by downward diffusion of air from the surface. If C is the mass fraction and D is the relevant diffusion coefficient (measured by Okamoto et al [2] as 4 × 10⁻⁶𝑚2/𝑠) and L is the distance scale (depth) over which the concentration varies below the surface
Diffusional flux (m/s) = 𝐷 (𝑑𝐶
𝑑𝑧) = 4 × 10⁻⁶/𝐿
From Figure 2.2 the value of L ~ 0.5 m which leads to an estimated diffusive flux of:
Diffusional flux = 𝐷 (𝑑𝐶
𝑑𝑧) = 4 × 10⁻⁶/𝐿 = 4 × 10⁻⁶/0.5 = 8 × 10⁻⁶ m/s
Within the accuracy of the analysis, this confirms that equilibrium occurs when upward pressure driven gas flow towards the surface is balanced by downward diffusion of air.
Horizontal advection of gas at depth is much slower. At equilibrium this is again balanced by diffusion but in this case the distance L over which the concentration varies is much larger (concentration gradients are much lower) corresponding to the reduced rate of diffusive flux.
In general the thickness of the mixed zone separating pure gas from air can be estimated from
Thickness of the gas-air boundary (m) =D( m2/s) / Advective velocity (m/s)
For larger flow rates this thickness may be small: For a leak flow of 10 litres /second (at the same depth as the TGC experiment) the width of the mixed zone separating pure gas from air would only be about a millimetre. In this case diffusion would have little effect on the main flow of gas.
The equations governing diffusive and pressure driven (advective) flux of gas are of similar form – at least where the gas flow is laminar.
Diffusive gas flux (m/s) = 𝐷 (𝑑𝐶
𝑑𝑧) Ficks equation
Pressure driven gas flux (m/s) = 𝑘
𝜇 (
𝑑𝑃
𝑑𝑧) Darcy Equation
If pure gas (C=1) is released in a cavity with a pressure P then the gas fluxes due to diffusion and advection
(pressure) are in the ratio 𝐷𝜇
𝑘𝑃.
For the TGC experiments on hydrogen the typical values of these parameters were:
𝐷 = 4 × 10⁻⁶ 𝑚2/𝑠
𝜇 = 8.8 × 10⁻⁶ Pa.s
𝑘 = 1.4 × 10⁻¹¹𝑚2
P~ 200 Pa
H100 Hydrogen Characterisation - Final Report
19 May 2019
The ratio of diffusive to pressure driven flow is therefore approximately 0.01 – at this ratio diffusion has a noticeable effect on gas flow.
For larger leaks with supply pressures up to 75 mbar (7500 Pa) the ratio of diffusive to pressure driven flow will be much smaller effect of diffusion on mass flow rate is generally negligible.
Horizontal transport of gas by diffusion can occur but analyses similar to that above show that for significant leaks it is a small fraction of the advective flow. Where the surface is open, gas is lost to the surface by diffusion within a distance equal to a few times the burial depth in an analogous way to loss by advection (see below). Where the release is capped, diffusion can transport gas further horizontally but generally at a much lower flow rate than advection. If pressure driven flow is blocked by a solid surface diffusion can still occur but the associated rates of gas flux are generally too low to be significant.
2.2.2. Effects of Buoyancy
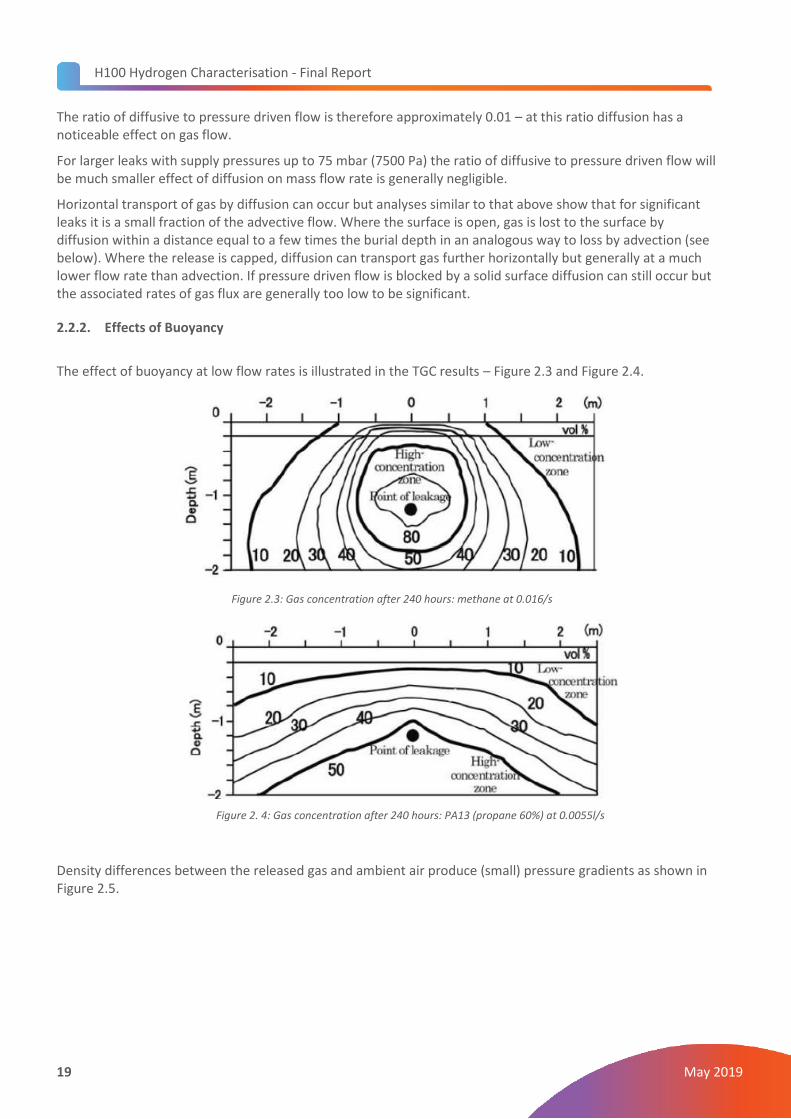
The effect of buoyancy at low flow rates is illustrated in the TGC results – Figure 2.3 and Figure 2.4.
Figure 2.3: Gas concentration after 240 hours: methane at 0.016/s
Figure 2. 4: Gas concentration after 240 hours: PA13 (propane 60%) at 0.0055l/s
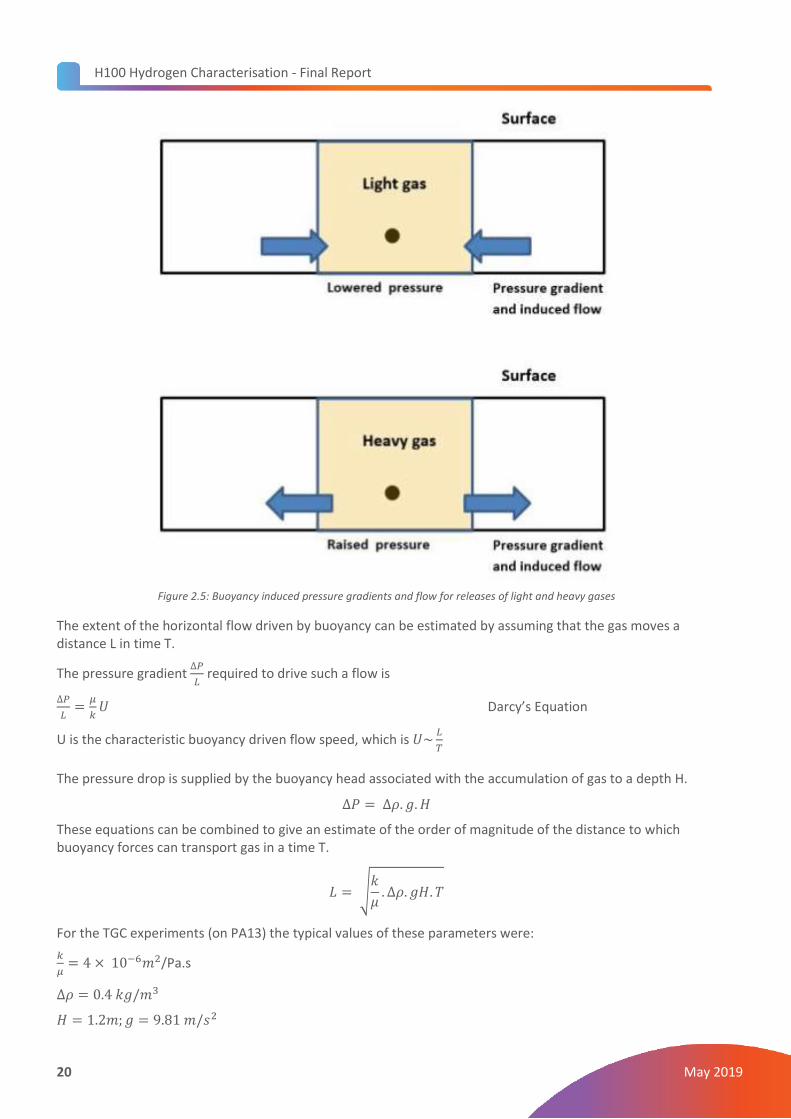
Density differences between the released gas and ambient air produce (small) pressure gradients as shown in Figure 2.5.
H100 Hydrogen Characterisation - Final Report
20 May 2019
Figure 2.5: Buoyancy induced pressure gradients and flow for releases of light and heavy gases
The extent of the horizontal flow driven by buoyancy can be estimated by assuming that the gas moves a distance L in time T.
The pressure gradient ∆𝑃
𝐿 required to drive such a flow is
∆𝑃
𝐿=
𝜇
𝑘𝑈 Darcy’s Equation
U is the characteristic buoyancy driven flow speed, which is 𝑈~𝐿
𝑇
The pressure drop is supplied by the buoyancy head associated with the accumulation of gas to a depth H.
∆𝑃 = ∆𝜌. 𝑔. 𝐻
These equations can be combined to give an estimate of the order of magnitude of the distance to which buoyancy forces can transport gas in a time T.
𝐿 = √𝑘
𝜇. ∆𝜌. 𝑔𝐻. 𝑇
For the TGC experiments (on PA13) the typical values of these parameters were:
𝑘
𝜇= 4 × 10⁻⁶𝑚2/Pa.s
∆𝜌 = 0.4 𝑘𝑔/𝑚3
𝐻 = 1.2𝑚; 𝑔 = 9.81 𝑚/𝑠2
H100 Hydrogen Characterisation - Final Report
21 May 2019
T = 864,000 seconds (240 hours)
Which lead to an estimate of buoyancy driven spreading of the order of 4 metres – which is roughly in line with the observations (Figure 2.4).
In the case of light gases the buoyancy forces tend to restrict horizontal spread of gas. However, even for hydrogen, the buoyancy head is generally < 10Pa which is small compared with the source pressure for any significant leaks.
Differences between the flow of methane and hydrogen from leaks are likely to be dominated by the effects of differing density on turbulent flow through cracks and the effects of differing viscosity on laminar flow in porous ground, rather than through the establishment of small buoyancy related pressure gradients. Solutions of Darcy’s equation in place of the full momentum equation (which includes buoyancy terms) will normally be sufficiently accurate - especially for large (and hence significant) leaks.
3. Below Ground Behaviour of Gas Releases
3.1. Risk Scenarios Where Gas Flows Through A Porous Medium
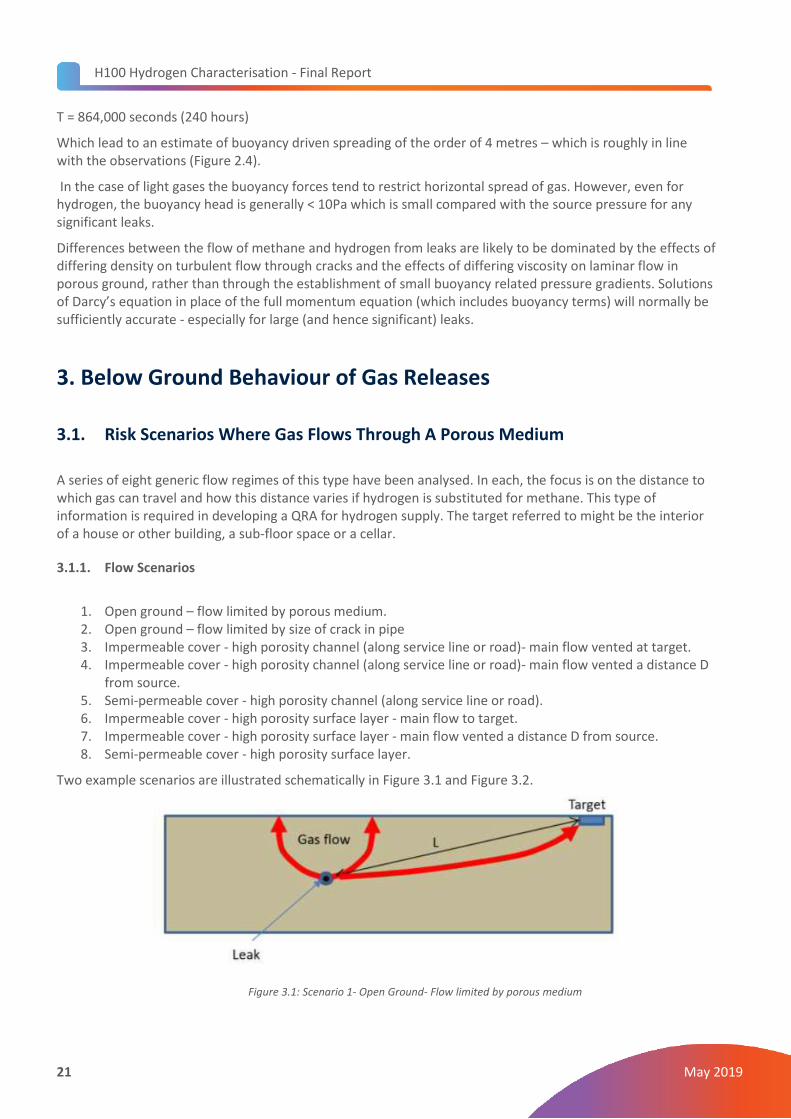
A series of eight generic flow regimes of this type have been analysed. In each, the focus is on the distance to which gas can travel and how this distance varies if hydrogen is substituted for methane. This type of information is required in developing a QRA for hydrogen supply. The target referred to might be the interior of a house or other building, a sub-floor space or a cellar.
3.1.1. Flow Scenarios
1. Open ground – flow limited by porous medium. 2. Open ground – flow limited by size of crack in pipe 3. Impermeable cover - high porosity channel (along service line or road)- main flow vented at target. 4. Impermeable cover - high porosity channel (along service line or road)- main flow vented a distance D
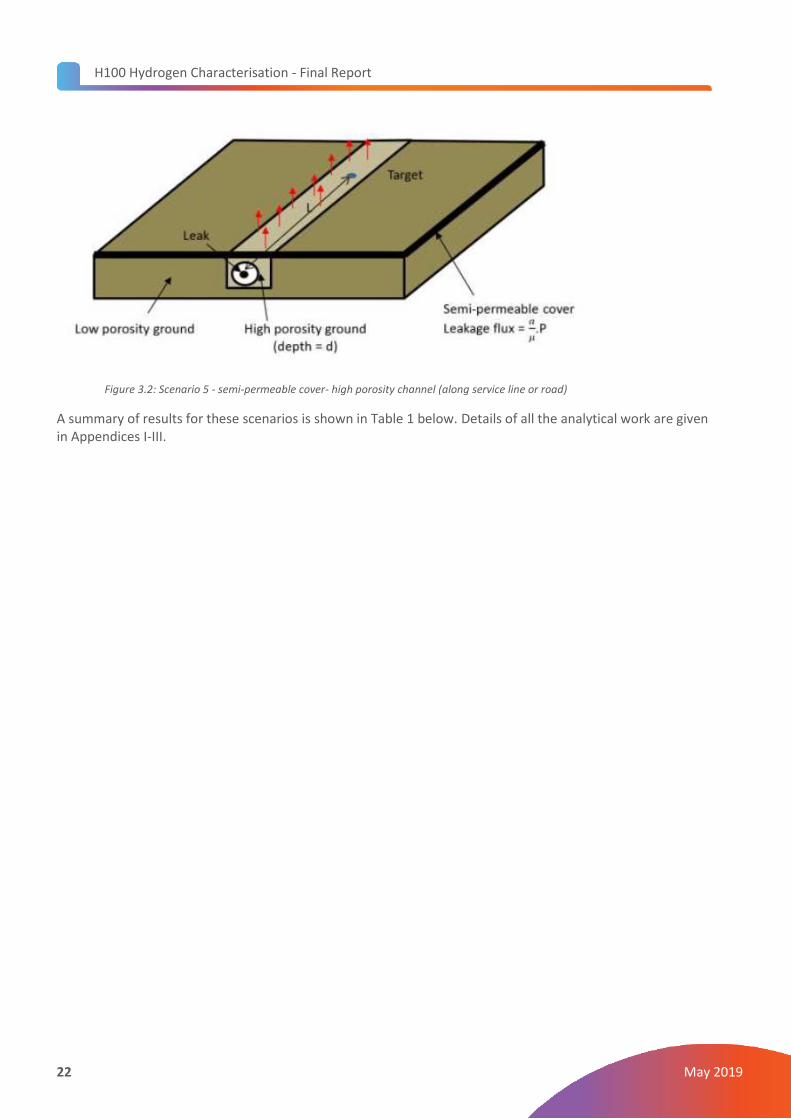
from source. 5. Semi-permeable cover - high porosity channel (along service line or road). 6. Impermeable cover - high porosity surface layer - main flow to target. 7. Impermeable cover - high porosity surface layer - main flow vented a distance D from source. 8. Semi-permeable cover - high porosity surface layer.
Two example scenarios are illustrated schematically in Figure 3.1 and Figure 3.2.
Figure 3.1: Scenario 1- Open Ground- Flow limited by porous medium
H100 Hydrogen Characterisation - Final Report
22 May 2019
Figure 3.2: Scenario 5 - semi-permeable cover- high porosity channel (along service line or road)
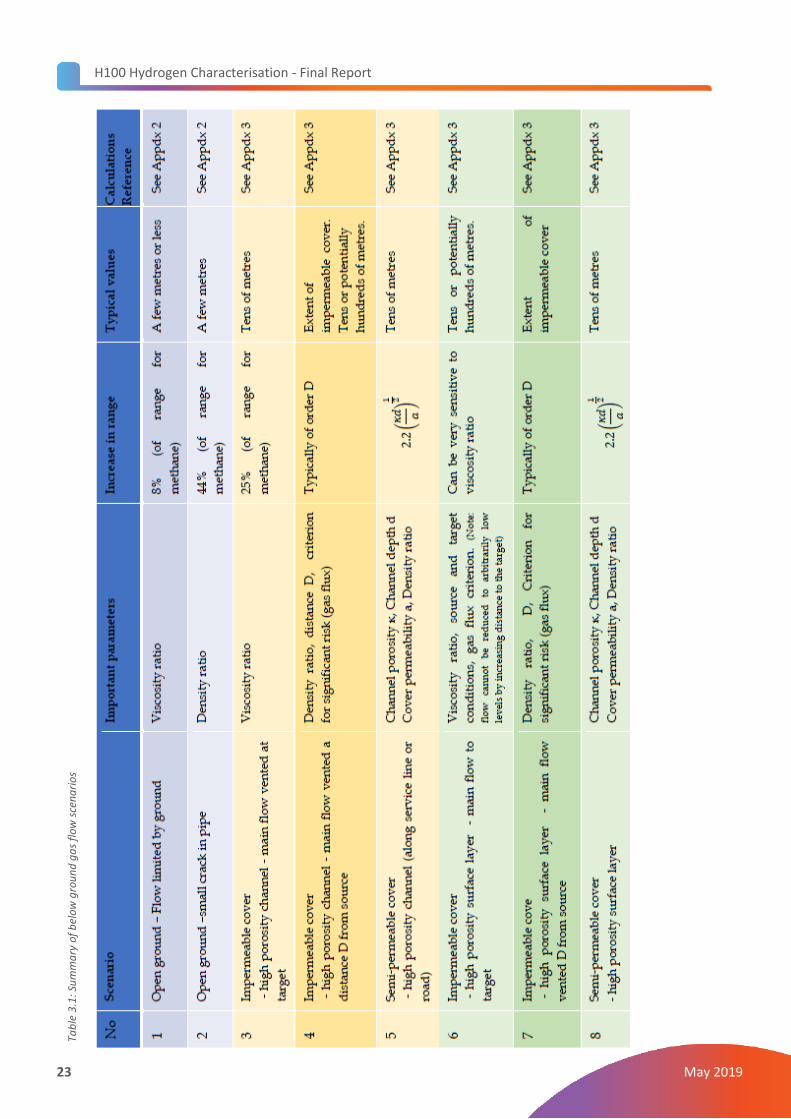
A summary of results for these scenarios is shown in Table 1 below. Details of all the analytical work are given in Appendices I-III.
H100 Hydrogen Characterisation - Final Report
23 May 2019
Tab
le 3
.1: S
um
ma
ry o
f b
elo
w g
rou
nd
ga
s fl
ow
sce
na
rio
s
H100 Hydrogen Characterisation - Final Report
24 May 2019
Notes for Table 3.1:
1. Colour indicates the type of analysis that has been undertaken. Blues indicate a 3D calculation, Greens indicate 2D calculation and Yellows 1D calculation.
2. Pressure: It has been assumed that the supply pressures for methane and hydrogen are similar.
3. Significant Risk Criterion (absolute flow rate): In some cases the change in range depends on the criterion used for a significant gas flux. ERM have suggested a gas flux that could create a flammable atmosphere in a 1m3 space with 1 Air Change per Hour (ACH) would correspond to the lowest potentially significant leak. This would correspond to a volume flow rate of 0.014 l/s. This level of leak is similar to the total release rate in the Tokyo Gas company tests (Section 1). Substantially larger flow rates would be required to cause dangerous conditions in larger or better ventilated spaces.
4. Significant Risk Criterion (relative flow rate): The results in Table 1 were obtained on the assumption that equal volume flows of hydrogen and methane correspond to equivalent levels of risk. The lower flammable limits for natural gas and hydrogen are similar so this is a reasonable first approximation. If more information is available about potential vulnerable spaces (e.g. ventilation rate, ignition sources) then different assumptions about the relative risk of methane and hydrogen might be appropriate.
5. Definition of “a” The definition of the permeability of a surface layer is:
Leakage Flux through surface layer = 𝑎
𝜇. 𝑃
If the cover is a homogenous material, a is related to bulk permeability of the material κ and the thickness of the cover d as:
𝑎 =𝑘
𝑑
The idea of a semi-permeable surface may also be applied to situations where the cover is mostly impermeable but includes numerous, uniformly distributed, fine cracks.
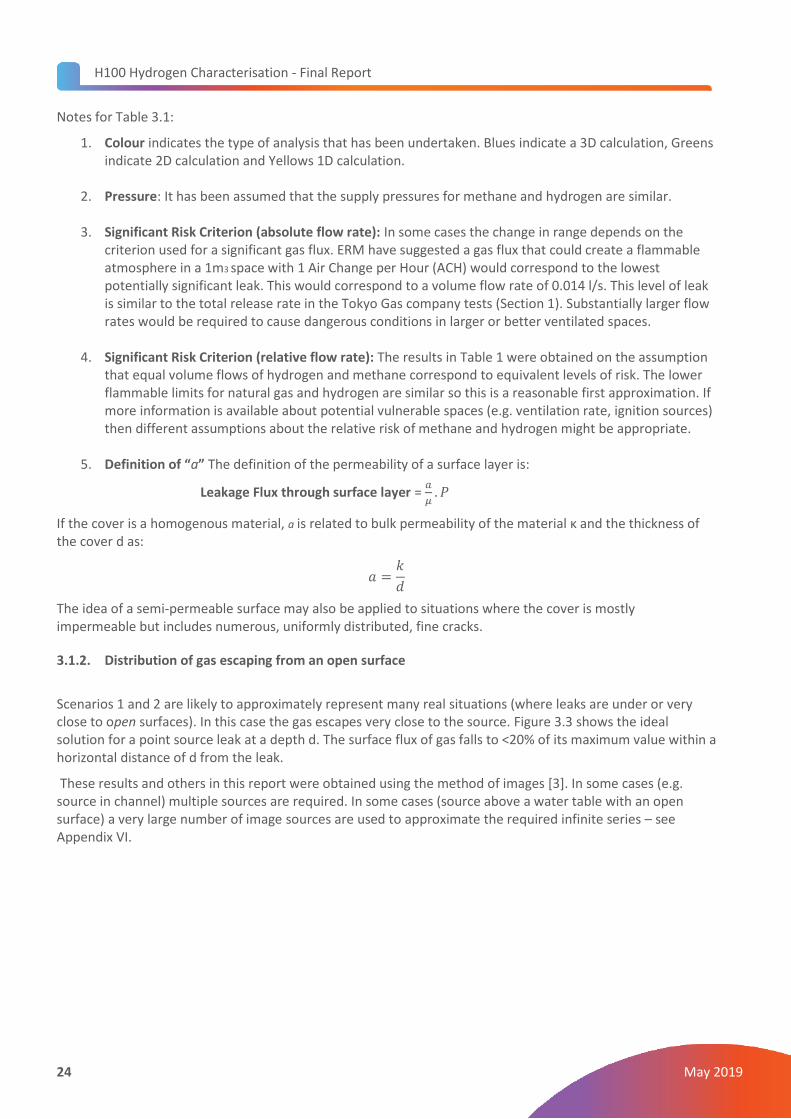
3.1.2. Distribution of gas escaping from an open surface
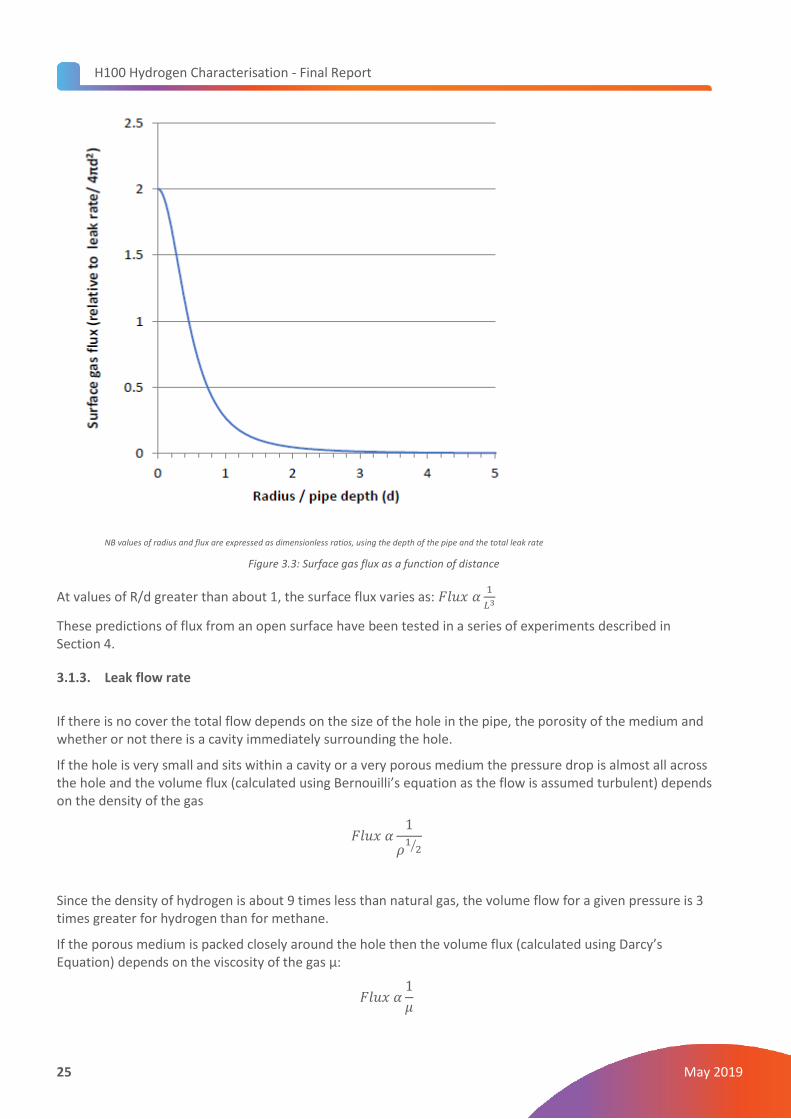
Scenarios 1 and 2 are likely to approximately represent many real situations (where leaks are under or very close to open surfaces). In this case the gas escapes very close to the source. Figure 3.3 shows the ideal solution for a point source leak at a depth d. The surface flux of gas falls to <20% of its maximum value within a horizontal distance of d from the leak.
These results and others in this report were obtained using the method of images [3]. In some cases (e.g. source in channel) multiple sources are required. In some cases (source above a water table with an open surface) a very large number of image sources are used to approximate the required infinite series – see Appendix VI.
H100 Hydrogen Characterisation - Final Report
25 May 2019
NB values of radius and flux are expressed as dimensionless ratios, using the depth of the pipe and the total leak rate
Figure 3.3: Surface gas flux as a function of distance
At values of R/d greater than about 1, the surface flux varies as: 𝐹𝑙𝑢𝑥 𝛼1
𝐿3
These predictions of flux from an open surface have been tested in a series of experiments described in Section 4.
3.1.3. Leak flow rate
If there is no cover the total flow depends on the size of the hole in the pipe, the porosity of the medium and whether or not there is a cavity immediately surrounding the hole.
If the hole is very small and sits within a cavity or a very porous medium the pressure drop is almost all across the hole and the volume flux (calculated using Bernouilli’s equation as the flow is assumed turbulent) depends on the density of the gas
𝐹𝑙𝑢𝑥 𝛼1
𝜌1
2⁄
Since the density of hydrogen is about 9 times less than natural gas, the volume flow for a given pressure is 3 times greater for hydrogen than for methane.
If the porous medium is packed closely around the hole then the volume flux (calculated using Darcy’s Equation) depends on the viscosity of the gas μ:
𝐹𝑙𝑢𝑥 𝛼1
𝜇
H100 Hydrogen Characterisation - Final Report
26 May 2019
Since the viscosity of hydrogen is about 25% less than natural gas, the volume flow for a given pressure is 25% times greater for hydrogen than for methane.
Intermediate cases and various minor corrections (for inertial effects, open surface, water table etc.) are discussed in Appendix 1.
3.1.4. Effects of impermeable cover
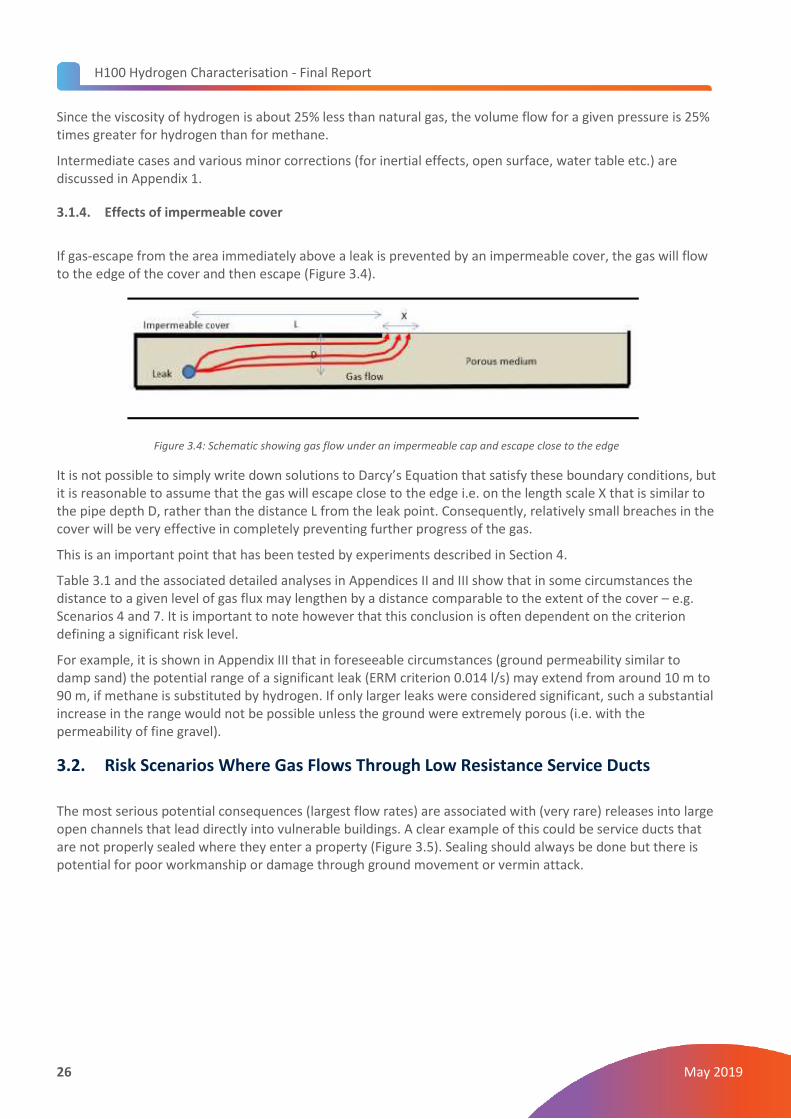
If gas-escape from the area immediately above a leak is prevented by an impermeable cover, the gas will flow to the edge of the cover and then escape (Figure 3.4).
Figure 3.4: Schematic showing gas flow under an impermeable cap and escape close to the edge
It is not possible to simply write down solutions to Darcy’s Equation that satisfy these boundary conditions, but it is reasonable to assume that the gas will escape close to the edge i.e. on the length scale X that is similar to the pipe depth D, rather than the distance L from the leak point. Consequently, relatively small breaches in the cover will be very effective in completely preventing further progress of the gas.
This is an important point that has been tested by experiments described in Section 4.
Table 3.1 and the associated detailed analyses in Appendices II and III show that in some circumstances the distance to a given level of gas flux may lengthen by a distance comparable to the extent of the cover – e.g. Scenarios 4 and 7. It is important to note however that this conclusion is often dependent on the criterion defining a significant risk level.
For example, it is shown in Appendix III that in foreseeable circumstances (ground permeability similar to damp sand) the potential range of a significant leak (ERM criterion 0.014 l/s) may extend from around 10 m to 90 m, if methane is substituted by hydrogen. If only larger leaks were considered significant, such a substantial increase in the range would not be possible unless the ground were extremely porous (i.e. with the permeability of fine gravel).
3.2. Risk Scenarios Where Gas Flows Through Low Resistance Service Ducts
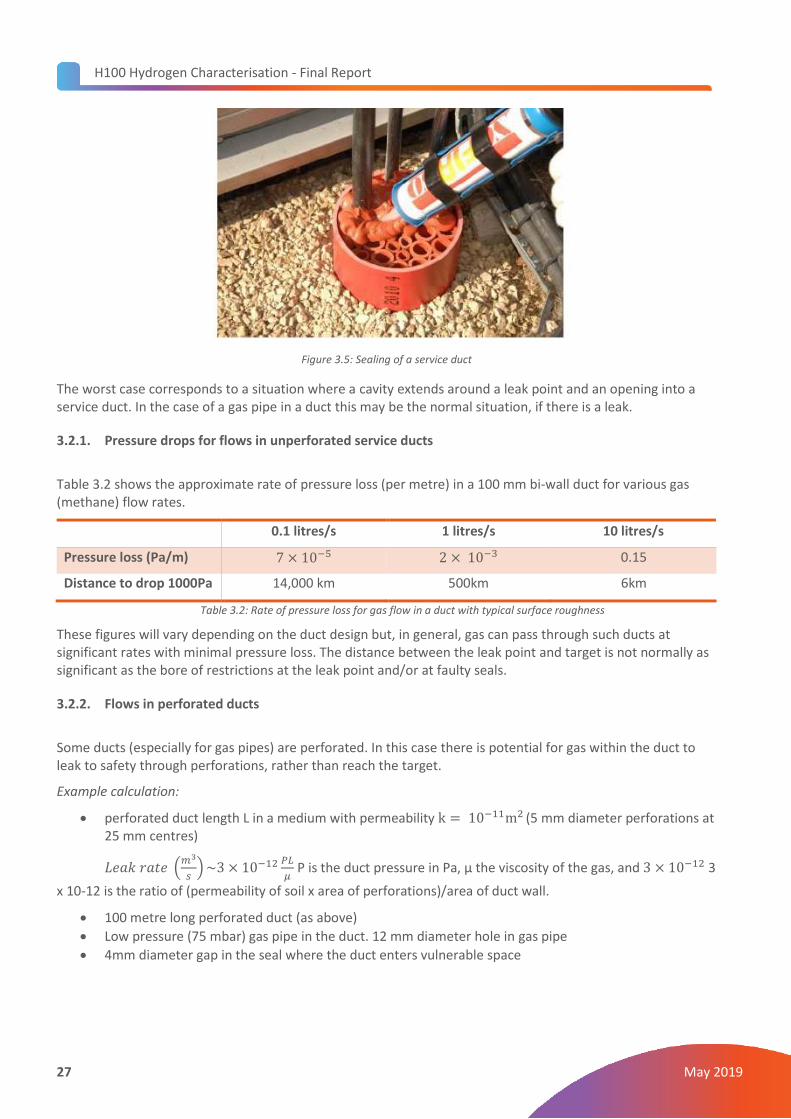
The most serious potential consequences (largest flow rates) are associated with (very rare) releases into large open channels that lead directly into vulnerable buildings. A clear example of this could be service ducts that are not properly sealed where they enter a property (Figure 3.5). Sealing should always be done but there is potential for poor workmanship or damage through ground movement or vermin attack.
H100 Hydrogen Characterisation - Final Report
27 May 2019
Figure 3.5: Sealing of a service duct
The worst case corresponds to a situation where a cavity extends around a leak point and an opening into a service duct. In the case of a gas pipe in a duct this may be the normal situation, if there is a leak.
3.2.1. Pressure drops for flows in unperforated service ducts
Table 3.2 shows the approximate rate of pressure loss (per metre) in a 100 mm bi-wall duct for various gas (methane) flow rates.
0.1 litres/s 1 litres/s 10 litres/s
Pressure loss (Pa/m) 7 × 10⁻⁵ 2 × 10⁻³ 0.15
Distance to drop 1000Pa 14,000 km 500km 6km
Table 3.2: Rate of pressure loss for gas flow in a duct with typical surface roughness
These figures will vary depending on the duct design but, in general, gas can pass through such ducts at significant rates with minimal pressure loss. The distance between the leak point and target is not normally as significant as the bore of restrictions at the leak point and/or at faulty seals.
3.2.2. Flows in perforated ducts
Some ducts (especially for gas pipes) are perforated. In this case there is potential for gas within the duct to leak to safety through perforations, rather than reach the target.
Example calculation:
• perforated duct length L in a medium with permeability k = 10−11m2 (5 mm diameter perforations at
25 mm centres)
𝐿𝑒𝑎𝑘 𝑟𝑎𝑡𝑒 (𝑚3
𝑠) ~3 × 10⁻¹² 𝑃𝐿
𝜇 P is the duct pressure in Pa, μ the viscosity of the gas, and 3 × 10⁻¹² 3
x 10-12 is the ratio of (permeability of soil x area of perforations)/area of duct wall.
• 100 metre long perforated duct (as above)
• Low pressure (75 mbar) gas pipe in the duct. 12 mm diameter hole in gas pipe
• 4mm diameter gap in the seal where the duct enters vulnerable space
H100 Hydrogen Characterisation - Final Report
28 May 2019
This kind of problem involves simultaneous solution of equations governing flows into the duct from the pipe and out of the duct through perforations and into the vulnerable space.
In this case <10% of the gas released reaches the vulnerable space – the bulk finds its way out of the duct via perforations. If the hydrogen is substituted for methane the volume flow of gas to the vulnerable space increases by a factor of about 4.5 (to around 1 l/s).
This is significantly more than the factor of 3 to be expected for a purely turbulent leak or 1.25 for a purely laminar leak. In general this situation, where a high proportion of gas leaks to safety, corresponds to the largest proportional increase in volume flow to danger if hydrogen is substituted for methane.
Table 3.3 shows the variation of flow rate with the length of perforated duct between leak and vulnerable target. In this case there is a drop in the flow rate to the target with increasing distance. This is not caused by increased flow resistance in the duct but by the fact that for longer ducts there is more opportunity for the flow to escape the duct to safety.
Length of duct (m) 50 100 200
Flow rate to vulnerable target (l/s)
1.31 0.96 0.68
Table 3.3: Example flow rates to a vulnerable target along perforated ducts of different lengths
The mitigation of risk by gas flows through perforations in a duct depends on the permeability of the medium. If a non-retentive material like sand is used, a reasonably high level of permeability can be relied upon, unless the ground is completely waterlogged. The recovery of permeability after heavy rain has been studied experimentally – Section 4.
3.2.3. Leak point and entry into duct separated by a porous medium
Because pressure losses along the duct are low, the entry point into the duct effectively becomes the entry point into the target. The problem reduces to that treated in Section 3.1. The effects of changing from methane to hydrogen are similar to those summarised in Table 3.1. More information is given in Appendix IV.
4. Experimental Work
Experimental work has been undertaken to complement the analysis described in Section 3 and investigate the following:
1. Flow rate / pressure curves for leaks into media with different permeability 2. Effects of the water content of the ground on gas flow 3. Distribution of surface gas flux near a buried leak 4. Distribution of surface gas flux where gas escapes at the edge of an impermeable cover
H100 Hydrogen Characterisation - Final Report
29 May 2019
4.1. Flow Rates for a Leaks into Media with Different Permeability
4.1.1. Equipment
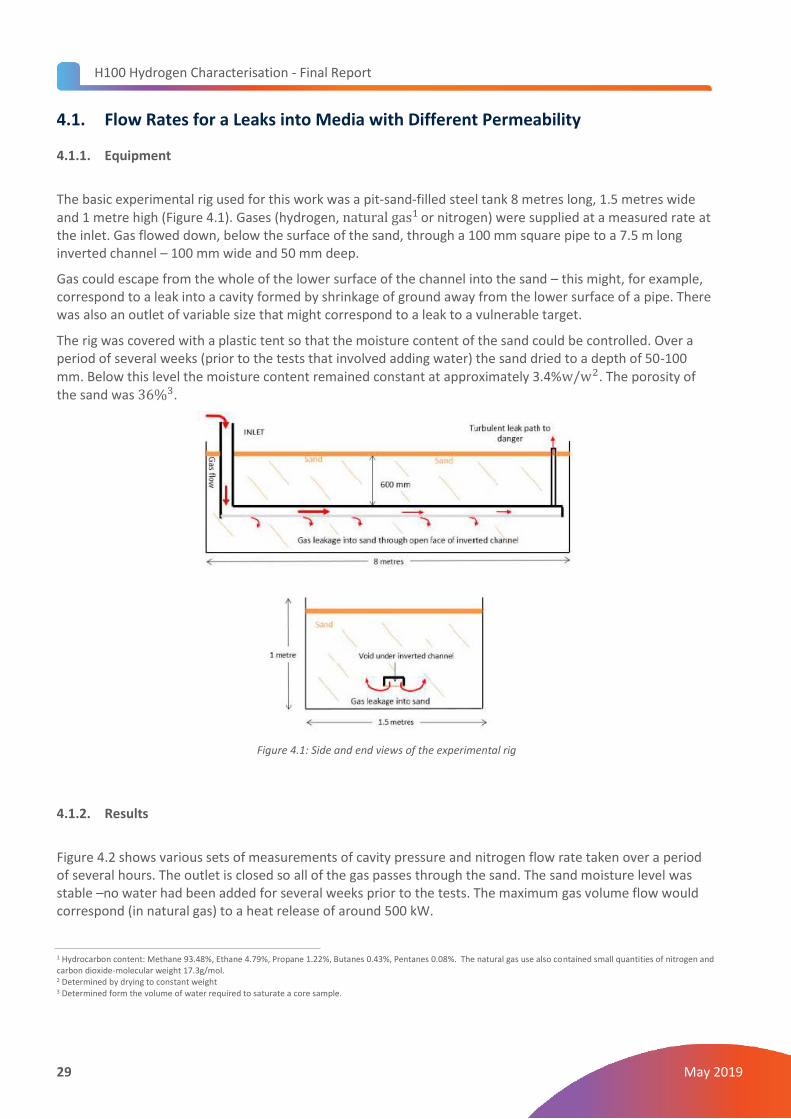
The basic experimental rig used for this work was a pit-sand-filled steel tank 8 metres long, 1.5 metres wide and 1 metre high (Figure 4.1). Gases (hydrogen, natural gas1
or nitrogen) were supplied at a measured rate at the inlet. Gas flowed down, below the surface of the sand, through a 100 mm square pipe to a 7.5 m long inverted channel – 100 mm wide and 50 mm deep.
Gas could escape from the whole of the lower surface of the channel into the sand – this might, for example, correspond to a leak into a cavity formed by shrinkage of ground away from the lower surface of a pipe. There was also an outlet of variable size that might correspond to a leak to a vulnerable target.
The rig was covered with a plastic tent so that the moisture content of the sand could be controlled. Over a period of several weeks (prior to the tests that involved adding water) the sand dried to a depth of 50-100 mm. Below this level the moisture content remained constant at approximately 3.4%w/w2. The porosity of the sand was 36%3.
Figure 4.1: Side and end views of the experimental rig
4.1.2. Results
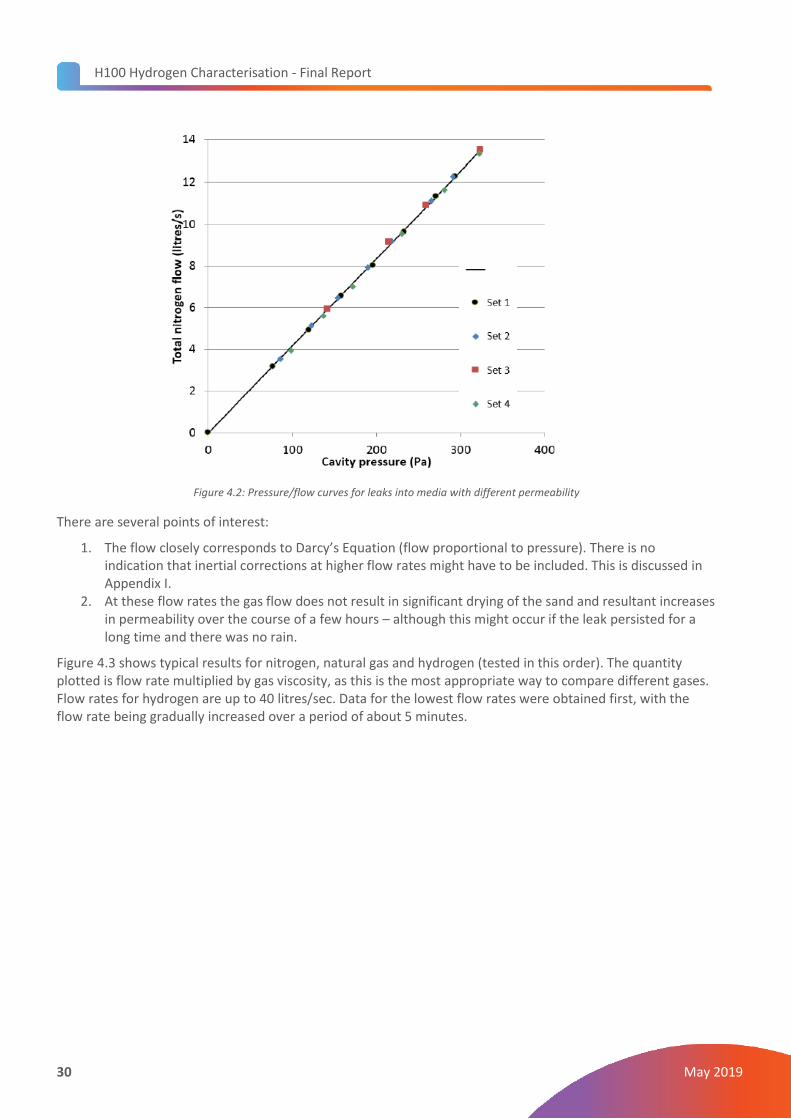
Figure 4.2 shows various sets of measurements of cavity pressure and nitrogen flow rate taken over a period of several hours. The outlet is closed so all of the gas passes through the sand. The sand moisture level was stable –no water had been added for several weeks prior to the tests. The maximum gas volume flow would correspond (in natural gas) to a heat release of around 500 kW.
1 Hydrocarbon content: Methane 93.48%, Ethane 4.79%, Propane 1.22%, Butanes 0.43%, Pentanes 0.08%. The natural gas use also contained small quantities of nitrogen and carbon dioxide-molecular weight 17.3g/mol. 2 Determined by drying to constant weight 3 Determined form the volume of water required to saturate a core sample.
H100 Hydrogen Characterisation - Final Report
30 May 2019
Figure 4.2: Pressure/flow curves for leaks into media with different permeability
There are several points of interest:
1. The flow closely corresponds to Darcy’s Equation (flow proportional to pressure). There is no indication that inertial corrections at higher flow rates might have to be included. This is discussed in Appendix I.
2. At these flow rates the gas flow does not result in significant drying of the sand and resultant increases in permeability over the course of a few hours – although this might occur if the leak persisted for a long time and there was no rain.
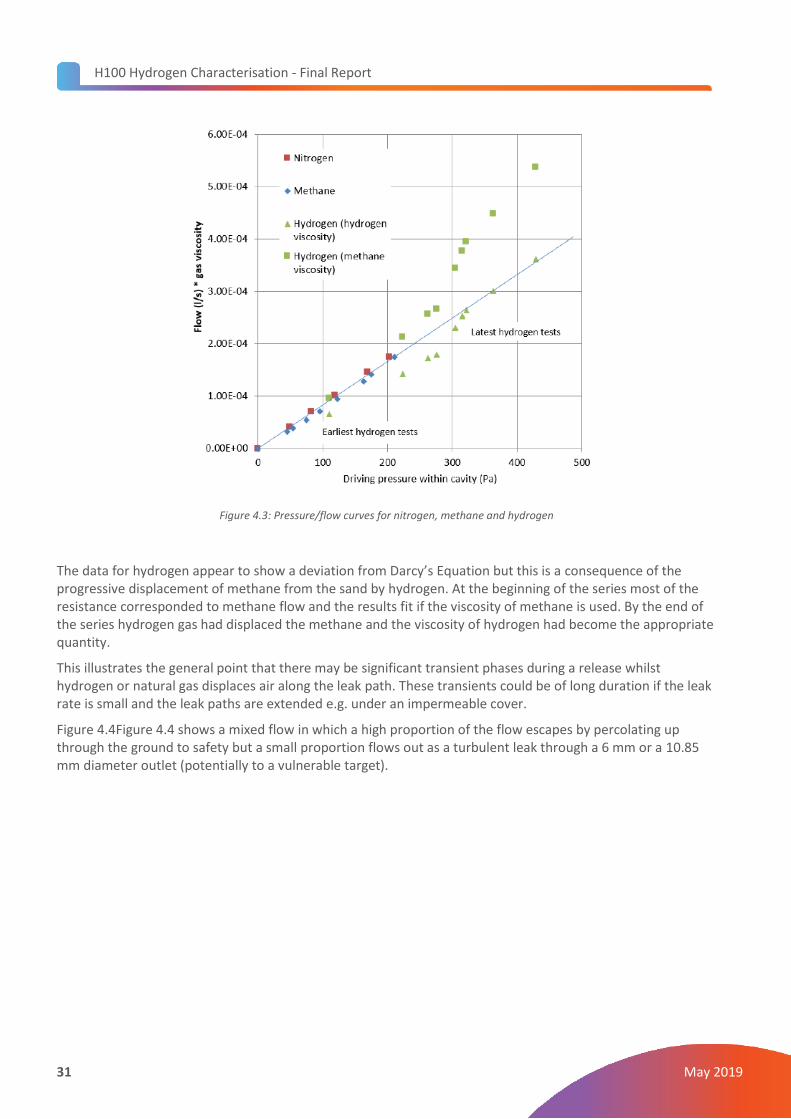
Figure 4.3 shows typical results for nitrogen, natural gas and hydrogen (tested in this order). The quantity plotted is flow rate multiplied by gas viscosity, as this is the most appropriate way to compare different gases. Flow rates for hydrogen are up to 40 litres/sec. Data for the lowest flow rates were obtained first, with the flow rate being gradually increased over a period of about 5 minutes.
H100 Hydrogen Characterisation - Final Report
31 May 2019
Figure 4.3: Pressure/flow curves for nitrogen, methane and hydrogen
The data for hydrogen appear to show a deviation from Darcy’s Equation but this is a consequence of the progressive displacement of methane from the sand by hydrogen. At the beginning of the series most of the resistance corresponded to methane flow and the results fit if the viscosity of methane is used. By the end of the series hydrogen gas had displaced the methane and the viscosity of hydrogen had become the appropriate quantity.
This illustrates the general point that there may be significant transient phases during a release whilst hydrogen or natural gas displaces air along the leak path. These transients could be of long duration if the leak rate is small and the leak paths are extended e.g. under an impermeable cover.
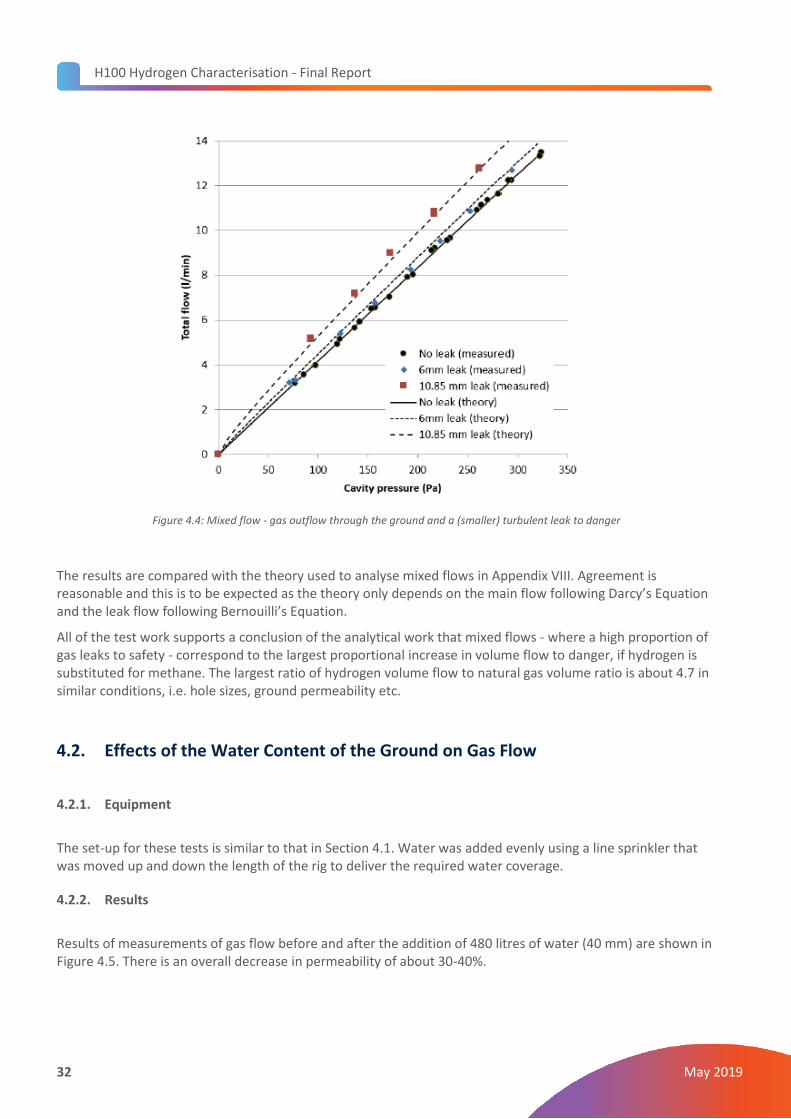
Figure 4.4Figure 4.4 shows a mixed flow in which a high proportion of the flow escapes by percolating up through the ground to safety but a small proportion flows out as a turbulent leak through a 6 mm or a 10.85 mm diameter outlet (potentially to a vulnerable target).
H100 Hydrogen Characterisation - Final Report
32 May 2019
Figure 4.4: Mixed flow - gas outflow through the ground and a (smaller) turbulent leak to danger
The results are compared with the theory used to analyse mixed flows in Appendix VIII. Agreement is reasonable and this is to be expected as the theory only depends on the main flow following Darcy’s Equation and the leak flow following Bernouilli’s Equation.
All of the test work supports a conclusion of the analytical work that mixed flows - where a high proportion of gas leaks to safety - correspond to the largest proportional increase in volume flow to danger, if hydrogen is substituted for methane. The largest ratio of hydrogen volume flow to natural gas volume ratio is about 4.7 in similar conditions, i.e. hole sizes, ground permeability etc.
4.2. Effects of the Water Content of the Ground on Gas Flow
4.2.1. Equipment
The set-up for these tests is similar to that in Section 4.1. Water was added evenly using a line sprinkler that was moved up and down the length of the rig to deliver the required water coverage.
4.2.2. Results
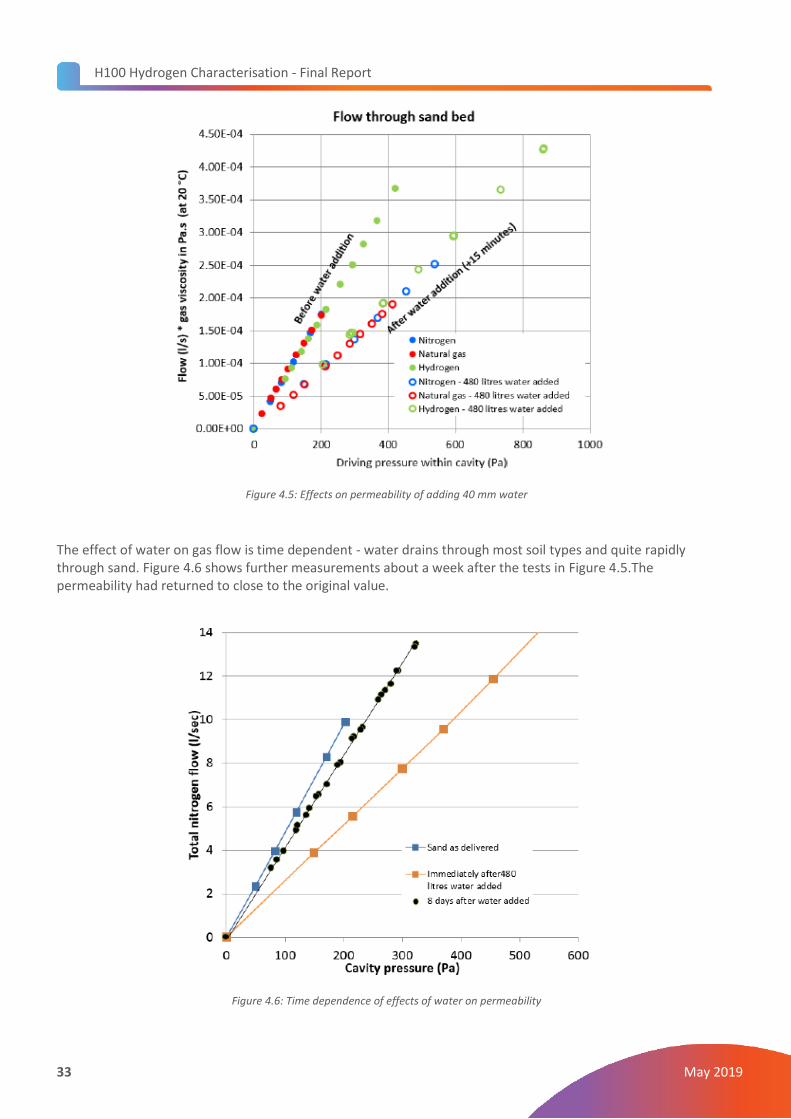
Results of measurements of gas flow before and after the addition of 480 litres of water (40 mm) are shown in Figure 4.5. There is an overall decrease in permeability of about 30-40%.
H100 Hydrogen Characterisation - Final Report
33 May 2019
Figure 4.5: Effects on permeability of adding 40 mm water
The effect of water on gas flow is time dependent - water drains through most soil types and quite rapidly through sand. Figure 4.6 shows further measurements about a week after the tests in Figure 4.5.The permeability had returned to close to the original value.
Figure 4.6: Time dependence of effects of water on permeability
H100 Hydrogen Characterisation - Final Report
34 May 2019
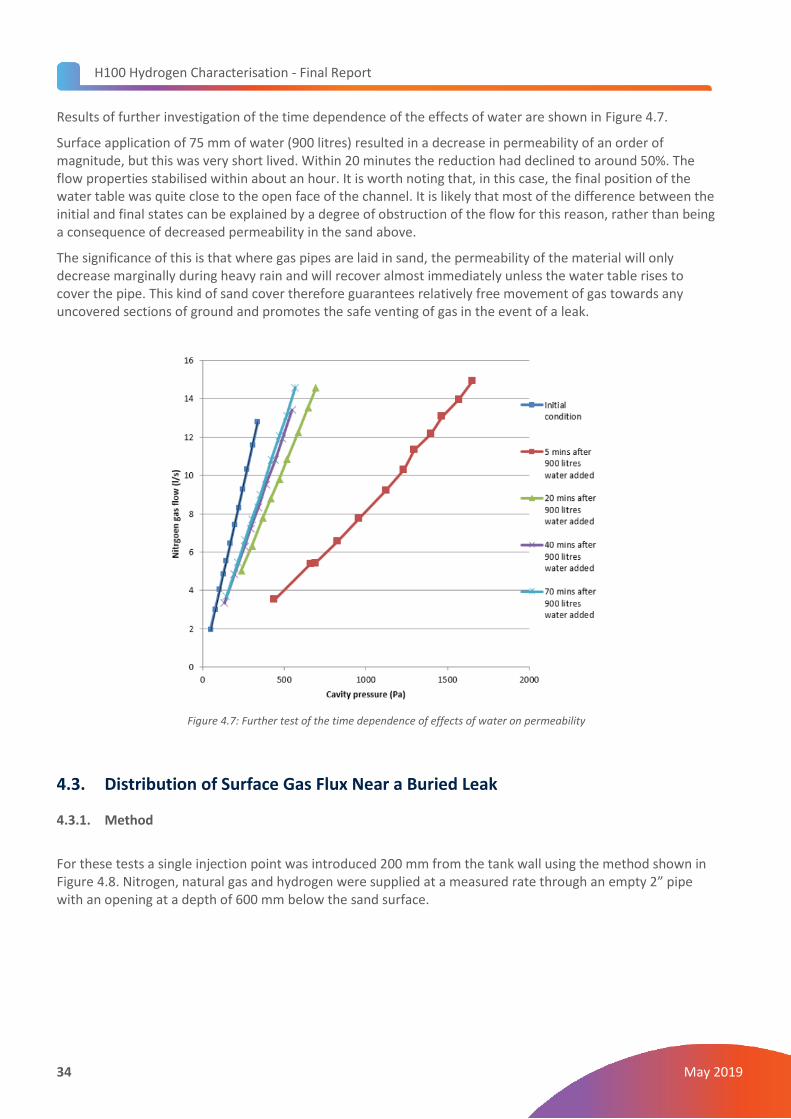
Results of further investigation of the time dependence of the effects of water are shown in Figure 4.7.
Surface application of 75 mm of water (900 litres) resulted in a decrease in permeability of an order of magnitude, but this was very short lived. Within 20 minutes the reduction had declined to around 50%. The flow properties stabilised within about an hour. It is worth noting that, in this case, the final position of the water table was quite close to the open face of the channel. It is likely that most of the difference between the initial and final states can be explained by a degree of obstruction of the flow for this reason, rather than being a consequence of decreased permeability in the sand above.
The significance of this is that where gas pipes are laid in sand, the permeability of the material will only decrease marginally during heavy rain and will recover almost immediately unless the water table rises to cover the pipe. This kind of sand cover therefore guarantees relatively free movement of gas towards any uncovered sections of ground and promotes the safe venting of gas in the event of a leak.
Figure 4.7: Further test of the time dependence of effects of water on permeability
4.3. Distribution of Surface Gas Flux Near a Buried Leak
4.3.1. Method
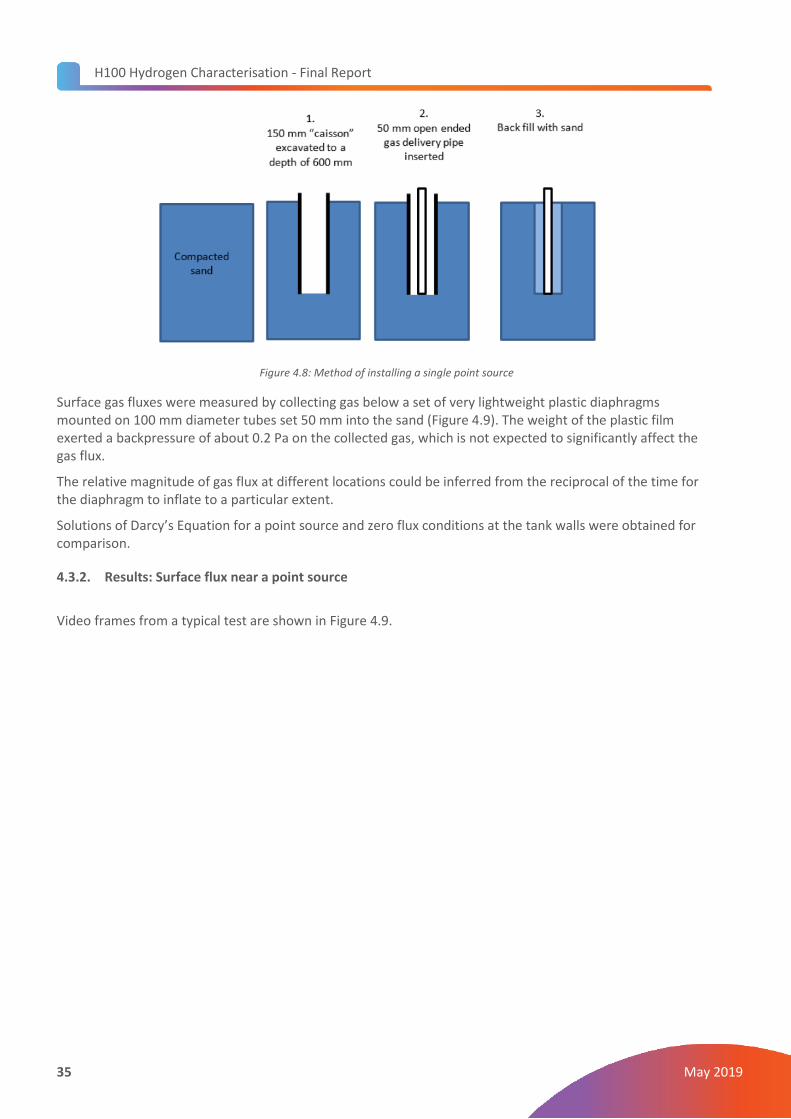
For these tests a single injection point was introduced 200 mm from the tank wall using the method shown in Figure 4.8. Nitrogen, natural gas and hydrogen were supplied at a measured rate through an empty 2” pipe with an opening at a depth of 600 mm below the sand surface.
H100 Hydrogen Characterisation - Final Report
35 May 2019
Figure 4.8: Method of installing a single point source
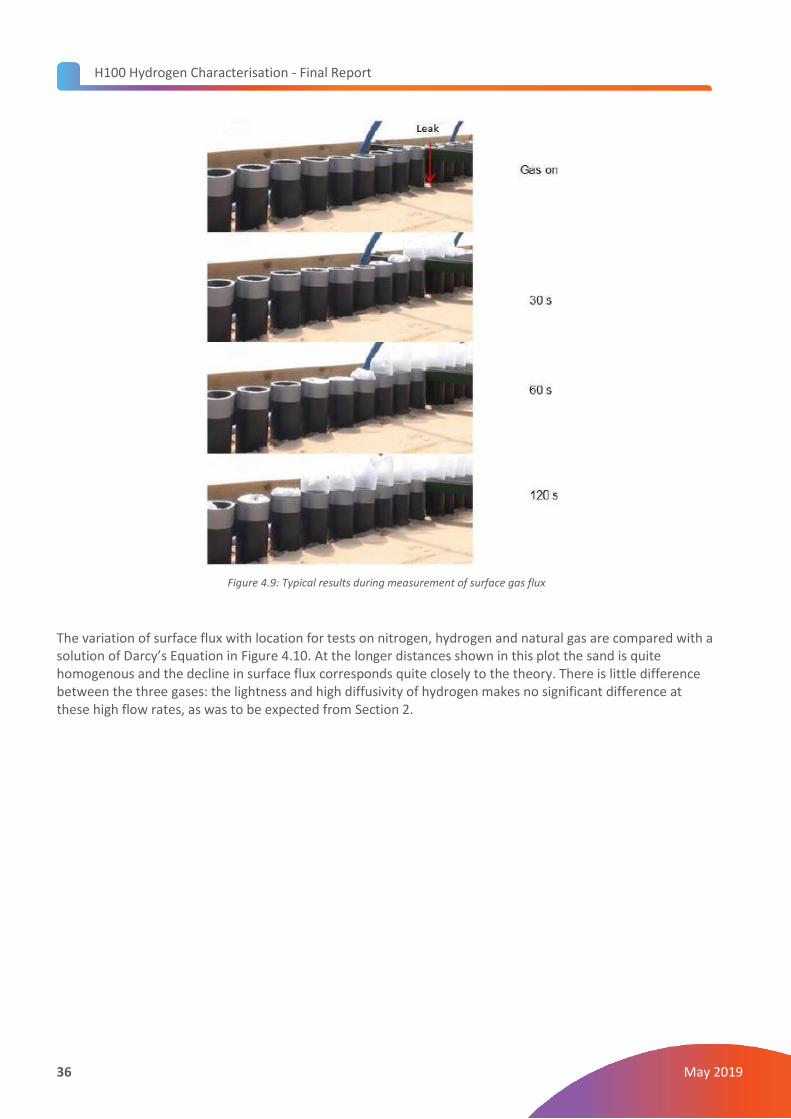
Surface gas fluxes were measured by collecting gas below a set of very lightweight plastic diaphragms mounted on 100 mm diameter tubes set 50 mm into the sand (Figure 4.9). The weight of the plastic film exerted a backpressure of about 0.2 Pa on the collected gas, which is not expected to significantly affect the gas flux.
The relative magnitude of gas flux at different locations could be inferred from the reciprocal of the time for the diaphragm to inflate to a particular extent.
Solutions of Darcy’s Equation for a point source and zero flux conditions at the tank walls were obtained for comparison.
4.3.2. Results: Surface flux near a point source
Video frames from a typical test are shown in Figure 4.9.
H100 Hydrogen Characterisation - Final Report
36 May 2019
Figure 4.9: Typical results during measurement of surface gas flux
The variation of surface flux with location for tests on nitrogen, hydrogen and natural gas are compared with a solution of Darcy’s Equation in Figure 4.10. At the longer distances shown in this plot the sand is quite homogenous and the decline in surface flux corresponds quite closely to the theory. There is little difference between the three gases: the lightness and high diffusivity of hydrogen makes no significant difference at these high flow rates, as was to be expected from Section 2.
H100 Hydrogen Characterisation - Final Report
37 May 2019
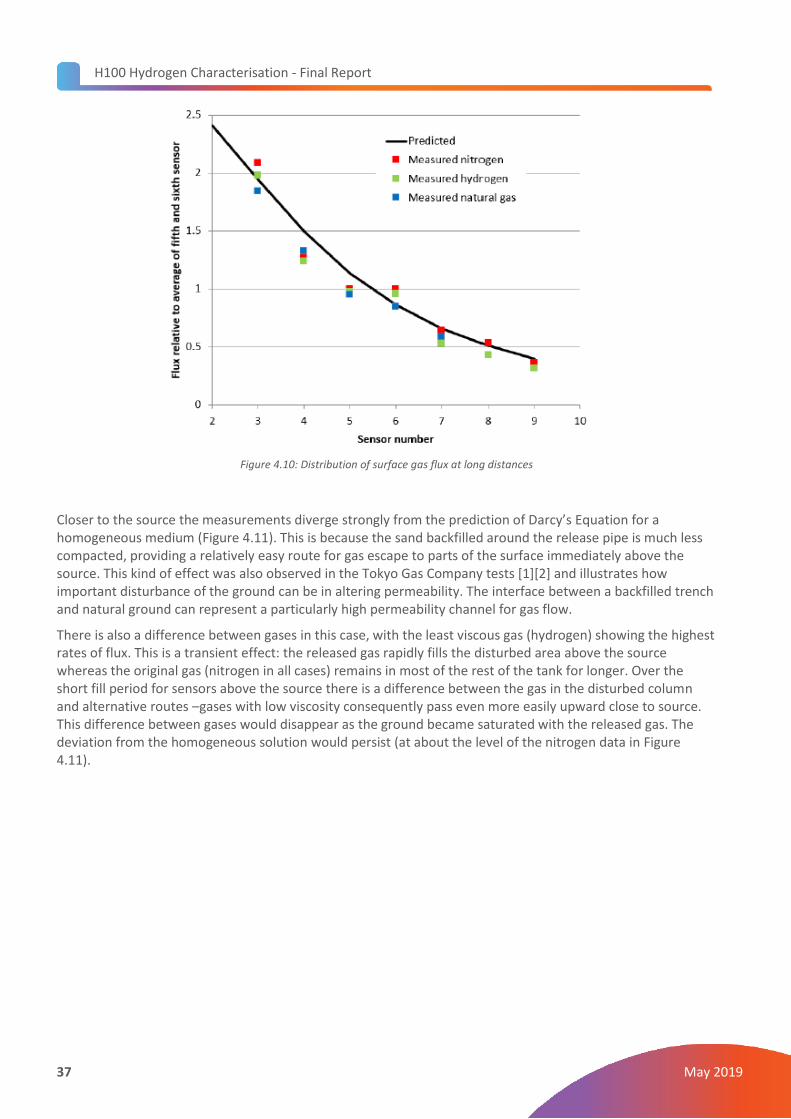
Figure 4.10: Distribution of surface gas flux at long distances
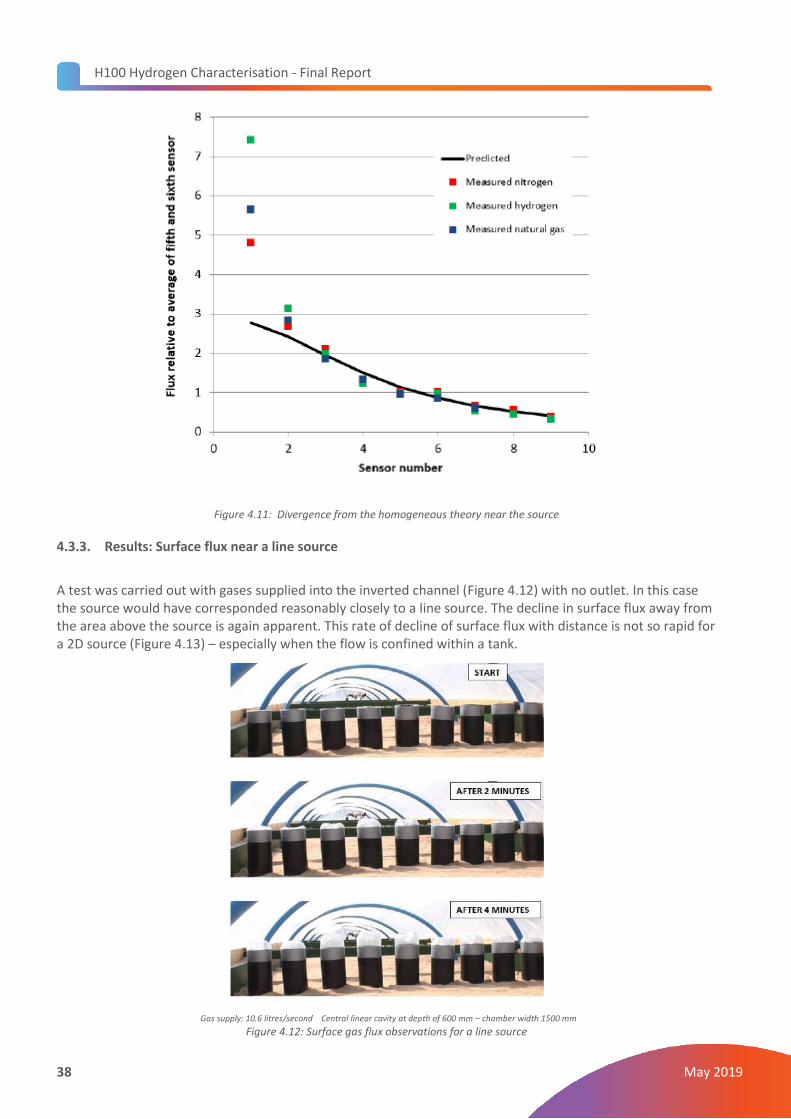
Closer to the source the measurements diverge strongly from the prediction of Darcy’s Equation for a homogeneous medium (Figure 4.11). This is because the sand backfilled around the release pipe is much less compacted, providing a relatively easy route for gas escape to parts of the surface immediately above the source. This kind of effect was also observed in the Tokyo Gas Company tests [1][2] and illustrates how important disturbance of the ground can be in altering permeability. The interface between a backfilled trench and natural ground can represent a particularly high permeability channel for gas flow.
There is also a difference between gases in this case, with the least viscous gas (hydrogen) showing the highest rates of flux. This is a transient effect: the released gas rapidly fills the disturbed area above the source whereas the original gas (nitrogen in all cases) remains in most of the rest of the tank for longer. Over the short fill period for sensors above the source there is a difference between the gas in the disturbed column and alternative routes –gases with low viscosity consequently pass even more easily upward close to source. This difference between gases would disappear as the ground became saturated with the released gas. The deviation from the homogeneous solution would persist (at about the level of the nitrogen data in Figure 4.11).
H100 Hydrogen Characterisation - Final Report
38 May 2019
Figure 4.11: Divergence from the homogeneous theory near the source
4.3.3. Results: Surface flux near a line source
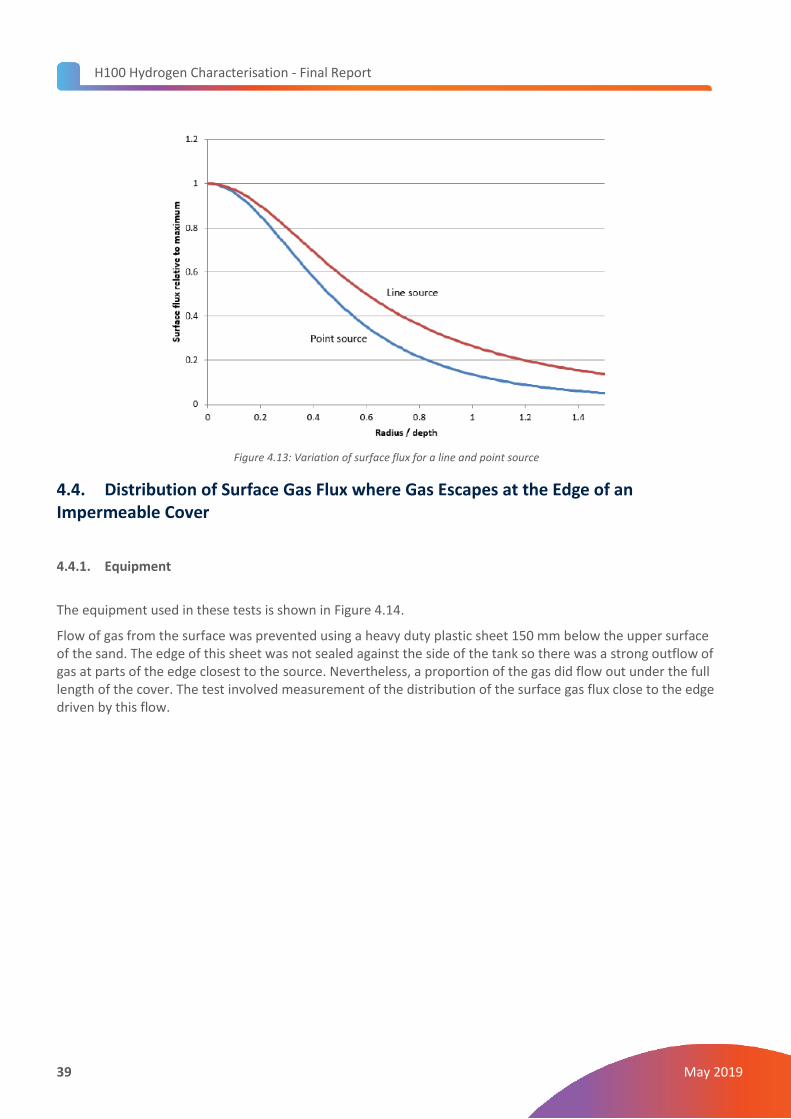
A test was carried out with gases supplied into the inverted channel (Figure 4.12) with no outlet. In this case the source would have corresponded reasonably closely to a line source. The decline in surface flux away from the area above the source is again apparent. This rate of decline of surface flux with distance is not so rapid for a 2D source (Figure 4.13) – especially when the flow is confined within a tank.
Gas supply: 10.6 litres/second Central linear cavity at depth of 600 mm – chamber width 1500 mm
Figure 4.12: Surface gas flux observations for a line source
H100 Hydrogen Characterisation - Final Report
39 May 2019
Figure 4.13: Variation of surface flux for a line and point source
4.4. Distribution of Surface Gas Flux where Gas Escapes at the Edge of an Impermeable Cover
4.4.1. Equipment
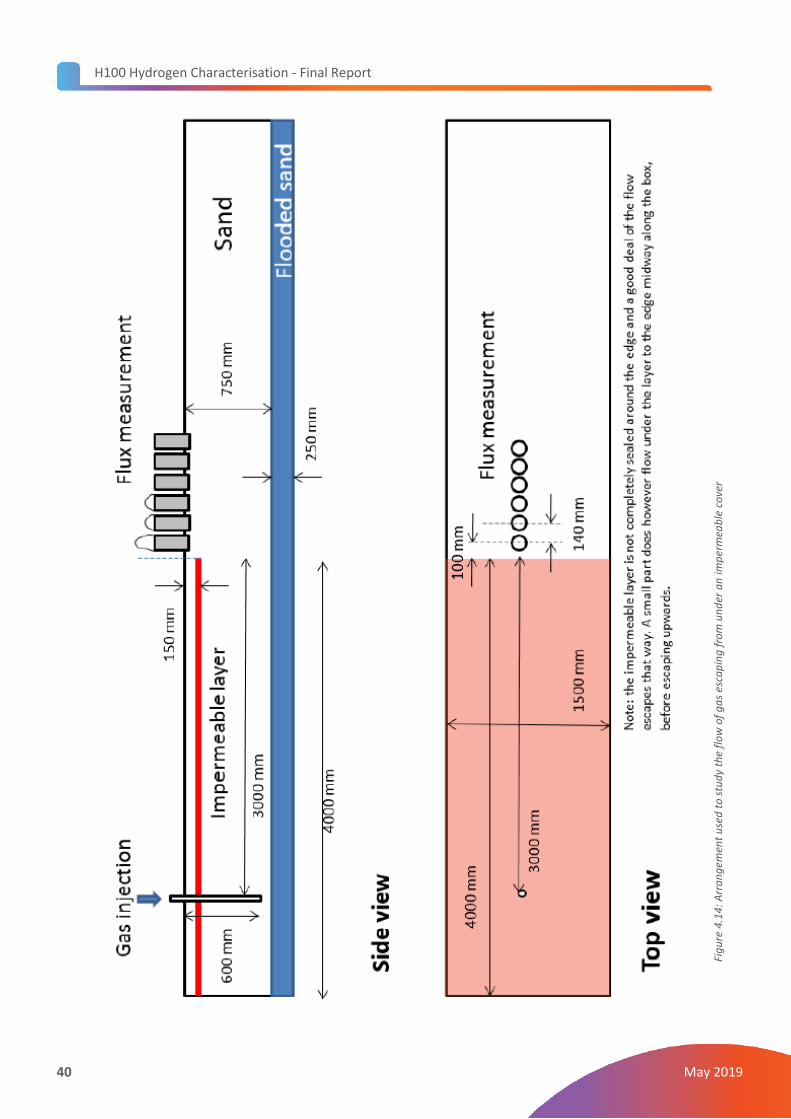
The equipment used in these tests is shown in Figure 4.14.
Flow of gas from the surface was prevented using a heavy duty plastic sheet 150 mm below the upper surface of the sand. The edge of this sheet was not sealed against the side of the tank so there was a strong outflow of gas at parts of the edge closest to the source. Nevertheless, a proportion of the gas did flow out under the full length of the cover. The test involved measurement of the distribution of the surface gas flux close to the edge driven by this flow.
H100 Hydrogen Characterisation - Final Report
40 May 2019
Fig
ure
4.1
4: A
rra
ng
emen
t u
sed
to
stu
dy
the
flo
w o
f g
as
esca
pin
g f
rom
un
der
an
imp
erm
eab
le c
ove
r
H100 Hydrogen Characterisation - Final Report
41 May 2019
4.4.2. Results
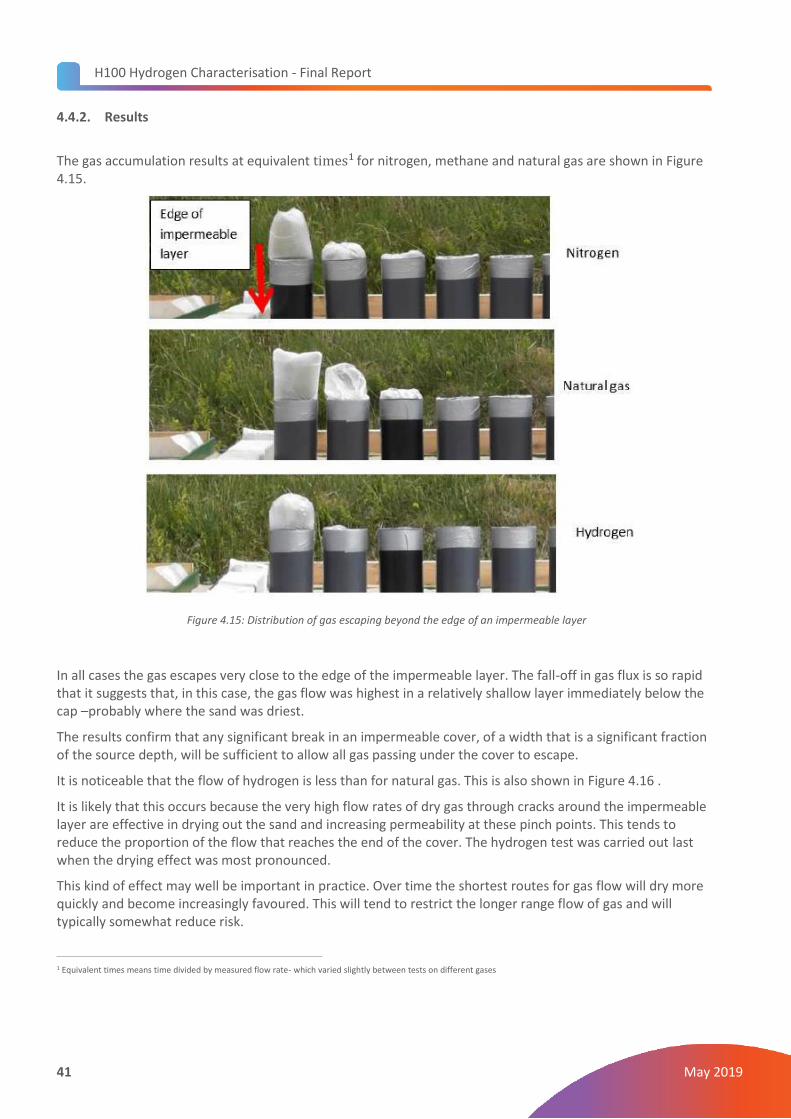
The gas accumulation results at equivalent times1 for nitrogen, methane and natural gas are shown in Figure
4.15.
Figure 4.15: Distribution of gas escaping beyond the edge of an impermeable layer
In all cases the gas escapes very close to the edge of the impermeable layer. The fall-off in gas flux is so rapid that it suggests that, in this case, the gas flow was highest in a relatively shallow layer immediately below the cap –probably where the sand was driest.
The results confirm that any significant break in an impermeable cover, of a width that is a significant fraction of the source depth, will be sufficient to allow all gas passing under the cover to escape.
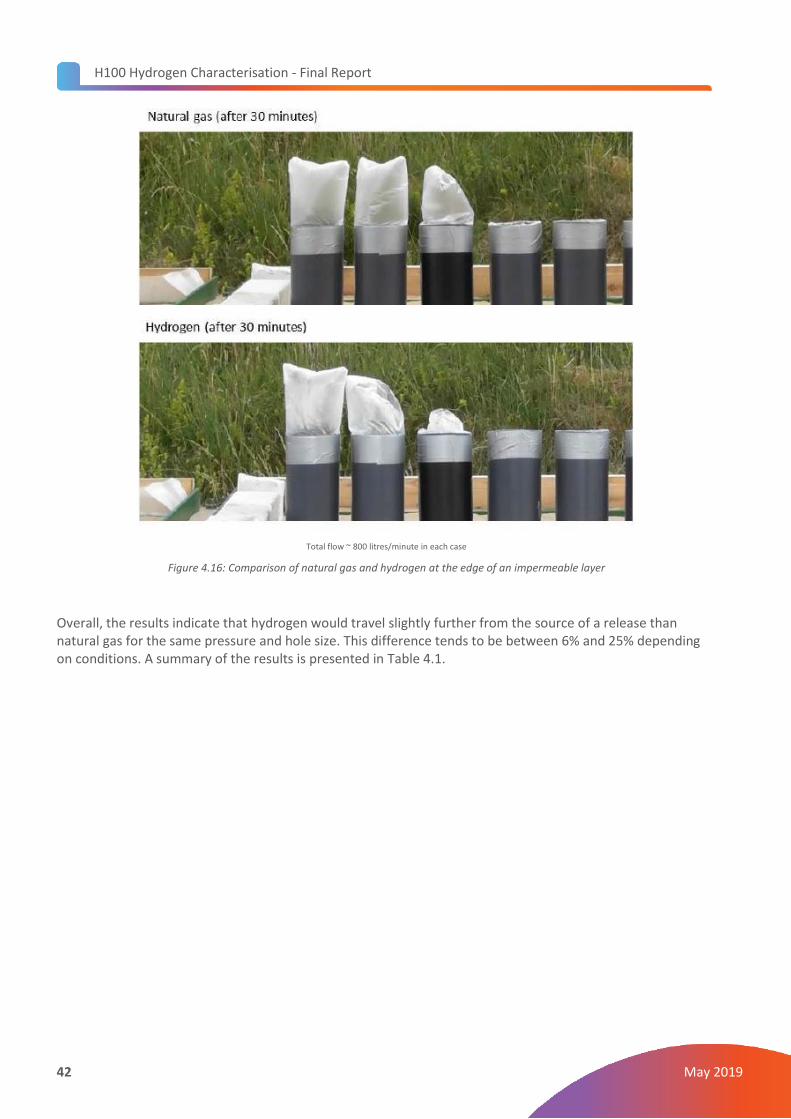
It is noticeable that the flow of hydrogen is less than for natural gas. This is also shown in Figure 4.16 .
It is likely that this occurs because the very high flow rates of dry gas through cracks around the impermeable layer are effective in drying out the sand and increasing permeability at these pinch points. This tends to reduce the proportion of the flow that reaches the end of the cover. The hydrogen test was carried out last when the drying effect was most pronounced.
This kind of effect may well be important in practice. Over time the shortest routes for gas flow will dry more quickly and become increasingly favoured. This will tend to restrict the longer range flow of gas and will typically somewhat reduce risk.
1 Equivalent times means time divided by measured flow rate- which varied slightly between tests on different gases
H100 Hydrogen Characterisation - Final Report
42 May 2019
Total flow ~ 800 litres/minute in each case
Figure 4.16: Comparison of natural gas and hydrogen at the edge of an impermeable layer
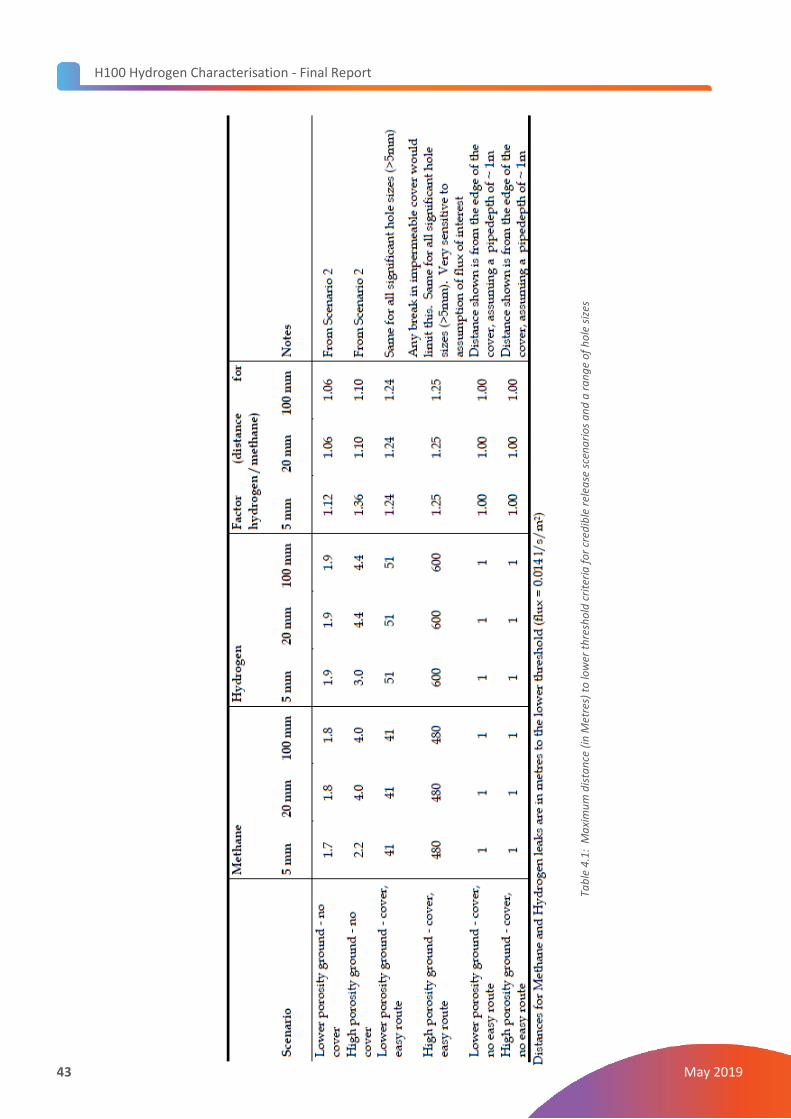
Overall, the results indicate that hydrogen would travel slightly further from the source of a release than natural gas for the same pressure and hole size. This difference tends to be between 6% and 25% depending on conditions. A summary of the results is presented in Table 4.1.
H100 Hydrogen Characterisation - Final Report
43 May 2019
Tab
le 4
.1:
Ma
xim
um
dis
tan
ce (
in M
etre
s) t
o lo
wer
th
resh
old
cri
teri
a f
or
cred
ible
rel
ease
sce
na
rio
s a
nd
a r
an
ge
of
ho
le s
izes
H100 Hydrogen Characterisation - Final Report
44 May 2019
5. QRA for the Low Pressure Gas Distribution System
The QRA for the low pressure distribution system has been conducted as a comparative QRA, assessing the relative risks of gas ingress to nearby buildings from a bespoke 100% hydrogen network against an equivalent natural gas supply system. The risk assessment is designed to ensure the differences in characteristics of hydrogen and natural gas can be appropriately reflected.
A comparison of risk between hydrogen and natural gas involves the consideration of 5 key elements:
1. Probability of release from network piping including hole size distribution and estimated release rates 2. Movement of flammable gas in the event of a release and the likelihood of gas entering a domestic
property 3. Gas build-up within a domestic property in the event of a release entering the property 4. Probability of ignition in the event of a flammable atmosphere being present 5. Consequences of an ignited release
Each of the first four areas are considered in this report using a mixture of original research and reviews of existing literature to provide an overall estimate of the comparative risk for the H100 project. The focus is solely on determining the likelihood of obtaining an ignited release inside a domestic property. The consequences of an ignited release inside a building are not considered at this time.
5.1. Release Probability
The key objective of the QRA is to assess the comparative risk across a range of credible release/failure cases. The first stage of this is to compare the likelihood of a release from the proposed H100 network (100% PE) with that for the currently installed network.
5.1.1. Leak Frequency
A record of reported leaks from SGN’s current network is available from the SGN PRE and GMSR database [17]. The data does not provide a breakdown by hole size, although it does provide a breakdown by the following parameters:
• Pipe diameter
• Immediate cause of leak
• Main service material of construction
• Whether injuries, evacuation, or gas in building occurred
The information from the SGN database [17] was used to determine the number of leaks, gas in building (GIB) events and ignitions over a 4 year period (2005-2008). Although data is available over the period 2002 to 2017, the period 2005-2008 appears to the best in terms of the level of consistent reporting. Information on the cause of release was also extracted from the records during this period.
Leak Data Analysis
The reporting period 2005-2008, provides the following statistics for upstream events where gas was released into a building (with a measured concentration of at least 20% LFL):
• Total number of ‘Gas in Building’ Events: 261
• Number of ‘Gas in Building’ Events from PE = 55 (21%)
• Number of ‘Gas in Building’ Events from Non-PE = 206 (76%)
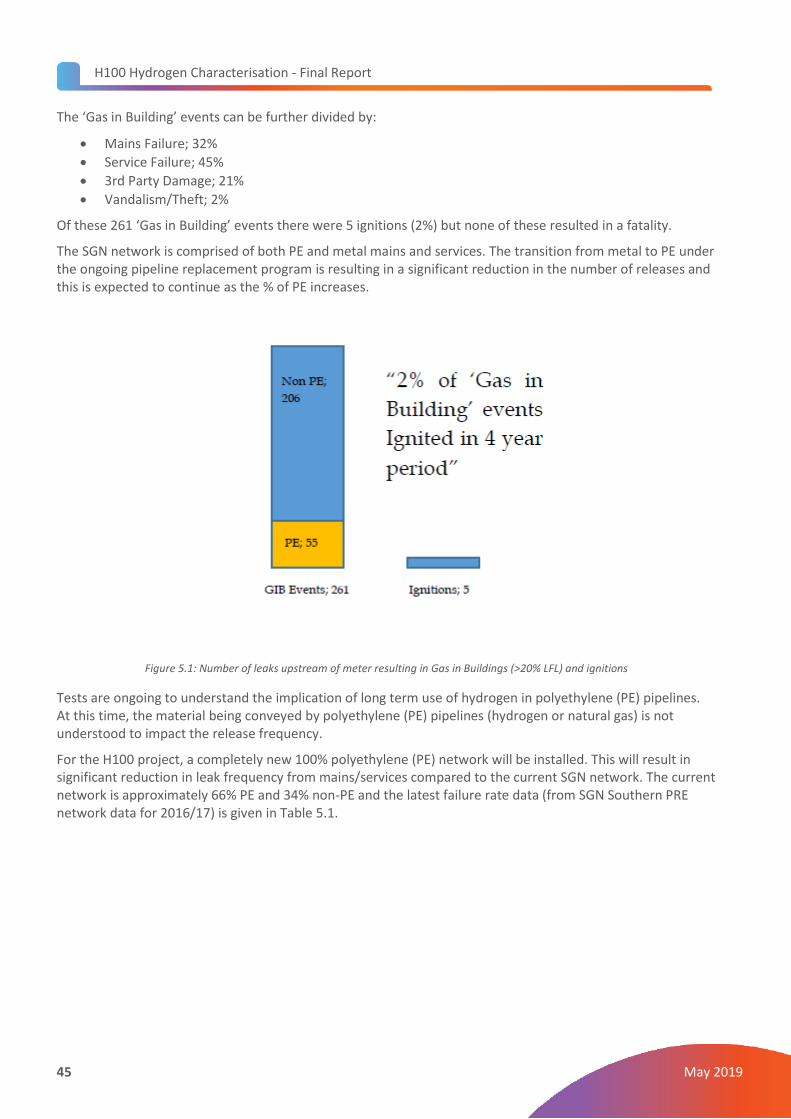
H100 Hydrogen Characterisation - Final Report
45 May 2019
The ‘Gas in Building’ events can be further divided by:
• Mains Failure; 32%
• Service Failure; 45%
• 3rd Party Damage; 21%
• Vandalism/Theft; 2%
Of these 261 ‘Gas in Building’ events there were 5 ignitions (2%) but none of these resulted in a fatality.
The SGN network is comprised of both PE and metal mains and services. The transition from metal to PE under the ongoing pipeline replacement program is resulting in a significant reduction in the number of releases and this is expected to continue as the % of PE increases.
Figure 5.1: Number of leaks upstream of meter resulting in Gas in Buildings (>20% LFL) and ignitions
Tests are ongoing to understand the implication of long term use of hydrogen in polyethylene (PE) pipelines. At this time, the material being conveyed by polyethylene (PE) pipelines (hydrogen or natural gas) is not understood to impact the release frequency.
For the H100 project, a completely new 100% polyethylene (PE) network will be installed. This will result in significant reduction in leak frequency from mains/services compared to the current SGN network. The current network is approximately 66% PE and 34% non-PE and the latest failure rate data (from SGN Southern PRE network data for 2016/17) is given in Table 5.1.
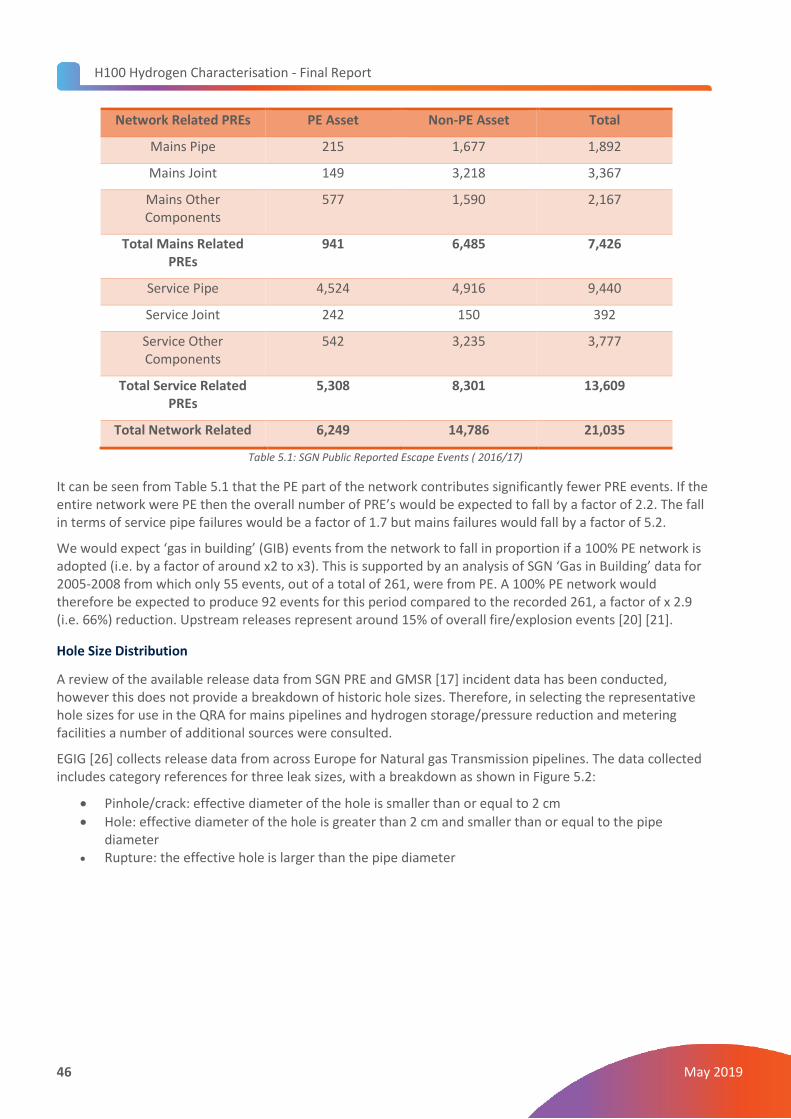
H100 Hydrogen Characterisation - Final Report
46 May 2019
Network Related PREs PE Asset Non-PE Asset Total
Mains Pipe 215 1,677 1,892
Mains Joint 149 3,218 3,367
Mains Other Components
577 1,590 2,167
Total Mains Related PREs
941 6,485 7,426
Service Pipe 4,524 4,916 9,440
Service Joint 242 150 392
Service Other Components
542 3,235 3,777
Total Service Related PREs
5,308 8,301 13,609
Total Network Related 6,249 14,786 21,035
Table 5.1: SGN Public Reported Escape Events ( 2016/17)
It can be seen from Table 5.1 that the PE part of the network contributes significantly fewer PRE events. If the entire network were PE then the overall number of PRE’s would be expected to fall by a factor of 2.2. The fall in terms of service pipe failures would be a factor of 1.7 but mains failures would fall by a factor of 5.2.
We would expect ‘gas in building’ (GIB) events from the network to fall in proportion if a 100% PE network is adopted (i.e. by a factor of around x2 to x3). This is supported by an analysis of SGN ‘Gas in Building’ data for 2005-2008 from which only 55 events, out of a total of 261, were from PE. A 100% PE network would therefore be expected to produce 92 events for this period compared to the recorded 261, a factor of x 2.9 (i.e. 66%) reduction. Upstream releases represent around 15% of overall fire/explosion events [20] [21].
Hole Size Distribution
A review of the available release data from SGN PRE and GMSR [17] incident data has been conducted, however this does not provide a breakdown of historic hole sizes. Therefore, in selecting the representative hole sizes for use in the QRA for mains pipelines and hydrogen storage/pressure reduction and metering facilities a number of additional sources were consulted.
EGIG [26] collects release data from across Europe for Natural gas Transmission pipelines. The data collected includes category references for three leak sizes, with a breakdown as shown in Figure 5.2:
• Pinhole/crack: effective diameter of the hole is smaller than or equal to 2 cm
• Hole: effective diameter of the hole is greater than 2 cm and smaller than or equal to the pipe diameter
• Rupture: the effective hole is larger than the pipe diameter
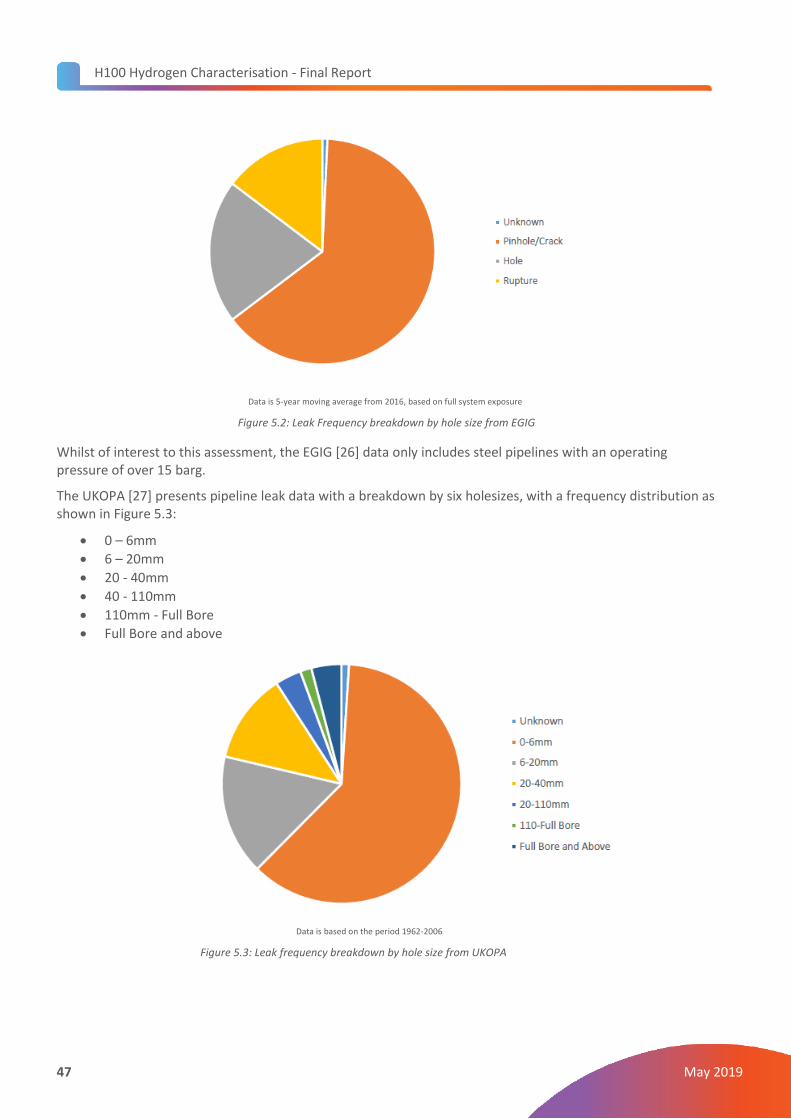
H100 Hydrogen Characterisation - Final Report
47 May 2019
Data is 5-year moving average from 2016, based on full system exposure
Figure 5.2: Leak Frequency breakdown by hole size from EGIG
Whilst of interest to this assessment, the EGIG [26] data only includes steel pipelines with an operating pressure of over 15 barg.
The UKOPA [27] presents pipeline leak data with a breakdown by six holesizes, with a frequency distribution as shown in Figure 5.3:
• 0 – 6mm
• 6 – 20mm
• 20 - 40mm
• 40 - 110mm
• 110mm - Full Bore
• Full Bore and above
Data is based on the period 1962-2006
Figure 5.3: Leak frequency breakdown by hole size from UKOPA
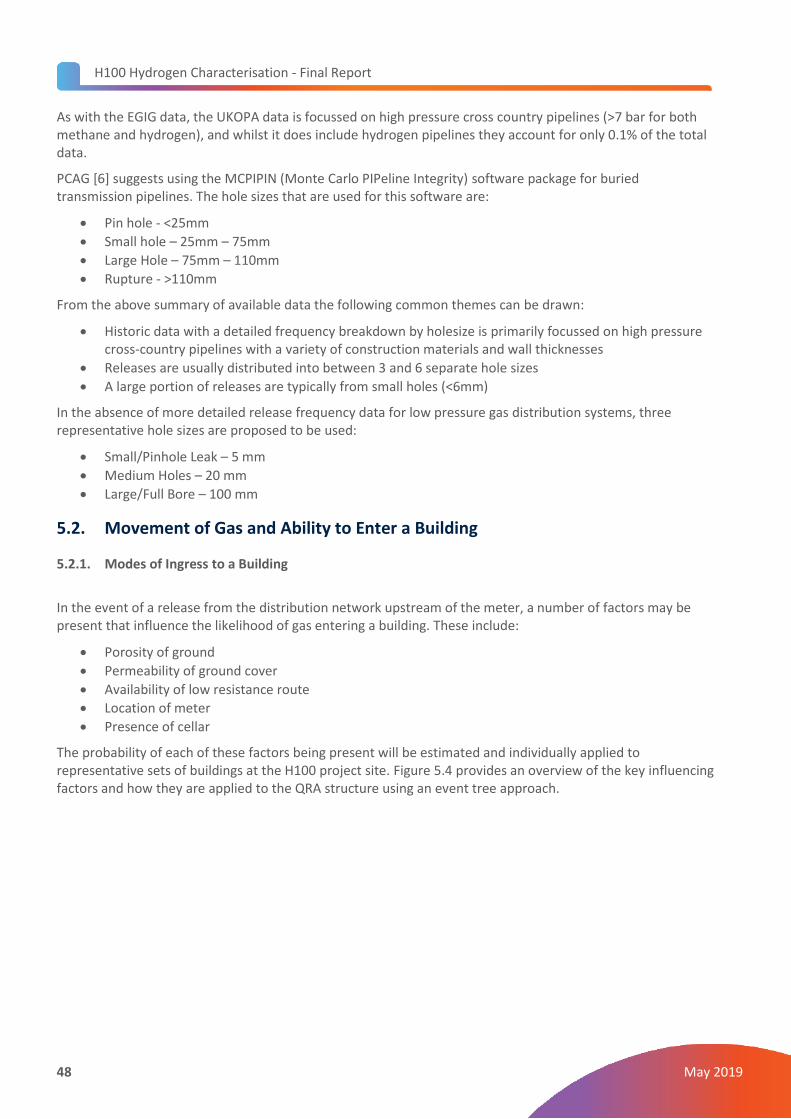
H100 Hydrogen Characterisation - Final Report
48 May 2019
As with the EGIG data, the UKOPA data is focussed on high pressure cross country pipelines (>7 bar for both methane and hydrogen), and whilst it does include hydrogen pipelines they account for only 0.1% of the total data.
PCAG [6] suggests using the MCPIPIN (Monte Carlo PIPeline Integrity) software package for buried transmission pipelines. The hole sizes that are used for this software are:
• Pin hole - <25mm
• Small hole – 25mm – 75mm
• Large Hole – 75mm – 110mm
• Rupture - >110mm
From the above summary of available data the following common themes can be drawn:
• Historic data with a detailed frequency breakdown by holesize is primarily focussed on high pressure cross-country pipelines with a variety of construction materials and wall thicknesses
• Releases are usually distributed into between 3 and 6 separate hole sizes
• A large portion of releases are typically from small holes (<6mm)
In the absence of more detailed release frequency data for low pressure gas distribution systems, three representative hole sizes are proposed to be used:
• Small/Pinhole Leak – 5 mm
• Medium Holes – 20 mm
• Large/Full Bore – 100 mm
5.2. Movement of Gas and Ability to Enter a Building
5.2.1. Modes of Ingress to a Building
In the event of a release from the distribution network upstream of the meter, a number of factors may be present that influence the likelihood of gas entering a building. These include:
• Porosity of ground
• Permeability of ground cover
• Availability of low resistance route
• Location of meter
• Presence of cellar
The probability of each of these factors being present will be estimated and individually applied to representative sets of buildings at the H100 project site. Figure 5.4 provides an overview of the key influencing factors and how they are applied to the QRA structure using an event tree approach.
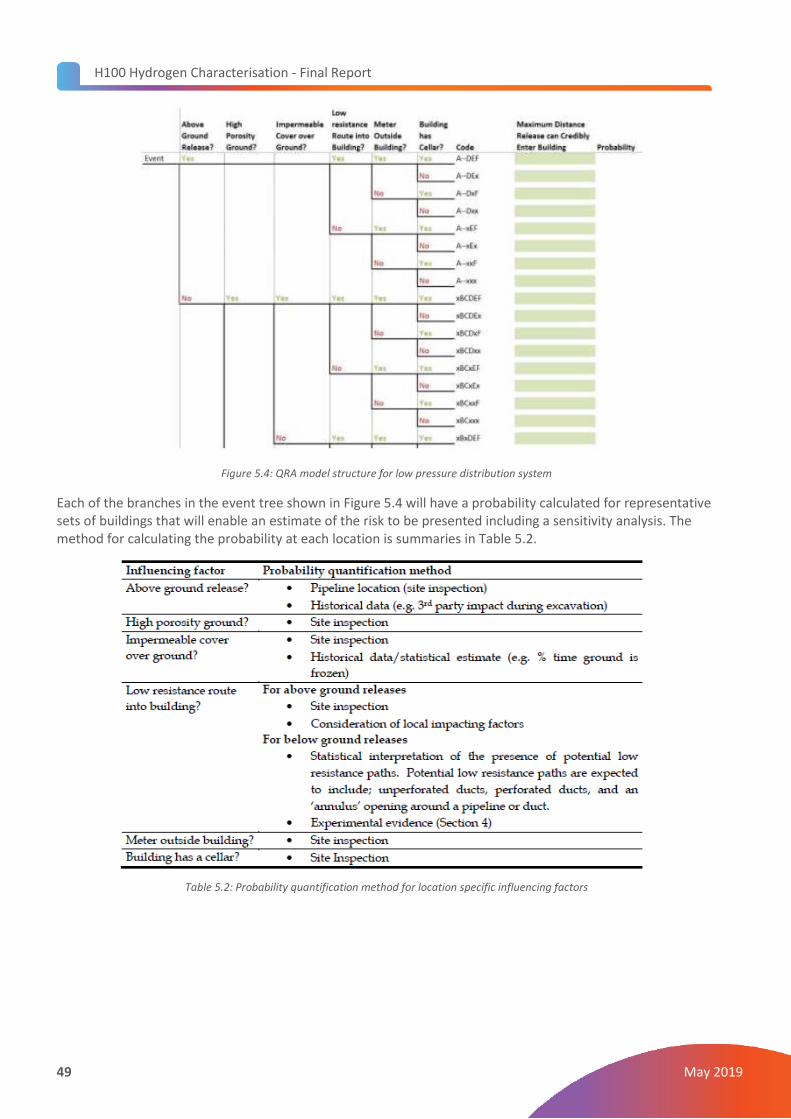
H100 Hydrogen Characterisation - Final Report
49 May 2019
Figure 5.4: QRA model structure for low pressure distribution system
Each of the branches in the event tree shown in Figure 5.4 will have a probability calculated for representative sets of buildings that will enable an estimate of the risk to be presented including a sensitivity analysis. The method for calculating the probability at each location is summaries in Table 5.2.
Table 5.2: Probability quantification method for location specific influencing factors
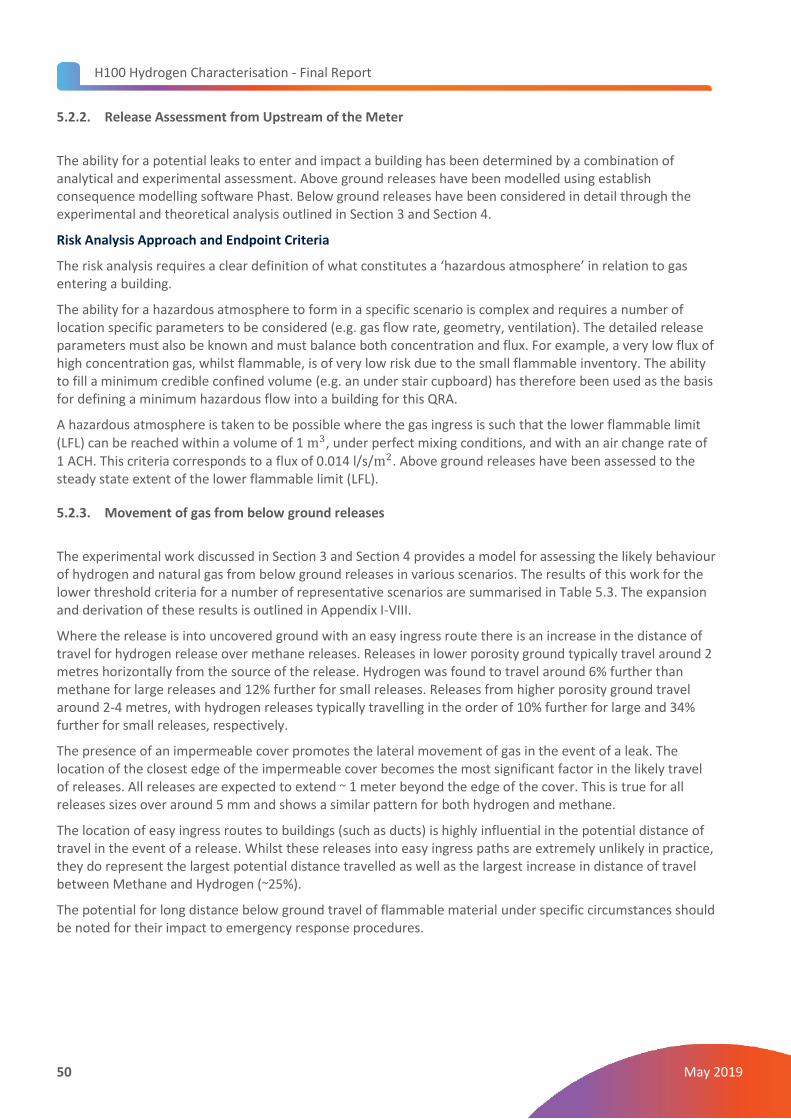
H100 Hydrogen Characterisation - Final Report
50 May 2019
5.2.2. Release Assessment from Upstream of the Meter
The ability for a potential leaks to enter and impact a building has been determined by a combination of analytical and experimental assessment. Above ground releases have been modelled using establish consequence modelling software Phast. Below ground releases have been considered in detail through the experimental and theoretical analysis outlined in Section 3 and Section 4.
Risk Analysis Approach and Endpoint Criteria
The risk analysis requires a clear definition of what constitutes a ‘hazardous atmosphere’ in relation to gas entering a building.
The ability for a hazardous atmosphere to form in a specific scenario is complex and requires a number of location specific parameters to be considered (e.g. gas flow rate, geometry, ventilation). The detailed release parameters must also be known and must balance both concentration and flux. For example, a very low flux of high concentration gas, whilst flammable, is of very low risk due to the small flammable inventory. The ability to fill a minimum credible confined volume (e.g. an under stair cupboard) has therefore been used as the basis for defining a minimum hazardous flow into a building for this QRA.
A hazardous atmosphere is taken to be possible where the gas ingress is such that the lower flammable limit (LFL) can be reached within a volume of 1 m3, under perfect mixing conditions, and with an air change rate of 1 ACH. This criteria corresponds to a flux of 0.014 l/s/m2. Above ground releases have been assessed to the steady state extent of the lower flammable limit (LFL).
5.2.3. Movement of gas from below ground releases
The experimental work discussed in Section 3 and Section 4 provides a model for assessing the likely behaviour of hydrogen and natural gas from below ground releases in various scenarios. The results of this work for the lower threshold criteria for a number of representative scenarios are summarised in Table 5.3. The expansion and derivation of these results is outlined in Appendix I-VIII.
Where the release is into uncovered ground with an easy ingress route there is an increase in the distance of travel for hydrogen release over methane releases. Releases in lower porosity ground typically travel around 2 metres horizontally from the source of the release. Hydrogen was found to travel around 6% further than methane for large releases and 12% further for small releases. Releases from higher porosity ground travel around 2-4 metres, with hydrogen releases typically travelling in the order of 10% further for large and 34% further for small releases, respectively.
The presence of an impermeable cover promotes the lateral movement of gas in the event of a leak. The location of the closest edge of the impermeable cover becomes the most significant factor in the likely travel of releases. All releases are expected to extend ~ 1 meter beyond the edge of the cover. This is true for all releases sizes over around 5 mm and shows a similar pattern for both hydrogen and methane.
The location of easy ingress routes to buildings (such as ducts) is highly influential in the potential distance of travel in the event of a release. Whilst these releases into easy ingress paths are extremely unlikely in practice, they do represent the largest potential distance travelled as well as the largest increase in distance of travel between Methane and Hydrogen (~25%).
The potential for long distance below ground travel of flammable material under specific circumstances should be noted for their impact to emergency response procedures.
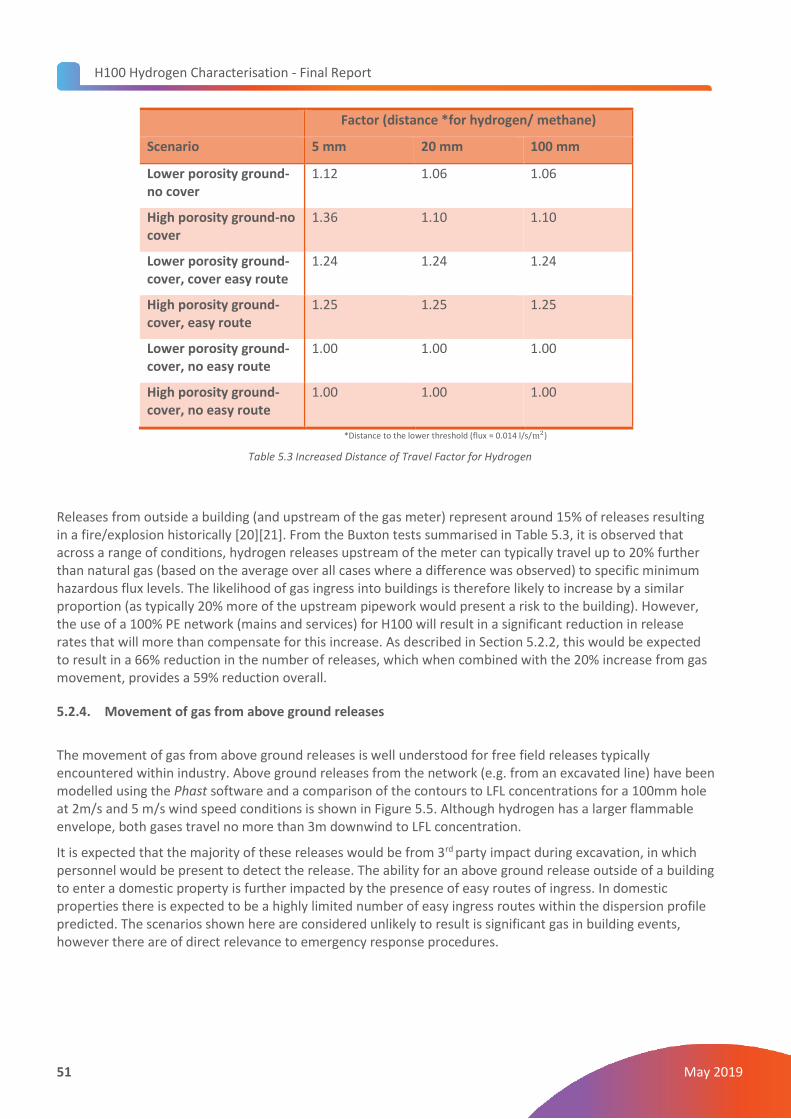
H100 Hydrogen Characterisation - Final Report
51 May 2019
Factor (distance *for hydrogen/ methane)
Scenario 5 mm 20 mm 100 mm
Lower porosity ground-no cover
1.12 1.06 1.06
High porosity ground-no cover
1.36 1.10 1.10
Lower porosity ground- cover, cover easy route
1.24 1.24 1.24
High porosity ground-cover, easy route
1.25 1.25 1.25
Lower porosity ground- cover, no easy route
1.00 1.00 1.00
High porosity ground- cover, no easy route
1.00 1.00 1.00
*Distance to the lower threshold (flux = 0.014 l/s/m2)
Table 5.3 Increased Distance of Travel Factor for Hydrogen
Releases from outside a building (and upstream of the gas meter) represent around 15% of releases resulting in a fire/explosion historically [20][21]. From the Buxton tests summarised in Table 5.3, it is observed that across a range of conditions, hydrogen releases upstream of the meter can typically travel up to 20% further than natural gas (based on the average over all cases where a difference was observed) to specific minimum hazardous flux levels. The likelihood of gas ingress into buildings is therefore likely to increase by a similar proportion (as typically 20% more of the upstream pipework would present a risk to the building). However, the use of a 100% PE network (mains and services) for H100 will result in a significant reduction in release rates that will more than compensate for this increase. As described in Section 5.2.2, this would be expected to result in a 66% reduction in the number of releases, which when combined with the 20% increase from gas movement, provides a 59% reduction overall.
5.2.4. Movement of gas from above ground releases
The movement of gas from above ground releases is well understood for free field releases typically encountered within industry. Above ground releases from the network (e.g. from an excavated line) have been modelled using the Phast software and a comparison of the contours to LFL concentrations for a 100mm hole at 2m/s and 5 m/s wind speed conditions is shown in Figure 5.5. Although hydrogen has a larger flammable envelope, both gases travel no more than 3m downwind to LFL concentration.
It is expected that the majority of these releases would be from 3rd party impact during excavation, in which
personnel would be present to detect the release. The ability for an above ground release outside of a building to enter a domestic property is further impacted by the presence of easy routes of ingress. In domestic properties there is expected to be a highly limited number of easy ingress routes within the dispersion profile predicted. The scenarios shown here are considered unlikely to result is significant gas in building events, however there are of direct relevance to emergency response procedures.
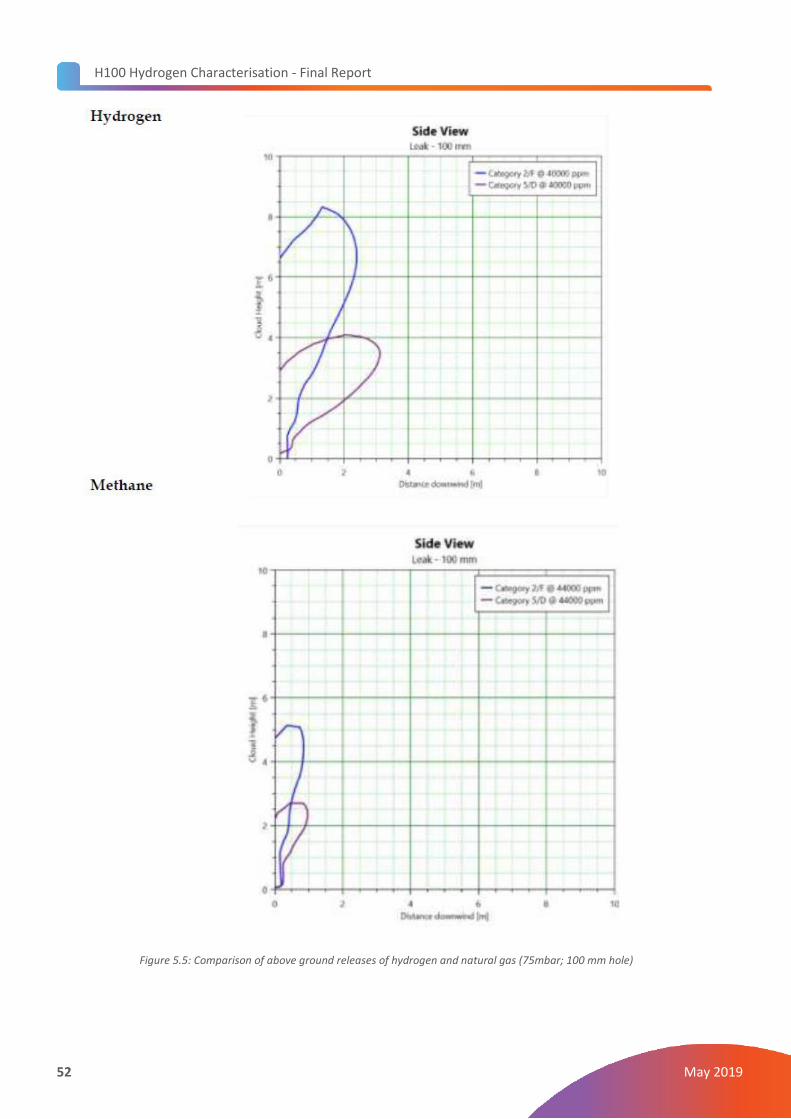
H100 Hydrogen Characterisation - Final Report
52 May 2019
Figure 5.5: Comparison of above ground releases of hydrogen and natural gas (75mbar; 100 mm hole)
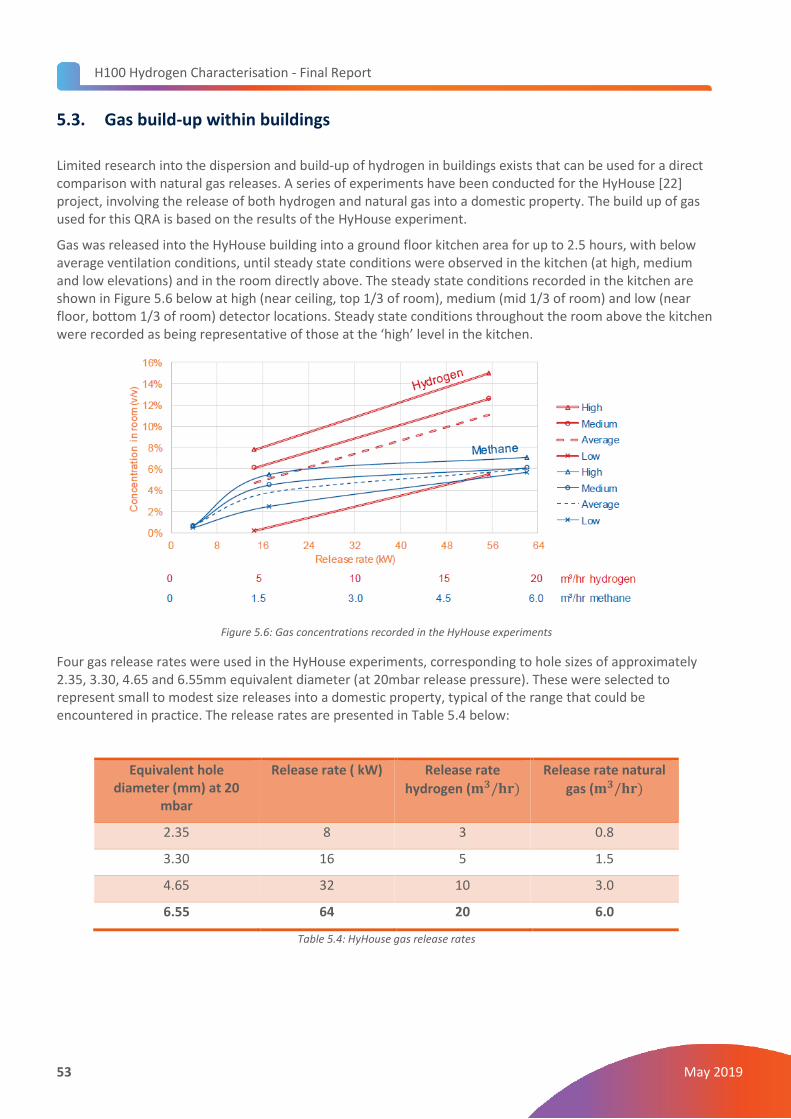
H100 Hydrogen Characterisation - Final Report
53 May 2019
5.3. Gas build-up within buildings
Limited research into the dispersion and build-up of hydrogen in buildings exists that can be used for a direct comparison with natural gas releases. A series of experiments have been conducted for the HyHouse [22] project, involving the release of both hydrogen and natural gas into a domestic property. The build up of gas used for this QRA is based on the results of the HyHouse experiment.
Gas was released into the HyHouse building into a ground floor kitchen area for up to 2.5 hours, with below average ventilation conditions, until steady state conditions were observed in the kitchen (at high, medium and low elevations) and in the room directly above. The steady state conditions recorded in the kitchen are shown in Figure 5.6 below at high (near ceiling, top 1/3 of room), medium (mid 1/3 of room) and low (near floor, bottom 1/3 of room) detector locations. Steady state conditions throughout the room above the kitchen were recorded as being representative of those at the ‘high’ level in the kitchen.
Figure 5.6: Gas concentrations recorded in the HyHouse experiments
Four gas release rates were used in the HyHouse experiments, corresponding to hole sizes of approximately 2.35, 3.30, 4.65 and 6.55mm equivalent diameter (at 20mbar release pressure). These were selected to represent small to modest size releases into a domestic property, typical of the range that could be encountered in practice. The release rates are presented in Table 5.4 below:
Equivalent hole diameter (mm) at 20
mbar
Release rate ( kW) Release rate
hydrogen (𝐦𝟑/𝐡𝐫)
Release rate natural
gas (𝐦𝟑/𝐡𝐫)
2.35 8 3 0.8
3.30 16 5 1.5
4.65 32 10 3.0
6.55 64 20 6.0
Table 5.4: HyHouse gas release rates
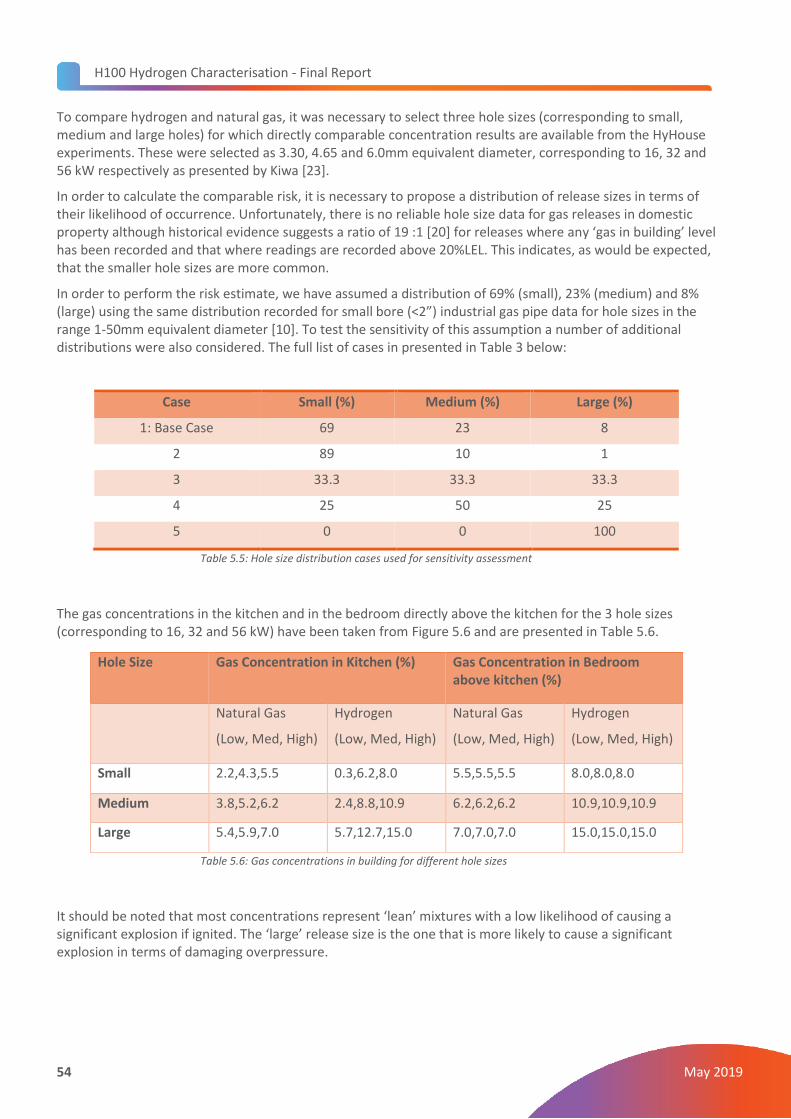
H100 Hydrogen Characterisation - Final Report
54 May 2019
To compare hydrogen and natural gas, it was necessary to select three hole sizes (corresponding to small, medium and large holes) for which directly comparable concentration results are available from the HyHouse experiments. These were selected as 3.30, 4.65 and 6.0mm equivalent diameter, corresponding to 16, 32 and 56 kW respectively as presented by Kiwa [23].
In order to calculate the comparable risk, it is necessary to propose a distribution of release sizes in terms of their likelihood of occurrence. Unfortunately, there is no reliable hole size data for gas releases in domestic property although historical evidence suggests a ratio of 19 :1 [20] for releases where any ‘gas in building’ level has been recorded and that where readings are recorded above 20%LEL. This indicates, as would be expected, that the smaller hole sizes are more common.
In order to perform the risk estimate, we have assumed a distribution of 69% (small), 23% (medium) and 8% (large) using the same distribution recorded for small bore (<2”) industrial gas pipe data for hole sizes in the range 1-50mm equivalent diameter [10]. To test the sensitivity of this assumption a number of additional distributions were also considered. The full list of cases in presented in Table 3 below:
Case Small (%) Medium (%) Large (%)
1: Base Case 69 23 8
2 89 10 1
3 33.3 33.3 33.3
4 25 50 25
5 0 0 100
Table 5.5: Hole size distribution cases used for sensitivity assessment
The gas concentrations in the kitchen and in the bedroom directly above the kitchen for the 3 hole sizes (corresponding to 16, 32 and 56 kW) have been taken from Figure 5.6 and are presented in Table 5.6.
Table 5.6: Gas concentrations in building for different hole sizes
It should be noted that most concentrations represent ‘lean’ mixtures with a low likelihood of causing a significant explosion if ignited. The ‘large’ release size is the one that is more likely to cause a significant explosion in terms of damaging overpressure.
Hole Size Gas Concentration in Kitchen (%) Gas Concentration in Bedroom above kitchen (%)
Natural Gas
(Low, Med, High)
Hydrogen
(Low, Med, High)
Natural Gas
(Low, Med, High)
Hydrogen
(Low, Med, High)
Small 2.2,4.3,5.5 0.3,6.2,8.0 5.5,5.5,5.5 8.0,8.0,8.0
Medium 3.8,5.2,6.2 2.4,8.8,10.9 6.2,6.2,6.2 10.9,10.9,10.9
Large 5.4,5.9,7.0 5.7,12.7,15.0 7.0,7.0,7.0 15.0,15.0,15.0
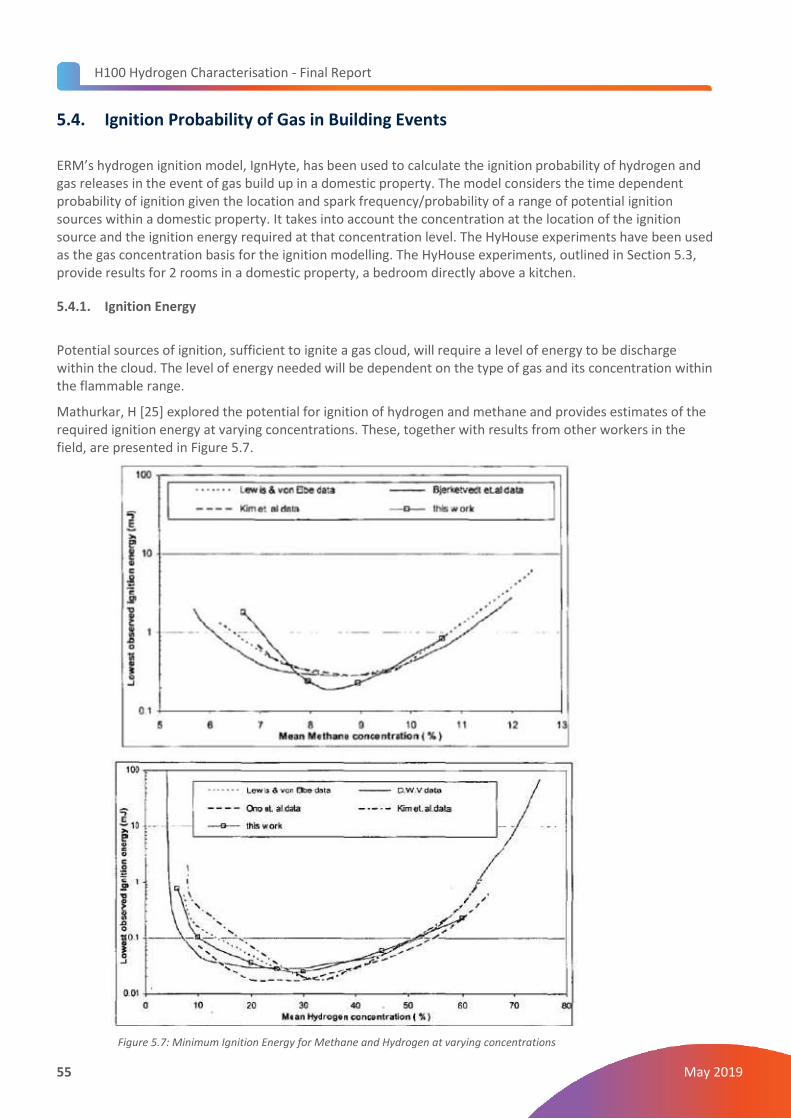
H100 Hydrogen Characterisation - Final Report
55 May 2019
5.4. Ignition Probability of Gas in Building Events
ERM’s hydrogen ignition model, IgnHyte, has been used to calculate the ignition probability of hydrogen and gas releases in the event of gas build up in a domestic property. The model considers the time dependent probability of ignition given the location and spark frequency/probability of a range of potential ignition sources within a domestic property. It takes into account the concentration at the location of the ignition source and the ignition energy required at that concentration level. The HyHouse experiments have been used as the gas concentration basis for the ignition modelling. The HyHouse experiments, outlined in Section 5.3, provide results for 2 rooms in a domestic property, a bedroom directly above a kitchen.
5.4.1. Ignition Energy
Potential sources of ignition, sufficient to ignite a gas cloud, will require a level of energy to be discharge within the cloud. The level of energy needed will be dependent on the type of gas and its concentration within the flammable range.
Mathurkar, H [25] explored the potential for ignition of hydrogen and methane and provides estimates of the required ignition energy at varying concentrations. These, together with results from other workers in the field, are presented in Figure 5.7.
Figure 5.7: Minimum Ignition Energy for Methane and Hydrogen at varying concentrations
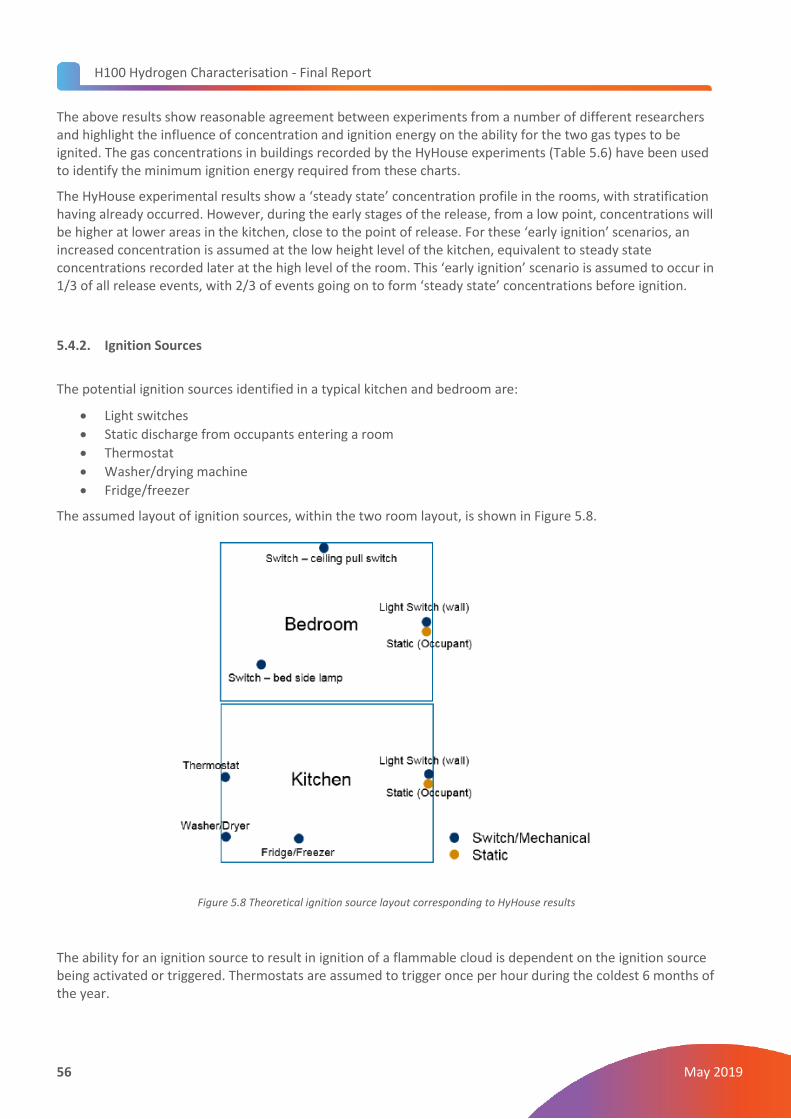
H100 Hydrogen Characterisation - Final Report
56 May 2019
The above results show reasonable agreement between experiments from a number of different researchers and highlight the influence of concentration and ignition energy on the ability for the two gas types to be ignited. The gas concentrations in buildings recorded by the HyHouse experiments (Table 5.6) have been used to identify the minimum ignition energy required from these charts.
The HyHouse experimental results show a ‘steady state’ concentration profile in the rooms, with stratification having already occurred. However, during the early stages of the release, from a low point, concentrations will be higher at lower areas in the kitchen, close to the point of release. For these ‘early ignition’ scenarios, an increased concentration is assumed at the low height level of the kitchen, equivalent to steady state concentrations recorded later at the high level of the room. This ‘early ignition’ scenario is assumed to occur in 1/3 of all release events, with 2/3 of events going on to form ‘steady state’ concentrations before ignition.
5.4.2. Ignition Sources
The potential ignition sources identified in a typical kitchen and bedroom are:
• Light switches
• Static discharge from occupants entering a room
• Thermostat
• Washer/drying machine
• Fridge/freezer
The assumed layout of ignition sources, within the two room layout, is shown in Figure 5.8.
Figure 5.8 Theoretical ignition source layout corresponding to HyHouse results
The ability for an ignition source to result in ignition of a flammable cloud is dependent on the ignition source being activated or triggered. Thermostats are assumed to trigger once per hour during the coldest 6 months of the year.
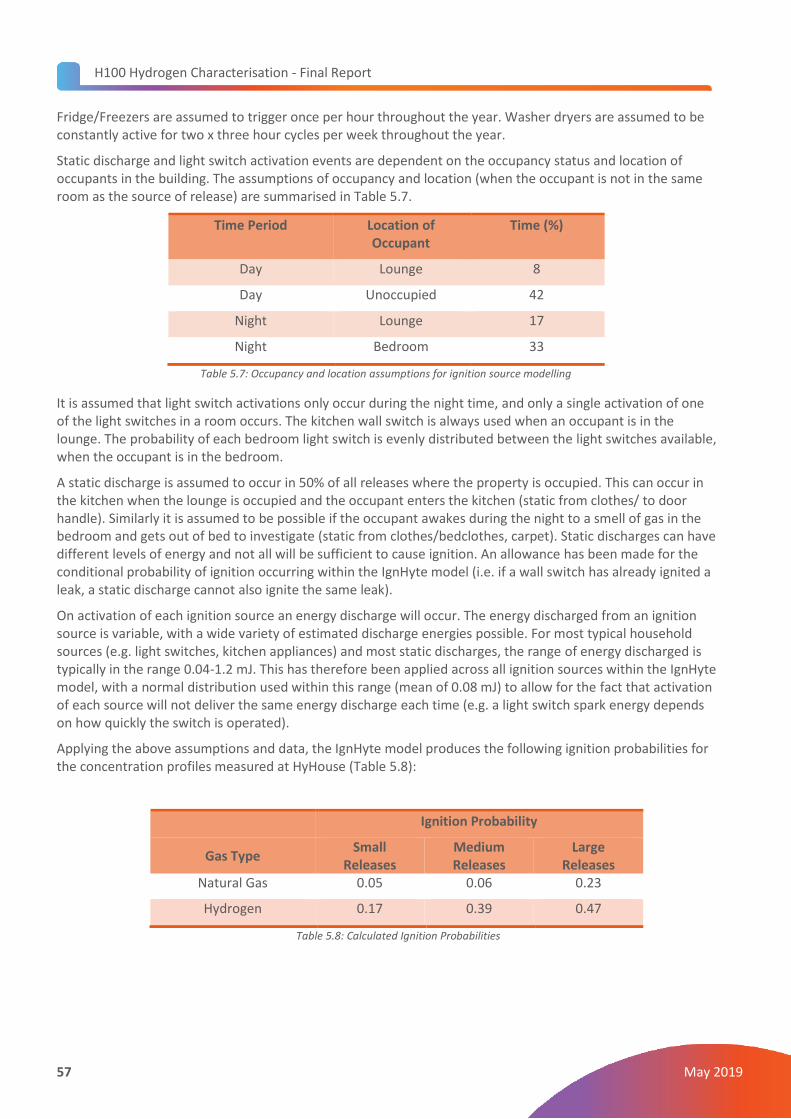
H100 Hydrogen Characterisation - Final Report
57 May 2019
Fridge/Freezers are assumed to trigger once per hour throughout the year. Washer dryers are assumed to be constantly active for two x three hour cycles per week throughout the year.
Static discharge and light switch activation events are dependent on the occupancy status and location of occupants in the building. The assumptions of occupancy and location (when the occupant is not in the same room as the source of release) are summarised in Table 5.7.
Time Period Location of Occupant
Time (%)
Day Lounge 8
Day Unoccupied 42
Night Lounge 17
Night Bedroom 33
Table 5.7: Occupancy and location assumptions for ignition source modelling
It is assumed that light switch activations only occur during the night time, and only a single activation of one of the light switches in a room occurs. The kitchen wall switch is always used when an occupant is in the lounge. The probability of each bedroom light switch is evenly distributed between the light switches available, when the occupant is in the bedroom.
A static discharge is assumed to occur in 50% of all releases where the property is occupied. This can occur in the kitchen when the lounge is occupied and the occupant enters the kitchen (static from clothes/ to door handle). Similarly it is assumed to be possible if the occupant awakes during the night to a smell of gas in the bedroom and gets out of bed to investigate (static from clothes/bedclothes, carpet). Static discharges can have different levels of energy and not all will be sufficient to cause ignition. An allowance has been made for the conditional probability of ignition occurring within the IgnHyte model (i.e. if a wall switch has already ignited a leak, a static discharge cannot also ignite the same leak).
On activation of each ignition source an energy discharge will occur. The energy discharged from an ignition source is variable, with a wide variety of estimated discharge energies possible. For most typical household sources (e.g. light switches, kitchen appliances) and most static discharges, the range of energy discharged is typically in the range 0.04-1.2 mJ. This has therefore been applied across all ignition sources within the IgnHyte model, with a normal distribution used within this range (mean of 0.08 mJ) to allow for the fact that activation of each source will not deliver the same energy discharge each time (e.g. a light switch spark energy depends on how quickly the switch is operated).
Applying the above assumptions and data, the IgnHyte model produces the following ignition probabilities for the concentration profiles measured at HyHouse (Table 5.8):
Ignition Probability
Gas Type Small
Releases Medium Releases
Large Releases
Natural Gas 0.05 0.06 0.23
Hydrogen 0.17 0.39 0.47
Table 5.8: Calculated Ignition Probabilities
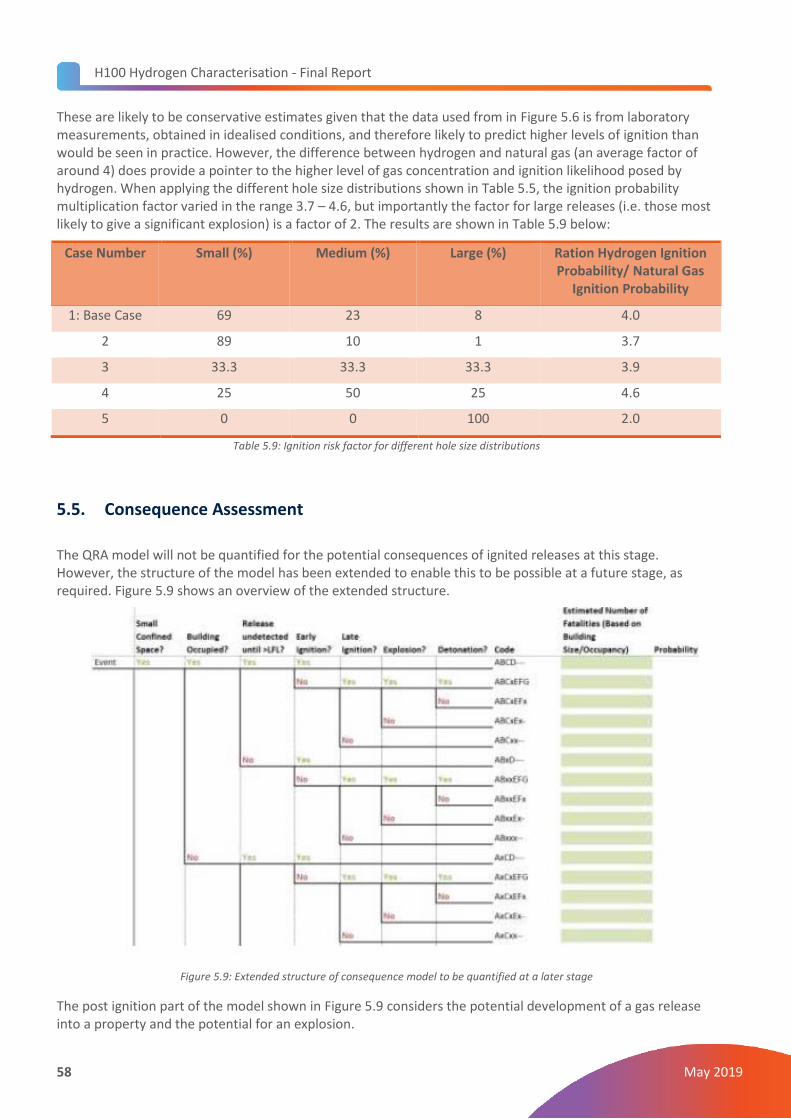
H100 Hydrogen Characterisation - Final Report
58 May 2019
These are likely to be conservative estimates given that the data used from in Figure 5.6 is from laboratory measurements, obtained in idealised conditions, and therefore likely to predict higher levels of ignition than would be seen in practice. However, the difference between hydrogen and natural gas (an average factor of around 4) does provide a pointer to the higher level of gas concentration and ignition likelihood posed by hydrogen. When applying the different hole size distributions shown in Table 5.5, the ignition probability multiplication factor varied in the range 3.7 – 4.6, but importantly the factor for large releases (i.e. those most likely to give a significant explosion) is a factor of 2. The results are shown in Table 5.9 below:
Case Number Small (%) Medium (%) Large (%) Ration Hydrogen Ignition Probability/ Natural Gas
Ignition Probability
1: Base Case 69 23 8 4.0
2 89 10 1 3.7
3 33.3 33.3 33.3 3.9
4 25 50 25 4.6
5 0 0 100 2.0
Table 5.9: Ignition risk factor for different hole size distributions
5.5. Consequence Assessment
The QRA model will not be quantified for the potential consequences of ignited releases at this stage. However, the structure of the model has been extended to enable this to be possible at a future stage, as required. Figure 5.9 shows an overview of the extended structure.
Figure 5.9: Extended structure of consequence model to be quantified at a later stage
The post ignition part of the model shown in Figure 5.9 considers the potential development of a gas release into a property and the potential for an explosion.
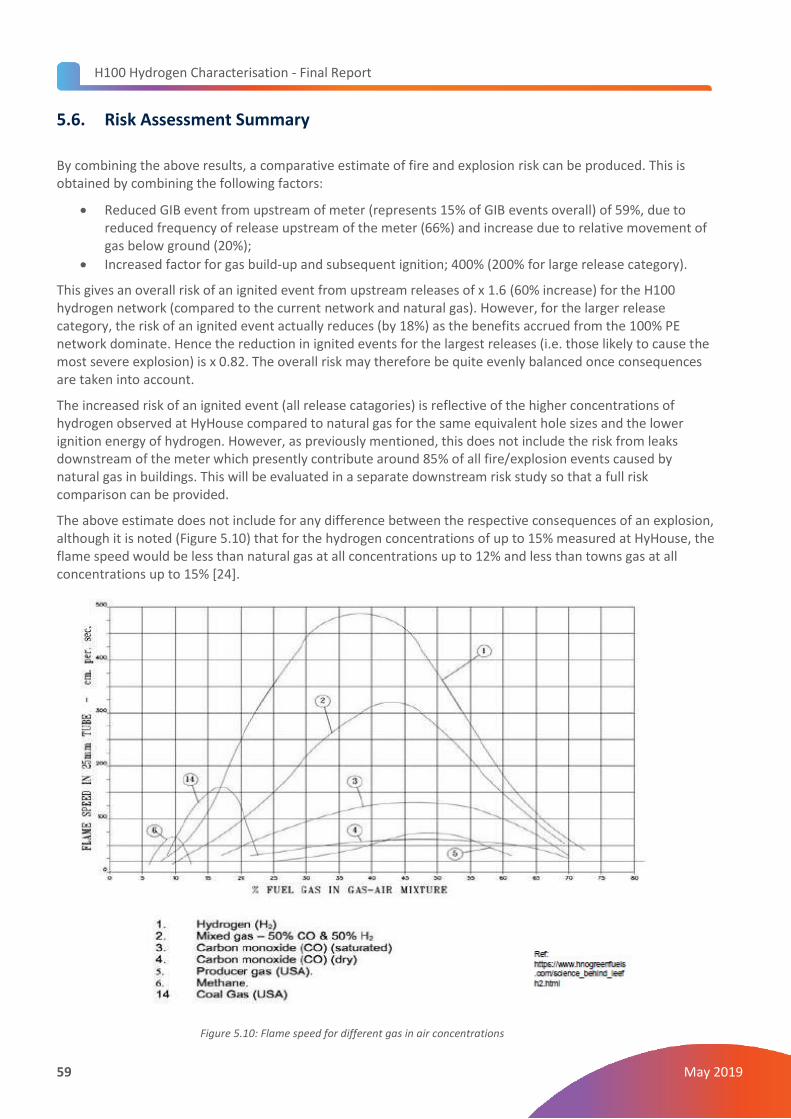
H100 Hydrogen Characterisation - Final Report
59 May 2019
5.6. Risk Assessment Summary
By combining the above results, a comparative estimate of fire and explosion risk can be produced. This is obtained by combining the following factors:
• Reduced GIB event from upstream of meter (represents 15% of GIB events overall) of 59%, due to reduced frequency of release upstream of the meter (66%) and increase due to relative movement of gas below ground (20%);
• Increased factor for gas build-up and subsequent ignition; 400% (200% for large release category).
This gives an overall risk of an ignited event from upstream releases of x 1.6 (60% increase) for the H100 hydrogen network (compared to the current network and natural gas). However, for the larger release category, the risk of an ignited event actually reduces (by 18%) as the benefits accrued from the 100% PE network dominate. Hence the reduction in ignited events for the largest releases (i.e. those likely to cause the most severe explosion) is x 0.82. The overall risk may therefore be quite evenly balanced once consequences are taken into account.
The increased risk of an ignited event (all release catagories) is reflective of the higher concentrations of hydrogen observed at HyHouse compared to natural gas for the same equivalent hole sizes and the lower ignition energy of hydrogen. However, as previously mentioned, this does not include the risk from leaks downstream of the meter which presently contribute around 85% of all fire/explosion events caused by natural gas in buildings. This will be evaluated in a separate downstream risk study so that a full risk comparison can be provided.
The above estimate does not include for any difference between the respective consequences of an explosion, although it is noted (Figure 5.10) that for the hydrogen concentrations of up to 15% measured at HyHouse, the flame speed would be less than natural gas at all concentrations up to 12% and less than towns gas at all concentrations up to 15% [24].
Figure 5.10: Flame speed for different gas in air concentrations
H100 Hydrogen Characterisation - Final Report
60 May 2019
6. QRA for the high pressure hydrogen supply source
The QRA for the high pressure storage facility that will supply the hydrogen for H100 is based on a similar approach to existing UK industrial sites utilising high pressure hydrogen. As such the QRA will be aligned to the UK HSE’s Planning Case Assessment Guidance (PCAG) [4] and Land-Use Planning (LUP) guidance [5].
6.1.1. Overview
Quantitative Risk Analysis (QRA) typically involves four key stages, which will be used for the H100 project:
• Hazard identification and generation of failure cases
• Frequency assessment, which consists of estimation of the frequencies of initiating events and the resulting hazardous outcomes
• Consequence assessment, which includes modelling of the physical effects of the hazardous outcomes and their potential effect on people
• Risk summation and analysis, where the results from consequence and frequency assessment are combined to calculate the overall risk.
The scope of work for the QRA covers both the hydrogen storage tanks and the associated pressure reduction and metering facilities. The risk assessment of the system will comprise a comparative risk assessment against an equivalent natural gas supply.
6.1.2. Hazard Identification and Failure Cases
Hazard identification
The key objective of a QRA is to assess the risk associated with major accident hazards, such hazards need to be identified and the release/failure cases defined. When a concept design for the facility is available it will be broken down into sections, each representing a hazard source (e.g. high pressure storage vessel, manifold, pipeline etc.).
Failure Cases
The failure cases for identified sections will be categorised into the following hole sizes:
• Pinhole release (P)
• Small release (S)
• Medium release (M)
• Large/fullbore rupture (L).
6.1.3. Frequency Assessment
Release Frequency Assessment
The release frequencies will determined using an equipment list from the design, and generic data from the HSE’s Failure Rate and Event Data (FRED) [6]. Where FRED data for a particular system is not available or deemed unsuitable, generic data suggested by other institutions, such as Oil and Gas Producers (OGP) [10] will be used.
Detection and Isolation
Where provided, the probability of successful leak detection and automatic isolation will be taken as 0.99, consistent with the value given in FRED [6].
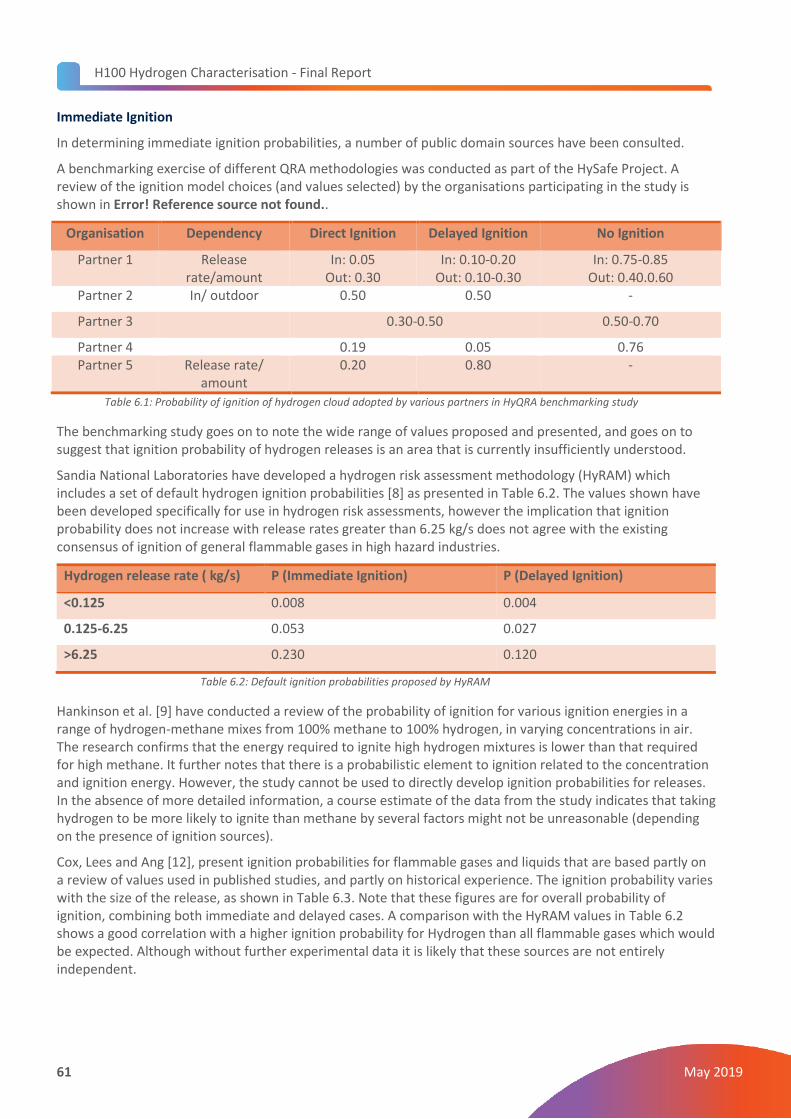
H100 Hydrogen Characterisation - Final Report
61 May 2019
Immediate Ignition
In determining immediate ignition probabilities, a number of public domain sources have been consulted.
A benchmarking exercise of different QRA methodologies was conducted as part of the HySafe Project. A review of the ignition model choices (and values selected) by the organisations participating in the study is shown in Error! Reference source not found..
Organisation Dependency Direct Ignition Delayed Ignition No Ignition
Partner 1 Release rate/amount
In: 0.05 Out: 0.30
In: 0.10-0.20 Out: 0.10-0.30
In: 0.75-0.85 Out: 0.40.0.60
Partner 2 In/ outdoor 0.50 0.50 -
Partner 3 0.30-0.50 0.50-0.70
Partner 4 0.19 0.05 0.76 Partner 5 Release rate/
amount 0.20 0.80 -
Table 6.1: Probability of ignition of hydrogen cloud adopted by various partners in HyQRA benchmarking study
The benchmarking study goes on to note the wide range of values proposed and presented, and goes on to suggest that ignition probability of hydrogen releases is an area that is currently insufficiently understood.
Sandia National Laboratories have developed a hydrogen risk assessment methodology (HyRAM) which includes a set of default hydrogen ignition probabilities [8] as presented in Table 6.2. The values shown have been developed specifically for use in hydrogen risk assessments, however the implication that ignition probability does not increase with release rates greater than 6.25 kg/s does not agree with the existing consensus of ignition of general flammable gases in high hazard industries.
Hydrogen release rate ( kg/s) P (Immediate Ignition) P (Delayed Ignition)
<0.125 0.008 0.004
0.125-6.25 0.053 0.027
>6.25 0.230 0.120
Table 6.2: Default ignition probabilities proposed by HyRAM
Hankinson et al. [9] have conducted a review of the probability of ignition for various ignition energies in a range of hydrogen-methane mixes from 100% methane to 100% hydrogen, in varying concentrations in air. The research confirms that the energy required to ignite high hydrogen mixtures is lower than that required for high methane. It further notes that there is a probabilistic element to ignition related to the concentration and ignition energy. However, the study cannot be used to directly develop ignition probabilities for releases. In the absence of more detailed information, a course estimate of the data from the study indicates that taking hydrogen to be more likely to ignite than methane by several factors might not be unreasonable (depending on the presence of ignition sources).
Cox, Lees and Ang [12], present ignition probabilities for flammable gases and liquids that are based partly on a review of values used in published studies, and partly on historical experience. The ignition probability varies with the size of the release, as shown in Table 6.3. Note that these figures are for overall probability of ignition, combining both immediate and delayed cases. A comparison with the HyRAM values in Table 6.2 shows a good correlation with a higher ignition probability for Hydrogen than all flammable gases which would be expected. Although without further experimental data it is likely that these sources are not entirely independent.
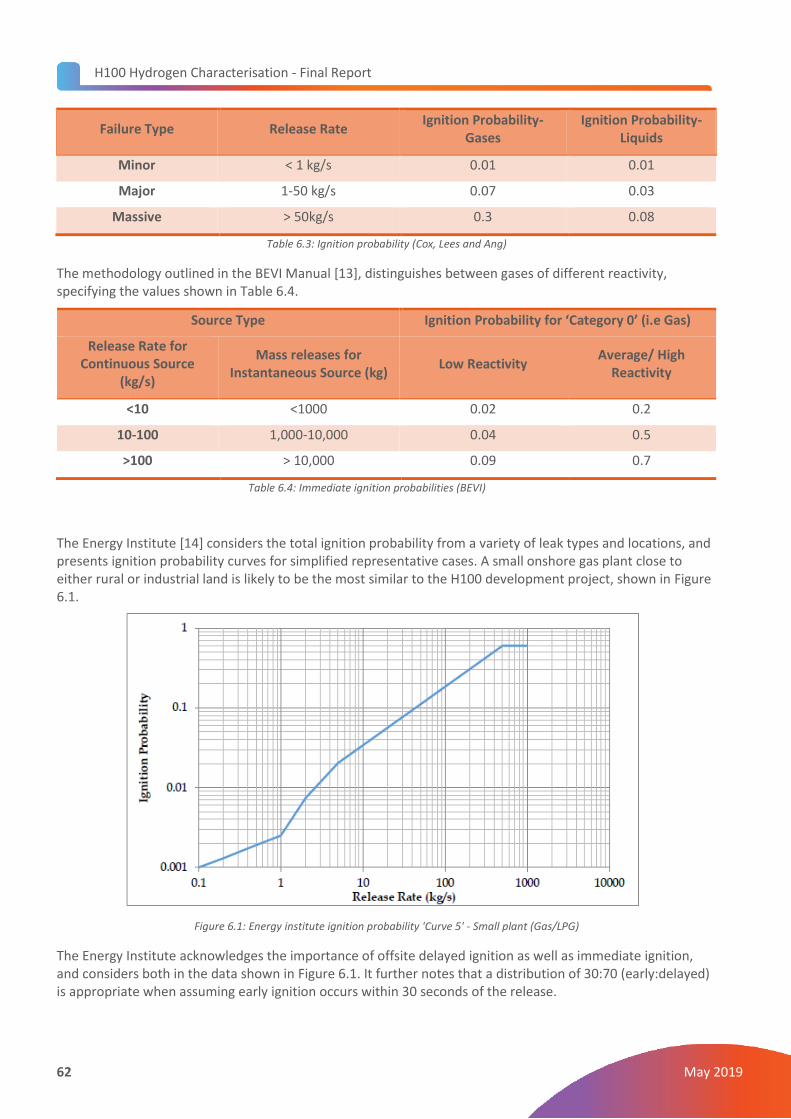
H100 Hydrogen Characterisation - Final Report
62 May 2019
Failure Type Release Rate Ignition Probability-
Gases Ignition Probability-
Liquids
Minor < 1 kg/s 0.01 0.01
Major 1-50 kg/s 0.07 0.03
Massive > 50kg/s 0.3 0.08
Table 6.3: Ignition probability (Cox, Lees and Ang)
The methodology outlined in the BEVI Manual [13], distinguishes between gases of different reactivity, specifying the values shown in Table 6.4.
Source Type Ignition Probability for ‘Category 0’ (i.e Gas)
Release Rate for Continuous Source
(kg/s)
Mass releases for Instantaneous Source (kg)
Low Reactivity Average/ High
Reactivity
<10 <1000 0.02 0.2
10-100 1,000-10,000 0.04 0.5
>100 > 10,000 0.09 0.7
Table 6.4: Immediate ignition probabilities (BEVI)
The Energy Institute [14] considers the total ignition probability from a variety of leak types and locations, and presents ignition probability curves for simplified representative cases. A small onshore gas plant close to either rural or industrial land is likely to be the most similar to the H100 development project, shown in Figure 6.1.
Figure 6.1: Energy institute ignition probability 'Curve 5' - Small plant (Gas/LPG)
The Energy Institute acknowledges the importance of offsite delayed ignition as well as immediate ignition, and considers both in the data shown in Figure 6.1. It further notes that a distribution of 30:70 (early:delayed) is appropriate when assuming early ignition occurs within 30 seconds of the release.
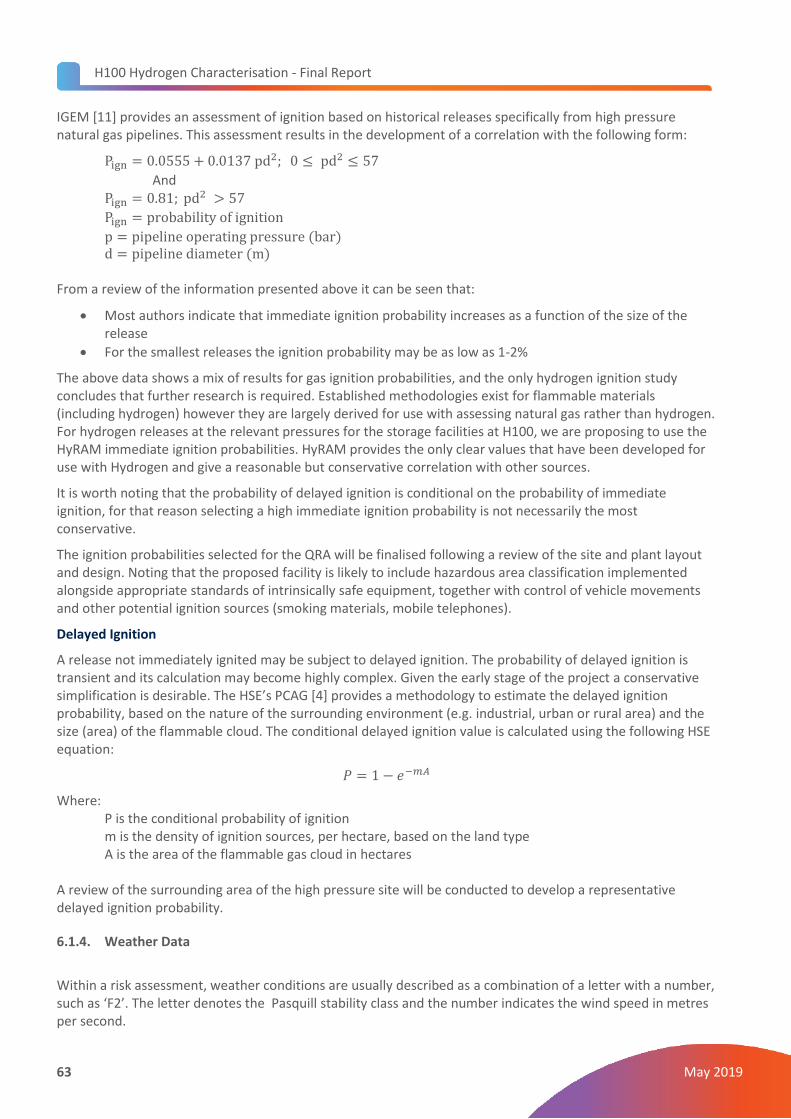
H100 Hydrogen Characterisation - Final Report
63 May 2019
IGEM [11] provides an assessment of ignition based on historical releases specifically from high pressure natural gas pipelines. This assessment results in the development of a correlation with the following form:
Pign = 0.0555 + 0.0137 pd2; 0 ≤ pd2 ≤ 57
And Pign = 0.81; pd2 > 57
Pign = probability of ignition
p = pipeline operating pressure (bar) d = pipeline diameter (m)
From a review of the information presented above it can be seen that:
• Most authors indicate that immediate ignition probability increases as a function of the size of the release
• For the smallest releases the ignition probability may be as low as 1-2%
The above data shows a mix of results for gas ignition probabilities, and the only hydrogen ignition study concludes that further research is required. Established methodologies exist for flammable materials (including hydrogen) however they are largely derived for use with assessing natural gas rather than hydrogen. For hydrogen releases at the relevant pressures for the storage facilities at H100, we are proposing to use the HyRAM immediate ignition probabilities. HyRAM provides the only clear values that have been developed for use with Hydrogen and give a reasonable but conservative correlation with other sources.
It is worth noting that the probability of delayed ignition is conditional on the probability of immediate ignition, for that reason selecting a high immediate ignition probability is not necessarily the most conservative.
The ignition probabilities selected for the QRA will be finalised following a review of the site and plant layout and design. Noting that the proposed facility is likely to include hazardous area classification implemented alongside appropriate standards of intrinsically safe equipment, together with control of vehicle movements and other potential ignition sources (smoking materials, mobile telephones).
Delayed Ignition
A release not immediately ignited may be subject to delayed ignition. The probability of delayed ignition is transient and its calculation may become highly complex. Given the early stage of the project a conservative simplification is desirable. The HSE’s PCAG [4] provides a methodology to estimate the delayed ignition probability, based on the nature of the surrounding environment (e.g. industrial, urban or rural area) and the size (area) of the flammable cloud. The conditional delayed ignition value is calculated using the following HSE equation:
𝑃 = 1 − 𝑒−𝑚𝐴
Where: P is the conditional probability of ignition m is the density of ignition sources, per hectare, based on the land type A is the area of the flammable gas cloud in hectares
A review of the surrounding area of the high pressure site will be conducted to develop a representative delayed ignition probability.
6.1.4. Weather Data
Within a risk assessment, weather conditions are usually described as a combination of a letter with a number, such as ‘F2’. The letter denotes the Pasquill stability class and the number indicates the wind speed in metres per second.
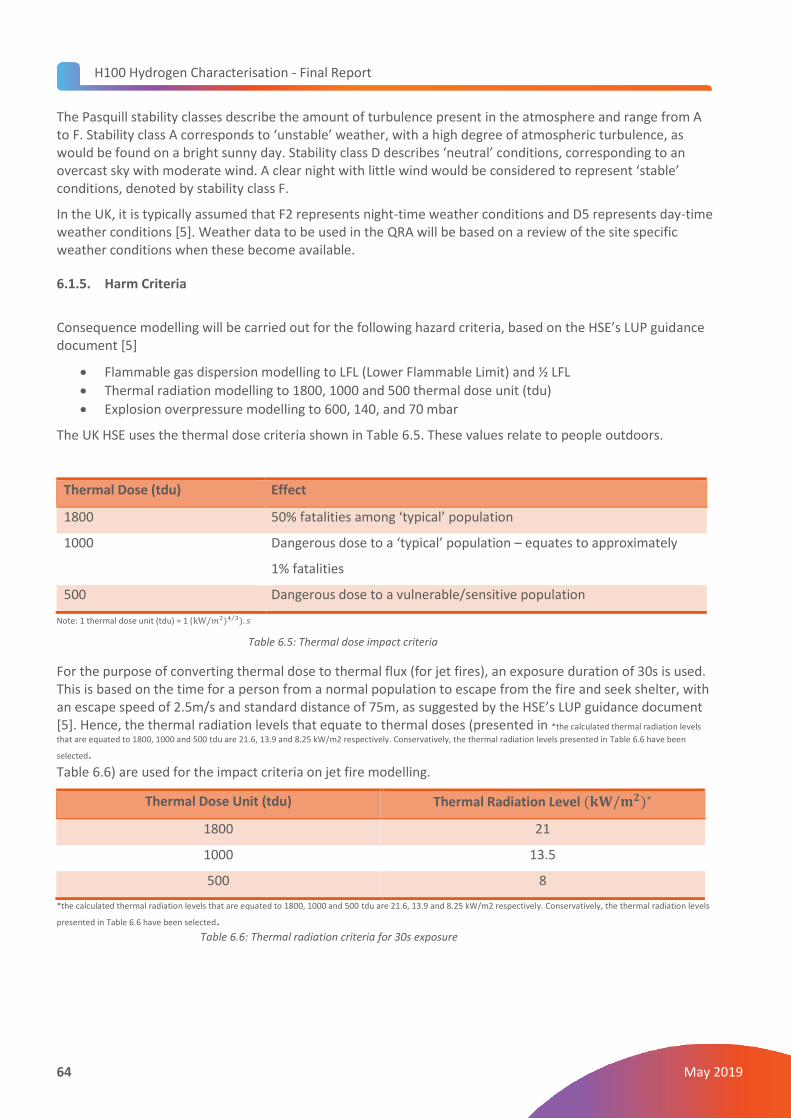
H100 Hydrogen Characterisation - Final Report
64 May 2019
The Pasquill stability classes describe the amount of turbulence present in the atmosphere and range from A to F. Stability class A corresponds to ‘unstable’ weather, with a high degree of atmospheric turbulence, as would be found on a bright sunny day. Stability class D describes ‘neutral’ conditions, corresponding to an overcast sky with moderate wind. A clear night with little wind would be considered to represent ‘stable’ conditions, denoted by stability class F.
In the UK, it is typically assumed that F2 represents night-time weather conditions and D5 represents day-time weather conditions [5]. Weather data to be used in the QRA will be based on a review of the site specific weather conditions when these become available.
6.1.5. Harm Criteria
Consequence modelling will be carried out for the following hazard criteria, based on the HSE’s LUP guidance document [5]
• Flammable gas dispersion modelling to LFL (Lower Flammable Limit) and ½ LFL
• Thermal radiation modelling to 1800, 1000 and 500 thermal dose unit (tdu)
• Explosion overpressure modelling to 600, 140, and 70 mbar
The UK HSE uses the thermal dose criteria shown in Table 6.5. These values relate to people outdoors.
Thermal Dose (tdu) Effect
1800 50% fatalities among ‘typical’ population
1000 Dangerous dose to a ‘typical’ population – equates to approximately
1% fatalities
500 Dangerous dose to a vulnerable/sensitive population
Note: 1 thermal dose unit (tdu) = 1 (kW/𝑚2)4 3⁄ ). 𝑠
Table 6.5: Thermal dose impact criteria
For the purpose of converting thermal dose to thermal flux (for jet fires), an exposure duration of 30s is used. This is based on the time for a person from a normal population to escape from the fire and seek shelter, with an escape speed of 2.5m/s and standard distance of 75m, as suggested by the HSE’s LUP guidance document [5]. Hence, the thermal radiation levels that equate to thermal doses (presented in *the calculated thermal radiation levels
that are equated to 1800, 1000 and 500 tdu are 21.6, 13.9 and 8.25 kW/m2 respectively. Conservatively, the thermal radiation levels presented in Table 6.6 have been
selected.
Table 6.6) are used for the impact criteria on jet fire modelling.
Thermal Dose Unit (tdu) Thermal Radiation Level (𝐤𝐖/𝐦𝟐)∗
1800 21
1000 13.5
500 8
*the calculated thermal radiation levels that are equated to 1800, 1000 and 500 tdu are 21.6, 13.9 and 8.25 kW/m2 respectively. Conservatively, the thermal radiation levels
presented in Table 6.6 have been selected.
Table 6.6: Thermal radiation criteria for 30s exposure
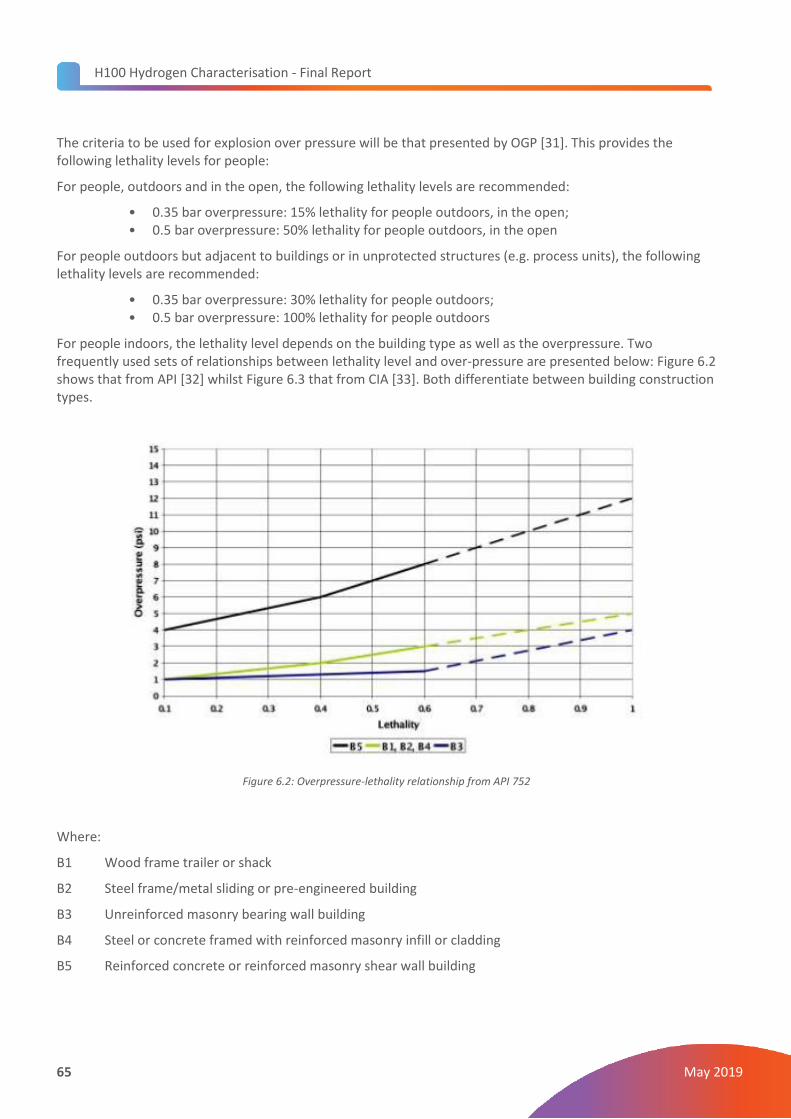
H100 Hydrogen Characterisation - Final Report
65 May 2019
The criteria to be used for explosion over pressure will be that presented by OGP [31]. This provides the following lethality levels for people:
For people, outdoors and in the open, the following lethality levels are recommended:
• 0.35 bar overpressure: 15% lethality for people outdoors, in the open; • 0.5 bar overpressure: 50% lethality for people outdoors, in the open
For people outdoors but adjacent to buildings or in unprotected structures (e.g. process units), the following lethality levels are recommended:
• 0.35 bar overpressure: 30% lethality for people outdoors; • 0.5 bar overpressure: 100% lethality for people outdoors
For people indoors, the lethality level depends on the building type as well as the overpressure. Two frequently used sets of relationships between lethality level and over-pressure are presented below: Figure 6.2 shows that from API [32] whilst Figure 6.3 that from CIA [33]. Both differentiate between building construction types.
Figure 6.2: Overpressure-lethality relationship from API 752
Where:
B1 Wood frame trailer or shack
B2 Steel frame/metal sliding or pre-engineered building
B3 Unreinforced masonry bearing wall building
B4 Steel or concrete framed with reinforced masonry infill or cladding
B5 Reinforced concrete or reinforced masonry shear wall building
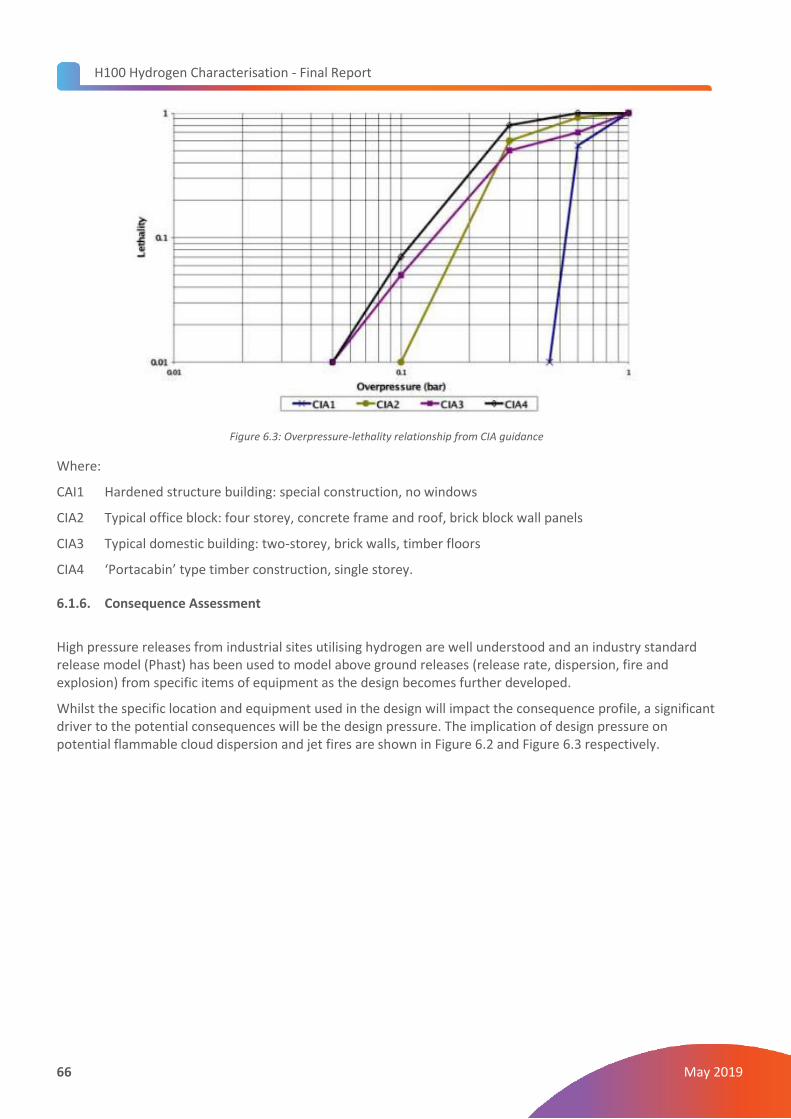
H100 Hydrogen Characterisation - Final Report
66 May 2019
Figure 6.3: Overpressure-lethality relationship from CIA guidance
Where:
CAI1 Hardened structure building: special construction, no windows
CIA2 Typical office block: four storey, concrete frame and roof, brick block wall panels
CIA3 Typical domestic building: two-storey, brick walls, timber floors
CIA4 ‘Portacabin’ type timber construction, single storey.
6.1.6. Consequence Assessment
High pressure releases from industrial sites utilising hydrogen are well understood and an industry standard release model (Phast) has been used to model above ground releases (release rate, dispersion, fire and explosion) from specific items of equipment as the design becomes further developed.
Whilst the specific location and equipment used in the design will impact the consequence profile, a significant driver to the potential consequences will be the design pressure. The implication of design pressure on potential flammable cloud dispersion and jet fires are shown in Figure 6.2 and Figure 6.3 respectively.
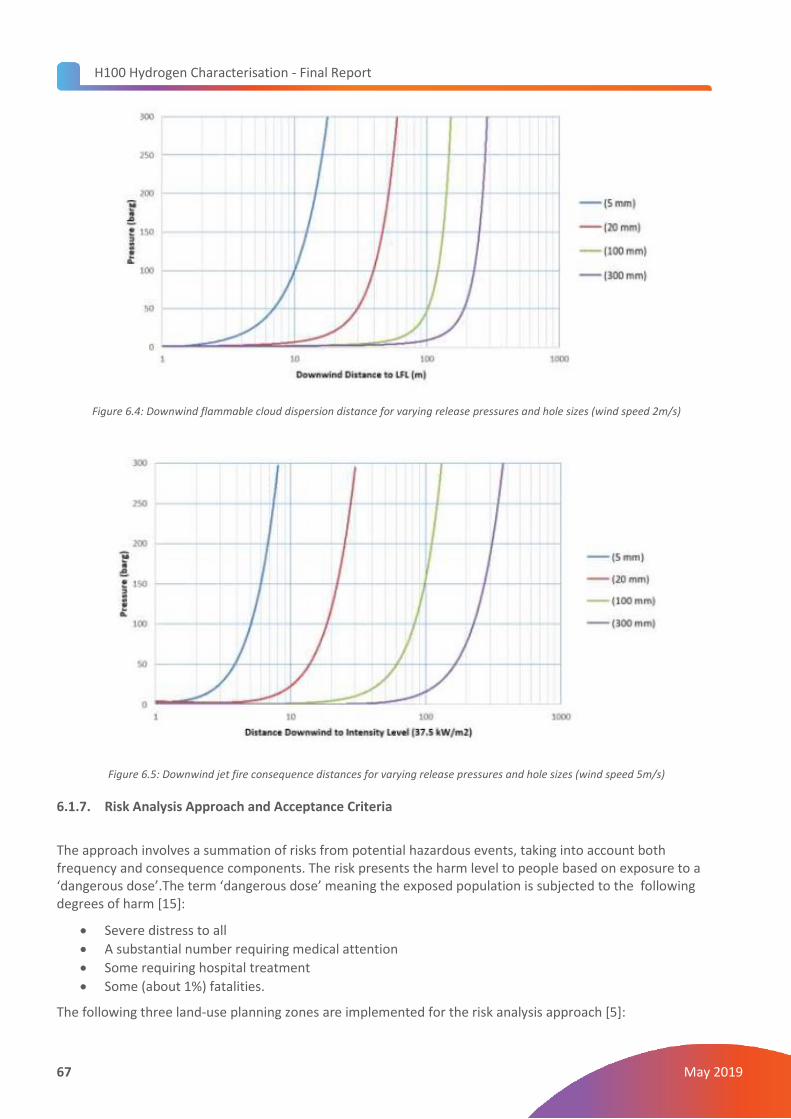
H100 Hydrogen Characterisation - Final Report
67 May 2019
Figure 6.4: Downwind flammable cloud dispersion distance for varying release pressures and hole sizes (wind speed 2m/s)
Figure 6.5: Downwind jet fire consequence distances for varying release pressures and hole sizes (wind speed 5m/s)
6.1.7. Risk Analysis Approach and Acceptance Criteria
The approach involves a summation of risks from potential hazardous events, taking into account both frequency and consequence components. The risk presents the harm level to people based on exposure to a ‘dangerous dose’.The term ‘dangerous dose’ meaning the exposed population is subjected to the following degrees of harm [15]:
• Severe distress to all
• A substantial number requiring medical attention
• Some requiring hospital treatment
• Some (about 1%) fatalities.
The following three land-use planning zones are implemented for the risk analysis approach [5]:
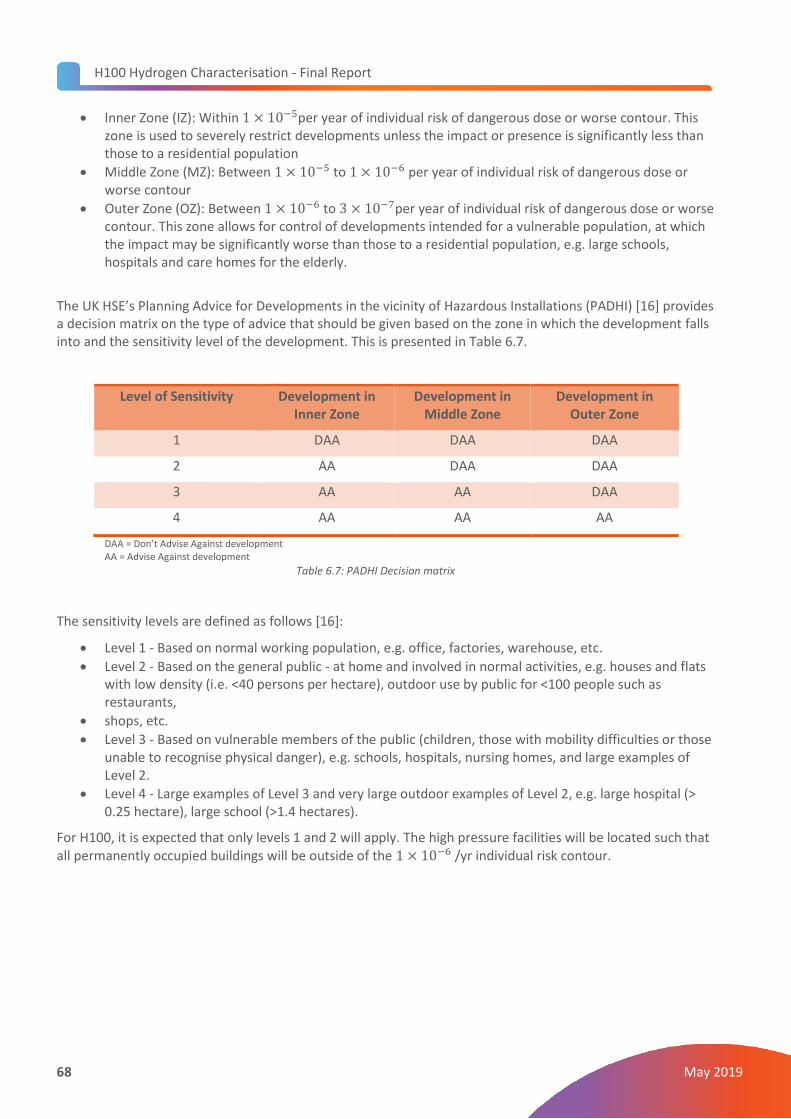
H100 Hydrogen Characterisation - Final Report
68 May 2019
• Inner Zone (IZ): Within 1 × 10⁻⁵per year of individual risk of dangerous dose or worse contour. This zone is used to severely restrict developments unless the impact or presence is significantly less than those to a residential population
• Middle Zone (MZ): Between 1 × 10⁻⁵ to 1 × 10⁻⁶ per year of individual risk of dangerous dose or worse contour
• Outer Zone (OZ): Between 1 × 10⁻⁶ to 3 × 10⁻⁷per year of individual risk of dangerous dose or worse contour. This zone allows for control of developments intended for a vulnerable population, at which the impact may be significantly worse than those to a residential population, e.g. large schools, hospitals and care homes for the elderly.
The UK HSE’s Planning Advice for Developments in the vicinity of Hazardous Installations (PADHI) [16] provides a decision matrix on the type of advice that should be given based on the zone in which the development falls into and the sensitivity level of the development. This is presented in Table 6.7.
Level of Sensitivity Development in Inner Zone
Development in Middle Zone
Development in Outer Zone
1 DAA DAA DAA
2 AA DAA DAA
3 AA AA DAA
4 AA AA AA
DAA = Don’t Advise Against development AA = Advise Against development
Table 6.7: PADHI Decision matrix
The sensitivity levels are defined as follows [16]:
• Level 1 - Based on normal working population, e.g. office, factories, warehouse, etc.
• Level 2 - Based on the general public - at home and involved in normal activities, e.g. houses and flats with low density (i.e. <40 persons per hectare), outdoor use by public for <100 people such as restaurants,
• shops, etc.
• Level 3 - Based on vulnerable members of the public (children, those with mobility difficulties or those unable to recognise physical danger), e.g. schools, hospitals, nursing homes, and large examples of Level 2.
• Level 4 - Large examples of Level 3 and very large outdoor examples of Level 2, e.g. large hospital (> 0.25 hectare), large school (>1.4 hectares).
For H100, it is expected that only levels 1 and 2 will apply. The high pressure facilities will be located such that all permanently occupied buildings will be outside of the 1 × 10⁻⁶ /yr individual risk contour.
H100 Hydrogen Characterisation - Final Report
69 May 2019
7. Review of Emergency Policy and Procedures
7.1. General Findings A review of SGN’s Management Procedure [29] and Work Procedure [30] has been conducted to identify the changes that are required to enable those document to remain applicable under hydrogen operations.
Our findings suggest that it should be possible to update the two procedures to address hydrogen with a fairly limited number of changes. However, further work/studies will be required in many cases (e.g. as part of H100/ other projects) before the information to make these changes is available. The key areas of change required include:
Gas Detection Instruments
Current NG detection instruments (e.g. Gascoseeker, extended Gascoseeker probe, LEL/GIA gas detector, FIM/FID machine, etc) are referred to throughout. The equivalent instruments for hydrogen use need to be developed/described.
Size of Search Zones
The size of the search zones are currently quoted for natural gas. These are also likely to be sufficient for hydrogen but should be reviewed in the light of the test results presented in Section 3.
Size of Evacuation Zones
These are currently tabulated for different sizes of natural gas release. The distances will need to be reviewed for hydrogen (in light of dispersion/explosion tests) and updated accordingly.
Gas Escape Risk Assessment Matrix
This is currently developed for NG and will need updating (risk scores, distances, etc) for hydrogen utilising the results from the testing.
Odourant
References to odourant and “characteristic smell of natural gas” will require update once information on odourant for hydrogen is known.
Regulations
References to regulations such as GS(M)R, PSR, PSSR and RIDDOR. In many cases these regulations will require update to specifically address hydrogen (e.g. quantity thresholds for RIDDOR)
Domestic Meters
Descriptions relating to current meters, regulators, etc in procedures (appendices) will need updating to reflect same for hydrogen, once equipment is developed
Ignition
Current procedures relating to electrical isolation, PPE, tools, potential ignition sources, etc to be risk assessed to confirm their continued suitability for hydrogen
Barholing
Current procedures relating to barholing to be risk assessed to confirm continued suitability for hydrogen
Competency/Training
Training for dealing with hydrogen escapes (and utilising hydrogen gas detection equipment) will be required and any differences in approach, compared to NG, incorporated into procedures.
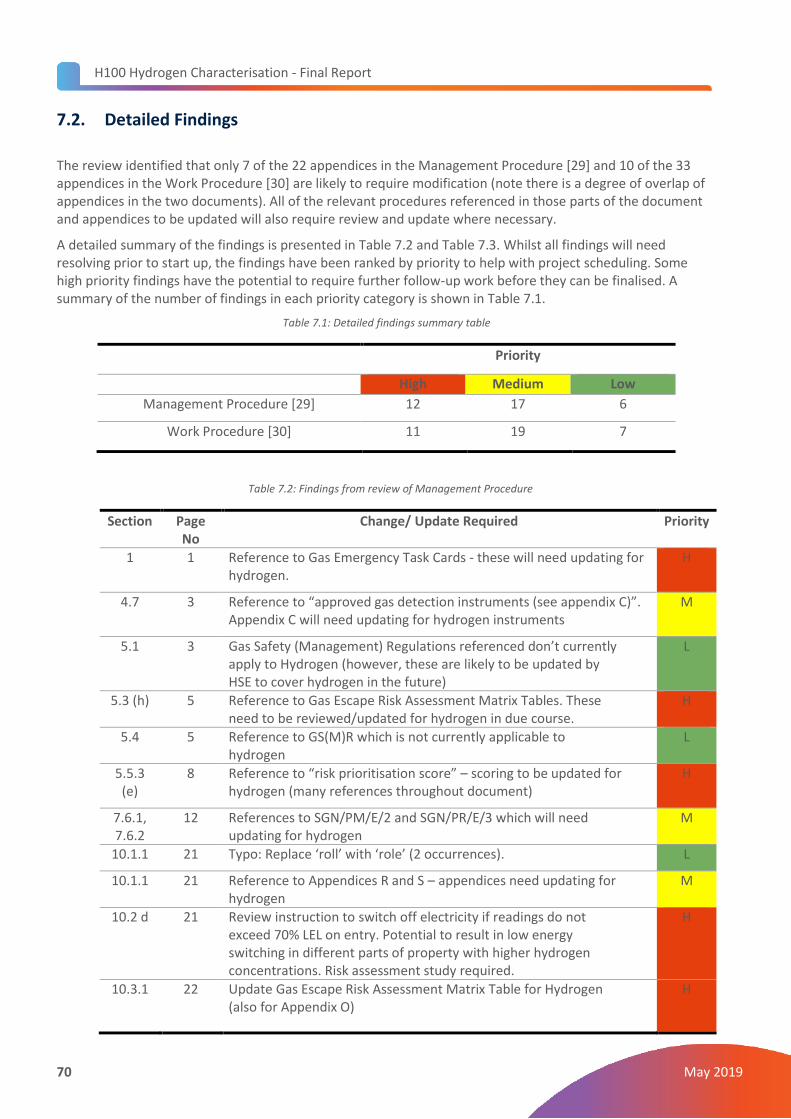
H100 Hydrogen Characterisation - Final Report
70 May 2019
7.2. Detailed Findings
The review identified that only 7 of the 22 appendices in the Management Procedure [29] and 10 of the 33 appendices in the Work Procedure [30] are likely to require modification (note there is a degree of overlap of appendices in the two documents). All of the relevant procedures referenced in those parts of the document and appendices to be updated will also require review and update where necessary.
A detailed summary of the findings is presented in Table 7.2 and Table 7.3. Whilst all findings will need resolving prior to start up, the findings have been ranked by priority to help with project scheduling. Some high priority findings have the potential to require further follow-up work before they can be finalised. A summary of the number of findings in each priority category is shown in Table 7.1.
Table 7.1: Detailed findings summary table
Priority
High Medium Low
Management Procedure [29] 12 17 6
Work Procedure [30] 11 19 7
Table 7.2: Findings from review of Management Procedure
Section Page No
Change/ Update Required Priority
1 1 Reference to Gas Emergency Task Cards - these will need updating for hydrogen.
H
4.7 3 Reference to “approved gas detection instruments (see appendix C)”. Appendix C will need updating for hydrogen instruments
M
5.1 3 Gas Safety (Management) Regulations referenced don’t currently apply to Hydrogen (however, these are likely to be updated by HSE to cover hydrogen in the future)
L
5.3 (h) 5 Reference to Gas Escape Risk Assessment Matrix Tables. These need to be reviewed/updated for hydrogen in due course.
H
5.4 5 Reference to GS(M)R which is not currently applicable to hydrogen
L
5.5.3 (e)
8 Reference to “risk prioritisation score” – scoring to be updated for hydrogen (many references throughout document)
H
7.6.1, 7.6.2
12 References to SGN/PM/E/2 and SGN/PR/E/3 which will need updating for hydrogen
M
10.1.1 21 Typo: Replace ‘roll’ with ‘role’ (2 occurrences). L
10.1.1 21 Reference to Appendices R and S – appendices need updating for hydrogen
M
10.2 d 21 Review instruction to switch off electricity if readings do not exceed 70% LEL on entry. Potential to result in low energy switching in different parts of property with higher hydrogen concentrations. Risk assessment study required.
H
10.3.1 22 Update Gas Escape Risk Assessment Matrix Table for Hydrogen (also for Appendix O)
H
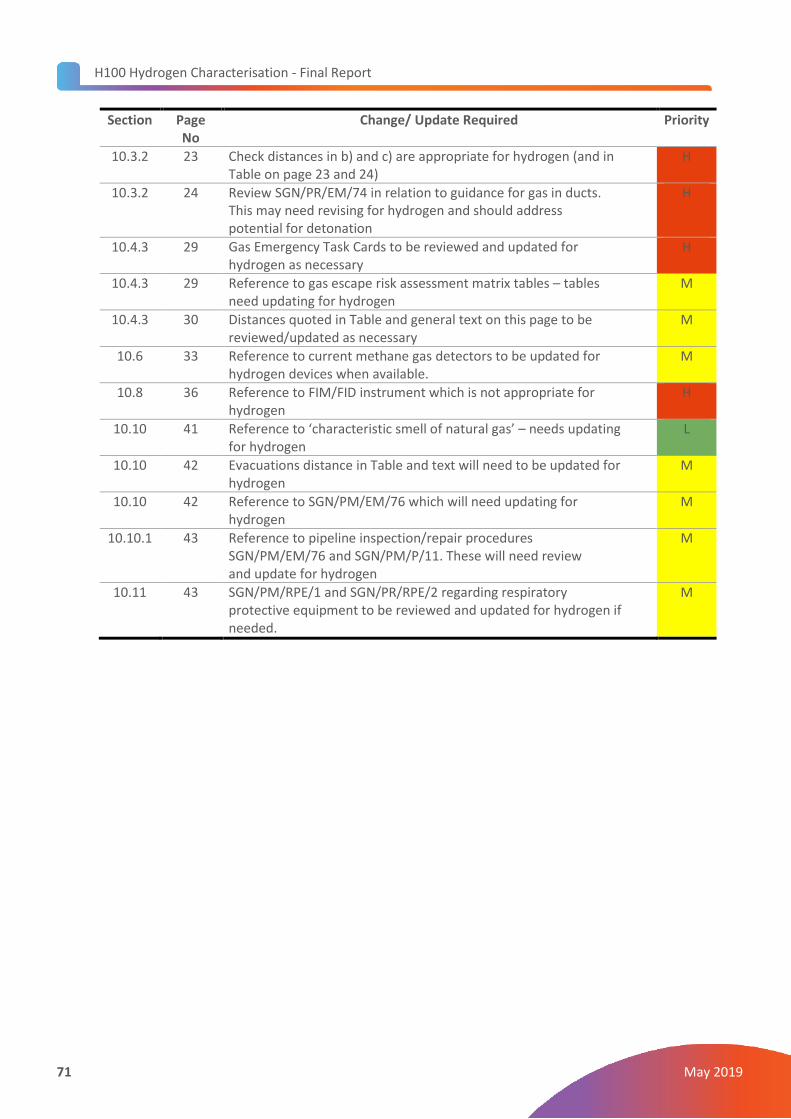
H100 Hydrogen Characterisation - Final Report
71 May 2019
Section Page No
Change/ Update Required Priority
10.3.2 23 Check distances in b) and c) are appropriate for hydrogen (and in Table on page 23 and 24)
H
10.3.2 24 Review SGN/PR/EM/74 in relation to guidance for gas in ducts. This may need revising for hydrogen and should address potential for detonation
H
10.4.3 29 Gas Emergency Task Cards to be reviewed and updated for hydrogen as necessary
H
10.4.3 29 Reference to gas escape risk assessment matrix tables – tables need updating for hydrogen
M
10.4.3 30 Distances quoted in Table and general text on this page to be reviewed/updated as necessary
M
10.6 33 Reference to current methane gas detectors to be updated for hydrogen devices when available.
M
10.8 36 Reference to FIM/FID instrument which is not appropriate for hydrogen
H
10.10 41 Reference to ‘characteristic smell of natural gas’ – needs updating for hydrogen
L
10.10 42 Evacuations distance in Table and text will need to be updated for hydrogen
M
10.10 42 Reference to SGN/PM/EM/76 which will need updating for hydrogen
M
10.10.1 43 Reference to pipeline inspection/repair procedures SGN/PM/EM/76 and SGN/PM/P/11. These will need review and update for hydrogen
M
10.11 43 SGN/PM/RPE/1 and SGN/PR/RPE/2 regarding respiratory protective equipment to be reviewed and updated for hydrogen if needed.
M
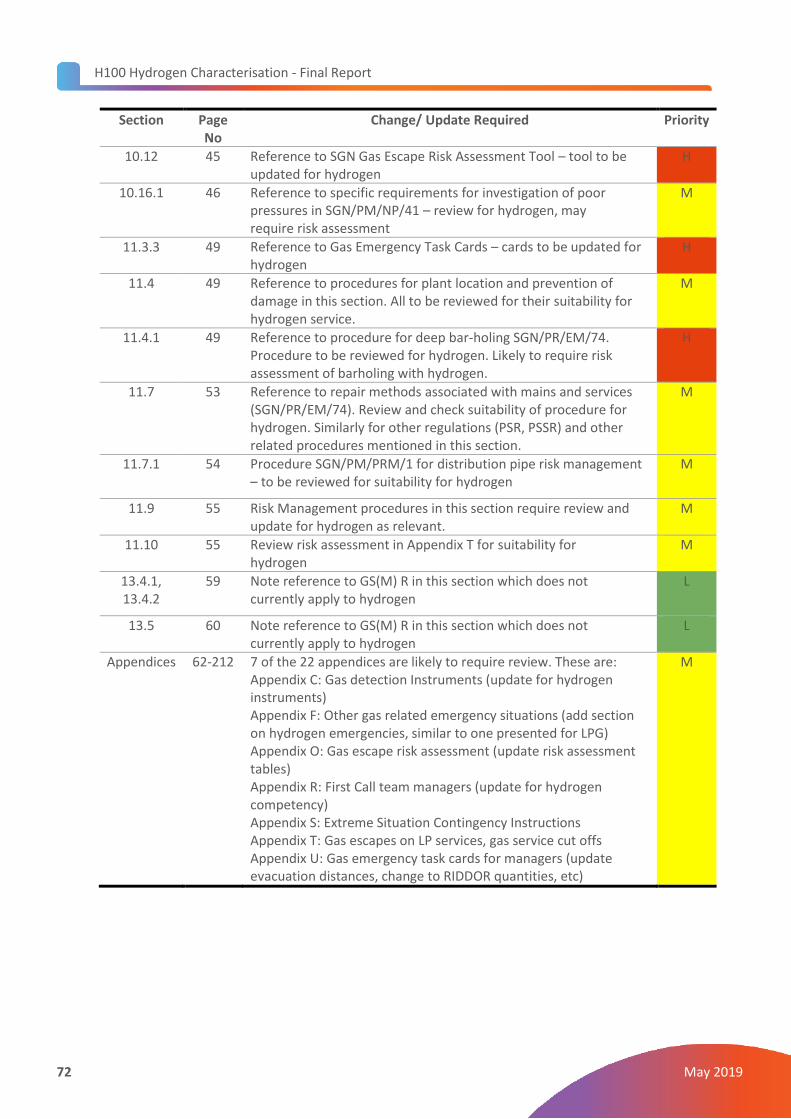
H100 Hydrogen Characterisation - Final Report
72 May 2019
Section Page No
Change/ Update Required Priority
10.12 45 Reference to SGN Gas Escape Risk Assessment Tool – tool to be updated for hydrogen
H
10.16.1 46 Reference to specific requirements for investigation of poor pressures in SGN/PM/NP/41 – review for hydrogen, may require risk assessment
M
11.3.3 49 Reference to Gas Emergency Task Cards – cards to be updated for hydrogen
H
11.4 49 Reference to procedures for plant location and prevention of damage in this section. All to be reviewed for their suitability for hydrogen service.
M
11.4.1 49 Reference to procedure for deep bar-holing SGN/PR/EM/74. Procedure to be reviewed for hydrogen. Likely to require risk assessment of barholing with hydrogen.
H
11.7 53 Reference to repair methods associated with mains and services (SGN/PR/EM/74). Review and check suitability of procedure for hydrogen. Similarly for other regulations (PSR, PSSR) and other related procedures mentioned in this section.
M
11.7.1 54 Procedure SGN/PM/PRM/1 for distribution pipe risk management – to be reviewed for suitability for hydrogen
M
11.9 55 Risk Management procedures in this section require review and update for hydrogen as relevant.
M
11.10 55 Review risk assessment in Appendix T for suitability for hydrogen
M
13.4.1, 13.4.2
59 Note reference to GS(M) R in this section which does not currently apply to hydrogen
L
13.5 60 Note reference to GS(M) R in this section which does not currently apply to hydrogen
L
Appendices 62-212 7 of the 22 appendices are likely to require review. These are: Appendix C: Gas detection Instruments (update for hydrogen instruments) Appendix F: Other gas related emergency situations (add section on hydrogen emergencies, similar to one presented for LPG) Appendix O: Gas escape risk assessment (update risk assessment tables) Appendix R: First Call team managers (update for hydrogen competency) Appendix S: Extreme Situation Contingency Instructions Appendix T: Gas escapes on LP services, gas service cut offs Appendix U: Gas emergency task cards for managers (update evacuation distances, change to RIDDOR quantities, etc)
M
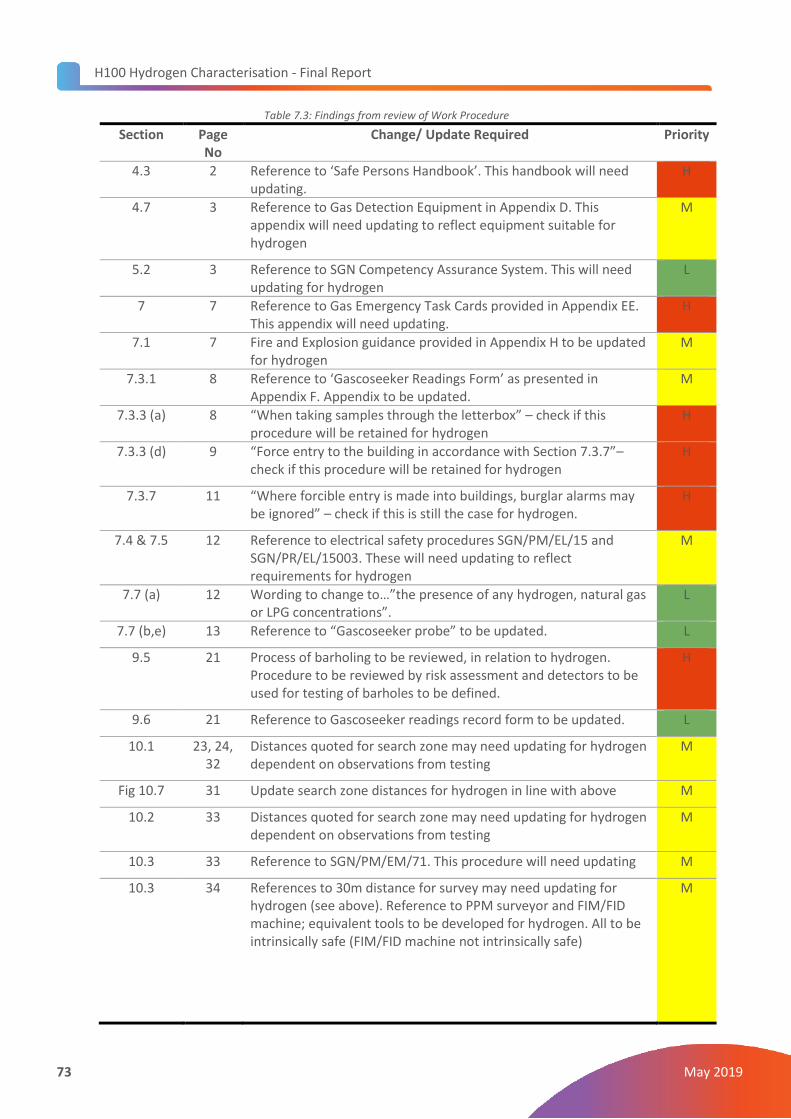
H100 Hydrogen Characterisation - Final Report
73 May 2019
Table 7.3: Findings from review of Work Procedure
Section Page No
Change/ Update Required Priority
4.3 2 Reference to ‘Safe Persons Handbook’. This handbook will need updating.
H
4.7 3 Reference to Gas Detection Equipment in Appendix D. This appendix will need updating to reflect equipment suitable for hydrogen
M
5.2 3 Reference to SGN Competency Assurance System. This will need updating for hydrogen
L
7 7 Reference to Gas Emergency Task Cards provided in Appendix EE. This appendix will need updating.
H
7.1 7 Fire and Explosion guidance provided in Appendix H to be updated for hydrogen
M
7.3.1 8 Reference to ‘Gascoseeker Readings Form’ as presented in Appendix F. Appendix to be updated.
M
7.3.3 (a) 8 “When taking samples through the letterbox” – check if this procedure will be retained for hydrogen
H
7.3.3 (d) 9 “Force entry to the building in accordance with Section 7.3.7”– check if this procedure will be retained for hydrogen
H
7.3.7 11 “Where forcible entry is made into buildings, burglar alarms may be ignored” – check if this is still the case for hydrogen.
H
7.4 & 7.5 12 Reference to electrical safety procedures SGN/PM/EL/15 and SGN/PR/EL/15003. These will need updating to reflect requirements for hydrogen
M
7.7 (a) 12 Wording to change to…”the presence of any hydrogen, natural gas or LPG concentrations”.
L
7.7 (b,e) 13 Reference to “Gascoseeker probe” to be updated. L
9.5 21 Process of barholing to be reviewed, in relation to hydrogen. Procedure to be reviewed by risk assessment and detectors to be used for testing of barholes to be defined.
H
9.6 21 Reference to Gascoseeker readings record form to be updated. L
10.1 23, 24, 32
Distances quoted for search zone may need updating for hydrogen dependent on observations from testing
M
Fig 10.7 31 Update search zone distances for hydrogen in line with above M
10.2 33 Distances quoted for search zone may need updating for hydrogen dependent on observations from testing
M
10.3 33 Reference to SGN/PM/EM/71. This procedure will need updating M
10.3 34 References to 30m distance for survey may need updating for hydrogen (see above). Reference to PPM surveyor and FIM/FID machine; equivalent tools to be developed for hydrogen. All to be intrinsically safe (FIM/FID machine not intrinsically safe)
M
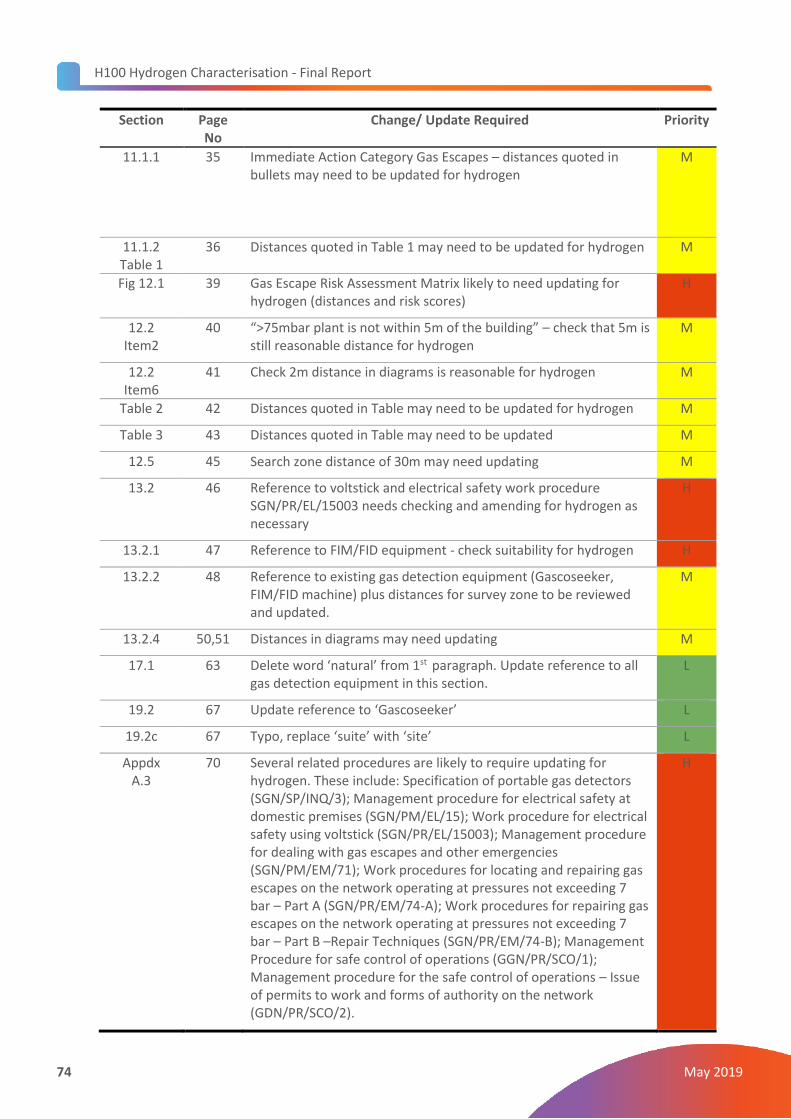
H100 Hydrogen Characterisation - Final Report
74 May 2019
Section Page No
Change/ Update Required Priority
11.1.1 35 Immediate Action Category Gas Escapes – distances quoted in bullets may need to be updated for hydrogen
M
11.1.2 Table 1
36 Distances quoted in Table 1 may need to be updated for hydrogen M
Fig 12.1 39 Gas Escape Risk Assessment Matrix likely to need updating for hydrogen (distances and risk scores)
H
12.2 Item2
40 “>75mbar plant is not within 5m of the building” – check that 5m is still reasonable distance for hydrogen
M
12.2 Item6
41 Check 2m distance in diagrams is reasonable for hydrogen M
Table 2 42 Distances quoted in Table may need to be updated for hydrogen M
Table 3 43 Distances quoted in Table may need to be updated M
12.5 45 Search zone distance of 30m may need updating M
13.2 46 Reference to voltstick and electrical safety work procedure SGN/PR/EL/15003 needs checking and amending for hydrogen as necessary
H
13.2.1 47 Reference to FIM/FID equipment - check suitability for hydrogen H
13.2.2 48 Reference to existing gas detection equipment (Gascoseeker, FIM/FID machine) plus distances for survey zone to be reviewed and updated.
M
13.2.4 50,51 Distances in diagrams may need updating M
17.1 63 Delete word ‘natural’ from 1st paragraph. Update reference to all gas detection equipment in this section.
L
19.2 67 Update reference to ‘Gascoseeker’ L
19.2c 67 Typo, replace ‘suite’ with ‘site’ L
Appdx A.3
70 Several related procedures are likely to require updating for hydrogen. These include: Specification of portable gas detectors (SGN/SP/INQ/3); Management procedure for electrical safety at domestic premises (SGN/PM/EL/15); Work procedure for electrical safety using voltstick (SGN/PR/EL/15003); Management procedure for dealing with gas escapes and other emergencies (SGN/PM/EM/71); Work procedures for locating and repairing gas escapes on the network operating at pressures not exceeding 7 bar – Part A (SGN/PR/EM/74-A); Work procedures for repairing gas escapes on the network operating at pressures not exceeding 7 bar – Part B –Repair Techniques (SGN/PR/EM/74-B); Management Procedure for safe control of operations (GGN/PR/SCO/1); Management procedure for the safe control of operations – Issue of permits to work and forms of authority on the network (GDN/PR/SCO/2).
H
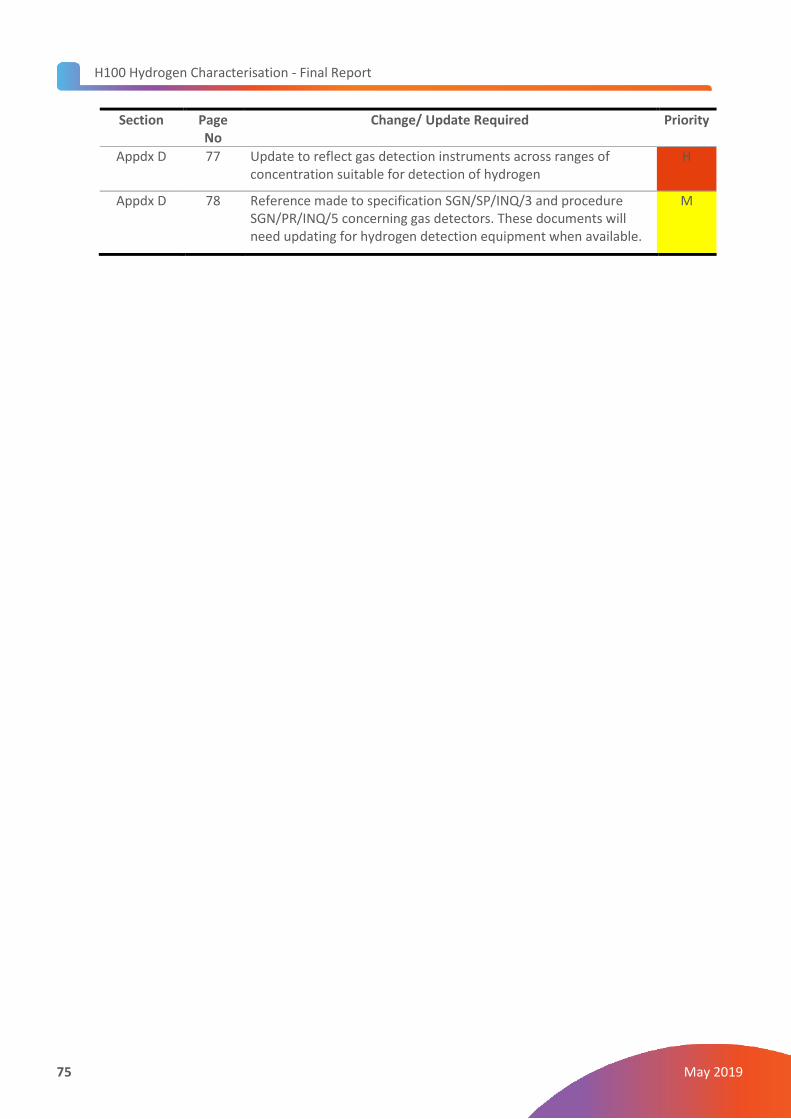
H100 Hydrogen Characterisation - Final Report
75 May 2019
Section Page No
Change/ Update Required Priority
Appdx D 77 Update to reflect gas detection instruments across ranges of concentration suitable for detection of hydrogen
H
Appdx D 78 Reference made to specification SGN/SP/INQ/3 and procedure SGN/PR/INQ/5 concerning gas detectors. These documents will need updating for hydrogen detection equipment when available.
M
H100 Hydrogen Characterisation - Final Report
76 May 2019
8. Conclusions
8.1. Below Ground Gas Dispersion
A series of eight generic flow regimes were analysed corresponding to various flows under open and covered surfaces. In each the focus was on the distance to which gas can travel to a minimum hazardous flux level and how this distance changes if hydrogen is substituted for methane. This type of information is required in developing the QRA and the ‘case for safety’ for hydrogen supply.
In many cases the switch to hydrogen makes minimal difference to the range at which significant gas flows will occur. If the ground around the leak is uncovered, the hydrogen or methane escapes within a few metres of the release point. In cases where the leak is covered, the switch to hydrogen may extend the range more significantly (by up to 25%).
The most serious potential consequences (largest flow rates) are associated with (very rare) releases into large open channels that lead directly into vulnerable buildings. A clear example of this problem is a service duct that is not properly sealed where it enters a property. Some ducts (especially for gas pipes) are perforated. In this case there is potential for gas within the duct to leak to safety through perforations rather than reach a vulnerable target via a damaged seal.
Key findings from the experimental programme are:
• The measured flow rates through the sand (up to 40 litres/second) closely followed Darcy’s Equation - flow rate was strictly proportional to pressure. There was no indication that inertial corrections at higher flow rates should be included in modelling.
• Heavy surface application of water resulted in a decrease in permeability of an order of magnitude, but for sand this decrease was very short lived. The permeability returned to close to its original value within about an hour.
• Measurements of surface gas flux were made for various gases leaking from a point source at rates of approximately 10 litres/second under an open surface. The results compared well with solutions of Darcy’s Equation with appropriate boundary conditions.
• Measurements of surface gas flux were made for various gases leaking from a point source at rates of approximately 10 litres/second under an impermeable cover. In all cases the gases flowed under the cover and then escaped very close to the edge of the impermeable layer. The results confirmed that any significant break in an impermeable cover,of a width that is a significant fraction of the source depth, will be sufficient to allow all gas passing under the cover to escape.
• Horizontal distances travelled below ground from the point of release were found to be typically 6%-25% further for hydrogen compared to natural gas across the range of conditions tested.
H100 Hydrogen Characterisation - Final Report
77 May 2019
8.2. Risk Assessment
Research around a number of critical factors in understanding the risk profile of hydrogen is ongoing; which includes leakage, dispersion, ignition, and consequence assessment.
A comparative estimate of fire and explosion risk for the proposed H100 hydrogen network (against the current SGN network supplying natural gas) has been conducted based on the best available understanding of the influencing factors at this stage. This is obtained by combining the following factors:
• A reduction of gas in building events from leaks upstream of the meter of 59%. This is due to a reduced frequency of release upstream of the meter (66%) due to having a 100% PE network, and an increased relative movement of gas below ground of 20% for hydrogen;
• Increased factor for gas build-up and subsequent ignition of hydrogen events of 400% (200% for the large release category) due to hydrogen producing higher concentration levels (for the same release hole size) and having lower ignition energy.
This analysis is for upstream (of the meter) events only. These historically represent around 15% of fire and explosion events involving natural gas. Downstream releases, which constitute 85% of fire and explosion events, are to be addressed in a separate study.
The above estimate does not include for any difference between the respective consequences of an explosion. However, it is noted that for the hydrogen concentrations of up to 15% measured at HyHouse, the flame speed would be less than natural gas at all concentrations up to 12% and less than towns gas at all concentrations up to 15%.
8.3. Emergency Procedures
A review of SGN’s Management Procedure and Work Procedure has been conducted to identify the changes that are required to enable those documents to remain applicable under hydrogen operations.
The findings suggest that it should be possible to update the two procedures to address hydrogen with a fairly limited number of changes. However, further work or studies will be required in many cases (e.g. as part of H100 or other projects) before the information to make these changes is available.
8.4. Implications for H100 Project
The work undertaken to understand hydrogen characteristics, the potential risk from leaks upstream of the meter, and the implications on SGN’s emergency response procedures have identified the following implications to the H100 project:
• The use of hydrogen makes a small difference to the distances over which gas leaks travel below ground compared to natural gas. This is typically an increase of 6-25%.
• Installing a new full polyethylene network offers a reduction in the likelihood of upstream leaks by around 66%. This is a major benefit that the H100 project will offer compared to the current mixed material network.
• The emergency response procedures should be updated where appropriate in line with the findings of this report.
• The overall comparative risk (hydrogen v natural gas) for the H100 project can only be estimated when an evaluation of downstream releases is conducted to complement this study of upstream releases. This is likely to indicate a range of risk reduction measures that can be incorporated into the H100 design specifically to address the risk from downstream releases.
H100 Hydrogen Characterisation - Final Report
78 May 2019
9. References [1] Okamoto, H. and Gomi, Y. (2011). Empirical research on diffusion behavior of leaked gas in the ground. Journal of Loss Prevention in the Process Industries, 24(5), 531-540.
[2] Okamoto, H., Gomi, Y. and Akagi, H. (2014). Movement characteristics of hydrogen gas within the ground and its detection at ground surface. Journal of Civil Engineering and Science, 3(1), 49-66.
[3] Method of Images https://en.wikipedia.org/wiki/Method_of_images
[4] Planning Case Assessment Guidance, Health and Safety Executive (HSE), 2000.
[5] Land-Use Planning Methodology, Technical Reference Document,
Health and Safety Executive (HSE), July 2005.
[6] Failure Rate and Event Data for use within Risk Assessments, PCAG chp_6K Version 12, HSE, 2012.
[7] Ham, K et al. Benchmarking exercise on risk assessment methods applied to virtual hydrogen refuelling station.
[8] Groth, K et al. Methodology for assessing the safety of hydrogen systems: HyRAM 1.1 technical reference manual. Sandia report SAND2017-2998.
[9] Hankinson, G., Marthurkar, H. and Lwesmith, BJ. Ignition energy and ignition probability of Methane-Hydrogen-Air Mixtures.
[10] Risk Assessment Data Directory, Report No. 434, International Association of Oil and Gas Producers (OGP), 2010.
[11] IGEM/TD/2, Application of Pipeline Risk Assessment to proposed Developments in the Vicinity of High Pressure Natural Gas Pipeline, Institute of Gas Engineers and Managers.
[12] Classification of Hazardous Locations, AW Cox, FP Lees and ML Ang, 1990.
[13] Reference Manual Bevi Risk Assessments, Version 3.1, The National Institute of Public Health and the Environment (RIVM), 2009.
[14] IP Research Report: Ignition Probability Review, Model Development and Look-up Correlations, Energy Institute, 2006.
[15] HSE’s Current Approach to land Use Planning (LUP).
[16] PADHI, HSE’s Land Use Planning Methodology, Health and Safety Executive.
[17] SGN, 2017. Gas Safety and Management Regulations incident summary data from SGN 2002-2017
[18] Energy Network Association, 2013. Guide to the UK and Ireland Energy Networks. Available at: http://www.energynetworks.org/assets/files/news/publications/GTTN/GTTN%202013_Website%20version.pdf [Accessed 01/12/18]
[19] SGN, 2018. Annual report and financial Statements 2018.
[20] HSE, 2015. Major Hazard Safety Performance Indicators in Great Britain’s Onshore Gas and Pipelines Industry, Annual Report 2014/5
[21] RIDGAS, 2018. Gas Related Incidents Reported in Great Britain. Available at: http://www.hse.gov.uk/statistics/tables/index.htm
[22] HyHouse, 2015. Safety Issues Surrounding Hydrogen as an Energy Storage Vector. Kiwa Gastec.
[23] Crowther, M. ENA Presentation Slides, Kiwa Gas, November 2018.
[24] https://www.hnogreenfuels.com/science_behind_leefh2.html

H100 Hydrogen Characterisation - Final Report
79 May 2019
[25] Mathurkar, H, 2009. Minimum ignition energy and ignition probability for methane, hydrogen and their mixtures. Loughborough University
[26] EGIG, 2018. Gas Pipeline Incidents, 10th Report of the European Gas Pipeline Incident Data Group (period 1970-2016) VA 17.R.0395
[27] UKOPA, 2018. UKOPA Pipeline Product Loss Incidents and Faults Report (1962-2016). United Kingdom Onshore Pipeline Operators’ Association
[28] https://en.wikipedia.org/wiki/Permeability_(earth_sciences), accessed 27/02/2018
[29] SGN/PM/EM/71 SGN Management Procedure: Management Procedure for Dealing with Gas Escapes and other Emergencies. Revision 11/13, November 2013.
[30] SGN/PM/EM/72 SGN Work Procedure: Dealing with Gas Escapes and other Emergencies. Version No 2014 06 17, June 2014.
[31] OGP International Association of Oil and Gas Producers. Risk Assessment Data Directory, 2010.
[32] API RP 752 .American Petroleum Institute (API), Management of Hazards Associated with Location of
Process Plant Buildings 2nd Ed. 2003.
[33] Chemical Industries Association (CIA). Guidance for the location and design of occupied buildings on
chemical manufactured sites, 2nd Ed 2003.
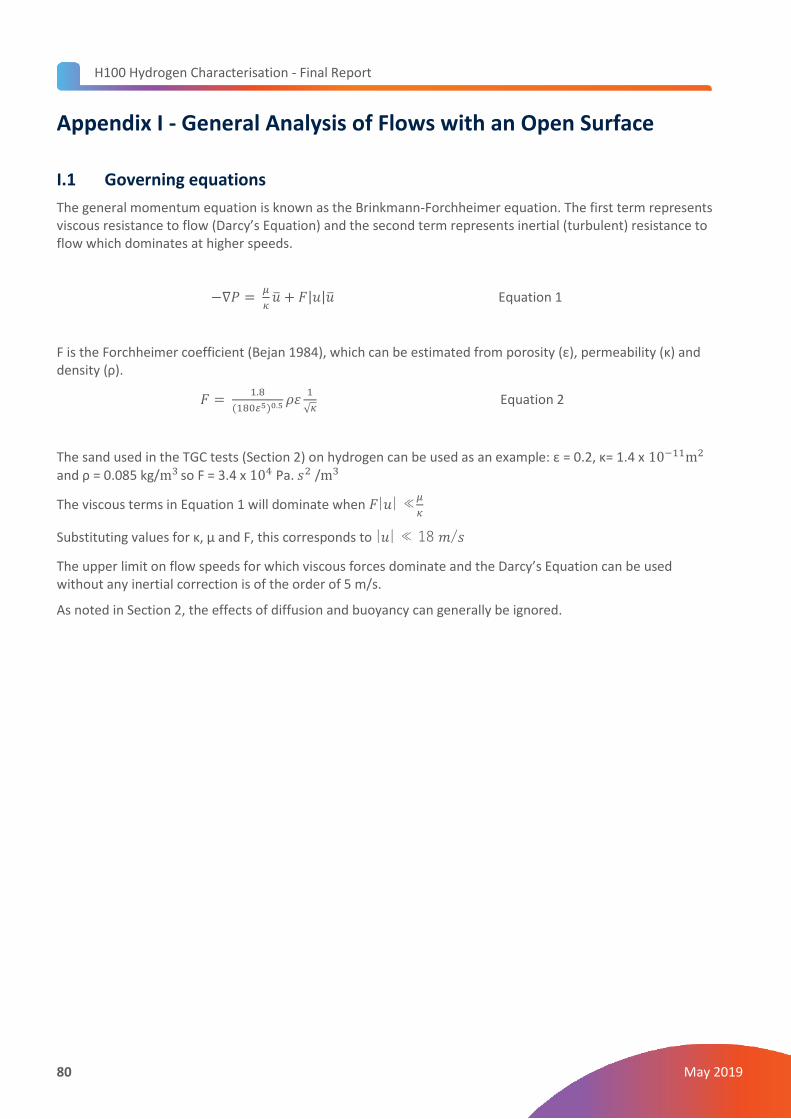
H100 Hydrogen Characterisation - Final Report
80 May 2019
Appendix I - General Analysis of Flows with an Open Surface
I.1 Governing equations
The general momentum equation is known as the Brinkmann-Forchheimer equation. The first term represents viscous resistance to flow (Darcy’s Equation) and the second term represents inertial (turbulent) resistance to flow which dominates at higher speeds.
−∇𝑃 = 𝜇
𝜅�� + 𝐹|𝑢|�� Equation 1
F is the Forchheimer coefficient (Bejan 1984), which can be estimated from porosity (ε), permeability (κ) and density (ρ).
𝐹 = 1.8
(180𝜀5)0.5 𝜌𝜀1
√𝜅 Equation 2
The sand used in the TGC tests (Section 2) on hydrogen can be used as an example: ε = 0.2, κ= 1.4 x 10⁻¹¹m2
and ρ = 0.085 kg/m3 so F = 3.4 x 10⁴ Pa. 𝑠2 /m3
The viscous terms in Equation 1 will dominate when 𝐹|𝑢| ≪𝜇
𝜅
Substituting values for κ, μ and F, this corresponds to |𝑢| ≪ 18 𝑚/𝑠
The upper limit on flow speeds for which viscous forces dominate and the Darcy’s Equation can be used without any inertial correction is of the order of 5 m/s.
As noted in Section 2, the effects of diffusion and buoyancy can generally be ignored.
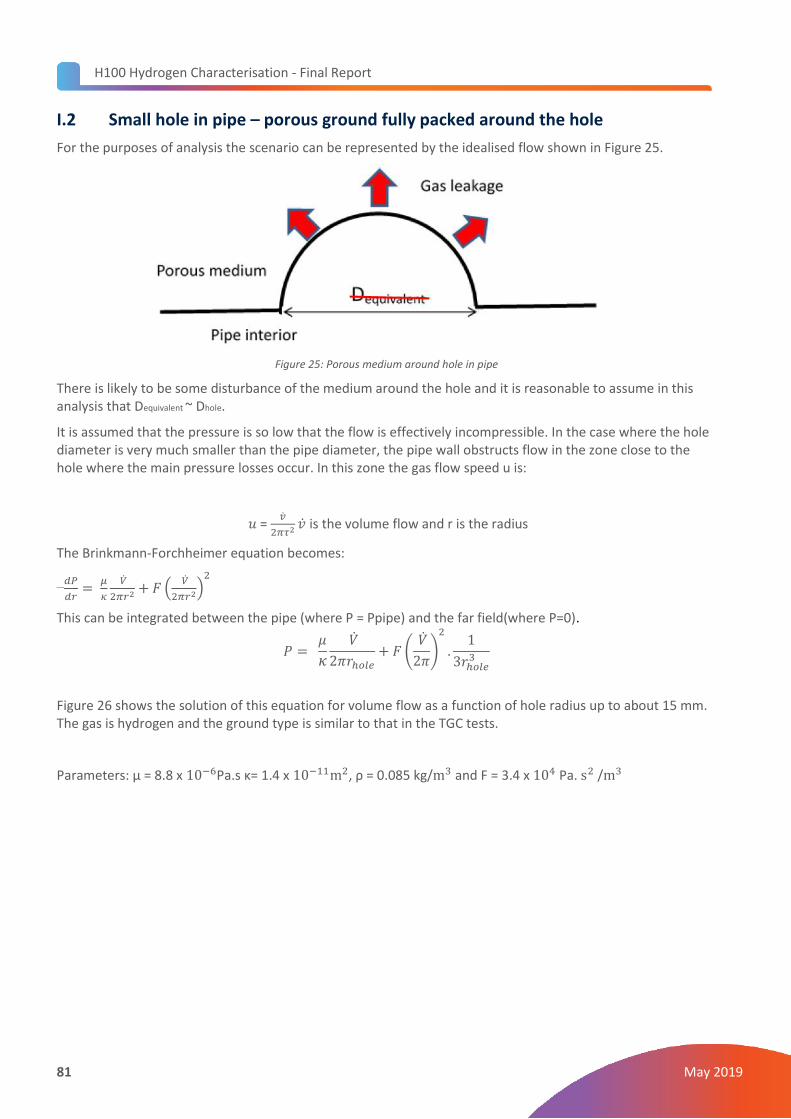
H100 Hydrogen Characterisation - Final Report
81 May 2019
I.2 Small hole in pipe – porous ground fully packed around the hole
For the purposes of analysis the scenario can be represented by the idealised flow shown in Figure 25.
Figure 25: Porous medium around hole in pipe
There is likely to be some disturbance of the medium around the hole and it is reasonable to assume in this analysis that Dequivalent ~ Dhole.
It is assumed that the pressure is so low that the flow is effectively incompressible. In the case where the hole diameter is very much smaller than the pipe diameter, the pipe wall obstructs flow in the zone close to the hole where the main pressure losses occur. In this zone the gas flow speed u is:
𝑢 = ��
2𝜋𝜏2 �� is the volume flow and r is the radius
The Brinkmann-Forchheimer equation becomes:
−𝑑𝑃
𝑑𝑟=
𝜇
𝜅
��
2𝜋𝑟2 + 𝐹 ( ��
2𝜋𝑟2)2
This can be integrated between the pipe (where P = Ppipe) and the far field(where P=0).
𝑃 = 𝜇
𝜅
��
2𝜋𝑟ℎ𝑜𝑙𝑒+ 𝐹 (
��
2𝜋)
2
.1
3𝑟ℎ𝑜𝑙𝑒3
Figure 26 shows the solution of this equation for volume flow as a function of hole radius up to about 15 mm. The gas is hydrogen and the ground type is similar to that in the TGC tests.
Parameters: μ = 8.8 x 10⁻⁶Pa.s κ= 1.4 x 10⁻¹¹m2, ρ = 0.085 kg/m3 and F = 3.4 x 10⁴ Pa. s2 /m3
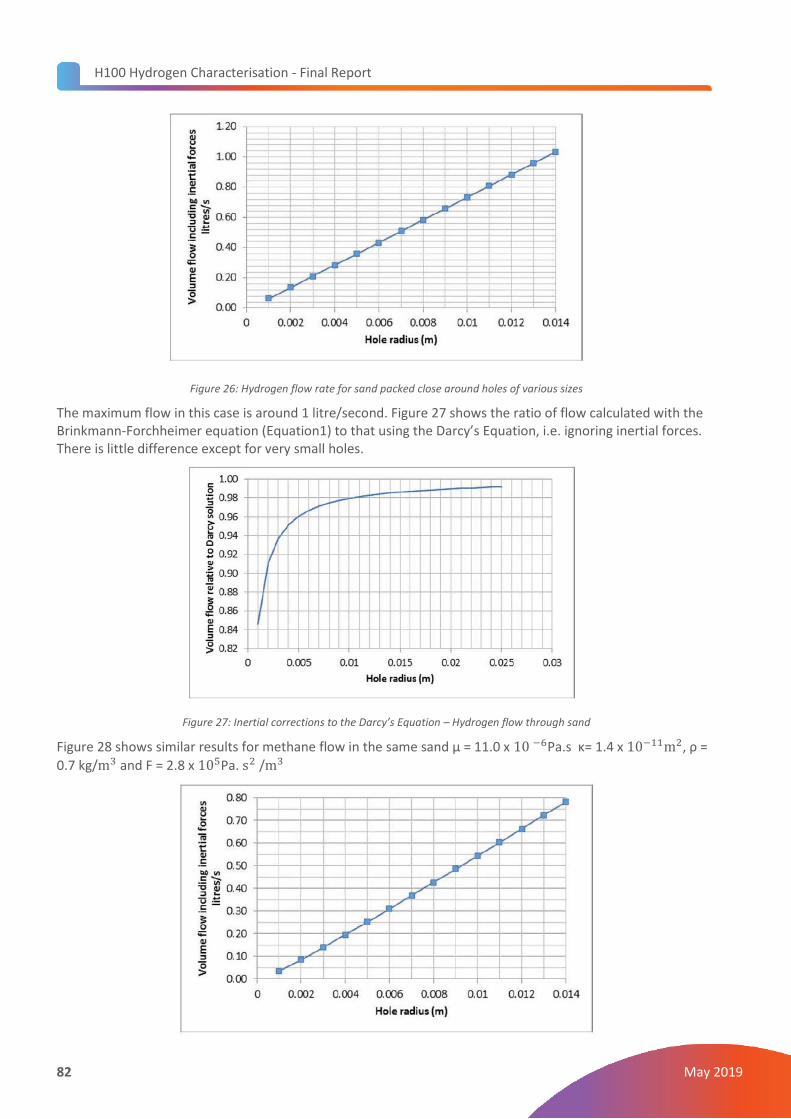
H100 Hydrogen Characterisation - Final Report
82 May 2019
Figure 26: Hydrogen flow rate for sand packed close around holes of various sizes
The maximum flow in this case is around 1 litre/second. Figure 27 shows the ratio of flow calculated with the Brinkmann-Forchheimer equation (Equation1) to that using the Darcy’s Equation, i.e. ignoring inertial forces. There is little difference except for very small holes.
Figure 27: Inertial corrections to the Darcy’s Equation – Hydrogen flow through sand
Figure 28 shows similar results for methane flow in the same sand μ = 11.0 x 10 −6Pa.s κ= 1.4 x 10⁻¹¹m2, ρ =
0.7 kg/m3 and F = 2.8 x 10⁵Pa. s2 /m3
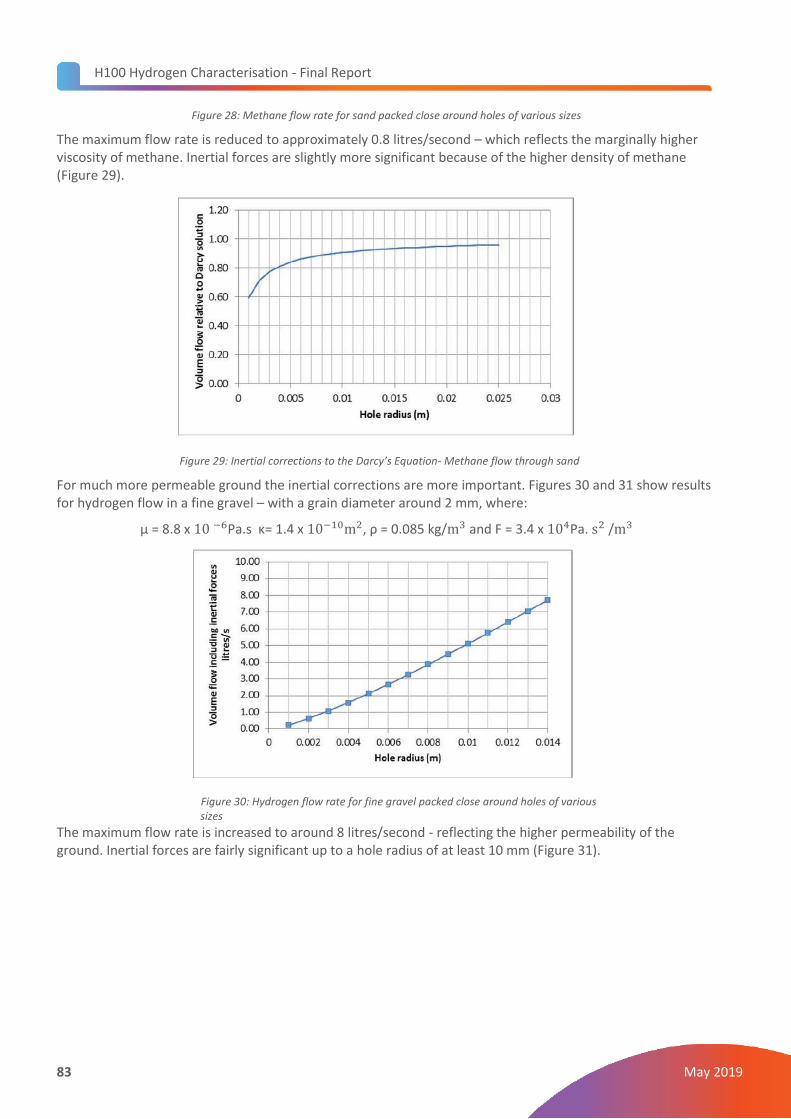
H100 Hydrogen Characterisation - Final Report
83 May 2019
Figure 28: Methane flow rate for sand packed close around holes of various sizes
The maximum flow rate is reduced to approximately 0.8 litres/second – which reflects the marginally higher viscosity of methane. Inertial forces are slightly more significant because of the higher density of methane (Figure 29).
Figure 29: Inertial corrections to the Darcy’s Equation- Methane flow through sand
For much more permeable ground the inertial corrections are more important. Figures 30 and 31 show results for hydrogen flow in a fine gravel – with a grain diameter around 2 mm, where:
μ = 8.8 x 10 −6Pa.s κ= 1.4 x 10⁻¹⁰m2, ρ = 0.085 kg/m3 and F = 3.4 x 10⁴Pa. s2 /m3
Figure 30: Hydrogen flow rate for fine gravel packed close around holes of various sizes
The maximum flow rate is increased to around 8 litres/second - reflecting the higher permeability of the ground. Inertial forces are fairly significant up to a hole radius of at least 10 mm (Figure 31).
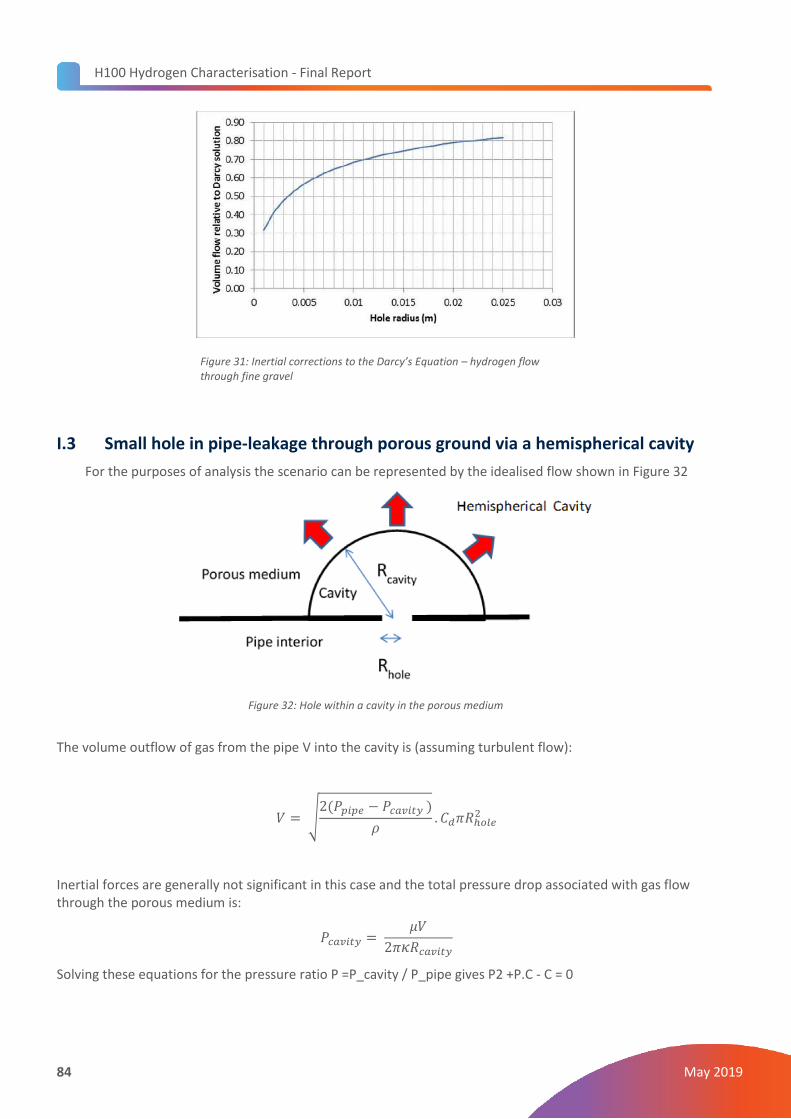
H100 Hydrogen Characterisation - Final Report
84 May 2019
Figure 31: Inertial corrections to the Darcy’s Equation – hydrogen flow through fine gravel
I.3 Small hole in pipe-leakage through porous ground via a hemispherical cavity
For the purposes of analysis the scenario can be represented by the idealised flow shown in Figure 32
Figure 32: Hole within a cavity in the porous medium
The volume outflow of gas from the pipe V into the cavity is (assuming turbulent flow):
𝑉 = √2(𝑃𝑝𝑖𝑝𝑒 − 𝑃𝑐𝑎𝑣𝑖𝑡𝑦 )
𝜌. 𝐶𝑑𝜋𝑅ℎ𝑜𝑙𝑒
2
Inertial forces are generally not significant in this case and the total pressure drop associated with gas flow through the porous medium is:
𝑃𝑐𝑎𝑣𝑖𝑡𝑦 = 𝜇𝑉
2𝜋𝜅𝑅𝑐𝑎𝑣𝑖𝑡𝑦
Solving these equations for the pressure ratio P =P_cavity / P_pipe gives P2 +P.C - C = 0
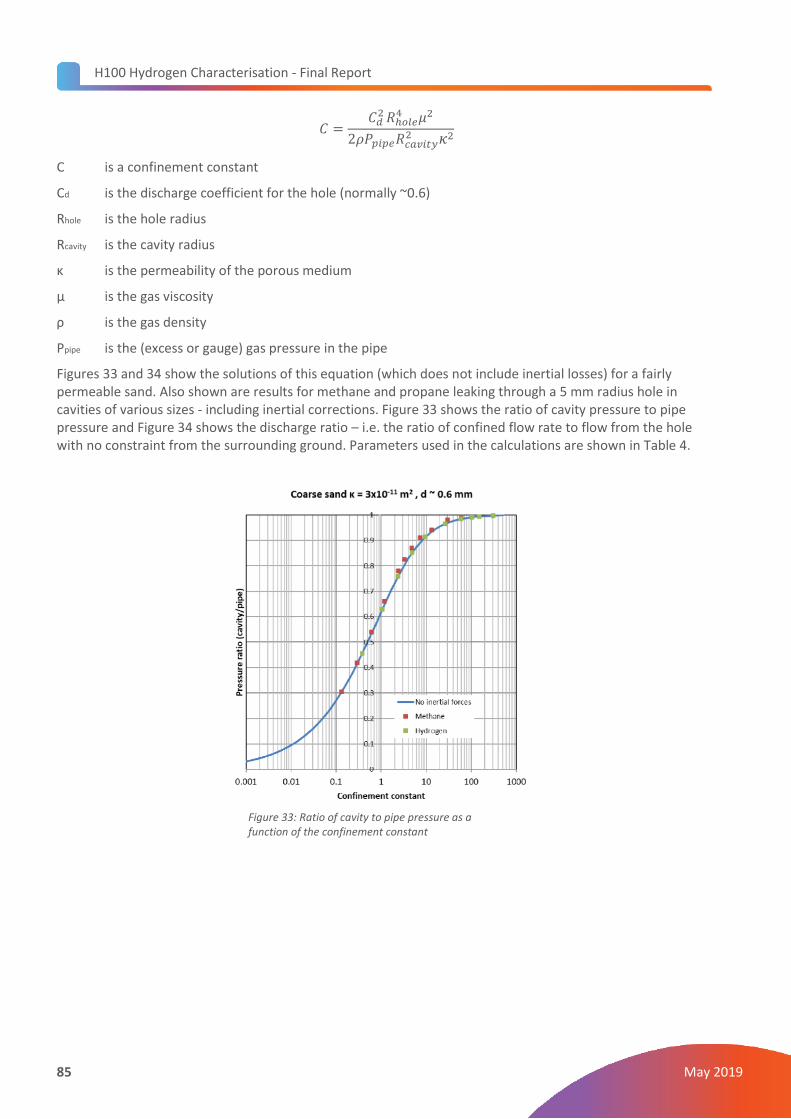
H100 Hydrogen Characterisation - Final Report
85 May 2019
𝐶 =𝐶𝑑
2 𝑅ℎ𝑜𝑙𝑒4 𝜇2
2𝜌𝑃𝑝𝑖𝑝𝑒𝑅𝑐𝑎𝑣𝑖𝑡𝑦2 𝜅2
C is a confinement constant
Cd is the discharge coefficient for the hole (normally ~0.6)
Rhole is the hole radius
Rcavity is the cavity radius
κ is the permeability of the porous medium
μ is the gas viscosity
ρ is the gas density
Ppipe is the (excess or gauge) gas pressure in the pipe
Figures 33 and 34 show the solutions of this equation (which does not include inertial losses) for a fairly permeable sand. Also shown are results for methane and propane leaking through a 5 mm radius hole in cavities of various sizes - including inertial corrections. Figure 33 shows the ratio of cavity pressure to pipe pressure and Figure 34 shows the discharge ratio – i.e. the ratio of confined flow rate to flow from the hole with no constraint from the surrounding ground. Parameters used in the calculations are shown in Table 4.
Figure 33: Ratio of cavity to pipe pressure as a function of the confinement constant
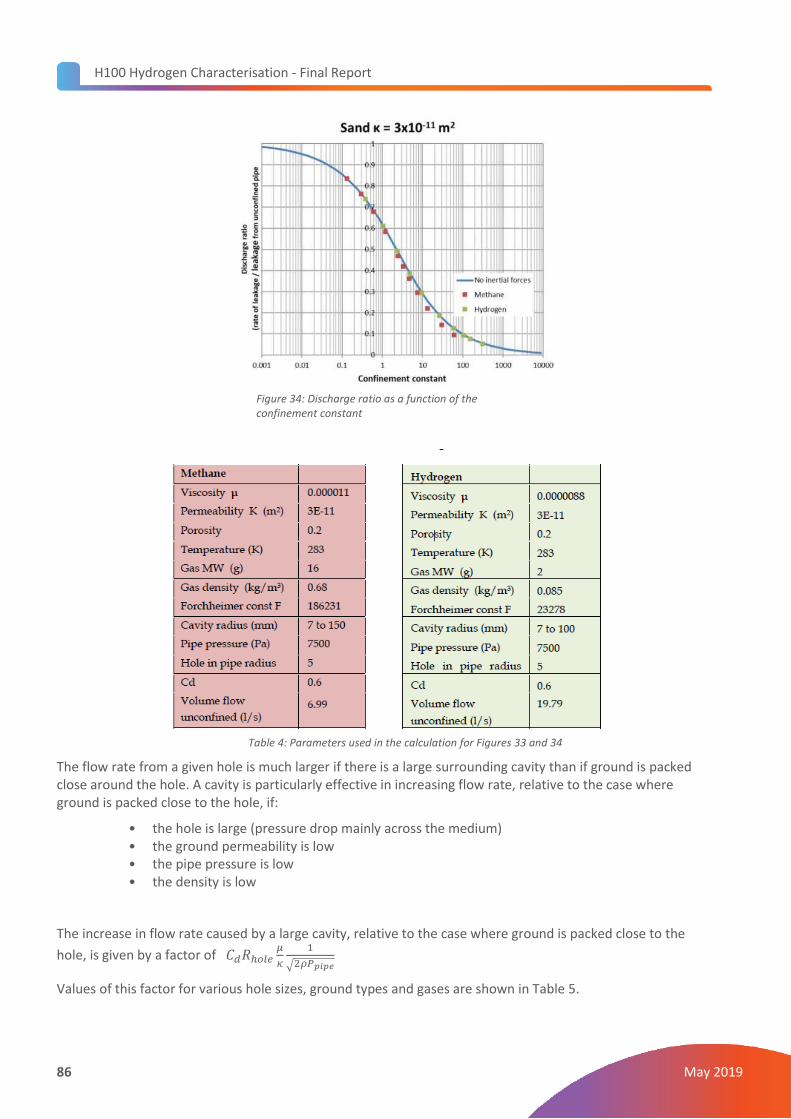
H100 Hydrogen Characterisation - Final Report
86 May 2019
Figure 34: Discharge ratio as a function of the confinement constant
Table 4: Parameters used in the calculation for Figures 33 and 34
The flow rate from a given hole is much larger if there is a large surrounding cavity than if ground is packed close around the hole. A cavity is particularly effective in increasing flow rate, relative to the case where ground is packed close to the hole, if:
• the hole is large (pressure drop mainly across the medium) • the ground permeability is low • the pipe pressure is low • the density is low
The increase in flow rate caused by a large cavity, relative to the case where ground is packed close to the
hole, is given by a factor of 𝐶𝑑𝑅ℎ𝑜𝑙𝑒𝜇
𝜅
1
√2𝜌𝑃𝑝𝑖𝑝𝑒
Values of this factor for various hole sizes, ground types and gases are shown in Table 5.
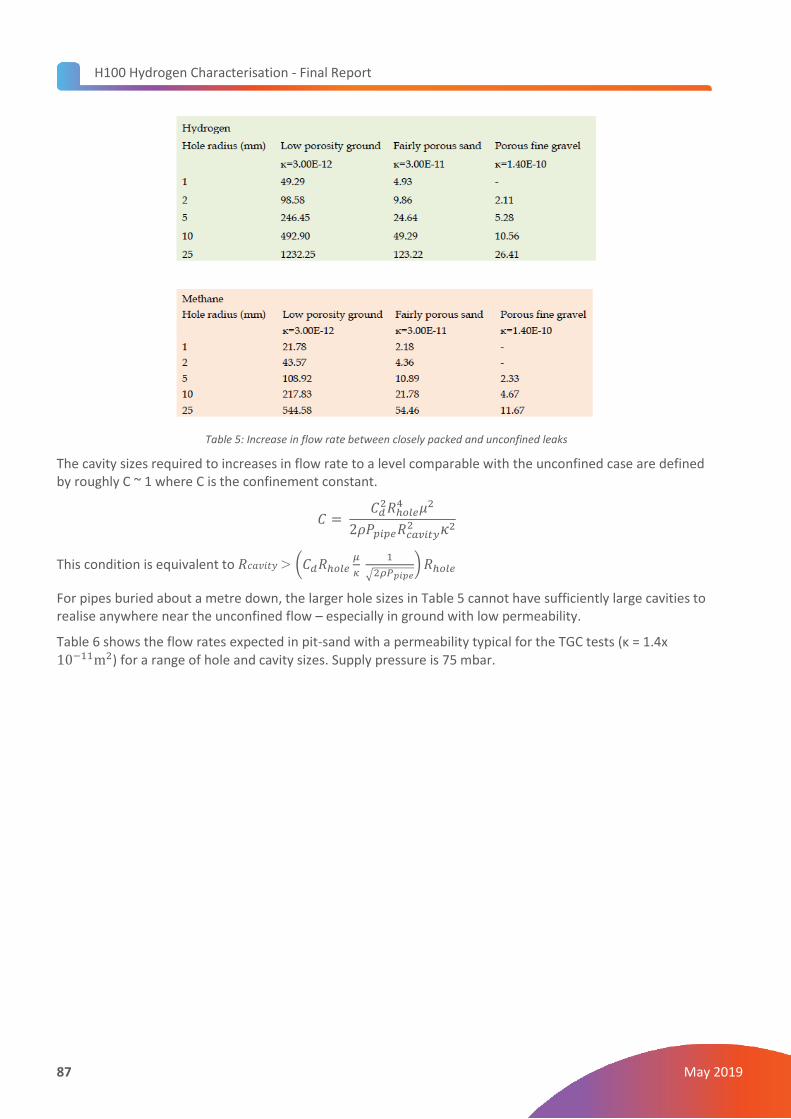
H100 Hydrogen Characterisation - Final Report
87 May 2019
Table 5: Increase in flow rate between closely packed and unconfined leaks
The cavity sizes required to increases in flow rate to a level comparable with the unconfined case are defined by roughly C ~ 1 where C is the confinement constant.
𝐶 = 𝐶𝑑
2𝑅ℎ𝑜𝑙𝑒4 𝜇2
2𝜌𝑃𝑝𝑖𝑝𝑒𝑅𝑐𝑎𝑣𝑖𝑡𝑦2 𝜅2
This condition is equivalent to 𝑅𝑐𝑎𝑣𝑖𝑡𝑦 > (𝐶𝑑𝑅ℎ𝑜𝑙𝑒𝜇
𝜅
1
√2𝜌𝑃𝑝𝑖𝑝𝑒) 𝑅ℎ𝑜𝑙𝑒
For pipes buried about a metre down, the larger hole sizes in Table 5 cannot have sufficiently large cavities to realise anywhere near the unconfined flow – especially in ground with low permeability.
Table 6 shows the flow rates expected in pit-sand with a permeability typical for the TGC tests (κ = 1.4x 10⁻¹¹m2) for a range of hole and cavity sizes. Supply pressure is 75 mbar.
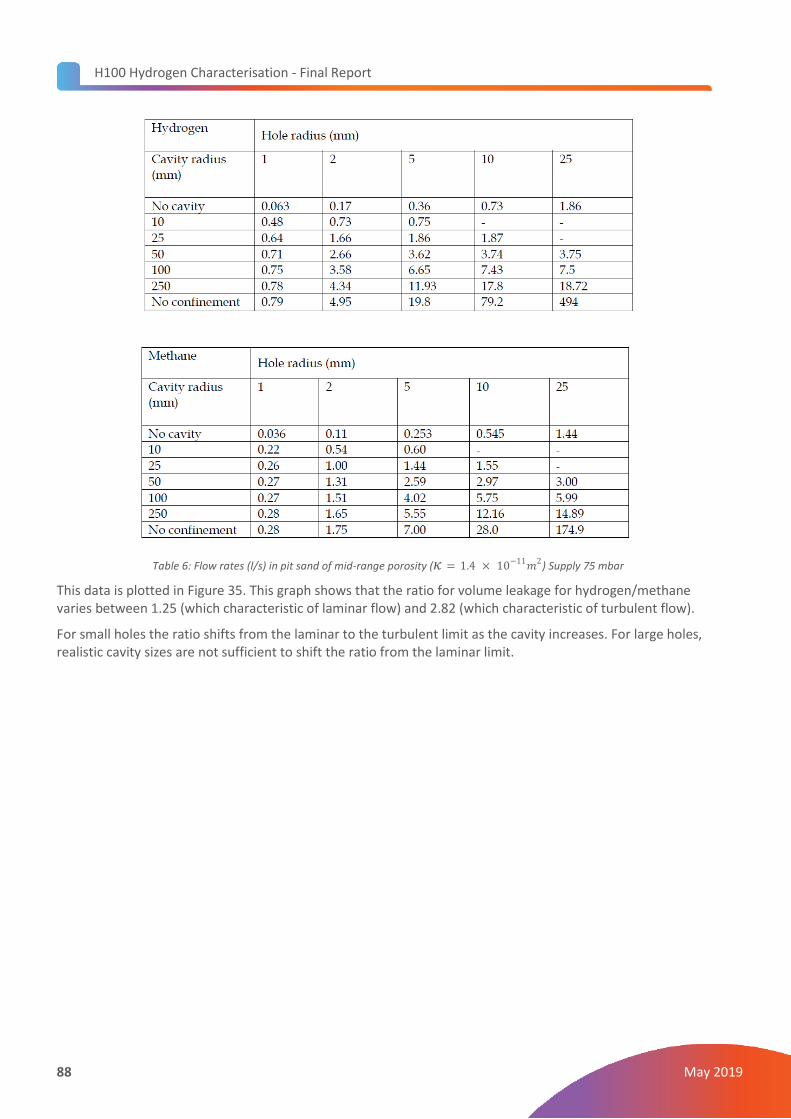
H100 Hydrogen Characterisation - Final Report
88 May 2019
Table 6: Flow rates (l/s) in pit sand of mid-range porosity (𝜅 = 1.4 × 10⁻¹¹𝑚2) Supply 75 mbar
This data is plotted in Figure 35. This graph shows that the ratio for volume leakage for hydrogen/methane varies between 1.25 (which characteristic of laminar flow) and 2.82 (which characteristic of turbulent flow).
For small holes the ratio shifts from the laminar to the turbulent limit as the cavity increases. For large holes, realistic cavity sizes are not sufficient to shift the ratio from the laminar limit.
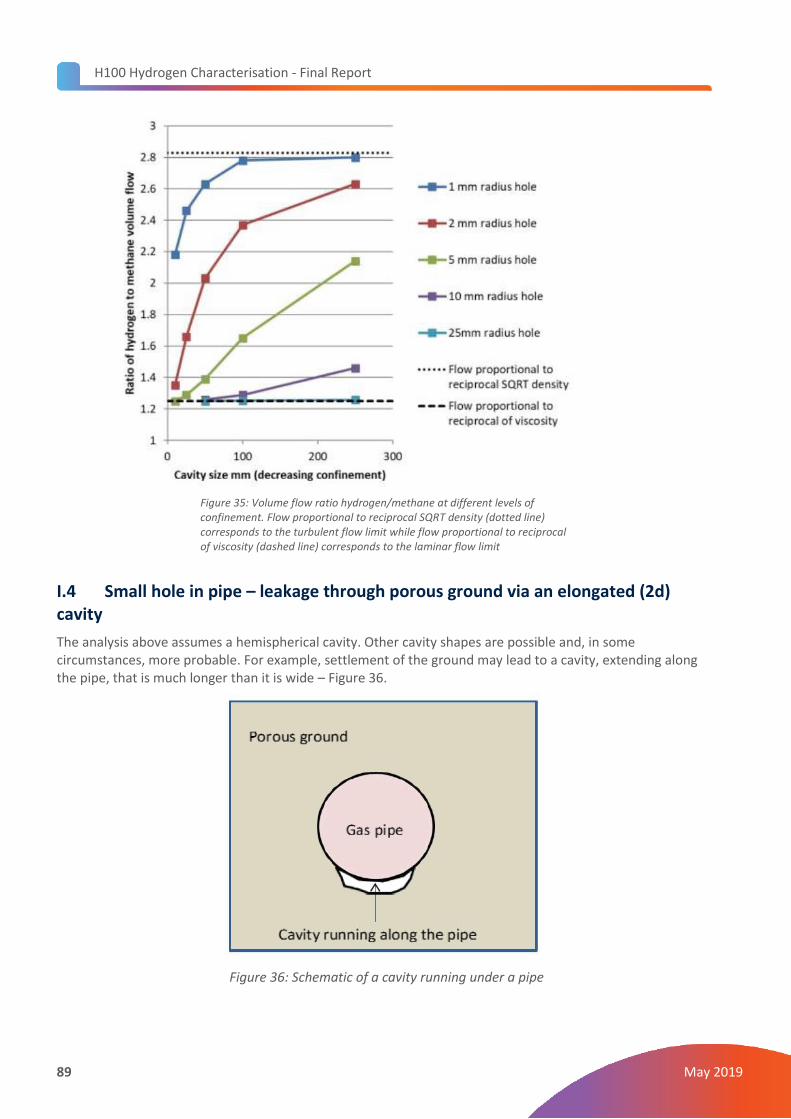
H100 Hydrogen Characterisation - Final Report
89 May 2019
Figure 35: Volume flow ratio hydrogen/methane at different levels of confinement. Flow proportional to reciprocal SQRT density (dotted line) corresponds to the turbulent flow limit while flow proportional to reciprocal of viscosity (dashed line) corresponds to the laminar flow limit
I.4 Small hole in pipe – leakage through porous ground via an elongated (2d) cavity
The analysis above assumes a hemispherical cavity. Other cavity shapes are possible and, in some circumstances, more probable. For example, settlement of the ground may lead to a cavity, extending along the pipe, that is much longer than it is wide – Figure 36.
Figure 36: Schematic of a cavity running under a pipe

H100 Hydrogen Characterisation - Final Report
90 May 2019
If the cavity cross-section is much larger than the hole in the pipe then gas will flow freely (without significant pressure loss) along the cavity and the gas flow from the cavity will have a quasi-cylindrical symmetry.
If the cavity is represented by a long half-cylinder with radius r2Dcav and length L (L >> r2Dcav and L >> pipe radius and L >> burial depth) then the pressure loss equation becomes approximately:
−𝑑𝑃
𝑑𝑟=
𝜇
𝜅.�� 𝐿⁄
2𝜋𝑟+ 𝐹 (
�� 𝐿⁄
2𝜋𝑟)
2
Integrating between the cavity and the ground surface (at a height H above the pipe, where P=0) gives the
following approximate relationship between flow rate ��and cavity pressure:
𝑃2𝐷𝑐𝑎𝑣 = 𝜇
𝜅.�� 𝐿⁄
2𝜋. ln (
𝐻
𝑟2𝐷𝑐𝑎𝑣) + 𝐹.
1
𝑟2𝐷𝑐𝑎𝑣(
�� 𝐿⁄
2𝜋)
2
Long (2D) cracks have a much higher surface area and are more effective at increasing leak flow than 3D flows from holes with the same radius.
Normally the flow rate can be estimated by solving two equations
𝑃2𝐷𝑐𝑎𝑣 = 𝜇
𝜅.�� 𝐿⁄
2𝜋. ln (
𝐻
𝑟2𝐷𝑐𝑎𝑣) + 𝐹.
1
𝑟2𝐷𝑐𝑎𝑣(
�� 𝐿⁄
2𝜋)
2
And �� = √2(𝑃𝑝𝑖𝑝𝑒−𝑃2𝐷𝑐𝑎𝑣)
𝜌. 𝐶𝑑
𝜋𝑅ℎ𝑜𝑙𝑒
2
Example: Hydrogen leaks into 3D and 2D cavities
Given μ = 8.8 x 10 −6Pa.s κ= 1.4 x 10⁻¹⁰m2, ρ = 0.085 kg/m3, P= 7500 Pa, H= 1 m, F = 23.000
Flow rate for a 5 mm hole into a 25 mm radius hemispherical cavity = 1.86 l/s
(Cavity pressure in this case is quite close to the pipe pressure)
Flow rate for a 5 mm hole into a 25 mm radius half-cylindrical cavity (length 3 m) = 17 l/s
(Cavity pressure in this case is around 2000 Pa)
Flow rate if completely unconfined = 19.8 l/s
For very long, narrow cavities and large holes it may be necessary to allow for pressure losses along the cavity. In the example above the maximum velocities in the cavity are around 15 m/s. Using a friction factor appropriate to a very rough duct, suggests that pressure losses along the cavity will be < 100 Pa.
This is small compared with the mean pressure and it is therefore reasonable to ignore pressure changes along the length of the cavity. Such a flow could however have an erosive effect, potentially leading to changes in the shape of the cavity.
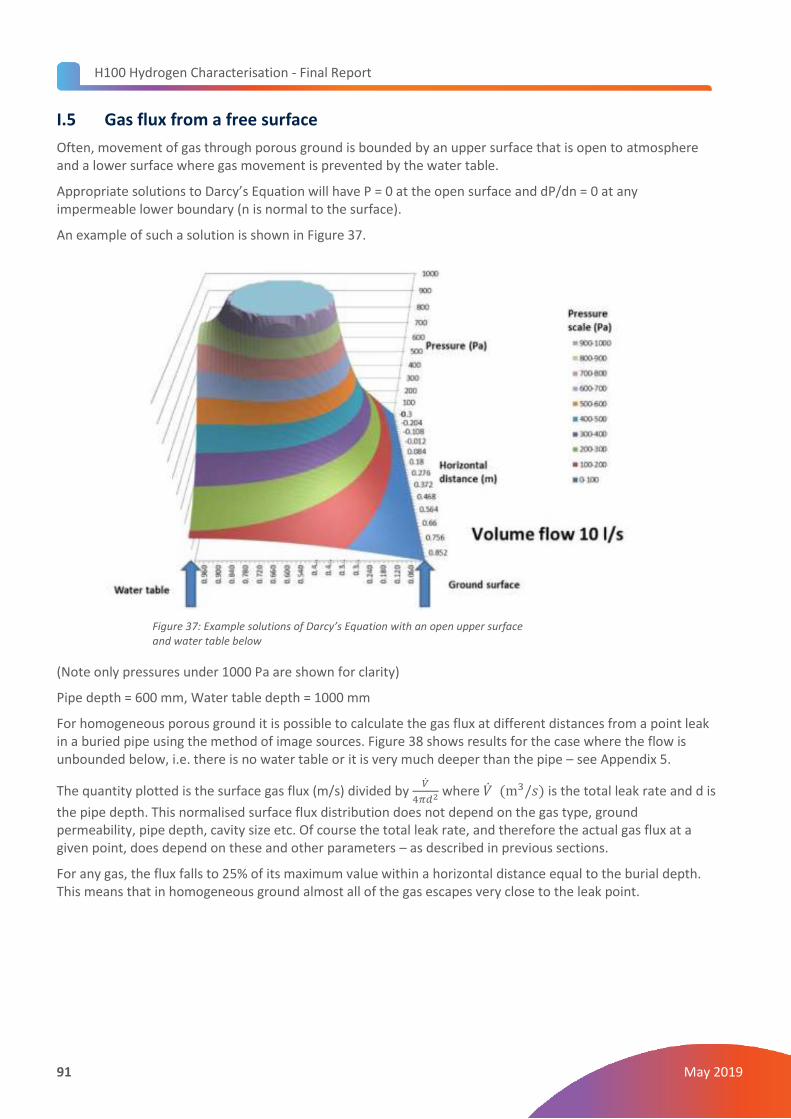
H100 Hydrogen Characterisation - Final Report
91 May 2019
I.5 Gas flux from a free surface
Often, movement of gas through porous ground is bounded by an upper surface that is open to atmosphere and a lower surface where gas movement is prevented by the water table.
Appropriate solutions to Darcy’s Equation will have P = 0 at the open surface and dP/dn = 0 at any impermeable lower boundary (n is normal to the surface).
An example of such a solution is shown in Figure 37.
Figure 37: Example solutions of Darcy’s Equation with an open upper surface and water table below
(Note only pressures under 1000 Pa are shown for clarity)
Pipe depth = 600 mm, Water table depth = 1000 mm
For homogeneous porous ground it is possible to calculate the gas flux at different distances from a point leak in a buried pipe using the method of image sources. Figure 38 shows results for the case where the flow is unbounded below, i.e. there is no water table or it is very much deeper than the pipe – see Appendix 5.
The quantity plotted is the surface gas flux (m/s) divided by ��
4𝜋𝑑2 where �� (m3/𝑠) is the total leak rate and d is
the pipe depth. This normalised surface flux distribution does not depend on the gas type, ground permeability, pipe depth, cavity size etc. Of course the total leak rate, and therefore the actual gas flux at a given point, does depend on these and other parameters – as described in previous sections.
For any gas, the flux falls to 25% of its maximum value within a horizontal distance equal to the burial depth. This means that in homogeneous ground almost all of the gas escapes very close to the leak point.
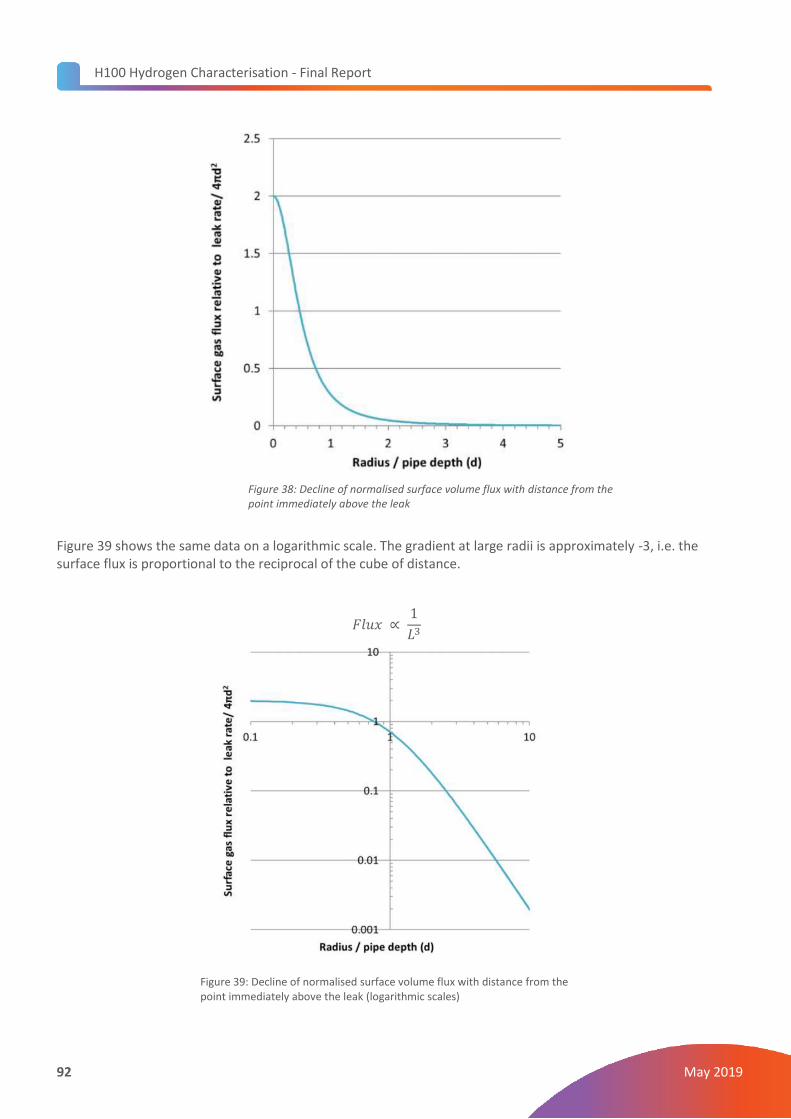
H100 Hydrogen Characterisation - Final Report
92 May 2019
Figure 38: Decline of normalised surface volume flux with distance from the point immediately above the leak
Figure 39 shows the same data on a logarithmic scale. The gradient at large radii is approximately -3, i.e. the surface flux is proportional to the reciprocal of the cube of distance.
𝐹𝑙𝑢𝑥 ∝ 1
𝐿3
Figure 39: Decline of normalised surface volume flux with distance from the point immediately above the leak (logarithmic scales)
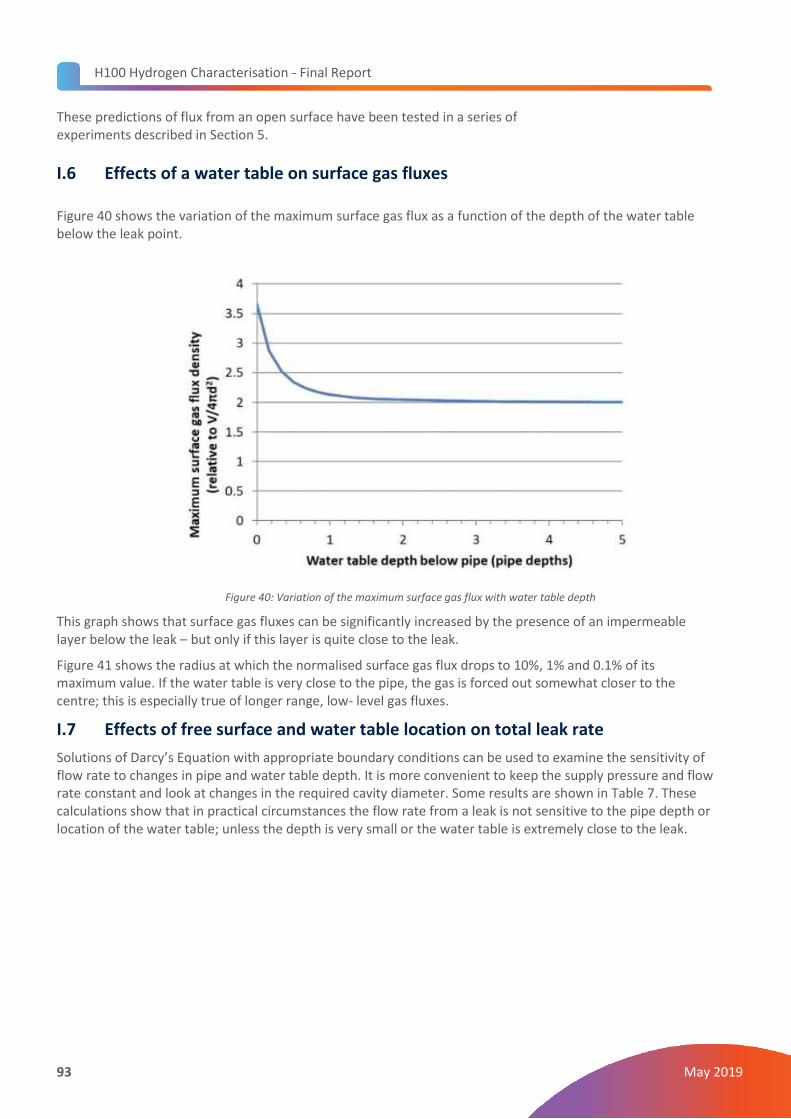
H100 Hydrogen Characterisation - Final Report
93 May 2019
These predictions of flux from an open surface have been tested in a series of experiments described in Section 5.
I.6 Effects of a water table on surface gas fluxes Figure 40 shows the variation of the maximum surface gas flux as a function of the depth of the water table below the leak point.
Figure 40: Variation of the maximum surface gas flux with water table depth
This graph shows that surface gas fluxes can be significantly increased by the presence of an impermeable layer below the leak – but only if this layer is quite close to the leak.
Figure 41 shows the radius at which the normalised surface gas flux drops to 10%, 1% and 0.1% of its maximum value. If the water table is very close to the pipe, the gas is forced out somewhat closer to the centre; this is especially true of longer range, low- level gas fluxes.
I.7 Effects of free surface and water table location on total leak rate
Solutions of Darcy’s Equation with appropriate boundary conditions can be used to examine the sensitivity of flow rate to changes in pipe and water table depth. It is more convenient to keep the supply pressure and flow rate constant and look at changes in the required cavity diameter. Some results are shown in Table 7. These calculations show that in practical circumstances the flow rate from a leak is not sensitive to the pipe depth or location of the water table; unless the depth is very small or the water table is extremely close to the leak.
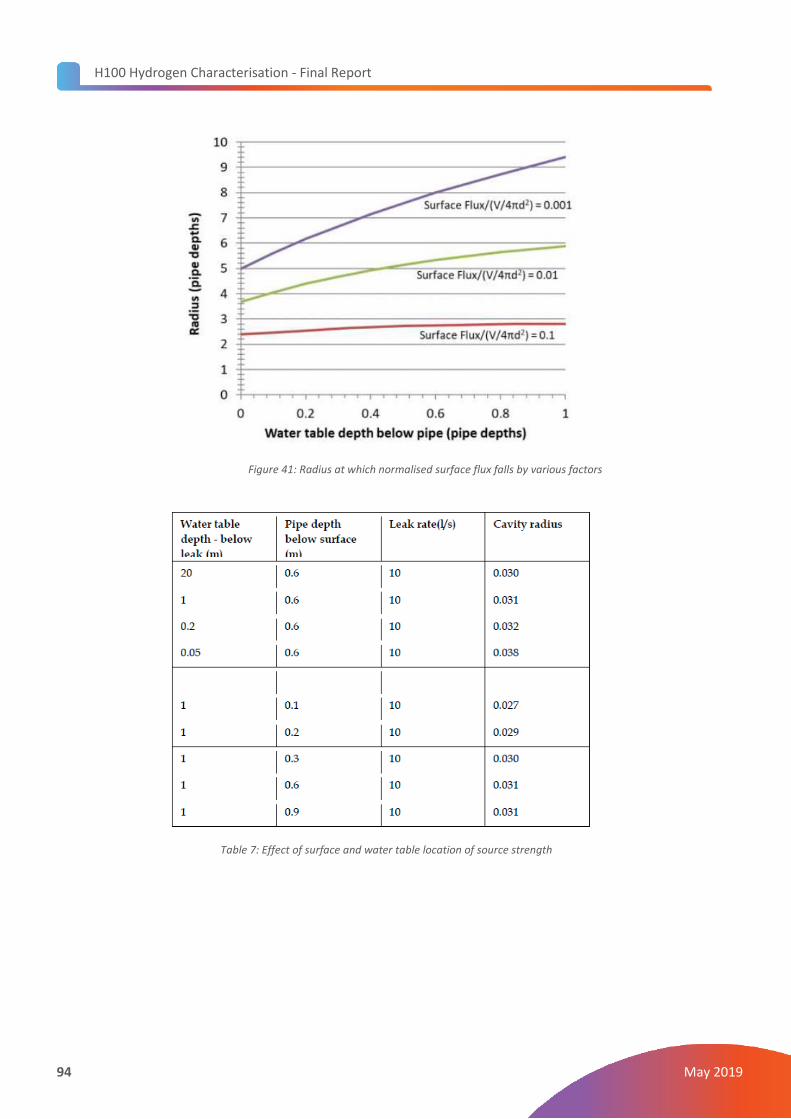
H100 Hydrogen Characterisation - Final Report
94 May 2019
Figure 41: Radius at which normalised surface flux falls by various factors
Table 7: Effect of surface and water table location of source strength
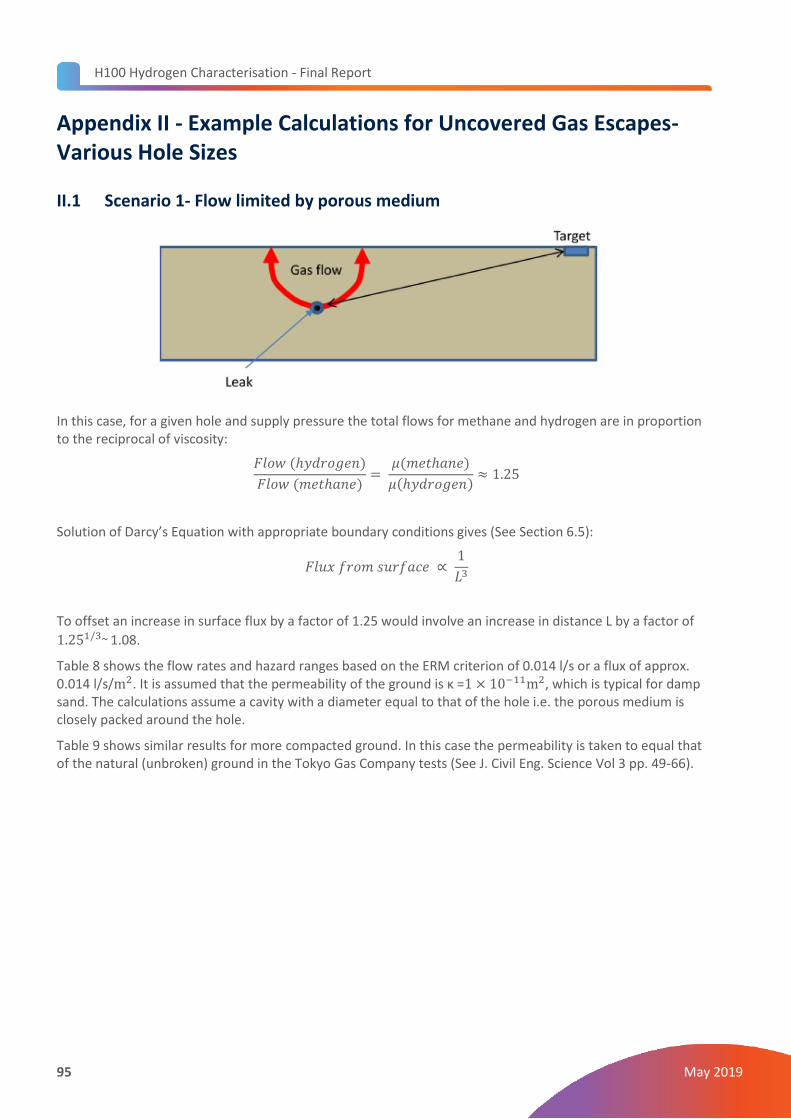
H100 Hydrogen Characterisation - Final Report
95 May 2019
Appendix II - Example Calculations for Uncovered Gas Escapes- Various Hole Sizes
II.1 Scenario 1- Flow limited by porous medium
In this case, for a given hole and supply pressure the total flows for methane and hydrogen are in proportion to the reciprocal of viscosity:
𝐹𝑙𝑜𝑤 (ℎ𝑦𝑑𝑟𝑜𝑔𝑒𝑛)
𝐹𝑙𝑜𝑤 (𝑚𝑒𝑡ℎ𝑎𝑛𝑒)=
𝜇(𝑚𝑒𝑡ℎ𝑎𝑛𝑒)
𝜇(ℎ𝑦𝑑𝑟𝑜𝑔𝑒𝑛)≈ 1.25
Solution of Darcy’s Equation with appropriate boundary conditions gives (See Section 6.5):
𝐹𝑙𝑢𝑥 𝑓𝑟𝑜𝑚 𝑠𝑢𝑟𝑓𝑎𝑐𝑒 ∝ 1
𝐿3
To offset an increase in surface flux by a factor of 1.25 would involve an increase in distance L by a factor of
1.251/3~ 1.08.
Table 8 shows the flow rates and hazard ranges based on the ERM criterion of 0.014 l/s or a flux of approx. 0.014 l/s/m2. It is assumed that the permeability of the ground is κ =1 × 10⁻¹¹m2, which is typical for damp sand. The calculations assume a cavity with a diameter equal to that of the hole i.e. the porous medium is closely packed around the hole.
Table 9 shows similar results for more compacted ground. In this case the permeability is taken to equal that of the natural (unbroken) ground in the Tokyo Gas Company tests (See J. Civil Eng. Science Vol 3 pp. 49-66).
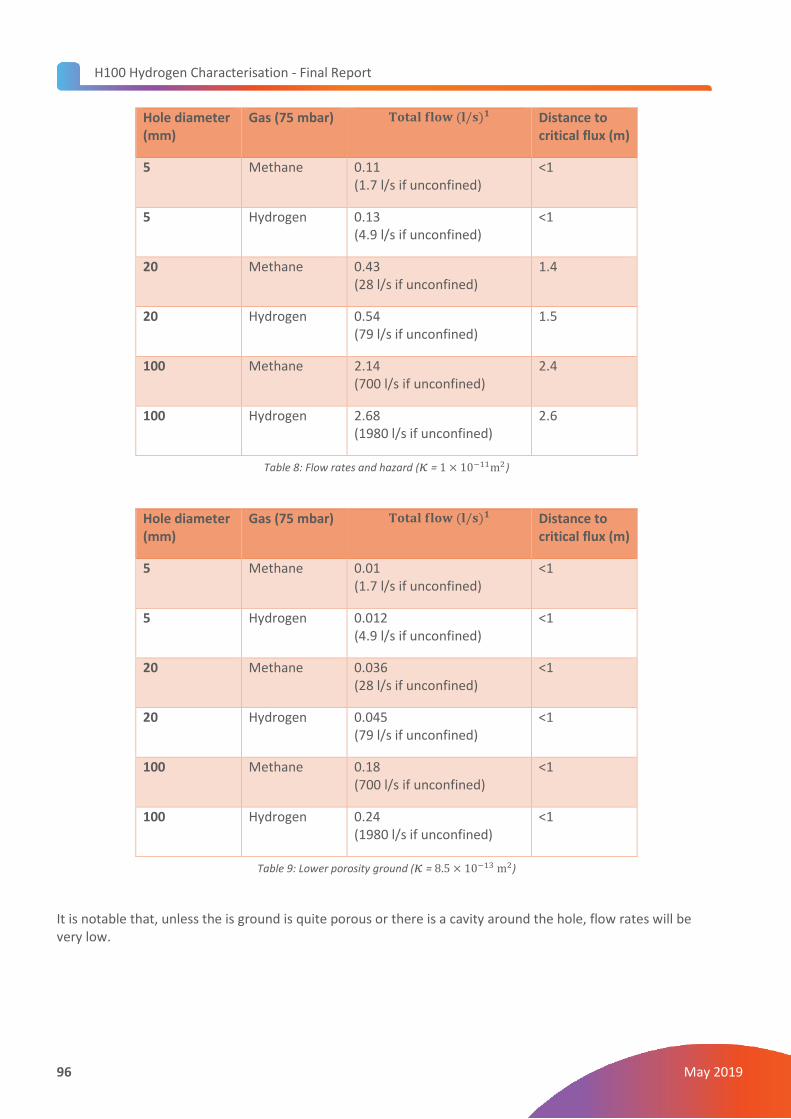
H100 Hydrogen Characterisation - Final Report
96 May 2019
Hole diameter (mm)
Gas (75 mbar) 𝐓𝐨𝐭𝐚𝐥 𝐟𝐥𝐨𝐰 (𝐥/𝐬)𝟏 Distance to critical flux (m)
5 Methane 0.11 (1.7 l/s if unconfined)
<1
5 Hydrogen 0.13 (4.9 l/s if unconfined)
<1
20 Methane 0.43 (28 l/s if unconfined)
1.4
20 Hydrogen 0.54 (79 l/s if unconfined)
1.5
100 Methane 2.14 (700 l/s if unconfined)
2.4
100 Hydrogen 2.68 (1980 l/s if unconfined)
2.6
Table 8: Flow rates and hazard (𝜅 = 1 × 10⁻¹¹m2)
Hole diameter (mm)
Gas (75 mbar) 𝐓𝐨𝐭𝐚𝐥 𝐟𝐥𝐨𝐰 (𝐥/𝐬)𝟏 Distance to critical flux (m)
5 Methane 0.01 (1.7 l/s if unconfined)
<1
5 Hydrogen 0.012 (4.9 l/s if unconfined)
<1
20 Methane 0.036 (28 l/s if unconfined)
<1
20 Hydrogen 0.045 (79 l/s if unconfined)
<1
100 Methane 0.18 (700 l/s if unconfined)
<1
100 Hydrogen 0.24 (1980 l/s if unconfined)
<1
Table 9: Lower porosity ground (𝜅 = 8.5 × 10⁻¹³ m2)
It is notable that, unless the is ground is quite porous or there is a cavity around the hole, flow rates will be very low.
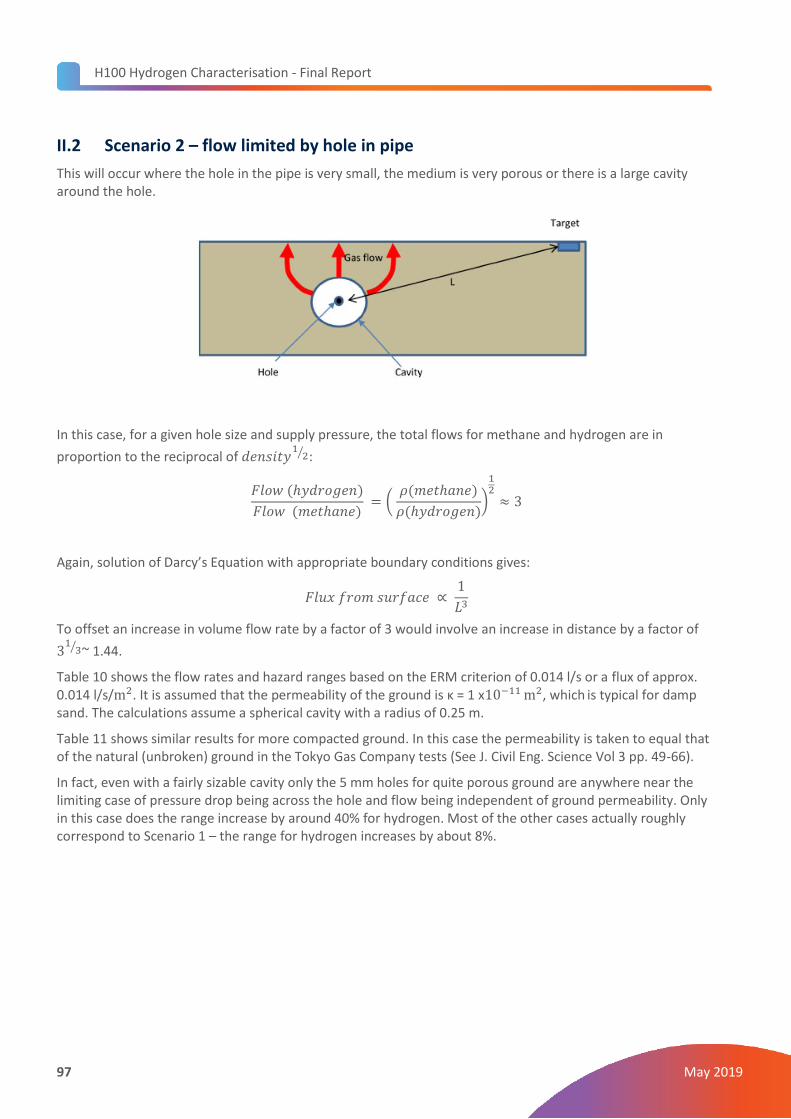
H100 Hydrogen Characterisation - Final Report
97 May 2019
II.2 Scenario 2 – flow limited by hole in pipe
This will occur where the hole in the pipe is very small, the medium is very porous or there is a large cavity around the hole.
In this case, for a given hole size and supply pressure, the total flows for methane and hydrogen are in
proportion to the reciprocal of 𝑑𝑒𝑛𝑠𝑖𝑡𝑦1
2⁄ :
𝐹𝑙𝑜𝑤 (ℎ𝑦𝑑𝑟𝑜𝑔𝑒𝑛)
𝐹𝑙𝑜𝑤 (𝑚𝑒𝑡ℎ𝑎𝑛𝑒) = (
𝜌(𝑚𝑒𝑡ℎ𝑎𝑛𝑒)
𝜌(ℎ𝑦𝑑𝑟𝑜𝑔𝑒𝑛))
12
≈ 3
Again, solution of Darcy’s Equation with appropriate boundary conditions gives:
𝐹𝑙𝑢𝑥 𝑓𝑟𝑜𝑚 𝑠𝑢𝑟𝑓𝑎𝑐𝑒 ∝ 1
𝐿3
To offset an increase in volume flow rate by a factor of 3 would involve an increase in distance by a factor of
31
3⁄ ~ 1.44.
Table 10 shows the flow rates and hazard ranges based on the ERM criterion of 0.014 l/s or a flux of approx. 0.014 l/s/m2. It is assumed that the permeability of the ground is κ = 1 x10⁻¹¹
m2, which is typical for damp sand. The calculations assume a spherical cavity with a radius of 0.25 m.
Table 11 shows similar results for more compacted ground. In this case the permeability is taken to equal that of the natural (unbroken) ground in the Tokyo Gas Company tests (See J. Civil Eng. Science Vol 3 pp. 49-66).
In fact, even with a fairly sizable cavity only the 5 mm holes for quite porous ground are anywhere near the limiting case of pressure drop being across the hole and flow being independent of ground permeability. Only in this case does the range increase by around 40% for hydrogen. Most of the other cases actually roughly correspond to Scenario 1 – the range for hydrogen increases by about 8%.
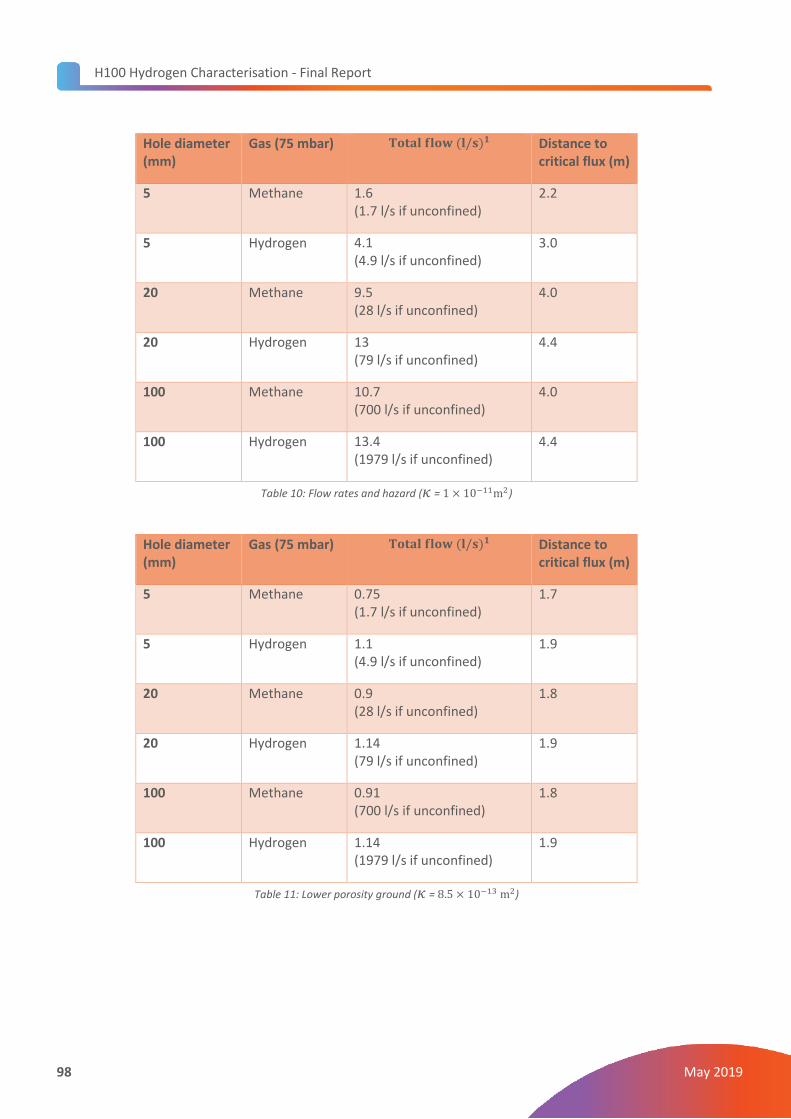
H100 Hydrogen Characterisation - Final Report
98 May 2019
Hole diameter (mm)
Gas (75 mbar) 𝐓𝐨𝐭𝐚𝐥 𝐟𝐥𝐨𝐰 (𝐥/𝐬)𝟏 Distance to critical flux (m)
5 Methane 1.6 (1.7 l/s if unconfined)
2.2
5 Hydrogen 4.1 (4.9 l/s if unconfined)
3.0
20 Methane 9.5 (28 l/s if unconfined)
4.0
20 Hydrogen 13 (79 l/s if unconfined)
4.4
100 Methane 10.7 (700 l/s if unconfined)
4.0
100 Hydrogen 13.4 (1979 l/s if unconfined)
4.4
Table 10: Flow rates and hazard (𝜅 = 1 × 10⁻¹¹m2)
Hole diameter (mm)
Gas (75 mbar) 𝐓𝐨𝐭𝐚𝐥 𝐟𝐥𝐨𝐰 (𝐥/𝐬)𝟏 Distance to critical flux (m)
5 Methane 0.75 (1.7 l/s if unconfined)
1.7
5 Hydrogen 1.1 (4.9 l/s if unconfined)
1.9
20 Methane 0.9 (28 l/s if unconfined)
1.8
20 Hydrogen 1.14 (79 l/s if unconfined)
1.9
100 Methane 0.91 (700 l/s if unconfined)
1.8
100 Hydrogen 1.14 (1979 l/s if unconfined)
1.9
Table 11: Lower porosity ground (𝜅 = 8.5 × 10⁻¹³ m2)

H100 Hydrogen Characterisation - Final Report
99 May 2019
Appendix III - Example Calculations with an Impermeable or Semi-Permeable Cover
Six of the scenarios in Table 1 correspond to gas flows capped by impermeable or semi-permeable covers.
III.1 Scenario 3: Impermeable cover- high porosity channel (along service line or road)- leak is the main flow
In this case there is a large enough hole and cavity that pressure required to drive the gas away from the immediate vicinity of the leak and into the porous channel is a small proportion of the line gas pressure P. The leak (to a large area target) corresponds to most of the flow.
The total flow in this case is: 𝐹𝑙𝑜𝑤 ≈𝑃𝜅𝐴
𝜇𝐿∝
1
𝐿
𝐹𝑙𝑜𝑤 (ℎ𝑦𝑑𝑟𝑜𝑔𝑒𝑛)
𝐹𝑙𝑜𝑤 (𝑚𝑒𝑡ℎ𝑎𝑛𝑒)=
𝜇(𝑚𝑒𝑡ℎ𝑎𝑛𝑒)
𝜇(ℎ𝑦𝑑𝑟𝑜𝑔𝑒𝑛)≈ 1.25
To offset an increase in volume flow rate by a factor of 1.25 would involve an increase in distance L by a factor of 1.25.
Table 12 shows the flow rates and hazard ranges based on the ERM criterion of 0.014 l/s or a flux of approx. 0.014 l/s/𝑚2. It is assumed the permeability of the ground is κ = 1 x10⁻¹¹
𝑚2 which is typical for damp sand.
Hole diameter (mm)
Gas (75 mbar) Total flow (l/s) Distance to critical flux (m)
Any (if > 5mm) Methane 0.0141 l/s 480
Any (if > 5mm) Hydrogen 0.0141 l/s 600
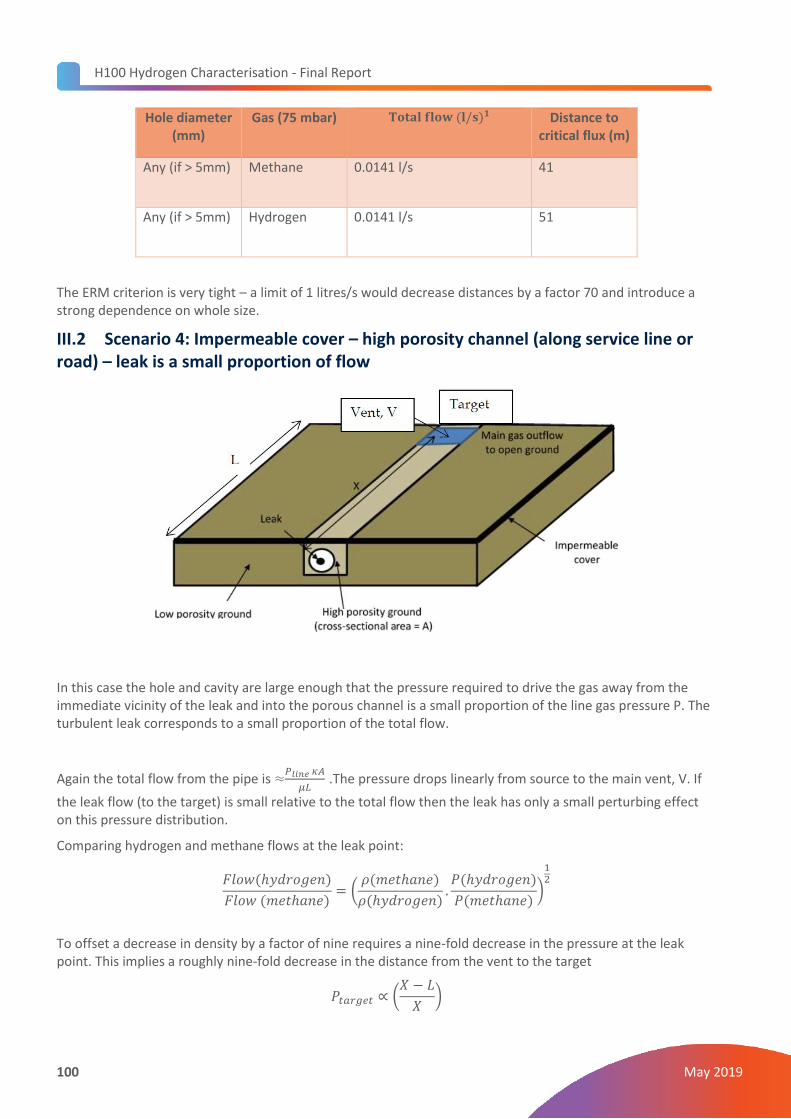
H100 Hydrogen Characterisation - Final Report
100 May 2019
Hole diameter (mm)
Gas (75 mbar) 𝐓𝐨𝐭𝐚𝐥 𝐟𝐥𝐨𝐰 (𝐥/𝐬)𝟏 Distance to critical flux (m)
Any (if > 5mm) Methane 0.0141 l/s 41
Any (if > 5mm) Hydrogen 0.0141 l/s 51
The ERM criterion is very tight – a limit of 1 litres/s would decrease distances by a factor 70 and introduce a strong dependence on whole size.
III.2 Scenario 4: Impermeable cover – high porosity channel (along service line or road) – leak is a small proportion of flow
In this case the hole and cavity are large enough that the pressure required to drive the gas away from the immediate vicinity of the leak and into the porous channel is a small proportion of the line gas pressure P. The turbulent leak corresponds to a small proportion of the total flow.
Again the total flow from the pipe is ≈𝑃𝑙𝑖𝑛𝑒 𝜅𝐴
𝜇𝐿 .The pressure drops linearly from source to the main vent, V. If
the leak flow (to the target) is small relative to the total flow then the leak has only a small perturbing effect on this pressure distribution.
Comparing hydrogen and methane flows at the leak point:
𝐹𝑙𝑜𝑤(ℎ𝑦𝑑𝑟𝑜𝑔𝑒𝑛)
𝐹𝑙𝑜𝑤 (𝑚𝑒𝑡ℎ𝑎𝑛𝑒)= (
𝜌(𝑚𝑒𝑡ℎ𝑎𝑛𝑒)
𝜌(ℎ𝑦𝑑𝑟𝑜𝑔𝑒𝑛).𝑃(ℎ𝑦𝑑𝑟𝑜𝑔𝑒𝑛)
𝑃(𝑚𝑒𝑡ℎ𝑎𝑛𝑒))
12
To offset a decrease in density by a factor of nine requires a nine-fold decrease in the pressure at the leak point. This implies a roughly nine-fold decrease in the distance from the vent to the target
𝑃𝑡𝑎𝑟𝑔𝑒𝑡 ∝ (𝑋 − 𝐿
𝑋)
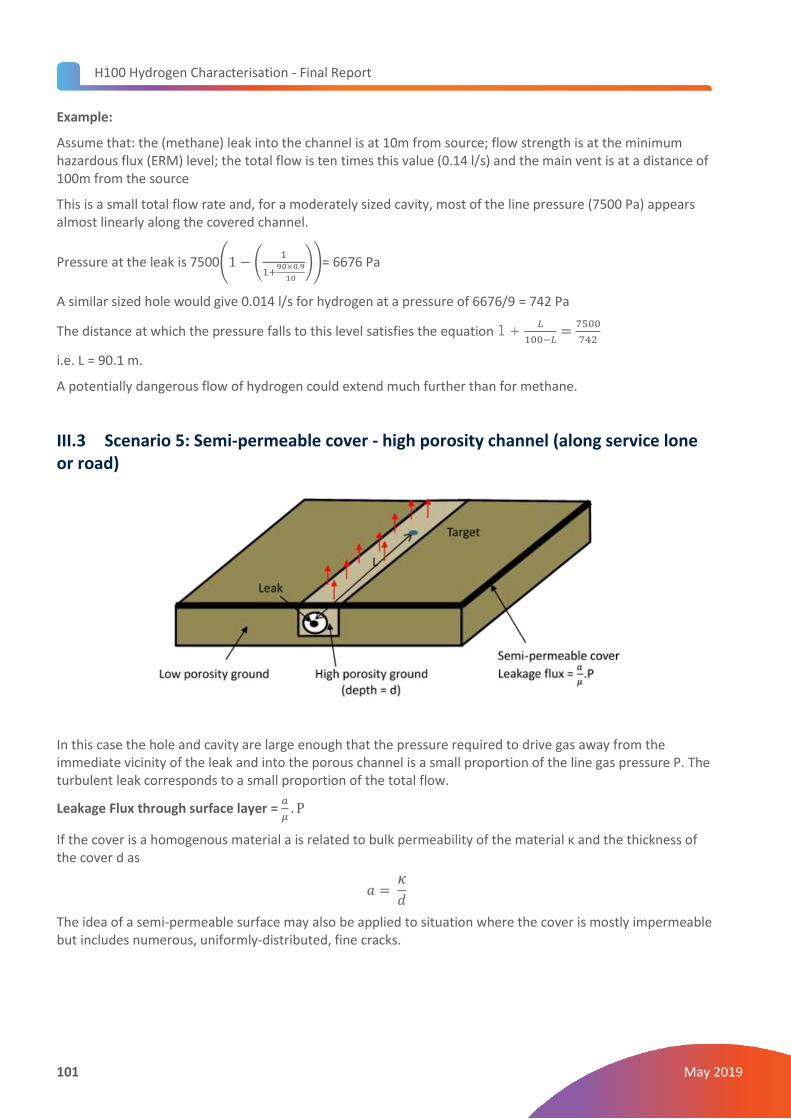
H100 Hydrogen Characterisation - Final Report
101 May 2019
Example:
Assume that: the (methane) leak into the channel is at 10m from source; flow strength is at the minimum hazardous flux (ERM) level; the total flow is ten times this value (0.14 l/s) and the main vent is at a distance of 100m from the source
This is a small total flow rate and, for a moderately sized cavity, most of the line pressure (7500 Pa) appears almost linearly along the covered channel.
Pressure at the leak is 7500(1 − (1
1+90×0.9
10
))= 6676 Pa
A similar sized hole would give 0.014 l/s for hydrogen at a pressure of 6676/9 = 742 Pa
The distance at which the pressure falls to this level satisfies the equation 1 + 𝐿
100−𝐿=
7500
742
i.e. L = 90.1 m.
A potentially dangerous flow of hydrogen could extend much further than for methane.
III.3 Scenario 5: Semi-permeable cover - high porosity channel (along service lone or road)
In this case the hole and cavity are large enough that the pressure required to drive gas away from the immediate vicinity of the leak and into the porous channel is a small proportion of the line gas pressure P. The turbulent leak corresponds to a small proportion of the total flow.
Leakage Flux through surface layer = 𝑎
𝜇. P
If the cover is a homogenous material a is related to bulk permeability of the material κ and the thickness of the cover d as
𝑎 = 𝜅
𝑑
The idea of a semi-permeable surface may also be applied to situation where the cover is mostly impermeable but includes numerous, uniformly-distributed, fine cracks.
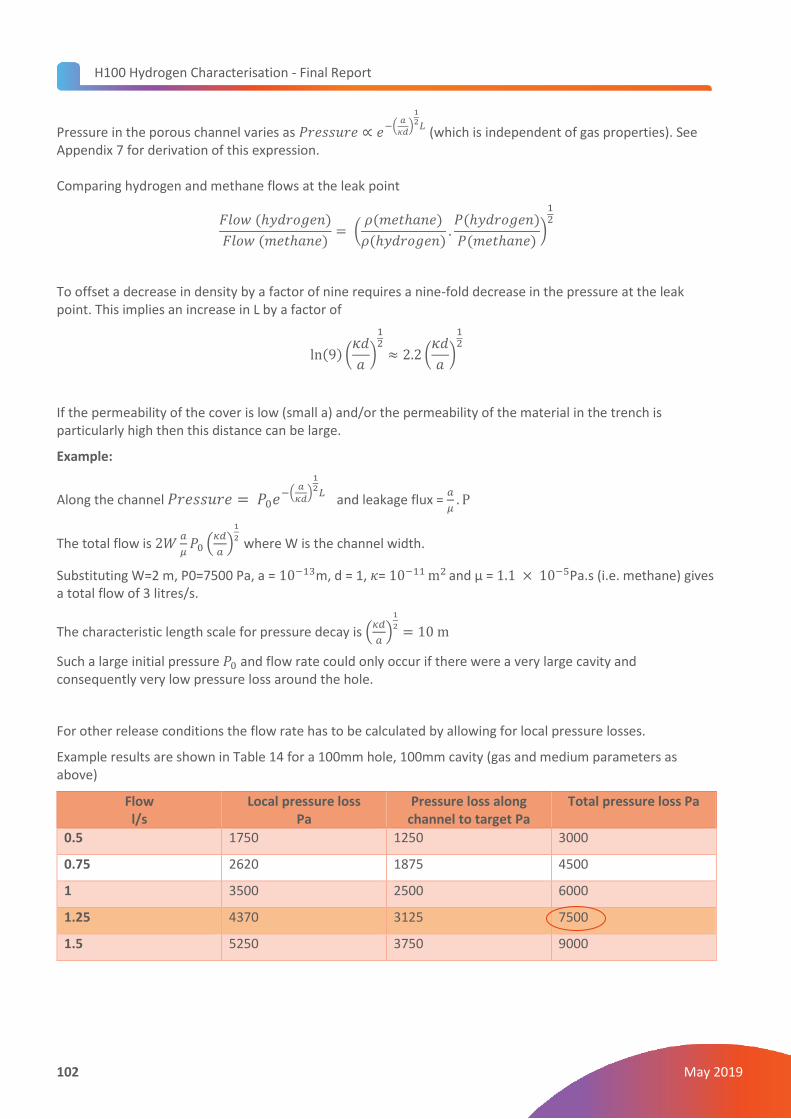
H100 Hydrogen Characterisation - Final Report
102 May 2019
Pressure in the porous channel varies as 𝑃𝑟𝑒𝑠𝑠𝑢𝑟𝑒 ∝ 𝑒−(
𝑎
𝜅𝑑)
12𝐿
(which is independent of gas properties). See Appendix 7 for derivation of this expression. Comparing hydrogen and methane flows at the leak point
𝐹𝑙𝑜𝑤 (ℎ𝑦𝑑𝑟𝑜𝑔𝑒𝑛)
𝐹𝑙𝑜𝑤 (𝑚𝑒𝑡ℎ𝑎𝑛𝑒)= (
𝜌(𝑚𝑒𝑡ℎ𝑎𝑛𝑒)
𝜌(ℎ𝑦𝑑𝑟𝑜𝑔𝑒𝑛).𝑃(ℎ𝑦𝑑𝑟𝑜𝑔𝑒𝑛)
𝑃(𝑚𝑒𝑡ℎ𝑎𝑛𝑒))
12
To offset a decrease in density by a factor of nine requires a nine-fold decrease in the pressure at the leak point. This implies an increase in L by a factor of
ln (9) (𝜅𝑑
𝑎)
12
≈ 2.2 (𝜅𝑑
𝑎)
12
If the permeability of the cover is low (small a) and/or the permeability of the material in the trench is particularly high then this distance can be large.
Example:
Along the channel 𝑃𝑟𝑒𝑠𝑠𝑢𝑟𝑒 = 𝑃0𝑒−(𝑎
𝜅𝑑)
12𝐿 and leakage flux =
𝑎
𝜇. P
The total flow is 2𝑊𝑎
𝜇𝑃0 (
𝜅𝑑
𝑎)
1
2 where W is the channel width.
Substituting W=2 m, P0=7500 Pa, a = 10−13m, d = 1, 𝜅= 10−11 m2
and μ = 1.1 × 10⁻⁵Pa.s (i.e. methane) gives a total flow of 3 litres/s.
The characteristic length scale for pressure decay is (𝜅𝑑
𝑎)
1
2= 10 m
Such a large initial pressure 𝑃0 and flow rate could only occur if there were a very large cavity and consequently very low pressure loss around the hole.
For other release conditions the flow rate has to be calculated by allowing for local pressure losses.
Example results are shown in Table 14 for a 100mm hole, 100mm cavity (gas and medium parameters as above)
Flow l/s
Local pressure loss Pa
Pressure loss along channel to target Pa
Total pressure loss Pa
0.5 1750 1250 3000
0.75 2620 1875 4500
1 3500 2500 6000
1.25 4370 3125 7500
1.5 5250 3750 9000

H100 Hydrogen Characterisation - Final Report
103 May 2019
The flow in this case is approximately 1.25 l/s. With about 60% of the pressure drop local to the hole.
The flow for hydrogen is larger because of lower viscosity by a factor of 1.25. But the initial pressure along the porous channel is a similar proportion of the total line pressure.
If there is a hole allowing a flow of 0.014 l/s methane to a target, the pressure would have to fall by a factor of approximately 9 to maintain the same flow rate for hydrogen.
In this case, to produce such a drop in pressure, the target to leak distance would have to increase by:
(𝑙𝑛9) (𝜅𝑑
𝑎)
12
≈ 2.2 (𝜅𝑑
𝑎)
12
= 20 𝑚
In general if the hole is large and almost all of the pressure drop is across the medium then
𝐹𝑙𝑜𝑤 = 2𝑊
𝑎
𝜇(
𝐾𝑑
𝑎)
12
.𝐾4𝜋𝑅𝑐𝑎𝑣
𝜇
(2𝑊𝑎
𝜇(
𝐾𝑑
𝑎)
12
+𝐾4𝜋𝑅𝑐𝑎𝑣
𝜇)
.𝑃𝑙𝑖𝑛𝑒
This flow must be at least an order of magnitude greater than leakage at the target or the target flow will strongly affect the pressure distribution. If “a” is very small above then
𝐹𝑙𝑜𝑤 = 2𝑊𝑎
𝜇(
𝜅𝑑
𝑎)
12
. 𝑃𝑙𝑖𝑛𝑒 > 0.14 × 10⁻³(10 × ERM Criterion)
This means that “a” must be greater than about 10−15 which corresponds to a (maximum) extra distance for
hydrogen of about 200 m. If “a” is any smaller, the surface is effectively impermeable and the flow morphs into Scenario 3 – where the extra distance for hydrogen is again around 200 m.
As for Scenario 3, a larger criterion for leak flow leads to shorter distances – for example if the target flow criterion is 1 litre/s then “a” would have to be at least 5 × 10⁻¹². The maximum extra distance to compensate for a swap to hydrogen would only be about 3 m – for this level of trench permeability.
If there is a hole allowing a flow of 0.014 l/s methane to a target, the pressure would have to fall by a factor of approximately 9 to maintain the same flow rate for hydrogen.
In this case to produce such a drop in pressure the target to leak distance would have to increase by:
(𝑙𝑛9) (𝜅𝑑
𝑎)
12
≈ 2.2 (𝜅𝑑
𝑎)
12
= 20 𝑚

H100 Hydrogen Characterisation - Final Report
104 May 2019
III.4 Scenario 6: Impermeable cover-high porosity surface layer-all flow to target
In this case there is a large enough hole and cavity that the pressure required to drive the gas away from the immediate vicinity of the leak and into the porous surface layer is a small proportion of the line gas pressure P. The leak (to a large area target) corresponds to most or all of the flow.
𝐹𝑙𝑜𝑤 (𝑄)~𝑃𝑙𝑖𝑛𝑒 . 𝑑.𝜅
𝜇.
1
ln (𝐿𝑑
)
Substituting d=0.6 m, P0=7500 Pa, 𝜅= 10−11 m2, L =10 m and μ = 1.1 × 10⁻⁵ Pa.s (i.e. methane) gives a flow of
1.6 litres/s.
For example: if a critical flow for methane corresponds to L/d = 50 then a 25% decrease in viscosity could be
offset by a 25% increase in 𝑙𝑛(𝐿
𝑑).This amounts to an increase in range to L/d = 133. The increase in range for
hydrogen would be tens of metres.
Total flow in this geometry is a weak function of L, especially for large L. Working out what value L would correspond to a very low flux, such as the ERM criterion, is problematic. Substituting Q = 0.014 l/s, d=0.6 m,
P0=7500 Pa, 𝜅= 10−11 m2and μ = 1.1 × 10⁻⁵ Pa.s gives
𝑙𝑛 (𝐿
𝑑) = ln (
10
0.6) ×
1.6
0.014= 321
𝐿 = 𝑑. 𝑒321~10139𝑚
It is not possible to reduce this kind of flow through a porous medium to a low level by increasing the distance between source and target.
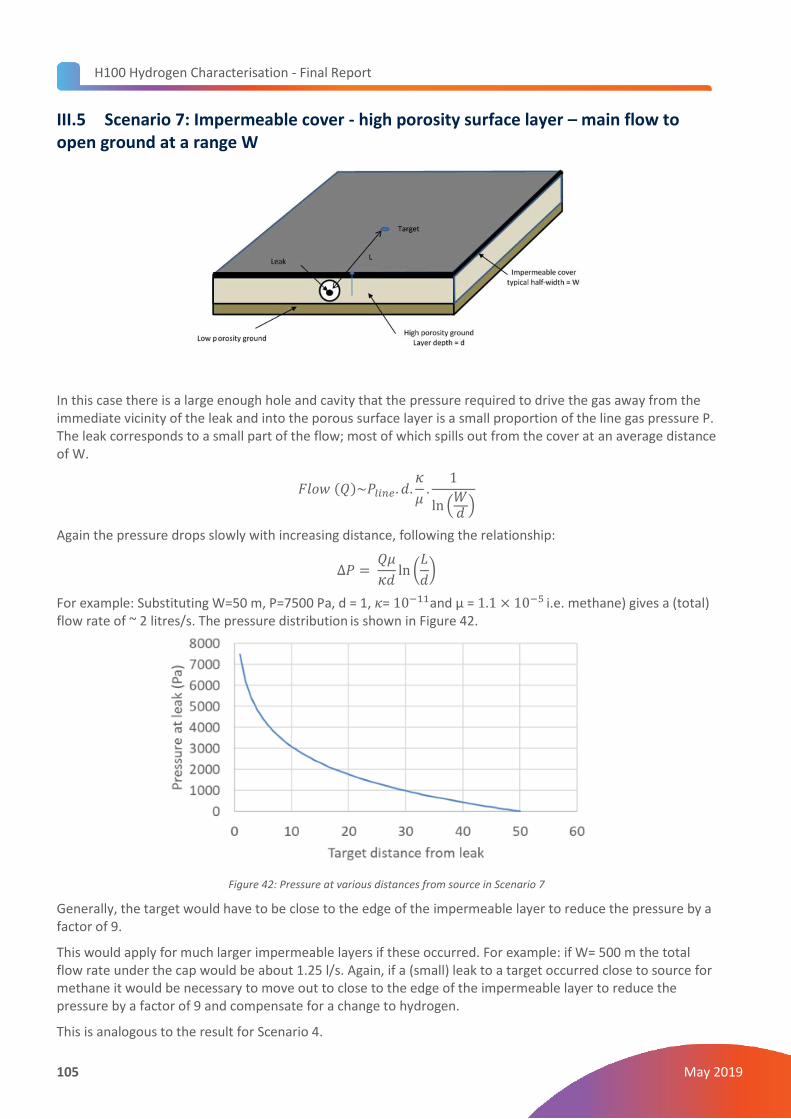
H100 Hydrogen Characterisation - Final Report
105 May 2019
III.5 Scenario 7: Impermeable cover - high porosity surface layer – main flow to open ground at a range W
In this case there is a large enough hole and cavity that the pressure required to drive the gas away from the immediate vicinity of the leak and into the porous surface layer is a small proportion of the line gas pressure P. The leak corresponds to a small part of the flow; most of which spills out from the cover at an average distance of W.
𝐹𝑙𝑜𝑤 (𝑄)~𝑃𝑙𝑖𝑛𝑒 . 𝑑.𝜅
𝜇.
1
ln (𝑊𝑑
)
Again the pressure drops slowly with increasing distance, following the relationship:
∆𝑃 = 𝑄𝜇
𝜅𝑑ln (
𝐿
𝑑)
For example: Substituting W=50 m, P=7500 Pa, d = 1, 𝜅= 10−11and μ = 1.1 × 10⁻⁵ i.e. methane) gives a (total)
flow rate of ~ 2 litres/s. The pressure distribution is shown in Figure 42.
Figure 42: Pressure at various distances from source in Scenario 7
Generally, the target would have to be close to the edge of the impermeable layer to reduce the pressure by a factor of 9.
This would apply for much larger impermeable layers if these occurred. For example: if W= 500 m the total flow rate under the cap would be about 1.25 l/s. Again, if a (small) leak to a target occurred close to source for methane it would be necessary to move out to close to the edge of the impermeable layer to reduce the pressure by a factor of 9 and compensate for a change to hydrogen.
This is analogous to the result for Scenario 4.
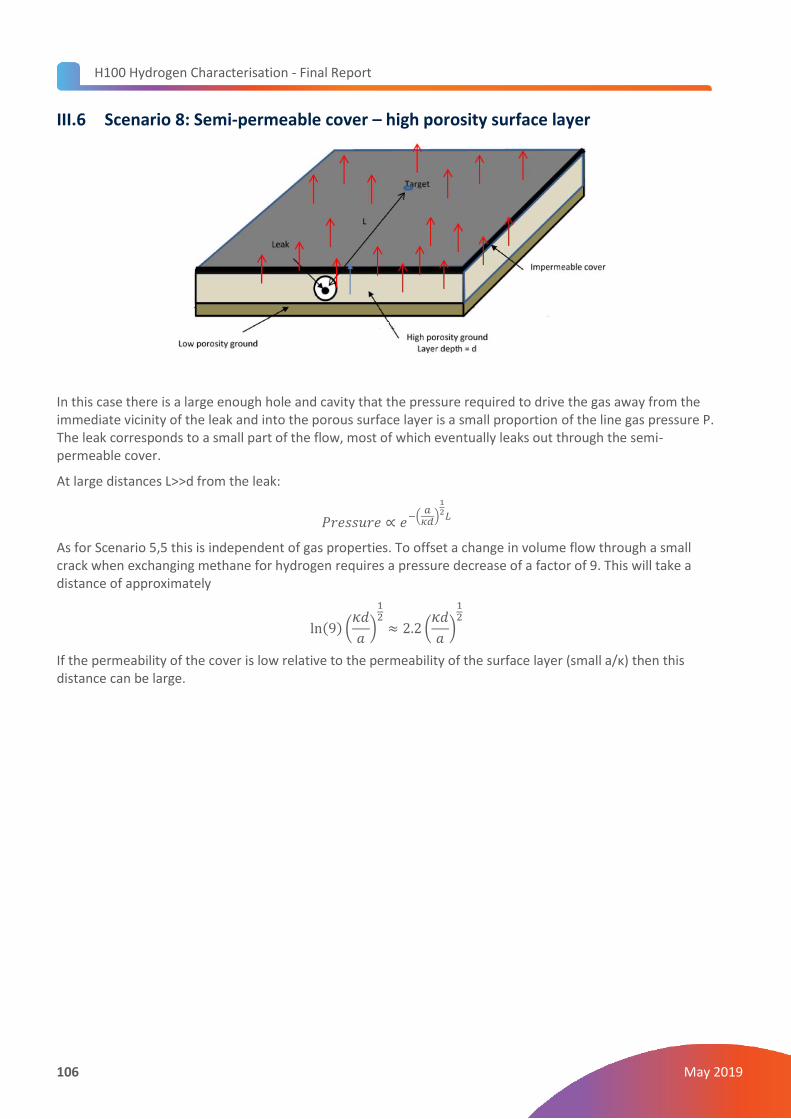
H100 Hydrogen Characterisation - Final Report
106 May 2019
III.6 Scenario 8: Semi-permeable cover – high porosity surface layer
In this case there is a large enough hole and cavity that the pressure required to drive the gas away from the immediate vicinity of the leak and into the porous surface layer is a small proportion of the line gas pressure P. The leak corresponds to a small part of the flow, most of which eventually leaks out through the semi-permeable cover.
At large distances L>>d from the leak:
𝑃𝑟𝑒𝑠𝑠𝑢𝑟𝑒 ∝ 𝑒−(
𝑎𝜅𝑑
)
12𝐿
As for Scenario 5,5 this is independent of gas properties. To offset a change in volume flow through a small crack when exchanging methane for hydrogen requires a pressure decrease of a factor of 9. This will take a distance of approximately
ln (9) (𝜅𝑑
𝑎)
12
≈ 2.2 (𝜅𝑑
𝑎)
12
If the permeability of the cover is low relative to the permeability of the surface layer (small a/κ) then this distance can be large.
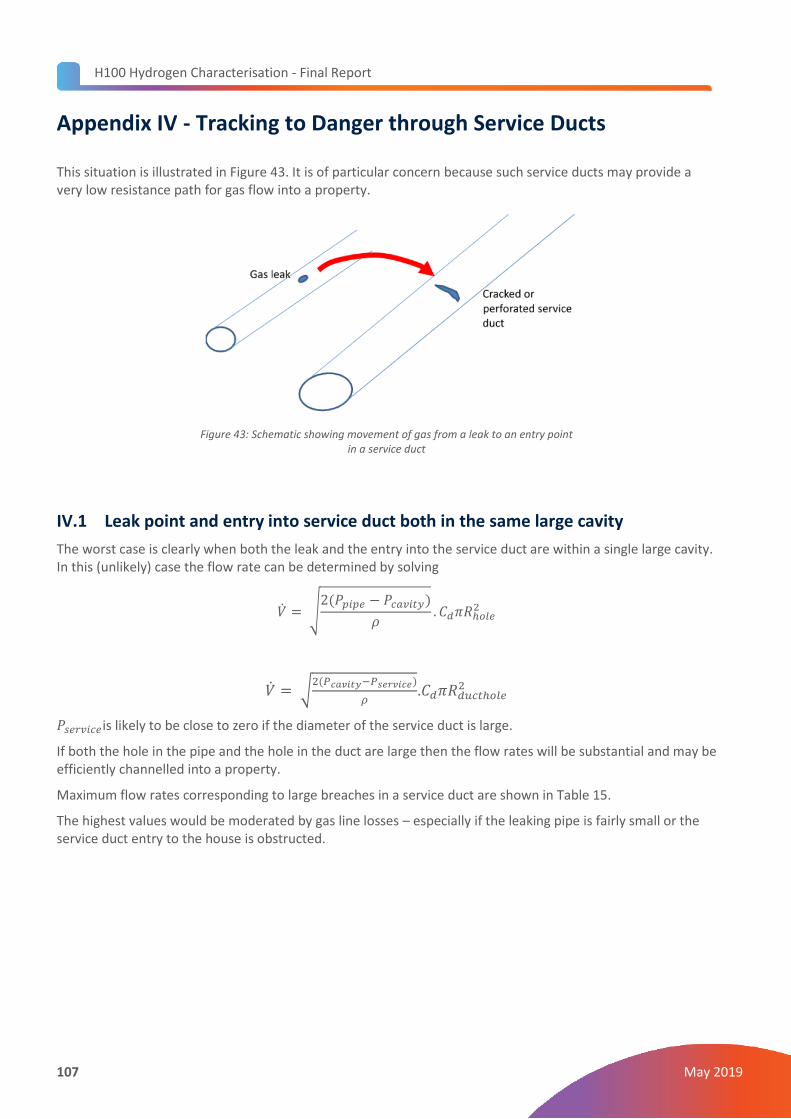
H100 Hydrogen Characterisation - Final Report
107 May 2019
Appendix IV - Tracking to Danger through Service Ducts
This situation is illustrated in Figure 43. It is of particular concern because such service ducts may provide a very low resistance path for gas flow into a property.
Figure 43: Schematic showing movement of gas from a leak to an entry point in a service duct
IV.1 Leak point and entry into service duct both in the same large cavity
The worst case is clearly when both the leak and the entry into the service duct are within a single large cavity. In this (unlikely) case the flow rate can be determined by solving
�� = √2(𝑃𝑝𝑖𝑝𝑒 − 𝑃𝑐𝑎𝑣𝑖𝑡𝑦)
𝜌. 𝐶𝑑𝜋𝑅ℎ𝑜𝑙𝑒
2
�� = √2(𝑃𝑐𝑎𝑣𝑖𝑡𝑦−𝑃𝑠𝑒𝑟𝑣𝑖𝑐𝑒)
𝜌.𝐶𝑑𝜋𝑅𝑑𝑢𝑐𝑡ℎ𝑜𝑙𝑒
2
𝑃𝑠𝑒𝑟𝑣𝑖𝑐𝑒is likely to be close to zero if the diameter of the service duct is large.
If both the hole in the pipe and the hole in the duct are large then the flow rates will be substantial and may be efficiently channelled into a property.
Maximum flow rates corresponding to large breaches in a service duct are shown in Table 15.
The highest values would be moderated by gas line losses – especially if the leaking pipe is fairly small or the service duct entry to the house is obstructed.
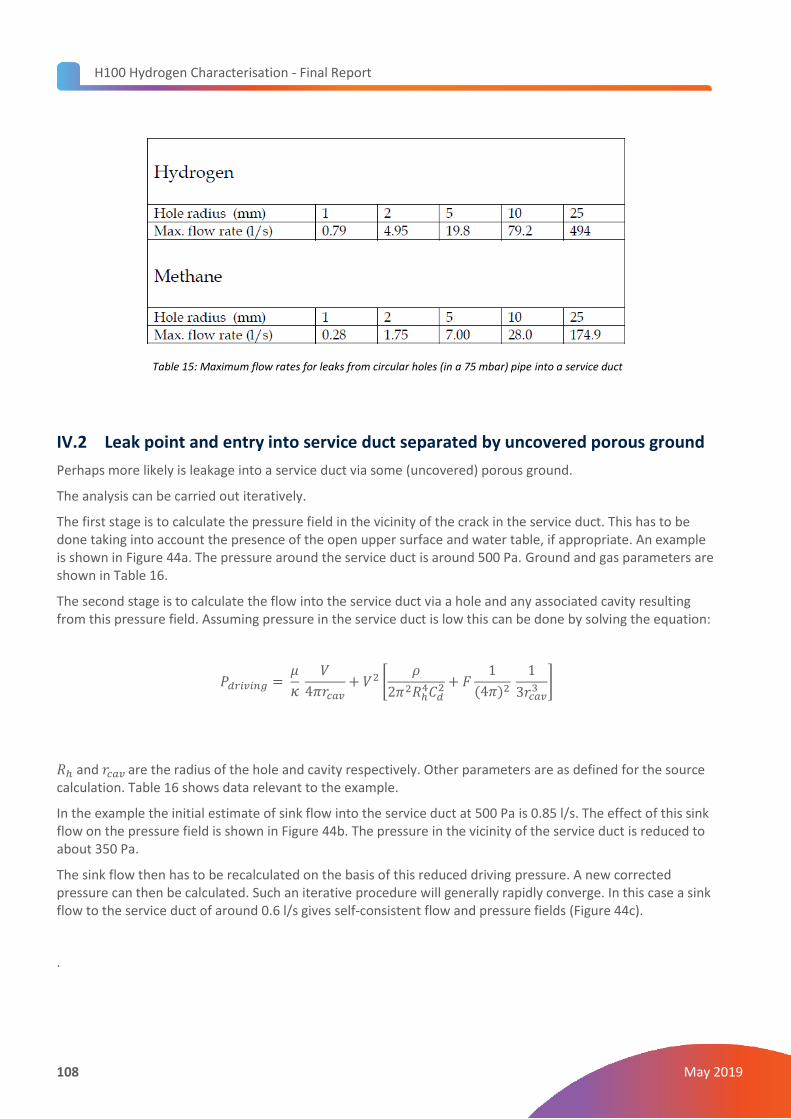
H100 Hydrogen Characterisation - Final Report
108 May 2019
Table 15: Maximum flow rates for leaks from circular holes (in a 75 mbar) pipe into a service duct
IV.2 Leak point and entry into service duct separated by uncovered porous ground
Perhaps more likely is leakage into a service duct via some (uncovered) porous ground.
The analysis can be carried out iteratively.
The first stage is to calculate the pressure field in the vicinity of the crack in the service duct. This has to be done taking into account the presence of the open upper surface and water table, if appropriate. An example is shown in Figure 44a. The pressure around the service duct is around 500 Pa. Ground and gas parameters are shown in Table 16.
The second stage is to calculate the flow into the service duct via a hole and any associated cavity resulting from this pressure field. Assuming pressure in the service duct is low this can be done by solving the equation:
𝑃𝑑𝑟𝑖𝑣𝑖𝑛𝑔 = 𝜇
𝜅
𝑉
4𝜋𝑟𝑐𝑎𝑣+ 𝑉2 [
𝜌
2𝜋2𝑅ℎ4𝐶𝑑
2 + 𝐹1
(4𝜋)2
1
3𝑟𝑐𝑎𝑣3 ]
𝑅ℎ and 𝑟𝑐𝑎𝑣 are the radius of the hole and cavity respectively. Other parameters are as defined for the source calculation. Table 16 shows data relevant to the example.
In the example the initial estimate of sink flow into the service duct at 500 Pa is 0.85 l/s. The effect of this sink flow on the pressure field is shown in Figure 44b. The pressure in the vicinity of the service duct is reduced to about 350 Pa.
The sink flow then has to be recalculated on the basis of this reduced driving pressure. A new corrected pressure can then be calculated. Such an iterative procedure will generally rapidly converge. In this case a sink flow to the service duct of around 0.6 l/s gives self-consistent flow and pressure fields (Figure 44c).
.
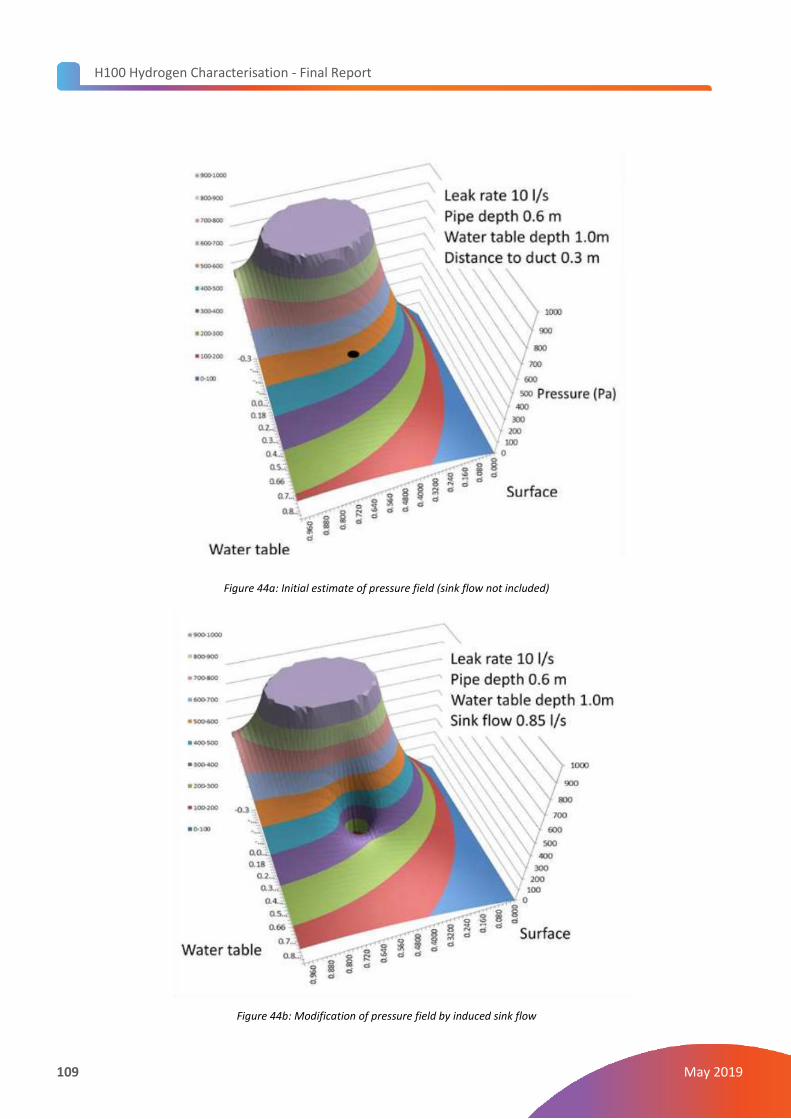
H100 Hydrogen Characterisation - Final Report
109 May 2019
Figure 44a: Initial estimate of pressure field (sink flow not included)
Figure 44b: Modification of pressure field by induced sink flow
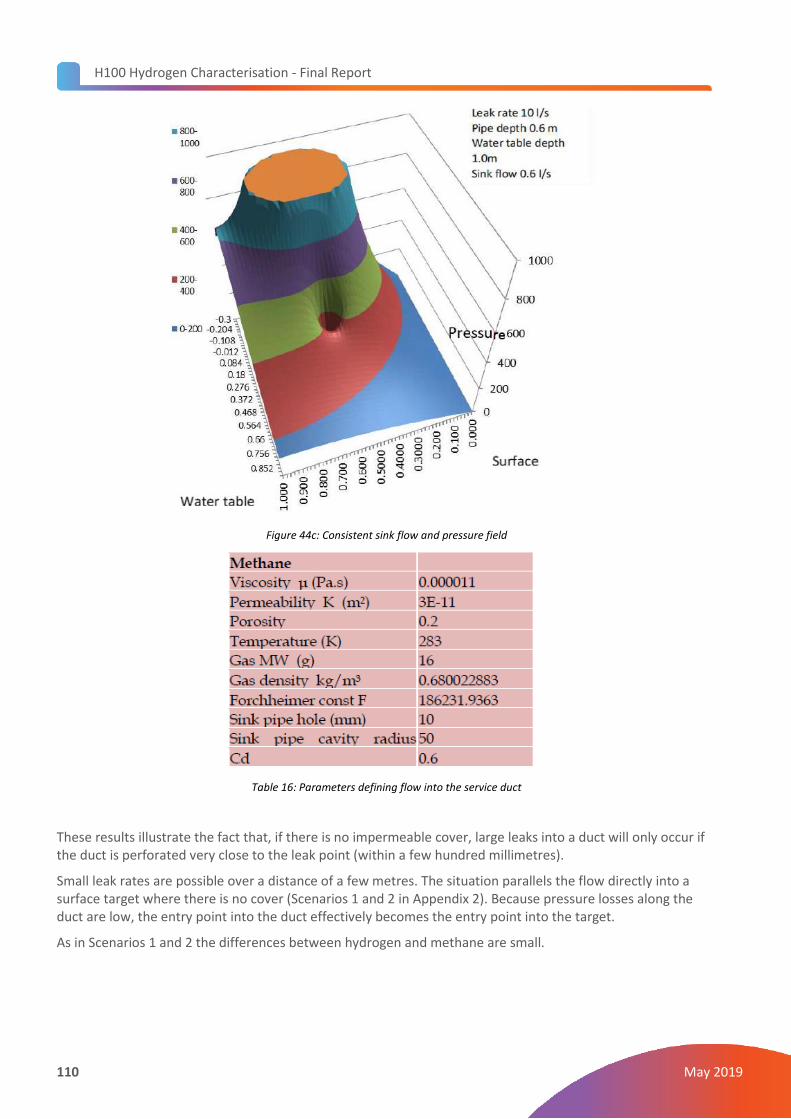
H100 Hydrogen Characterisation - Final Report
110 May 2019
Figure 44c: Consistent sink flow and pressure field
Table 16: Parameters defining flow into the service duct
These results illustrate the fact that, if there is no impermeable cover, large leaks into a duct will only occur if the duct is perforated very close to the leak point (within a few hundred millimetres).
Small leak rates are possible over a distance of a few metres. The situation parallels the flow directly into a surface target where there is no cover (Scenarios 1 and 2 in Appendix 2). Because pressure losses along the duct are low, the entry point into the duct effectively becomes the entry point into the target.
As in Scenarios 1 and 2 the differences between hydrogen and methane are small.

H100 Hydrogen Characterisation - Final Report
111 May 2019
IV.3 Leak point and entry into service duct separated by covered porous ground
In this case the variation of flow rate with distance depends on circumstances in a similar way to Scenarios 3-8 (Appendix 3). Because pressure losses along the duct are low the entry point into the duct effectively becomes the entry point into the target.
Significant flow rates into the duct are possible at larger separations between leak point and entry into the service duct. The differences (between methane and hydrogen) in distance required to reduce the flow into the duct to a given level are similar to those shown in Table 1. Detailed analyses for various cases mirror those in Appendix 3.
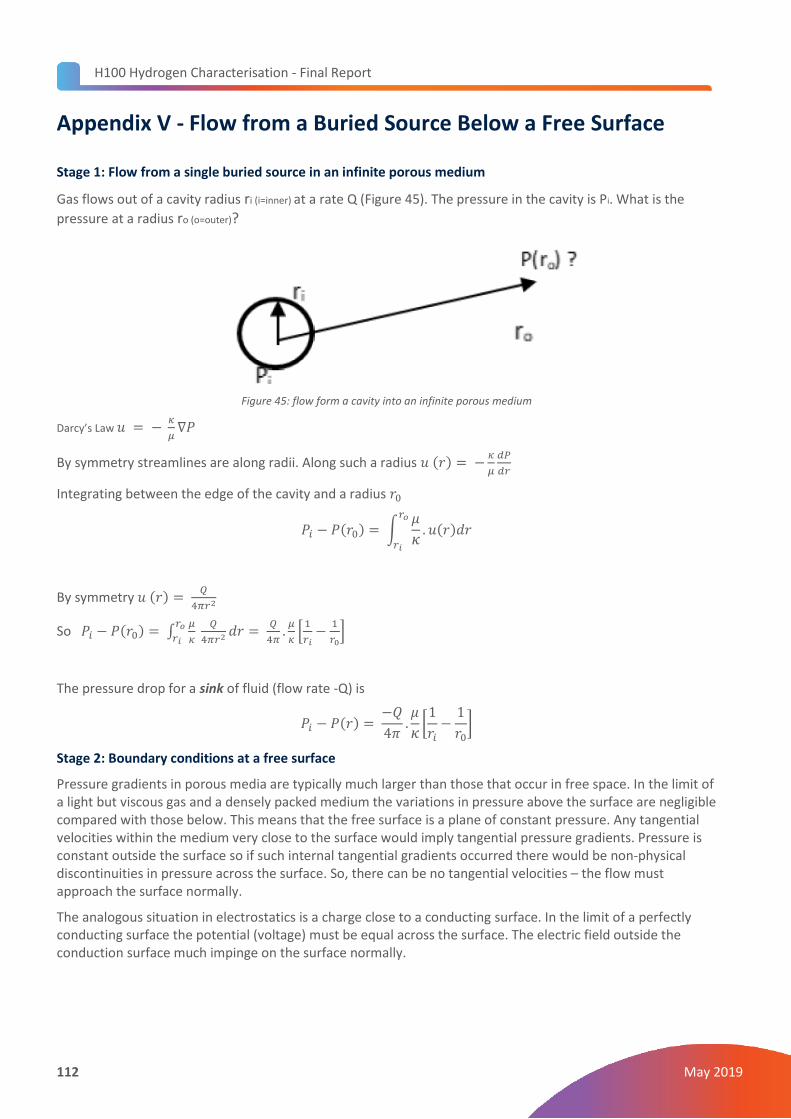
H100 Hydrogen Characterisation - Final Report
112 May 2019
Appendix V - Flow from a Buried Source Below a Free Surface
Stage 1: Flow from a single buried source in an infinite porous medium
Gas flows out of a cavity radius ri (i=inner) at a rate Q (Figure 45). The pressure in the cavity is Pi. What is the
pressure at a radius ro (o=outer)?
Figure 45: flow form a cavity into an infinite porous medium
Darcy’s Law 𝑢 = − 𝜅
𝜇∇𝑃
By symmetry streamlines are along radii. Along such a radius 𝑢 (𝑟) = −𝜅
𝜇
𝑑𝑃
𝑑𝑟
Integrating between the edge of the cavity and a radius 𝑟0
𝑃𝑖 − 𝑃(𝑟0) = ∫𝜇
𝜅
𝑟𝑜
𝑟𝑖
. 𝑢(𝑟)𝑑𝑟
By symmetry 𝑢 (𝑟) = 𝑄
4𝜋𝑟2
So 𝑃𝑖 − 𝑃(𝑟0) = ∫𝜇
𝜅
𝑟𝑜
𝑟𝑖
𝑄
4𝜋𝑟2 𝑑𝑟 = 𝑄
4𝜋.
𝜇
𝜅[
1
𝑟𝑖−
1
𝑟0]
The pressure drop for a sink of fluid (flow rate -Q) is
𝑃𝑖 − 𝑃(𝑟) = −𝑄
4𝜋.𝜇
𝜅[
1
𝑟𝑖−
1
𝑟0]
Stage 2: Boundary conditions at a free surface
Pressure gradients in porous media are typically much larger than those that occur in free space. In the limit of a light but viscous gas and a densely packed medium the variations in pressure above the surface are negligible compared with those below. This means that the free surface is a plane of constant pressure. Any tangential velocities within the medium very close to the surface would imply tangential pressure gradients. Pressure is constant outside the surface so if such internal tangential gradients occurred there would be non-physical discontinuities in pressure across the surface. So, there can be no tangential velocities – the flow must approach the surface normally.
The analogous situation in electrostatics is a charge close to a conducting surface. In the limit of a perfectly conducting surface the potential (voltage) must be equal across the surface. The electric field outside the conduction surface much impinge on the surface normally.

H100 Hydrogen Characterisation - Final Report
113 May 2019
Stage 3: The method of images
It is possible to establish a flow satisfying the above boundary condition using an image sink (similar size and flow rate) in the symmetry position above the surface (Figure 46).
Figure 46: Source of fluid, open surface and image sink
The net flow induced by the source and image sink is normal to the surface on the central plane: the tangential components of velocity are equal and opposite and therefore cancel.
If the flow rate into the sink is -Q the pressure across all of the central surface is zero.
The vector velocity induced by the source and sink at any location can be written down straight away.
𝒖 = 𝑄
4𝜋(
𝒓+
𝑟+2 −
𝒓−
𝑟−2 )
𝒓+ is the unit vector from the source to the location of interest
𝑟+2 is the square of the distance from the source to the location of interest
𝒓− is the unit vector from the image sink to the location of interest
𝑟−2 is the square of the distance from the image sink to the location of interest
On the central plane the normal velocity at a radius of r is: (see figure below)
𝑢 = 2𝑄
4𝜋.
1
(ℎ2 + 𝑟2).
ℎ
(ℎ2 + 𝑟2)1
2⁄
𝑢 = 𝑄
2𝜋.
ℎ
(ℎ2 + 𝑟2)3
2⁄
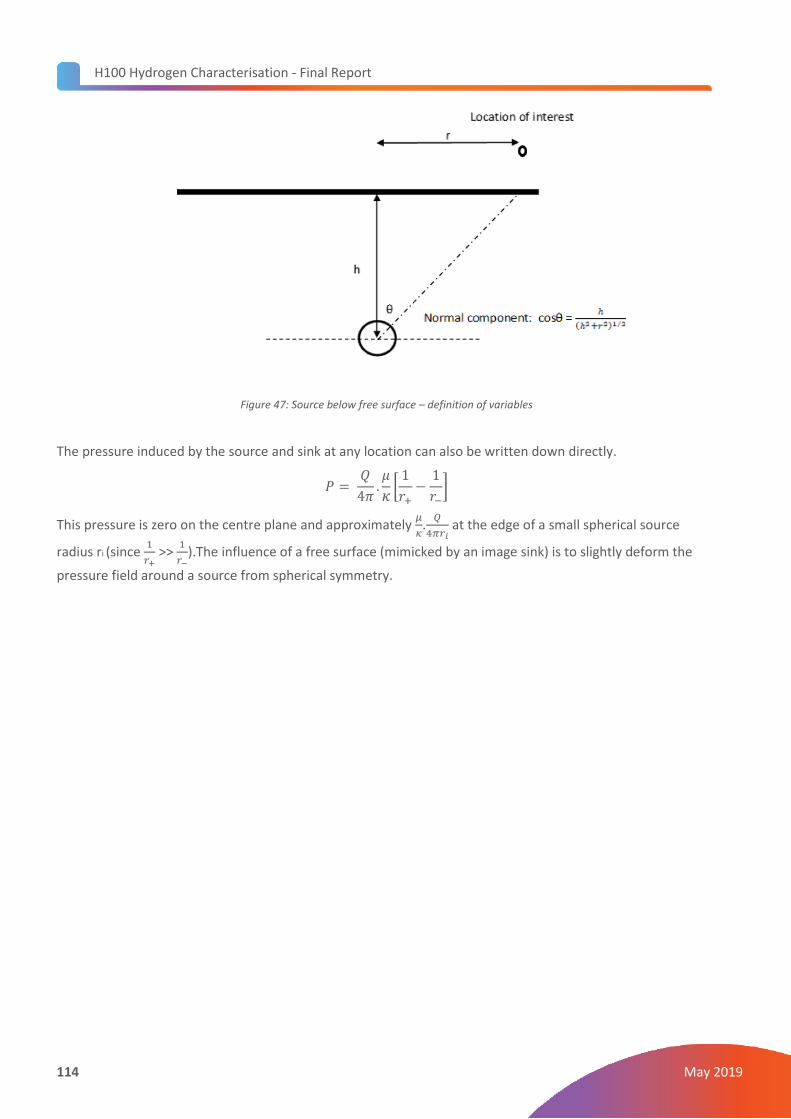
H100 Hydrogen Characterisation - Final Report
114 May 2019
Figure 47: Source below free surface – definition of variables
The pressure induced by the source and sink at any location can also be written down directly.
𝑃 = 𝑄
4𝜋.𝜇
𝜅[
1
𝑟+−
1
𝑟−]
This pressure is zero on the centre plane and approximately 𝜇
𝜅.
𝑄
4𝜋𝑟𝑖 at the edge of a small spherical source
radius ri (since 1
𝑟+ >>
1
𝑟−).The influence of a free surface (mimicked by an image sink) is to slightly deform the
pressure field around a source from spherical symmetry.

H100 Hydrogen Characterisation - Final Report
115 May 2019
Appendix VI - Source Under a Free Surface above an Impermeable Layer
The problem solved here is a buried source a distance “a” below an open surface and a distance “b” above an underlying impermeable boundary e.g. a water table (Figure 48).
The first stage in matching boundary conditions at the ground surface and water table is to add a primary image sink at a height of “a”. Without the effect of the water table this would solve the problem but the combined flows from the source and image sink do not satisfy the boundary condition at the water table (no normal flow).
This can be fixed by introducing an image pair of source and sink at the symmetry position below the ground. These image sources ensure the boundary condition at the ground is satisfied but slightly disturb the flow at the surface.
Again, this disturbance can be removed by introducing a second source sink pair above the ground as shown in Figure 45. These four additions (two sources and two sinks) form a set. Their net effect is exact matching of boundary conditions at the ground surface and a slight disturbance to the match at the water table.
A closer match to both conditions can be obtained by adding an n=2 quartet of sources. These are the reflections of the n=1 set in the ground and water table with appropriate polarities.
Since the distance of these sources to the locations that matter (between the water table and the ground) is increasing, each set of 4 images produces a smaller correction to the final result.
The flow at any point can be calculated by summing the flows from individual sources paying attention to the distance direction and polarity of the sources. For example: the normal flux F through the open surface at a range of r from the point above the source (strength Q) is:
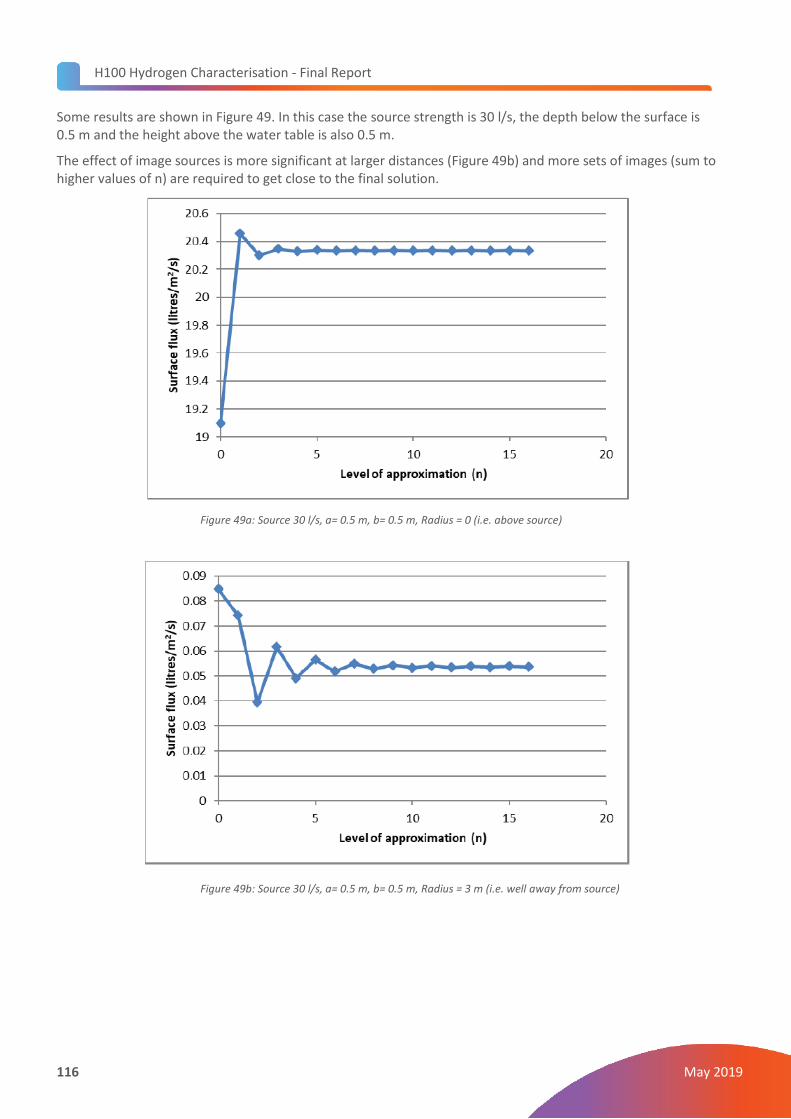
H100 Hydrogen Characterisation - Final Report
116 May 2019
Some results are shown in Figure 49. In this case the source strength is 30 l/s, the depth below the surface is 0.5 m and the height above the water table is also 0.5 m.
The effect of image sources is more significant at larger distances (Figure 49b) and more sets of images (sum to higher values of n) are required to get close to the final solution.
Figure 49a: Source 30 l/s, a= 0.5 m, b= 0.5 m, Radius = 0 (i.e. above source)
Figure 49b: Source 30 l/s, a= 0.5 m, b= 0.5 m, Radius = 3 m (i.e. well away from source)

H100 Hydrogen Characterisation - Final Report
117 May 2019
Appendix VII - Solution of One-Dimensional Flow Equations ( Scenario 5)
Gas flows in a channel filled with a uniform porous medium. The channel depth is “d” and width is “W”. The channel is surrounded on the base and sides by ground of low porosity/permeability and on top by a semipermeable cover.
The flux through the cover is linearly related to the pressure across it (implying the leakage flows are laminar):
𝐹 = 𝑎
𝜇∆𝑃
(If the cover was a thin layer of a low permeability uniformly porous material thickness “t” then:
𝑎 = κ𝐶𝑜𝑣𝑒𝑟
𝑡 where 𝜅𝐶𝑜𝑣𝑒𝑟 is the permeability of the cover medium)
Flow across the cross-section of the channel is assumed to be uniform because its length is very much greater than its width or depth.
The pressure gradient along the channel is related to the total flow at this point, Q, by Darcy’s Equation.
𝑑𝑃
𝑑𝑥= −
𝜇
𝜅.
𝑄
𝑑𝑊
The rate of decline in the flow in the channel (because of leakage through the surface) is related to the pressure as:
𝑑𝑄
𝑑𝑥= 𝑊. 𝐹 = −𝑊.
𝑎
𝜇. 𝑃
Combining these two equations gives:
𝑑2𝑃
𝑑𝑥2= −
𝜇
𝜅𝑊𝑑.𝑑𝑄
𝑑𝑥=
𝑎
𝜅𝑑𝑃
The solution with the right behaviour at large x is:
𝑃 = 𝑃0𝑒−√
𝑎𝜅𝑑
. 𝑥
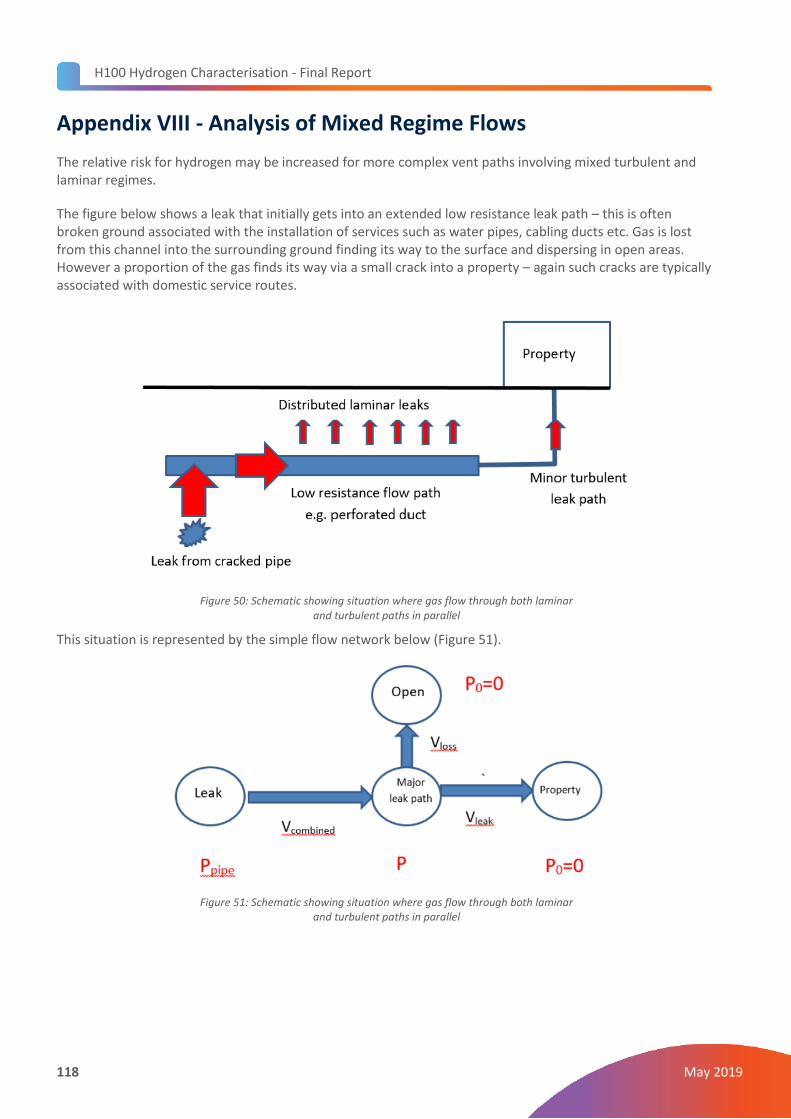
H100 Hydrogen Characterisation - Final Report
118 May 2019
Appendix VIII - Analysis of Mixed Regime Flows
The relative risk for hydrogen may be increased for more complex vent paths involving mixed turbulent and laminar regimes.
The figure below shows a leak that initially gets into an extended low resistance leak path – this is often broken ground associated with the installation of services such as water pipes, cabling ducts etc. Gas is lost from this channel into the surrounding ground finding its way to the surface and dispersing in open areas. However a proportion of the gas finds its way via a small crack into a property – again such cracks are typically associated with domestic service routes.
Figure 50: Schematic showing situation where gas flow through both laminar and turbulent paths in parallel
This situation is represented by the simple flow network below (Figure 51).
Figure 51: Schematic showing situation where gas flow through both laminar and turbulent paths in parallel

H100 Hydrogen Characterisation - Final Report
119 May 2019
Assume:
1. The combined flow out of the pipe into the main flow path is turbulent. 2. The flow through the smaller crack into the property is also turbulent. 3. The distributed loss to the open through compacted ground is laminar (Darcy’s Equation). 4. The flow is incompressible. 5. Flow resistances are independent of Reynolds number within a limited range.
In general
𝑃 = 𝑎𝜌𝑉𝑙𝑒𝑎𝑘2
𝑃 = 𝑏𝜇𝑉𝑙𝑜𝑠𝑠
𝑃𝑝𝑖𝑝𝑒 − 𝑃 = 𝑐𝜌( 𝑉𝑙𝑒𝑎𝑘 + 𝑉𝑙𝑜𝑠𝑠)2
a, b and c are constants that depend on the area of leak paths as well as permeability, friction factors etc.
For a given set of turbulent and laminar flow resistances and pipe pressures the various flow rates can be obtained and compared for hydrogen and methane.
Where most of the leak channels into the property (i.e. bμ >> a ρ) this situation reduces to the purely turbulent flow case examined above. The change from methane to hydrogen just leads to the increase in
volume flow associated with the decrease in density 𝜌−1
2⁄ .
However, where only a relatively small proportion of the leak channels into the property (e.g. of order 10%) and the rest is lost to the open then the change from methane to hydrogen is accompanied by a larger increase in volume flow into the building.