Embed Size (px)
Citation preview
PCGBRF202019 March 2021
Project Catalyst Trial Report
Trialling Different Ameliorant Methods to Improve Poor
Soakage
Status: Completed
Grower Information Grower Name: Mark Castalanelli
Entity Name: Castalanelli MA
Trial Farm No/Name:
BKN-07391A
Mill Area: Pioneer
Total Farm Area ha: 88
No. Years Farming:
Trial Subdistrict: Waterview
Area under Cane ha: 88
PCGBRF202019 March 2021
Background Information
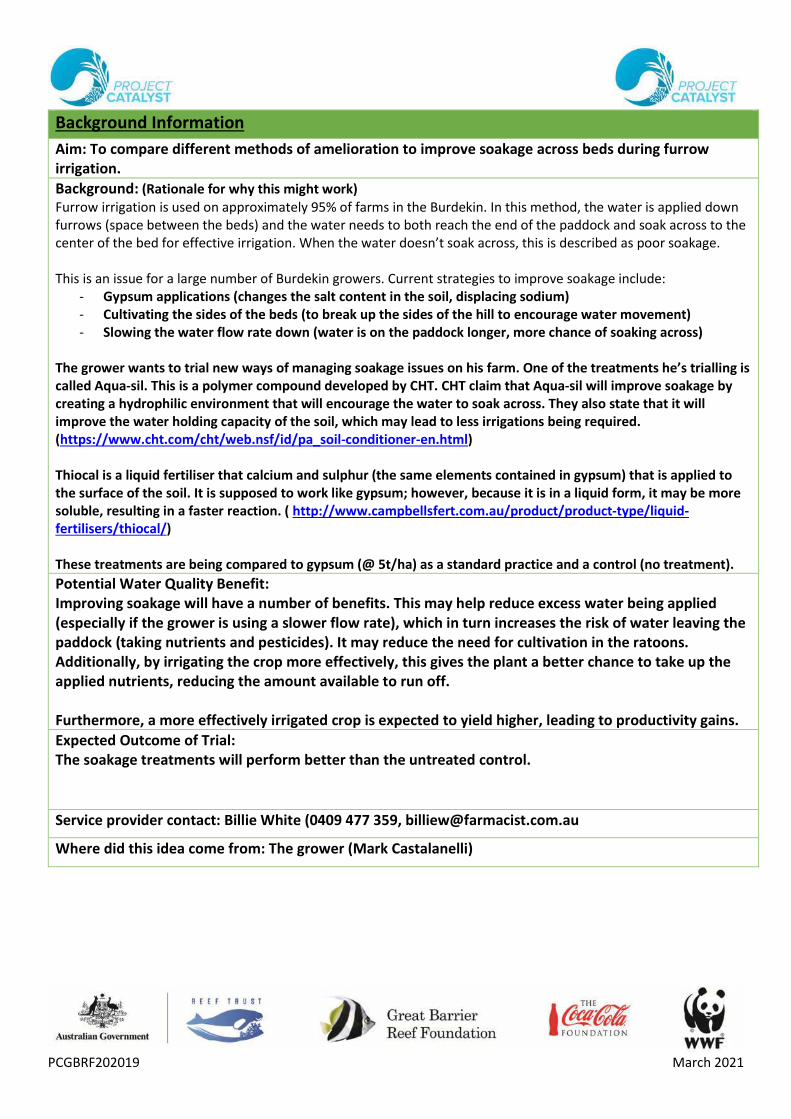
Aim: To compare different methods of amelioration to improve soakage across beds during furrow irrigation.
Background: (Rationale for why this might work) Furrow irrigation is used on approximately 95% of farms in the Burdekin. In this method, the water is applied down furrows (space between the beds) and the water needs to both reach the end of the paddock and soak across to the center of the bed for effective irrigation. When the water doesn’t soak across, this is described as poor soakage. This is an issue for a large number of Burdekin growers. Current strategies to improve soakage include:
- Gypsum applications (changes the salt content in the soil, displacing sodium) - Cultivating the sides of the beds (to break up the sides of the hill to encourage water movement) - Slowing the water flow rate down (water is on the paddock longer, more chance of soaking across)
The grower wants to trial new ways of managing soakage issues on his farm. One of the treatments he’s trialling is called Aqua-sil. This is a polymer compound developed by CHT. CHT claim that Aqua-sil will improve soakage by creating a hydrophilic environment that will encourage the water to soak across. They also state that it will improve the water holding capacity of the soil, which may lead to less irrigations being required. (https://www.cht.com/cht/web.nsf/id/pa_soil-conditioner-en.html) Thiocal is a liquid fertiliser that calcium and sulphur (the same elements contained in gypsum) that is applied to the surface of the soil. It is supposed to work like gypsum; however, because it is in a liquid form, it may be more soluble, resulting in a faster reaction. ( http://www.campbellsfert.com.au/product/product-type/liquid-fertilisers/thiocal/) These treatments are being compared to gypsum (@ 5t/ha) as a standard practice and a control (no treatment).
Potential Water Quality Benefit: Improving soakage will have a number of benefits. This may help reduce excess water being applied (especially if the grower is using a slower flow rate), which in turn increases the risk of water leaving the paddock (taking nutrients and pesticides). It may reduce the need for cultivation in the ratoons. Additionally, by irrigating the crop more effectively, this gives the plant a better chance to take up the applied nutrients, reducing the amount available to run off. Furthermore, a more effectively irrigated crop is expected to yield higher, leading to productivity gains. Expected Outcome of Trial: The soakage treatments will perform better than the untreated control.
Service provider contact: Billie White (0409 477 359, [email protected]
Where did this idea come from: The grower (Mark Castalanelli)
PCGBRF202019 March 2021
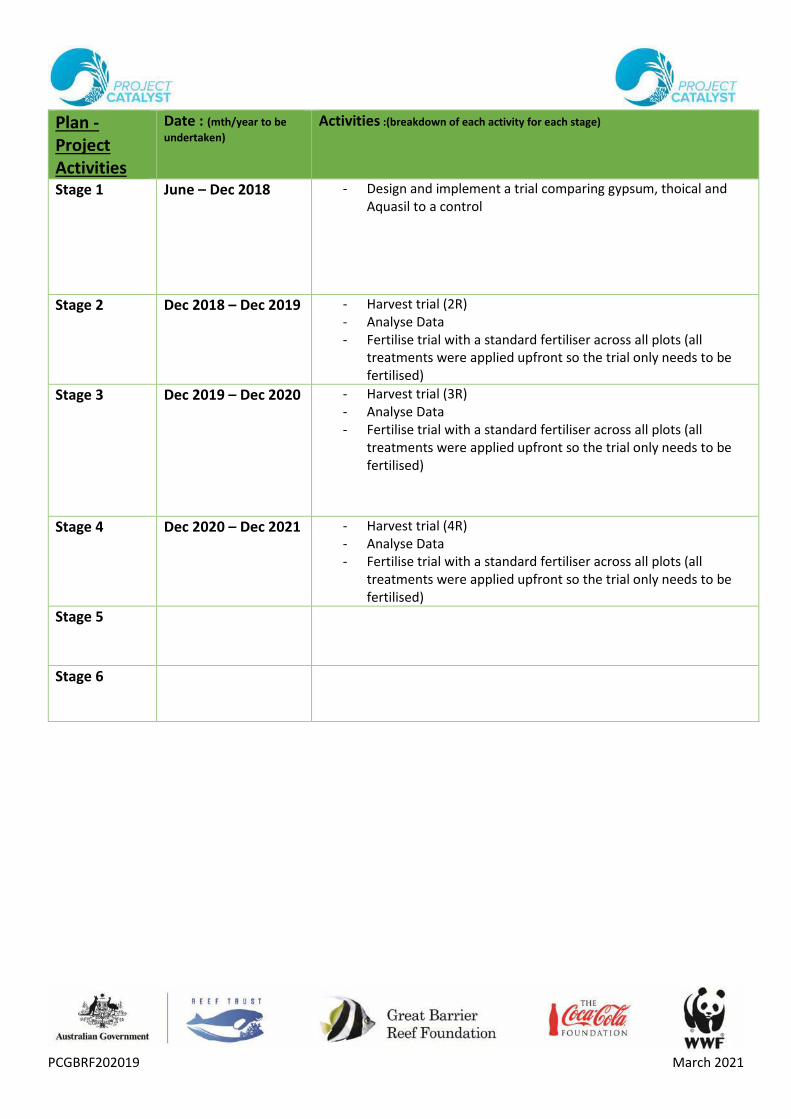
Plan - Project Activities
Date : (mth/year to be
undertaken) Activities :(breakdown of each activity for each stage)
Stage 1 June – Dec 2018 - Design and implement a trial comparing gypsum, thoical and Aquasil to a control
Stage 2 Dec 2018 – Dec 2019 - Harvest trial (2R) - Analyse Data - Fertilise trial with a standard fertiliser across all plots (all
treatments were applied upfront so the trial only needs to be fertilised)
Stage 3 Dec 2019 – Dec 2020 - Harvest trial (3R) - Analyse Data - Fertilise trial with a standard fertiliser across all plots (all
treatments were applied upfront so the trial only needs to be fertilised)
Stage 4 Dec 2020 – Dec 2021 - Harvest trial (4R) - Analyse Data - Fertilise trial with a standard fertiliser across all plots (all
treatments were applied upfront so the trial only needs to be fertilised)
Stage 5
Stage 6
PCGBRF202019 March 2021
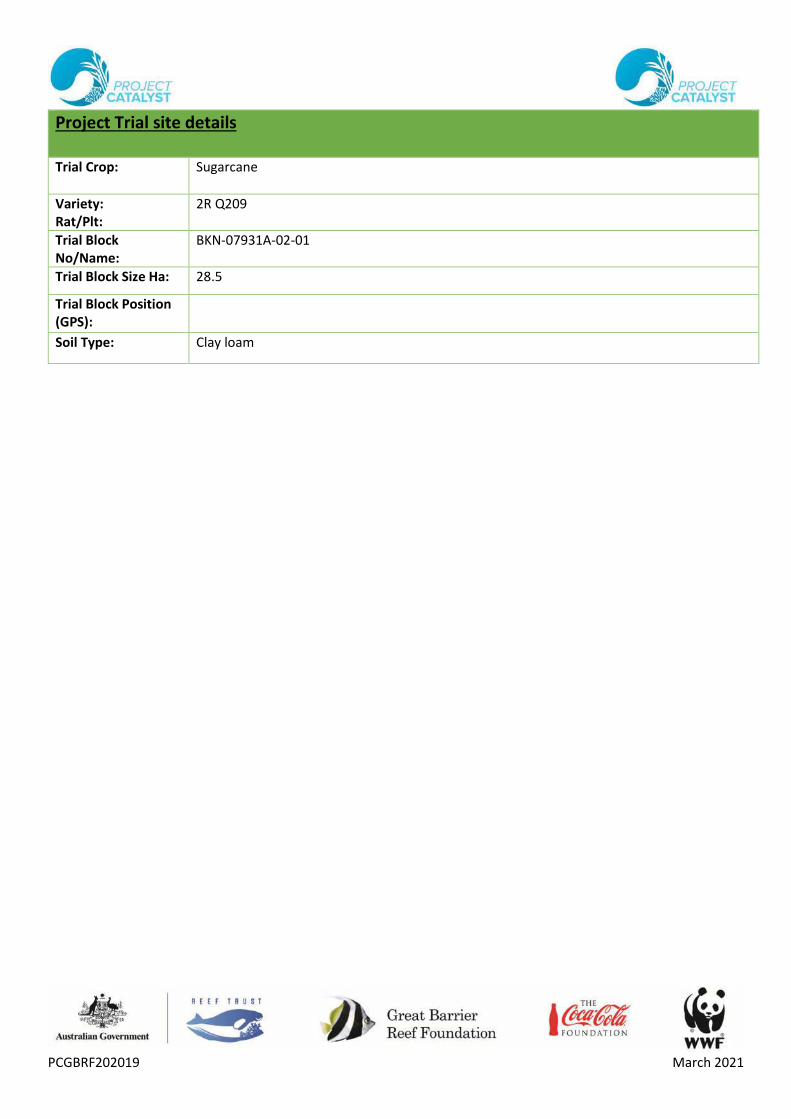
Project Trial site details
Trial Crop: Sugarcane
Variety: Rat/Plt:
2R Q209
Trial Block No/Name:
BKN-07931A-02-01
Trial Block Size Ha: 28.5
Trial Block Position (GPS):
Soil Type: Clay loam
PCGBRF202019 March 2021
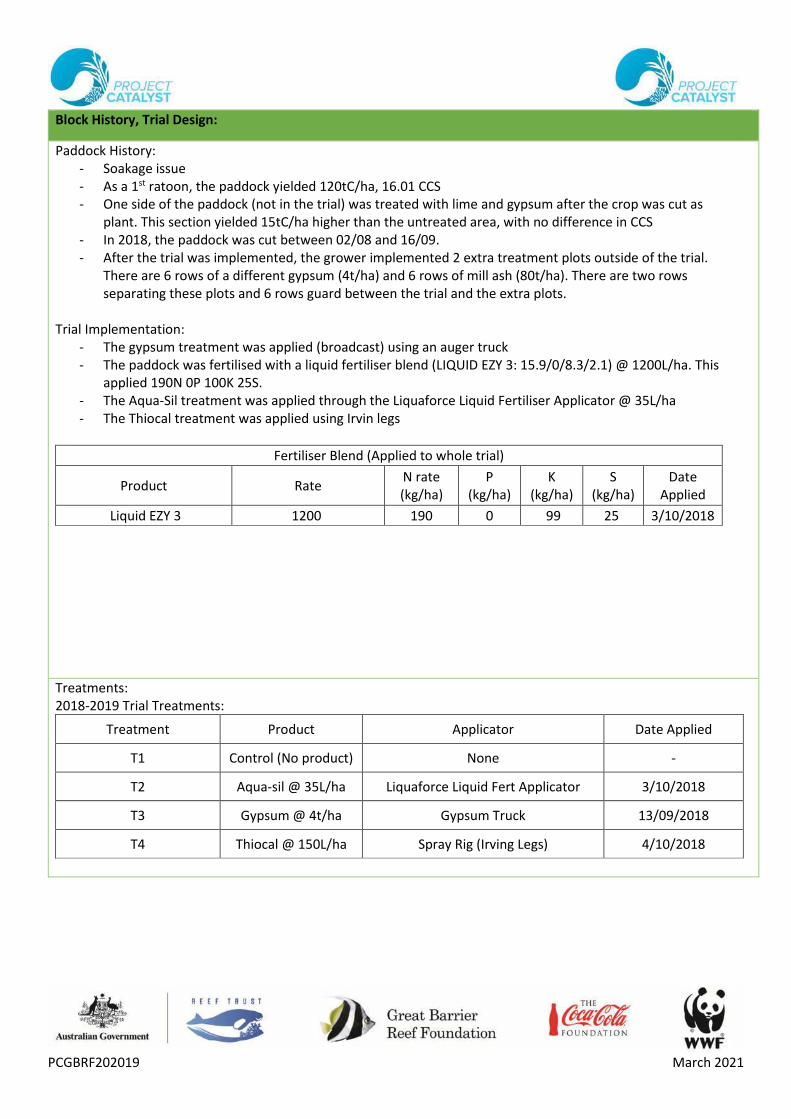
Block History, Trial Design:
Paddock History: - Soakage issue - As a 1st ratoon, the paddock yielded 120tC/ha, 16.01 CCS - One side of the paddock (not in the trial) was treated with lime and gypsum after the crop was cut as
plant. This section yielded 15tC/ha higher than the untreated area, with no difference in CCS - In 2018, the paddock was cut between 02/08 and 16/09. - After the trial was implemented, the grower implemented 2 extra treatment plots outside of the trial.
There are 6 rows of a different gypsum (4t/ha) and 6 rows of mill ash (80t/ha). There are two rows separating these plots and 6 rows guard between the trial and the extra plots.
Trial Implementation:
- The gypsum treatment was applied (broadcast) using an auger truck - The paddock was fertilised with a liquid fertiliser blend (LIQUID EZY 3: 15.9/0/8.3/2.1) @ 1200L/ha. This
applied 190N 0P 100K 25S. - The Aqua-Sil treatment was applied through the Liquaforce Liquid Fertiliser Applicator @ 35L/ha - The Thiocal treatment was applied using Irvin legs
Fertiliser Blend (Applied to whole trial)
Product Rate N rate (kg/ha)
P (kg/ha)
K (kg/ha)
S (kg/ha)
Date Applied
Liquid EZY 3 1200 190 0 99 25 3/10/2018
Treatments: 2018-2019 Trial Treatments:
Treatment Product Applicator Date Applied
T1 Control (No product) None -
T2 Aqua-sil @ 35L/ha Liquaforce Liquid Fert Applicator 3/10/2018
T3 Gypsum @ 4t/ha Gypsum Truck 13/09/2018
T4 Thiocal @ 150L/ha Spray Rig (Irving Legs) 4/10/2018
PCGBRF202019 March 2021
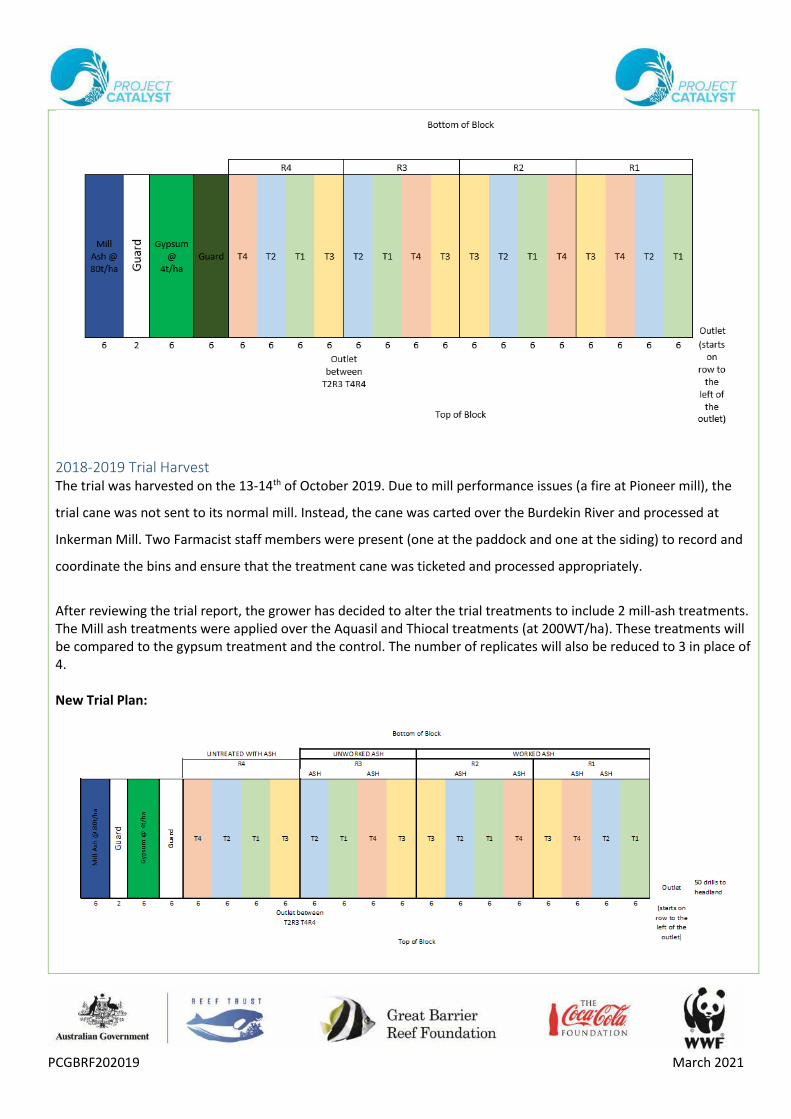
2018-2019 Trial Harvest The trial was harvested on the 13-14th of October 2019. Due to mill performance issues (a fire at Pioneer mill), the
trial cane was not sent to its normal mill. Instead, the cane was carted over the Burdekin River and processed at
Inkerman Mill. Two Farmacist staff members were present (one at the paddock and one at the siding) to record and
coordinate the bins and ensure that the treatment cane was ticketed and processed appropriately.
After reviewing the trial report, the grower has decided to alter the trial treatments to include 2 mill-ash treatments. The Mill ash treatments were applied over the Aquasil and Thiocal treatments (at 200WT/ha). These treatments will be compared to the gypsum treatment and the control. The number of replicates will also be reduced to 3 in place of 4. New Trial Plan:
PCGBRF202019 March 2021
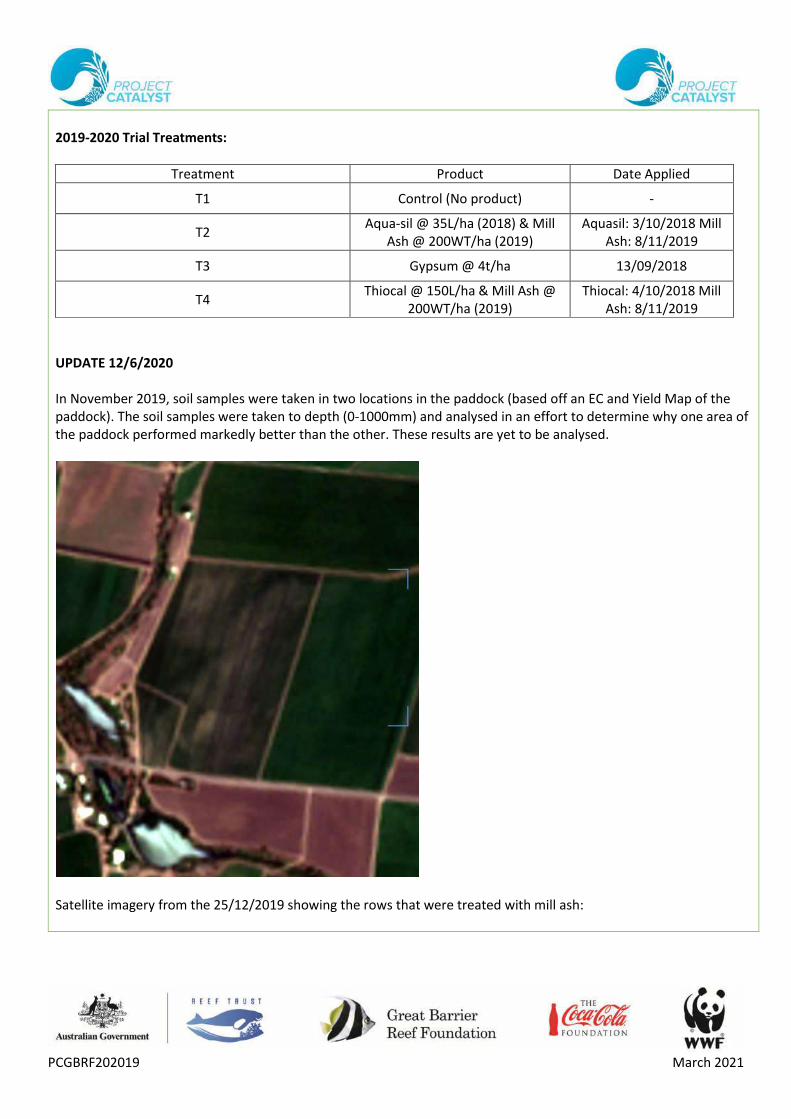
2019-2020 Trial Treatments:
Treatment Product Date Applied
T1 Control (No product) -
T2 Aqua-sil @ 35L/ha (2018) & Mill
Ash @ 200WT/ha (2019) Aquasil: 3/10/2018 Mill
Ash: 8/11/2019
T3 Gypsum @ 4t/ha 13/09/2018
T4 Thiocal @ 150L/ha & Mill Ash @
200WT/ha (2019) Thiocal: 4/10/2018 Mill
Ash: 8/11/2019
UPDATE 12/6/2020 In November 2019, soil samples were taken in two locations in the paddock (based off an EC and Yield Map of the paddock). The soil samples were taken to depth (0-1000mm) and analysed in an effort to determine why one area of the paddock performed markedly better than the other. These results are yet to be analysed.
Satellite imagery from the 25/12/2019 showing the rows that were treated with mill ash:
PCGBRF202019 March 2021
Results:
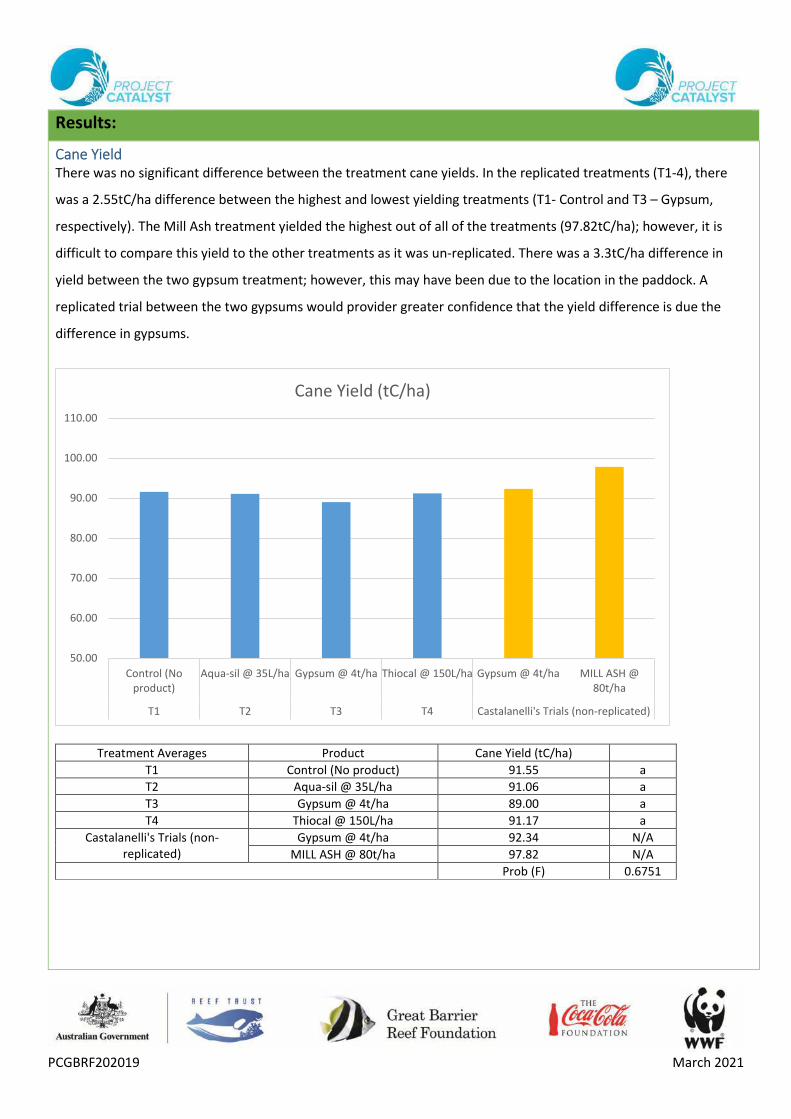
Cane Yield There was no significant difference between the treatment cane yields. In the replicated treatments (T1-4), there
was a 2.55tC/ha difference between the highest and lowest yielding treatments (T1- Control and T3 – Gypsum,
respectively). The Mill Ash treatment yielded the highest out of all of the treatments (97.82tC/ha); however, it is
difficult to compare this yield to the other treatments as it was un-replicated. There was a 3.3tC/ha difference in
yield between the two gypsum treatment; however, this may have been due to the location in the paddock. A
replicated trial between the two gypsums would provider greater confidence that the yield difference is due the
difference in gypsums.
Treatment Averages Product Cane Yield (tC/ha)
T1 Control (No product) 91.55 a
T2 Aqua-sil @ 35L/ha 91.06 a
T3 Gypsum @ 4t/ha 89.00 a
T4 Thiocal @ 150L/ha 91.17 a
Castalanelli's Trials (non-replicated)
Gypsum @ 4t/ha 92.34 N/A
MILL ASH @ 80t/ha 97.82 N/A
Prob (F) 0.6751
50.00
60.00
70.00
80.00
90.00
100.00
110.00
Control (Noproduct)
Aqua-sil @ 35L/ha Gypsum @ 4t/ha Thiocal @ 150L/ha Gypsum @ 4t/ha MILL ASH @80t/ha
T1 T2 T3 T4 Castalanelli's Trials (non-replicated)
Cane Yield (tC/ha)
PCGBRF202019 March 2021
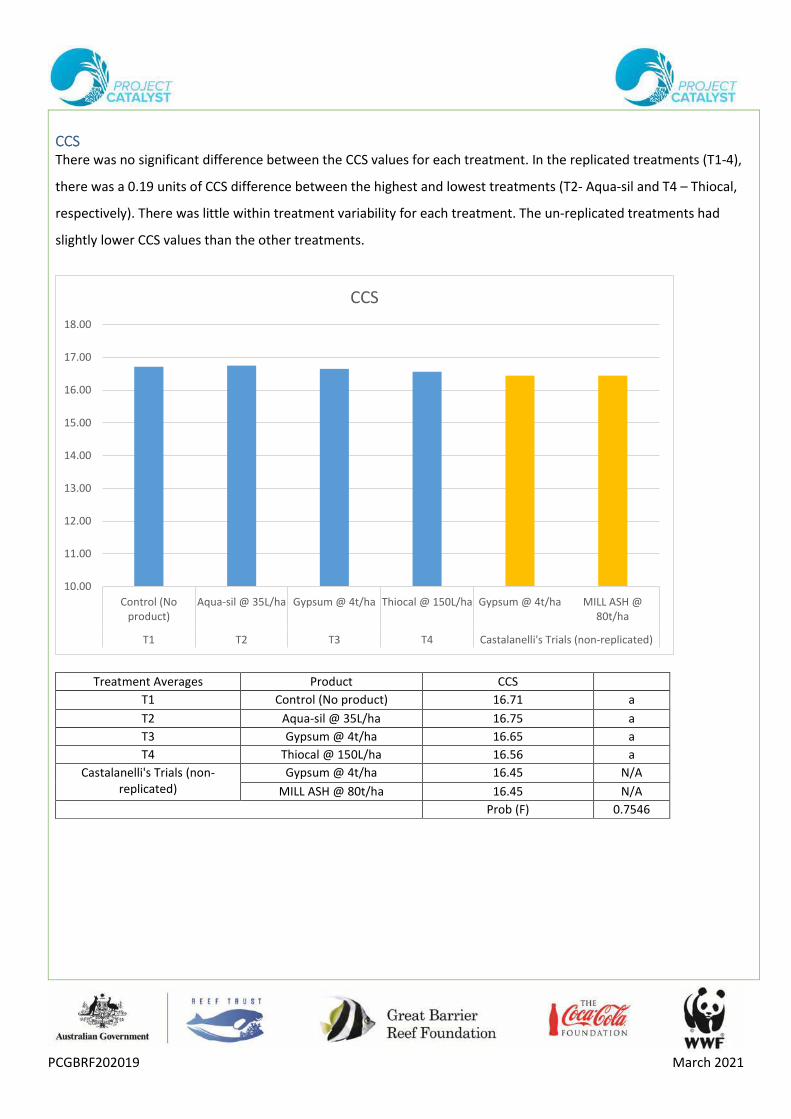
CCS There was no significant difference between the CCS values for each treatment. In the replicated treatments (T1-4),
there was a 0.19 units of CCS difference between the highest and lowest treatments (T2- Aqua-sil and T4 – Thiocal,
respectively). There was little within treatment variability for each treatment. The un-replicated treatments had
slightly lower CCS values than the other treatments.
Treatment Averages Product CCS
T1 Control (No product) 16.71 a
T2 Aqua-sil @ 35L/ha 16.75 a
T3 Gypsum @ 4t/ha 16.65 a
T4 Thiocal @ 150L/ha 16.56 a
Castalanelli's Trials (non-replicated)
Gypsum @ 4t/ha 16.45 N/A
MILL ASH @ 80t/ha 16.45 N/A
Prob (F) 0.7546
10.00
11.00
12.00
13.00
14.00
15.00
16.00
17.00
18.00
Control (Noproduct)
Aqua-sil @ 35L/ha Gypsum @ 4t/ha Thiocal @ 150L/ha Gypsum @ 4t/ha MILL ASH @80t/ha
T1 T2 T3 T4 Castalanelli's Trials (non-replicated)
CCS
PCGBRF202019 March 2021
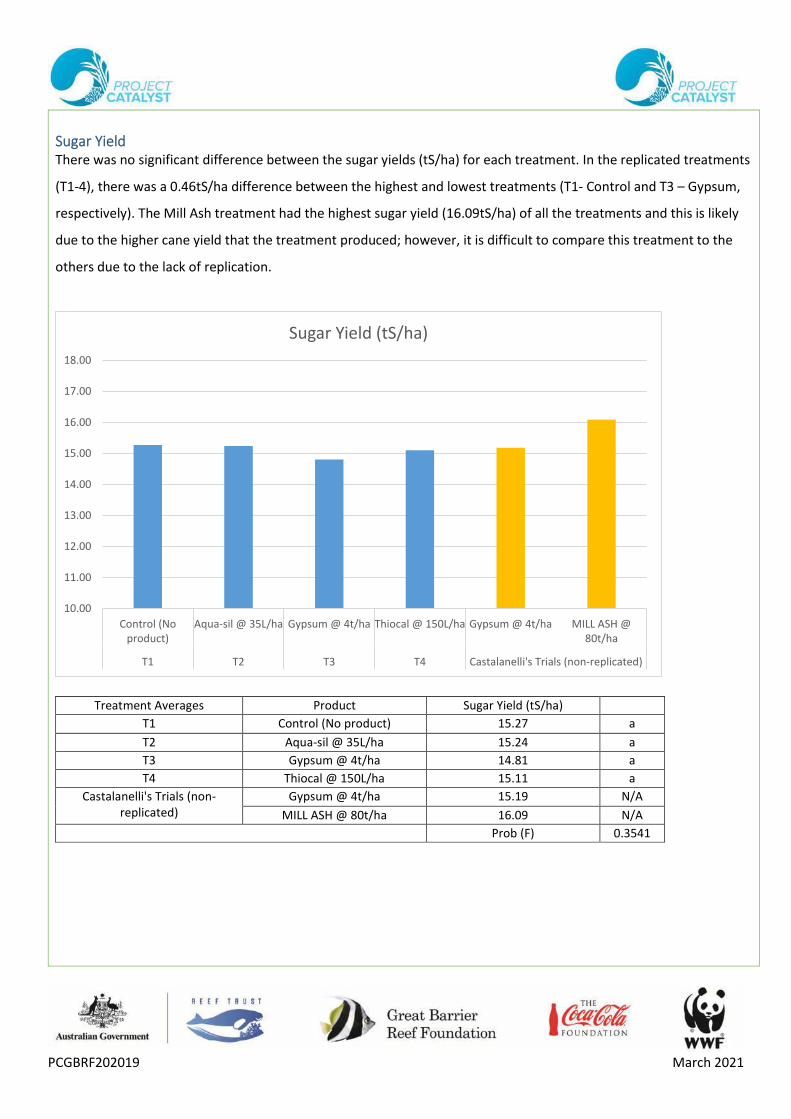
Sugar Yield There was no significant difference between the sugar yields (tS/ha) for each treatment. In the replicated treatments
(T1-4), there was a 0.46tS/ha difference between the highest and lowest treatments (T1- Control and T3 – Gypsum,
respectively). The Mill Ash treatment had the highest sugar yield (16.09tS/ha) of all the treatments and this is likely
due to the higher cane yield that the treatment produced; however, it is difficult to compare this treatment to the
others due to the lack of replication.
Treatment Averages Product Sugar Yield (tS/ha)
T1 Control (No product) 15.27 a
T2 Aqua-sil @ 35L/ha 15.24 a
T3 Gypsum @ 4t/ha 14.81 a
T4 Thiocal @ 150L/ha 15.11 a
Castalanelli's Trials (non-replicated)
Gypsum @ 4t/ha 15.19 N/A
MILL ASH @ 80t/ha 16.09 N/A
Prob (F) 0.3541
10.00
11.00
12.00
13.00
14.00
15.00
16.00
17.00
18.00
Control (Noproduct)
Aqua-sil @ 35L/ha Gypsum @ 4t/ha Thiocal @ 150L/ha Gypsum @ 4t/ha MILL ASH @80t/ha
T1 T2 T3 T4 Castalanelli's Trials (non-replicated)
Sugar Yield (tS/ha)

PCGBRF202019 March 2021
04/03/2021 Update
When the trial was being harvested, there was a noticeable yield difference between the Plots in Rep 1 and the plots in Reps 2, 3 and 4. Rep 1 yielded 5-15tC/ha higher than the same treatments in the remaining reps. This difference was also apparent on a yield map, derived through satellite imagery. In the previous fallow, the paddock had been lasered and EC mapped prior to planting.
When the yield map is compared to the EC map, the pattern of the zones is quite similar. In the yield map, the dark blue zones are the higher yielding areas and the red zone is the lower yielding areas. It appears that the lower yielding zones were in the red zones on the EC maps, whereas the higher yielding cane grew in the green/blue EC zones. To investigate the difference between the two zones, soil samples were taken down the soil profile in 200mm increments down to 1 meter in the red zone. When the green zone was sampled, we found a compaction layer at 600mm which we couldn’t bust through, even with the drill auger! These samples were sent away for laboratory analysis, including a sand/silt/clay percentage.
Figure 1 EC Map of the trial sit, Yield Map of the trial site (blue = higher yielding zone, red = lower yielding zone) and sample sites in red and green zones.
PCGBRF202019 March 2021
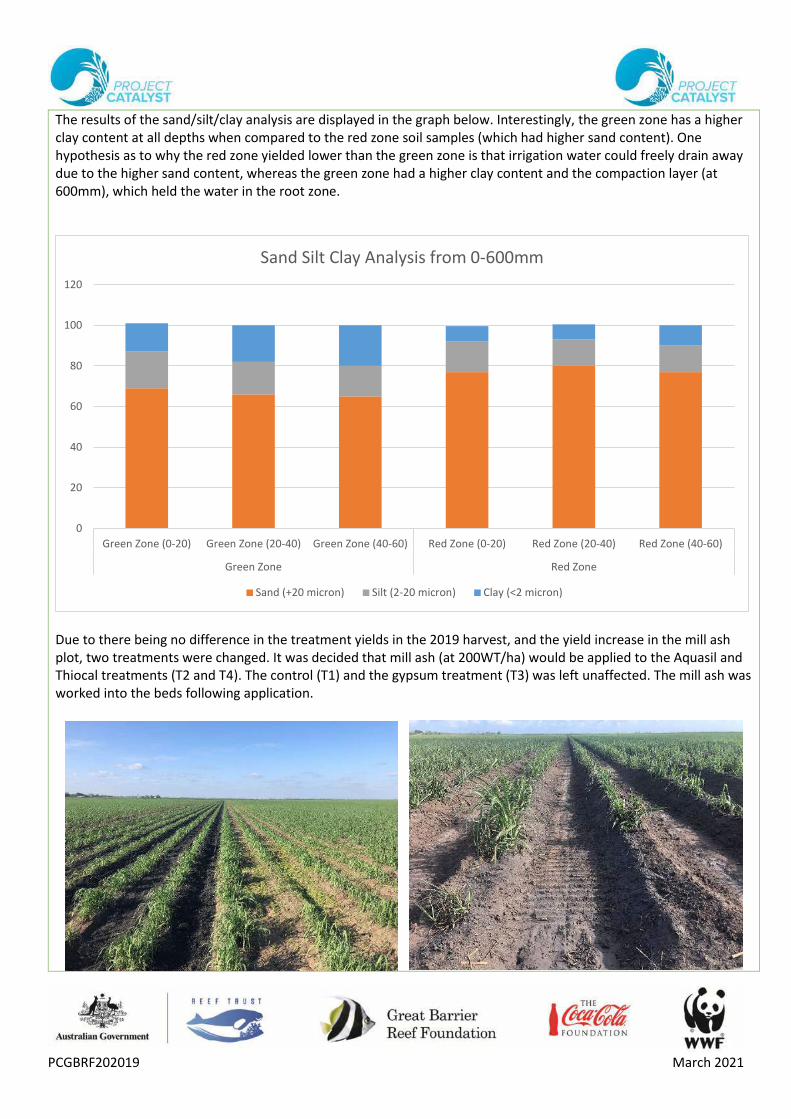
The results of the sand/silt/clay analysis are displayed in the graph below. Interestingly, the green zone has a higher clay content at all depths when compared to the red zone soil samples (which had higher sand content). One hypothesis as to why the red zone yielded lower than the green zone is that irrigation water could freely drain away due to the higher sand content, whereas the green zone had a higher clay content and the compaction layer (at 600mm), which held the water in the root zone.
Due to there being no difference in the treatment yields in the 2019 harvest, and the yield increase in the mill ash plot, two treatments were changed. It was decided that mill ash (at 200WT/ha) would be applied to the Aquasil and Thiocal treatments (T2 and T4). The control (T1) and the gypsum treatment (T3) was left unaffected. The mill ash was worked into the beds following application.
0
20
40
60
80
100
120
Green Zone (0-20) Green Zone (20-40) Green Zone (40-60) Red Zone (0-20) Red Zone (20-40) Red Zone (40-60)
Green Zone Red Zone
Sand Silt Clay Analysis from 0-600mm
Sand (+20 micron) Silt (2-20 micron) Clay (<2 micron)
PCGBRF202019 March 2021
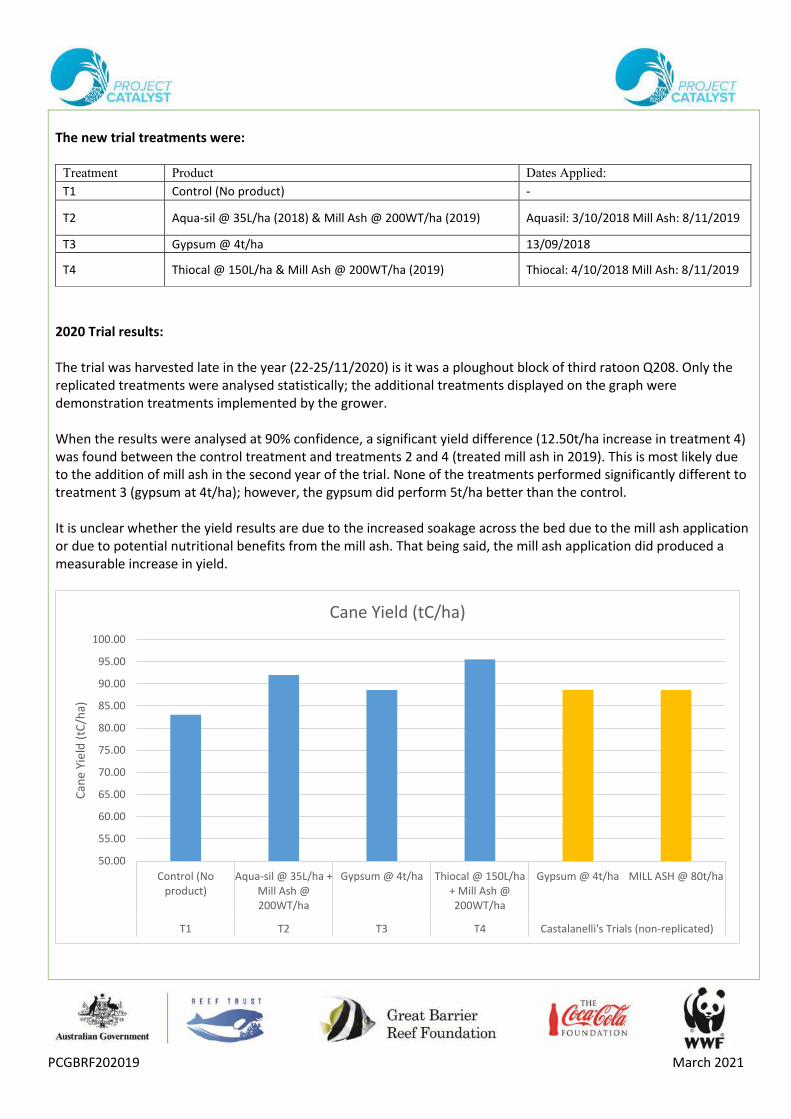
The new trial treatments were:
Treatment Product Dates Applied:
T1 Control (No product) -
T2 Aqua-sil @ 35L/ha (2018) & Mill Ash @ 200WT/ha (2019) Aquasil: 3/10/2018 Mill Ash: 8/11/2019
T3 Gypsum @ 4t/ha 13/09/2018
T4 Thiocal @ 150L/ha & Mill Ash @ 200WT/ha (2019) Thiocal: 4/10/2018 Mill Ash: 8/11/2019
2020 Trial results: The trial was harvested late in the year (22-25/11/2020) is it was a ploughout block of third ratoon Q208. Only the replicated treatments were analysed statistically; the additional treatments displayed on the graph were demonstration treatments implemented by the grower. When the results were analysed at 90% confidence, a significant yield difference (12.50t/ha increase in treatment 4) was found between the control treatment and treatments 2 and 4 (treated mill ash in 2019). This is most likely due to the addition of mill ash in the second year of the trial. None of the treatments performed significantly different to treatment 3 (gypsum at 4t/ha); however, the gypsum did perform 5t/ha better than the control. It is unclear whether the yield results are due to the increased soakage across the bed due to the mill ash application or due to potential nutritional benefits from the mill ash. That being said, the mill ash application did produced a measurable increase in yield.
50.00
55.00
60.00
65.00
70.00
75.00
80.00
85.00
90.00
95.00
100.00
Control (Noproduct)
Aqua-sil @ 35L/ha +Mill Ash @200WT/ha
Gypsum @ 4t/ha Thiocal @ 150L/ha+ Mill Ash @200WT/ha
Gypsum @ 4t/ha MILL ASH @ 80t/ha
T1 T2 T3 T4 Castalanelli's Trials (non-replicated)
Can
e Yi
eld
(tC
/ha)
Cane Yield (tC/ha)
PCGBRF202019 March 2021
Treatment Averages Product Cane Yield (tC/ha)
T1 Control (No product) 83.01 b
T2 Aqua-sil @ 35L/ha + Mill Ash @
200WT/ha 92.01
a
T3 Gypsum @ 4t/ha 88.59 ab
T4 Thiocal @ 150L/ha + Mill Ash @
200WT/ha 95.52
a
Castalanelli's Trials (non-replicated)
Gypsum @ 4t/ha 88.66 -
MILL ASH @ 80t/ha 88.62 -
F Prob (90%) 0.0815
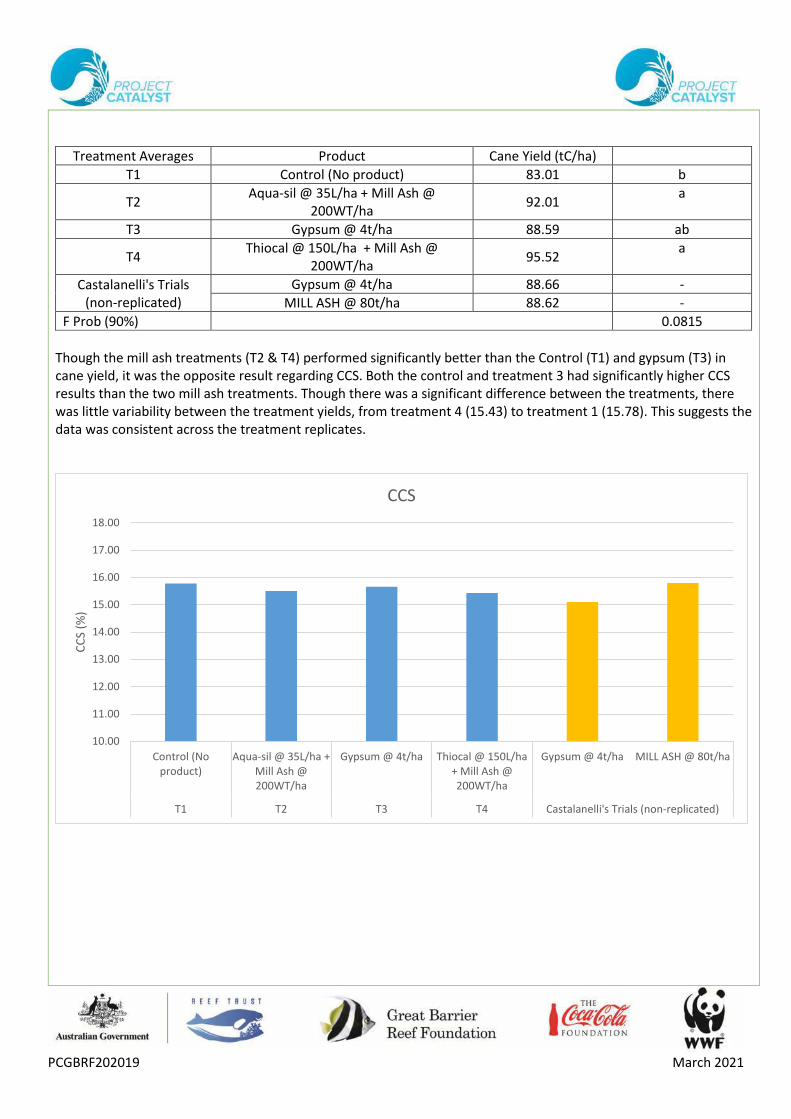
Though the mill ash treatments (T2 & T4) performed significantly better than the Control (T1) and gypsum (T3) in cane yield, it was the opposite result regarding CCS. Both the control and treatment 3 had significantly higher CCS results than the two mill ash treatments. Though there was a significant difference between the treatments, there was little variability between the treatment yields, from treatment 4 (15.43) to treatment 1 (15.78). This suggests the data was consistent across the treatment replicates.
10.00
11.00
12.00
13.00
14.00
15.00
16.00
17.00
18.00
Control (Noproduct)
Aqua-sil @ 35L/ha +Mill Ash @200WT/ha
Gypsum @ 4t/ha Thiocal @ 150L/ha+ Mill Ash @200WT/ha
Gypsum @ 4t/ha MILL ASH @ 80t/ha
T1 T2 T3 T4 Castalanelli's Trials (non-replicated)
CC
S (%
)
CCS
PCGBRF202019 March 2021
Treatment Averages Product CCS
T1 Control (No product) 15.78 a
T2 Aqua-sil @ 35L/ha + Mill Ash @
200WT/ha 15.50
b
T3 Gypsum @ 4t/ha 15.66 a
T4 Thiocal @ 150L/ha + Mill Ash @
200WT/ha 15.43
b
Castalanelli's Trials (non-replicated)
Gypsum @ 4t/ha 15.10 -
MILL ASH @ 80t/ha 15.80 -
F Prob (90%) 0.0370
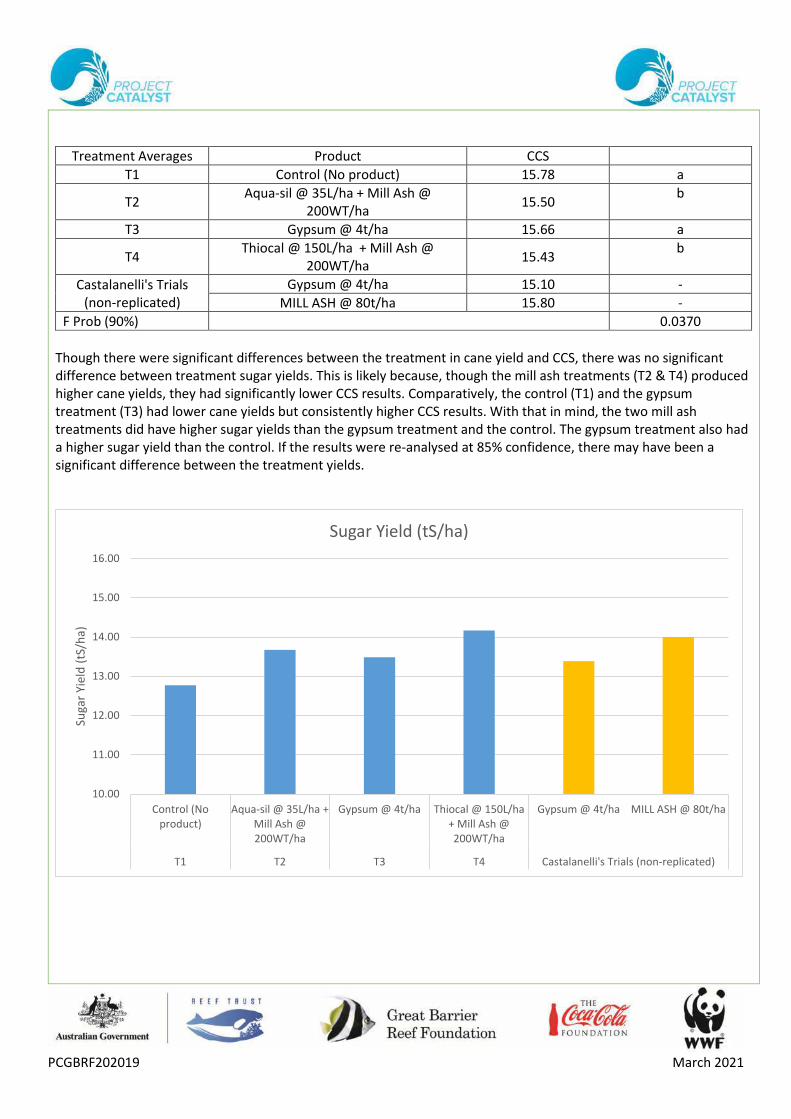
Though there were significant differences between the treatment in cane yield and CCS, there was no significant difference between treatment sugar yields. This is likely because, though the mill ash treatments (T2 & T4) produced higher cane yields, they had significantly lower CCS results. Comparatively, the control (T1) and the gypsum treatment (T3) had lower cane yields but consistently higher CCS results. With that in mind, the two mill ash treatments did have higher sugar yields than the gypsum treatment and the control. The gypsum treatment also had a higher sugar yield than the control. If the results were re-analysed at 85% confidence, there may have been a significant difference between the treatment yields.
10.00
11.00
12.00
13.00
14.00
15.00
16.00
Control (Noproduct)
Aqua-sil @ 35L/ha +Mill Ash @200WT/ha
Gypsum @ 4t/ha Thiocal @ 150L/ha+ Mill Ash @200WT/ha
Gypsum @ 4t/ha MILL ASH @ 80t/ha
T1 T2 T3 T4 Castalanelli's Trials (non-replicated)
Suga
r Yi
eld
(tS
/ha)
Sugar Yield (tS/ha)
PCGBRF202019 March 2021
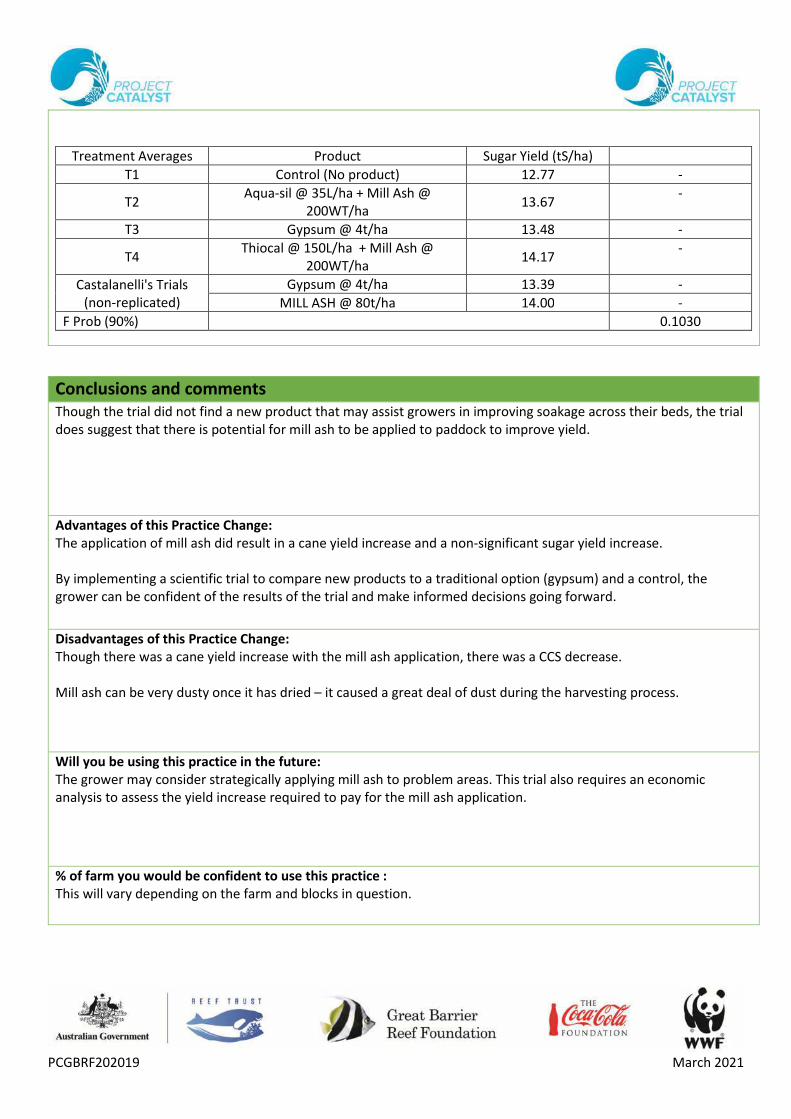
Treatment Averages Product Sugar Yield (tS/ha)
T1 Control (No product) 12.77 -
T2 Aqua-sil @ 35L/ha + Mill Ash @
200WT/ha 13.67
-
T3 Gypsum @ 4t/ha 13.48 -
T4 Thiocal @ 150L/ha + Mill Ash @
200WT/ha 14.17
-
Castalanelli's Trials (non-replicated)
Gypsum @ 4t/ha 13.39 -
MILL ASH @ 80t/ha 14.00 -
F Prob (90%) 0.1030
Conclusions and comments
Though the trial did not find a new product that may assist growers in improving soakage across their beds, the trial does suggest that there is potential for mill ash to be applied to paddock to improve yield.
Advantages of this Practice Change: The application of mill ash did result in a cane yield increase and a non-significant sugar yield increase. By implementing a scientific trial to compare new products to a traditional option (gypsum) and a control, the grower can be confident of the results of the trial and make informed decisions going forward.
Disadvantages of this Practice Change: Though there was a cane yield increase with the mill ash application, there was a CCS decrease. Mill ash can be very dusty once it has dried – it caused a great deal of dust during the harvesting process.
Will you be using this practice in the future: The grower may consider strategically applying mill ash to problem areas. This trial also requires an economic analysis to assess the yield increase required to pay for the mill ash application.
% of farm you would be confident to use this practice : This will vary depending on the farm and blocks in question.