Embed Size (px)
Citation preview
PCGBRF2020117 March 2021
Project Catalyst Trial Report
Sub Surface Applied Mill By-Products
Grower Information Grower Name: Wilmar Sugar
Entity Name: Wilmar Sugar
Trial Farm No/Name:
Sub-surface applied mill by-products trial F# 0848A
Mill Area: Victoria
Total Farm Area ha: 6,600 in total across Herbert, Burdekin, Proserpine and Plain Creek
No. Years Farming: 11 years since becoming Wilmar Sugar in 2010.
Trial Subdistrict: Orient
Area under Cane ha: 1012.15 @ Farm# 0848
PCGBRF2020117 March 2021
Background Information
Aim: This project aims to investigate the use of varying rates of mill mud and ash banded sub-surface into the planting line, and whether transporting the mill by-products is economically viable, when the paddock is outside the traditional mill truck transportation area.
Background: (Rationale for why this might work)
Mill by-products have traditionally been used as an ameliorant to improve soil conditions and as a source of nutritional value. By banding the mill by-products sub-surface into the planting line, the benefits are localised to the growing region of the soil and not lost to run off due to heavy rainfall events. Furthermore, banding the mill by-products means that less is required to be transported. This may reduce costs associated with transporting to areas outside the usual region of transportation by the mill trucks.
Potential Water Quality Benefit: Banding mill by-products sub-surface reduces the risk of loss to run off to the Great Barrier Reef. This is particularly important regarding phosphorous.
Expected Outcome of Trial: That the varying rates of mill by-products will have a positive impact on productivity. Though the rates in this trial are much lower than the commercially applied rates, banding will localise the benefits to the stool and reduce total volume of product required, predicted to reduce overall costs.
Service provider contact: Megan Zahmel 0447 317 102
Where did this idea come from: Wilmar/ Peter Larsen
PCGBRF2020117 March 2021
Plan - Project Activities
Date: (mth/year to be
undertaken) Activities :(breakdown of each activity for each stage)
Stage 1 Establish trial Baseline soil nutrient samples – 1st of Dec 2015 Application of Mud and Ash – Dec 2015 Flumes set up to monitor water runoff quality. - 5th Jan 2016 Nutrient soil samples after mud application – 4th May 2016 Planted May 2016
Stage 2 Sampling 2017 Stalk counts and biomass - 10th Nov 2016 - 16th Feb 2017
Water runoff data collected – 26/01/2016 – 23/03/2017 Final Harvest results for 2017 – completed see attached results
Stage 3 Sampling 2018 Final Harvest results – Oct 2018 Soil samples - Nov 2018
Stage 4 Sampling 2019 Final Harvest and CCS results – 11th of September 2019
Stage 5
Stage 6
Project Trial site details
Trial Crop: Sugarcane
Variety: Rat/Plt:
Plant Q208 2016
Trial Block No/Name:
B# 1-2 F# 0848A Mill By-product sub-surface applied
Trial Block Size Ha: 22.3 ha
Trial Block Position (GPS):
Refer to google earth map
Soil Type: shallow loam overlying a sodic clay
PCGBRF2020117 March 2021
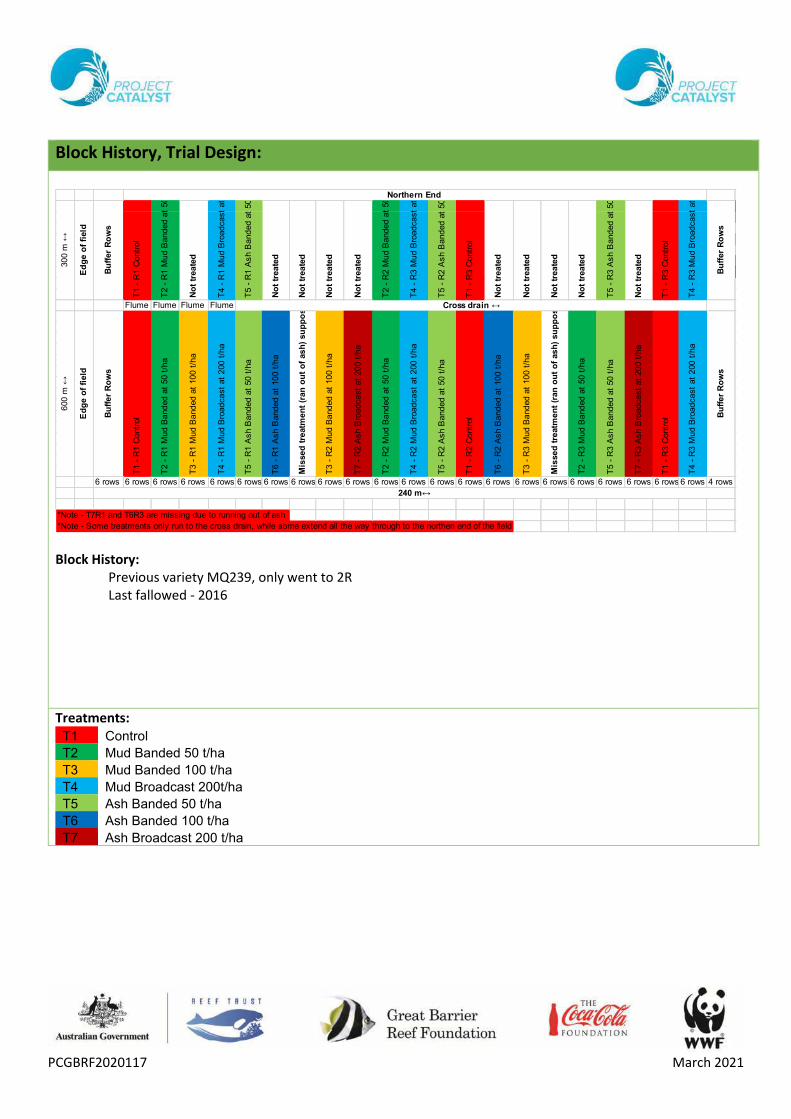
Block History, Trial Design:
Block History: Previous variety MQ239, only went to 2R Last fallowed - 2016
Treatments: T1 Control T2 Mud Banded 50 t/ha
T3 Mud Banded 100 t/ha
T4 Mud Broadcast 200t/ha
T5 Ash Banded 50 t/ha
T6 Ash Banded 100 t/ha
T7 Ash Broadcast 200 t/ha
Flume Flume Flume Flume
6 rows 6 rows 6 rows 6 rows 6 rows 6 rows 6 rows 6 rows 6 rows 6 rows 6 rows 6 rows 6 rows 6 rows 6 rows 6 rows 6 rows 6 rows 6 rows 6 rows 6 rows 6 rows 4 rows
*Note - T7R1 and T6R3 are missing due to running out of ash
*Note - Some treatments only run to the cross drain, while some extend all the way through to the northen end of the field
Northern End
240 m↔
Ed
ge o
f fi
eld
30
0 m
↔
T5 -
R3 A
sh B
and
ed
at
50
t/h
a
No
t tr
ea
ted
T1 -
R3 C
ontr
ol
T4 -
R3 M
ud B
road
ca
st
at
200
t/h
a
No
t tr
ea
ted
T2 -
R2 M
ud B
and
ed
at
50
t/h
a
T4 -
R3 M
ud B
road
ca
st
at
200
t/h
a
Bu
ffer
Ro
ws
Bu
ffer
Ro
ws
T5 -
R2 A
sh B
and
ed
at
50
t/h
a
T1 -
R3 C
ontr
ol
No
t tr
ea
ted
No
t tr
ea
ted
No
t tr
ea
ted
No
t tr
ea
ted
No
t tr
ea
ted
No
t tr
ea
ted
600
m ↔
Cross drain ↔
T1 -
R1 C
ontr
ol
T2 -
R1 M
ud B
and
ed
at
50
t/h
a
No
t tr
ea
ted
T4 -
R1 M
ud B
road
ca
st
at
200
t/h
a
T5 -
R1 A
sh B
and
ed
at
50
t/h
a
No
t tr
ea
ted
T3 -
R3 M
ud B
and
ed
at
10
0 t
/ha
T5 -
R3 A
sh B
and
ed
at
50
t/h
a
T7 -
R2 A
sh B
road
ca
st
at
20
0 t
/ha
T2 -
R2 M
ud B
and
ed
at
50
t/h
a
T4 -
R2 M
ud B
road
ca
st
at
200
t/h
a
T5 -
R2 A
sh B
and
ed
at
50
t/h
a
T1 -
R2 C
ontr
ol
T6 -
R2 A
sh B
and
ed
at
10
0 t
/ha
T5 -
R1 A
sh B
and
ed
at
50
t/h
a
T6 -
R1 A
sh B
and
ed
at
10
0 t
/ha
Mis
se
d t
reatm
en
t (r
an
ou
t o
f as
h)
su
pp
ose
d t
o b
e T
7R
1
T3 -
R2 M
ud B
and
ed
at
10
0 t
/ha
T2 -
R3 M
ud B
and
ed
at
50
t/h
a
Mis
se
d t
reatm
en
t (r
an
ou
t o
f as
h)
su
pp
ose
d t
o b
e T
6R
3
Bu
ffe
r R
ow
s
Bu
ffe
r R
ow
s
Ed
ge o
f fi
eld
T7 -
R3 A
sh B
road
ca
st
at
20
0 t
/ha
T1 -
R3 C
ontr
ol
T4 -
R3 M
ud B
road
ca
st
at
200
t/h
a
T1 -
R1 C
ontr
ol
T2 -
R1 M
ud B
and
ed
at
50
t/h
a
T3 -
R1 M
ud B
and
ed
at
10
0 t
/ha
T4 -
R1 M
ud B
road
ca
st
at
200
t/h
a
PCGBRF2020117 March 2021
Results:
Google Earth reference Map
2017 Season Results
PCGBRF2020117 March 2021
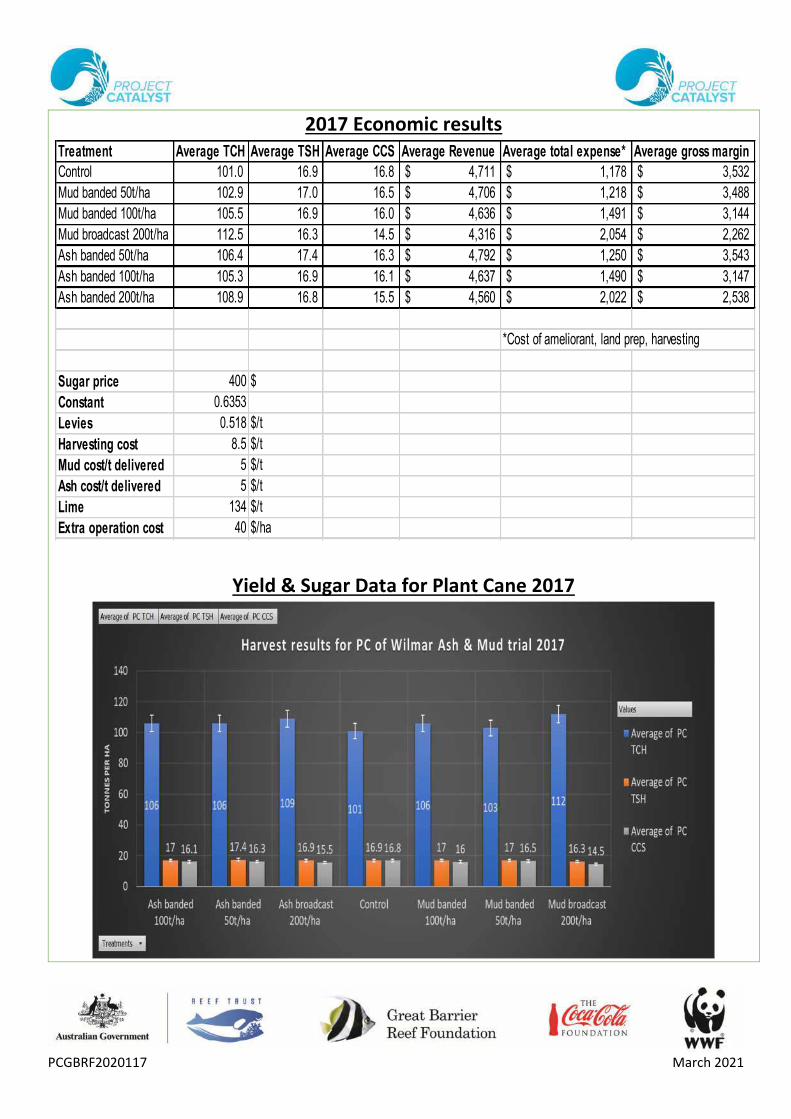
2017 Economic results
Yield & Sugar Data for Plant Cane 2017
Treatment Average TCH Average TSH Average CCS Average Revenue Average total expense* Average gross margin
Control 101.0 16.9 16.8 4,711$ 1,178$ 3,532$
Mud banded 50t/ha 102.9 17.0 16.5 4,706$ 1,218$ 3,488$
Mud banded 100t/ha 105.5 16.9 16.0 4,636$ 1,491$ 3,144$
Mud broadcast 200t/ha 112.5 16.3 14.5 4,316$ 2,054$ 2,262$
Ash banded 50t/ha 106.4 17.4 16.3 4,792$ 1,250$ 3,543$
Ash banded 100t/ha 105.3 16.9 16.1 4,637$ 1,490$ 3,147$
Ash banded 200t/ha 108.9 16.8 15.5 4,560$ 2,022$ 2,538$
*Cost of ameliorant, land prep, harvesting
Sugar price 400 $
Constant 0.6353
Levies 0.518 $/t
Harvesting cost 8.5 $/t
Mud cost/t delivered 5 $/t
Ash cost/t delivered 5 $/t
Lime 134 $/t
Extra operation cost 40 $/ha
PCGBRF2020117 March 2021
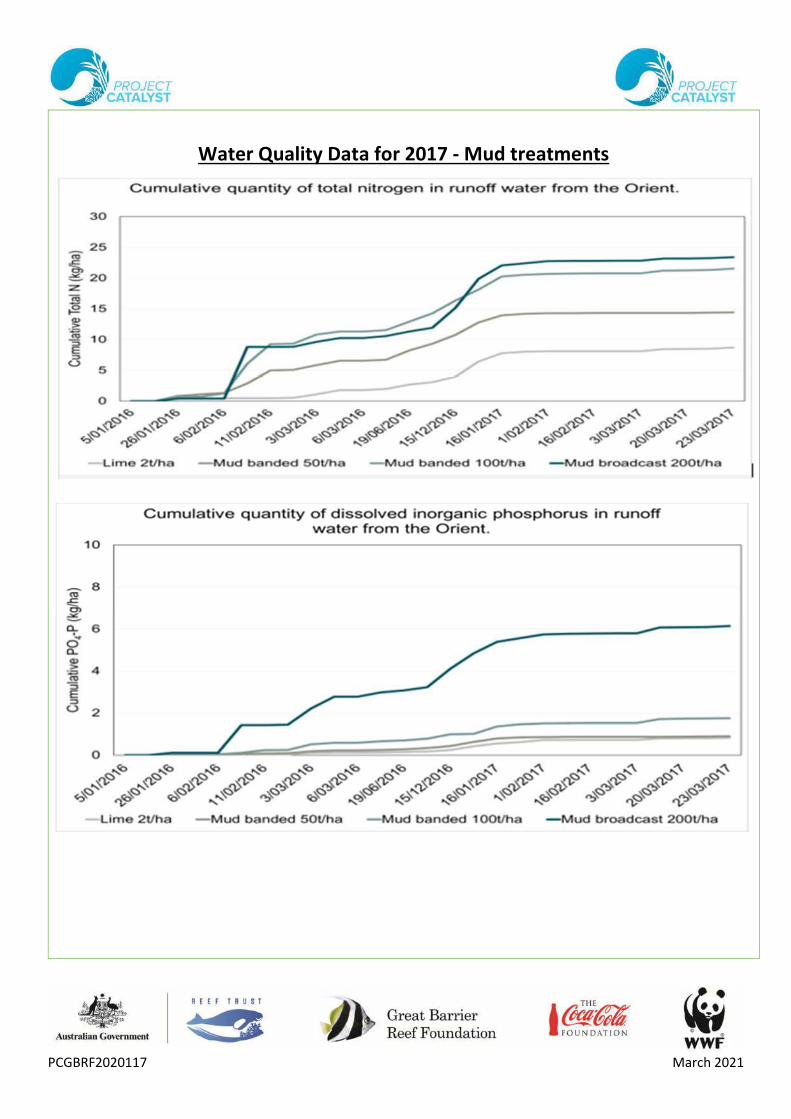
Water Quality Data for 2017 - Mud treatments
PCGBRF2020117 March 2021
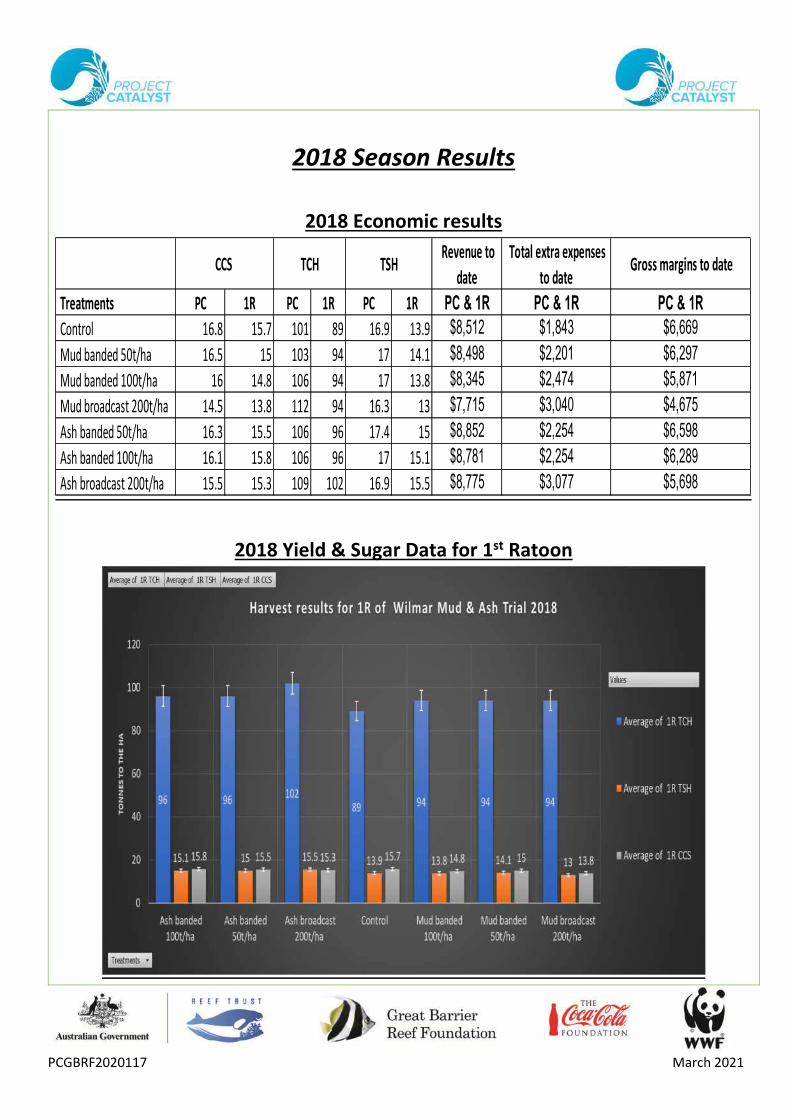
2018 Season Results
2018 Economic results
2018 Yield & Sugar Data for 1st Ratoon
Revenue to
date
Total extra expenses
to date Gross margins to date
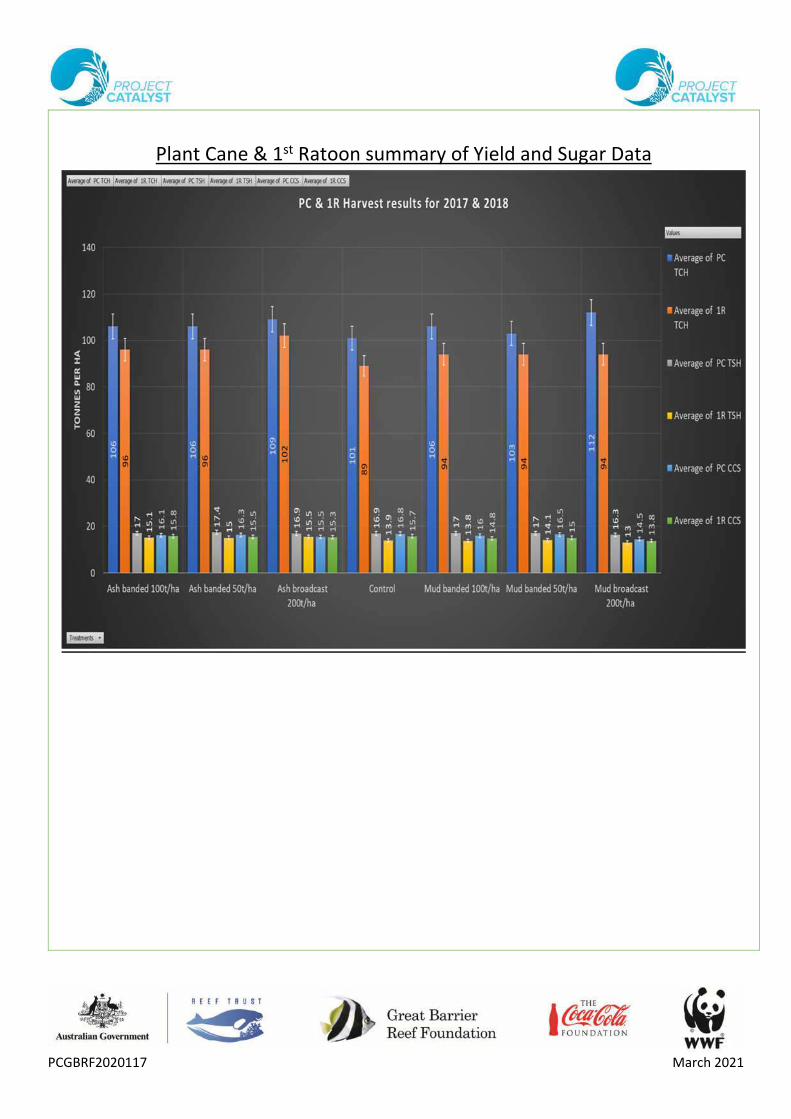
Treatments PC 1R PC 1R PC 1R PC & 1R PC & 1R PC & 1R
Control 16.8 15.7 101 89 16.9 13.9 $8,512 $1,843 $6,669
Mud banded 50t/ha 16.5 15 103 94 17 14.1 $8,498 $2,201 $6,297
Mud banded 100t/ha 16 14.8 106 94 17 13.8 $8,345 $2,474 $5,871
Mud broadcast 200t/ha 14.5 13.8 112 94 16.3 13 $7,715 $3,040 $4,675
Ash banded 50t/ha 16.3 15.5 106 96 17.4 15 $8,852 $2,254 $6,598
Ash banded 100t/ha 16.1 15.8 106 96 17 15.1 $8,781 $2,254 $6,289
Ash broadcast 200t/ha 15.5 15.3 109 102 16.9 15.5 $8,775 $3,077 $5,698
CCS TCH TSH
PCGBRF2020117 March 2021
Plant Cane & 1st Ratoon summary of Yield and Sugar Data
PCGBRF2020117 March 2021
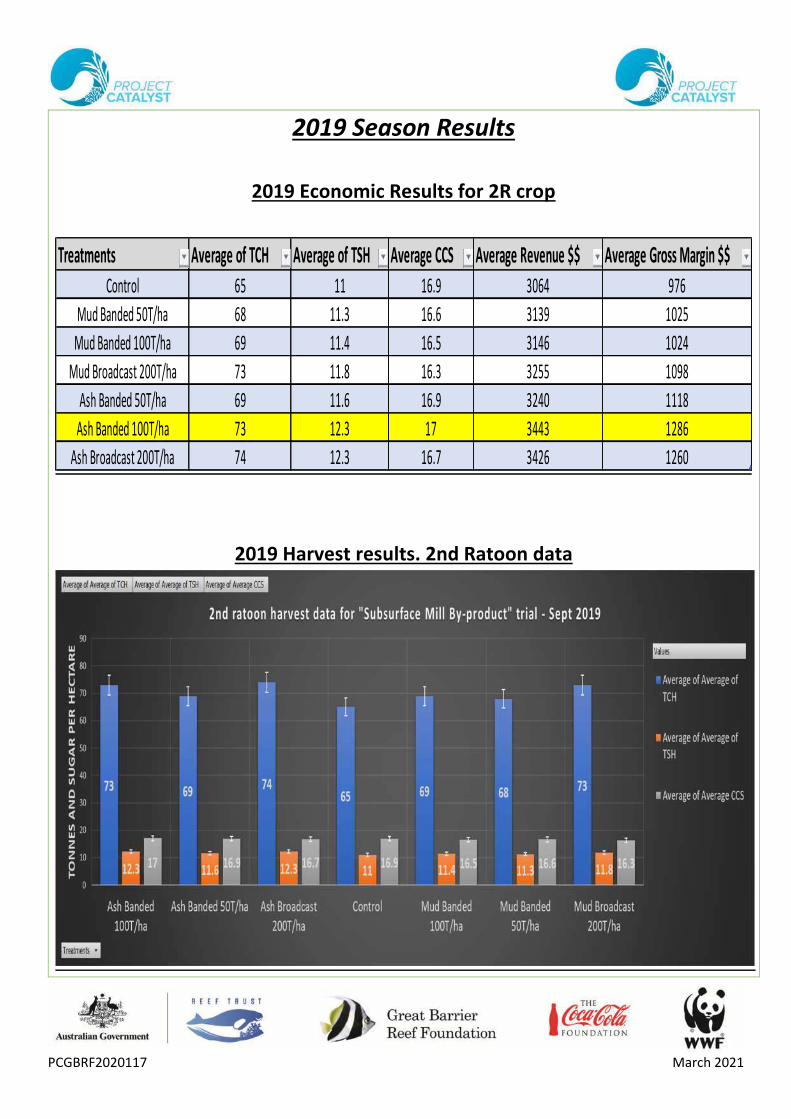
2019 Season Results
2019 Economic Results for 2R crop
2019 Harvest results. 2nd Ratoon data
Treatments Average of TCH Average of TSH Average CCS Average Revenue $$ Average Gross Margin $$Control 65 11 16.9 3064 976
Mud Banded 50T/ha 68 11.3 16.6 3139 1025
Mud Banded 100T/ha 69 11.4 16.5 3146 1024
Mud Broadcast 200T/ha 73 11.8 16.3 3255 1098
Ash Banded 50T/ha 69 11.6 16.9 3240 1118
Ash Banded 100T/ha 73 12.3 17 3443 1286
Ash Broadcast 200T/ha 74 12.3 16.7 3426 1260
PCGBRF2020117 March 2021
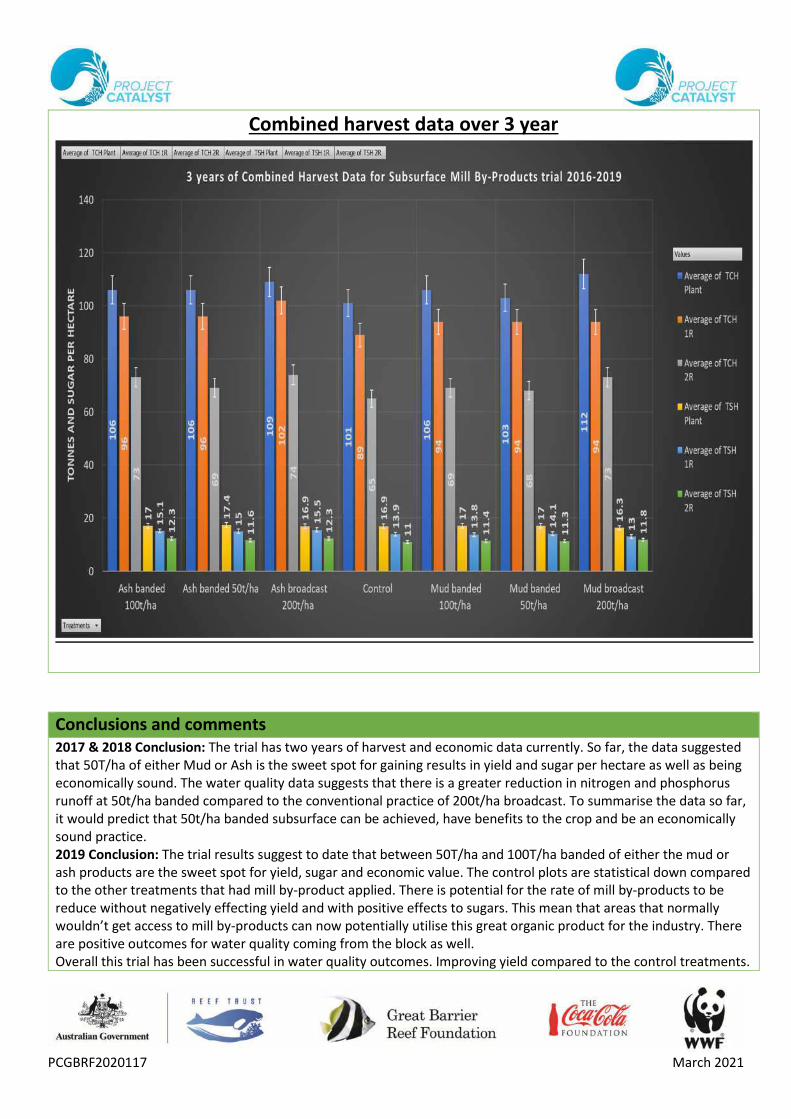
Combined harvest data over 3 year
Conclusions and comments
2017 & 2018 Conclusion: The trial has two years of harvest and economic data currently. So far, the data suggested that 50T/ha of either Mud or Ash is the sweet spot for gaining results in yield and sugar per hectare as well as being economically sound. The water quality data suggests that there is a greater reduction in nitrogen and phosphorus runoff at 50t/ha banded compared to the conventional practice of 200t/ha broadcast. To summarise the data so far, it would predict that 50t/ha banded subsurface can be achieved, have benefits to the crop and be an economically sound practice. 2019 Conclusion: The trial results suggest to date that between 50T/ha and 100T/ha banded of either the mud or ash products are the sweet spot for yield, sugar and economic value. The control plots are statistical down compared to the other treatments that had mill by-product applied. There is potential for the rate of mill by-products to be reduce without negatively effecting yield and with positive effects to sugars. This mean that areas that normally wouldn’t get access to mill by-products can now potentially utilise this great organic product for the industry. There are positive outcomes for water quality coming from the block as well. Overall this trial has been successful in water quality outcomes. Improving yield compared to the control treatments.
PCGBRF2020117 March 2021
Improving sugar with lower rates of product. Also transport cost of mill by-products can be reduced and even get mill by-products farther around the district, not just zones around the mill area due to transport costs.
Advantages of this Practice Change: Banding mill by-products via sub-surface application reduces the rate that it is applied, reducing the amount of nitrogen and phosphorous applied to the paddock, thus reducing the amount of these nutrients that may leave the farm in run off. This is especially important considering the proximity of the Herbert river catchment to the Great Barrier Reef. Traditionally, only growers that are close to the mill can afford mill by-product applications due the high rate that it is applied and the wet weight of the product. By banding mill by-products subsurface into the planting line, rates can be reduced. This may increase the number of growers that will be able to afford mill by-product applications. Disadvantages of this Practice Change: There still needs to be more work done on applying the product subsurface. There were initial issues with getting the mud and ash deep enough into the soil.
Will you be using this practice in the future? Yes, but refining the application equipment still needs on going work.
% of farm you would be confident to use this practice: The Orient farm in the Herbert region has taken to using mill by-product on the plant block. Due to sodic soil issues, this is still a hard area to farm, but with the use of mill by-products, Wilmar are hoping to get longer ratoon life for the cane cycles.