Embed Size (px)
Citation preview

Project Canary: A Performance Monitor for Solaris and Linux
Sean MeighanManager, ITSM EngineeringSun Microsystems, Inc.

Sun Confidential: Need to know Page 2
Project Canary
• Project Canary is made of two parts:>Canary Monitor
– Performance– Trend Analysis– Capacity Planning
>Canary Load Test– Creates Repeatable Load– Allows Easy Comparisons
• Both tools have the same design> Tools do not need root to run or install> Runs on Linux and Solaris, both SPARC and x86
Project Canary
Sun Confidential: Need to know Page 3
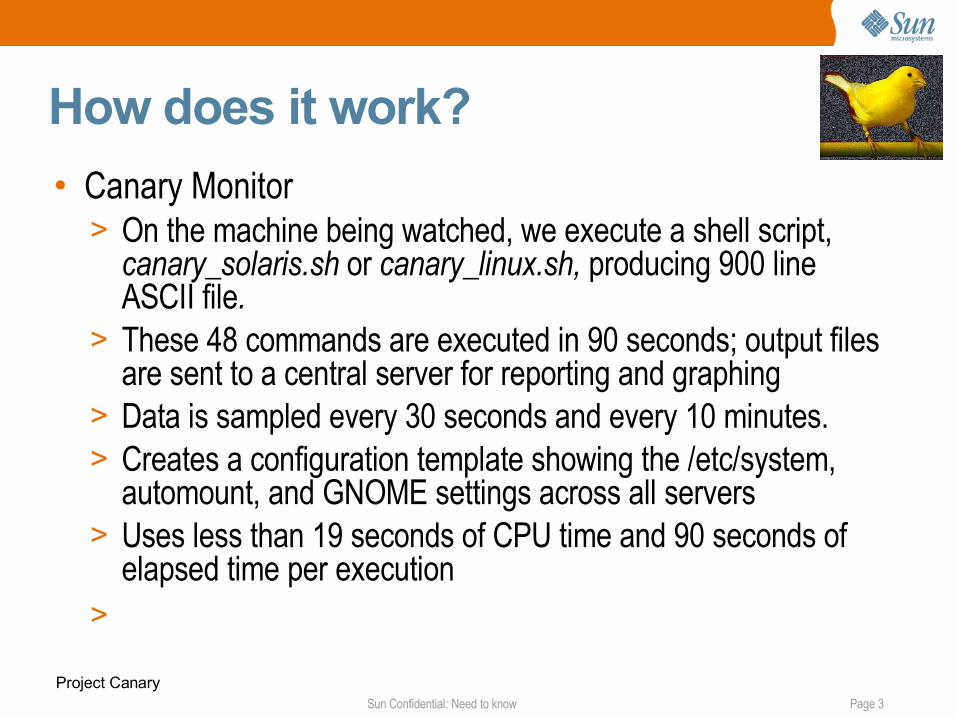
How does it work?
• Canary Monitor> On the machine being watched, we execute a shell script,
canary_solaris.sh or canary_linux.sh, producing 900 line ASCII file.
> These 48 commands are executed in 90 seconds; output files are sent to a central server for reporting and graphing
> Data is sampled every 30 seconds and every 10 minutes.> Creates a configuration template showing the /etc/system,
automount, and GNOME settings across all servers> Uses less than 19 seconds of CPU time and 90 seconds of
elapsed time per execution>
Project Canary

Sun Confidential: Need to know Page 4
How does it work? (cont)
Project Canary
Operating System Canary Client Canary Server NotesSolaris 2.6 Yes No Gnuplot binaries are compiled for Solaris 8Solaris 7 Not Tested No Gnuplot binaries are compiled for Solaris 8Solaris 8 Yes YesTrusted Solaris 8 Yes YesSolaris 9 Yes YesSolaris 10, Global Zone Yes YesSolaris 10, Local Zone Partial Yes Only sees Local Zone SuSE Linux 2.4 Yes YesSuSE Linux 2.6 Yes YesRed Hat Linux Yes Yes
Project Canary supports most common Solaris and Linux environments

Sun Confidential: Need to know Page 5
Project Canary

Sun Confidential: Need to know Page 6
Dashboard
• 20 graphs per server created every 10 minutes.
• Show network traffic, CPU load, memory, application profiles.
• Shows runaways, unusual data patterns.
Project Canary
TCP Traffic CPU LoadRunawayProcess
Strange Traffic

Sun Confidential: Need to know Page 7
Dashboard: More root causesfound
Project Canary
We sample %SYS, %USR, runq every 30seconds: %SYS increased by 20% every10 minutes. Runq increased by over 60every 10 minutes. Suspect: automountd
Avg and Max ping time indicateda bad network for four days. Pingtime tripled.
Sun Confidential: Need to know Page 8
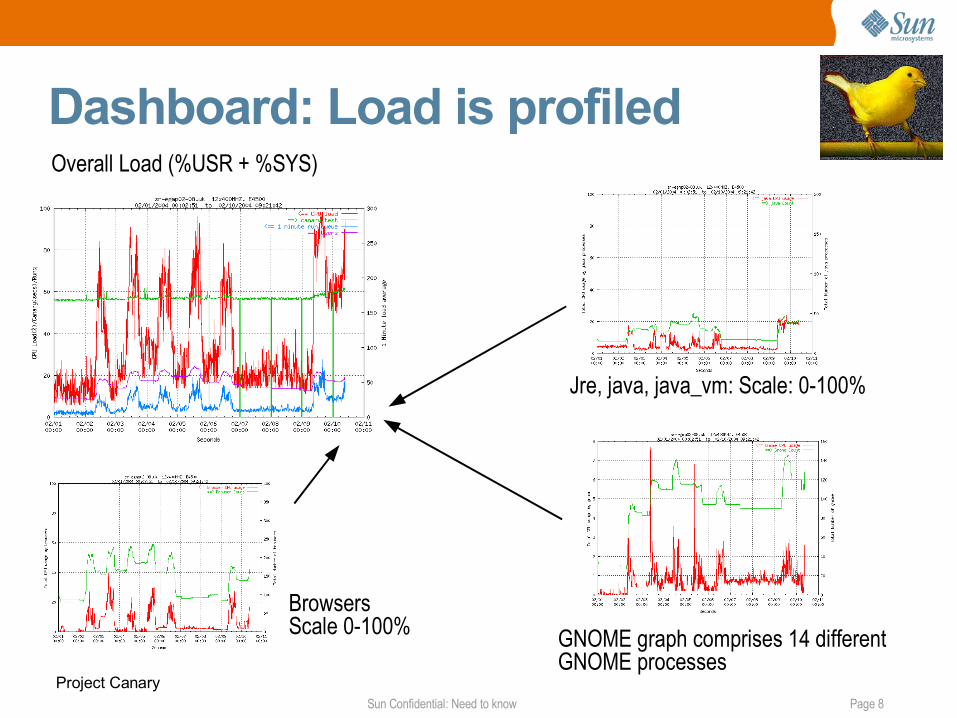
Dashboard: Load is profiled
Project Canary
Overall Load (%USR + %SYS)
BrowsersScale 0-100%
Jre, java, java_vm: Scale: 0-100%
GNOME graph comprises 14 differentGNOME processes

Sun Confidential: Need to know Page 9
Reports: Summary
Project Canary

Sun Confidential: Need to know Page 10
Reports: DTU Activity ,summary
Project Canary

Sun Confidential: Need to know Page 11
Reports: DTU Activity ,details
Project Canary

Sun Confidential: Need to know Page 12
Reports: DTU Map
Project Canary
Sun Confidential: Need to know Page 13
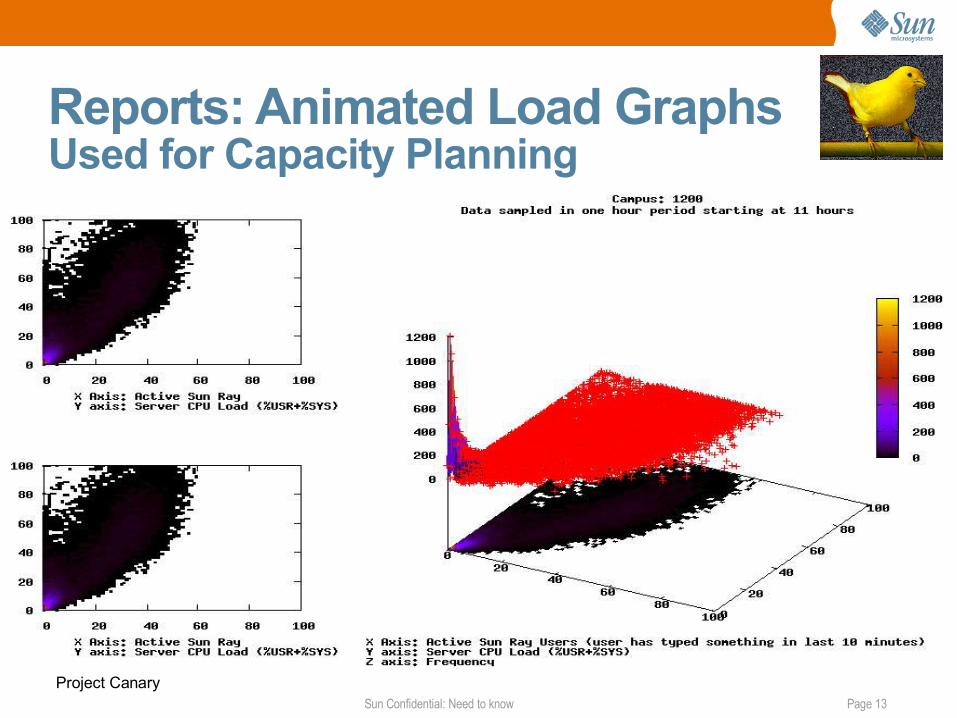
Reports: Animated Load GraphsUsed for Capacity Planning
Project Canary

Sun Confidential: Need to know Page 14
Reports: Apps Histograms
Project Canary

Sun Confidential: Need to know Page 15
Reports: Apps Histograms
• Click on 'GO' for firefox
Project Canary

Sun Confidential: Need to know Page 16
Reports: Apps Heat Map
Project Canary

Sun Confidential: Need to know Page 17
Canary Load Test: More Information
●http://canary.sfbay Canary web site. ●Canary Monitor Authors:●Wayne Chan, Karen Chau, Gabriel Bolano, ●Patrick Humphreys, Andreas Haupt, Sean Meighan●
●
●To get copy of Canary Monitor●http://itsm-eng.sfbay/canary/download/sparc_canary.tar.gz
Project Canary