Embed Size (px)
Citation preview
What Linux can learn from
Solaris performanceand vice-versa
Lead Performance Engineer
Brendan Gregg
@brendangreggSCaLE12xFebruary, 2014
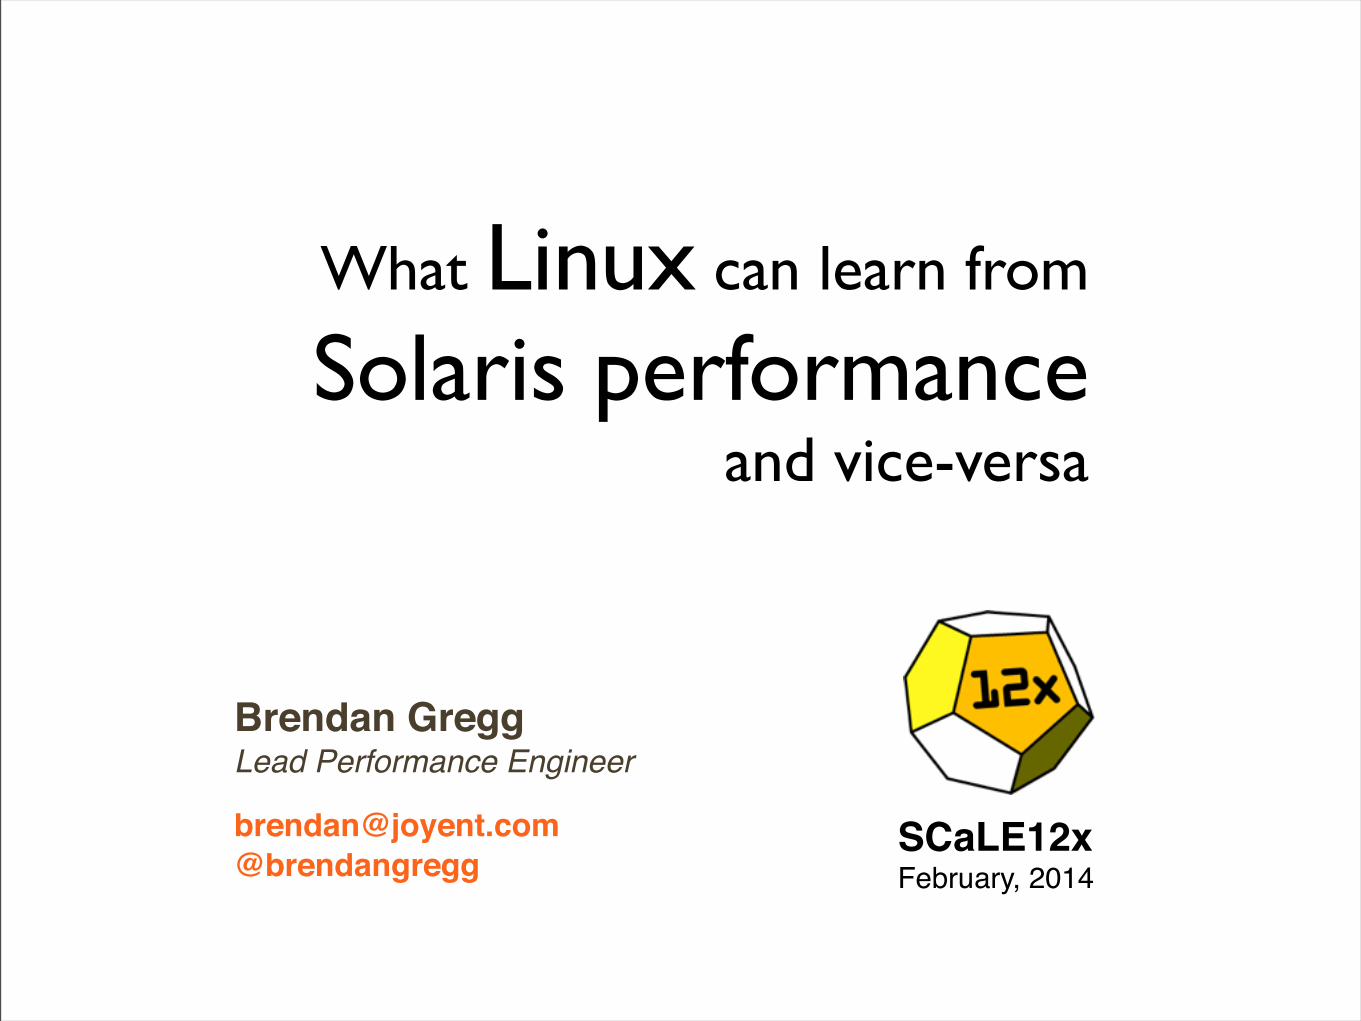
Linux vs Solaris Performance Differences
Applications
Block Device Interface EthernetVolume Managers IP
File Systems TCP/UDPVFS Sockets
System Libraries
Device Drivers
Scheduler
VirtualMemory
System Call Interface
Virtualization
ZFS
DynTicksRCU
SLUB
I/OScheduler
Overcommit& OOM Killer
Lazy TLB
likel
y()/u
nlik
ely(
)C
ON
FIG
urab
le
btrfs
Zones
Mature fullypreemptive
MPSS
CPU
sca
labi
lity
FireEngineCrossbow
Processswapping
KVM More device drivers
Up-to-datepackages
DTrace libumem futexMicrostateAccounting
Symbols
whoami
• Lead Performance Engineer at Joyent
• Work on Linux and SmartOS performance
• Work/Research: tools, visualizations, methodologies
• Did kernel engineering at Sun Microsystems; worked on DTrace and ZFS
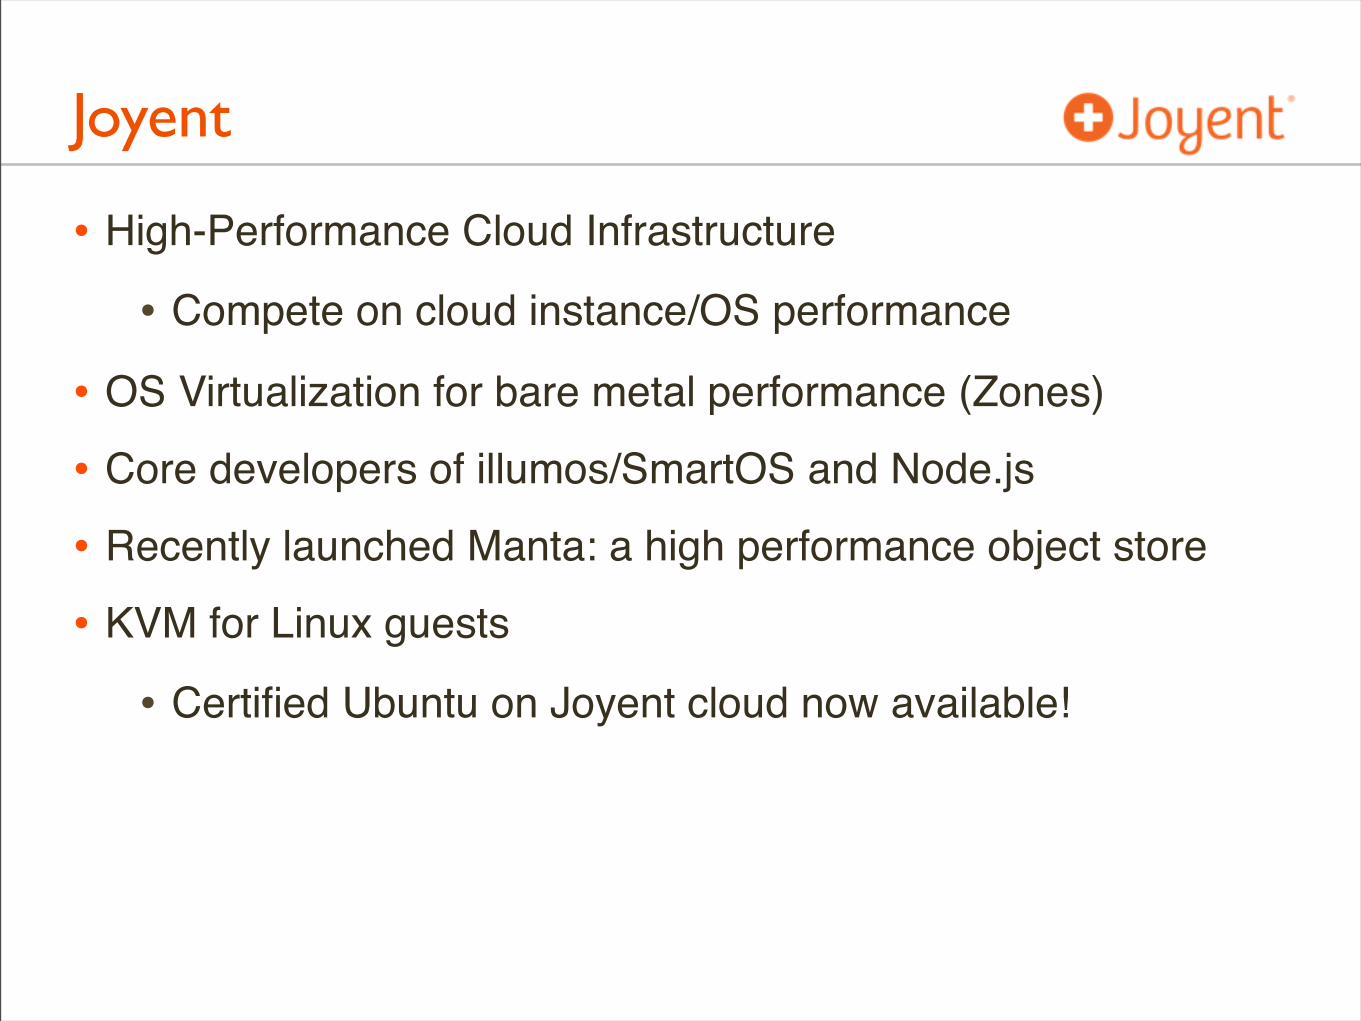
Joyent
• High-Performance Cloud Infrastructure
• Compete on cloud instance/OS performance
• OS Virtualization for bare metal performance (Zones)
• Core developers of illumos/SmartOS and Node.js
• Recently launched Manta: a high performance object store
• KVM for Linux guests
• Certified Ubuntu on Joyent cloud now available!
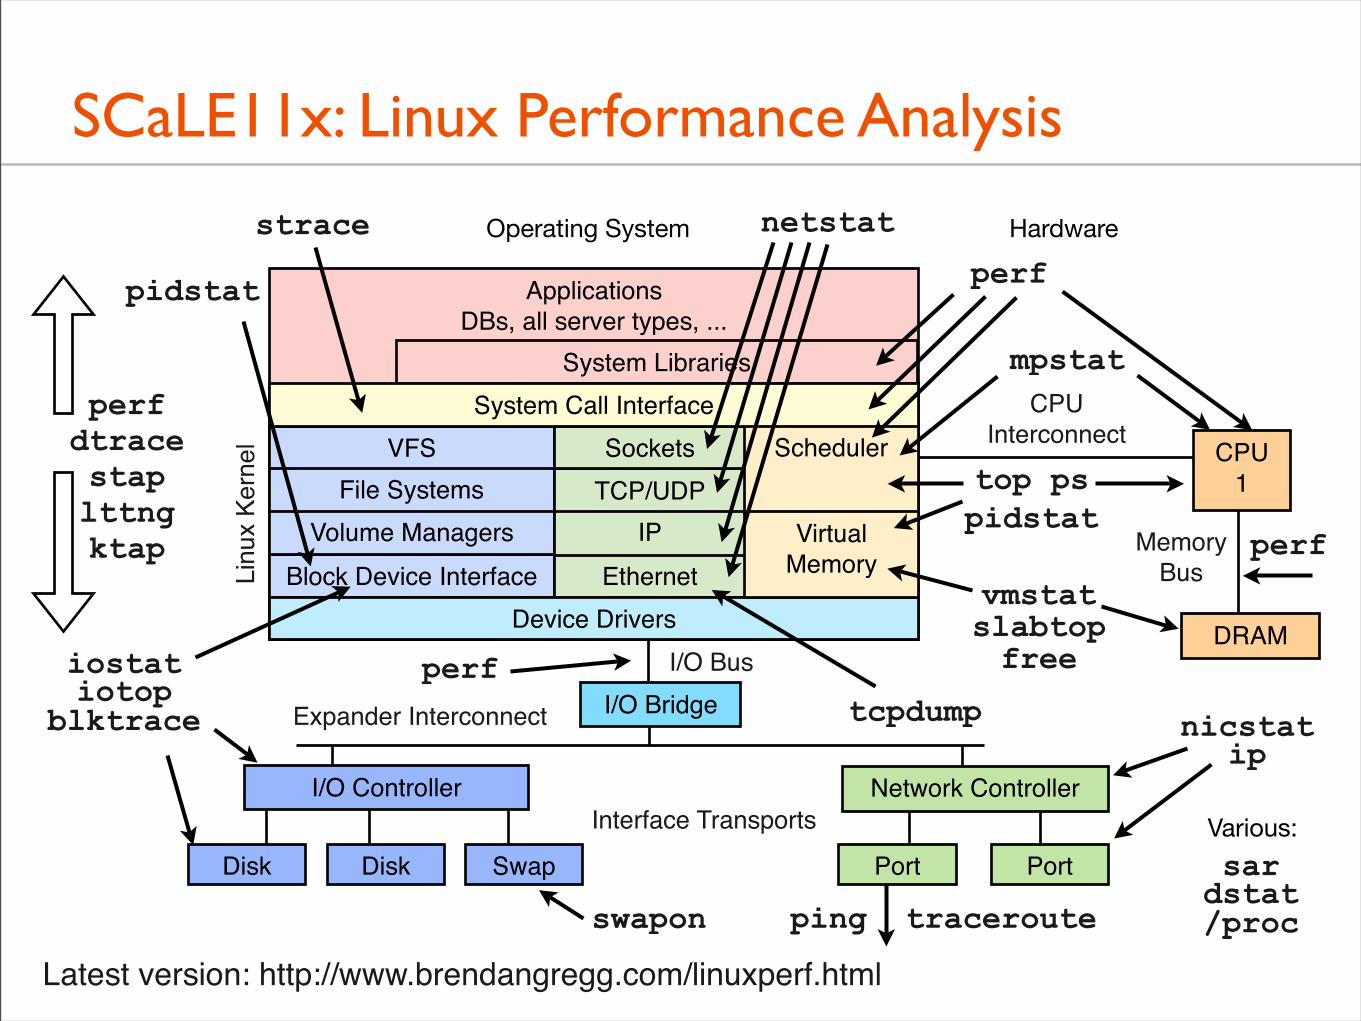
SCaLE11x: Linux Performance Analysis
sardstat/proc
Various:
ApplicationsDBs, all server types, ...
Block Device Interface EthernetVolume Managers IP
File Systems TCP/UDPVFS Sockets
Disk Disk Port Port
Expander Interconnect
I/O Bus
Interface TransportsNetwork Controller
I/O Bridge
System Libraries
Device Drivers
Scheduler
VirtualMemory
System Call Interface CPUInterconnect
MemoryBus
CPU1
DRAM
Operating System Hardwarestrace
iostatiotop
blktrace
vmstatslabtopfree
top pspidstat
tcpdump
netstat
perfdtracestaplttngktap
perf
mpstat
pidstat
ping traceroute
perf
perf
nicstatip
Swap
I/O Controller
swapon
Linu
x Ke
rnel
Latest version: http://www.brendangregg.com/linuxperf.html
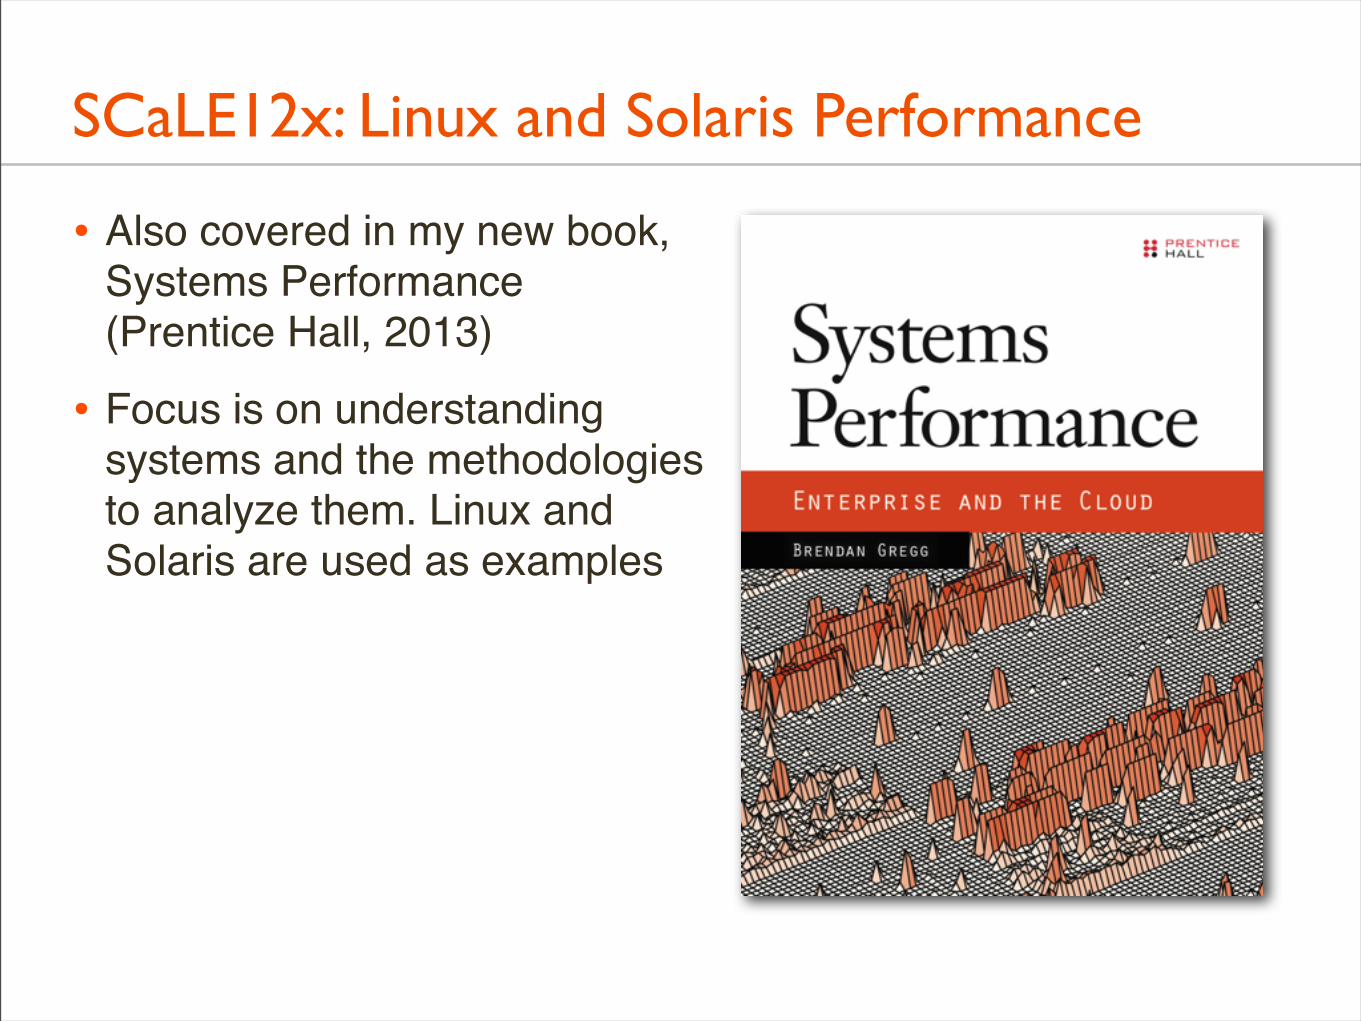
SCaLE12x: Linux and Solaris Performance
• Also covered in my new book,Systems Performance(Prentice Hall, 2013)
• Focus is on understandingsystems and the methodologiesto analyze them. Linux andSolaris are used as examples
Agenda
• Why systems differ
• Specific differences
• What Solaris could learn from Linux
• What Linux could learn from Solaris
• What both can learn
• Results
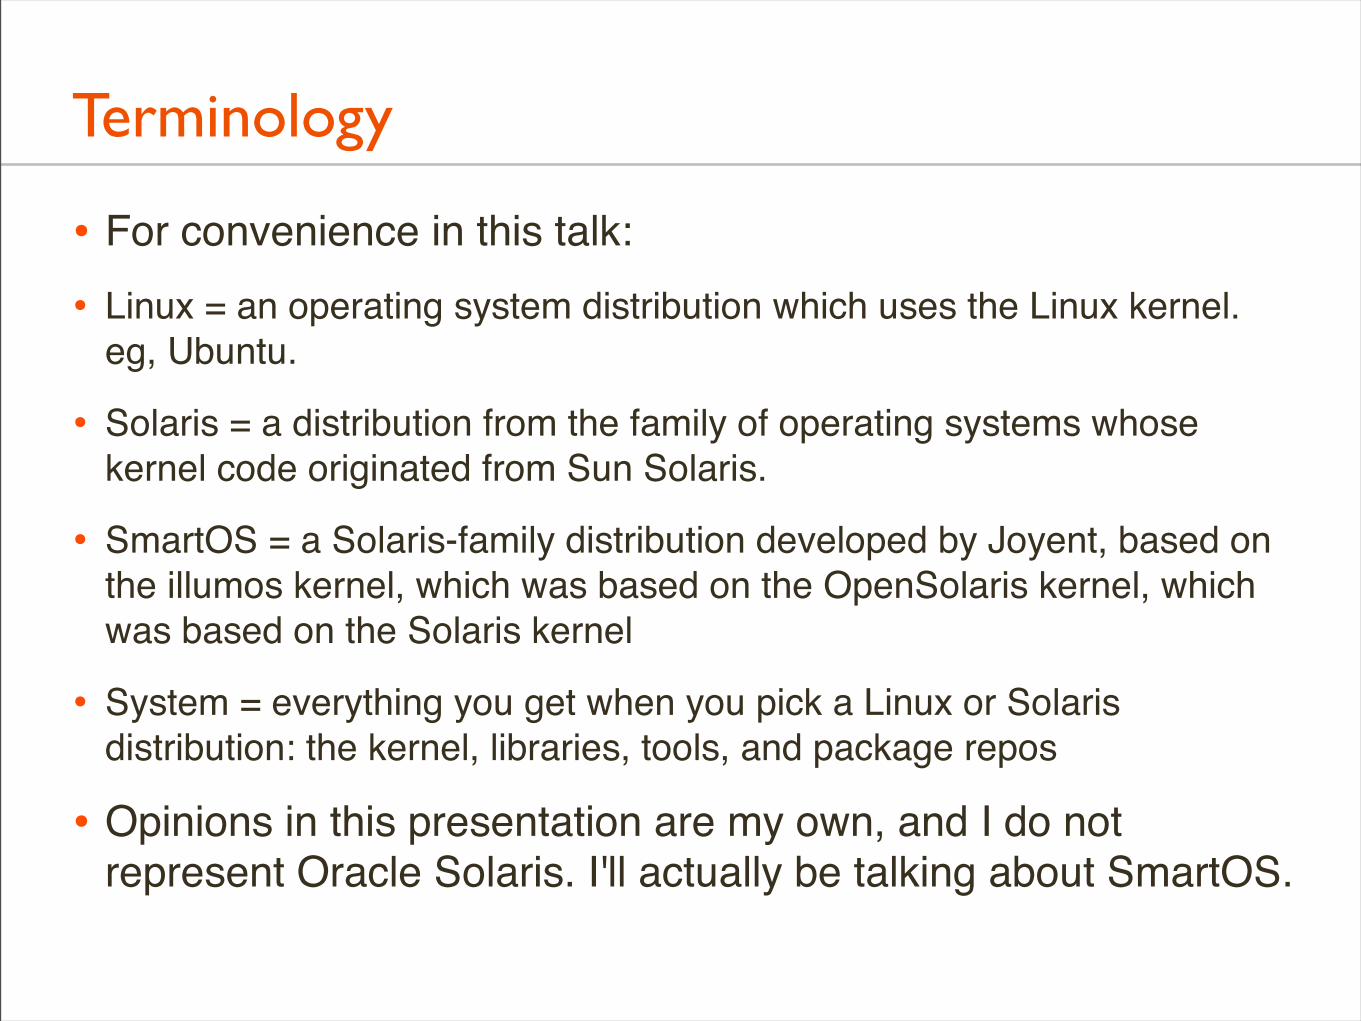
Terminology
• For convenience in this talk:
• Linux = an operating system distribution which uses the Linux kernel. eg, Ubuntu.
• Solaris = a distribution from the family of operating systems whose kernel code originated from Sun Solaris.
• SmartOS = a Solaris-family distribution developed by Joyent, based on the illumos kernel, which was based on the OpenSolaris kernel, which was based on the Solaris kernel
• System = everything you get when you pick a Linux or Solaris distribution: the kernel, libraries, tools, and package repos
• Opinions in this presentation are my own, and I do not represent Oracle Solaris. I'll actually be talking about SmartOS.
Why Systems Differ
Why Systems Differ
• Does the system even matter?
• Will your application perform the same on Linux and Solaris?
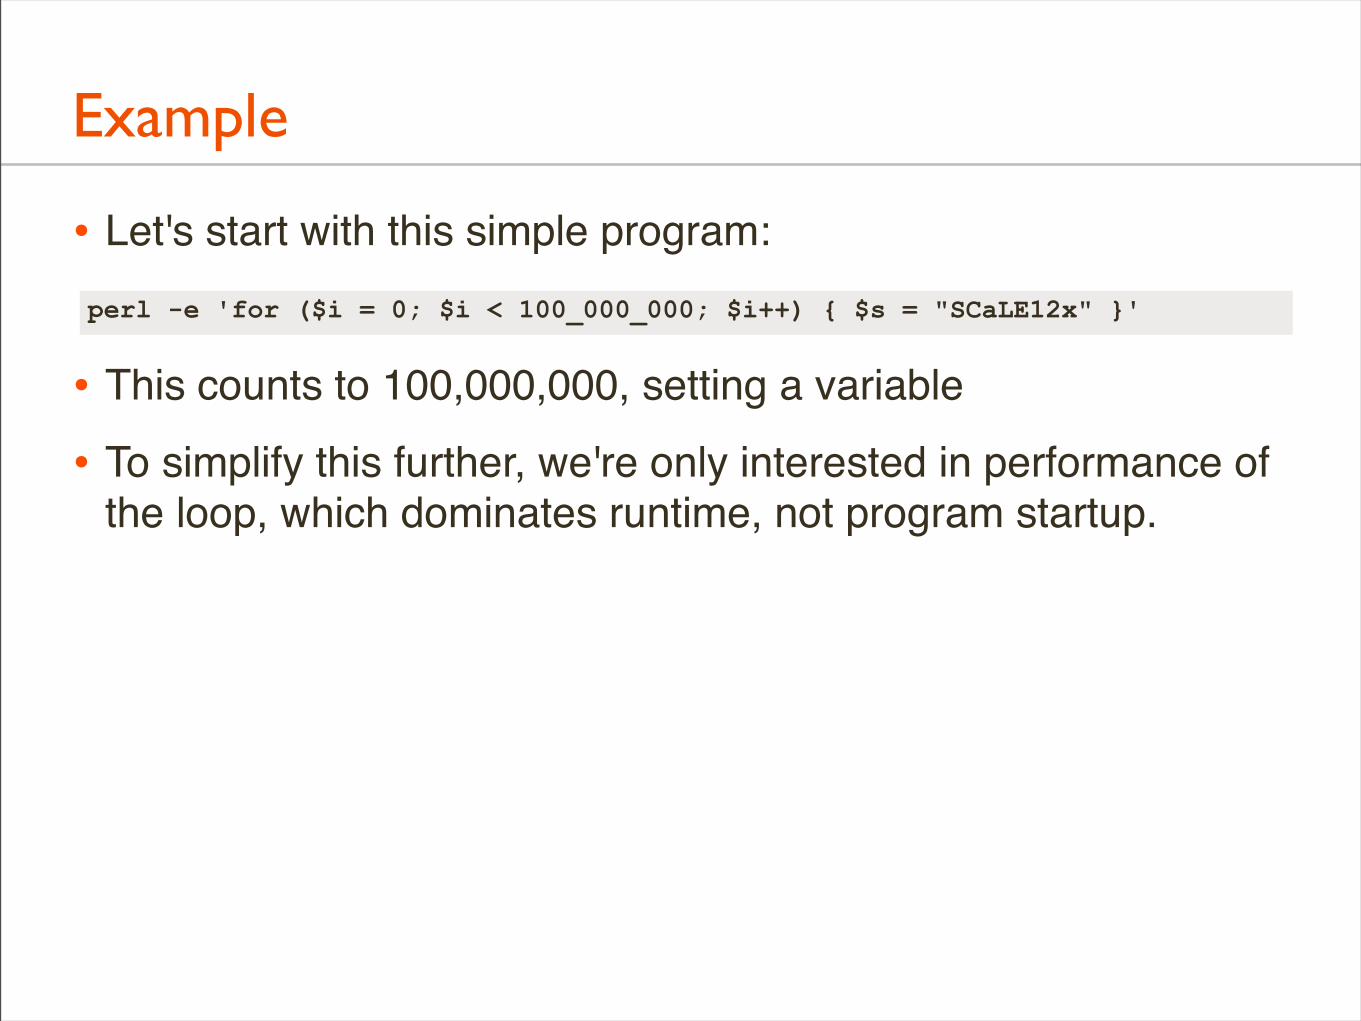
Example
• Let's start with this simple program:
• This counts to 100,000,000, setting a variable
• To simplify this further, we're only interested in performance of the loop, which dominates runtime, not program startup.
perl -e 'for ($i = 0; $i < 100_000_000; $i++) { $s = "SCaLE12x" }'
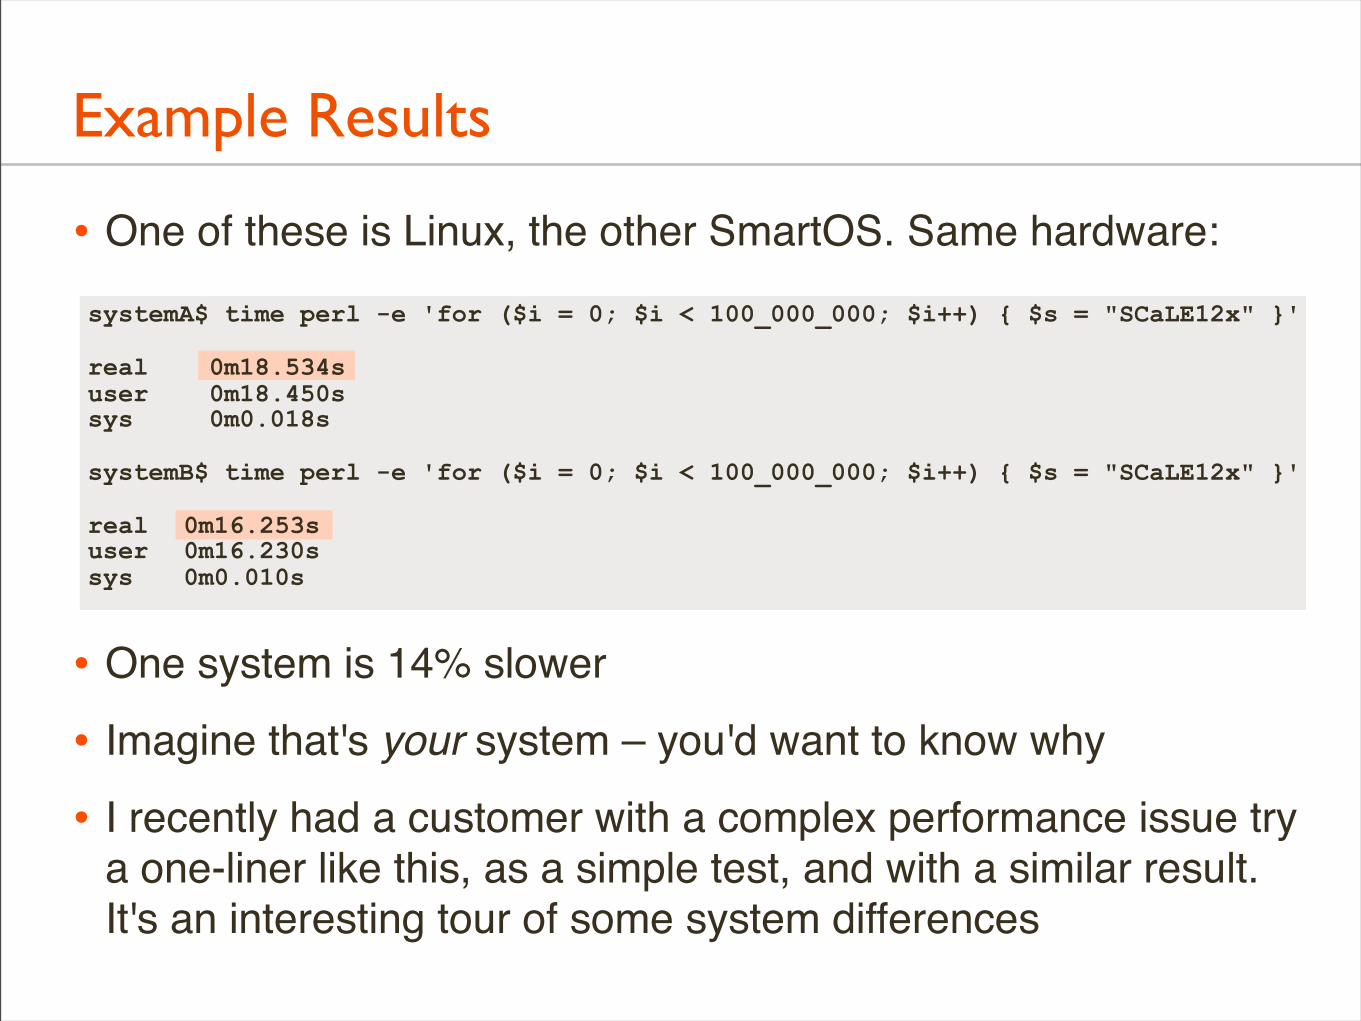
Example Results
• One of these is Linux, the other SmartOS. Same hardware:
• One system is 14% slower
• Imagine that's your system – you'd want to know why
• I recently had a customer with a complex performance issue try a one-liner like this, as a simple test, and with a similar result. It's an interesting tour of some system differences
systemA$ time perl -e 'for ($i = 0; $i < 100_000_000; $i++) { $s = "SCaLE12x" }'
real 0m18.534suser 0m18.450ssys 0m0.018s
systemB$ time perl -e 'for ($i = 0; $i < 100_000_000; $i++) { $s = "SCaLE12x" }'
real 0m16.253suser 0m16.230ssys 0m0.010s
Possible Differences: Versioning
• Different versions of Perl
• Applications improve performance from release to release
• Linux and SmartOS distributions use entirely different package repos; different software versions are common
• Different compilers used to build Perl
• Compilers come from package repos, too. I've seen 50% performance improvements by gcc version alone
• Different compiler options used to build Perl
• Application Makefile: #ifdef Linux -O3 #else -O0. ie, the performance difference is due to a Makefile decision
• 32-bit vs 64-bit builds
Possible Differences: OS
• Different system libraries
• If any library calls are used. eg: strcmp(), malloc(), memcpy(), ... These implementations vary between Linux and Solaris, and can perform very differently
• Robert Mustacchi enhanced libumem to provide improved malloc() performance on SmartOS. This can make a noticeable difference for some workloads
• Different background tasks
• Runtime could be perturbed by OS daemons doing async housekeeping. These differ between Linux and Solaris
Possible Differences: Observability
• Can the 14% be root caused?
• Observability tools differ. These don't cause the 14%, but can make the difference as to whether you can diagnose and fix it – or not.
• DTrace has meant that anything can be solved; without an equivalent on Linux, you may have to live with that 14%
• Although, Linux observability is getting much better...
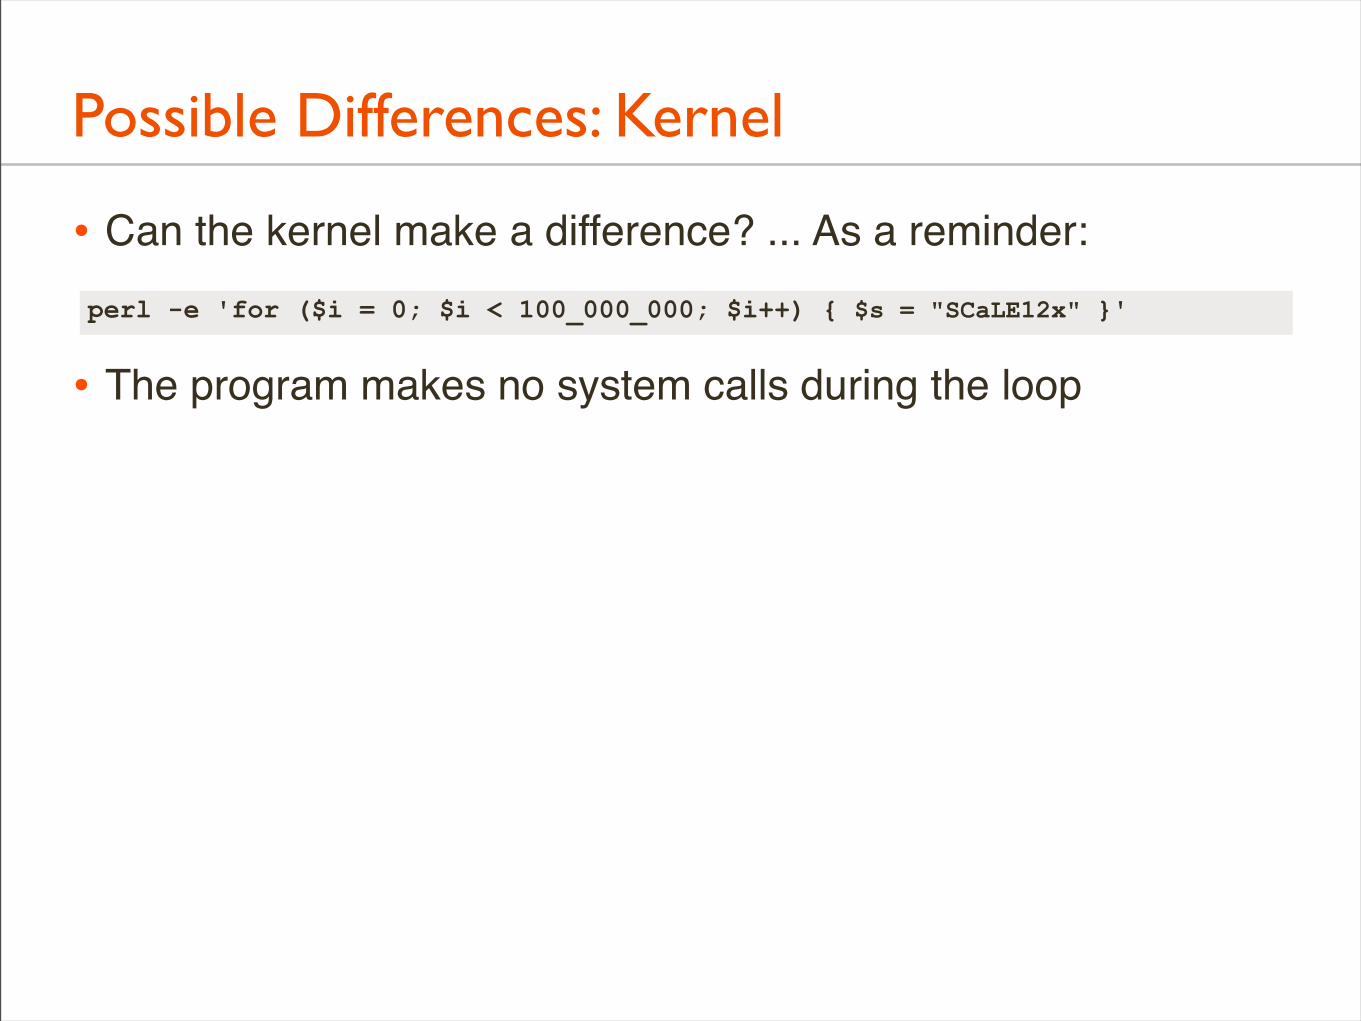
Possible Differences: Kernel
• Can the kernel make a difference? ... As a reminder:
• The program makes no system calls during the loop
perl -e 'for ($i = 0; $i < 100_000_000; $i++) { $s = "SCaLE12x" }'
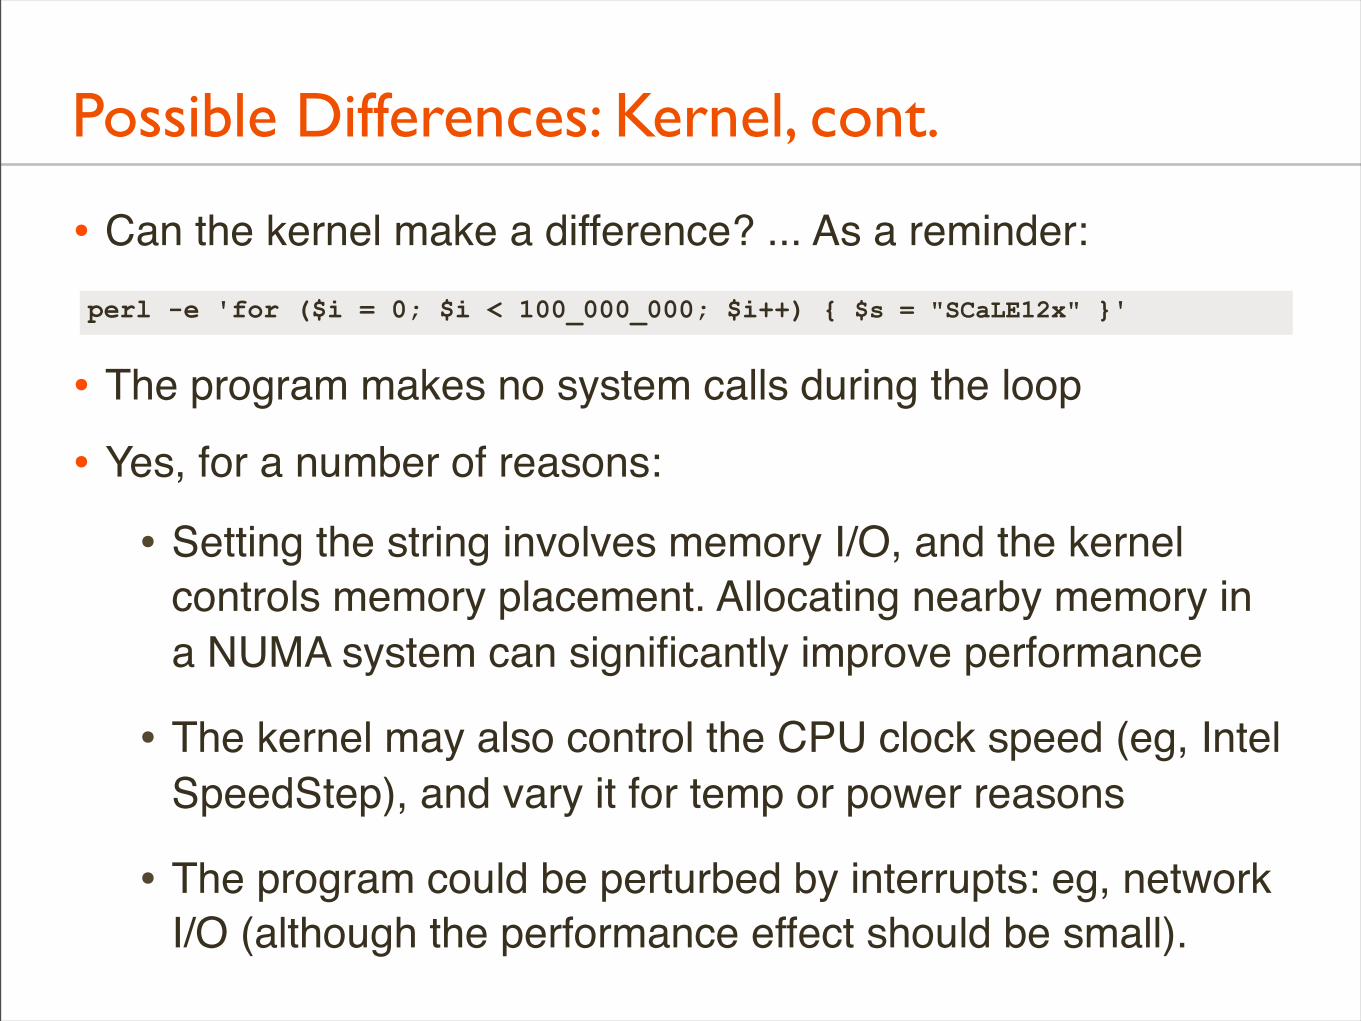
Possible Differences: Kernel, cont.
• Can the kernel make a difference? ... As a reminder:
• The program makes no system calls during the loop
• Yes, for a number of reasons:
• Setting the string involves memory I/O, and the kernel controls memory placement. Allocating nearby memory in a NUMA system can significantly improve performance
• The kernel may also control the CPU clock speed (eg, Intel SpeedStep), and vary it for temp or power reasons
• The program could be perturbed by interrupts: eg, network I/O (although the performance effect should be small).
perl -e 'for ($i = 0; $i < 100_000_000; $i++) { $s = "SCaLE12x" }'
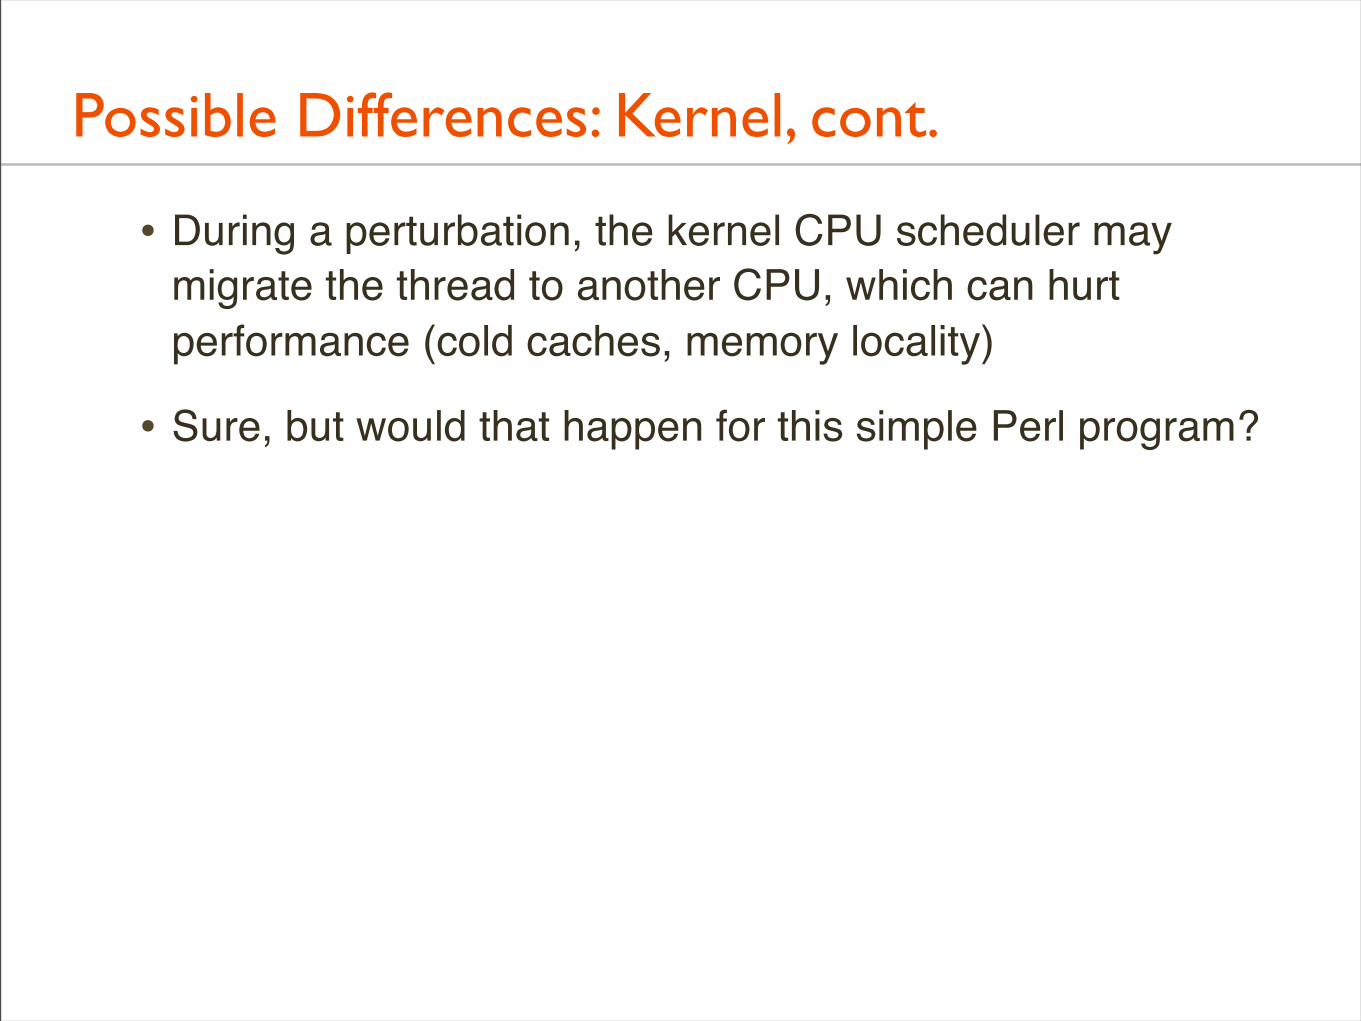
Possible Differences: Kernel, cont.
• During a perturbation, the kernel CPU scheduler may migrate the thread to another CPU, which can hurt performance (cold caches, memory locality)
• Sure, but would that happen for this simple Perl program?
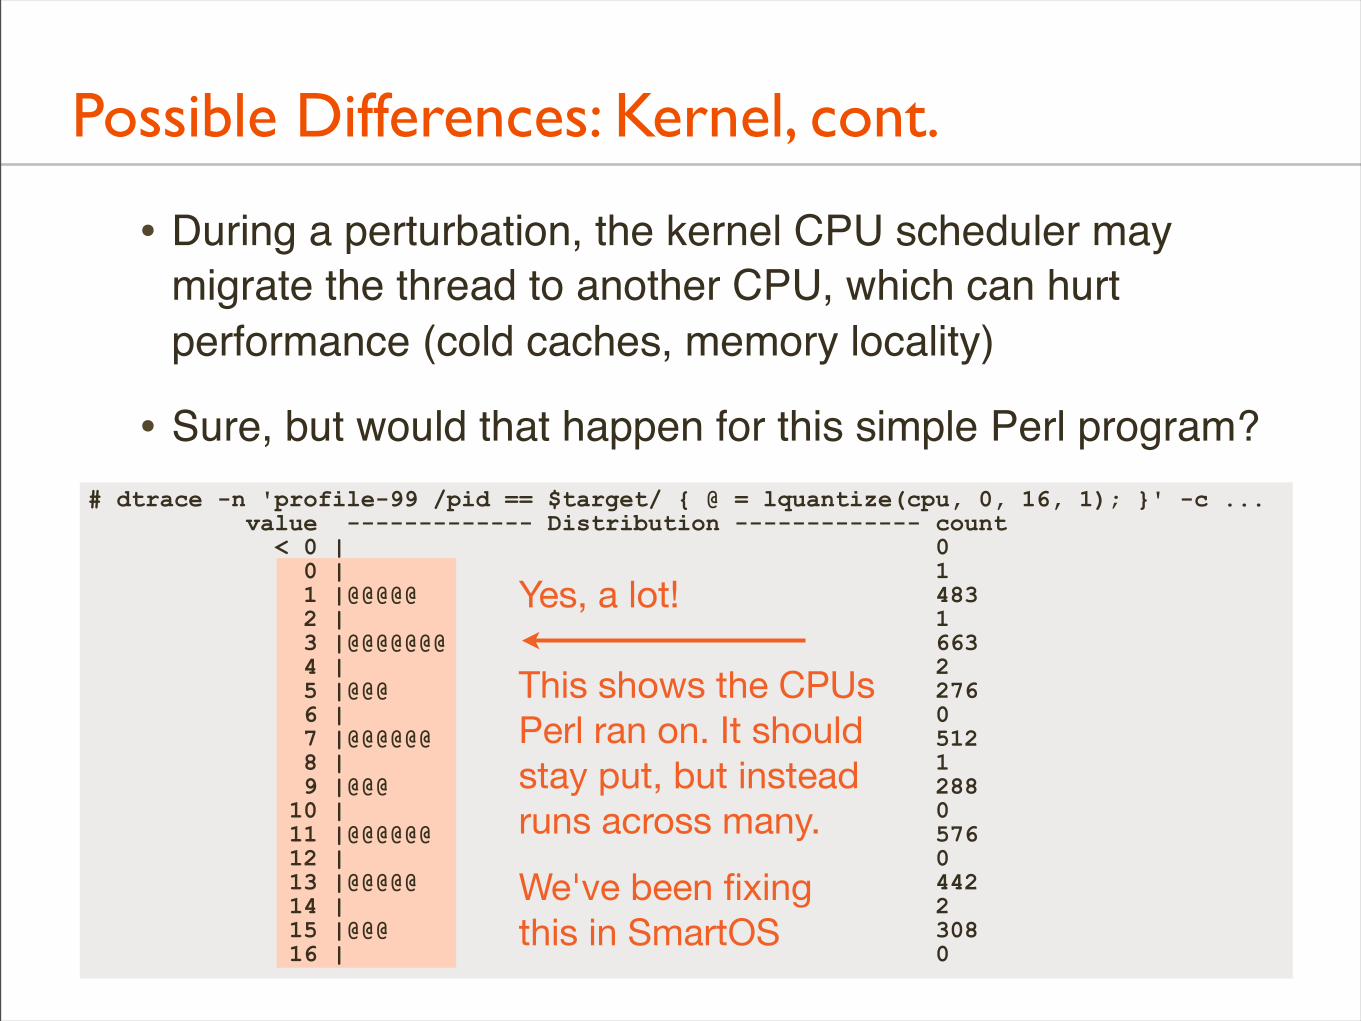
Possible Differences: Kernel, cont.
• During a perturbation, the kernel CPU scheduler may migrate the thread to another CPU, which can hurt performance (cold caches, memory locality)
• Sure, but would that happen for this simple Perl program?# dtrace -n 'profile-99 /pid == $target/ { @ = lquantize(cpu, 0, 16, 1); }' -c ... value ------------- Distribution ------------- count < 0 | 0 0 | 1 1 |@@@@@ 483 2 | 1 3 |@@@@@@@ 663 4 | 2 5 |@@@ 276 6 | 0 7 |@@@@@@ 512 8 | 1 9 |@@@ 288 10 | 0 11 |@@@@@@ 576 12 | 0 13 |@@@@@ 442 14 | 2 15 |@@@ 308 16 | 0
Yes, a lot!
This shows the CPUsPerl ran on. It shouldstay put, but insteadruns across many.
We've been fixingthis in SmartOS
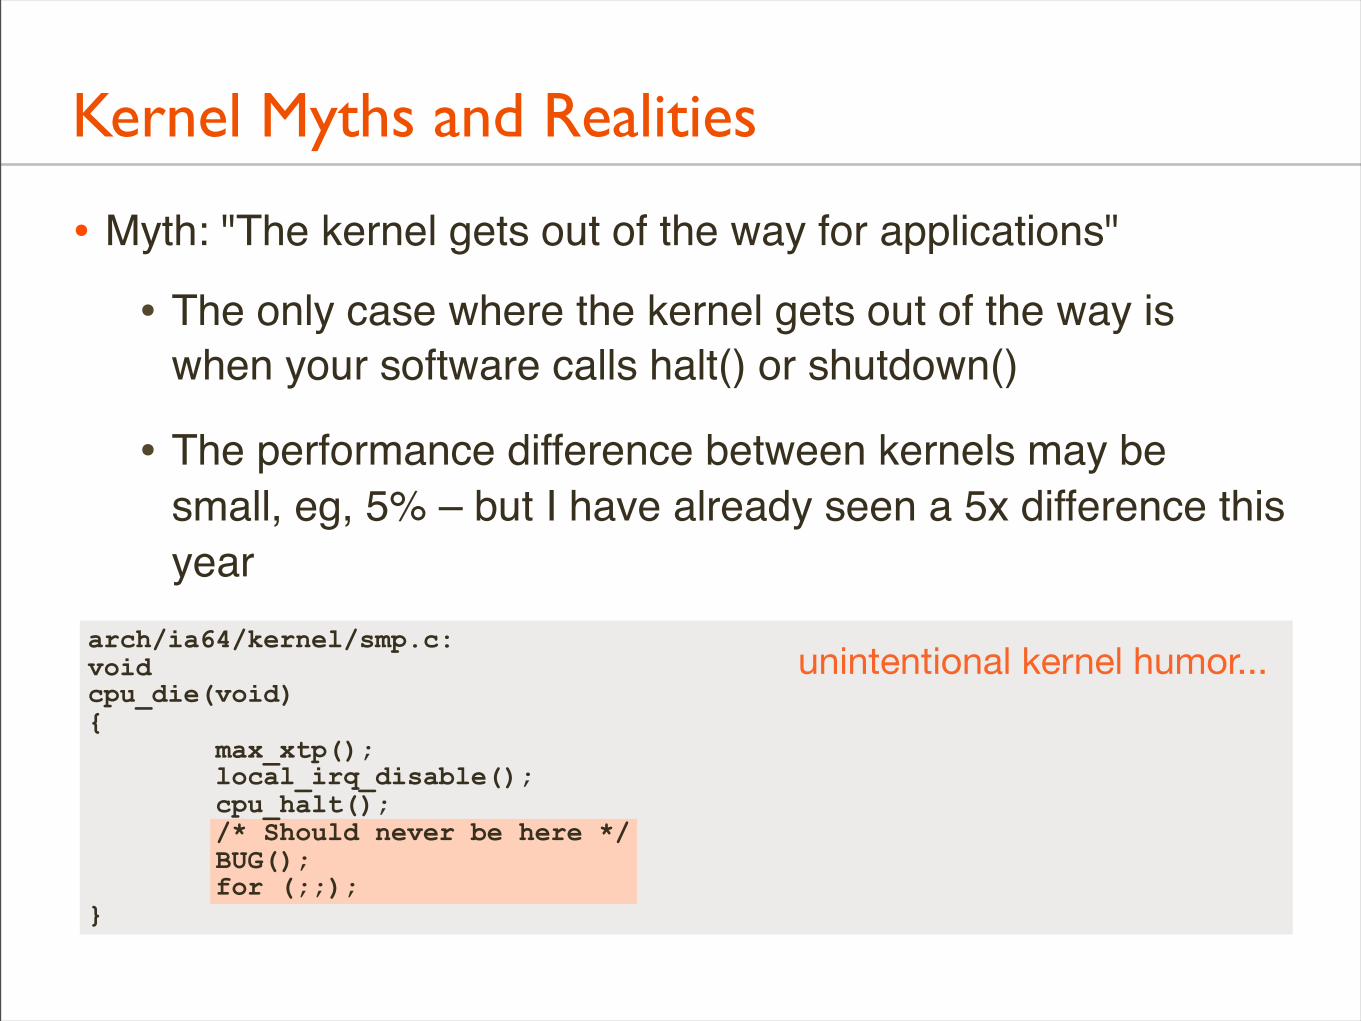
Kernel Myths and Realities
• Myth: "The kernel gets out of the way for applications"
• The only case where the kernel gets out of the way is when your software calls halt() or shutdown()
• The performance difference between kernels may be small, eg, 5% – but I have already seen a 5x difference this year
arch/ia64/kernel/smp.c:voidcpu_die(void){ max_xtp(); local_irq_disable(); cpu_halt(); /* Should never be here */ BUG(); for (;;);}
unintentional kernel humor...
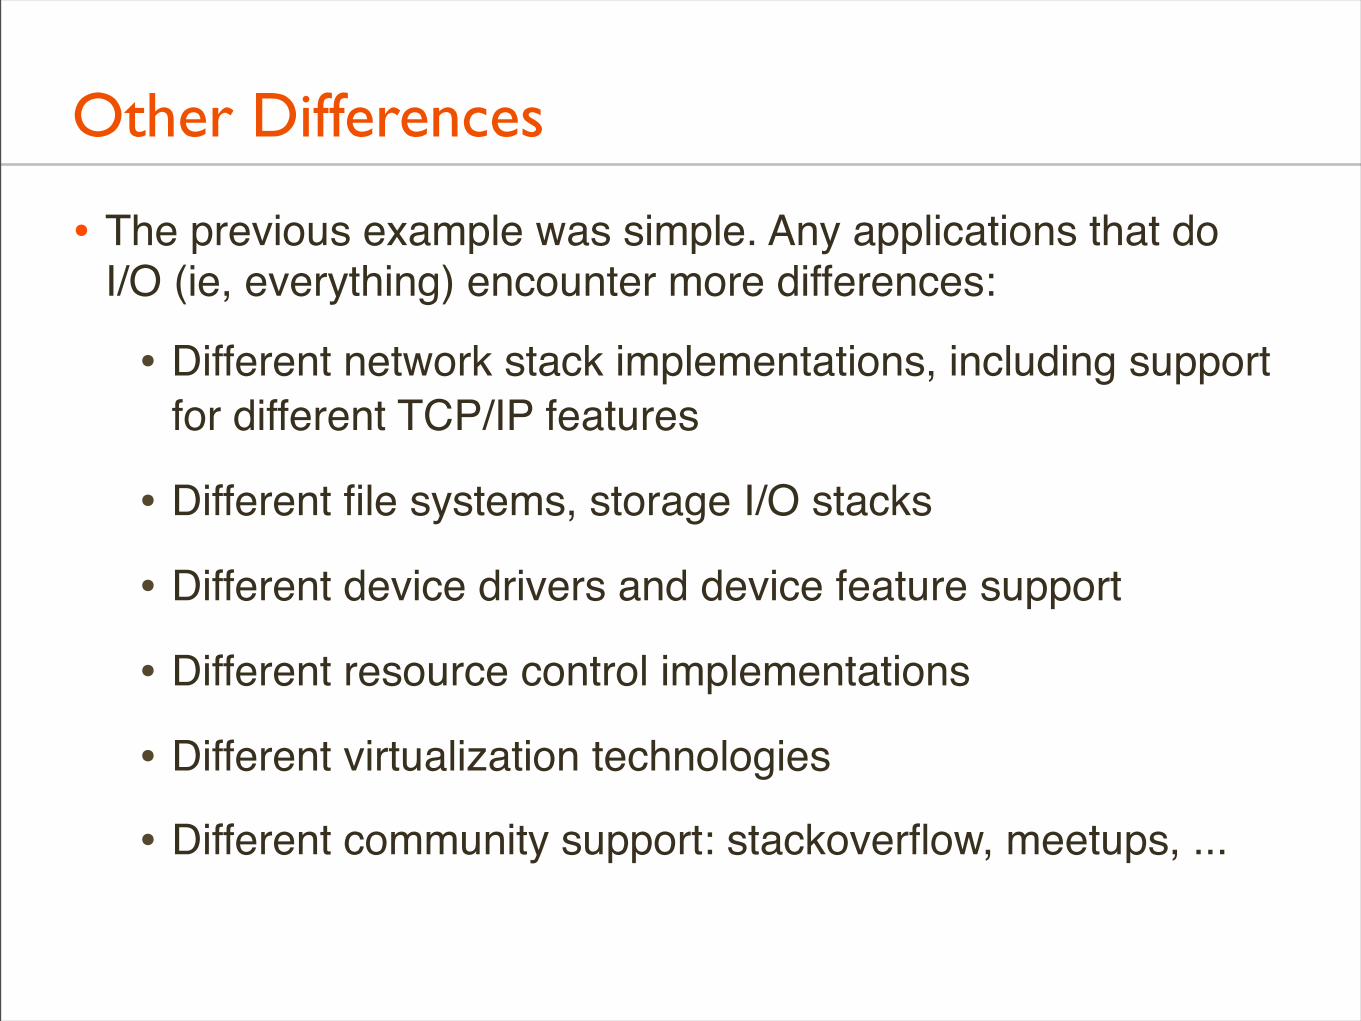
Other Differences
• The previous example was simple. Any applications that doI/O (ie, everything) encounter more differences:
• Different network stack implementations, including support for different TCP/IP features
• Different file systems, storage I/O stacks
• Different device drivers and device feature support
• Different resource control implementations
• Different virtualization technologies
• Different community support: stackoverflow, meetups, ...
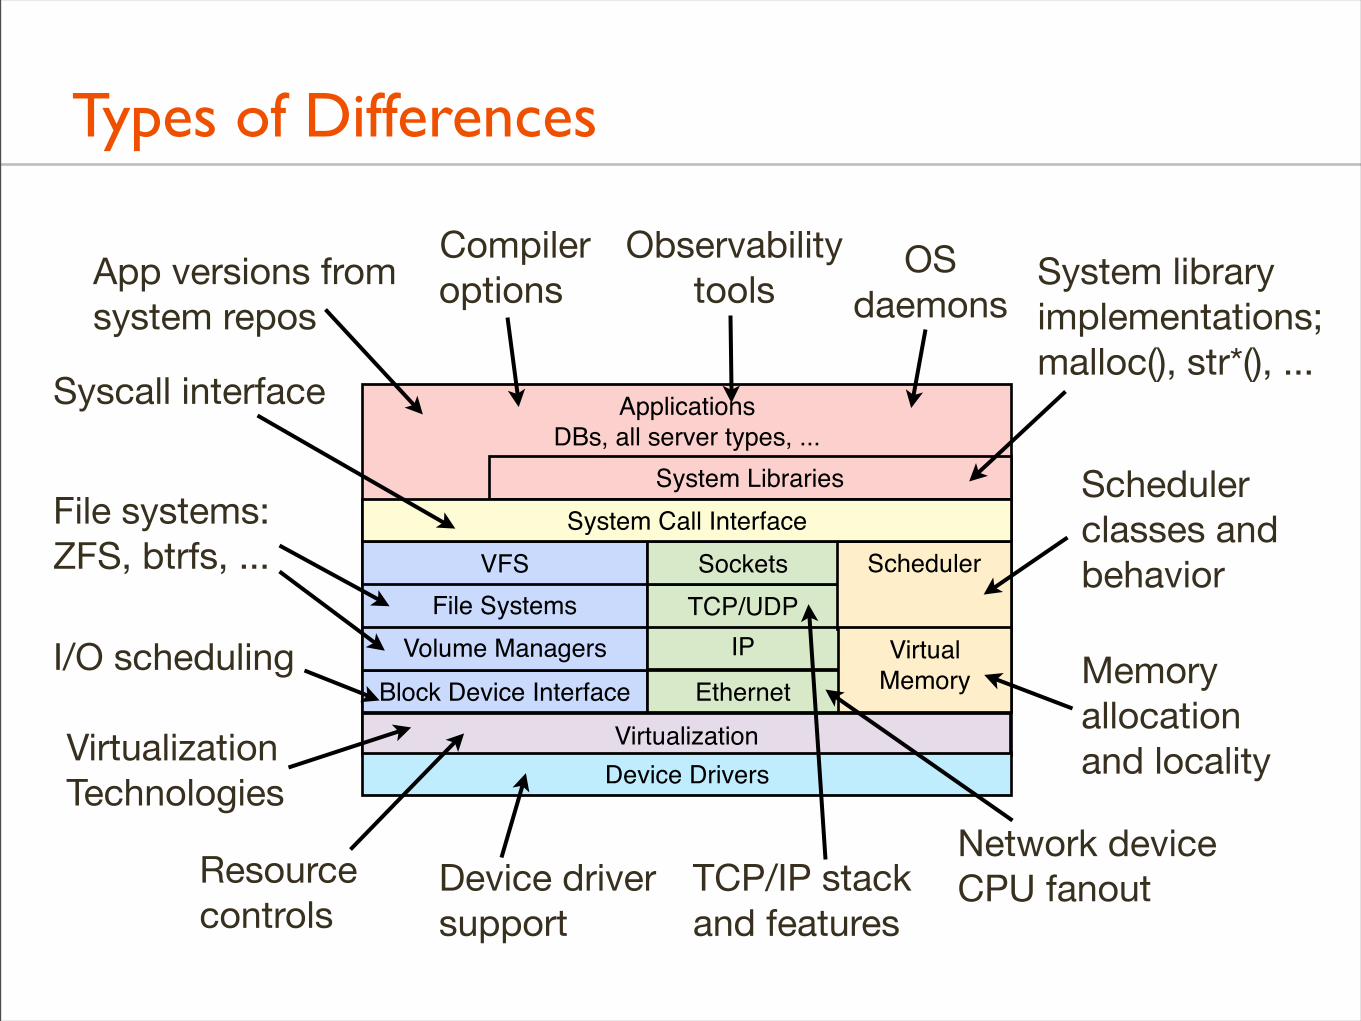
Types of Differences
ApplicationsDBs, all server types, ...
Block Device Interface EthernetVolume Managers IP
File Systems TCP/UDPVFS Sockets
System Libraries
Device Drivers
Scheduler
VirtualMemory
System Call Interface
App versions fromsystem repos
System libraryimplementations;malloc(), str*(), ...
Syscall interface
OSdaemons
File systems:ZFS, btrfs, ...
Compileroptions
Schedulerclasses andbehavior
I/O scheduling Memoryallocationand locality
Virtualization
TCP/IP stackand features
Network deviceCPU fanout
Observabilitytools
Resourcecontrols
Device driversupport
VirtualizationTechnologies
Specific Differences
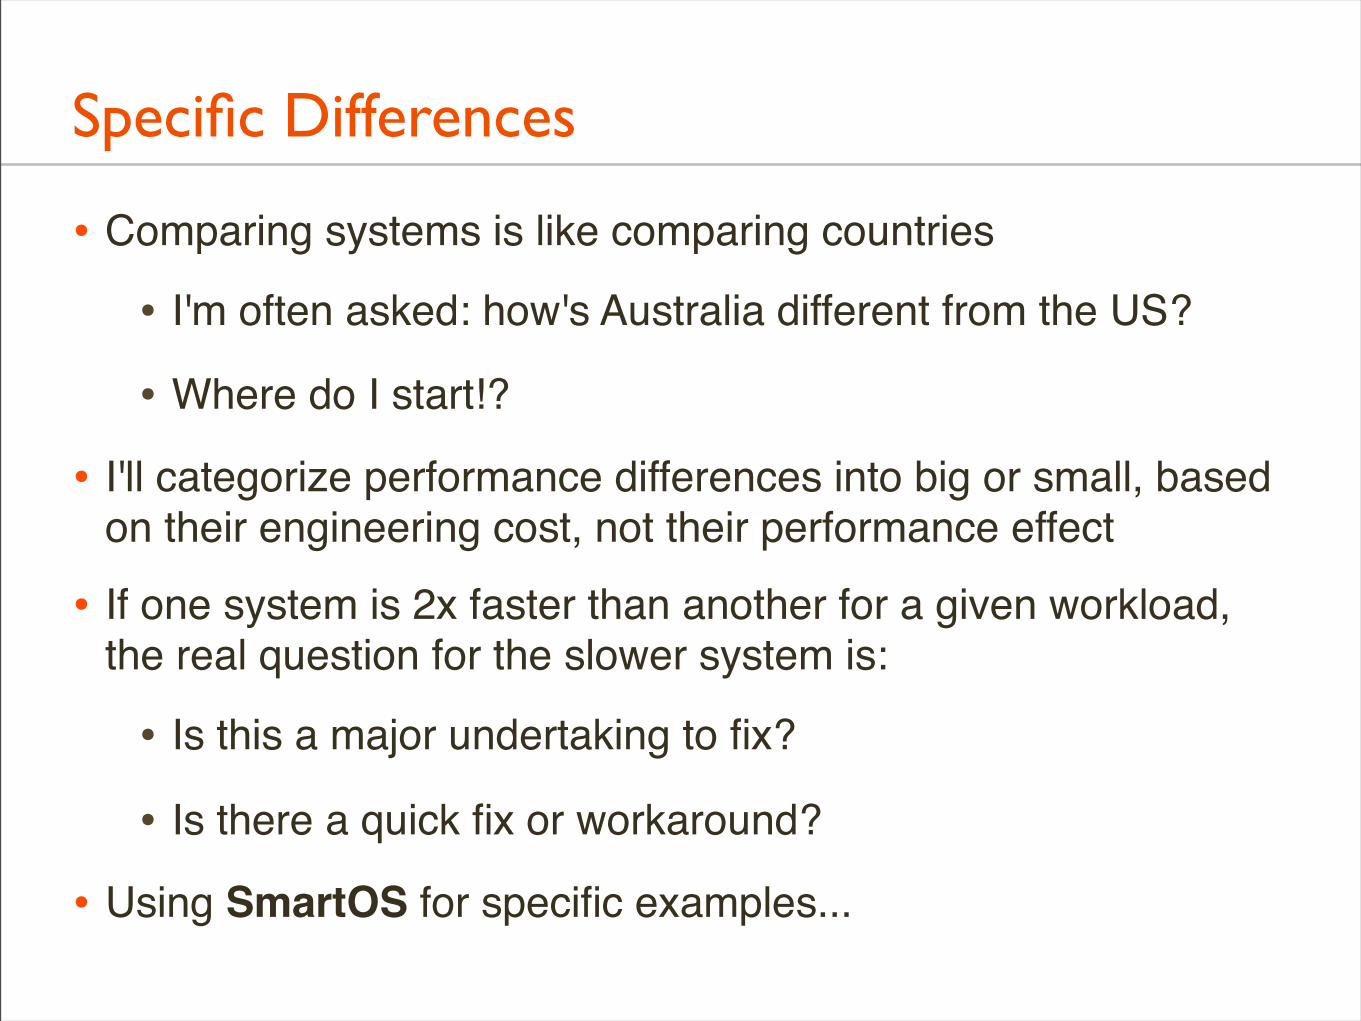
Specific Differences
• Comparing systems is like comparing countries
• I'm often asked: how's Australia different from the US?
• Where do I start!?
• I'll categorize performance differences into big or small, based on their engineering cost, not their performance effect
• If one system is 2x faster than another for a given workload, the real question for the slower system is:
• Is this a major undertaking to fix?
• Is there a quick fix or workaround?
• Using SmartOS for specific examples...
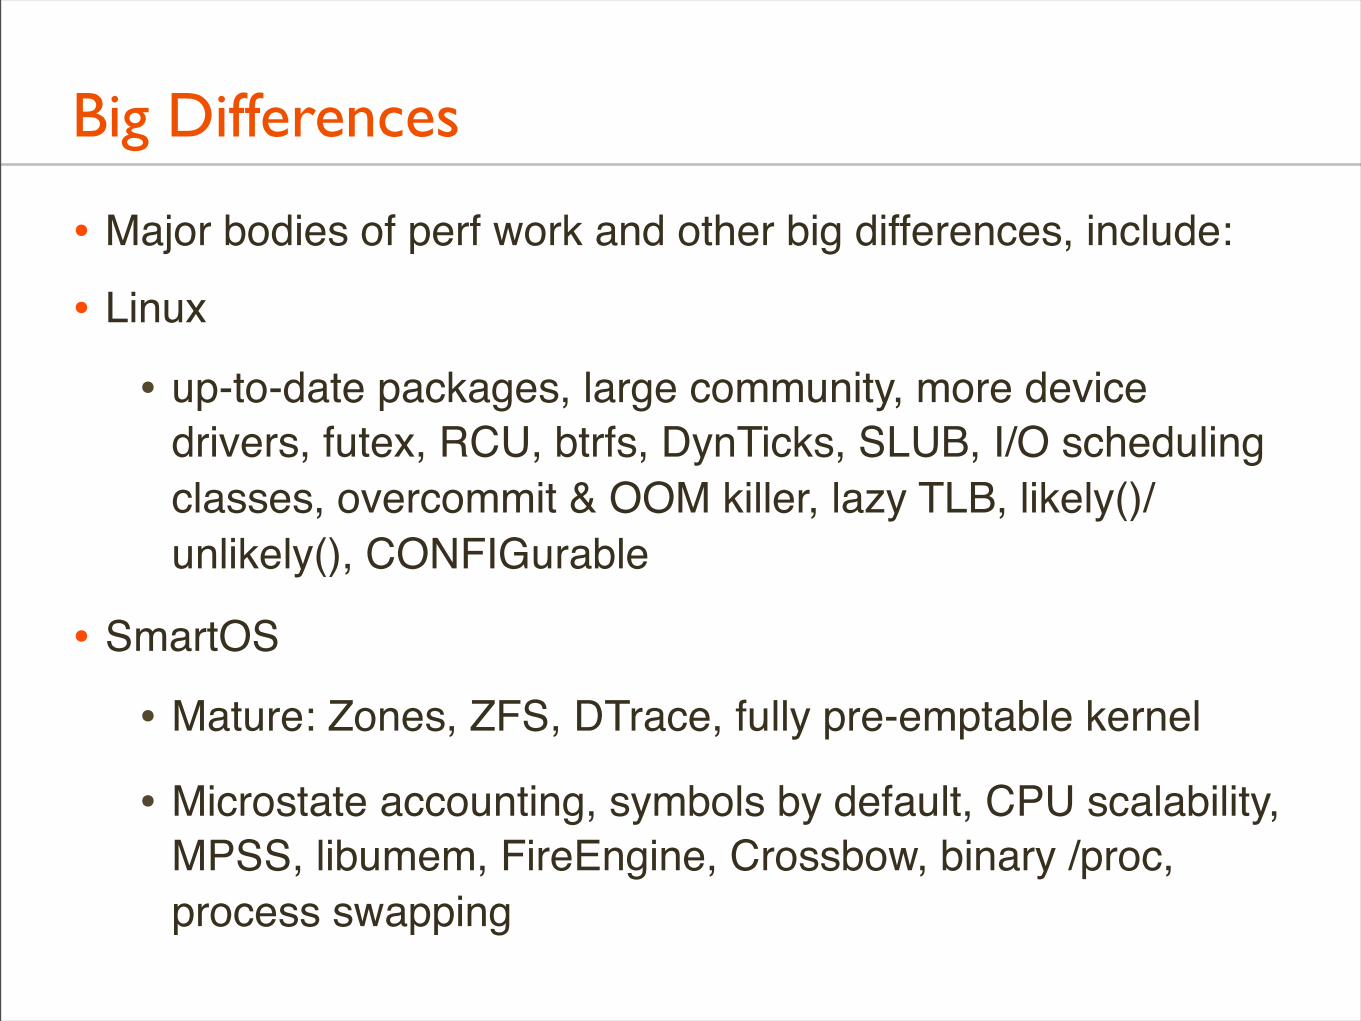
Big Differences
• Major bodies of perf work and other big differences, include:
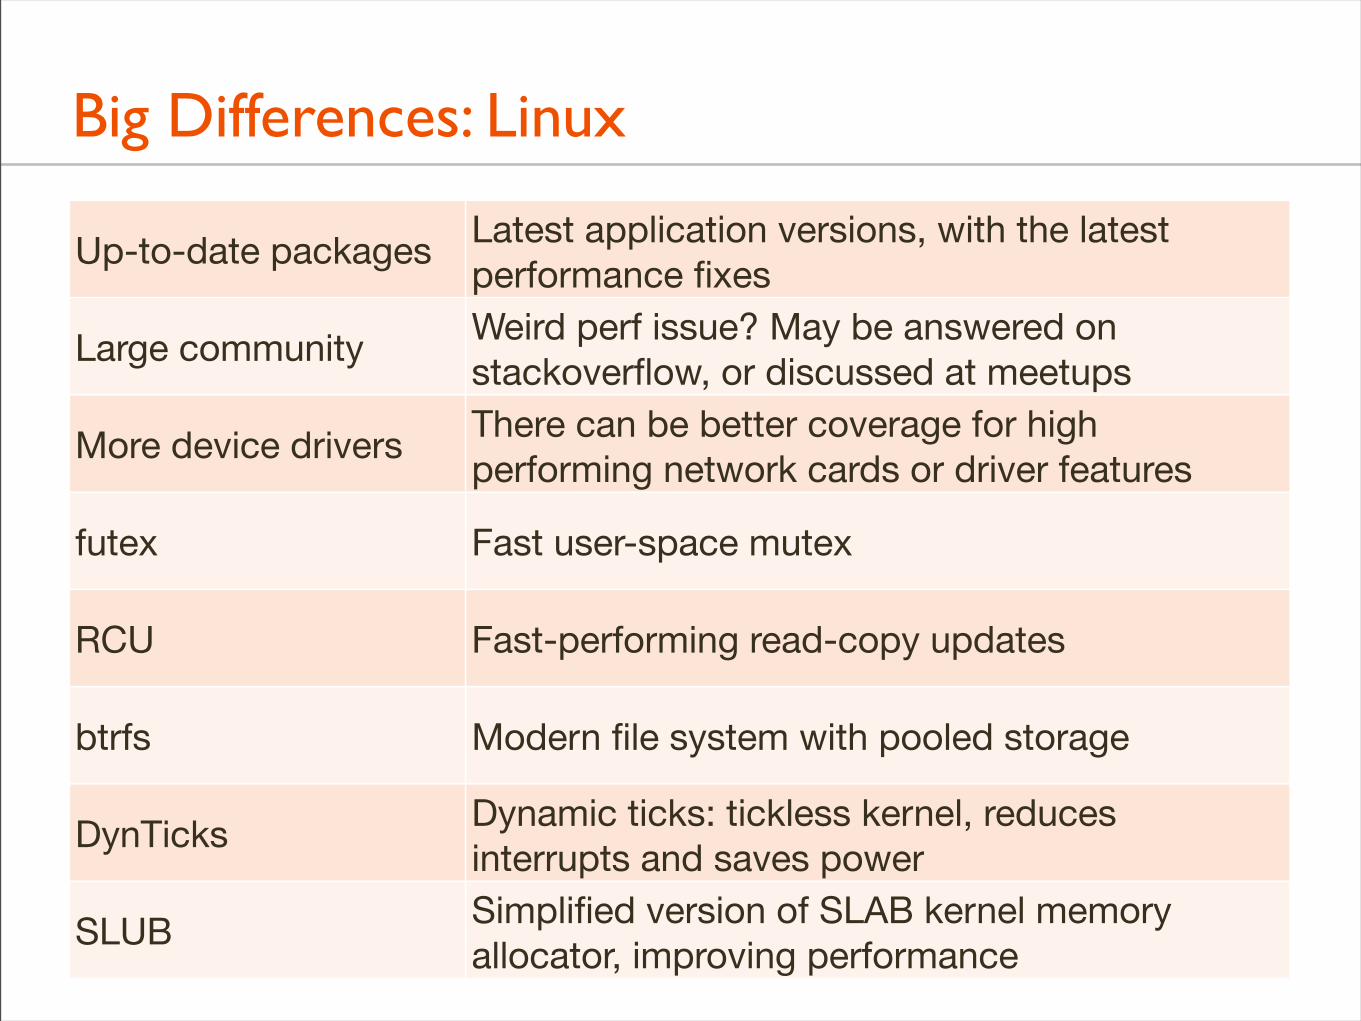
• Linux
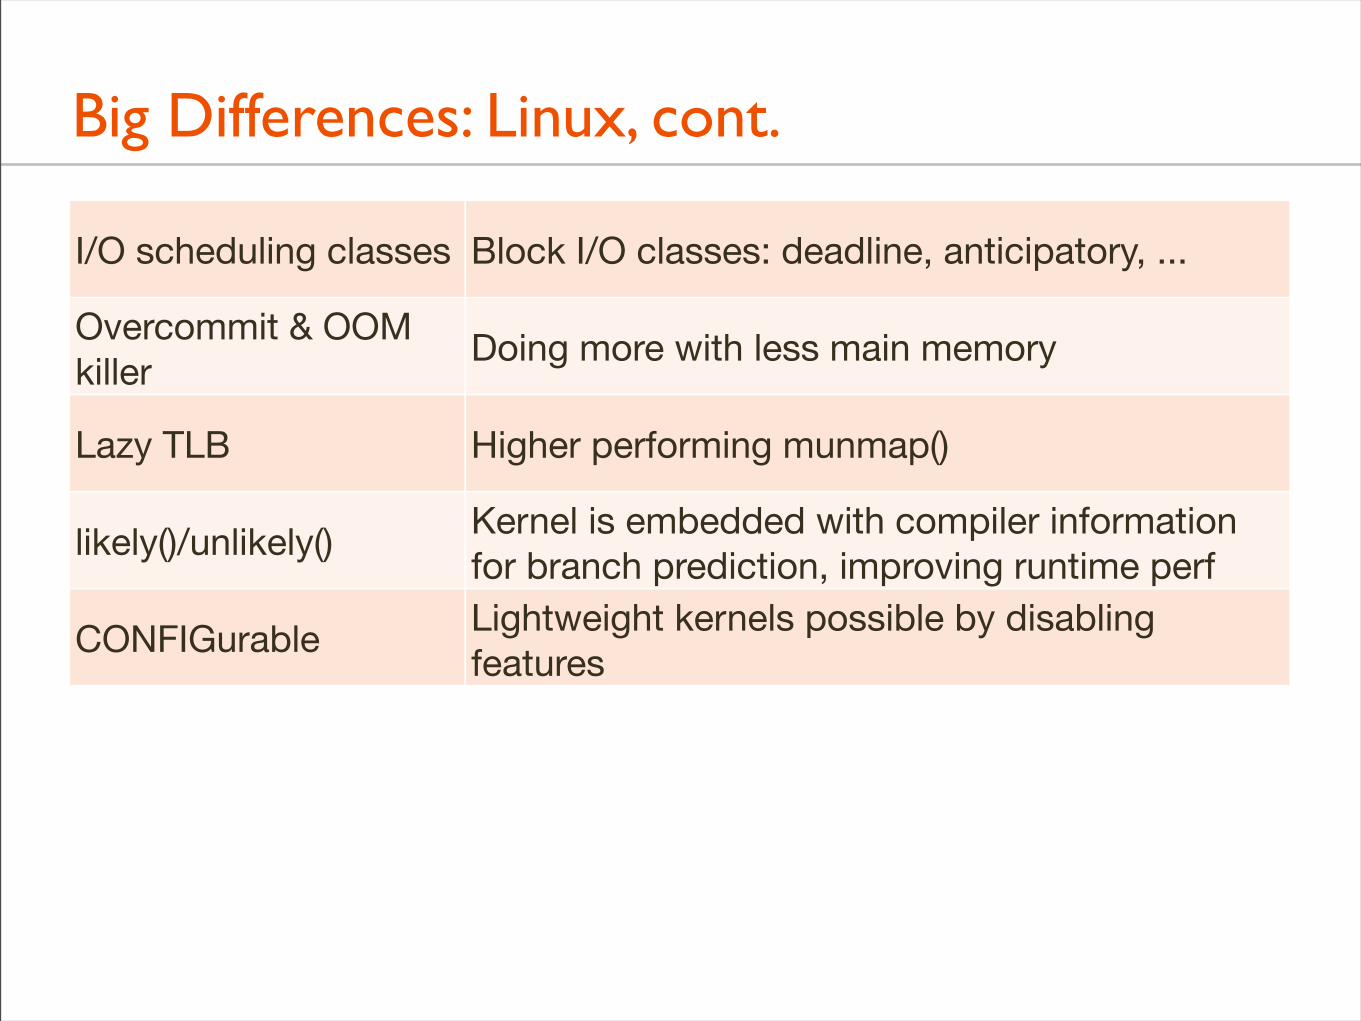
• up-to-date packages, large community, more device drivers, futex, RCU, btrfs, DynTicks, SLUB, I/O scheduling classes, overcommit & OOM killer, lazy TLB, likely()/unlikely(), CONFIGurable
• SmartOS
• Mature: Zones, ZFS, DTrace, fully pre-emptable kernel
• Microstate accounting, symbols by default, CPU scalability, MPSS, libumem, FireEngine, Crossbow, binary /proc, process swapping
Big Differences: Linux
Up-to-date packages Latest application versions, with the latest performance fixes
Large community Weird perf issue? May be answered on stackoverflow, or discussed at meetups
More device drivers There can be better coverage for high performing network cards or driver features
futex Fast user-space mutex
RCU Fast-performing read-copy updates
btrfs Modern file system with pooled storage
DynTicks Dynamic ticks: tickless kernel, reduces interrupts and saves power
SLUB Simplified version of SLAB kernel memory allocator, improving performance
Big Differences: Linux, cont.
I/O scheduling classes Block I/O classes: deadline, anticipatory, ...
Overcommit & OOM killer Doing more with less main memory
Lazy TLB Higher performing munmap()
likely()/unlikely() Kernel is embedded with compiler information for branch prediction, improving runtime perf
CONFIGurable Lightweight kernels possible by disabling features
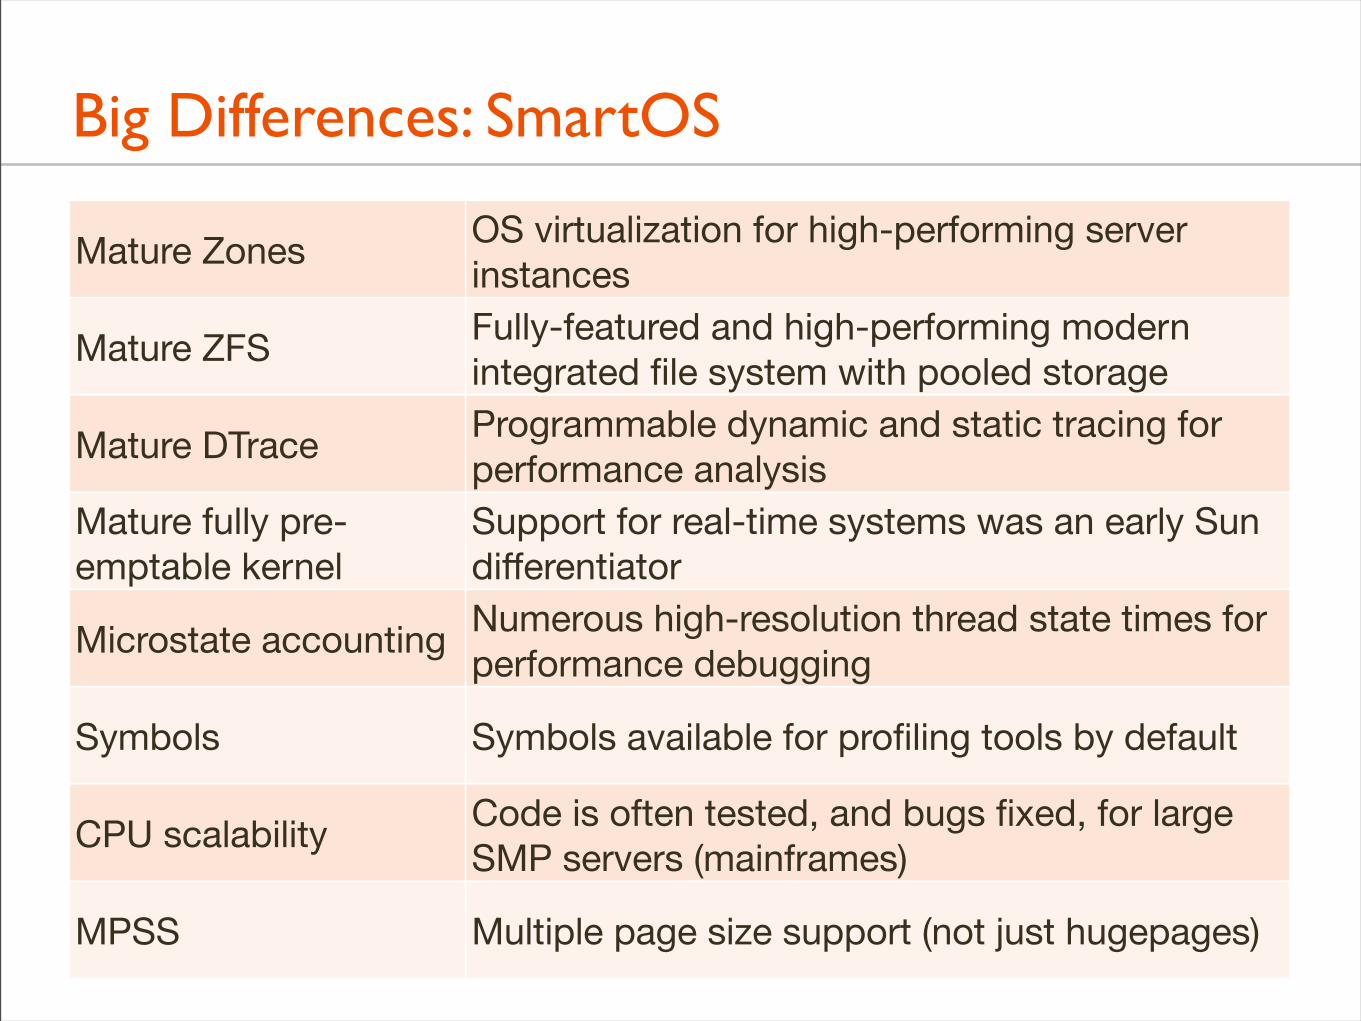
Big Differences: SmartOS
Mature Zones OS virtualization for high-performing server instances
Mature ZFS Fully-featured and high-performing modern integrated file system with pooled storage
Mature DTrace Programmable dynamic and static tracing for performance analysis
Mature fully pre-emptable kernel
Support for real-time systems was an early Sun differentiator
Microstate accounting Numerous high-resolution thread state times for performance debugging
Symbols Symbols available for profiling tools by default
CPU scalability Code is often tested, and bugs fixed, for large SMP servers (mainframes)
MPSS Multiple page size support (not just hugepages)
Big Differences: SmartOS, cont.
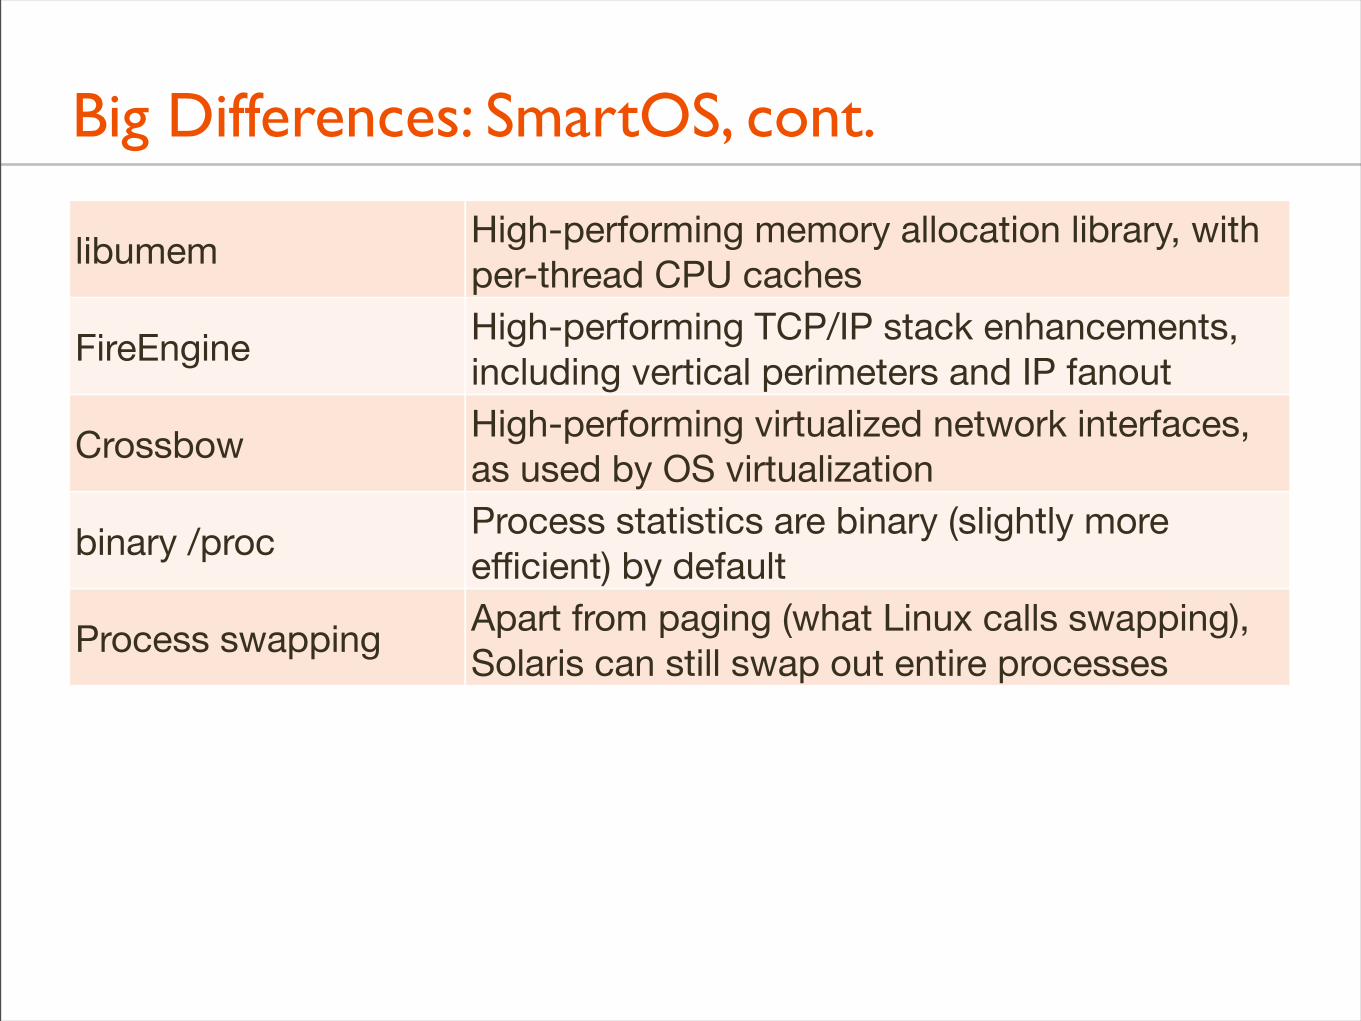
libumem High-performing memory allocation library, with per-thread CPU caches
FireEngine High-performing TCP/IP stack enhancements, including vertical perimeters and IP fanout
Crossbow High-performing virtualized network interfaces, as used by OS virtualization
binary /proc Process statistics are binary (slightly more efficient) by default
Process swapping Apart from paging (what Linux calls swapping), Solaris can still swap out entire processes
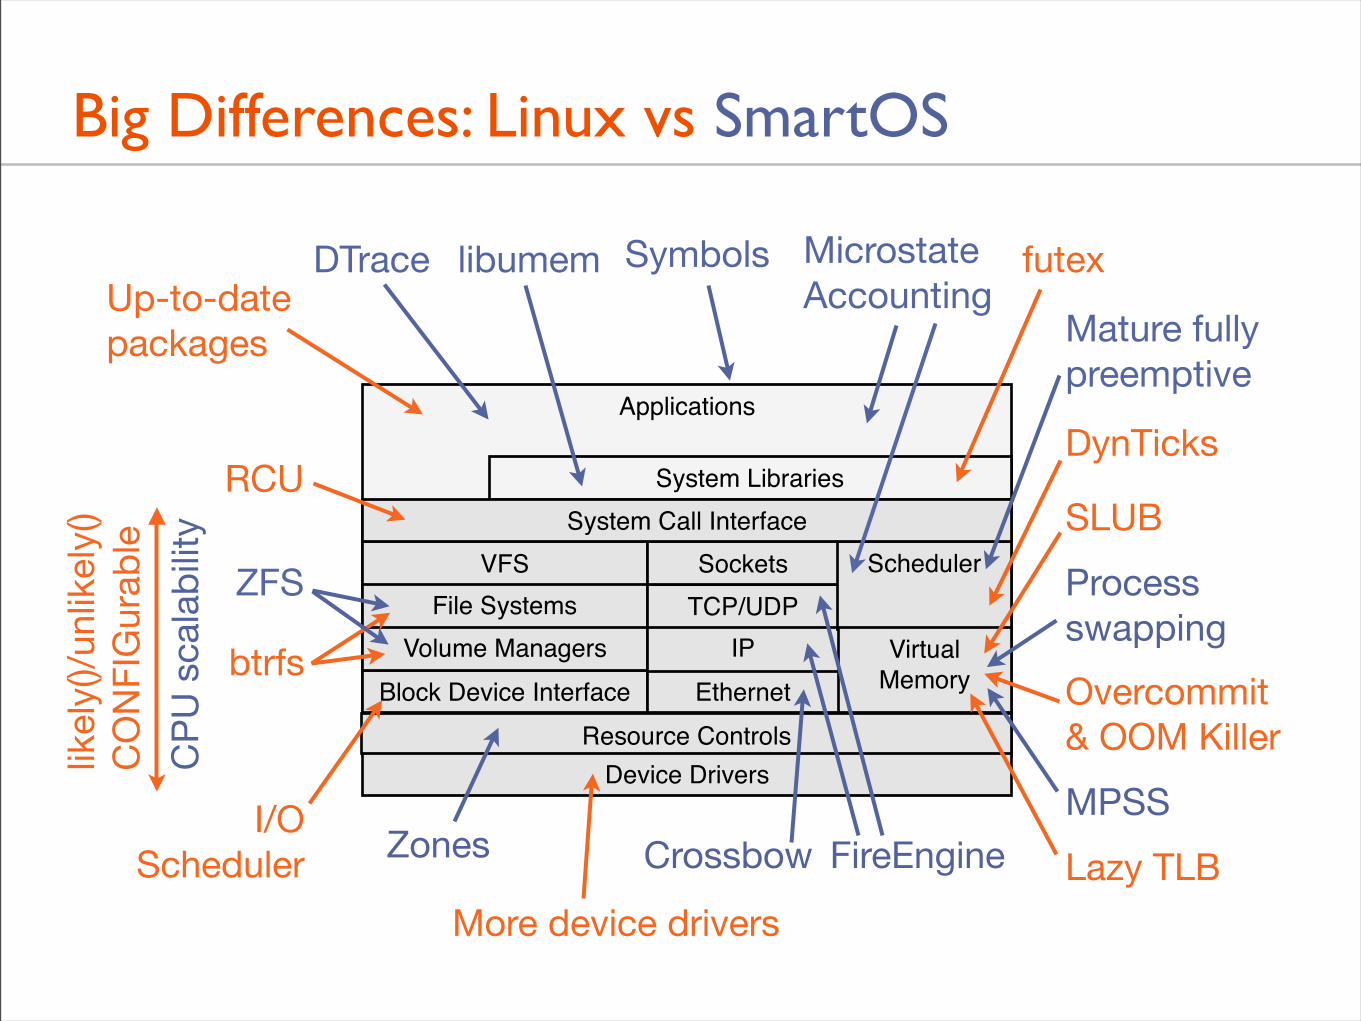
Big Differences: Linux vs SmartOS
Applications
Block Device Interface EthernetVolume Managers IP
File Systems TCP/UDPVFS Sockets
System Libraries
Device Drivers
Scheduler
VirtualMemory
System Call Interface
Resource Controls
ZFS
DynTicksRCU
SLUB
I/OScheduler
Overcommit& OOM Killer
Lazy TLB
likel
y()/u
nlik
ely(
)C
ON
FIG
urab
le
btrfs
Zones
Mature fullypreemptive
MPSS
CPU
sca
labi
lity
FireEngineCrossbow
Processswapping
More device drivers
Up-to-datepackages
DTrace libumem futexMicrostateAccounting
Symbols
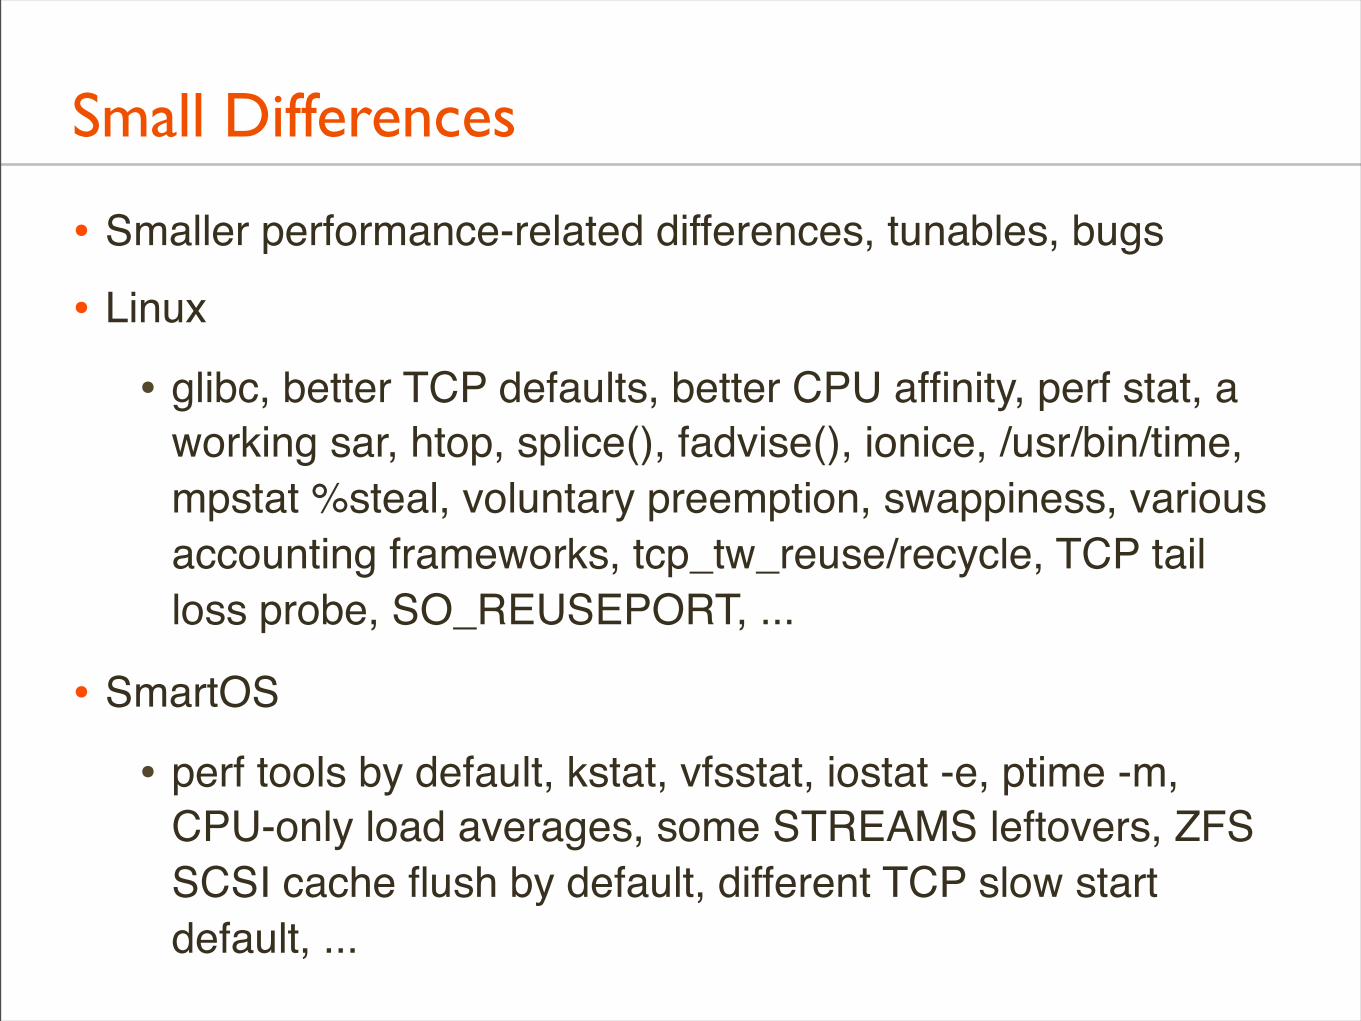
Small Differences
• Smaller performance-related differences, tunables, bugs
• Linux
• glibc, better TCP defaults, better CPU affinity, perf stat, a working sar, htop, splice(), fadvise(), ionice, /usr/bin/time, mpstat %steal, voluntary preemption, swappiness, various accounting frameworks, tcp_tw_reuse/recycle, TCP tail loss probe, SO_REUSEPORT, ...
• SmartOS
• perf tools by default, kstat, vfsstat, iostat -e, ptime -m, CPU-only load averages, some STREAMS leftovers, ZFS SCSI cache flush by default, different TCP slow start default, ...
Small Differences, cont.
• Small differences change frequently: a feature is added to one kernel, then the other a year later; a difference may only exist for a short period of time.
• These small kernel differences may still make a significant performance difference, but are classified as "small" based on engineering cost.
System Similarities
• It's important to note that many performance-related features are roughly equivalent:
• Both are Unix-like systems: processes, kernel, syscalls, time sharing, preemption, virtual memory, paged virtual memory, demand paging, ...
• Similar modern features: unified buffer cache, memory mapped files, multiprocessor support, CPU scheduling classes, CPU sets, 64-bit support, memory locality, resource controls, PIC profiler, epoll, ...
Non Performance Differences
• Linux
• Open source (vs Oracle Solaris), "everyone knows it", embedded Linux, popular and well supported desktop/laptop use...
• SmartOS
• SMF/FMA, contracts, privileges, mdb (postmortem debugging), gcore, crash dumps by default, ...
WARNING
The next sections are not suitable for those sufferingNot Invented Here (NIH) syndrome,
or those who are easily trolled
What Solaris can learn from Linux performance
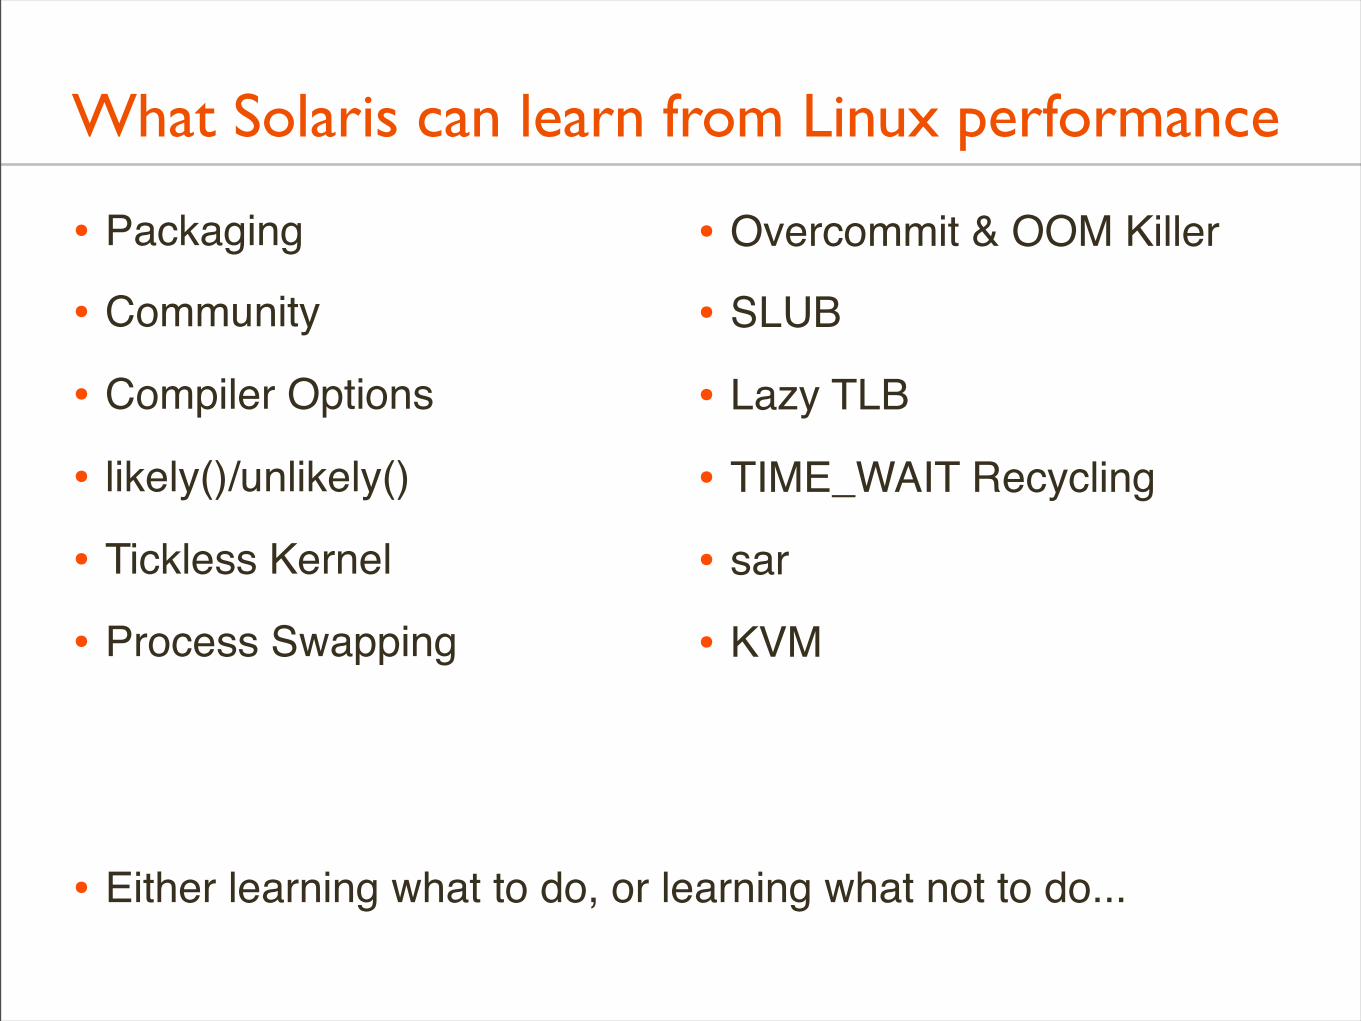
What Solaris can learn from Linux performance
• Packaging
• Community
• Compiler Options
• likely()/unlikely()
• Tickless Kernel
• Process Swapping
• Either learning what to do, or learning what not to do...
• Overcommit & OOM Killer
• SLUB
• Lazy TLB
• TIME_WAIT Recycling
• sar
• KVM
Packaging
• Linux package repositories are often well stocked and updated
• Convenience aside, this can mean that users run newer software versions, along with the latest perf fixes
• They find "Linux is faster", but the real difference is the version of: gcc, openssl, mysql, ... Solaris is unfairly blamed
Packaging, cont.
• Packaging is important and needs serious support
• Dedicated staff, community
• eg, Joyent has dedicated staff for the SmartOS package repo, which is based on pkgsrc from NetBSD
• It's not just the operating system that matters; it's the ecosystem
Community
• A large community means:
• Q/A sites have performance tips: stackoverflow, ...
• Conference talks on performance (this one!), slides, video
• Weird issues more likely found and fixed by someone else
• More case studies shared: what tuning/config worked
• A community helps people hear about the latest tools, tuning, and developments, and adopt them
Community, cont.
• Linux users expect to Google a question and find an answer on stackoverflow
• Either foster a community to share content on tuning, tools, configuration, or, have staff to create such content.
• Hire a good community manager!
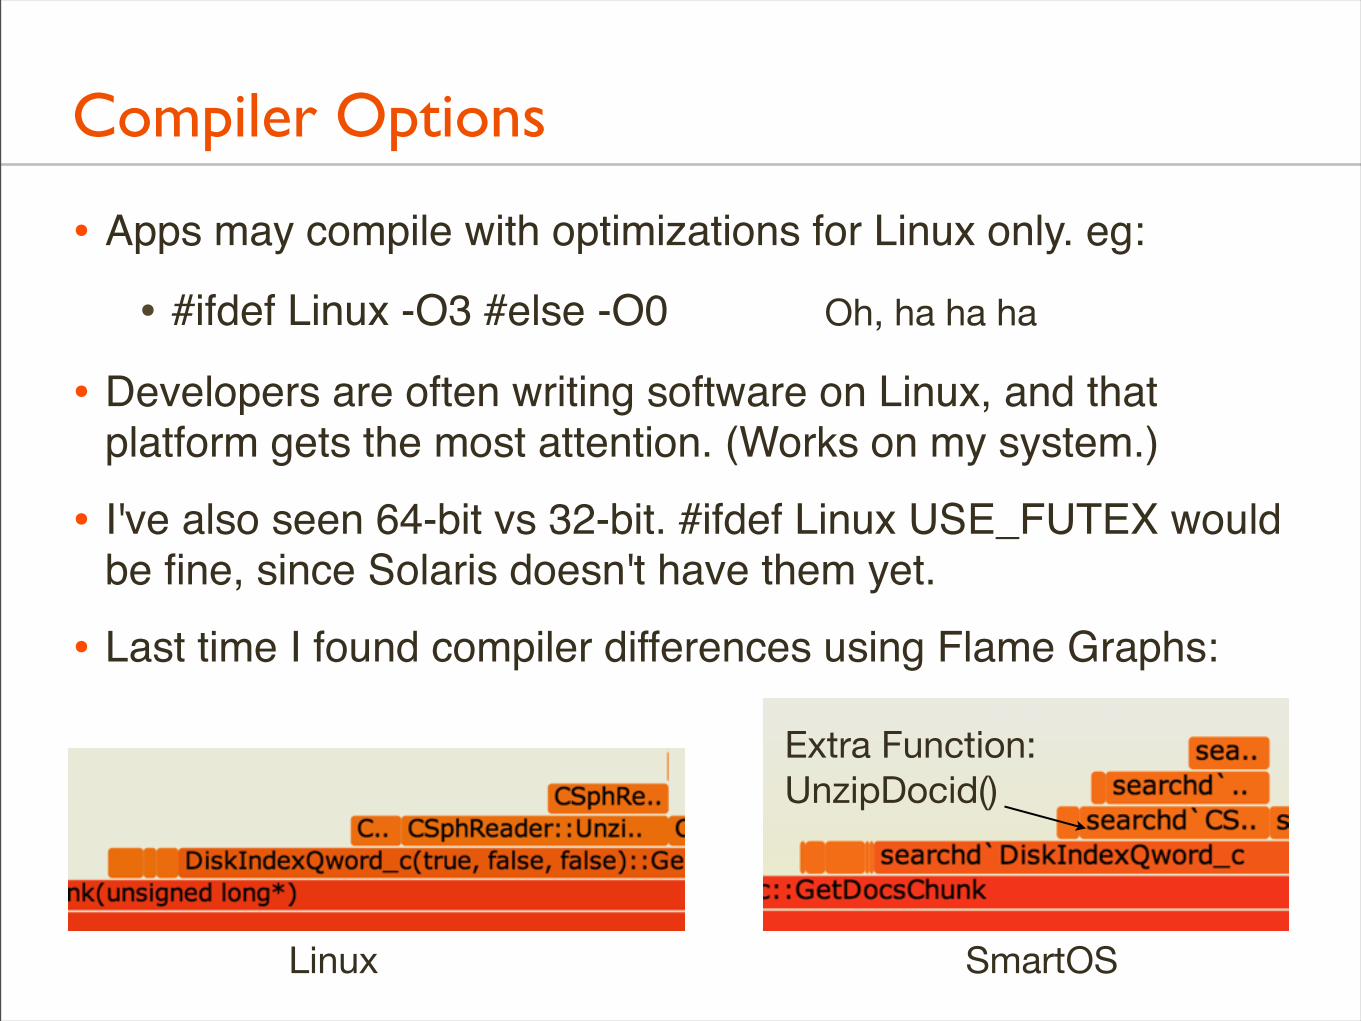
Compiler Options
• Apps may compile with optimizations for Linux only. eg:
• #ifdef Linux -O3 #else -O0
• Developers are often writing software on Linux, and that platform gets the most attention. (Works on my system.)
• I've also seen 64-bit vs 32-bit. #ifdef Linux USE_FUTEX would be fine, since Solaris doesn't have them yet.
• Last time I found compiler differences using Flame Graphs:
Linux SmartOS
Extra Function:UnzipDocid()
Oh, ha ha ha
Compiler Options, cont.
• Can be addressed by tuning packages in the repo
• Also file bugs/patches with developers to tune Makefiles
• Someone has to do this, eg, package repo staff/community who find and do the workarounds anyway
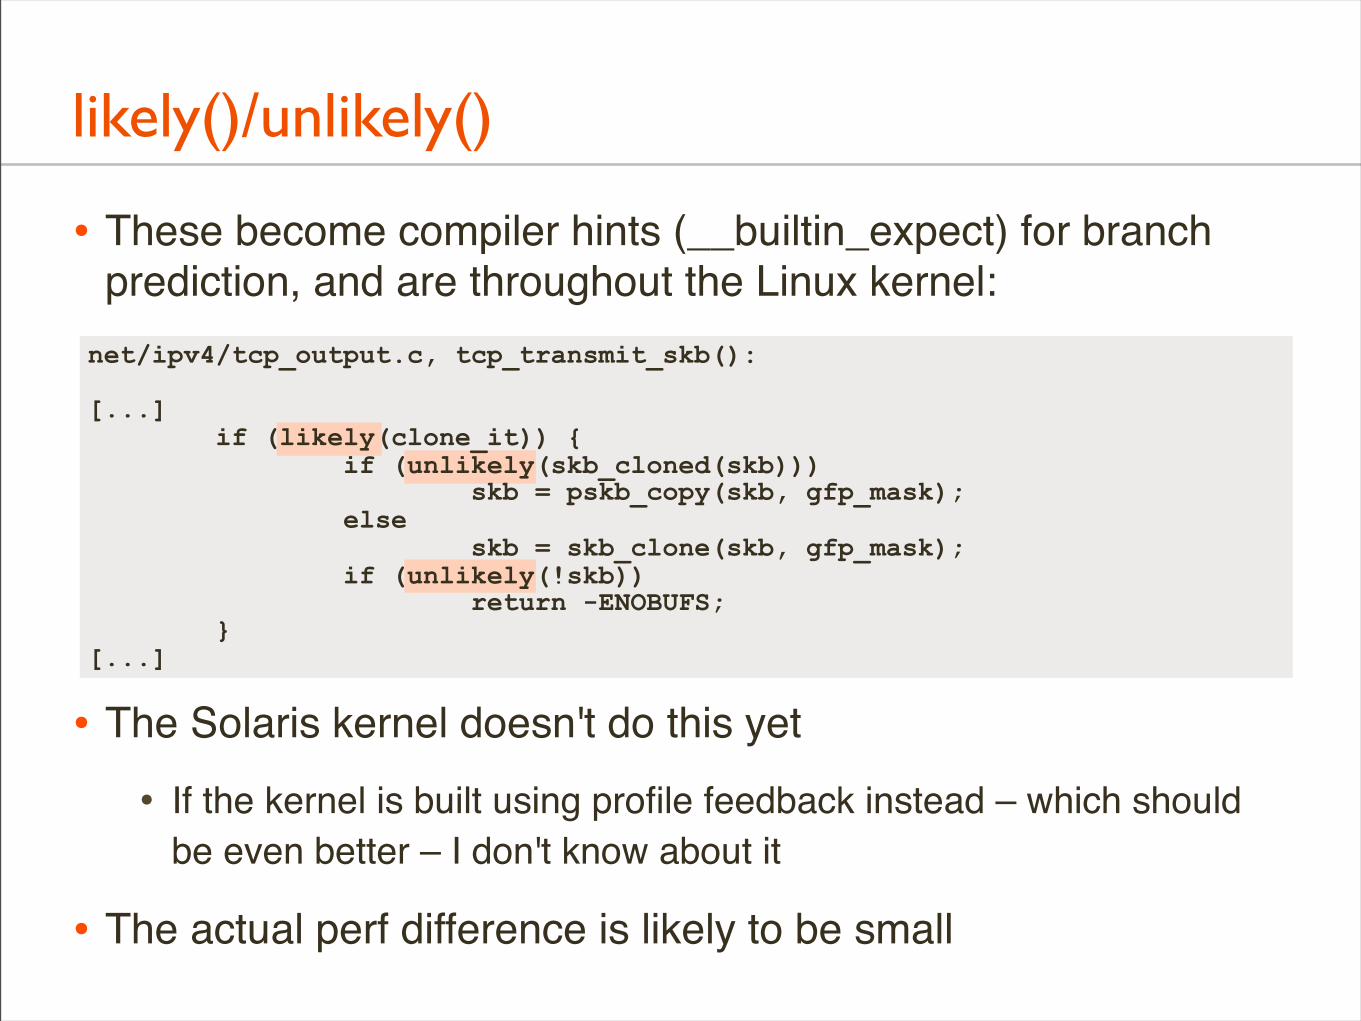
likely()/unlikely()
• These become compiler hints (__builtin_expect) for branch prediction, and are throughout the Linux kernel:
• The Solaris kernel doesn't do this yet
• If the kernel is built using profile feedback instead – which should be even better – I don't know about it
• The actual perf difference is likely to be small
net/ipv4/tcp_output.c, tcp_transmit_skb():
[...] if (likely(clone_it)) { if (unlikely(skb_cloned(skb))) skb = pskb_copy(skb, gfp_mask); else skb = skb_clone(skb, gfp_mask); if (unlikely(!skb)) return -ENOBUFS; }[...]
likely()/unlikely(), cont.
• Could be adopted by kernel engineering
• Might help readability, might not
Tickless Kernel
• Linux does this already (DynTicks), which reduces interrupts and improves processor power saving (good for laptops and embedded devices)
• Solaris still has a clock() routine, to perform various kernel housekeeping functions
• Called by default at 100 Hertz
• If hires_tick=1, at 1000 Hertz
• I've occasionally encountered perf issues involving 10 ms latencies, that don't exist on Linux
• ... which become 1 ms latencies after setting hires_tick=1
Tickless Kernel, cont.
• Sun/Oracle did start work on this years ago...
Process Swapping
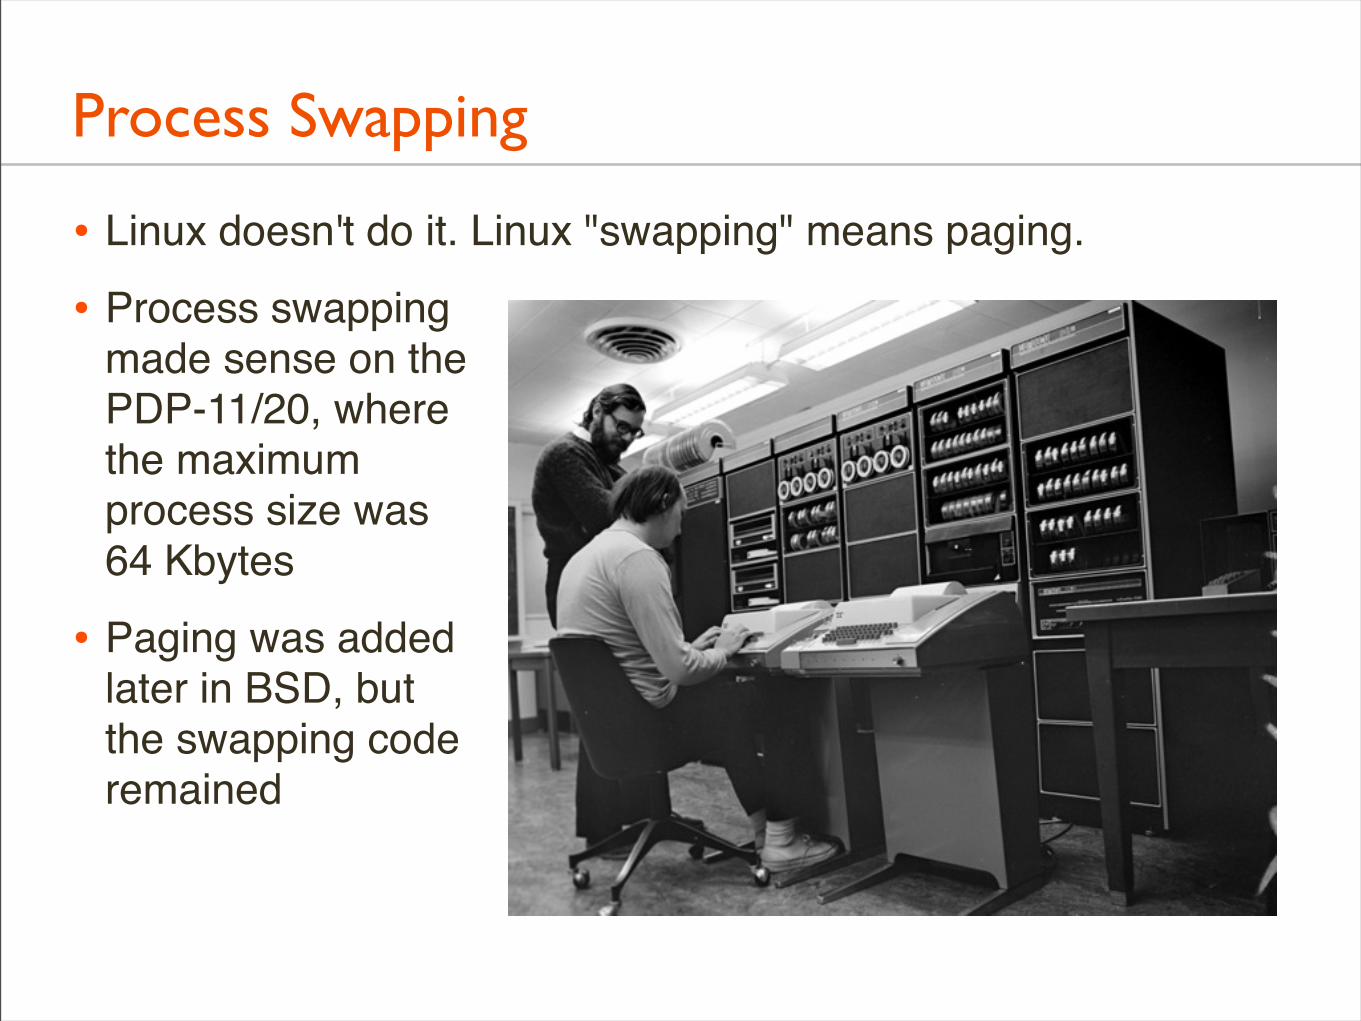
• Linux doesn't do it. Linux "swapping" means paging.
• Process swappingmade sense on thePDP-11/20, wherethe maximumprocess size was64 Kbytes
• Paging was addedlater in BSD, butthe swapping coderemained
Process Swapping, cont.
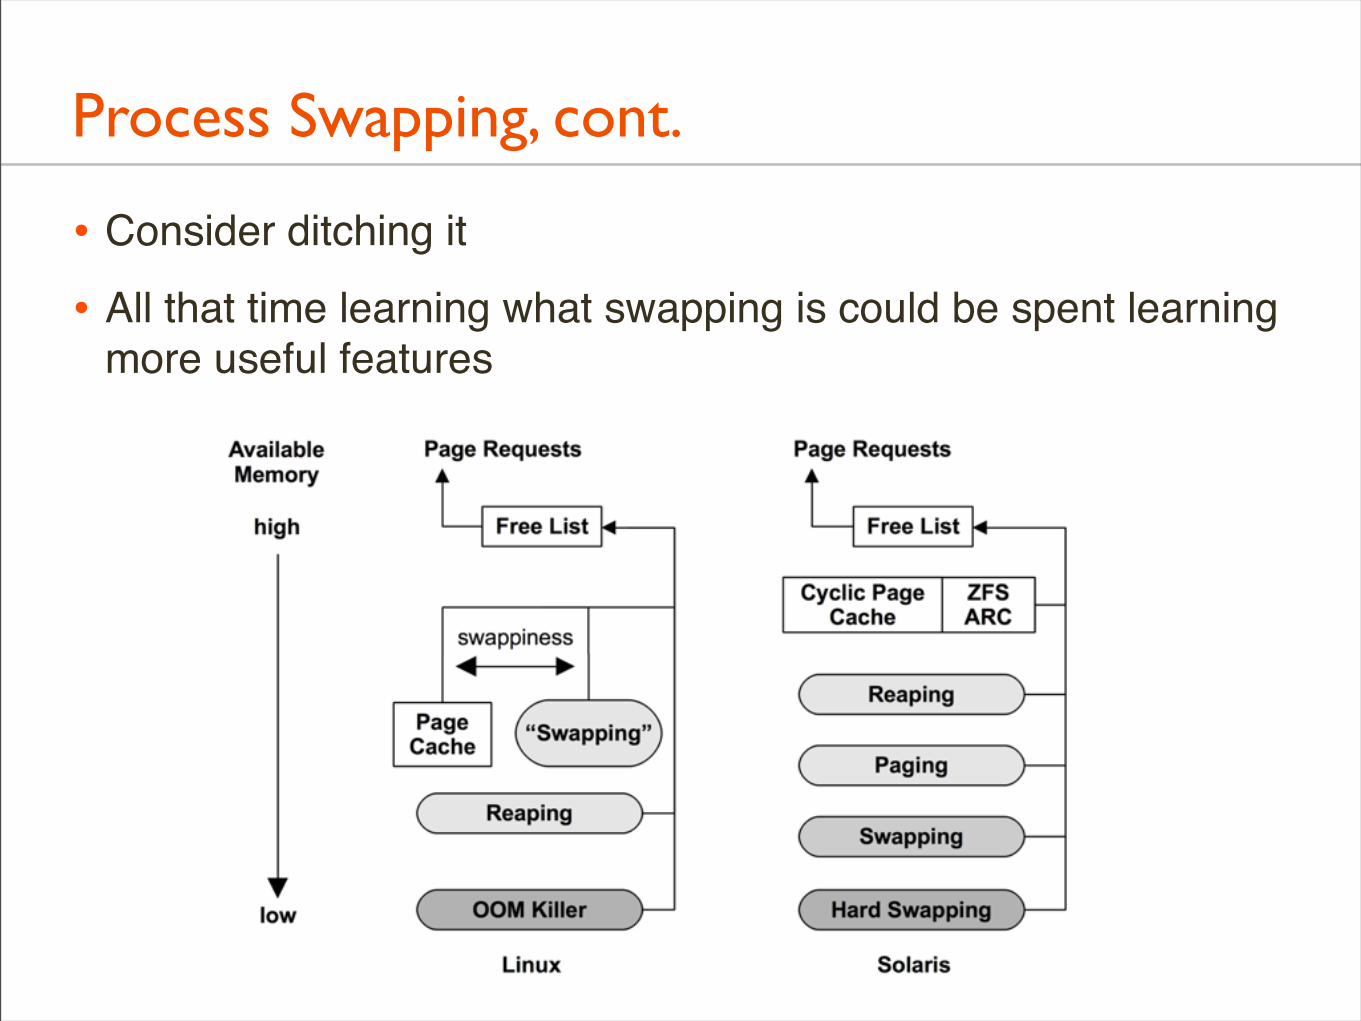
• Consider ditching it
• All that time learning what swapping is could be spent learning more useful features
Overcommit & OOM Killer
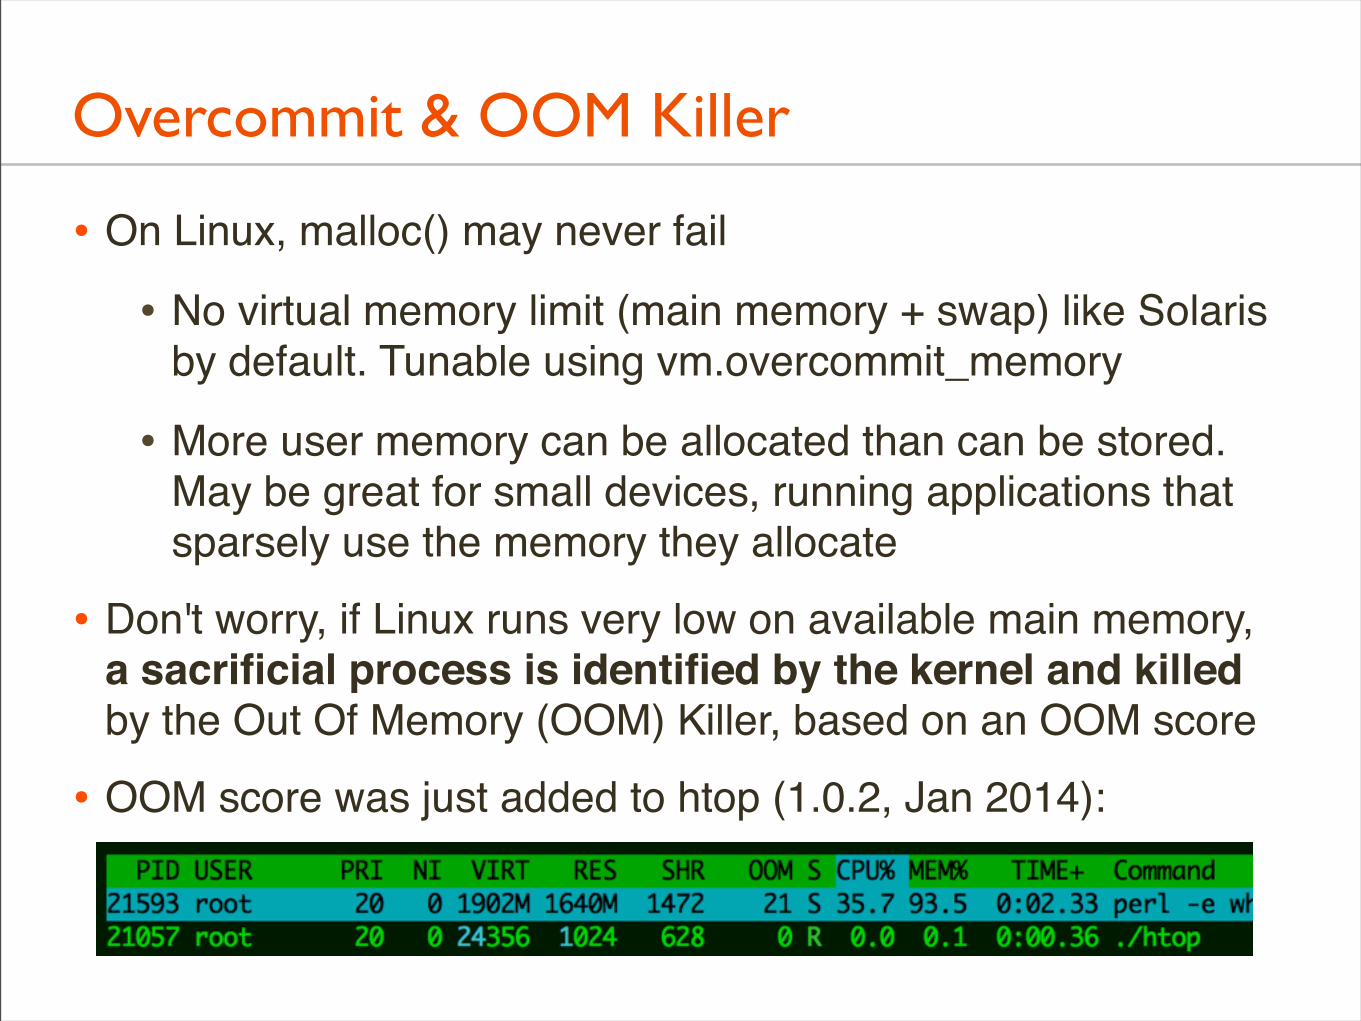
• On Linux, malloc() may never fail
• No virtual memory limit (main memory + swap) like Solaris by default. Tunable using vm.overcommit_memory
• More user memory can be allocated than can be stored. May be great for small devices, running applications that sparsely use the memory they allocate
• Don't worry, if Linux runs very low on available main memory, a sacrificial process is identified by the kernel and killed by the Out Of Memory (OOM) Killer, based on an OOM score
• OOM score was just added to htop (1.0.2, Jan 2014):
Overcommit & OOM Killer, cont.
• Solaris can learn why not to do this (cautionary tale)
• If an important app depended on this, and couldn't be fixed, the kernel could have an overcommit option that wasn't default
• ... this is why so much new code doesn't check for ENOMEM
SLUB
• Linux integrated the Solaris kernel SLAB allocator, then later simplified it: The SLUB allocator
• Removed object queues and per-CPU caches, leaving NUMA optimization to the page allocator's free lists
• Worth considering?
Lazy TLB
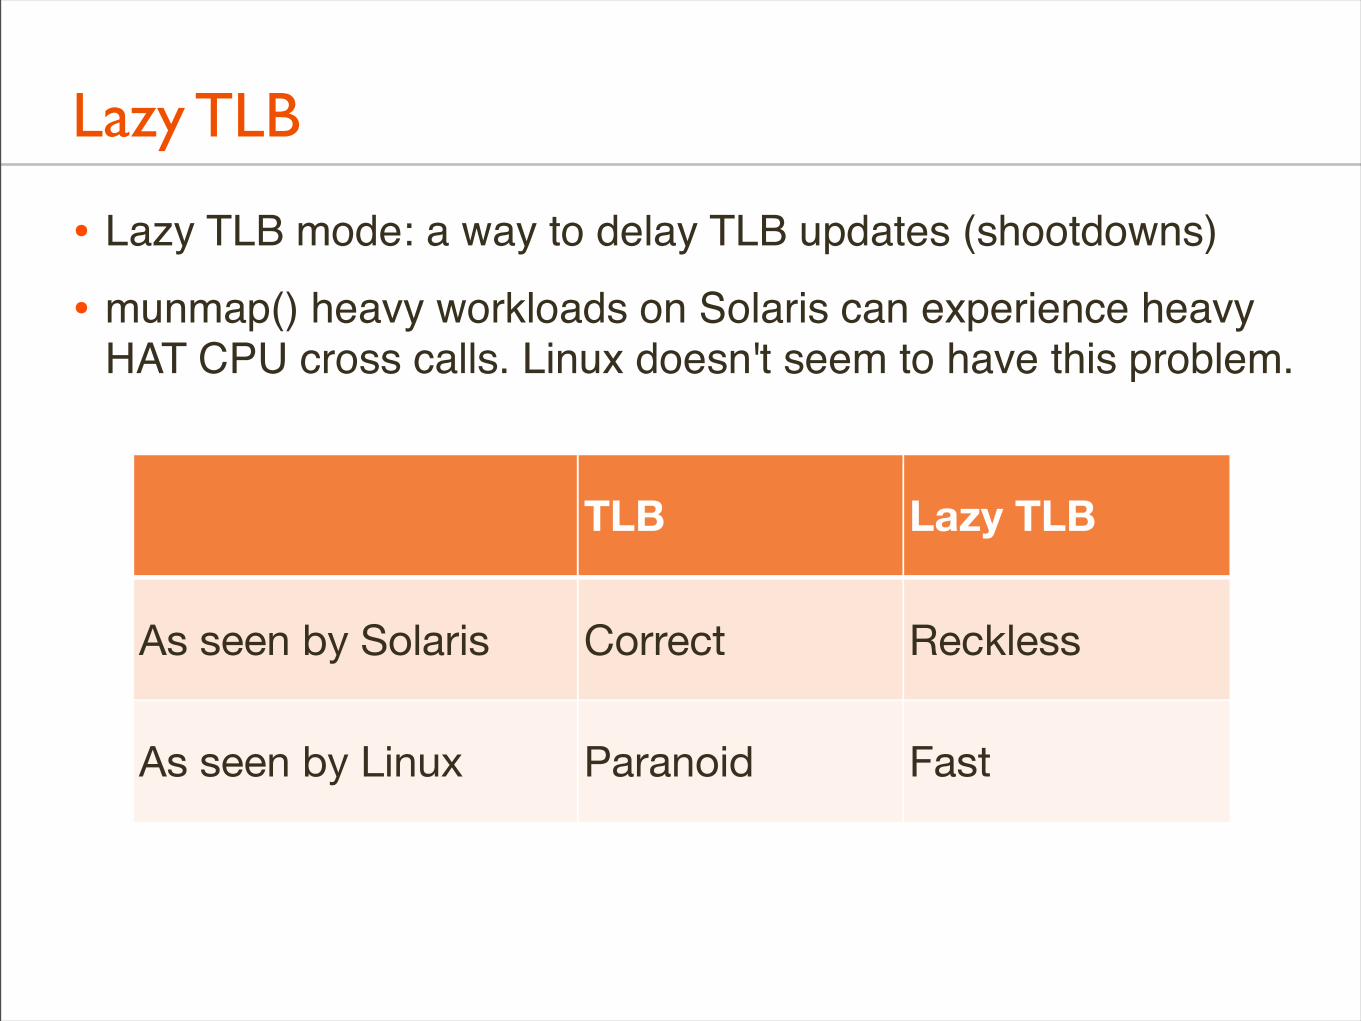
• Lazy TLB mode: a way to delay TLB updates (shootdowns)
• munmap() heavy workloads on Solaris can experience heavy HAT CPU cross calls. Linux doesn't seem to have this problem.
TLB Lazy TLB
As seen by Solaris Correct Reckless
As seen by Linux Paranoid Fast
Lazy TLB, cont.
• This difference needs to be investigated, quantified, and possibly fixed (tunable?)
TIME_WAIT Recycling
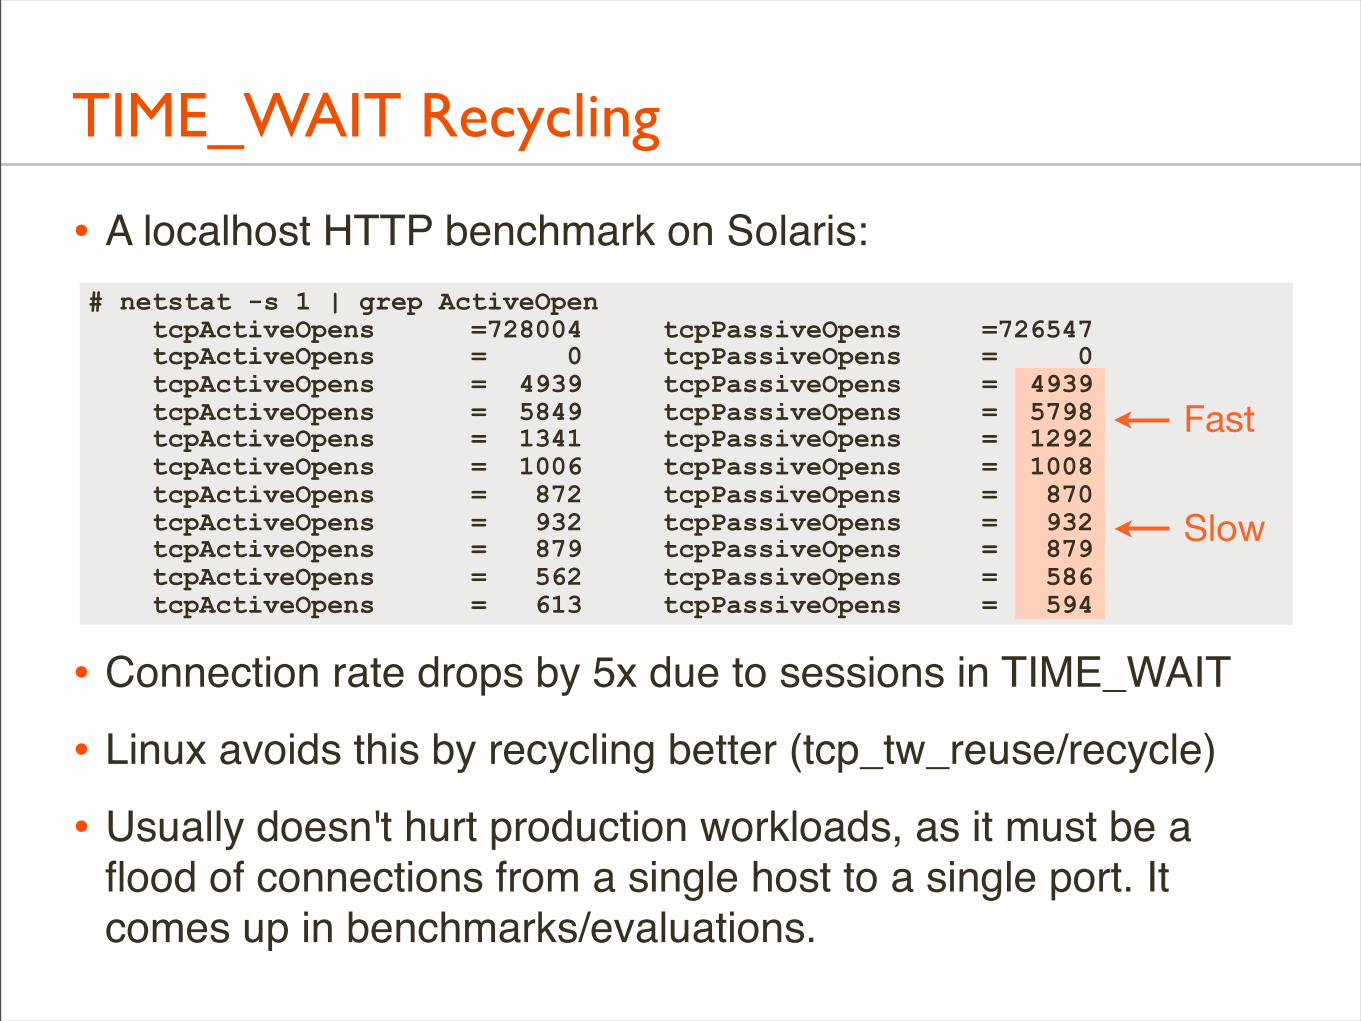
• A localhost HTTP benchmark on Solaris:
• Connection rate drops by 5x due to sessions in TIME_WAIT
• Linux avoids this by recycling better (tcp_tw_reuse/recycle)
• Usually doesn't hurt production workloads, as it must be a flood of connections from a single host to a single port. It comes up in benchmarks/evaluations.
# netstat -s 1 | grep ActiveOpen tcpActiveOpens =728004 tcpPassiveOpens =726547 tcpActiveOpens = 0 tcpPassiveOpens = 0 tcpActiveOpens = 4939 tcpPassiveOpens = 4939 tcpActiveOpens = 5849 tcpPassiveOpens = 5798 tcpActiveOpens = 1341 tcpPassiveOpens = 1292 tcpActiveOpens = 1006 tcpPassiveOpens = 1008 tcpActiveOpens = 872 tcpPassiveOpens = 870 tcpActiveOpens = 932 tcpPassiveOpens = 932 tcpActiveOpens = 879 tcpPassiveOpens = 879 tcpActiveOpens = 562 tcpPassiveOpens = 586 tcpActiveOpens = 613 tcpPassiveOpens = 594
Fast
Slow
TIME_WAIT Recycling, cont.
• Improve tcp_time_wait_processing()
• This is being fixed for illumos/SmartOS
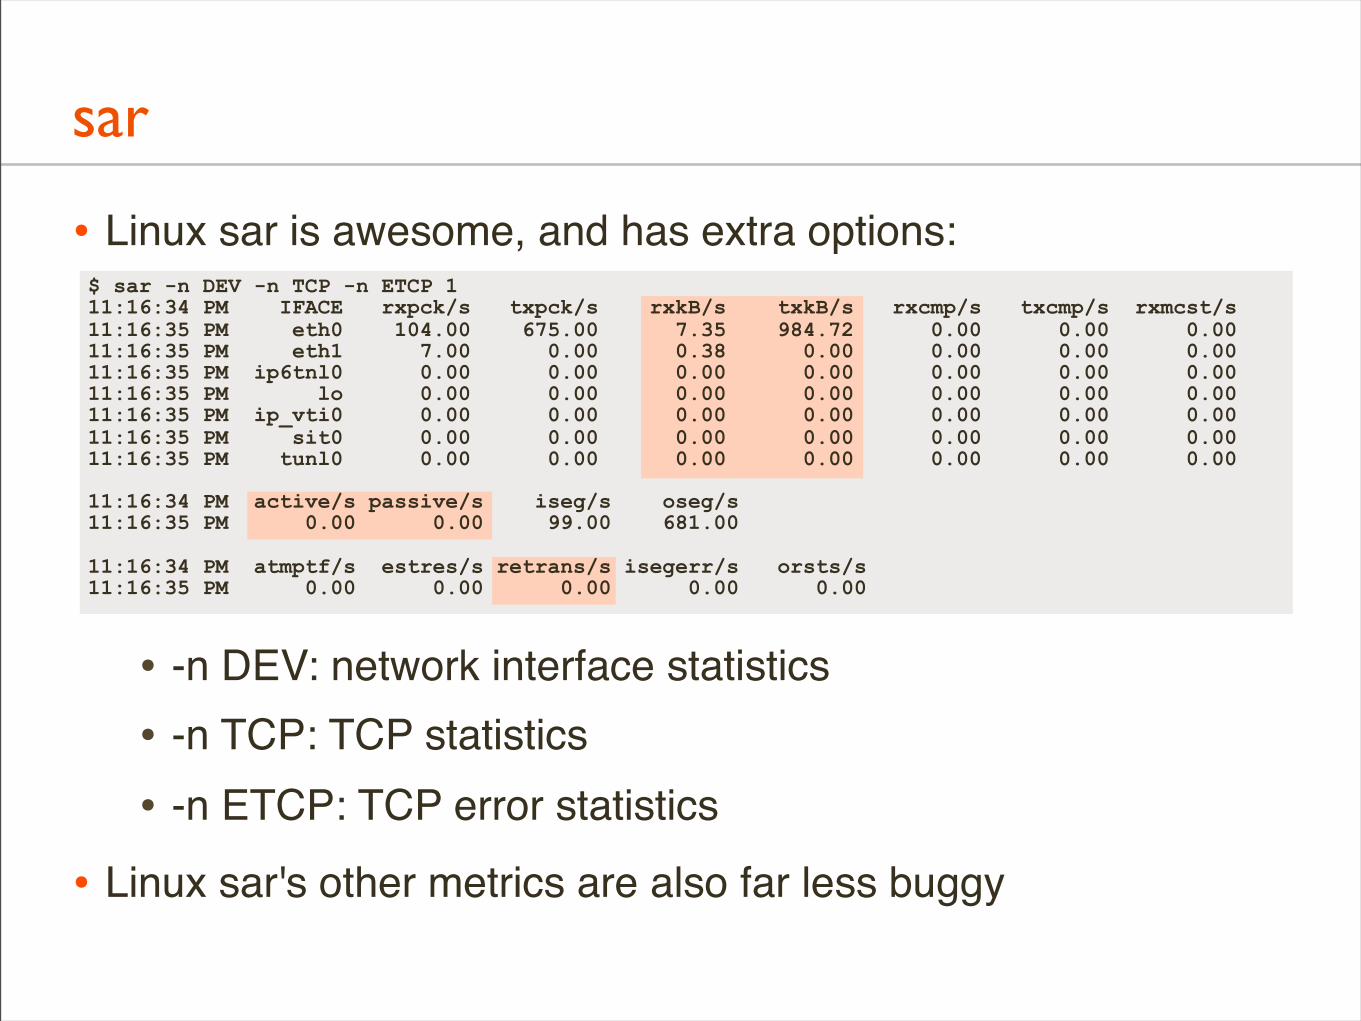
sar
• Linux sar is awesome, and has extra options:
• -n DEV: network interface statistics• -n TCP: TCP statistics• -n ETCP: TCP error statistics
• Linux sar's other metrics are also far less buggy
$ sar -n DEV -n TCP -n ETCP 111:16:34 PM IFACE rxpck/s txpck/s rxkB/s txkB/s rxcmp/s txcmp/s rxmcst/s11:16:35 PM eth0 104.00 675.00 7.35 984.72 0.00 0.00 0.0011:16:35 PM eth1 7.00 0.00 0.38 0.00 0.00 0.00 0.0011:16:35 PM ip6tnl0 0.00 0.00 0.00 0.00 0.00 0.00 0.0011:16:35 PM lo 0.00 0.00 0.00 0.00 0.00 0.00 0.0011:16:35 PM ip_vti0 0.00 0.00 0.00 0.00 0.00 0.00 0.0011:16:35 PM sit0 0.00 0.00 0.00 0.00 0.00 0.00 0.0011:16:35 PM tunl0 0.00 0.00 0.00 0.00 0.00 0.00 0.00
11:16:34 PM active/s passive/s iseg/s oseg/s11:16:35 PM 0.00 0.00 99.00 681.00
11:16:34 PM atmptf/s estres/s retrans/s isegerr/s orsts/s11:16:35 PM 0.00 0.00 0.00 0.00 0.00
sar, cont.
• Sar must be fixed for the 21st century
• Use the Linux sar options and column names, which follow a neat convention
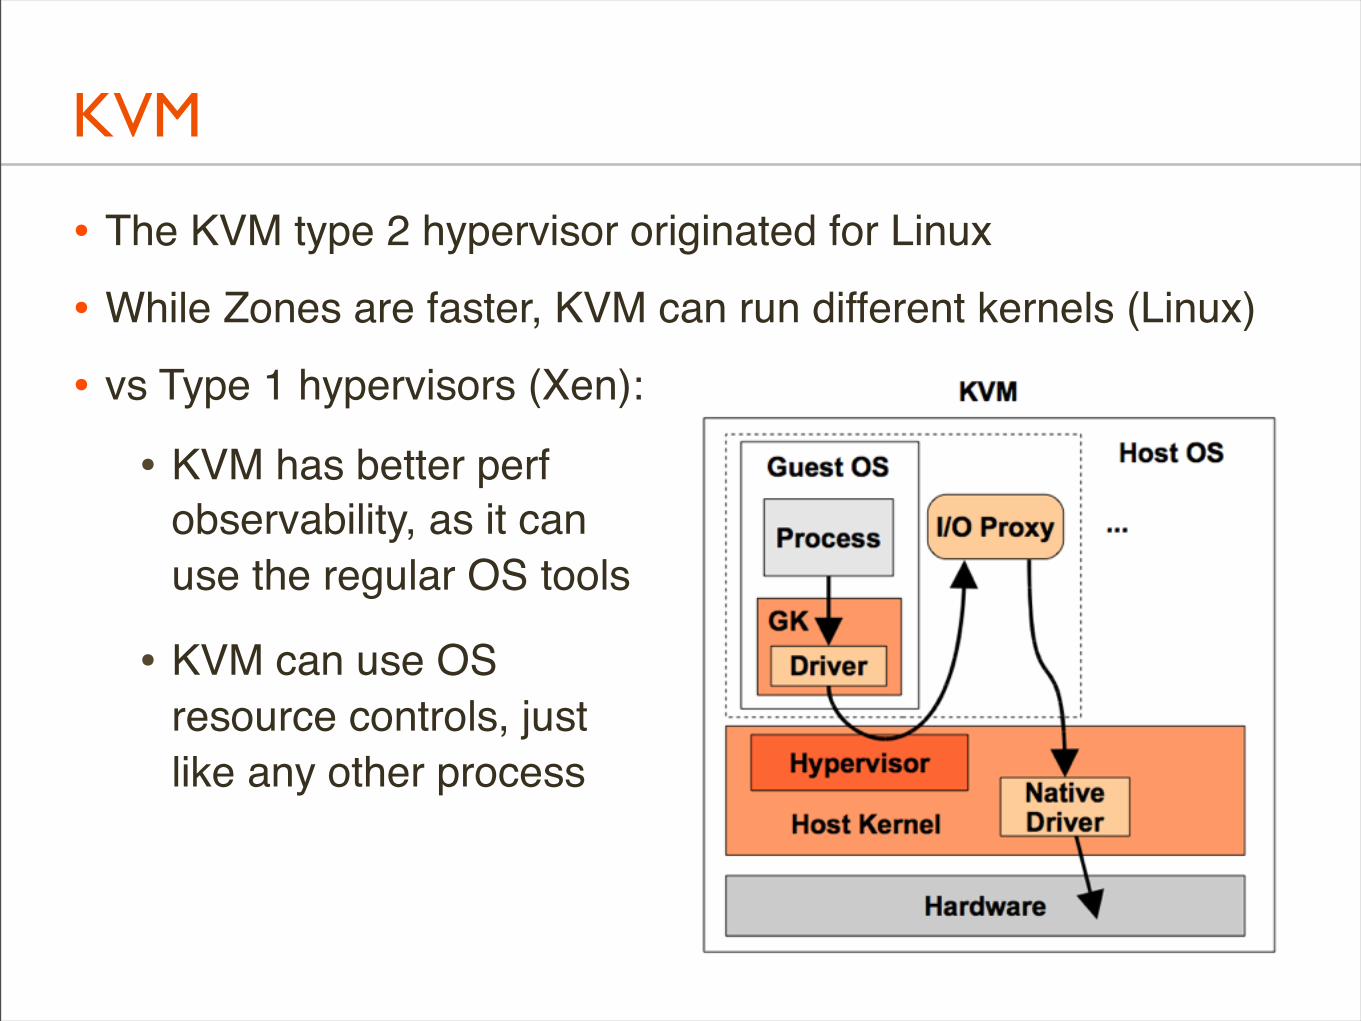
KVM
• The KVM type 2 hypervisor originated for Linux
• While Zones are faster, KVM can run different kernels (Linux)
• vs Type 1 hypervisors (Xen):
• KVM has better perfobservability, as it canuse the regular OS tools
• KVM can use OSresource controls, justlike any other process
KVM, cont.
• illumos/SmartOS learned this, Joyent ported KVM!
• Oracle Solaris doesn't have it yet
What Linux can learn from Solaris performance
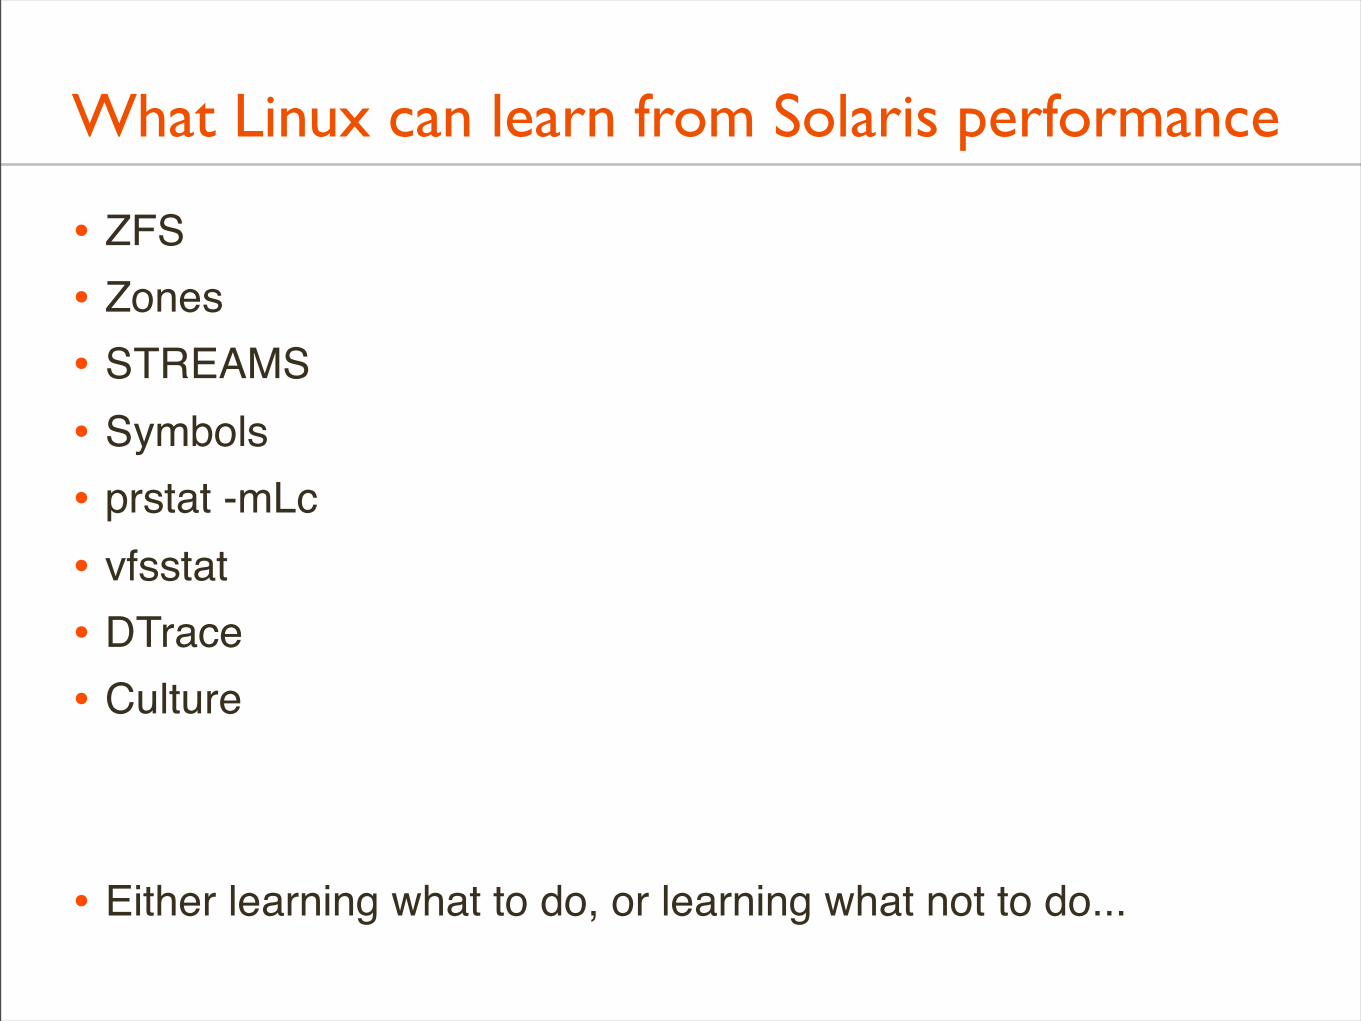
What Linux can learn from Solaris performance
• ZFS• Zones• STREAMS• Symbols• prstat -mLc• vfsstat• DTrace• Culture
• Either learning what to do, or learning what not to do...
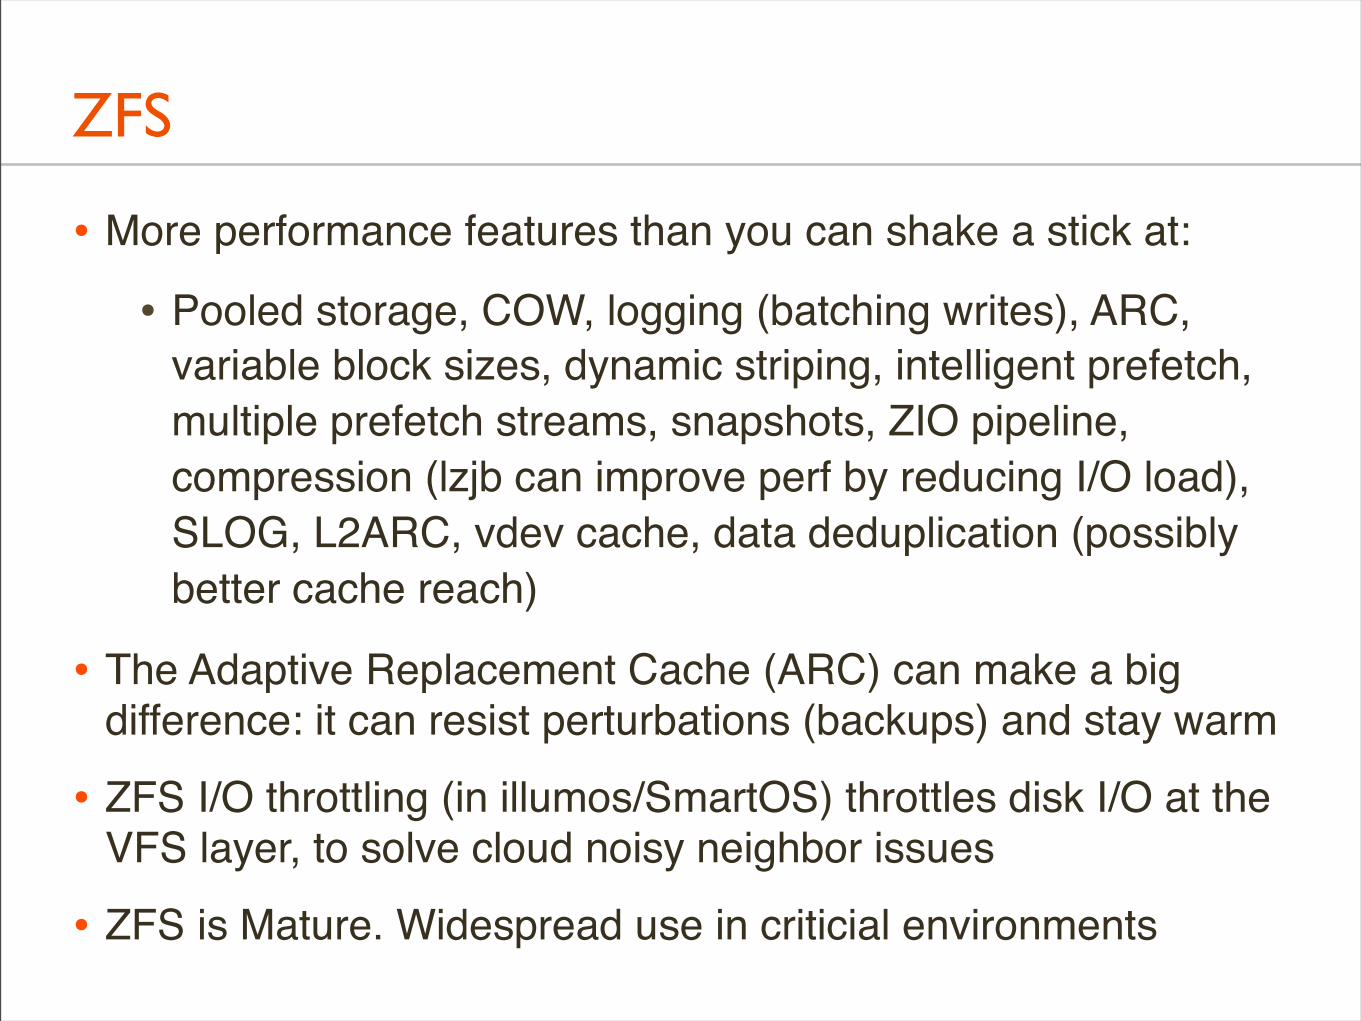
ZFS
• More performance features than you can shake a stick at:
• Pooled storage, COW, logging (batching writes), ARC, variable block sizes, dynamic striping, intelligent prefetch, multiple prefetch streams, snapshots, ZIO pipeline, compression (lzjb can improve perf by reducing I/O load), SLOG, L2ARC, vdev cache, data deduplication (possibly better cache reach)
• The Adaptive Replacement Cache (ARC) can make a big difference: it can resist perturbations (backups) and stay warm
• ZFS I/O throttling (in illumos/SmartOS) throttles disk I/O at the VFS layer, to solve cloud noisy neighbor issues
• ZFS is Mature. Widespread use in criticial environments
ZFS, cont.
• Linux has been learning about ZFS for a while
• http://zfsonlinux.org/
• btrfs
Zones
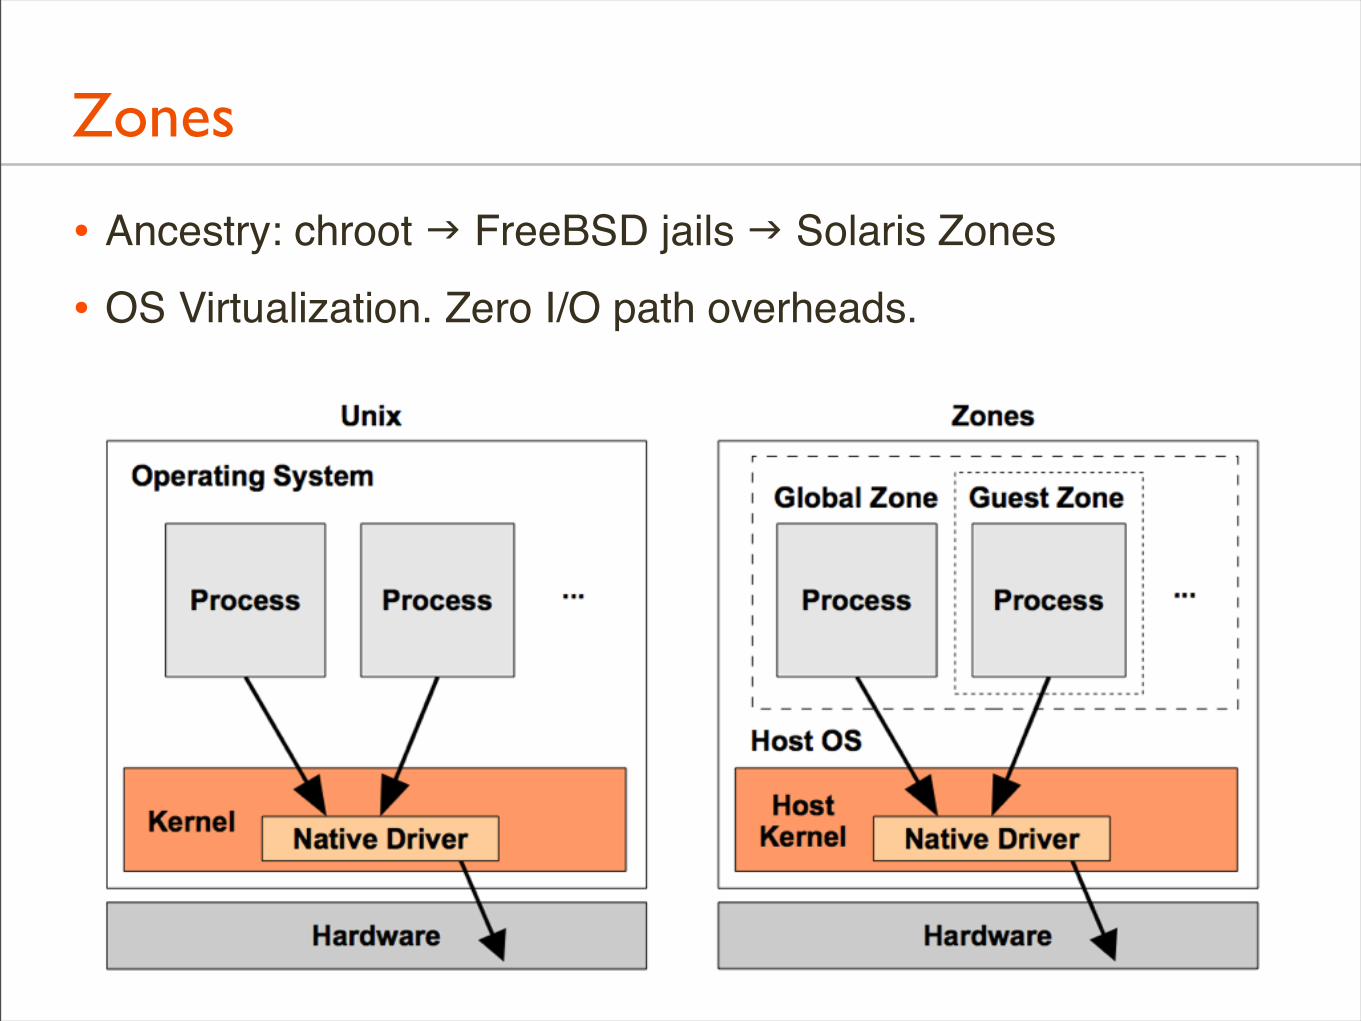
• Ancestry: chroot FreeBSD jails Solaris Zones
• OS Virtualization. Zero I/O path overheads.
Zones, cont.
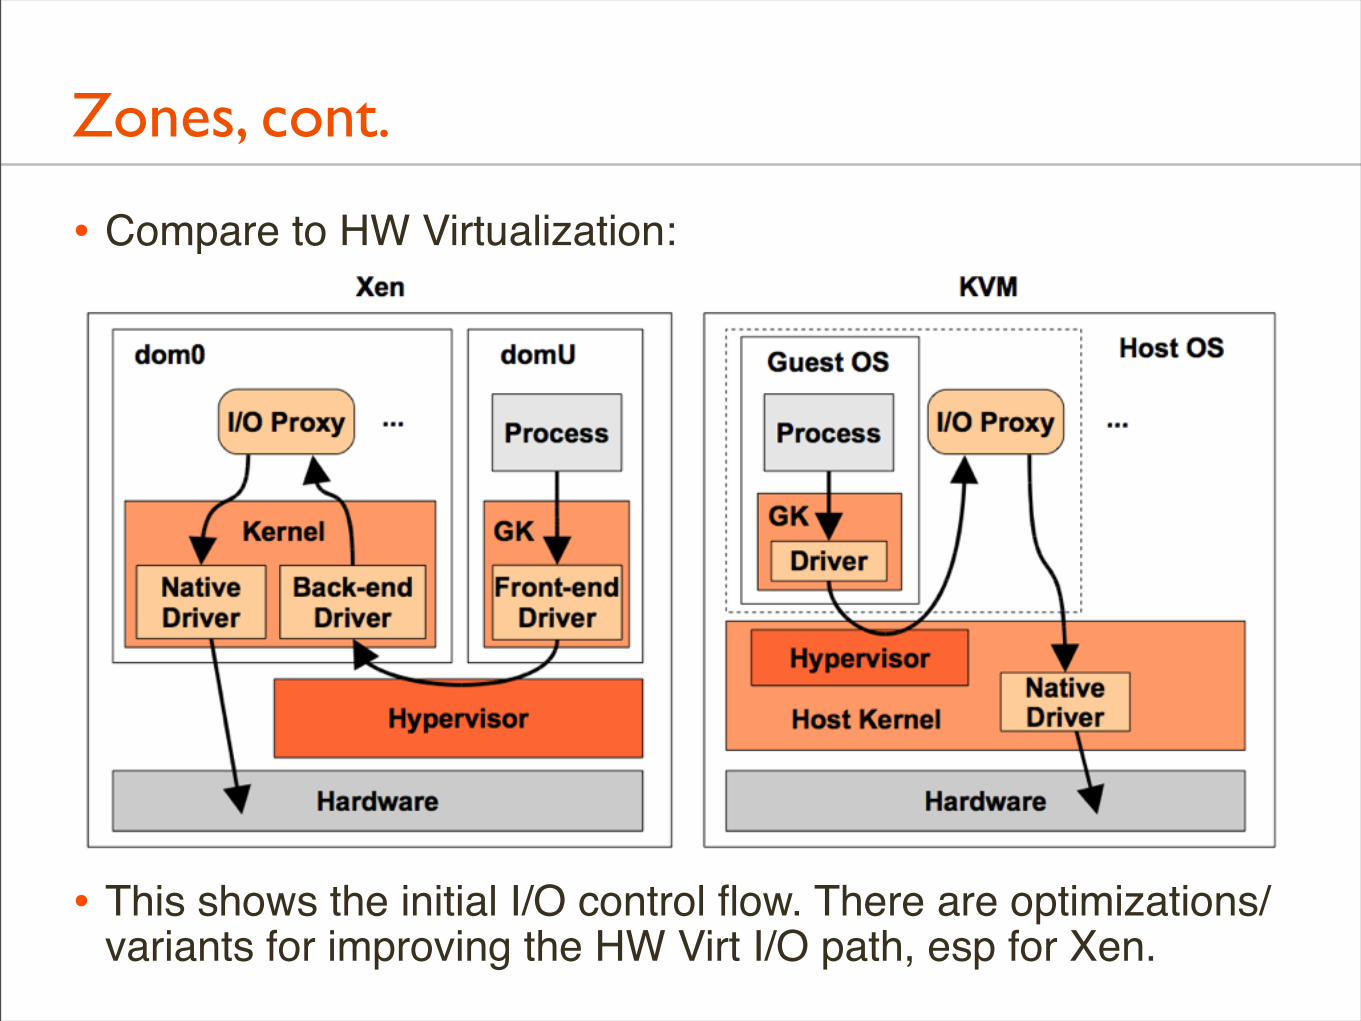
• Compare to HW Virtualization:
• This shows the initial I/O control flow. There are optimizations/variants for improving the HW Virt I/O path, esp for Xen.
Zones, cont.
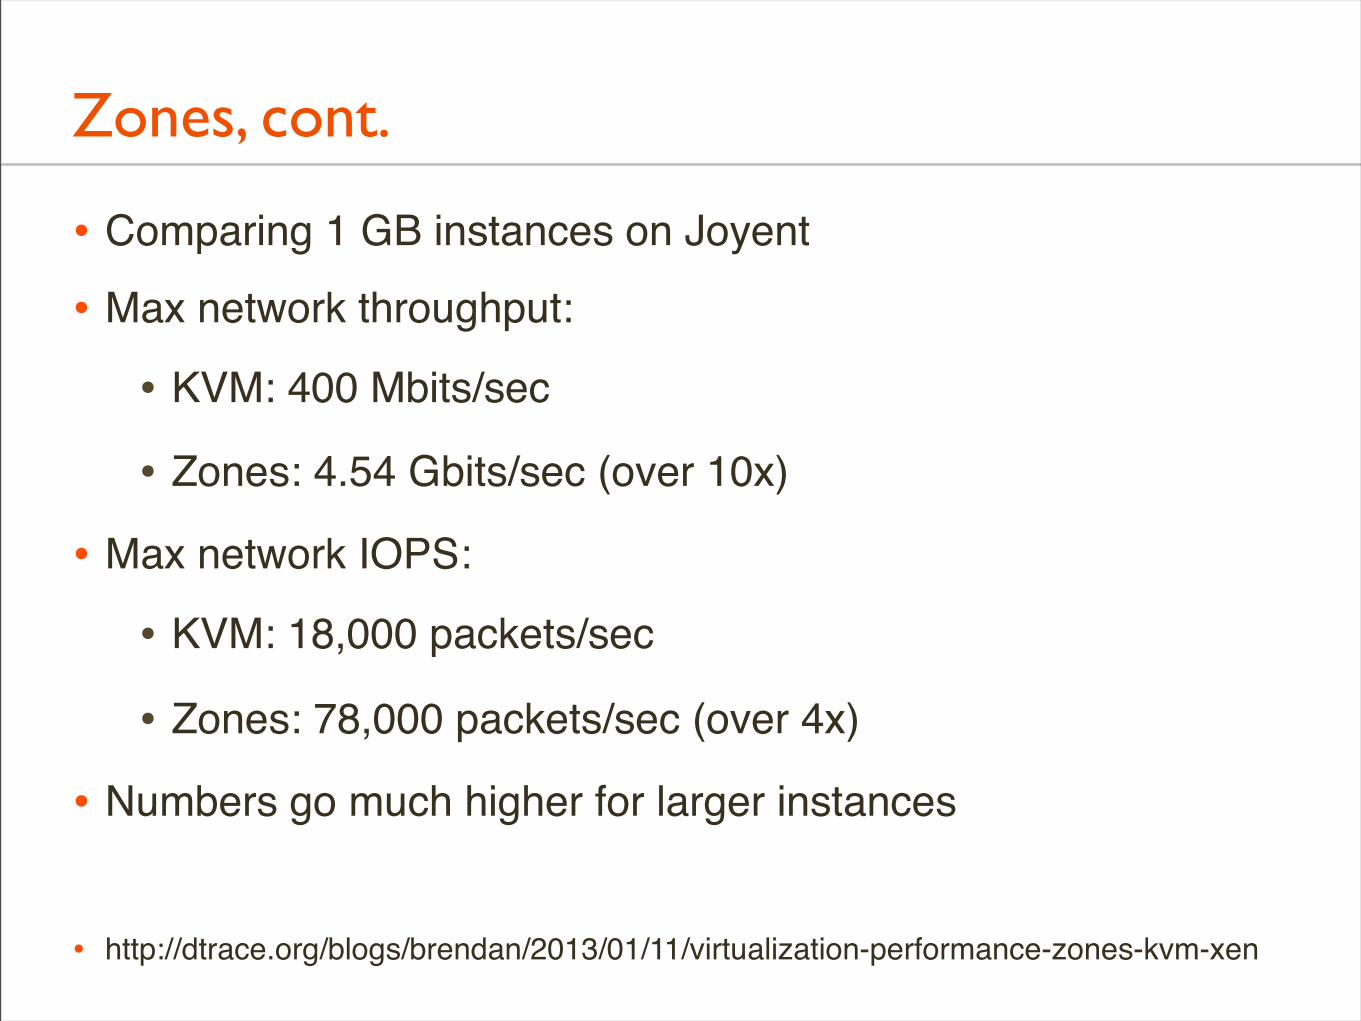
• Comparing 1 GB instances on Joyent
• Max network throughput:
• KVM: 400 Mbits/sec
• Zones: 4.54 Gbits/sec (over 10x)
• Max network IOPS:
• KVM: 18,000 packets/sec
• Zones: 78,000 packets/sec (over 4x)
• Numbers go much higher for larger instances
• http://dtrace.org/blogs/brendan/2013/01/11/virtualization-performance-zones-kvm-xen
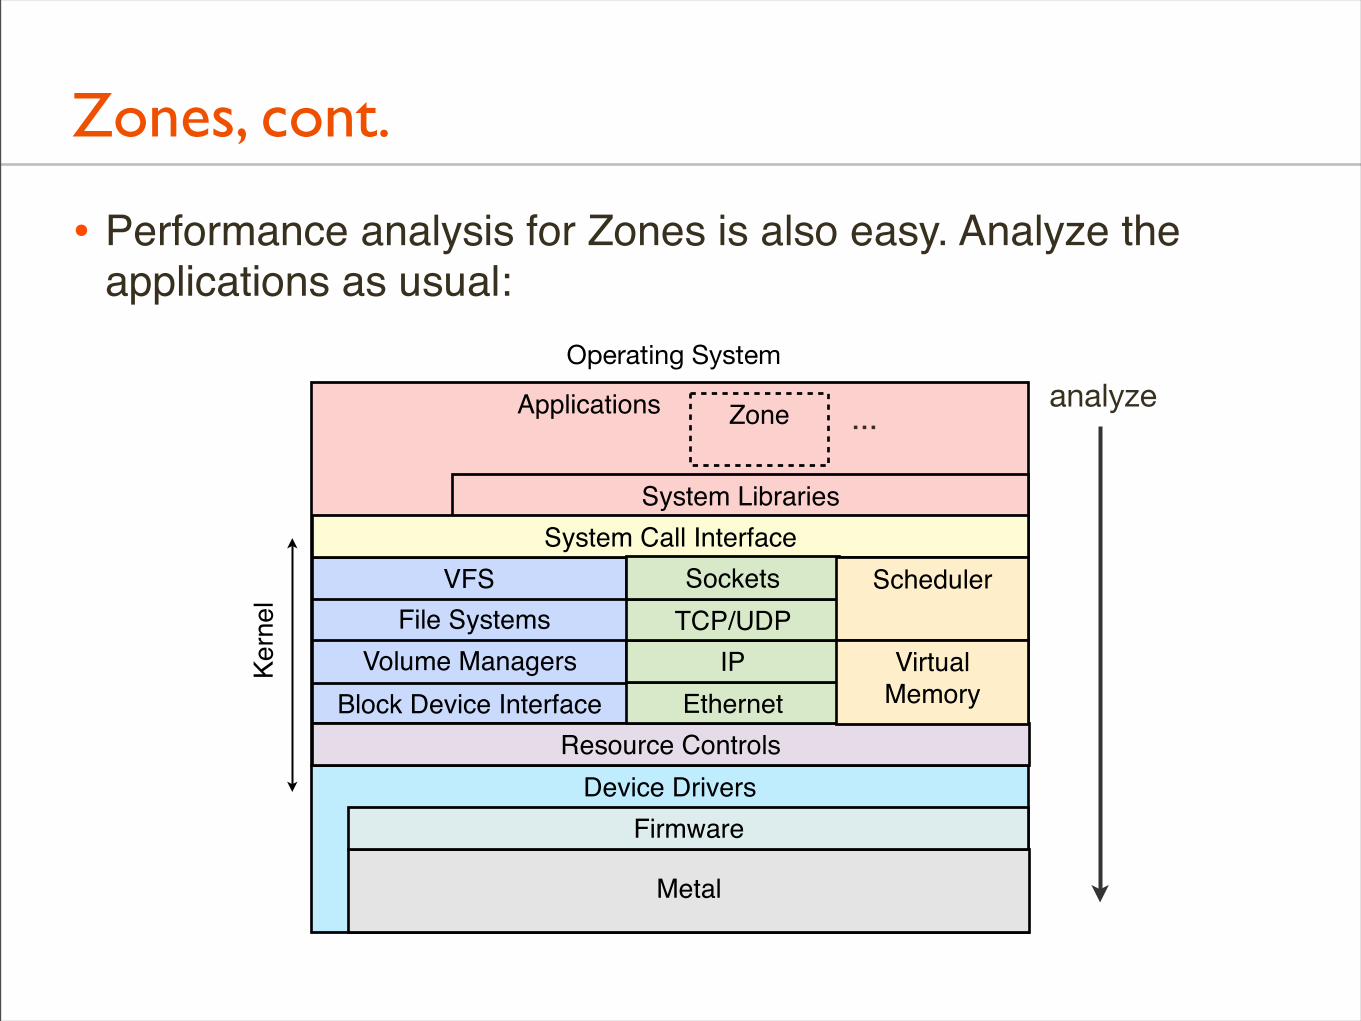
• Performance analysis for Zones is also easy. Analyze the applications as usual:
Zones, cont.
Device Drivers
Applications .
Block Device InterfaceVolume Managers
File SystemsVFS
System Libraries
Resource Controls
System Call Interface
Metal
Kern
el
EthernetIP
TCP/UDPSockets
Firmware
Operating System
Scheduler
VirtualMemory
Zone ... analyze
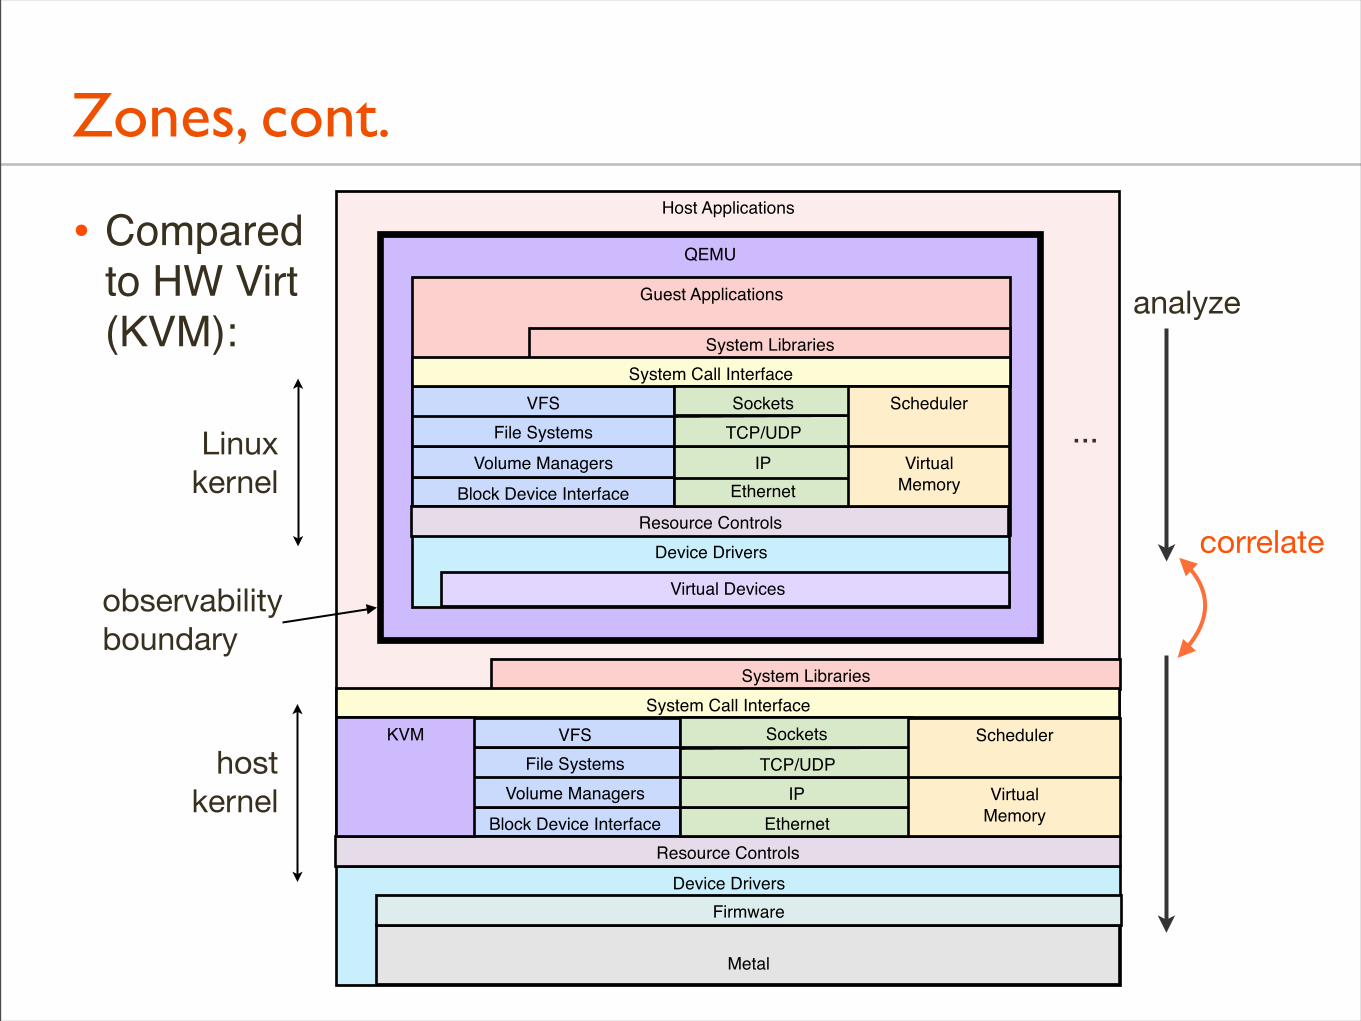
• Comparedto HW Virt(KVM):
Device Drivers
Host Applications
Block Device InterfaceVolume Managers
File SystemsVFS
System Libraries
Resource Controls
System Call Interface
Metal
EthernetIP
TCP/UDPSockets
Firmware
Scheduler
VirtualMemory
KVM
Zones, cont.
QEMU
Device Drivers
Guest Applications
Block Device InterfaceVolume Managers
File SystemsVFS
System Libraries
Resource Controls
System Call Interface
Virtual Devices
EthernetIP
TCP/UDPSockets Scheduler
VirtualMemory
...Linuxkernel
hostkernel
observabilityboundary
analyze
correlate
Zones, cont.
• Linux has been learning: LXC & cgroups, but not widespread adoption yet. Docker will likely drive adoption.
STREAMS
• AT&T modular I/O subsystem
• Like Unix shell pipes, but for kernel messages. Can push modules into the stream to customize processing
• Introduced (fully) in Unix 8th Ed Research Unix, became SVr4 STREAMS, and was used by Solaris for network TCP/IP stack
• With greater demands for TCP/IP performance, the overheads of STREAMS reduced scalability
• Sun switched high-performing paths to be direct function calls
STREAMS, cont.
• A cautionary tale: not good for high performance code paths
Symbols
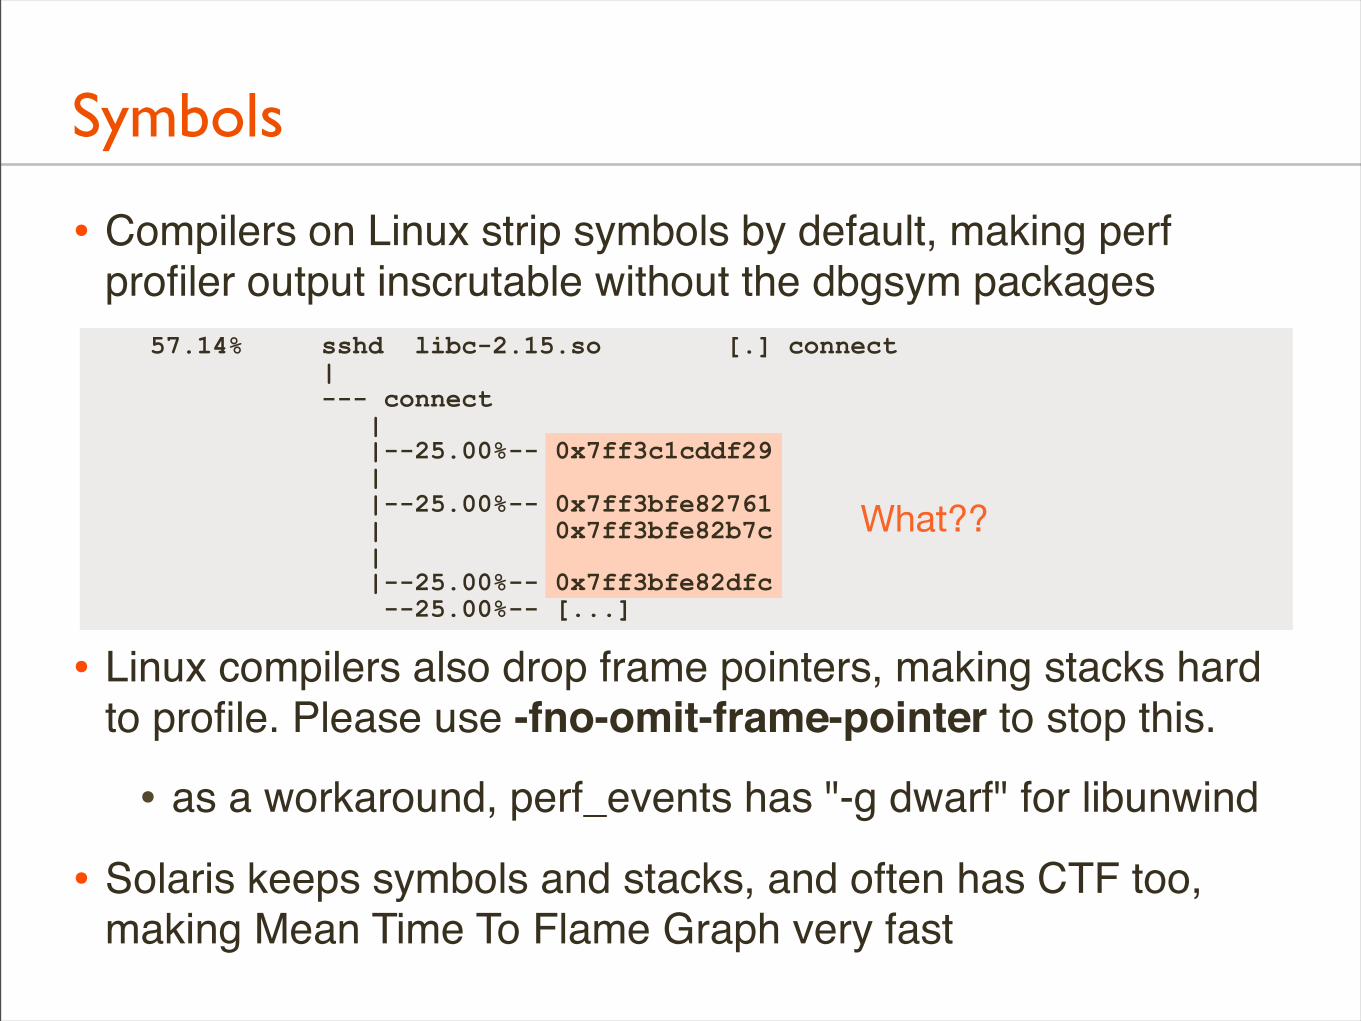
• Compilers on Linux strip symbols by default, making perf profiler output inscrutable without the dbgsym packages
• Linux compilers also drop frame pointers, making stacks hard to profile. Please use -fno-omit-frame-pointer to stop this.
• as a workaround, perf_events has "-g dwarf" for libunwind
• Solaris keeps symbols and stacks, and often has CTF too, making Mean Time To Flame Graph very fast
57.14% sshd libc-2.15.so [.] connect | --- connect | |--25.00%-- 0x7ff3c1cddf29 | |--25.00%-- 0x7ff3bfe82761 | 0x7ff3bfe82b7c | |--25.00%-- 0x7ff3bfe82dfc --25.00%-- [...]
What??
Symbols, cont.
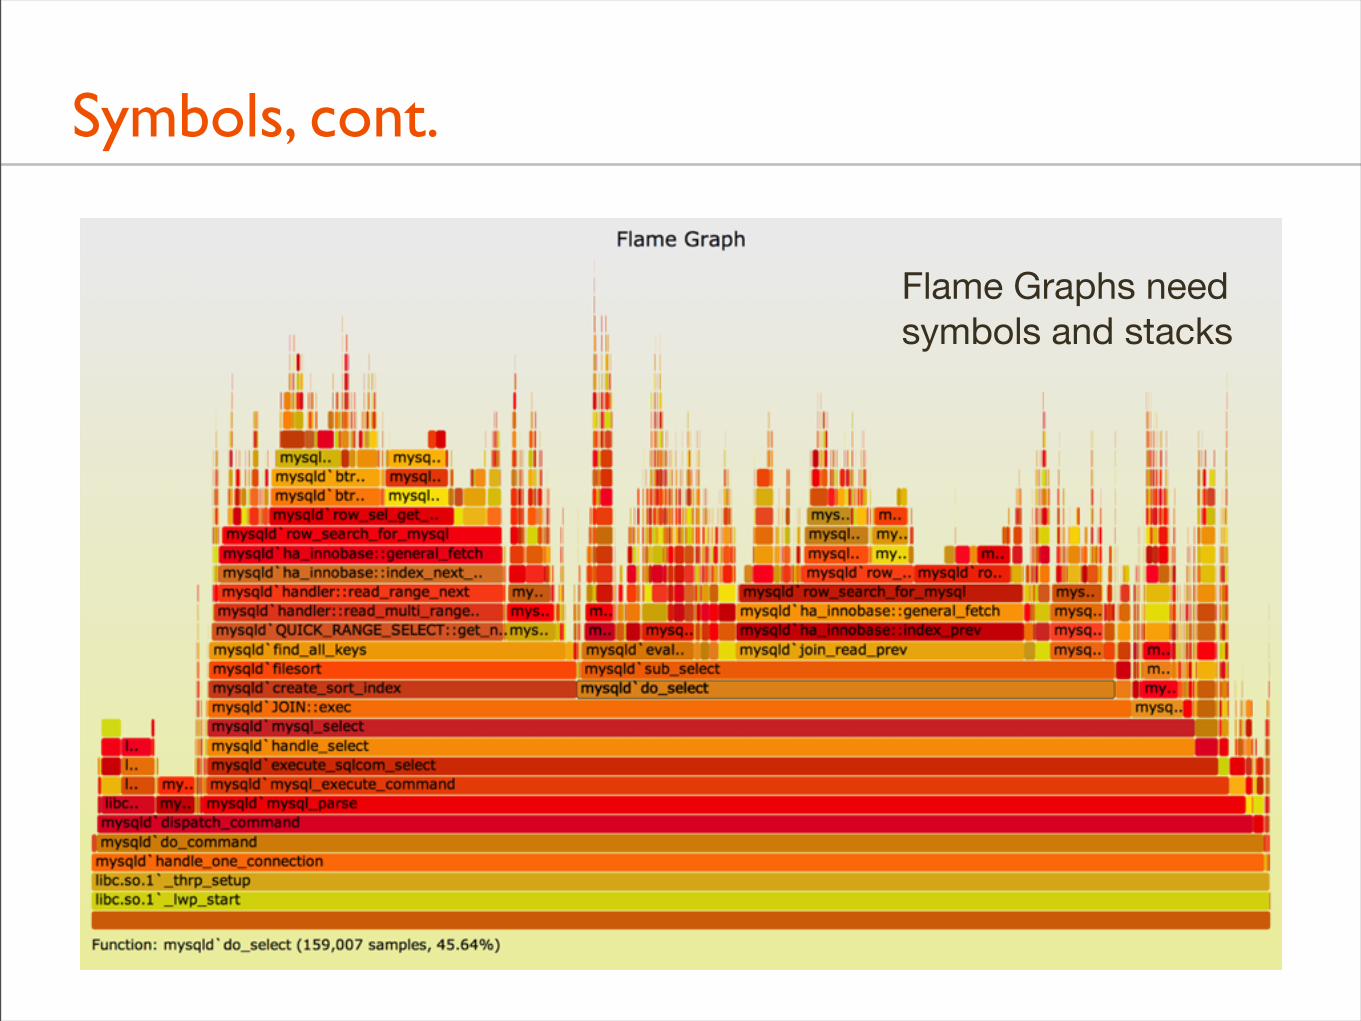
Flame Graphs needsymbols and stacks
Symbols, cont.
• Keep symbols and frame pointers. Faster resolution for performance analysis and troubleshooting.
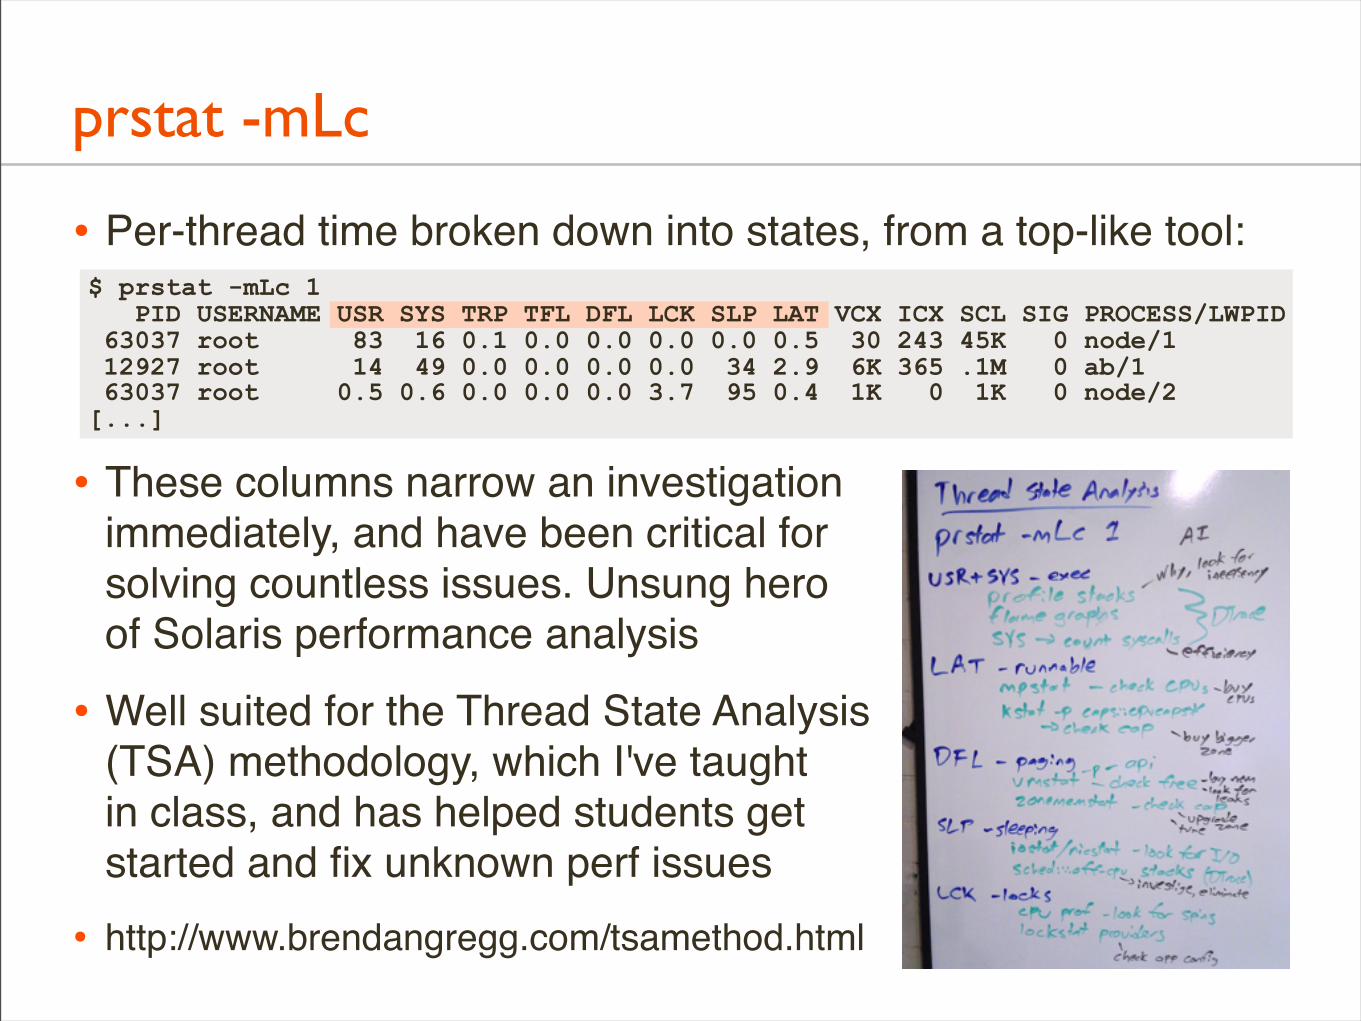
prstat -mLc
• Per-thread time broken down into states, from a top-like tool:
• These columns narrow an investigationimmediately, and have been critical forsolving countless issues. Unsung heroof Solaris performance analysis
• Well suited for the Thread State Analysis(TSA) methodology, which I've taughtin class, and has helped students getstarted and fix unknown perf issues
• http://www.brendangregg.com/tsamethod.html
$ prstat -mLc 1 PID USERNAME USR SYS TRP TFL DFL LCK SLP LAT VCX ICX SCL SIG PROCESS/LWPID 63037 root 83 16 0.1 0.0 0.0 0.0 0.0 0.5 30 243 45K 0 node/1 12927 root 14 49 0.0 0.0 0.0 0.0 34 2.9 6K 365 .1M 0 ab/1 63037 root 0.5 0.6 0.0 0.0 0.0 3.7 95 0.4 1K 0 1K 0 node/2[...]
prstat -mLc, cont.
• Linux has various thread states: delay accounting, I/O accounting, schedstats. Can they be added to htop?See TSA Method for use case and desired metrics.
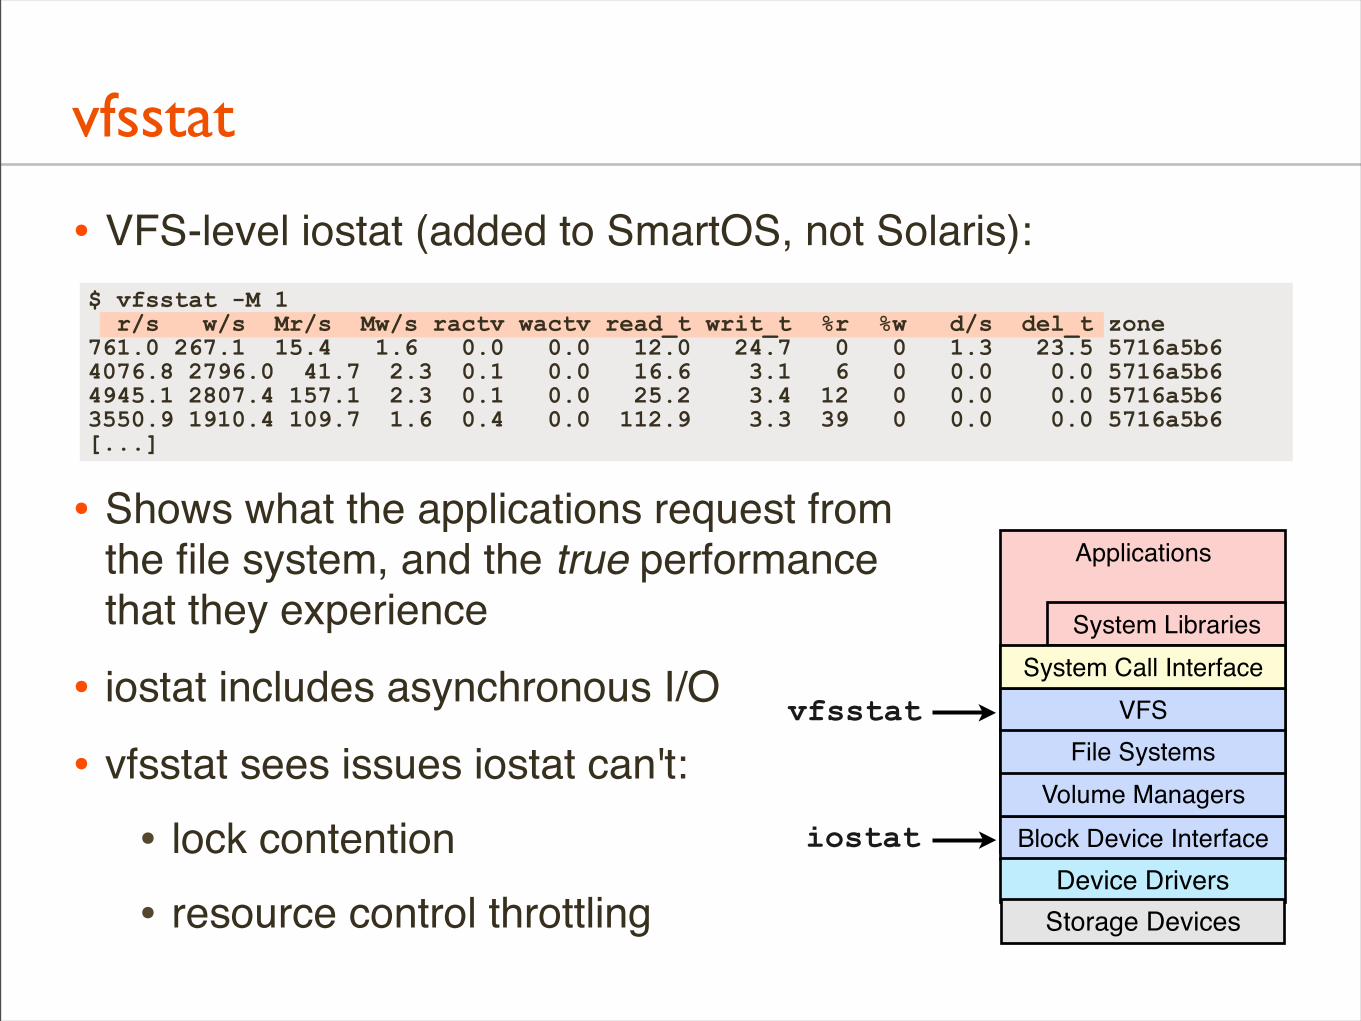
vfsstat
• VFS-level iostat (added to SmartOS, not Solaris):
• Shows what the applications request fromthe file system, and the true performancethat they experience
• iostat includes asynchronous I/O
• vfsstat sees issues iostat can't:
• lock contention
• resource control throttling
$ vfsstat -M 1 r/s w/s Mr/s Mw/s ractv wactv read_t writ_t %r %w d/s del_t zone761.0 267.1 15.4 1.6 0.0 0.0 12.0 24.7 0 0 1.3 23.5 5716a5b64076.8 2796.0 41.7 2.3 0.1 0.0 16.6 3.1 6 0 0.0 0.0 5716a5b64945.1 2807.4 157.1 2.3 0.1 0.0 25.2 3.4 12 0 0.0 0.0 5716a5b63550.9 1910.4 109.7 1.6 0.4 0.0 112.9 3.3 39 0 0.0 0.0 5716a5b6[...]
Applications
Block Device InterfaceVolume Managers
File SystemsVFS
System LibrariesSystem Call Interface
vfsstat
iostatDevice Drivers
Storage Devices
vfsstat, cont.
• Add vfsstat, or VFS metrics to sar.
DTrace
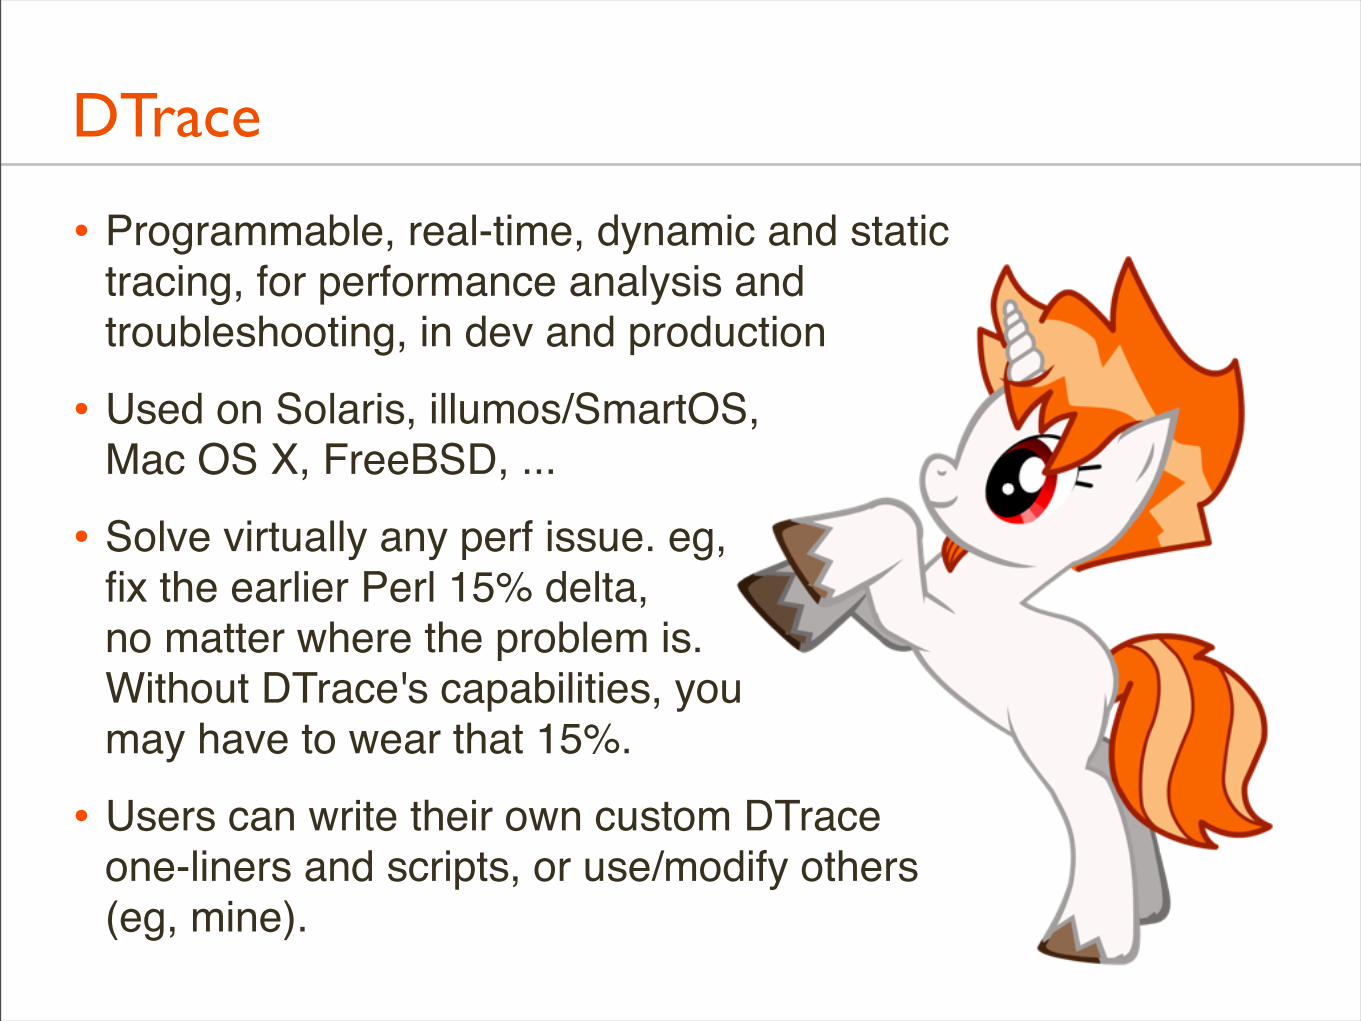
• Programmable, real-time, dynamic and statictracing, for performance analysis andtroubleshooting, in dev and production
• Used on Solaris, illumos/SmartOS,Mac OS X, FreeBSD, ...
• Solve virtually any perf issue. eg,fix the earlier Perl 15% delta,no matter where the problem is.Without DTrace's capabilities, youmay have to wear that 15%.
• Users can write their own custom DTraceone-liners and scripts, or use/modify others(eg, mine).
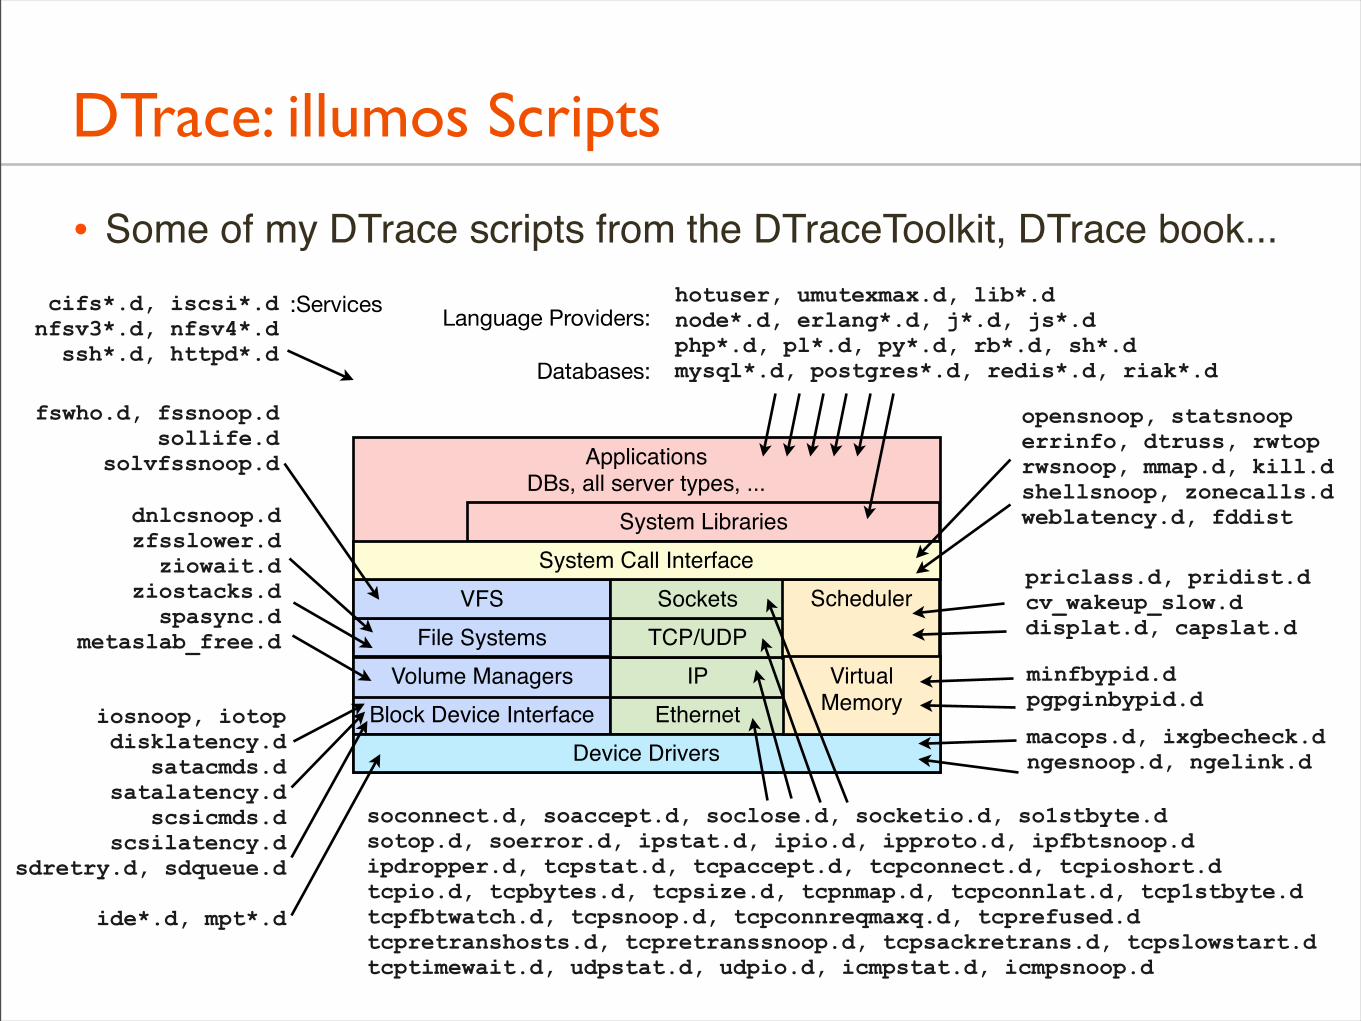
• Some of my DTrace scripts from the DTraceToolkit, DTrace book...
DTrace: illumos Scripts
ApplicationsDBs, all server types, ...
Block Device Interface EthernetVolume Managers IP
File Systems TCP/UDPVFS Sockets
System Libraries
Device Drivers
Scheduler
VirtualMemory
System Call Interface
iosnoop, iotopdisklatency.d
satacmds.dsatalatency.d
scsicmds.dscsilatency.d
sdretry.d, sdqueue.d
ide*.d, mpt*.d
priclass.d, pridist.dcv_wakeup_slow.ddisplat.d, capslat.d
opensnoop, statsnooperrinfo, dtruss, rwtoprwsnoop, mmap.d, kill.dshellsnoop, zonecalls.dweblatency.d, fddistdnlcsnoop.d
zfsslower.dziowait.d
ziostacks.dspasync.d
metaslab_free.d
fswho.d, fssnoop.dsollife.d
solvfssnoop.d
hotuser, umutexmax.d, lib*.dnode*.d, erlang*.d, j*.d, js*.dphp*.d, pl*.d, py*.d, rb*.d, sh*.dmysql*.d, postgres*.d, redis*.d, riak*.d
Language Providers:
Databases:
soconnect.d, soaccept.d, soclose.d, socketio.d, so1stbyte.dsotop.d, soerror.d, ipstat.d, ipio.d, ipproto.d, ipfbtsnoop.dipdropper.d, tcpstat.d, tcpaccept.d, tcpconnect.d, tcpioshort.dtcpio.d, tcpbytes.d, tcpsize.d, tcpnmap.d, tcpconnlat.d, tcp1stbyte.dtcpfbtwatch.d, tcpsnoop.d, tcpconnreqmaxq.d, tcprefused.dtcpretranshosts.d, tcpretranssnoop.d, tcpsackretrans.d, tcpslowstart.dtcptimewait.d, udpstat.d, udpio.d, icmpstat.d, icmpsnoop.d
cifs*.d, iscsi*.dnfsv3*.d, nfsv4*.d
ssh*.d, httpd*.d
:Services
minfbypid.dpgpginbypid.d
macops.d, ixgbecheck.dngesnoop.d, ngelink.d
DTrace, cont.
• What Linux needs to learn about DTrace:
Feature #1 is production safety• There should be NO risk of panics or freezes. It should be an
everyday tool like top(1).
• Related to production safety is the minimization of overheads, which can be done with in-kernel summaries. Some of the Linux tools need to learn how to do this, too, as the overheads of dump & post-analysis can get too high.
• Features aren't features if users don't use them
DTrace, cont.
• Linux might get DTrace-like capabilities via:
• dtrace4linux• perf_events• ktap• SystemTap• LTTng
• The Linux kernel has the necessary frameworks which are sourced by these tools: tracepoints, kprobes, uprobes
• ... and another thing Linux can learn:
• DTrace has a memorable unofficial mascot (the ponycorn by Deirdré Straughan, using General Zoi's pony creator). She's created some for the Linux tools too...
dtrace4linux
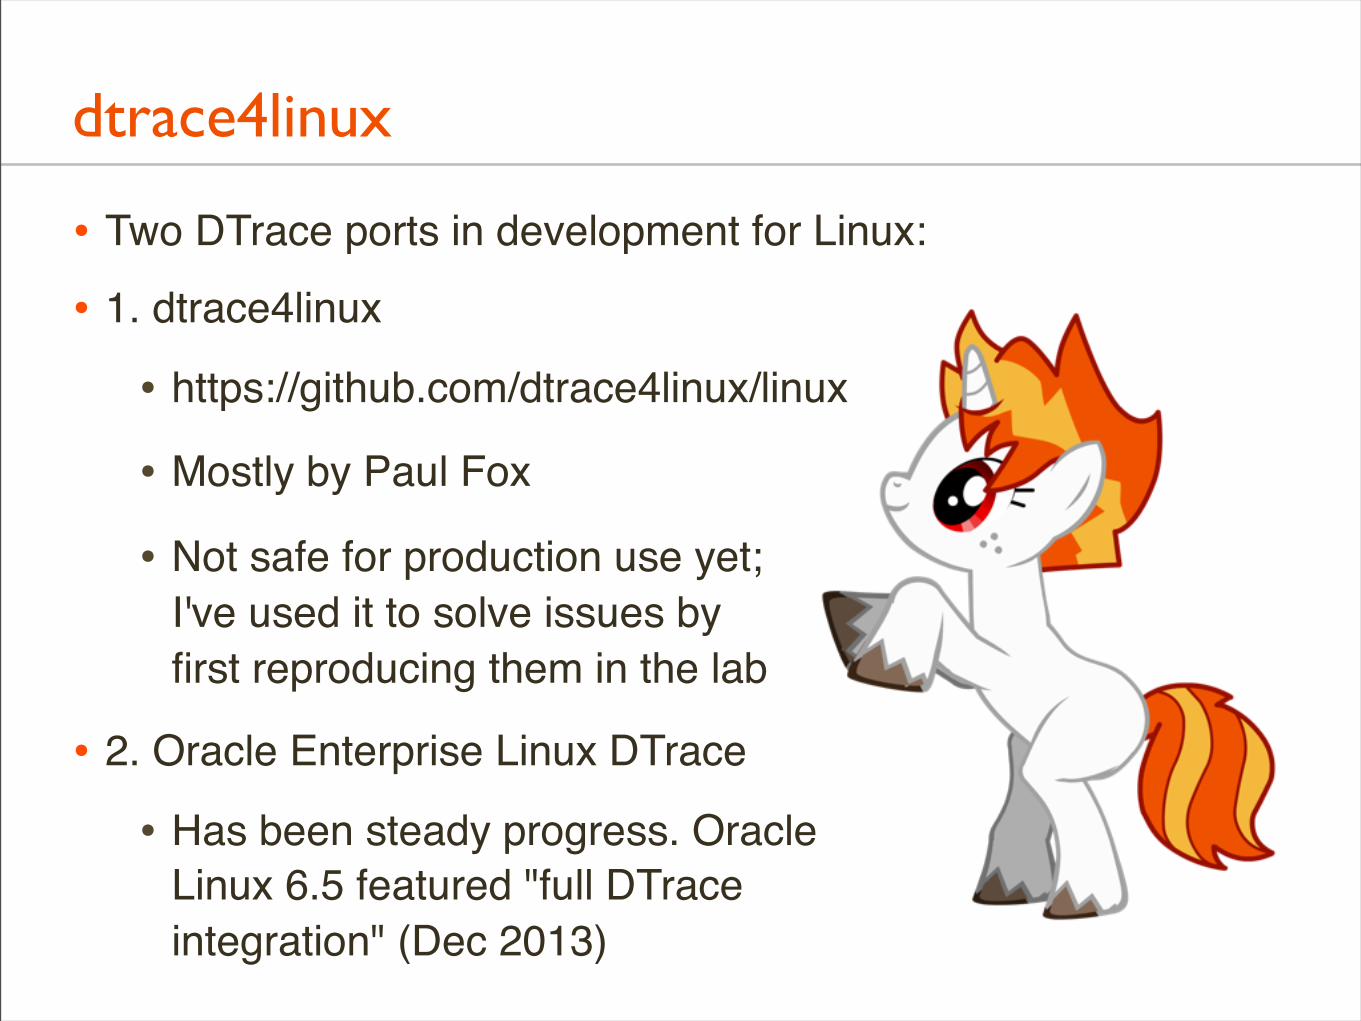
• Two DTrace ports in development for Linux:
• 1. dtrace4linux
• https://github.com/dtrace4linux/linux
• Mostly by Paul Fox
• Not safe for production use yet;I've used it to solve issues byfirst reproducing them in the lab
• 2. Oracle Enterprise Linux DTrace
• Has been steady progress. OracleLinux 6.5 featured "full DTraceintegration" (Dec 2013)
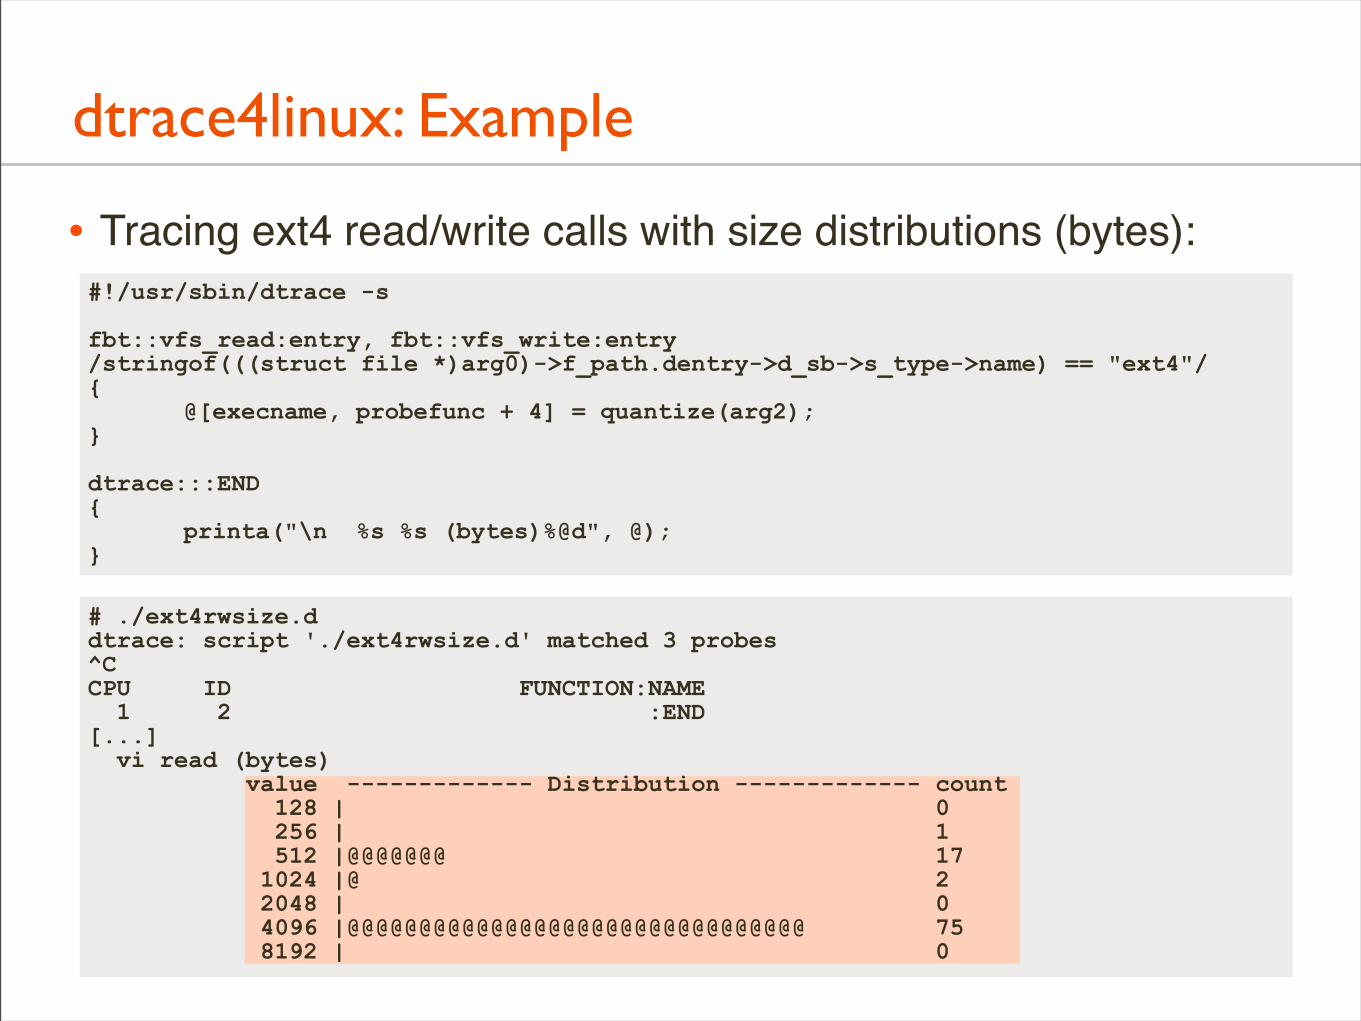
• Tracing ext4 read/write calls with size distributions (bytes):
dtrace4linux: Example
#!/usr/sbin/dtrace -s
fbt::vfs_read:entry, fbt::vfs_write:entry/stringof(((struct file *)arg0)->f_path.dentry->d_sb->s_type->name) == "ext4"/{ @[execname, probefunc + 4] = quantize(arg2);}
dtrace:::END{ printa("\n %s %s (bytes)%@d", @);}
# ./ext4rwsize.d dtrace: script './ext4rwsize.d' matched 3 probes^CCPU ID FUNCTION:NAME 1 2 :END [...] vi read (bytes) value ------------- Distribution ------------- count 128 | 0 256 | 1 512 |@@@@@@@ 17 1024 |@ 2 2048 | 0 4096 |@@@@@@@@@@@@@@@@@@@@@@@@@@@@@@@@ 75 8192 | 0
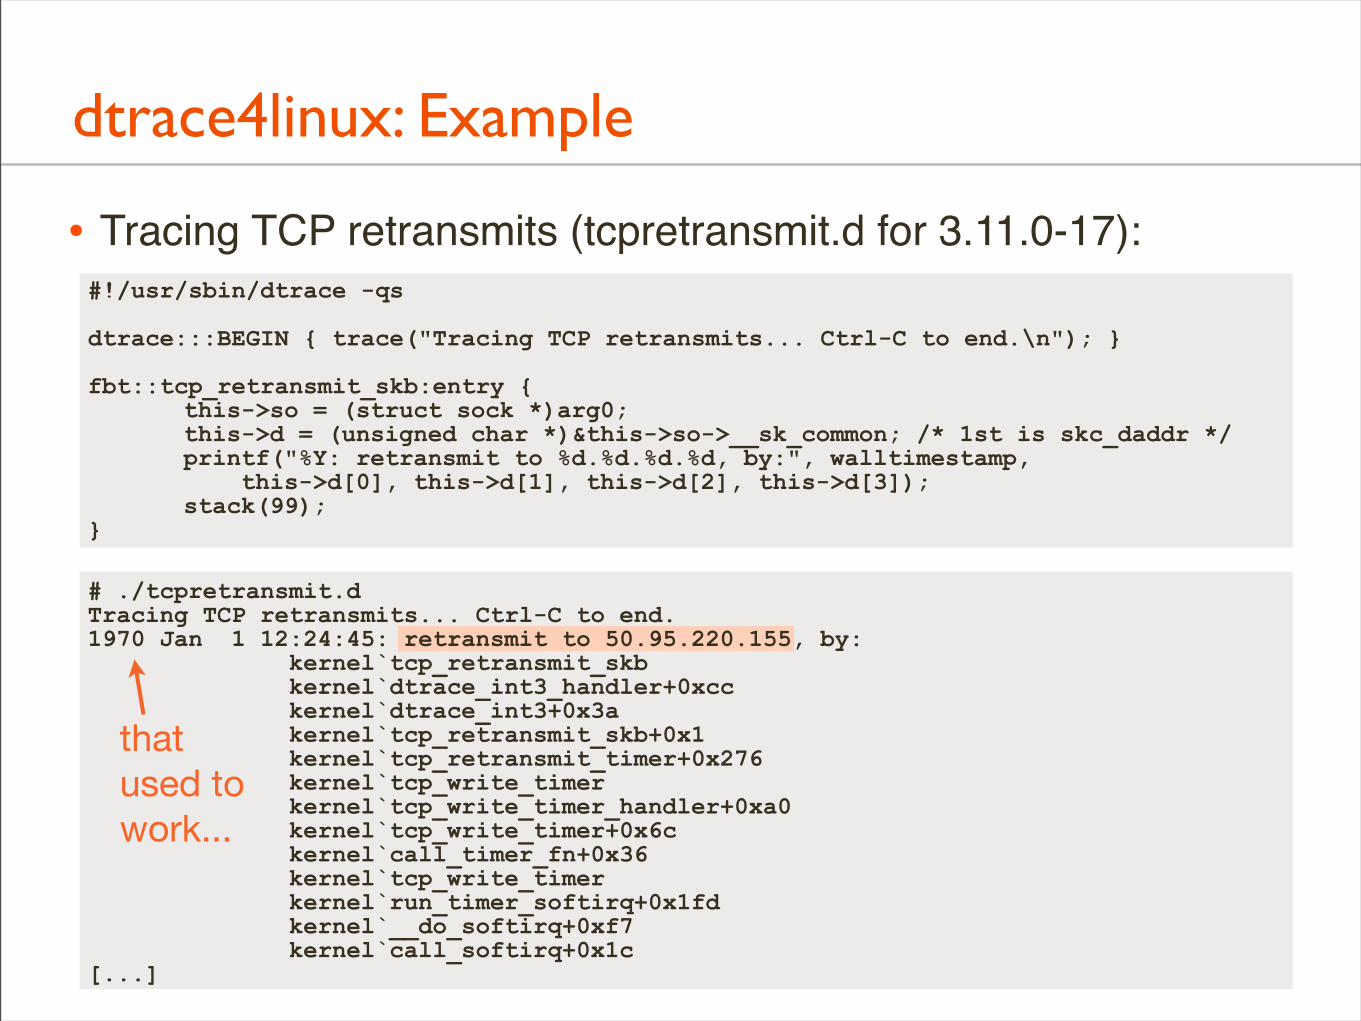
• Tracing TCP retransmits (tcpretransmit.d for 3.11.0-17):
dtrace4linux: Example
#!/usr/sbin/dtrace -qs
dtrace:::BEGIN { trace("Tracing TCP retransmits... Ctrl-C to end.\n"); }
fbt::tcp_retransmit_skb:entry { this->so = (struct sock *)arg0; this->d = (unsigned char *)&this->so->__sk_common; /* 1st is skc_daddr */ printf("%Y: retransmit to %d.%d.%d.%d, by:", walltimestamp, this->d[0], this->d[1], this->d[2], this->d[3]); stack(99);}
# ./tcpretransmit.d Tracing TCP retransmits... Ctrl-C to end.1970 Jan 1 12:24:45: retransmit to 50.95.220.155, by: kernel`tcp_retransmit_skb kernel`dtrace_int3_handler+0xcc kernel`dtrace_int3+0x3a kernel`tcp_retransmit_skb+0x1 kernel`tcp_retransmit_timer+0x276 kernel`tcp_write_timer kernel`tcp_write_timer_handler+0xa0 kernel`tcp_write_timer+0x6c kernel`call_timer_fn+0x36 kernel`tcp_write_timer kernel`run_timer_softirq+0x1fd kernel`__do_softirq+0xf7 kernel`call_softirq+0x1c[...]
thatused towork...
perf_events
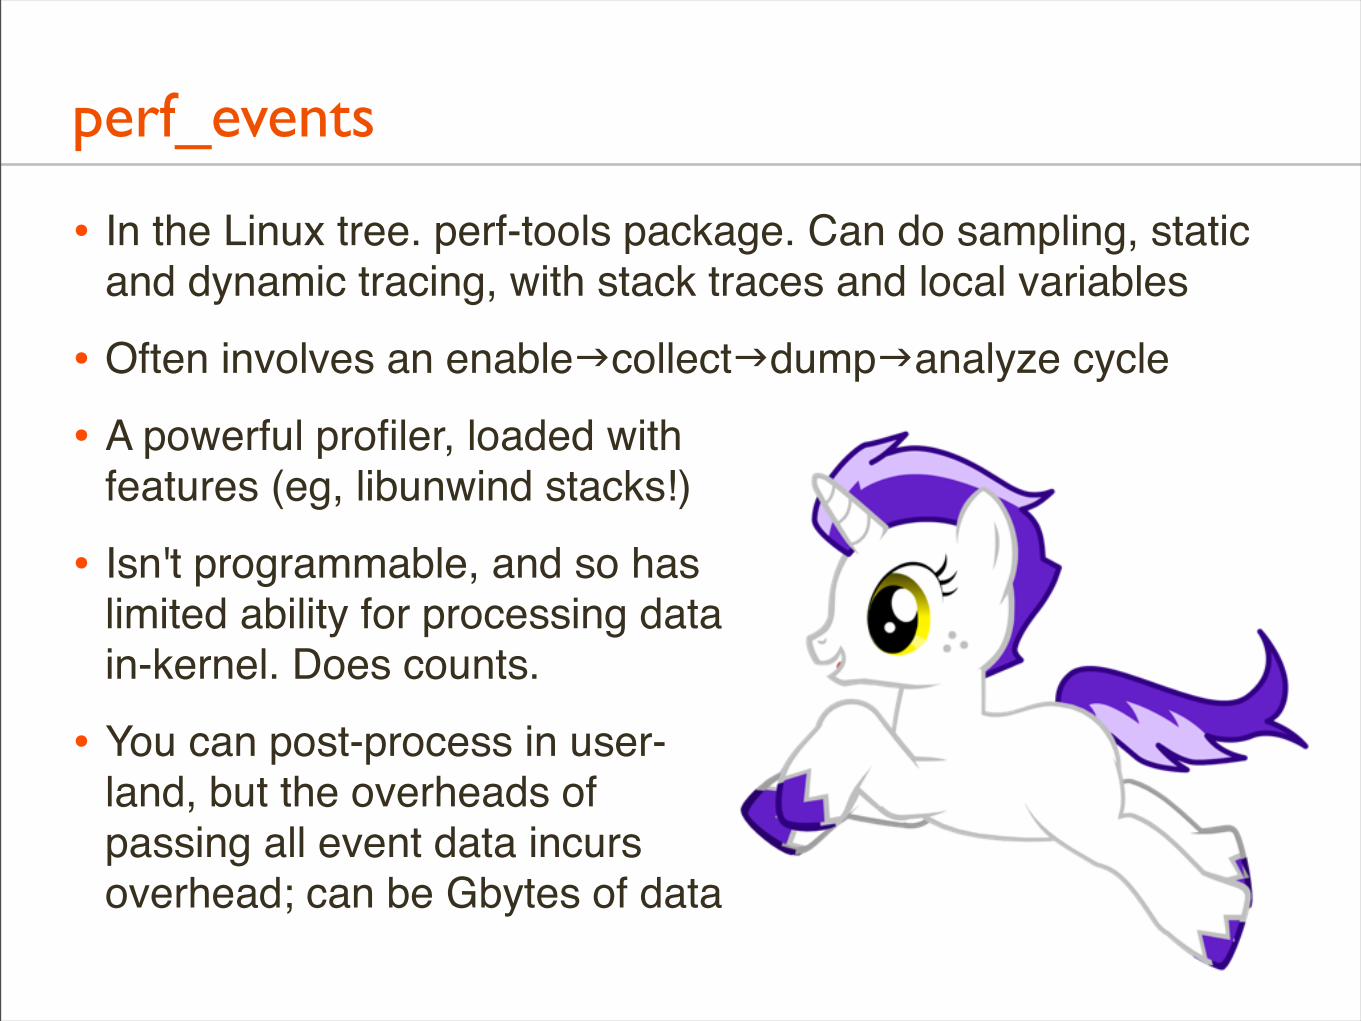
• In the Linux tree. perf-tools package. Can do sampling, static and dynamic tracing, with stack traces and local variables
• Often involves an enablecollectdumpanalyze cycle
• A powerful profiler, loaded withfeatures (eg, libunwind stacks!)
• Isn't programmable, and so haslimited ability for processing datain-kernel. Does counts.
• You can post-process in user-land, but the overheads ofpassing all event data incursoverhead; can be Gbytes of data
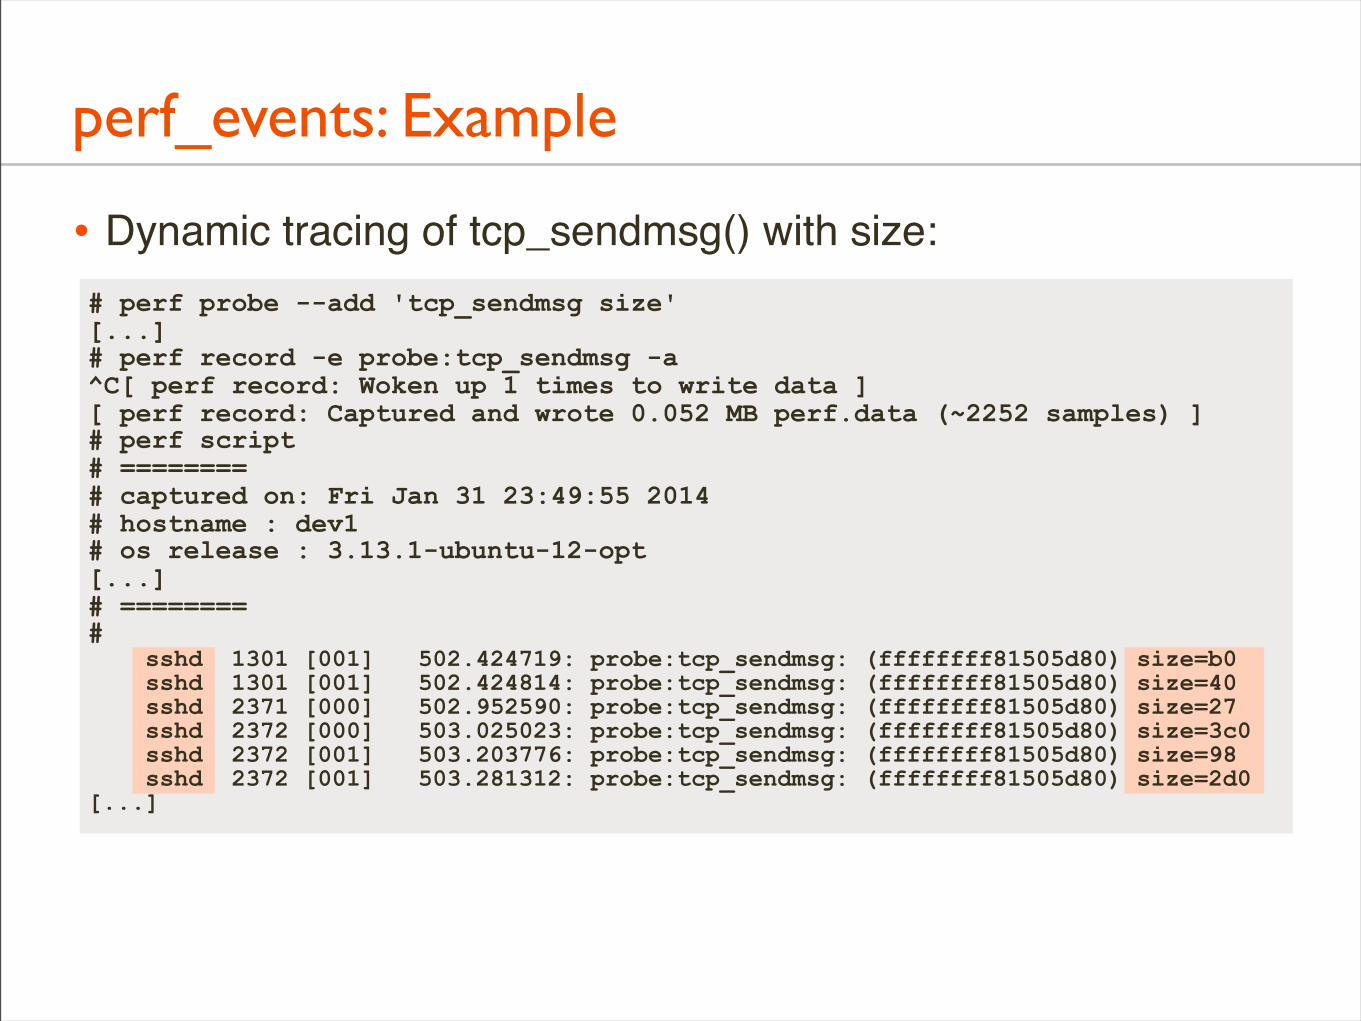
perf_events: Example
• Dynamic tracing of tcp_sendmsg() with size:# perf probe --add 'tcp_sendmsg size'[...]# perf record -e probe:tcp_sendmsg -a^C[ perf record: Woken up 1 times to write data ][ perf record: Captured and wrote 0.052 MB perf.data (~2252 samples) ]# perf script# ========# captured on: Fri Jan 31 23:49:55 2014# hostname : dev1# os release : 3.13.1-ubuntu-12-opt[...]# ========# sshd 1301 [001] 502.424719: probe:tcp_sendmsg: (ffffffff81505d80) size=b0 sshd 1301 [001] 502.424814: probe:tcp_sendmsg: (ffffffff81505d80) size=40 sshd 2371 [000] 502.952590: probe:tcp_sendmsg: (ffffffff81505d80) size=27 sshd 2372 [000] 503.025023: probe:tcp_sendmsg: (ffffffff81505d80) size=3c0 sshd 2372 [001] 503.203776: probe:tcp_sendmsg: (ffffffff81505d80) size=98 sshd 2372 [001] 503.281312: probe:tcp_sendmsg: (ffffffff81505d80) size=2d0[...]
ktap
• A new static/dynamic tracing tool for Linux
• Lightweight, simple, based on lua. Uses bytecode for programmable and safe tracing
• Suitable for use on embedded Linux
• http://www.ktap.org
• Features are limited (still indevelopment), but I've beenimpressed so far
• In development, so I can't recommendproduction use yet
ktap: Example
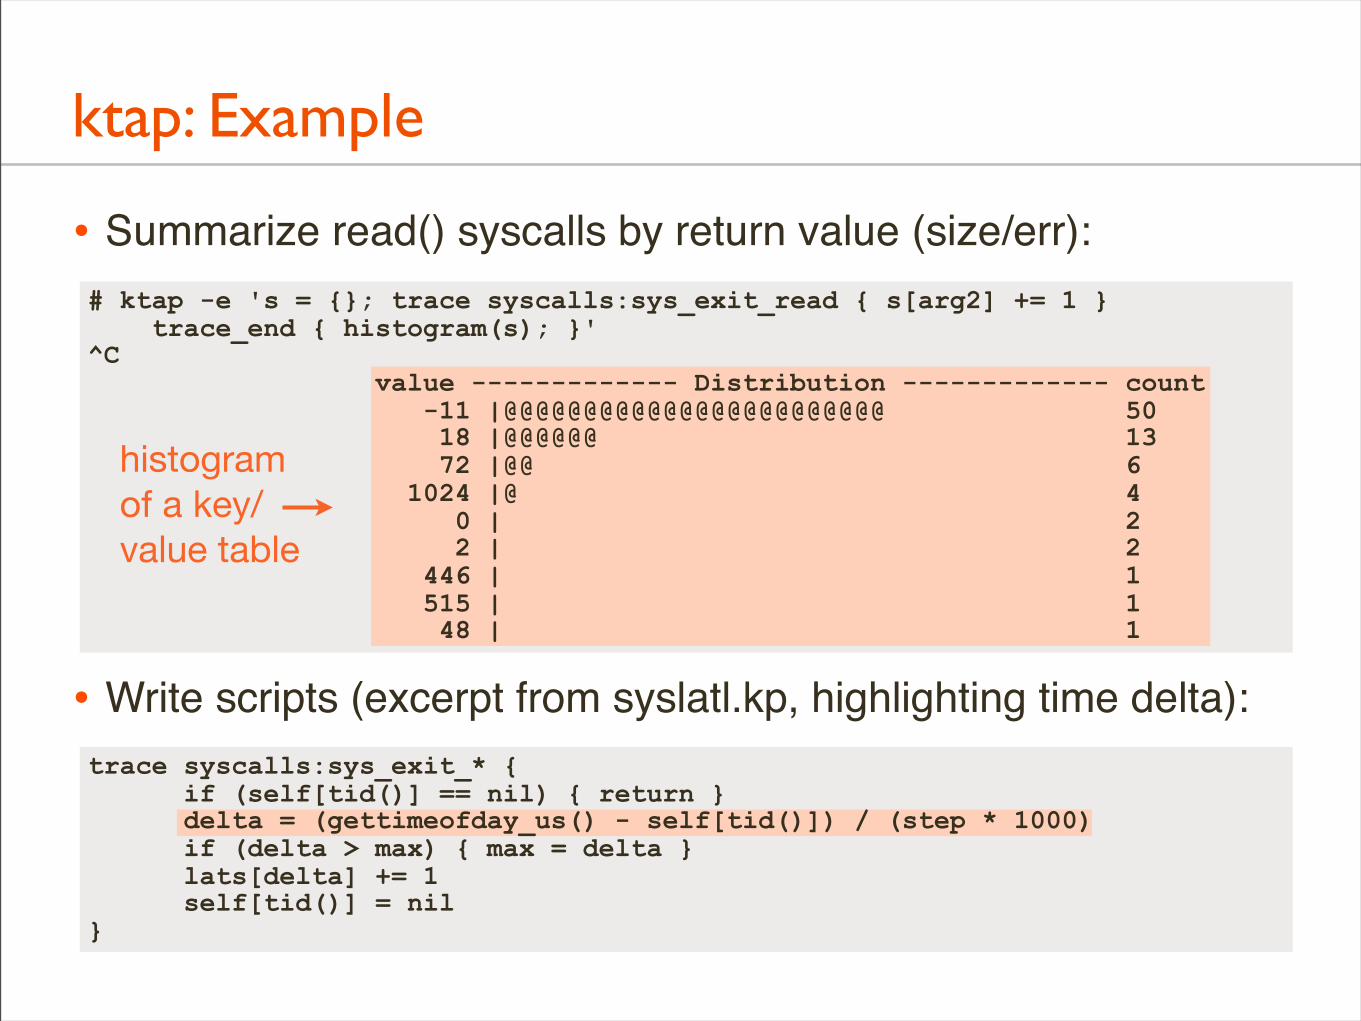
• Summarize read() syscalls by return value (size/err):
• Write scripts (excerpt from syslatl.kp, highlighting time delta):
# ktap -e 's = {}; trace syscalls:sys_exit_read { s[arg2] += 1 } trace_end { histogram(s); }'^C value ------------- Distribution ------------- count -11 |@@@@@@@@@@@@@@@@@@@@@@@@ 50 18 |@@@@@@ 13 72 |@@ 6 1024 |@ 4 0 | 2 2 | 2 446 | 1 515 | 1 48 | 1
trace syscalls:sys_exit_* { if (self[tid()] == nil) { return } delta = (gettimeofday_us() - self[tid()]) / (step * 1000) if (delta > max) { max = delta } lats[delta] += 1 self[tid()] = nil}
histogramof a key/value table
ktap: Setup
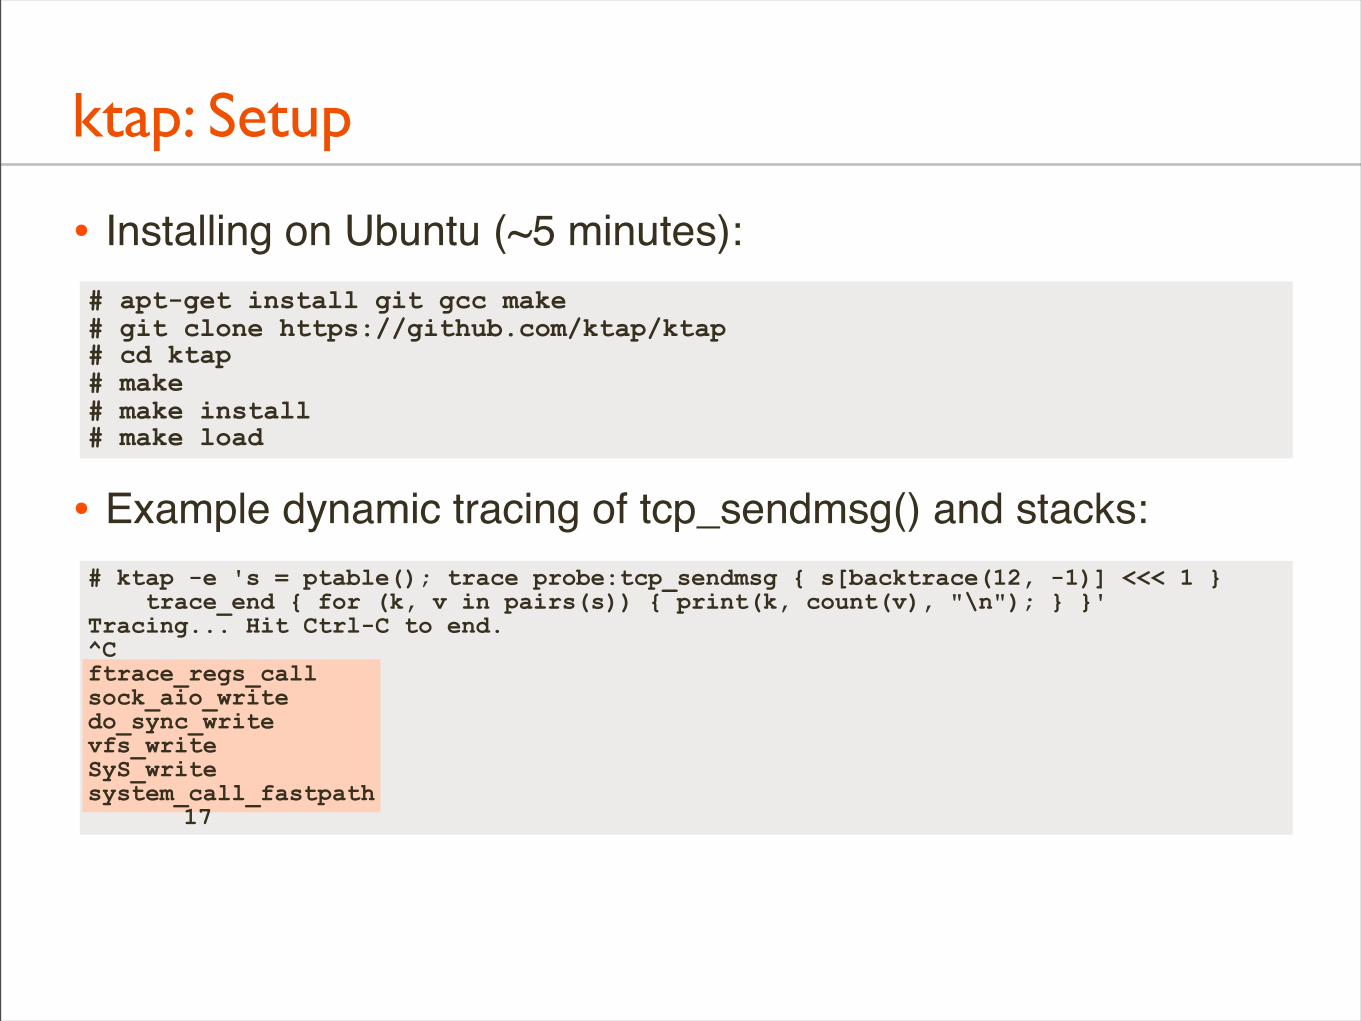
• Installing on Ubuntu (~5 minutes):
• Example dynamic tracing of tcp_sendmsg() and stacks:
# apt-get install git gcc make# git clone https://github.com/ktap/ktap# cd ktap# make# make install# make load
# ktap -e 's = ptable(); trace probe:tcp_sendmsg { s[backtrace(12, -1)] <<< 1 } trace_end { for (k, v in pairs(s)) { print(k, count(v), "\n"); } }'Tracing... Hit Ctrl-C to end.^Cftrace_regs_callsock_aio_writedo_sync_writevfs_writeSyS_writesystem_call_fastpath 17
SystemTap
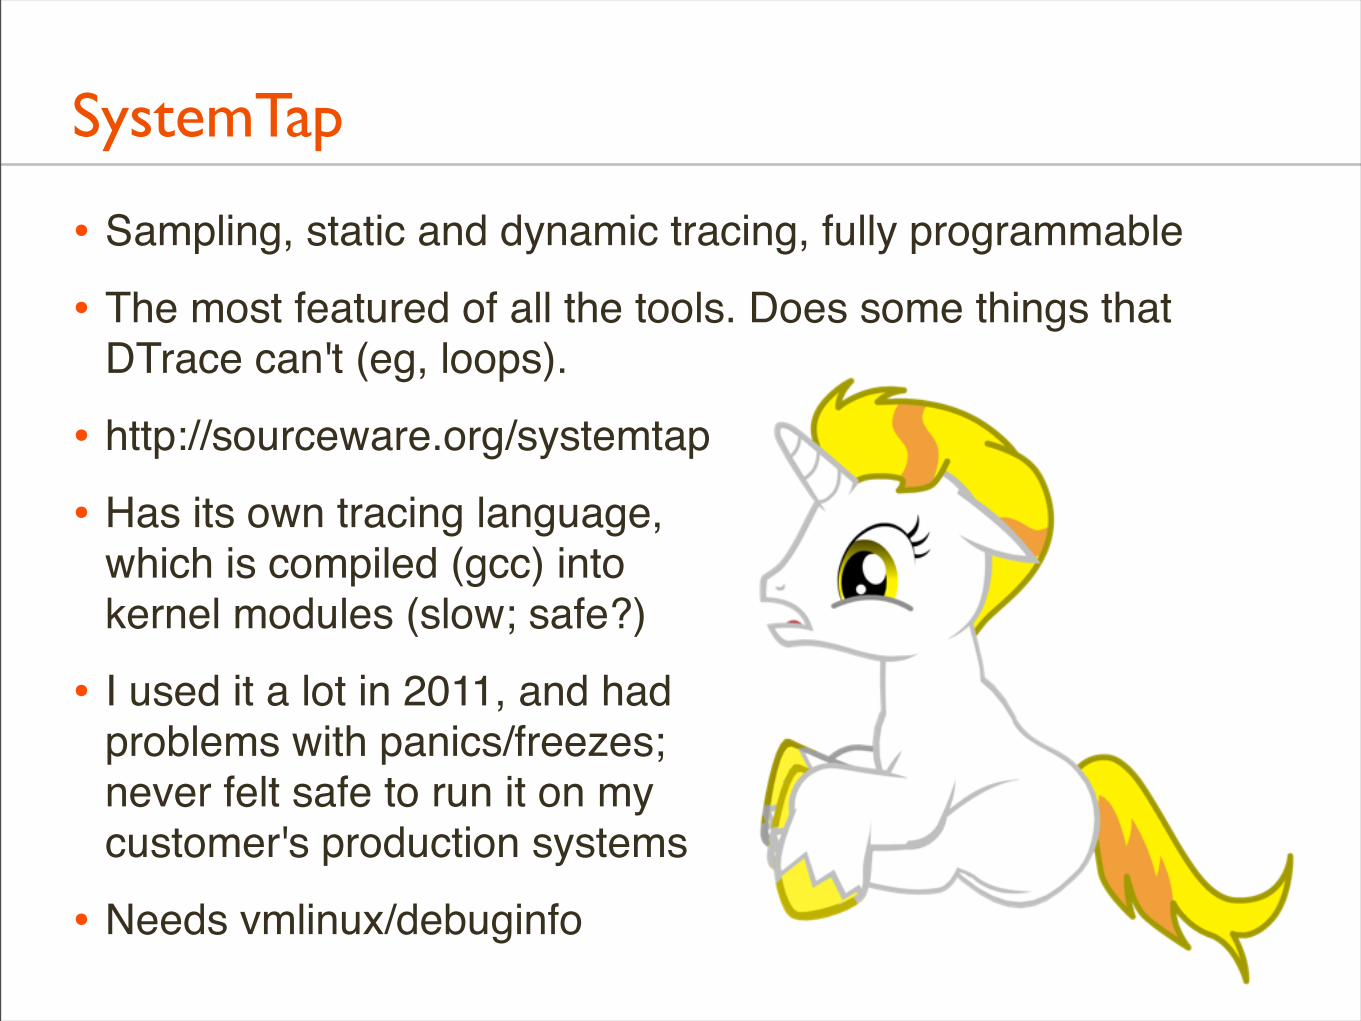
• Sampling, static and dynamic tracing, fully programmable
• The most featured of all the tools. Does some things that DTrace can't (eg, loops).
• http://sourceware.org/systemtap
• Has its own tracing language,which is compiled (gcc) intokernel modules (slow; safe?)
• I used it a lot in 2011, and hadproblems with panics/freezes;never felt safe to run it on mycustomer's production systems
• Needs vmlinux/debuginfo
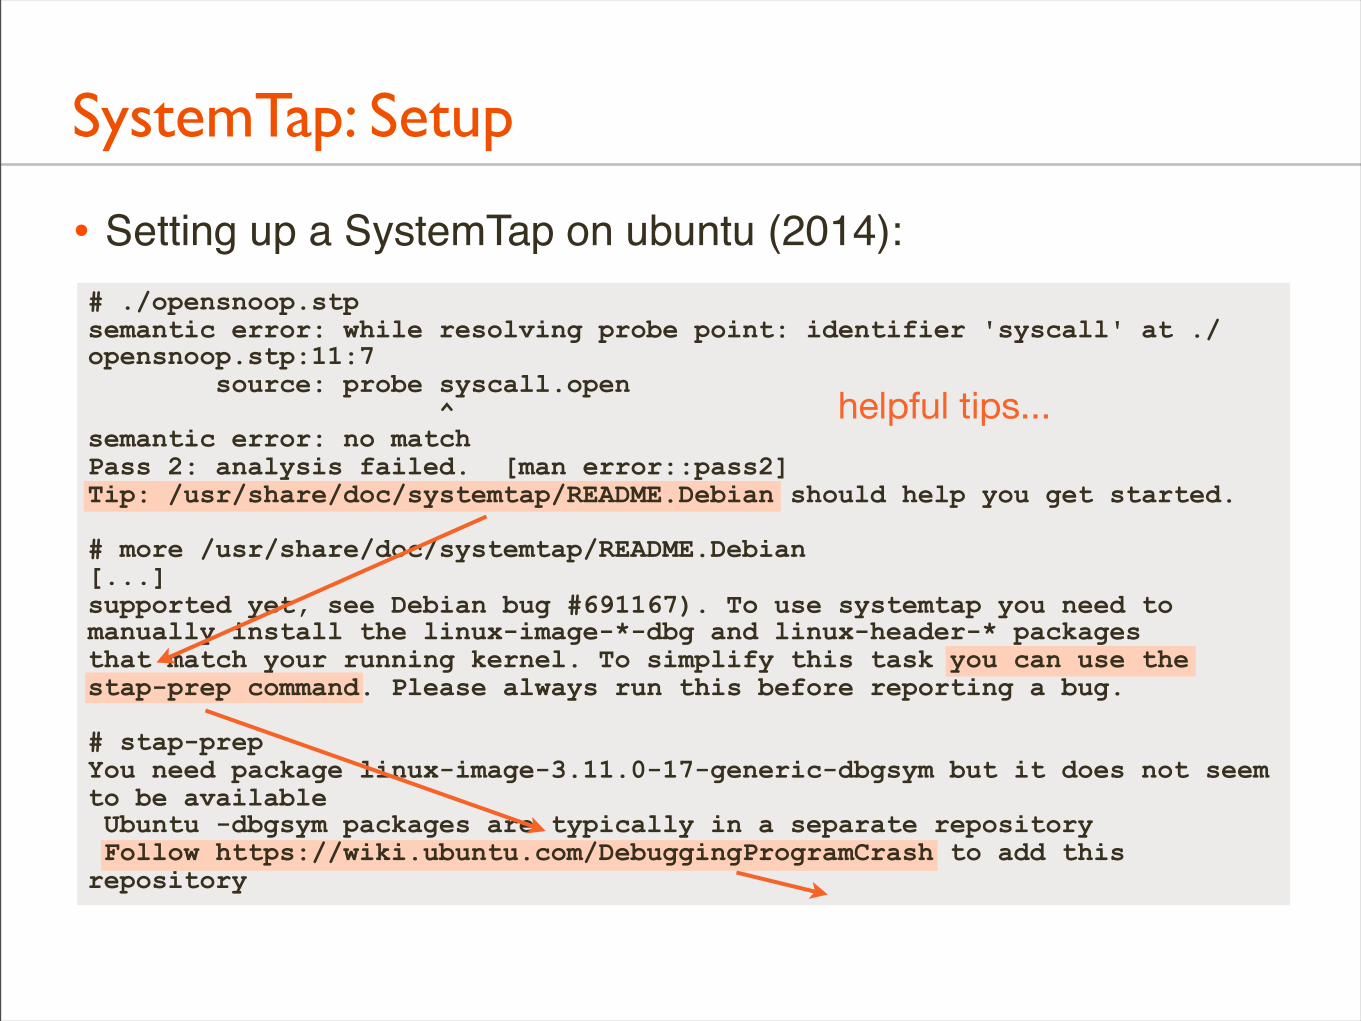
SystemTap: Setup
• Setting up a SystemTap on ubuntu (2014):# ./opensnoop.stp semantic error: while resolving probe point: identifier 'syscall' at ./opensnoop.stp:11:7 source: probe syscall.open ^semantic error: no matchPass 2: analysis failed. [man error::pass2]Tip: /usr/share/doc/systemtap/README.Debian should help you get started.
# more /usr/share/doc/systemtap/README.Debian[...]supported yet, see Debian bug #691167). To use systemtap you need tomanually install the linux-image-*-dbg and linux-header-* packagesthat match your running kernel. To simplify this task you can use thestap-prep command. Please always run this before reporting a bug.
# stap-prepYou need package linux-image-3.11.0-17-generic-dbgsym but it does not seem to be available Ubuntu -dbgsym packages are typically in a separate repository Follow https://wiki.ubuntu.com/DebuggingProgramCrash to add this repository
helpful tips...
SystemTap: Setup, cont.
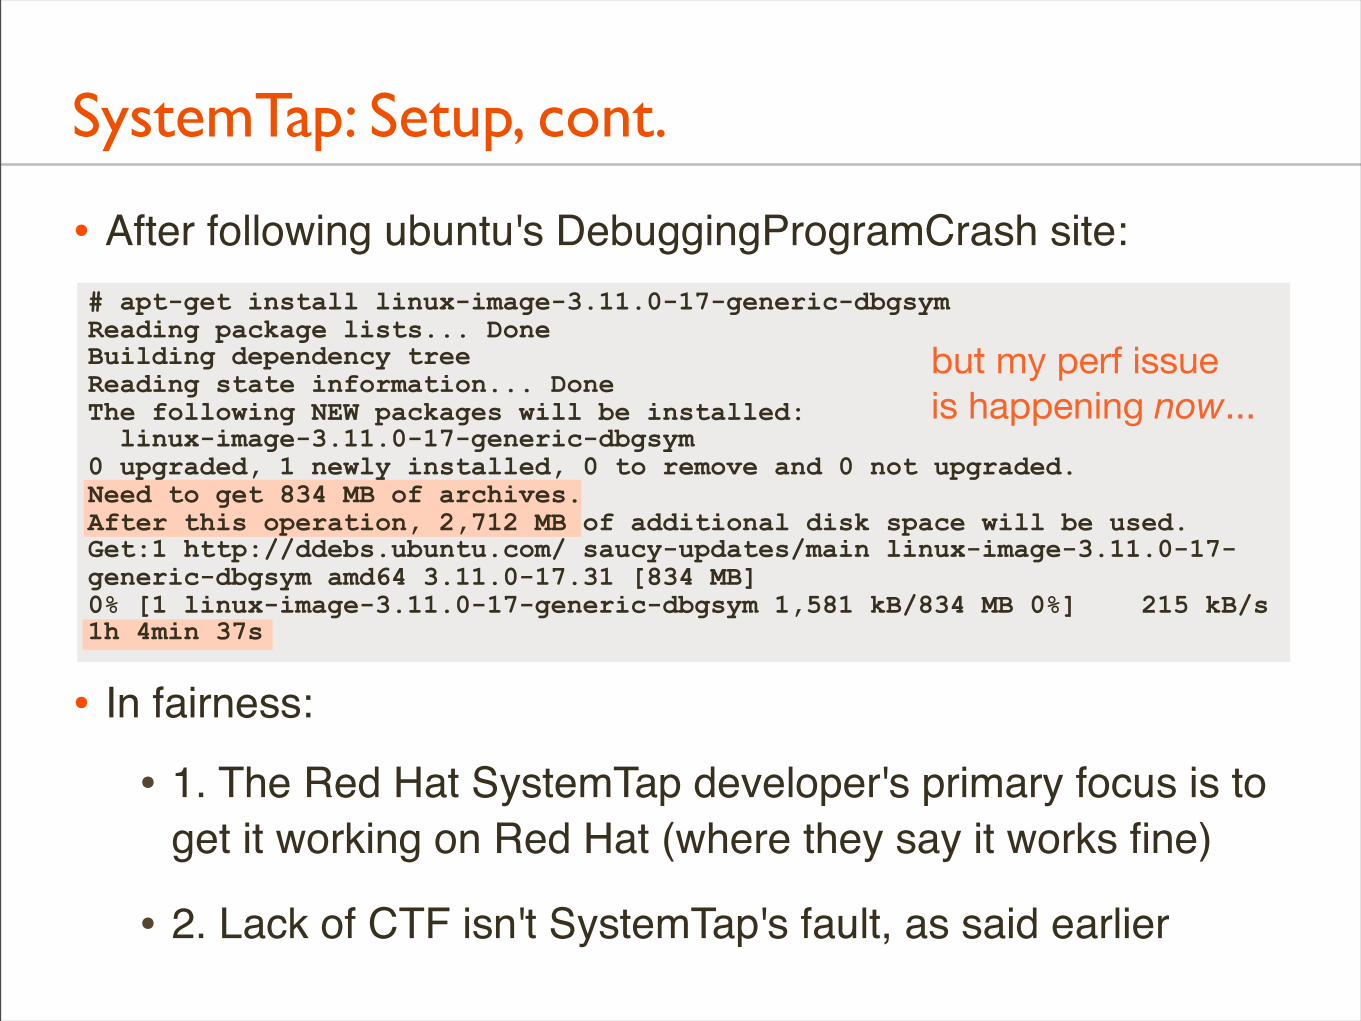
• After following ubuntu's DebuggingProgramCrash site:
• In fairness:
• 1. The Red Hat SystemTap developer's primary focus is to get it working on Red Hat (where they say it works fine)
• 2. Lack of CTF isn't SystemTap's fault, as said earlier
# apt-get install linux-image-3.11.0-17-generic-dbgsymReading package lists... DoneBuilding dependency tree Reading state information... DoneThe following NEW packages will be installed: linux-image-3.11.0-17-generic-dbgsym0 upgraded, 1 newly installed, 0 to remove and 0 not upgraded.Need to get 834 MB of archives.After this operation, 2,712 MB of additional disk space will be used.Get:1 http://ddebs.ubuntu.com/ saucy-updates/main linux-image-3.11.0-17-generic-dbgsym amd64 3.11.0-17.31 [834 MB]0% [1 linux-image-3.11.0-17-generic-dbgsym 1,581 kB/834 MB 0%] 215 kB/s 1h 4min 37s
but my perf issueis happening now...
SystemTap: Example
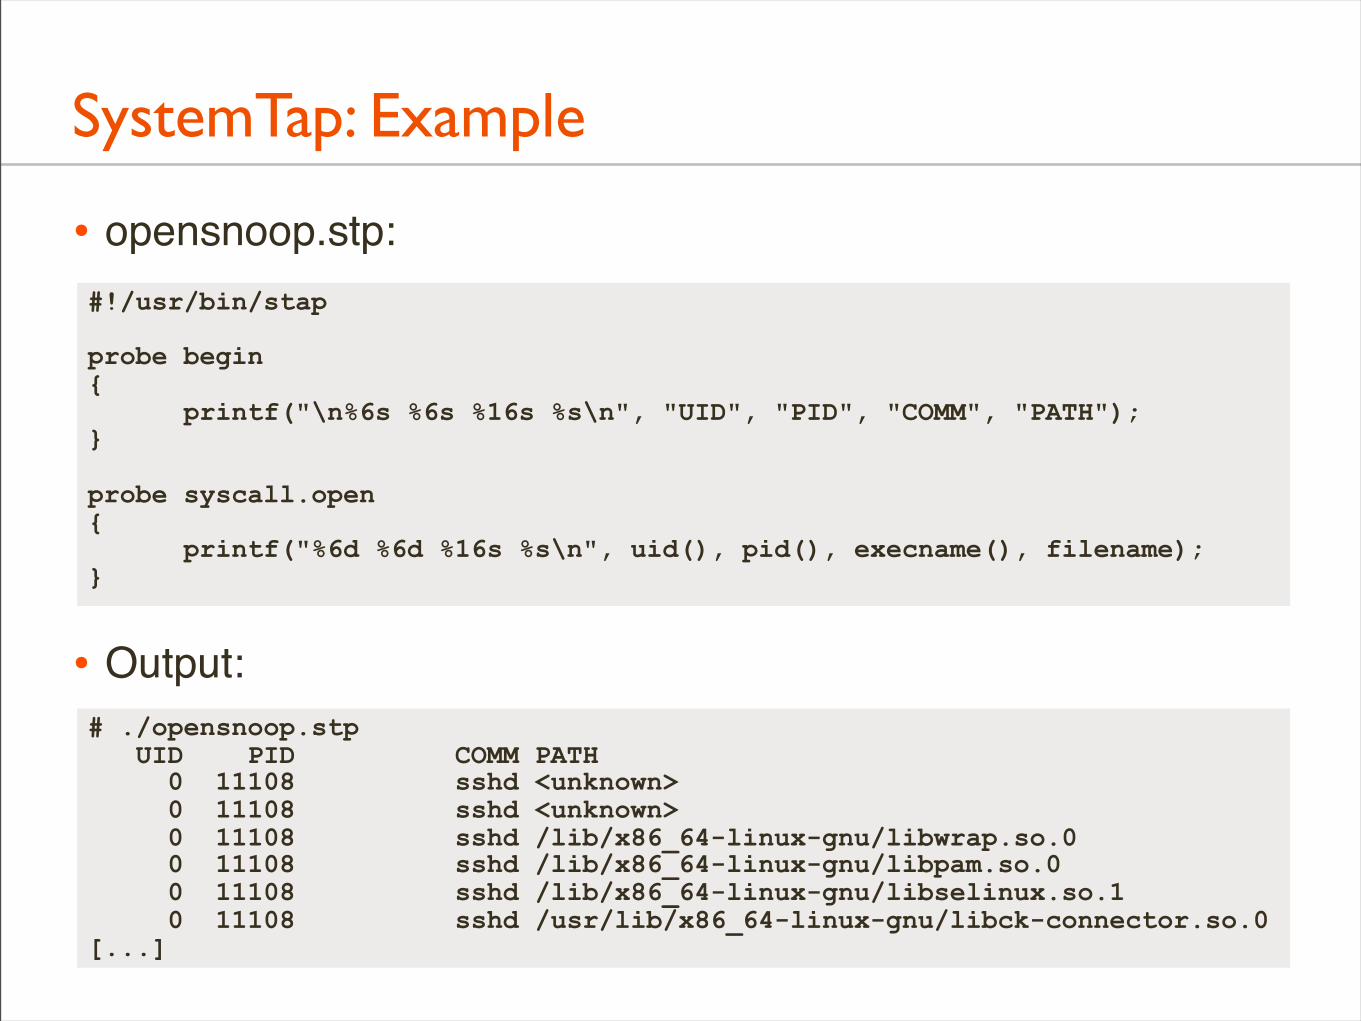
• opensnoop.stp:
• Output:
#!/usr/bin/stap
probe begin{ printf("\n%6s %6s %16s %s\n", "UID", "PID", "COMM", "PATH");}
probe syscall.open{ printf("%6d %6d %16s %s\n", uid(), pid(), execname(), filename);}
# ./opensnoop.stp UID PID COMM PATH 0 11108 sshd <unknown> 0 11108 sshd <unknown> 0 11108 sshd /lib/x86_64-linux-gnu/libwrap.so.0 0 11108 sshd /lib/x86_64-linux-gnu/libpam.so.0 0 11108 sshd /lib/x86_64-linux-gnu/libselinux.so.1 0 11108 sshd /usr/lib/x86_64-linux-gnu/libck-connector.so.0[...]
LTTng
• Profiling, static and dynamic tracing
• Based on Linux Trace Toolkit (LTT), which dabbled with dynamic tracing (DProbes) in 2001
• Involves an enablestartstopview cycle
• Designed to be highly efficient
• I haven't used it properly yet,so I don't have an informedopinion (sorry LTTng, notyour fault)
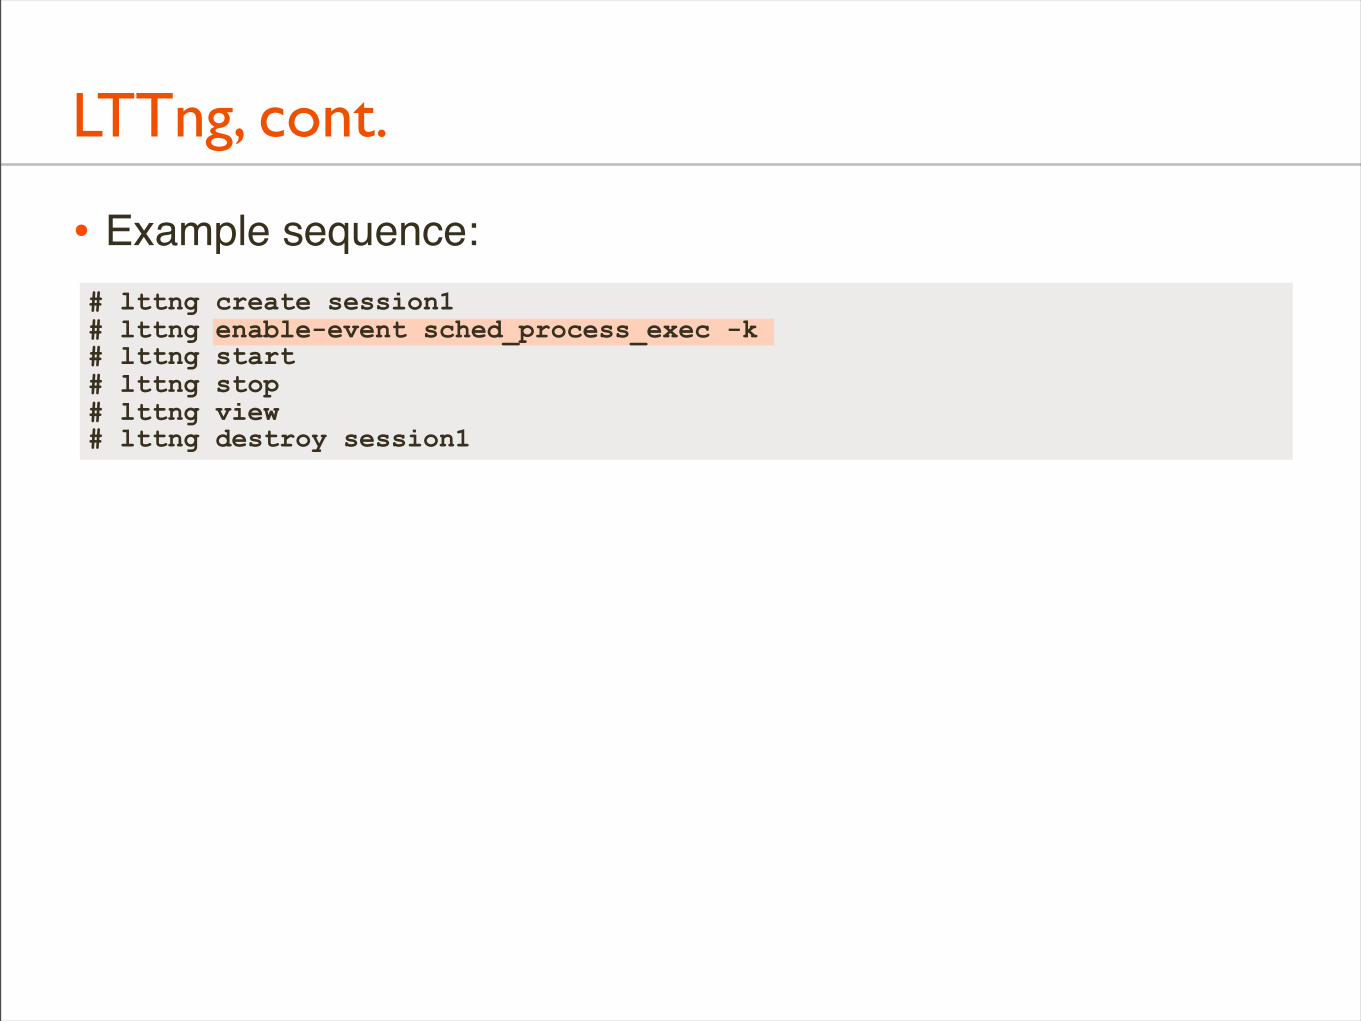
LTTng, cont.
• Example sequence:# lttng create session1# lttng enable-event sched_process_exec -k# lttng start# lttng stop# lttng view# lttng destroy session1
• 2014 is an exciting year for dynamic tracing and Linux –one of these may reach maturity and win!
DTrace, cont.
DTrace, final word
• What Oracle Solaris can learn from dtrace4linux:
• Dynamic tracing is crippled without source code
• Oracle could give customers scripts to run, but customers lose any practical chance of writing them themselves
• If the dtrace4linux port is completed, it will bemore useful than Oracle SolarisDTrace (unless they opensource it again)
Culture
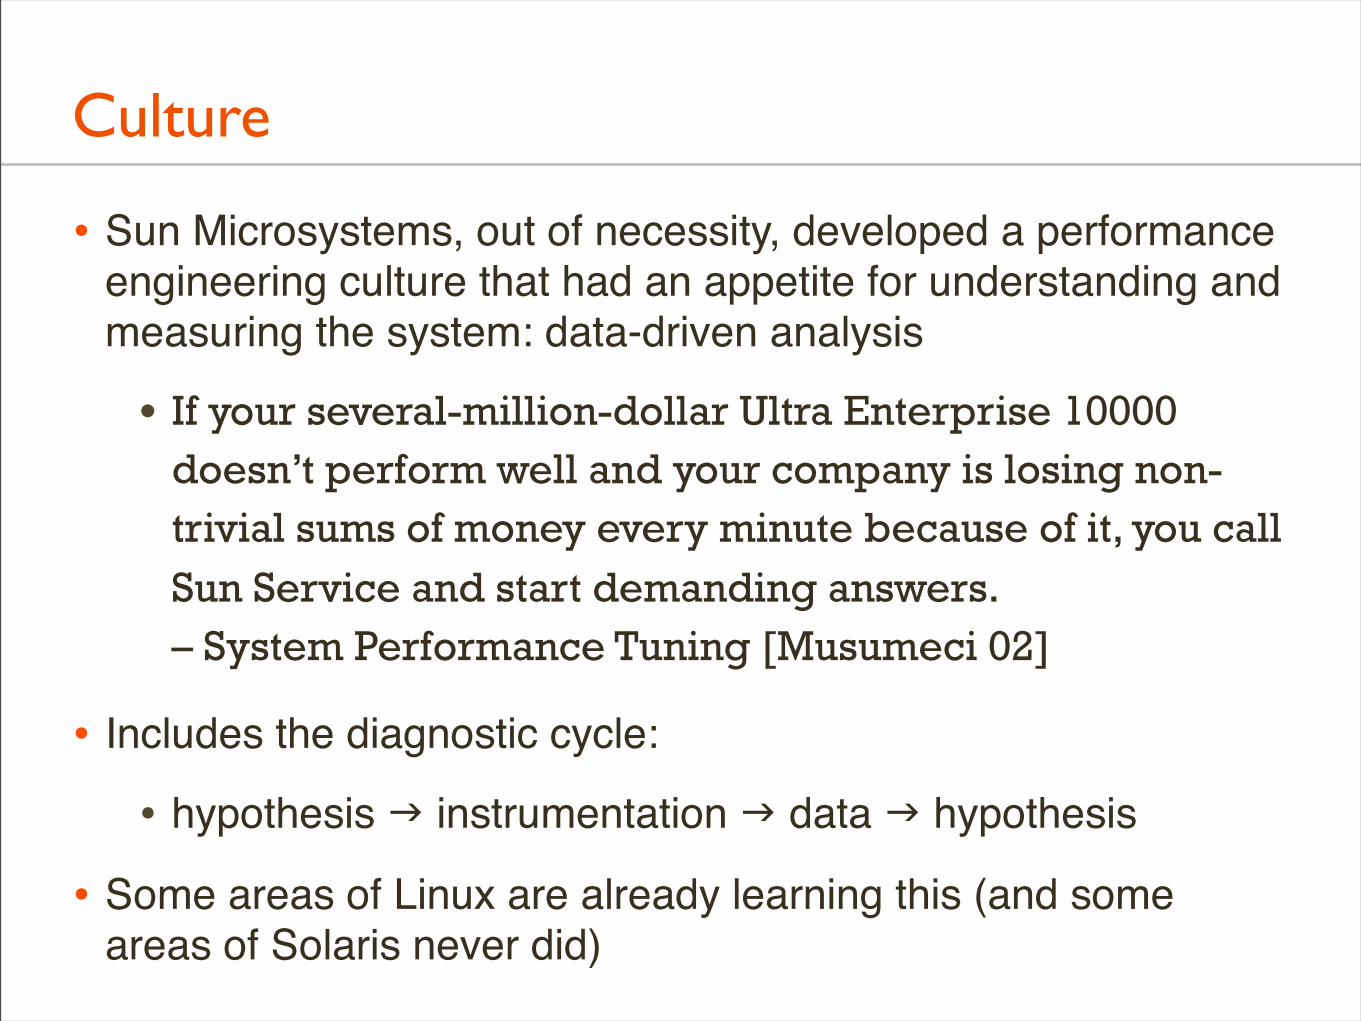
• Sun Microsystems, out of necessity, developed a performance engineering culture that had an appetite for understanding and measuring the system: data-driven analysis
• If your several-million-dollar Ultra Enterprise 10000 doesn’t perform well and your company is losing non-trivial sums of money every minute because of it, you call Sun Service and start demanding answers.– System Performance Tuning [Musumeci 02]
• Includes the diagnostic cycle:
• hypothesis instrumentation data hypothesis
• Some areas of Linux are already learning this (and some areas of Solaris never did)
Culture, cont.
top layer
tcpdump layer
strace layer
Kern
el
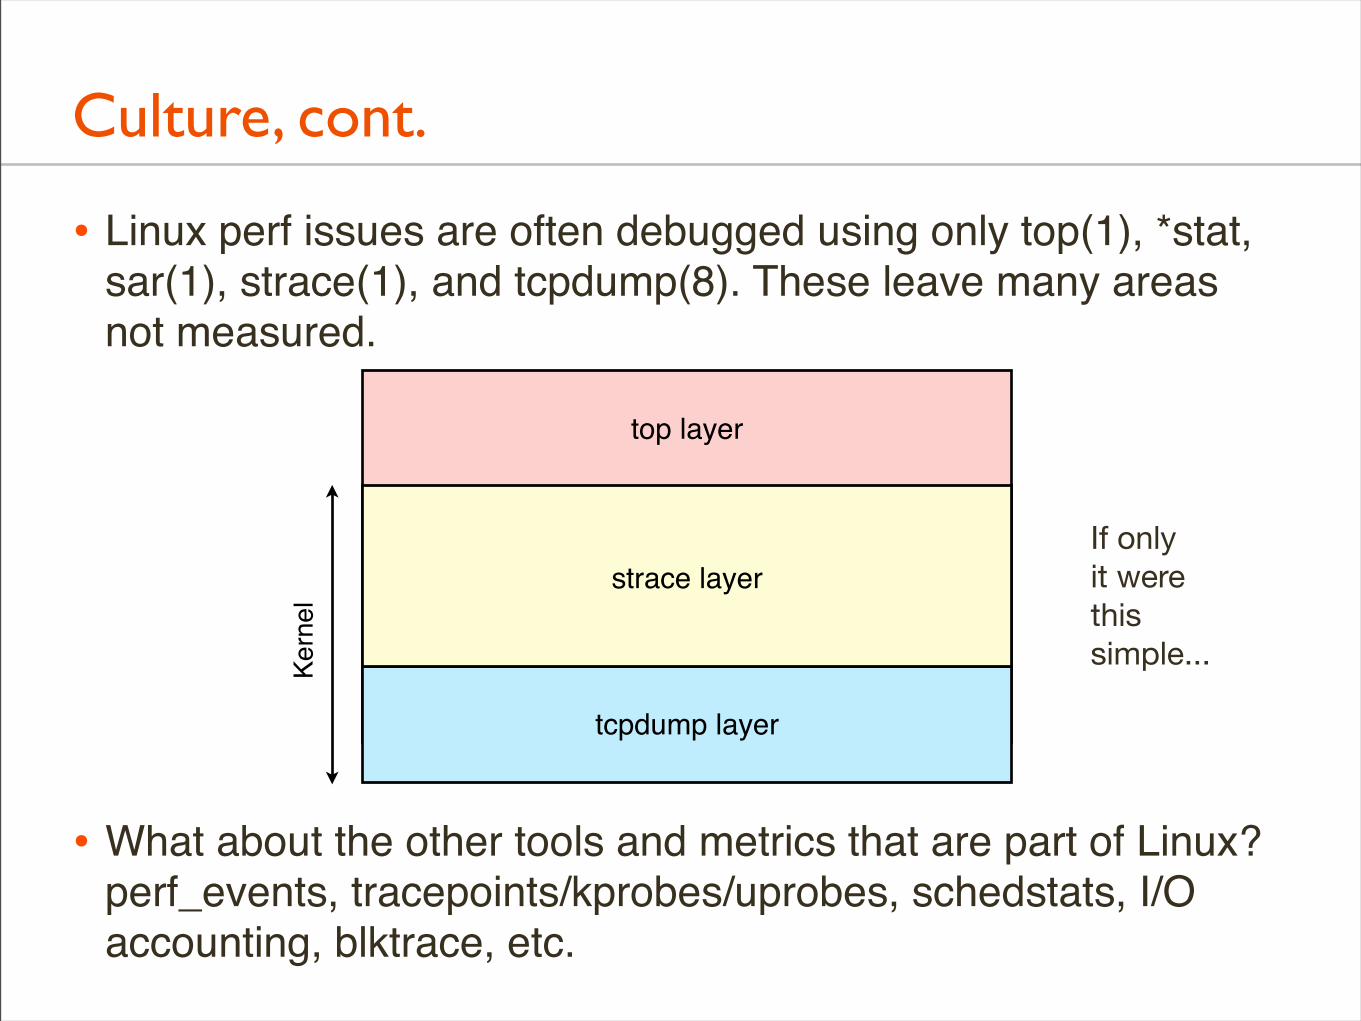
• Linux perf issues are often debugged using only top(1), *stat, sar(1), strace(1), and tcpdump(8). These leave many areas not measured.
• What about the other tools and metrics that are part of Linux? perf_events, tracepoints/kprobes/uprobes, schedstats, I/O accounting, blktrace, etc.
If onlyit werethissimple...
Culture, cont.
• Understand the system, and measure if at all possible
• Hypothesis instrumentation data hypothesis
• Use perf_events (and others once they are stable/safe)
• strace(1) is intermediate, not advanced
• High performance doesn't just mean hardware, system, and config. It foremost means analysis of performance limiters.

What Both can Learn
What Both can Learn
• Get better at benchmarking
Benchmarking
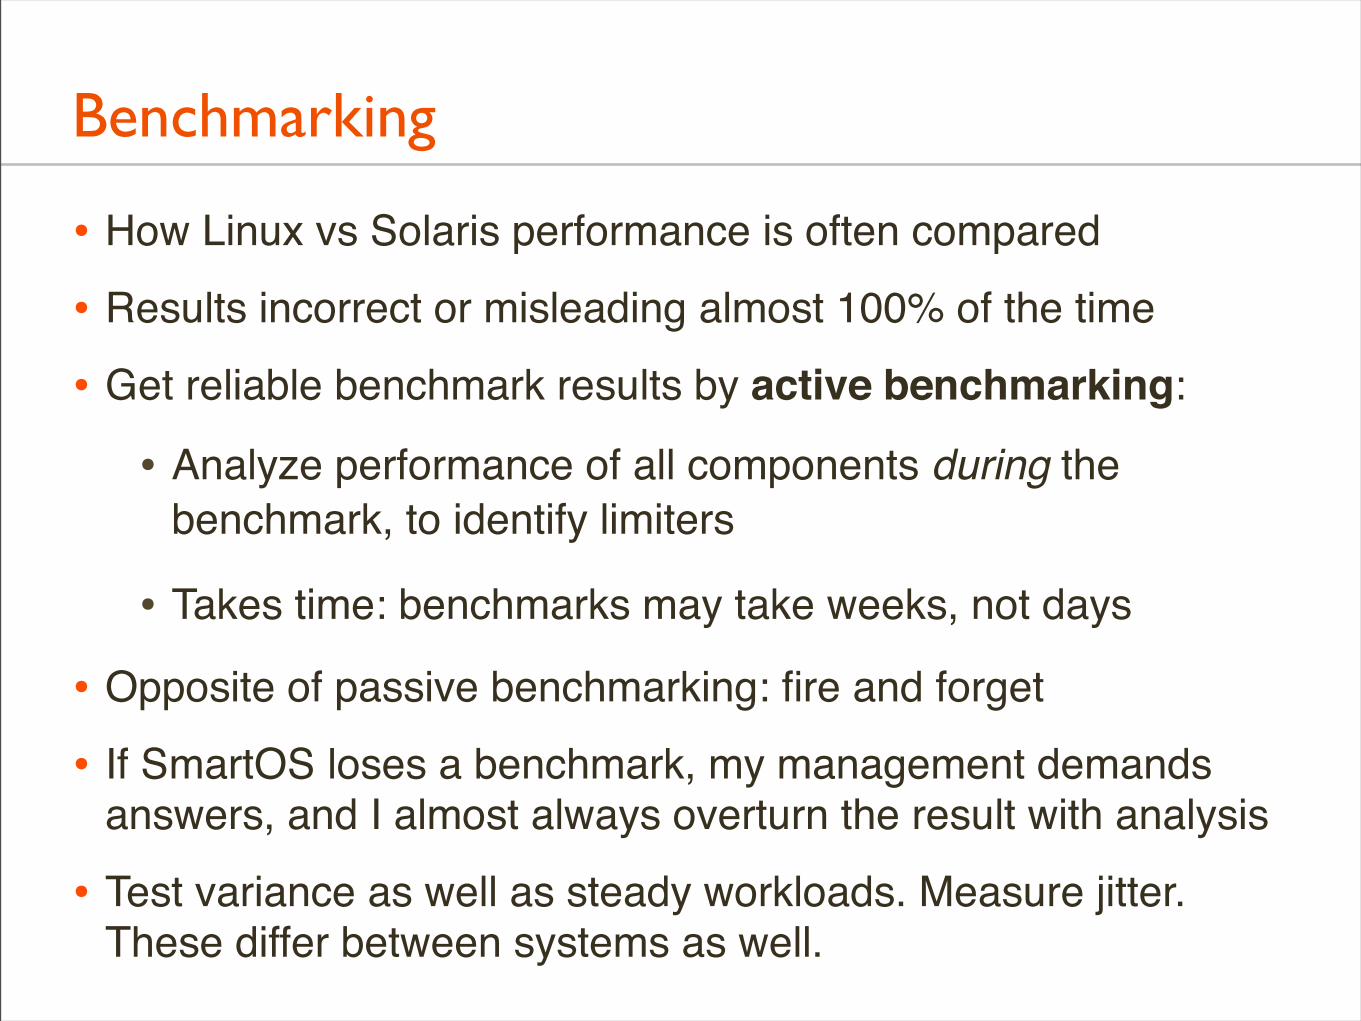
• How Linux vs Solaris performance is often compared
• Results incorrect or misleading almost 100% of the time
• Get reliable benchmark results by active benchmarking:
• Analyze performance of all components during the benchmark, to identify limiters
• Takes time: benchmarks may take weeks, not days
• Opposite of passive benchmarking: fire and forget
• If SmartOS loses a benchmark, my management demands answers, and I almost always overturn the result with analysis
• Test variance as well as steady workloads. Measure jitter. These differ between systems as well.

Results
Out-of-the-Box
• Out-of-the-box, which is faster, Linux or Solaris?
Out-of-the-Box
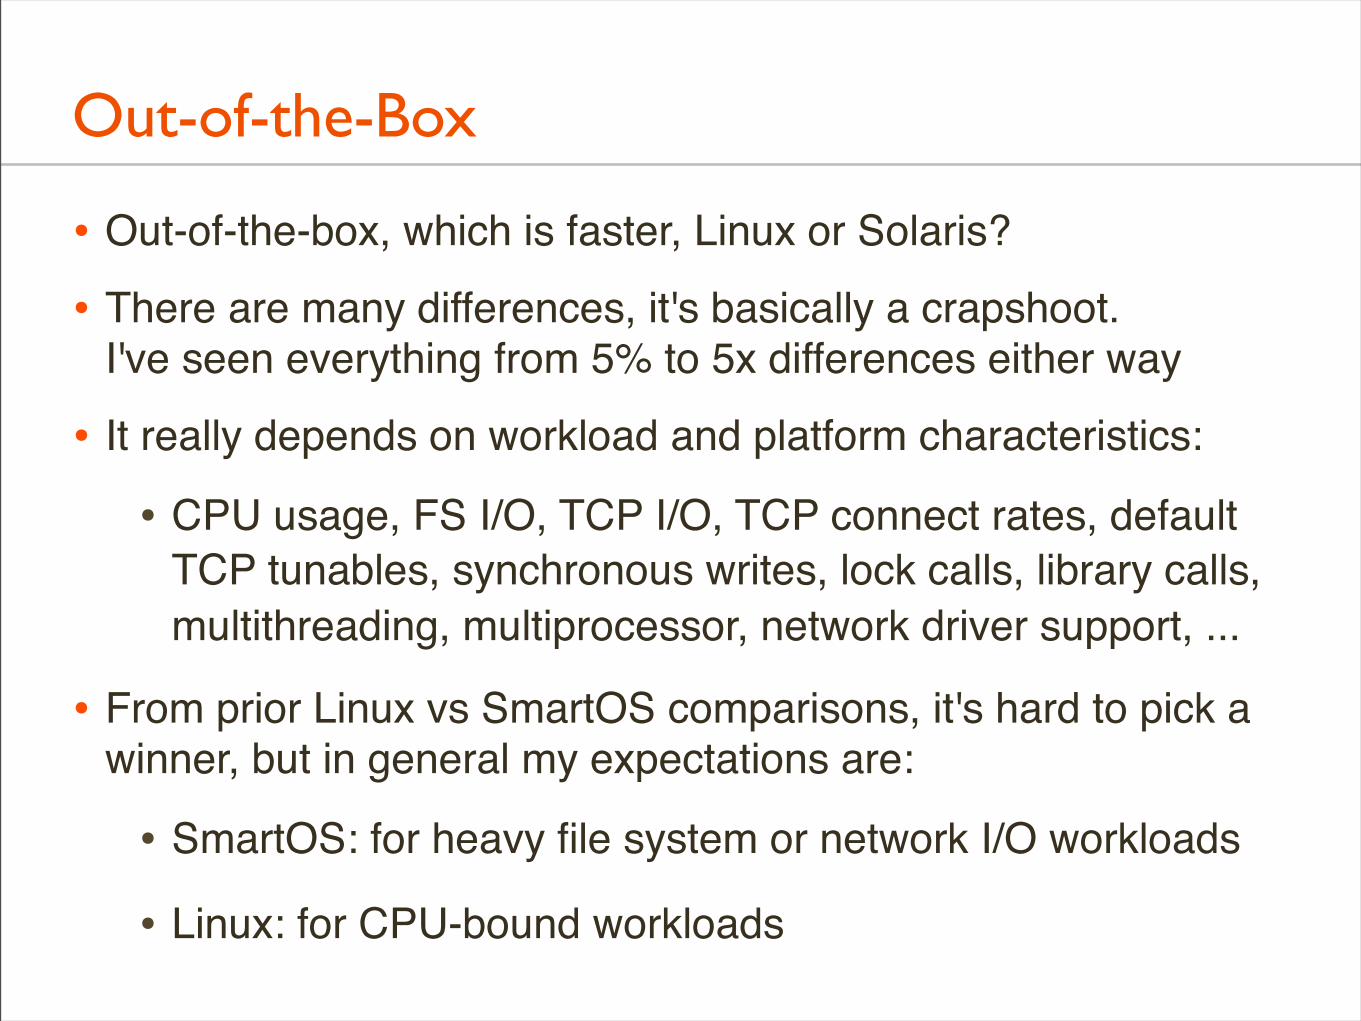
• Out-of-the-box, which is faster, Linux or Solaris?
• There are many differences, it's basically a crapshoot.I've seen everything from 5% to 5x differences either way
• It really depends on workload and platform characteristics:
• CPU usage, FS I/O, TCP I/O, TCP connect rates, default TCP tunables, synchronous writes, lock calls, library calls, multithreading, multiprocessor, network driver support, ...
• From prior Linux vs SmartOS comparisons, it's hard to pick a winner, but in general my expectations are:
• SmartOS: for heavy file system or network I/O workloads
• Linux: for CPU-bound workloads
Out-of-the-Box Relevance
• Out-of-the-box performance isn't that interesting: if you care about performance, why not do some analysis and tuning?
In Practice
• With some analysis and tuning, which is faster?
In Practice
• With some analysis and tuning, which is faster?
• Depends on the workload, and which differences matter to you
• With analysis, I can usually make SmartOS beat Linux
• DTrace and microstate accounting give me a big advantage: I can analyze and fix all the small differences (which sometimes exist as apps are developed for Linux)
• Although, perf/ktap/... are catching up
• I can do the same and make Linux beat SmartOS, but it's much more time-consuming without an equivalent DTrace
• On the same hardware, it's more about the performance engineer than the kernel. DTrace doesn't run itself.
At Joyent
• Joyent builds high performance SmartOS instances that frequently beat Linux, but that's due to more than just the OS. We use:
• Config: OS virtualization (Zones), all instances on ZFS
• Hardware: 10 GbE networks, plenty of DRAM for the ARC
• Analysis: DTrace to quickly root-cause issues and tune
• With SmartOS (ZFS, DTrace, Zones, KVM) configured for performance, and with some analysis, I expect to win most head-to-head performance comparisons
Learning From Linux
• Joyent has also been learning from Linux to improve SmartOS.
• Package repos: dedicated staff
• Community: dedicated staff
• Compiler options: dedicated repo staff
• KVM: ported!
• TCP TIME_WAIT: fixed localhost; more fixes to come
• sar: fix understood
• More to do...
References
• General Zoi's Awesome Pony Creator: http://generalzoi.deviantart.com/art/Pony-Creator-v3-397808116
• More perf examples: http://www.brendangregg.com/perf.html
• More ktap examples: http://www.brendangregg.com/ktap.html
• http://www.ktap.org/doc/tutorial.html
• Flame Graphs: http://www.brendangregg.com/flamegraphs.html
• Diagnostic cycle: http://dtrace.org/resources/bmc/cec_analytics.pdf
• http://www.brendangregg.com/activebenchmarking.html
• https://blogs.oracle.com/OTNGarage/entry/doing_more_with_dtrace_on
Thank You
• More info:
• illumos: http://illumos.org
• SmartOS: http://smartos.org
• DTrace: http://dtrace.org
• Joyent: http://joyent.com
• Systems Performance book:http://www.brendangregg.com/sysperf.html
• Me: http://www.brendangregg.com, http://dtrace.org/blogs/brendan, @brendangregg, [email protected]


![Solaris Performance Metrics Disk Utilisation by Process · Solaris Performance Metrics – Disk Utilisation by Process 10th December 2005 Brendan Gregg [Sydney, Australia] Abstract](https://img.pdfslide.us/doc/110x75/5adfbd5f7f8b9a97518c594b/solaris-performance-metrics-disk-utilisation-by-performance-metrics-disk-utilisation.jpg)