Embed Size (px)
Citation preview
Exxon Vuldez Oil Spill Restoration Project Final Report
Health and Rcproductive Implications of Exposure of Pacific Herring (Clupeapallusi) Adults and Eggs
to Weathered Crude Oil, and
Reproductive Condition of Herring Stock in Prince William Sound
Six Years .4fter the Exxon Valdez Oil Spill
Restoration Project 95974 Final Report
Mark G. Carlsl Scott W. Johnson'
Robert E. Thomas' Stanley D. Rice'
I National Oceanic and Atmospheric Administration National Marine Fisheries Service
Auk= Bay Laboratory ! !305 Glacier Highway Juneau, Alaska 99301
* Department of Biological Sciences Vesta Hal1 - Mansion Drive
California State University Chico Chico, California 95929
May 1997
Health and Reproductive Implications 01' Exposure o t Pacilic Herring (Clqwcr / w / / n , s i ) Adults ~ ~ n d Eggs t u Weathered Crude Oil. and Reproductive Condition o f Herring Stock i n
Princc William Sound S i x Years Al.tcr thc t c v o n \'old?.- Oil Spill
Restoration Pro,ject 95074 Final Report
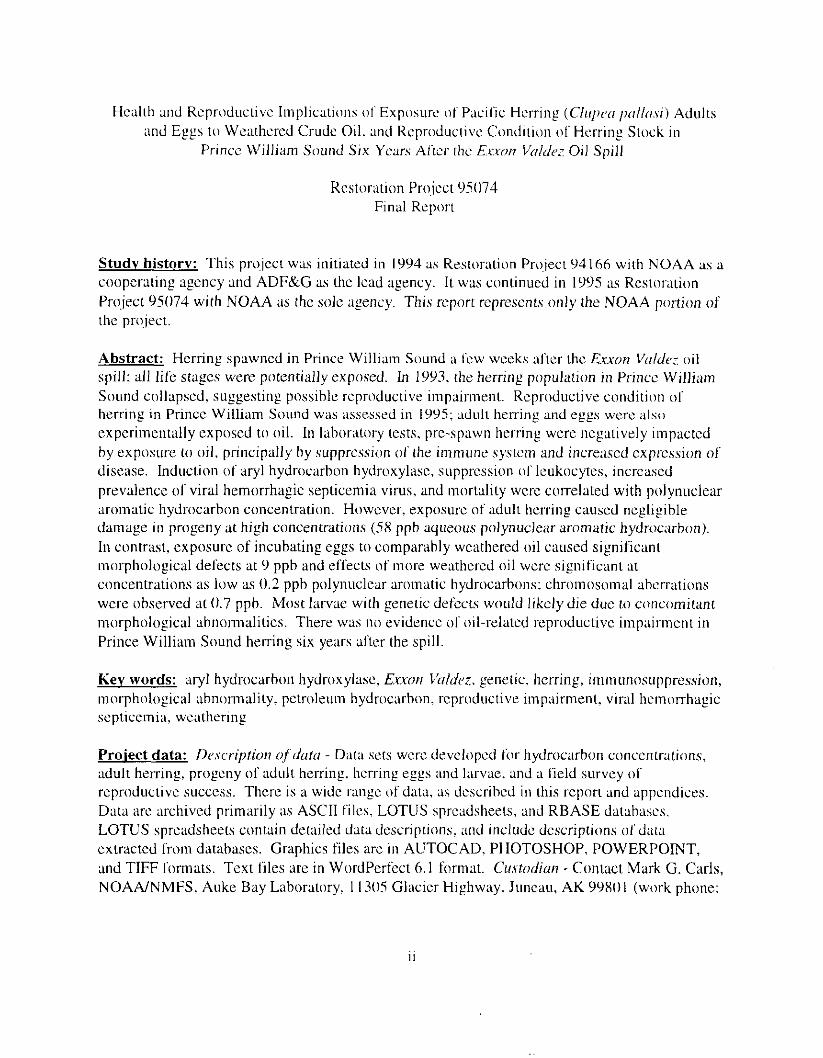
Studv history: This project was initiated i n 1994 as Restoration Project 94166 with NOAA as a cooperating agency and ADF&G as the lead agency. It was continued in 1995 as Rcsloration Pro,ject 95074 with NOAA as the sole agency. This report represents only the NOAA portion of the project.
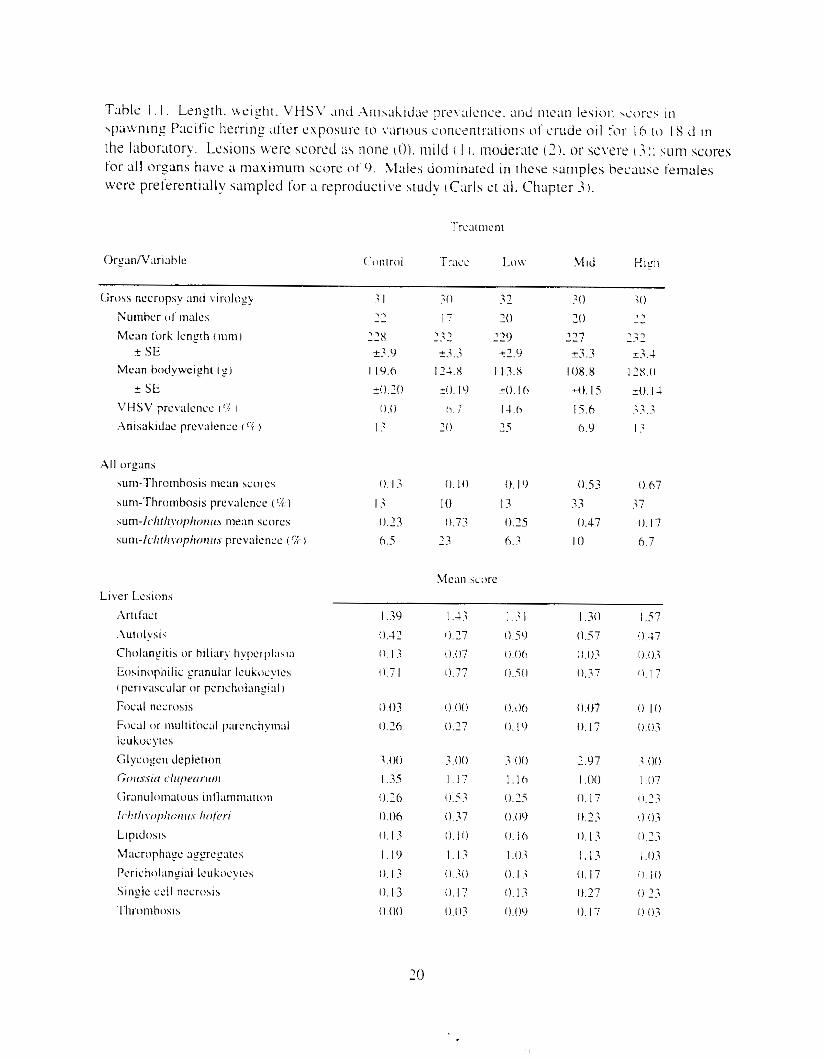
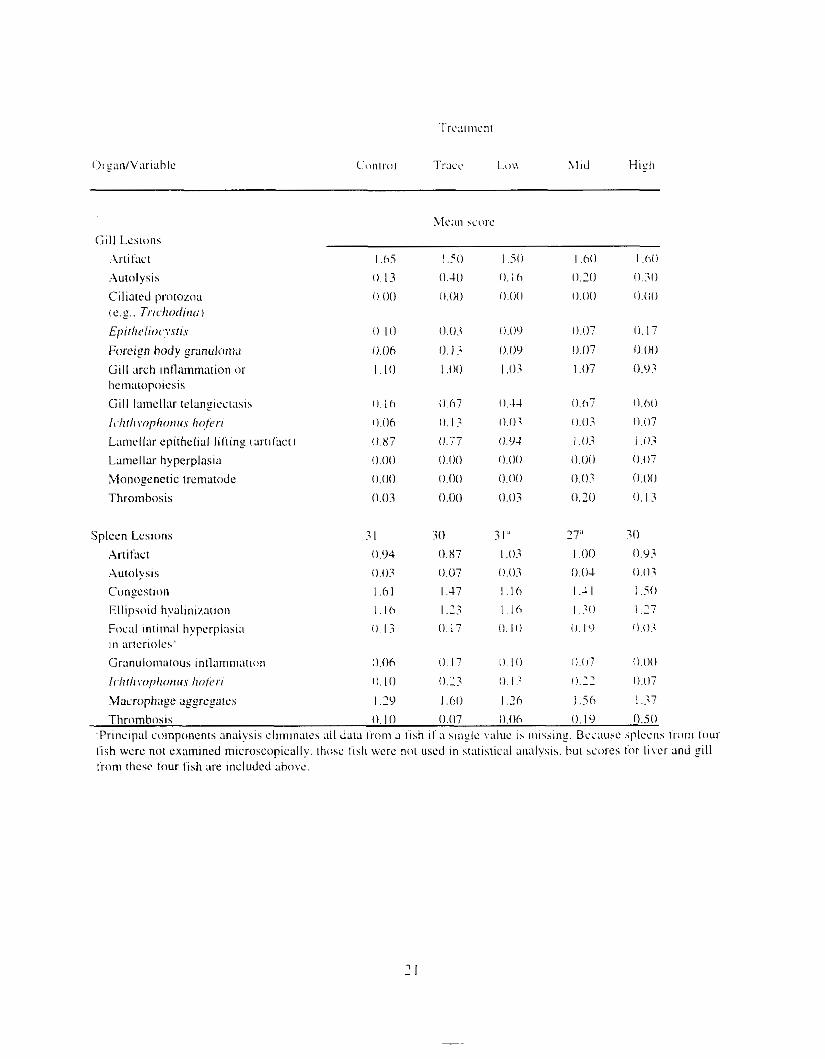
Abstract: Herring spawned in Prince William Sound a few wccks alter the E.rxor? Vrrlde; o i l spill: all life stages were potentiallyexposed. In 1993. the herring population in Princc William Sound collapsed, suggesting possible reproductive impairment. Reproductive condition of herring in Prince William Sound was assessed i n 1995: adult herring and eggs were alsu experimentally exposed to oil. In laboratory tests, pre-spawn herring were negatively impacted by exposure t o oil. principally hy suppression of the immune system and incre;wd expl-cssion o f disease. Induction of aryl hydrocarbon hydroxylase, suppression 01' leukocytes, increased prevalence of viral hemorrhagic septicemia virus. and mortality were correlated with polynuclear aromatic hydrocarbon concentration. However, exposure of adult herring causcd negligible damage i n progeny at high concentrations (SX pph aqueous polynuclear aromatic hydrocsrbon). I n contrast, exposure of incubating eggs to comparably weathered o i l caused significant morphological defects at 9 pph and ellects of more Weathered oil were significant at concentrations as low as 0.2 pph polynuclear aromatic hydrocarbons: chromosomal ahcrrations were observed at 0.7 pph. Most Inrvac with geneLic defects w o ~ ~ l d likclydie due to concomitant morphological ahnonnalitics. There was no evidence o f oil-related reproductive impairment in Prince William Sound herring six years after the spill.
Key words: aryl hydrocarhou hydroxylase, Er.won VuIdu.. genetic. herring, immunostIppression, morphological ;IhnorInality, petroleum hydrocarbon, reproductive impairment, viral hcmorrhagic septicemia, weathering
Proiect data: I h c r i p t i o n ojdufcr - Data sets were developed for hydrocarbon concentrations, adult herring, progeny of adult herring, herring eggs and larvae, and a held survey 01' reproductive success. There is a wide range of data, as described i n this report and appendices. Data are archived primarily as ASCn files, LOTUS spreadsheets, and RBASE databases. LOTUS spreadsheets contain detailed data descriptions. and include descriptions o f data extracted from databases. Graphics files are i n AUTOCAD. PHOTOSHOP, POWERPOINT, and TIFF formats. Text files are i n WordPerfect 6.1 format. C m d i u r ? - Contact Mark G. Carls, NOANNMFS, Auke Bay Laboratory. 1 I305 Glacier Highway. Juneau, AK 99801 (work phone:
(907) 7x94019; h x : (907) 7x9-6094. or E-mail mark.carls~'~noaa.~ov. Awilrrl~ilih, - Copics of a l l data and related tcxt files arc availablc on CDROM lor the cost ol'duplication.
Citation: Cads, M. G., S. W. Johnson, R. E. Thomas, and S. D. Ricc. 1997. Health ;1nd reproductive Implications o f exposure 01 Pacific herring (C/upw p / / m i ) adults and t&& 3 ' 'S to weathered crude oil. and reproductive condition of herring stock i n Prince William Sound six years after the E.uon Vuldrz oil spill, E.x.xon Vrrldvz Oil Spill Restor;ition Final Project Rcport (Rcstoration Project 95074), National Oceanic and Atmospheric Administration, National Marine Fisheries Scrvice, Aukc Bay Laboratory, Juneau, Alaska.
. . . 111
LlSTOFT.-\BLES . . . . . . . . . . . . . . . . . . . . . . . . . . . . . . . . . . . . . . . . . . . . . . . . . . . . . . . . . . 3
LIST0FFIGL:RES . . . . . . . . . . . . . . . . . . . . . . . . . . . . . . . . . . . . . . . . . . . . . . . . . . . . . . . . 4
EXECLTTIVE SL;M.MAR\I' . . . . . . . . . . . . . . . . . . . . . . . . . . . . . . . . . . . . . . . . . . . . . . . . . . . . 8
INTRODUCTION . . . . . . . . . . . . . . . . . . . . . . . . . . . . . . . . . . . . . . . . . . . . . . . . . . . . . . . . . . . . 12
OBJECTIVES . . . . . . . . . . . . . . . . . . . . . . . . . . . . . . . . . . . . . . . . . . . . . . . . . . . . . . . . . . . . . . . 13
Chapter I : Immunosuppression . express1011 o1 v~ral hrrnorrhagic septicemia virus . and mortality in pre-spawn Pacific herrinf I C/U/JCW p d l o s i ) exposed to weathered crude oil i n the laboratory . . . . . . . . . . . . . . . . . . . . . . . . . . . . . . . . . . . . . . . . . . . . . . . . . . . . . . . . . . . . . Ih ,ABSTRACT . . . . . . . . . . . . . . . . . . . . . . . . . . . . . . . . . . . . . . . . . . . . . . . . . . . . . . . . . . Ih INTRODUCTIOK . . . . . . . . . . . . . . . . . . . . . . . . . . . . . . . . . . . . . . . . . . . . . . . . . . . . . . 16 METHODS . . . . . . . . . . . . . . . . . . . . . . . . . . . . . . . . . . . . . . . . . . . . . . . . . . . . . . . . . . . 17 RESULTS . . . . . . . . . . . . . . . . . . . . . . . . . . . . . . . . . . . . . . . . . . . . . . . . . . . . . . . . . . . . . . DISCUSSION . . . . . . . . . . . . . . . . . . . . . . . . . . . . . . . . . . . . . . . . . . . . . . . . . . . . . . . . . 33 CONCLUSIONS . . . . . . . . . . . . . . . . . . . . . . . . . . . . . . . . . . . . . . . . . . . . . . . . . . . . . . . ~7 ACKNOWLEDGMENTS . . . . . . . . . . . . . . . . . . . . . . . . . . . . . . . . . . . . . . . . . . . . . . . . 38 LITERATURECITED . . . . . . . . . . . . . . . . . . . . . . . . . . . . . . . . . . . . . . . . . . . . . . . . . . 39 OTHER REFERENCES . . . . . . . . . . . . . . . . . . . . . . . . . . . . . . . . . . . . . . . . . . . . . . . . . 43
Chapter 7: Mixed function oxygen;lse ~nduction i n pre- and post-spawn herring (Cllrp. pf / /<ui ) by petroleum hydrocarbons . . . . . . . . . . . . . . . . . . . . . . . . . . . . . . . . . . . . . . . . . . . . . . . 44 .ABSTRACT . . . . . . . . . . . . . . . . . . . . . . . . . . . . . . . . . . . . . . . . . . . . . . . . . . . . . . . . . . . -13 INTRODUCTIOK . . . . . . . . . . . . . . . . . . . . . . . . . . . . . . . . . . . . . . . . . . . . . . . . . . . . 44 METHODS . . . . . . . . . . . . . . . . . . . . . . . . . . . . . . . . . . . . . . . . . . . . . . . . . . . . . . . . 45 KESULTS . . . . . . . . . . . . . . . . . . . . . . . . . . . . . . . . . . . . . . . . . . . . . . . . . . . . . . . . . . . . 47 DISCL~SSION . . . . . . . . . . . . . . . . . . . . . . . . . . . . . . . . . . . . . . . . . . . . . . . . . . . . . . . . . 5 3 CONCLUSIONS . . . . . . . . . . . . . . . . . . . . . . . . . . . . . . . . . . . . . . . . . . . . . . . . . . . . . . . jj .A CKSOWLEDGMENTS . . . . . . . . . . . . . . . . . . . . . . . . . . . . . . . . . . . . . . . . . . . . . . 5 5 LITERATURECITED . . . . . . . . . . . . . . . . . . . . . . . . . . . . . . . . . . . . . . . . . . . . . . . . . . ~6 OTHER REFERENCES . . . . . . . . . . . . . . . . . . . . . . . . . . . . . . . . . . . . . . . . . . . . . . . . . 60
Chapter 3 : The impact of exposure o t adult pre-spawn herring (C'lupetr p r d / r r . s i I t o 011 on profeny compared to that of direct euposut-e of eggs to oil durinf ~ncubation . . . . . . . . . . . . . . . 6 2 .-\BSTRACT . . . . . . . . . . . . . . . . . . . . . . . . . . . . . . . . . . . . . . . . . . . . . . . . . . . . . . . . . . . 62 INTRODUCTION . . . . . . . . . . . . . . . . . . . . . . . . . . . . . . . . . . . . . . . . . . . . . . . . . . . . . . ( ~ 7 METHODS . . . . . . . . . . . . . . . . . . . . . . . . . . . . . . . . . . . . . . . . . . . . . . . . . . . . . . . . . . . ( ~ 4 RESLjLTS . . . . . . . . . . . . . . . . . . . . . . . . . . . . . . . . . . . . . . . . . . . . . . . . . . . . . . . . . . . . 70
I
DISCCSSION . . . . . . . . . . . . . . . . . . . . . . . . . . . . . . . . . . . . . . . . . . . . . . . 34 CONCLUSIONS . . . . . . . . . . . . . . . . . . . . . . . . . . . . . . . . . . . . . . . . . . . . . . . . . . . . . . 90 .ACKSOWLED GMESTS . . . . . . . . . . . . . . . . . . . . . . . . . . . . . . . . . . . . . . . . . . . . . . . . 90 LITERATURE CITED . . . . . . . . . . . . . . . . . . . . . . . . . . . . . . . . . . . . . . . . . . . . . . . . . .
Chapter 4: Effects o f incub;rting lhrrrlns (C/ I ( /XW / w / / r i . v i i egzs i n \ \ ; ~ r r conrarnlnated \vlth weatheredcrudeoil . . . . . . . . . . . . . . . . . . . . . . . . . . . . . . . . . . . . . . . . . . . . . . . . . . . . . . .4 ~ B S T R A C T . . . . . . . . . . . . . . . . . . . . . . . . . . . . . . . . . . . . . . . . . . . . . . . . . . . . . . . . . . . ~4 LVTRODUCTION . . . . . . . . . . . . . . . . . . . . . . . . . . . . . . . . . . . . . . . . . . . . . . . . . . . . . . 94 METHODS . . . . . . . . . . . . . . . . . . . . . . . . . . . . . . . . . . . . . . . . . . . . . . . . . . . . . . . . . . . 95 RESULTS . . . . . . . . . . . . . . . . . . . . . . . . . . . . . . . . . . . . . . . . . . . . . . . . . . . . . . . . . . . 101 DISCUSSION . . . . . . . . . . . . . . . . . . . . . . . . . . . . . . . . . . . . . . . . . . . . . . . . . . . . . . . . 125 CONCLUSIONS . . . . . . . . . . . . . . . . . . . . . . . . . . . . . . . . . . . . . . . . . . . . . . . . . . . . . . 136 ACKNOWLEDGMENTS . . . . . . . . . . . . . . . . . . . . . . . . . . . . . . . . . . . . . . . . . . . . . . . 137 LITERATURE CITED . . . . . . . . . . . . . . . . . . . . . . . . . . . . . . . . . . . . . . . . . . . . . . . 138
Chapter 5 : Reproductlvr S L I C C ~ \ \ o t Pacrfic herring ( C / I ~ W I I / J U / / < L Y ; I i n Prince William Sound . .Alaska. s i x years atter the Erxm \'o/t/c. ..- Oil Spill . . . . . . . . . . . . . . . . . . . . . . . . . . . . . 146 r\BSTRACT . . . . . . . . . . . . . . . . . . . . . . . . . . . . . . . . . . . . . . . . . . . . . . . . . . . . . . . . . . 14h INTRODUCTION . . . . . . . . . . . . . . . . . . . . . . . . . . . . . . . . . . . . . . . . . . . . . . . . . . . . . 146 :METHODS . . . . . . . . . . . . . . . . . . . . . . . . . . . . . . . . . . . . . . . . . . . . . . . . . . . . . . . . . . 147 RESULTS . . . . . . . . . . . . . . . . . . . . . . . . . . . . . . . . . . . . . . . . . . . . . . . . . . . . . . . . . . . 153 DISCUSSION . . . . . . . . . . . . . . . . . . . . . . . . . . . . . . . . . . . . . . . . . . . . . . . . . . . . . . . . 158 CONCLUSIONS . . . . . . . . . . . . . . . . . . . . . . . . . . . . . . . . . . . . . . . . . . . . . . . . . . . . . . 166 ACKNOWLEDGMENTS . . . . . . . . . . . . . . . . . . . . . . . . . . . . . . . . . . . . . . . . . . . . . . . 167 LITERATURE CITED . . . . . . . . . . . . . . . . . . . . . . . . . . . . . . . . . . . . . . . . . . . . . . . . . 16x OTHER REFERENCES . . . . . . . . . . . . . . . . . . . . . . . . . . . . . . . . . . . . . . . . . . . . . . . . 171
. .\PPENDICES I72
Table 3 . I . PAH identified by chemical analysis. md the abbreviattons used in figures. . . . . . . 68 Table 3.2. Reproductive condiuon o f adult herrinf ;It time <>f artificial spawning. , . . . . . . . . . 70
Table 1. I . ,Alkane/P;\Hs and phytaneiPAHs ratios were lc)\ver In water than i n oiled rock. ~ndicating disrolutlon of the more wluhle PAH5. . . . . . . . . . . . . . . . . . . . . . . . . . . . . . 101
Table 1.2. Median effective PAH concentrations (ECSOsi. . . . . . . . . . . . . . . . . . . . . . . . . . . . I17
Table 5 , I . Description of key response parameters useU 10 evaluate reproductive ~ m p a ~ r m e n t ~n Pacific herrinz collected from ;I PWS and SE.-\K Alaska , . , . , . . . . . . . . . , , , . , , , . . 15 I
Table 5.1. ,Age. year-class. and possible o i l exposure o t Pacific herrin_r collected i n PWS. Alaska in 1995. , , . . . . . . . . . , . . . . . . . . . , . , , . . . . . . . . . . . . . . . . . . . . . . . . . . . . . . . . . . . . 1 5 2
Table 5.3. Fork length (mmi and wma[ic weisht lg) o f mature t'einale Pacific herrinf captured in SEAK and PWS. Alaska i n spring 1995. . . . . . . . . . . . . . . . . . . . . . . . . . . . . . . , , . . . . 154
Figure I . I . P;\H m d alkane cot1centratIons I n tl-c:ltment water x ;I tunction ot tlme . . . . . . . . 23 F i y r e 1.2. Relationship hetween I n l t i ; d P.AH concentration i n treatment water Lmd th; l t 111
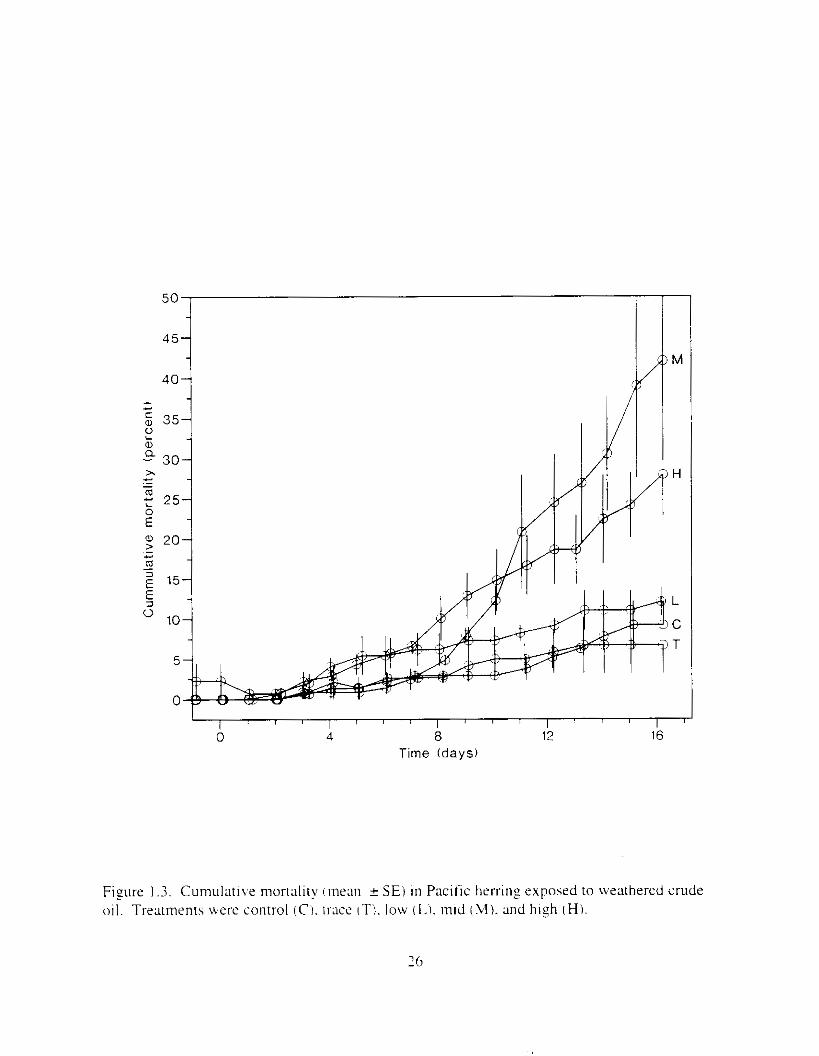
muscle and o v x y tlssue Inlean I S E ) . . . . . . . . . . . . . . . . . . . . . . . . . . . . . . . . . . . . . . . 2 1 Figure 1.3. Cumulative mortality (mean ? S E I In Pactfic herrtng exposed to weathered crude
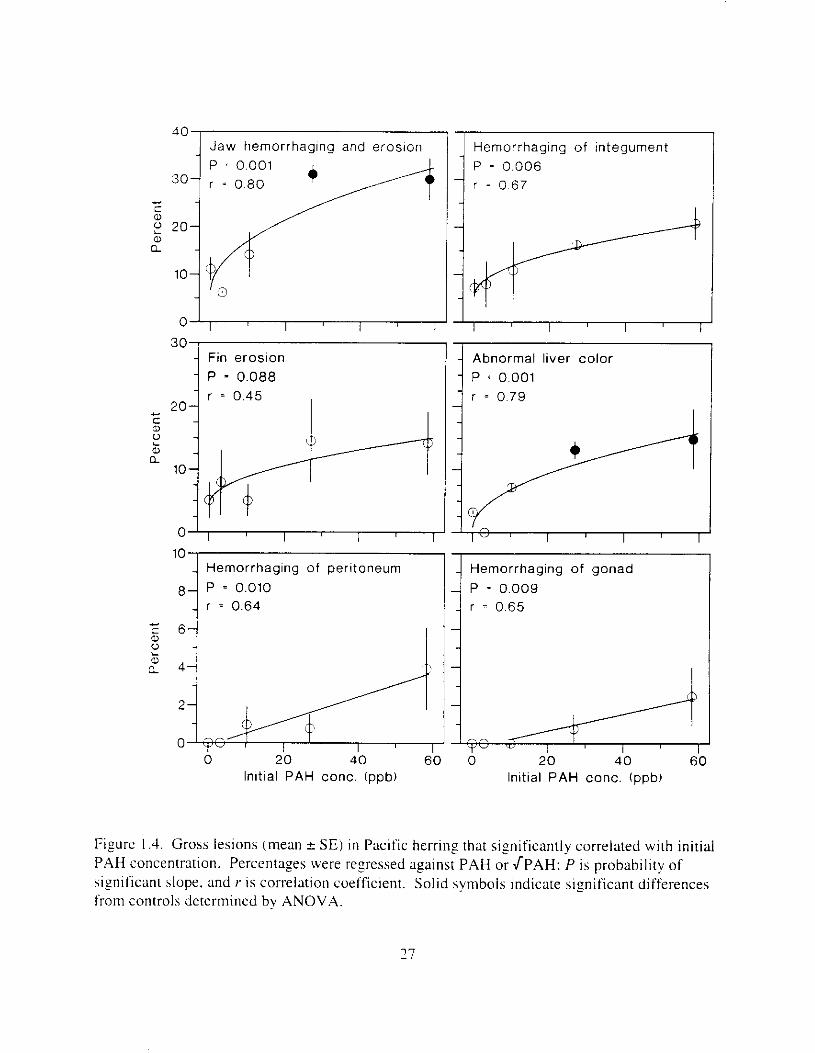
oil. 26 Figure 1.1. Gross lesions (mean 3 SEI i n Pacific herrlng that significantly correlated \ \ i t h initial
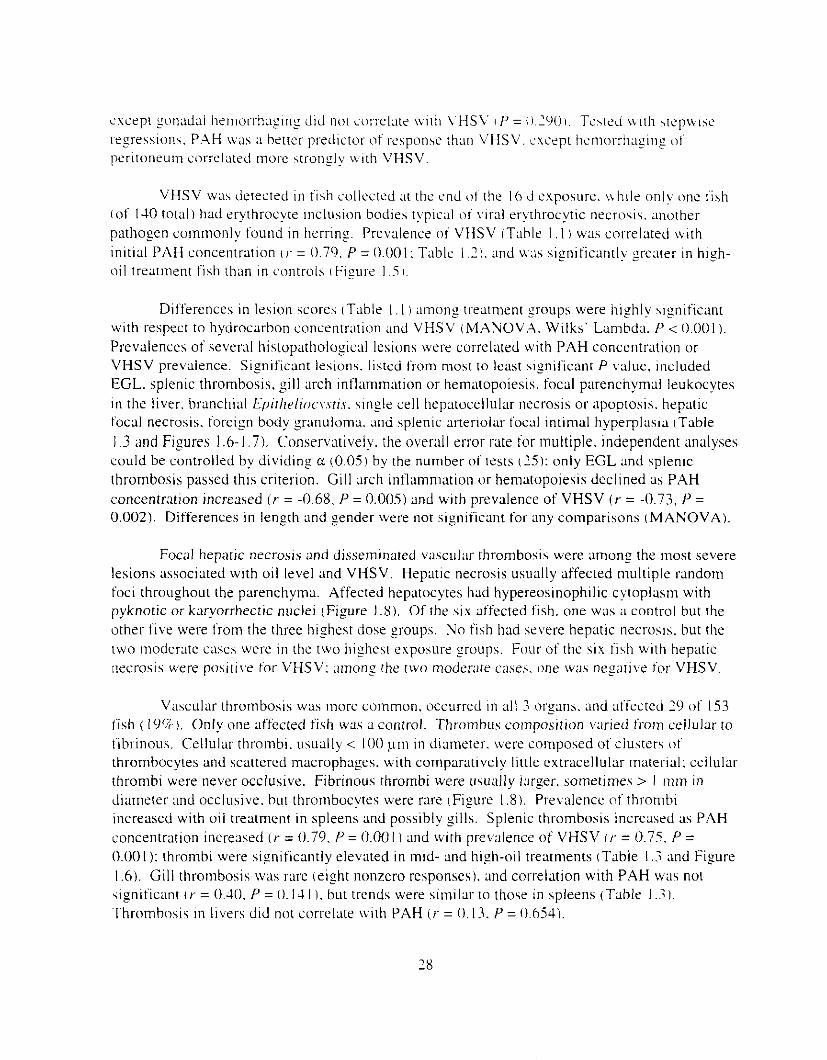
PAHconcentration. . . . . . . . . . . . . . . . . . . . . . . . . . . . . . . . . . . . . . . . . . . . . . . . . . . . . . ~7 Figure I .S. Relationship of EGL. VHSV. and cumulative mortality to initial PAH conccntration.
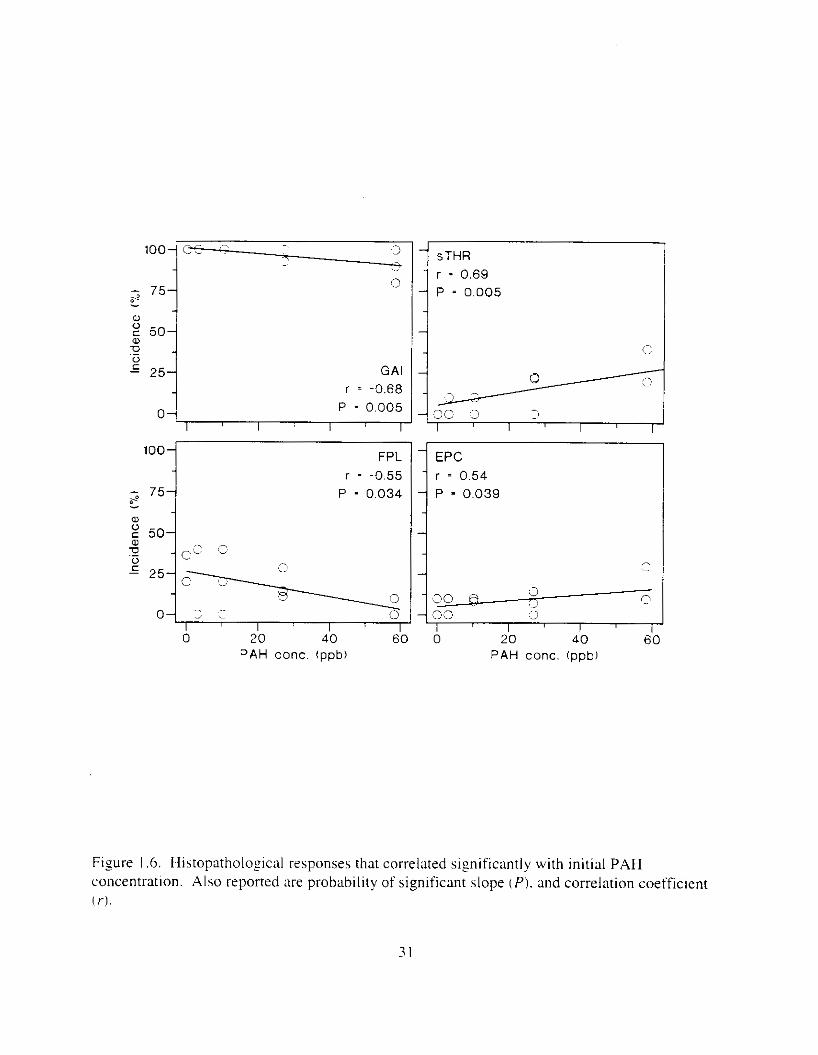
. . . . . . . . . . . . . . . . . . . . . . . . . . . . . . . . . . . . . . . . . . . . . . . . . . . . . . . . . . . . . . . . . . . . . .9 Figure I .6. Histopathological responses that correlated significantly with initial PAH
concentrltion . . . . . . . . . . . . . . . . . . . . . . . . . . . . . . . . . . . . . . . . . . . . . . . . . . . . . . . . . . . 31
. . . . . . . . . . . . . . . . . . . . . . . . . . . . . . . . . . . . . . . . . . . . . . . . . . . . . . . . . . . . . . . .
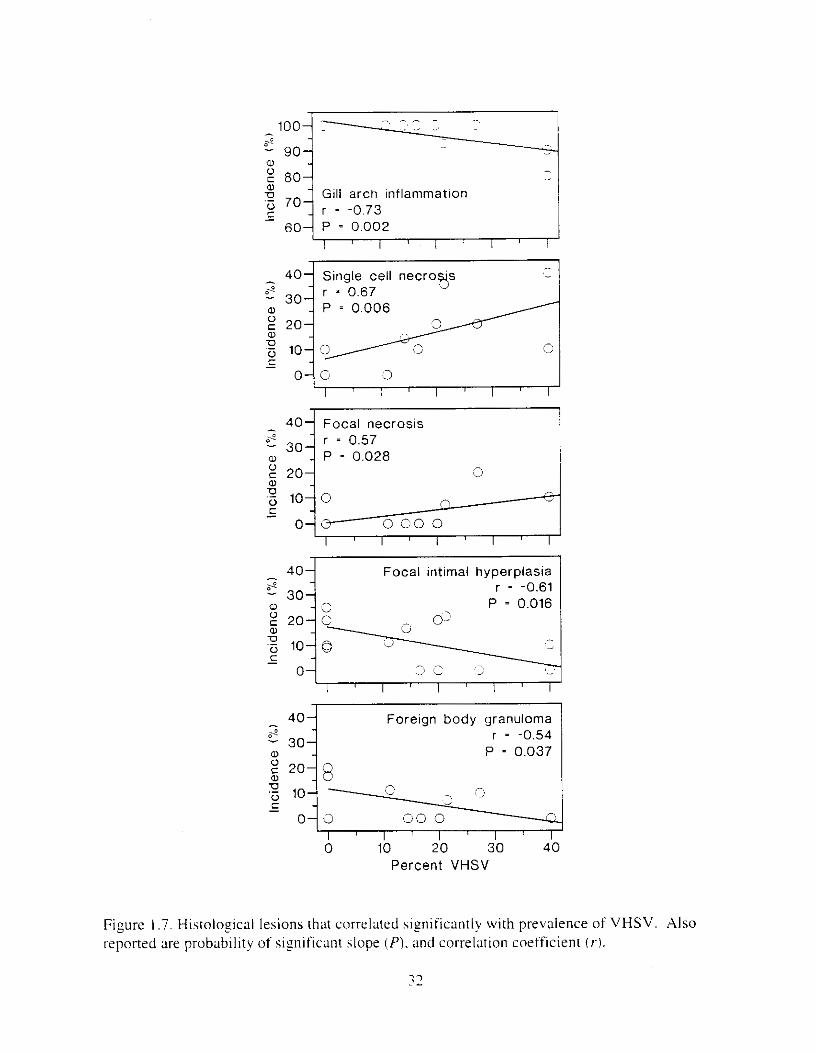
Figure I .7. Histological Icsions that correlated significantly with prevalence of VHSV. . . . . . . 32 Figure I .8. .Microscopic lesions i n adult Pacific herring exposed to weathered crude oil i n the
laboratory. . . . . . . . . . . . . . . . . . . . . . . . . . . . . . . . . . . . . . . . . . . . . . . . . . . . . . . . . . . . . .3
Figure 2. I . PAH concentrations In trmtment Lvater. . . . . . . . . . . . . . . . . . . . . . . . . . . . . . . . . . . -IS
herrlng exposed to oil i n water. . . . . . . . . . . . . . . . . . . . . . . . . . . . . . . . . . . . . . . . . . . . . 50 Figure 2.2. PAH concentrations In muscle and ovary o f pre-spawn and muscle of posr-\pawn
Figure 2.3. AHH activity in livers o f pre-%pawn herring :IS a function of oil treatment. . . . . . . 5 I Figure 2.4. Induction of MFO in pre- and post-spawn adult herring. . . . . . . . . . . . . . . . . . . . . . 52
Figure 3. I . Mean PAH concentrations i n water. ovaries. and i n high-oil treatment eggs as functions ot tlme . . . . . . . . . . . . . . . . . . . . . . . . . . . . . . . . . . . . . . . . . . . . . . . . . . . . . . . 72
Figure 3.2. PAH composition i n water varied as a function o f initial PAH concentration i n water. . . . . . . . . . . . . . . . . . . . . . . . . . . . . . . . . . . . . . . . . . . . . . . . . . . . . . . . . . . . . . . . . . . . . . 7 3
Figure 3.3 . Composition of PAHs val-ied as ;I titnction o f rime. . . . . . . . . . . . . . . . . . . . . . . . . . 71 F i p r e 3.4. Cornposition o f PAHs i n ovaries and e g z s compared to that i n trcattnent water. . . 75 Figure 3.5. Fertility and death of esgs \pawned from adult herring esposed to o i l S o r 1 6 d LIS
Figure 3.6. Peak and median hatch day o f esgs spawned fi-om adult herring exposed t o 0 1 1 8 or
F i y r e 3.7. Swimming ability. spinal defects. and death o f larvae from adult herrtng esposed to
Figure 3 . 8 . Incidence of larvae with yolk-sac edema and underdeveloped lower jaws I ' l - o m adult
Figure 3.9. Length. yolk volume. and maturity o f larvae hatched from adult kt-r tng e p o s e d to
Figure 3. IO. Anaphase aberrxion and number of mitotic figures i n pectoral fins o f I:trv;tc fronl
Figure 3 . I I . Comparlson of PAH concentrdtion i n treatment water and egg tissue i n experiments
. .
functions of inltial PAH. . . . . . . . . . . . . . . . . . . . . . . . . . . . . . . . . . . . . . . . . . . . . . . . . . 77
. . . . 16 d as functions ot lnltlal P.4H concentration. . . . . . . . . . . . . . . . . . . . . . . . . . . . . . . . . 78
oil 8 or 16 d as functions of inltial PAH concentration. . . . . . . . . . . . . . . . . . . . . . . . . . 80
herring exposed to oil 8 or 16 cl ;IS functions of initial P.4H concentrxion. . . . . . . . . . . SI
oil 8 o r I6 d as tunctions o f i n i [ t d PAH concentration. . . . . . . . . . . . . . . . . . . . . . . . . . S2
adult herring exposed to oil 8 d. . . . . . . . . . . . . . . . . . . . . . . . . . . . . . . . . . . . . . . . . . . . . 53
where pre-spawn adult herring were exposed to oil-contaminated water I 1094) 01- where
ilcrrlnf e f f s \\ere rxposrd di1-cctI) 10 oil~iullt;lllillliltr~l \\;ILCI t i t l r lnf IncLIh;1tlo~1 1 )()<)51. . . . . . . . . . . . . . . . . . . . . . . . . . . . . . . . . . . . . . . . . . . . . . . . . . . . . . . . . . . . . . . . . . . . s7
Figure 4. I , Total PAH concentratlons 111 \ \ ;~ter :15 ;I tunctlon of time. by experlnlenr ;md Ireatment. . . . . . . . . . . . . . . . . . . . . . . . . . . . . . . . . . . . . . . . . . . . . . . . . . . . . . . . . . . . . 102
Figure 4.2. PAH compos~tlon on day 0 i n E l as a lunctlon o f initial PAH concentratlon. . . . 104 Figure 4.3. PAH compositlon on day 0 In E7 as a function of initial P.4H concentration. . . . 105 Figure 4.4. Changes i n PAH composition as ;I function of time. . . . . . . . . . . . . . . . . . . . . . . . IO7 Figul-e 4.5. Concentrations of PAHs increased i n esg tiss~le over the entire 16 d exposul-e i n El .
but peaked after circa 4 d i n E:. . . . . . . . . . . . . . . . . . . . . . . . . . . . . . . . . . . . . . . . . . . . 108 Figure 4.6. Esposure of herrin? ezgs [o o i l during ~ncub;~tion stimulated early hatch. , , . , . , I I O Figure 4.7. Exposure of eggs to oil during incubation caused egg and larval mortality. . . . . . I I I Figure 4.8. Larval swimming ability was reduced by esposure of incubating e g g to o i l . and the
incidence of spinal abnormalities increased. . . . . . . . . . . . . . . . . . . . . . . . . . . . . . . . . . 1 I:! Figure 4.9. Edema was observed i n larvae hatched from oil-exposed eggs. and the incidence of
larvae with small lowerjaws increased. . . . . . . . . . . . . . . . . . . . . . . . . . . . . . . . . . . . . . I13 Figure 4. IO. Larval length decreased as ;I result of oil expohure: body curv;Iture and yo lk volume
increased. . . . . . . . . . . . . . . . . . . . . . . . . . . . . . . . . . . . . . . . . . . . . . . . . . . . . . . . . . . . . 115 Figure 4. I I. In E l . a random subsample o f larvae were m e s s e d hlind for morphologlcal
deformities and genetic aberration. . . . . . . . . . . . . . . . . . . . . . . . . . . . . . . . . . . . . . . . . I 16 Figure 4.12. Hatch timing. measured by peak hatch day and by median hatch day. declined as
exposure time increased. . . . . . . . . . . . . . . . . . . . . . . . . . . . . . . . . . . . . . . . . . . . . . . . . I19 Figure 4.13. In E l , egg and larval mortality increased as exposure time increased, but
regressions were not significant in E?. . . . . . . . . . . . . . . . . . . . . . . . . . . . . . . . . . . . . . 120 Figure 4.14. Larval swimming ability declined as exposure time Increased. and the incidence of
spinal abnormalities increased. . . . . . . . . . . . . . . . . . . . . . . . . . . . . . . . . . . . . . . . . . . . I2 I Figure 4.15. Edema increased as exposure time increased. and the incidence of I a r v x with small
IowerJaws increased. . . . . . . . . . . . . . . . . . . . . . . . . . . . . . . . . . . . . . . . . . . . . . . . . . . . 122 Figure 4.16. Larval length decreased ;I\ csposure time increased: body curvature and yolk
volume increased. . . . . . . . . . . . . . . . . . . . . . . . . . . . . . . . . . . . . . . . . . . . . . . . . . . . . . I23 F i g r e 4.17. I n El. ;I random subsunpie ot larvae were ;~ssesseu blind for nmrphologrcal
Figure 4.18. Comparison of PAH composition i n the low-oil treatment of E I I initial PAH . . . . . . . . . . . . . . . . . . . . . . . . . . . . . . . . . . . . . . . . . . . . . . . . . . . . . . . . . . deformities. II4
concentration \vas 9 ppb) and the high-oil treatment of E2 initial P.4H concentration W;IS
8 p p b ) . . . . . . . . . . . . . . . . . . . . . . . . . . . . . . . . . . . . . . . . . . . . . . . . . . . . . . . . . . . . . . . 130
F i y r e 5 . I , Collection sites of mature Pxi f ic herring in PWS and SEAK Alaska i n spriny 1995.
Figure 5.2. Mean ( + SE) percent hatch. live. effective swimmers. and spinal clbnormalities ol'
Figure 5 . 3 . For the 1989 yewclass. mean ( + SE) perccnt hatch. live. rffectlw swimlners. and
. . . . . . . . . . . . . . . . . . . . . . . . . . . . . . . . . . . . . . . . . . . . . . . . . . . . . . . . . . . . . . . . . . . . 148
larval Pacific herring by site and region i n Alaska. 1995. . . . . . . . . . . . . . . . . . . . . . . . 155
spinal abnormalities o f IxvaI Pacific herring by site and region i n Alaska. 1995. . . . . 156
5

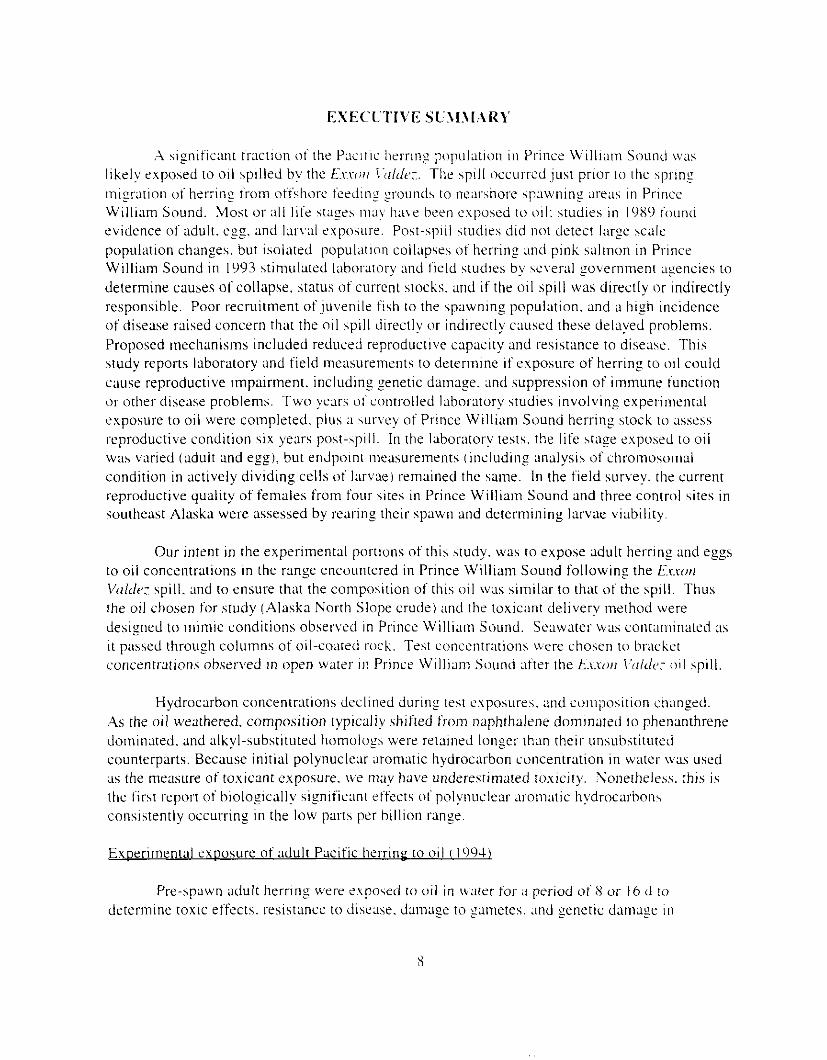
A significant fraction of the Pacl t~c ilerrlnf populut~on i n PI-ince William Sound \v;~s likelv exposed to oil \pllled by the E.v~c-oir \ ' d d o : . The \pill occurred just prior to the spr~n: ~ n ~ y c ~ t ~ o n ot'herrin? trorn otfshorc feedlns younci\ to nearshol-e \pawnin: areas i n Prince William Sound. Most 01- all life stage5 n1a) have been cxposed to oil: studies i n lOX9 found evidence of adult. egg. and Iar\.aI exposure. Post-sp~l l studirs did not detect large xn le populatlon changes. but isolated populatton collapses of hemin: and pink salmon i n Prince William Sound in 1993 stimulated laboratory and field studies b!! several ~overnrnent qencies to determine causes of collapse. status o f current stocks. and if the oI1 spill was directly o r indirectly responsible. Poor recruitment ofjuven~le fish to the \pawning population. and a high ~ncidence o f disease raised concern that the oil spill directly or indirectly caused these delayed problems. Proposed mechanisms included reduced reproductive capac~ty and resistance to disease. This study reports laboratory and field measurements to determine if exposure of herrins t o oil could cause reproductive impairment. including genetic damaze. and suppression of immune function o r other disease problems. Two years o f controlled laboratory studies involving experimental exposure to oil were completed. plus ;I w r v e y o f Prince William Sound herring stock to assess reproductive condition six years p o s t - q i l . In the laboratory tests. the life h t q e exposed to oil w ; ~ s varied (adult and egg), but enJpolnt measurements (including malysib o f chromo\omal condition i n actively dividing cells of larvae) remained the same. In the field survey. the current reproductive quality of females from four sites i n Prince William Sound and three control sites in southeast Alaska were assessed by rearing their spawn and determining larvae viability.
Our intent in the experimental portions of this study, was to expose adult herring and eggs to oil concentrations in the range encountered in Prince William Sound following the E.rro,! V ~ I k k : spill, and to ensure that the composition of this oil was similar to that of the spill. Thus the oil chosen for study (Alaska North Slope crude) and the toxicant delivery method were designed to mimic conditions observed ~n Prince William Sound. Seawater was contmlinated ;IS
It passed through columns of oil-coated rock. Test concent~-:~tions were chosen to bracket concentrations observed i n open water 111 Princc Willian~ Sound xfter the E.t.wrI \'k/dv: 0 1 1 spill.
Hydrocarbon concentrations declined d u r ~ n g test exposures. and co~nps i t ion chmged. As the oil weathered. composition typically shifted t'rorn ~xlphthalene dominated to phenanthrene dominated. and alkyl-substituted homolo:s were retained longer than their t~nsubstituted counterparts. Because initial polynuclear aromatic hydrocarbon concentration in water \vas used as the measure of toxicant exposure. we 17Uy have underestimated toxicity. Nonethele~s. this is the first report o f hiolozicdly significant effects o f polynuclear a ~ - o ~ n ; ~ t i c hydrocarbon\ consistently occurring i n the low parts per billion range.
Exoerilnental exposure o f adult Pacific herring to oil ( I W 4 I
Pre-spawn adult hernns wrrr exposed IO oil in w;lter for ;I period of 8 or 16 d to determine toxic effects. resistance to disease. damage to y n e t e s . .Ind genetic damage I n
lprogen!'. .Although x l u l t > were ezpo \e~ i . m q o r r m p h a s ~ ~ placed on the > u r \ ' ~ \ a I and viability ~ ) f resultant larwe. .Actively dividlng w ~ n ; ~ t i c cclls i n the pector;d tins o f larvae were esamined l'or chromosomal aberrations. in ;I t'dlo\v-tlp esperiment. post-spawn hrrr inz were similarly exposed to oil to determ~ne if cliffel-enccs I n physiological and Ireproductive condition would .lffect hydrocarbon :~ccumulation ;~nd hioIo?ical response.
Adult herring were neytively impacted by exposure to 011. Hydrocarbons ;~ccumulated in tissues of exposed fish. including muscle and ovary. Aryl hydrocarbon hydroxylase activity was induced i n liver tissue. The immune systems of adult fish were suppressed. Evidence for immunosuppression in the liver included slgnlficant declines in eosinophilic granular leukocytes and focal or multifocal parenchymal leukocytes in liver. Prevalence of viral hemorrhagic septicemia virus. subclinical or latent in our wild herring stock. w ~ s positively correlated with oil exposure. and negatively correlated with leukocyte abundance. suggesting a c a ~ s a l l i n k between immunosuppression and disease. Death and disease were positively correlated. and 97°C of the fish that died had lesions characteristic of viral hemorrhagic bepticernia virus. suggesting a causal l i nk between disease and mortality. .Although enpression o f latent virus i n response to toxicant exposure has not previously been reported. evidence stronzly indicates that activation o f viral hemorrhagic septicemia virus In Pacific Ilerr~ng might be encountered after an o i l sp~l l .
Oil impacts i n post-spawn herring were smaller than in pre-\pawn herring. but induction of mixed function oxidases was two to three times that i n pre-spawn fish. In contrast to pre- spawn fish. there was no external evidence of disease in post-spawn fish, and there was no evidence of dose-dependent mortality. Depression of induction levels in pre-spawn fish was probably related to the energetic cost of reproduction and the hormonal constituency of the reproductively ripe animals.
Exposure of pre-spawn adult herring to oil cclused no damage to gametes and little or none in progeny, even though initial polynuclear aromatic hydrocarbon exposure concentr;Ltions extended up to 58 ppb. There w a s no evidence that gamete Lriability was affected: mean fertility ranged from 93 to 950,. Fertile q g s produced normal larvae: the!-e were 110 differences in larval wrvival (within I d o f hatch). spinal defects. or swimmins hehavlor mtong treatments. There was an ilpparent Increase i n yolk volume In larvae from adults espohed to the high-oil treatment. but this change was not reflected i n other parameters that should have also responded i f i t were a true tl-eatment effect. The change i n yolk volume was about one-third that of LIII increase known to be related to oil exposure in 1995 tests. Larval size and maturity ;It hatch were not affected by exposure of adults. and there was no indication of an elevation of somatic chromosomal aberrations during mitosis. The rate of cell division w a s also unaffected.
Experimental exposure of Pacific herring eggs to oil during incubation ( 19951
In 1995. herring eggs were directly exposed to oil-contamlnated water for 16 d during incubation to determine ~norpholos jc~~l and zene t~c damage . and to relate this damage to survival potential. As i n the I994 adult esposures. the emphasis wi15 on the survival and viability of the resultin? larvae. We ;11so observed mo~-tality. behavior. and hatch timing. The test was repeated
Exposure ot ezg\ I O 0 1 1 ~LI I - I~ : Incubation I I K ~ L I C K ~ earl!' Ihatch. reduced hatching huccess. larval \wirnrnlng. \ u r v ~ v : ~ i . and hize. m d c a u e d e d e m a . k e l e t a l . u c ~ n ~ ~ f a c ~ a l . ;1nd finfold Llbnormalities. 'The frequency o t chron~oho~nal dxrrations was \~gnificantly elevated i n the pectoral fins o f exposed larvae. Senhitl\,itv o f ;I n ~ d e variety o f Ia~naI herring responseh I O oil were similar. and indicated siyificance ; ~ t 0.7 ppb aqueous polynuclear aromatic llydl-ocarbons o f the more h i z h l y \beathered oil. yolk-%^ cdcm;! and t i n ray tot-mation were the 111os1 sensitive Imeasures of response. and indicated sign~licance :It 0 . 2 ppb of the more hiFhly weathel-ed oil.
L x v a l survival potentla1 \\';I\ reduced by sublethal effects. For example. lar\al \wimminz. necessary for feeding and prcdamr avmdance. was cdversely affected by cxposure o f e g i s to oil. Althouzh splnal deformation appeared to be the dominant factor. edema. reduced (infold s u r f x e area. and retarded pectoral f i n development undoubtedly contributed to decreased iarval hwimrning d i l i t ! . Premature hatch m a y ;dso have contributed to reduced survival potential because swlmmlnf ability improves with maturity.
Larvae that hatched from oil-exposed eggs \yere geneticdly ciamafed. The genotoxicity endpoint used here. anaphase-telophase aberration rate. measured microscopically visible chromosome or chromatid breaks and bridfes during the later StafKS of mitosis. Consequences of the genetic damage observed in t h ~ s study cannot be predicted with certainty. but rnlght include reductions in successful cell division and zrowth. However. i t is likely that most affected individuals died due to concomitant morphological abnormalities. The question of whether observed chromosomal damage could he heritable has not been definitively answered.
Toxicity of the more h i z h l y weathered oil \vas p x t e r than could he predicted by total polynuclear ;Iromatic hydrocarbon concentration III the lehs weathered oil. huygehtinf that toxicity o f the mote persistent. heav~er ; I I - O I ~ ; I ~ I C bydrocal-bow and more substituted hornolofs W:IS sreater than that o f lighter. I K S hubhtltuted ;~ romat~c hydrocarbons. .Minimum elfective collcentratlons \vue about 9 pph po ly i~~c lea r ;troInatIc hydrocxbons tor weathe~-ed oil. hut fell to 0 . 2 ppb 10r more hlzhly weathered 0 1 1 .
Eupohureh ;IS hlloI-l ;IS 7 il causcd hign~ficant bioloycal rehponse and most I-CSpOllhKS were significant w~th in 8 d exposure. These results imply that relatively brief exposure to low concentrations of oil in Prince William Sound could have adversely affected herring e:zs \pawned i n o ~ l e d m i l s after the 'pill and may explain mol-pholoyical m d senetic abnormalities observed i n larvae in 14x9.
\\hen .Idults wet-e csposcd,just prlor t o \pawlins. Composltlon o i lhydt-ocarbons i n efgs irom xlult exposures was weighted towxd lishtrr pol\lnuclear xotnatlcs I naphtbalrnes accounted for l1lot-e than 90'3 of the :1roni:Ittcs on d a y 1 6 1 . and. of thc rctnaining heavier ;Iromatic hydro- carbons. unsubstituted homologs domlnatcd. I n cont rax c z g s cxposed directly to hydrocarbons during incubatlon contained greater percentages of l x z e r l n r compounds. Furthermore. due to o i l weathering. percentages ot large ring compounds i n directly exposed eggs increased during incubation. as did percentages o f dkylated compounds. Other btudies have shown that toxicity increases both with ring size and alkylation. including our direct egg exposures. Although direct exposure of adult herring to oil can increase their vulnerability to disease. adults have hignificant tissue mass and some hydrocarbon metabolizing capabilities. which result i n apparent protection of gametes from toxicants until they arc hpawned into the environment. Abnormal larvae i n Prince William Sound i n 1989 were not caused'by exposure of adult herring to oil.
Survev of renroductive condition o f PI-ince William Sound herring stock 19951
Pacific herring stock i n Prince William Sound were suneyed six years after the E.rwrr Vulde: oil spill t o determine reproductlve condition of the population. There were two major f o c ~ : I j ;I comparison of reproductive success between I-egions (Prince William Sound and southeast Alaska), and 2) ;I comparison of reproductive success between year classes within sites. particularly the 1989 year class (most likely impacted by the oil spill i n Prince William Sound). Mature herring from four sites i n Prince William Sound and three sites in southeast Alaska were collected i n 1995 and artificially spawned. Reproductive success of female herring was defined ;IS the production of morphologically and functionally normal larvae. Responses known to be sensitive to oil exposure were analyzed. Larvae were not inspected for genetic damage because morphological responses i n egg exposure studies met or exceeded genetic sensitivity.
Six years after the E.t-.wrl Vtrltle: oil spill. reproductive impairment was not detected in herring i n Prince William Sound. Egg fertility. hatching ~ L I C C K S S . lxval viability and hwlmming, \pinal abnormalities. and yolk-sac edema did not differ ztgnificantly between rcgions. includinz response of the 1989 year-class. Discrimination of responses between regions was not possible necause the best and worst responses were usually found i n southe,lst Alaska. Similarly. there were 110 consistent trends indicating reproductive impairment o f the 1989 year class at specific sites. Further. adult fish from all sites appeared to be healthy: weight. length. and condition I'xtor did not vary significantly among regions. Whether 01- not herring in Prince William Sound were ever reproductively impaired by the E.v.ror~ Vtrlde: oil spill is unknown. but the time lapse between the spill and our study probably precluded any detection o f reproductive impairment. Measurable effects likely declined. probably most rapidily during the first year ;IS the most adversely affected individuals died. Rerardless of the life stage and likelihood of possible oil exposure. herring we wmpled i n Prince Vjilliam Sound i n 1995 appeared to be reproductively f i t and similar to herring in southeast Alaska. Although herring stocks are still depressed i n Prince William Sound. factors other than t-eproductive impairment are probably limitin? recovery.
I n Chapter I . the l i n k q e between exposure (11 ; d d t he1-r111: to 0 1 1 . ; I C ~ U I ~ I L I ~ ~ [ I O I I o f lhylrocarbons 111 IIssue. Induction o t 1111xed functlon oxldase enzymes. immune response. opportun~st~c disease. and Inortaiity is explored. Pre-\p;~\vn herring \vere n e s x ~ v e l y ~mpacted by cxposure to oil. Induction of aryl hydrocxbon hydrox)lasc. suppl-ession of leukocbtes. i11c1-ease 111 viral hemorrhagic \eptlccmia v ~ r u s . and eumulcltivc mo~-tality ,111 correlated w ~ t h polvn~~clear mxnat ic hydrocarbon concentrat~on. I n contrast to pre-yawn fish. there was no r x t e l - n i evidence ot disease ill post-spawn t'sh. .~nd the!-e W;IS no evidence of dose-dependent n~o~-tal~ty.
. .
In Chapm 2 . induction o t cytochrome P-450 dependent !nixed function ~ l s ~ d a s e cnzynes b y exposure of pre- and post-spawn 11e1-ring is explored. .Activity o f x y l hydrocal-bon hydroxylase. a mixed-function oxidase enzyme. was induced i n liver tissue: induction I n post- spawn fish was two to three times that i n pre-spawn fish. Depression of inducrion levels in pre- spawn fish was probably related to the energetic cost of reproduction and the hormonal constituency of the reproductively ripe animals.
In Chapter 3. the effects of pre-spawn adult exposure i n ymetes. eggs. and l;~rvae are cornpared to those where herring eggs were exposed directly to oil during incubation. Exposure of pre-spawn adult herring t o oil caused no damage t o gmetes and little o r none i n progeny even though initial aqueous polynuclear aromatic hydrocarbon exposure concentrations extended up to 58 ppb. In sharp contrast. eggs exposed to comparably weathered oil during incubatton were significantly and adversely affected by exposure as brief a s 2 d. and at polynuclear aromatic hydrocarbon concentrations as low as 9 ppb. Differences in toxicant composition i n egs tissue may. in part. explain the radically different responses between types of exposure.
In Chapter 4. the effects of incubating herring eggs i n oll-contaminated \vater are detailed. including comparison to contamination with a more highly weathered oil. Additional tests were anduc ted to determine effective exposure duration. Exposure ;~dversely affecrcd e ~ g s and Ia~wae. For example. survival and size declined. and morphological and senetic defects i~~cre;~sed. Toxicity o f the lnore h izh ly weathered oil was Freater than could be predicted by lotal polynuclear aromatic hydrocarbon concentration i n the less weathered oil. s u z p t i n g that toxicity of the more persistent. heavier ;~ro~natic hydrocarbons and !no!-e substituted homoloys w a s yreatel- than that of lighter. less substituted aromatic hydrocal-bons. Signlticant sublethal response was observed at concentrations o f 0 2 ppb aqueous polynuclear aromatic hydrocarbons. Exposures as short as 2 d caused significant biological response. Although the consequences of the genetic damage ob\erved in this study cannot be predicted with certainty. i t is likely that most affected individuals died due to concomit;~nt morphological abnormalities.
I n Chapter 5 . !results of f ie ld surveys designed to compare the reproductive condition of Prince Willianl Sound herrin: stock i n I995 with that i n mutheat Alaska herrin: are pl-esented. Rcproductive success between year classes wlthin sites was also compared. pa~nicularly the 1989 year c l x s itnost likely impacted by the oil spill i n Prince William Sound). Reproducr~ve success

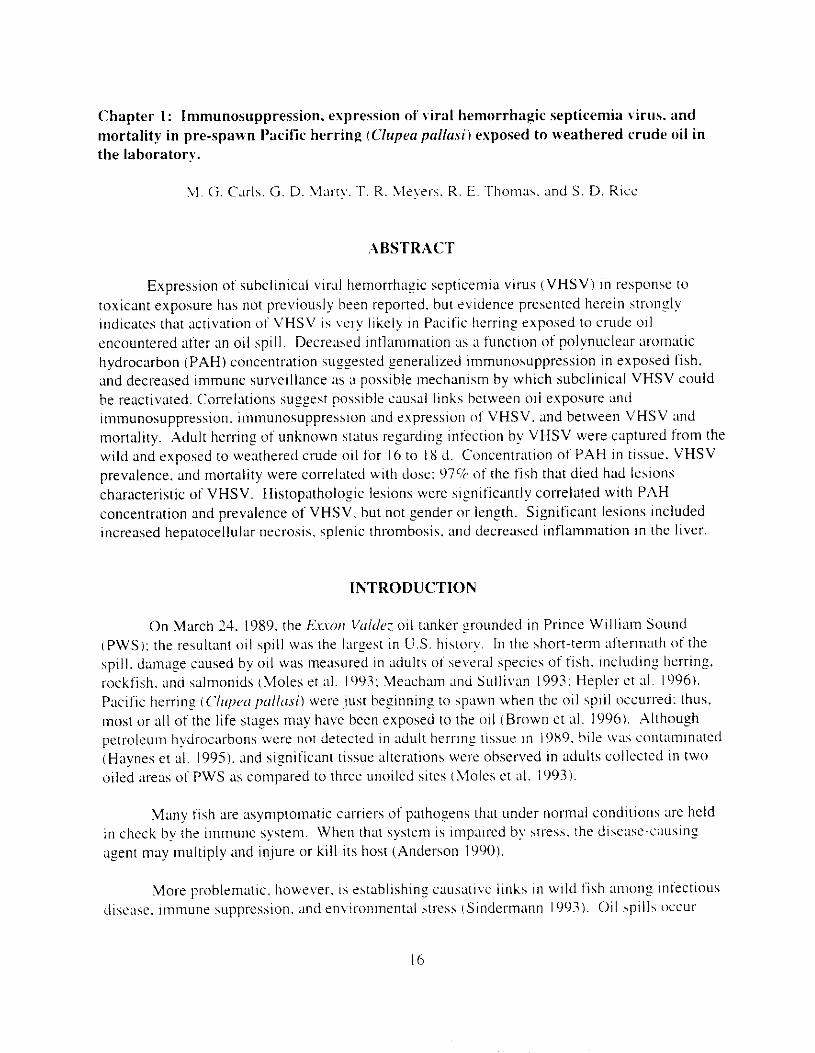
Chapter 1: Immunosuppression. expression of viral hemorrhagic septicemia biros. and mortality in pre-spawn Pacific herring ~ C l u p e a paflasi) esposed to weathered crude oil in the lahoratorv.
.ABSTRACT
Expression of subclinical viral hemorrhasic septicemia virus (VHSV) i n response to toxicant exposure has not previously been reported. but evidence presented herein stronsly indicates that activation of VHSV is very likely i n Pacific herring exposed to crude 011
encountered after an oil spill. Decreased intlammatlon :is a function o f polynuclex xomatic hydrocarbon (PAH) concentration suzgested seneralized immunosuppression in exposed fish. and decreased immune surveillance as ;I possible mechanism by which subclinical VHSV could be reactivated. Correlations sugzest poss~ble caus;Ii links between 0 1 1 exposure and Ilnrnunosuppresslon. immunosuppress~on and expression o f VHSV. and between VHSV and mortality. .Adult herring of unknown status regarding inteection by VHSV were captured from the wild and exposed to weathered crude o i l for 16 t o I 8 d. Concentration of PAH i n tissue. VHSV prevalence. and mortality were correlated with close: 97% o f the fish that died had lesions characteristic of VHSV. Histopathologic lesions were significantly correlated with PAH concentration and prevalence of VHSV. but not gender or length. Significant lesions ~ncluded increased hepatocellular necrosis. splenic thrombosis. and decreased inflammation i n the l iver.
INTRODUCTION
On March 24. 1989. the E.rvorl Vct /c / c : o i l tanker :rounded in Prince William Sound (PWSI: the resultant oil spill w ~ s the la r~es t i n U.S. history. I n the short-te~-m aftrrm:lth o f the sp~ll . d r m q e caused by 011 was measured In adults ot several species o f fish. ~ncludinf herring. I-ockfish. and salmonids (Moles et ~11. 1093: Meach;un ;Ind Sullivan 1993: Heplel- c t ;iI. 19961. Pacific herring (Clrcpcw p d l u s i ) were jtist beginning t o \ pawn when the oil s p ~ l l occul-1-ed: thus, most or a11 of the life stages may have been exposed t o the o i l (Brown et al. IO96i. ,\lthoush petroleum hydrocarbons were n o t detected i n adult herl-lng 1lssue 111 I9ti9. bile was contaminated (Haynes et 31. 1995). and sisnificant ~ I S S L I K alterations were observed in adults collected i n two oiled a~-eas of PWS as compared to three unoiled sites (.lloles et ;iI. 1993).
Many fish are asymptomatic carriers of p a t h o p s that under normal conditions are held i n check by the i~nmune system. When that system is impared by stress. the dise:ise-c:lusinf a p t may multiply and in.jure or ki l l its host (Anderson 1990).
More problematic. Ihowever. I S establishing causative links ~n w~ ld fish amons intectious disease. ~ m m u n e suppression. and envir-onment;ll stress (S inde rm~~nn 1993). Oil q i l l s occur
I6
pet-lodically i n nxmne hystems throu$hout the \vorld. , ~ n d Ilt\roparhoIo,~ "\ o f the cttecr\ ot hydrocarbon exposure o n fish has been documented I n I;horatory and field studies ( Haensly 19x1: klalins 1987: Solan$l and Overstreet 1987). Fol- example. lprevalence and intensity o f Infections with $astrointesrin;ll parasite\ \cere lower i n fix11 treated bcith crude oil it1 the laboratory (Khan and Kicenluk 19831. B y comparison. other fish had Increased number\ of hranchial Trichotlirlci after chronic exposure to oiled sediments i n [he laboratory. In Pacific herring (Cluprn p c d l ~ ~ i ~ nunlbers of 1 ; ~ ; 1 1 , A r l ; . y c k i . y , s i r t rp / c ( . i n the peritoneal cavity were lower in fish collected 14 d after the €.{-.wm Vdt/t,: oil spill. and these 1res~11ts were confirmed In Pacific herring exposed to crude oil in the laboratory (Moles et al. 1993). Chan=.es i n expression of bacterial and viral pathogens after oil exposure have not been documented.
Pacific herring sampled from oiled sites immediately after the spill had hepatic necrosis that was attributed to oil exposure (Moles et al. 1993). However. Paclfic herrinx sampled annually from the same sites from 1990 through 1992 did not have hepatic necrosis and there was no longer any evidence of hydrocarbon exposure (G. Marry, unpublished data; Kocan 1996). In PWS. in 1993. a n abundant 1988 ve;~r-class was fully [recruiting into the spawnmg population of Pacific herring. but the population collapsed. Morbidity of hel-rlng was primarily caused by Icllrh?opllorlu.s, but VHSV \vas considered a significant secondary cause (Marty et al. 1995). Of the remaining herring. 15 to 43% exhibited external ulceration or hemorrhages associated with VHSV (Meyers et al. 1994). and fish again had hepatic necrosis. In 1994. VHSV isolated from individual fish was statistically associated with hepatic necrosis (Marty et al. 1995). Meyers et 31. (1994) and Marty et al. (1995) hypothesized that a combination of environmental stressors (e&. spawning. inadequate food supply. or increased predation) resulted in activation of subclinical VHSV which resulted i n several lesions. including hepatic necrosis.
Our objective w u to search for immunosuppressive effects of crude oil in Pacific herring ;IS related to exposure. opportunistic disease infection. and mortalit). Wild-causht Pacific herring i n spawning condition were randomly separated into groups and exposed to petroleum hydrocarbons for 16 to IS d i n the laboratory. Hydrocarbon concentrations were measured i n treatment water. muscle. and ovarles. To document biochemical 1-espcnse. induction o f [nixed function oxidase tMFO) enzymes \vas observed i n livers (Thomas et : I I . 1997). Initial PAH concentrations in water (0.03 (controls) t o 58 ppb) were chosen t o Include maximum lnean PAH concentrations observed i n open water i n PWS following the spill 16.24 ppb: Short m d Harris l996j. Fish were not exposed to exoyenous VHSV durlny the experiment.
METHODS
Pre-spawn herring \vere collected near Shelter Island. southeast Alaska (5X.J'N Iat.. 134.8"W long.) by purse seine on March 20. 1994. To minimize scale loss. fish were transferred in water and not netted. Approximately 1.500 fish were maintained in a 24.000-L holding tank: seawater flow was 60 t o I30 L/min ;It 3.5 to j .2 'C and 3 I ppt. Fish were not fed duriny holding
17
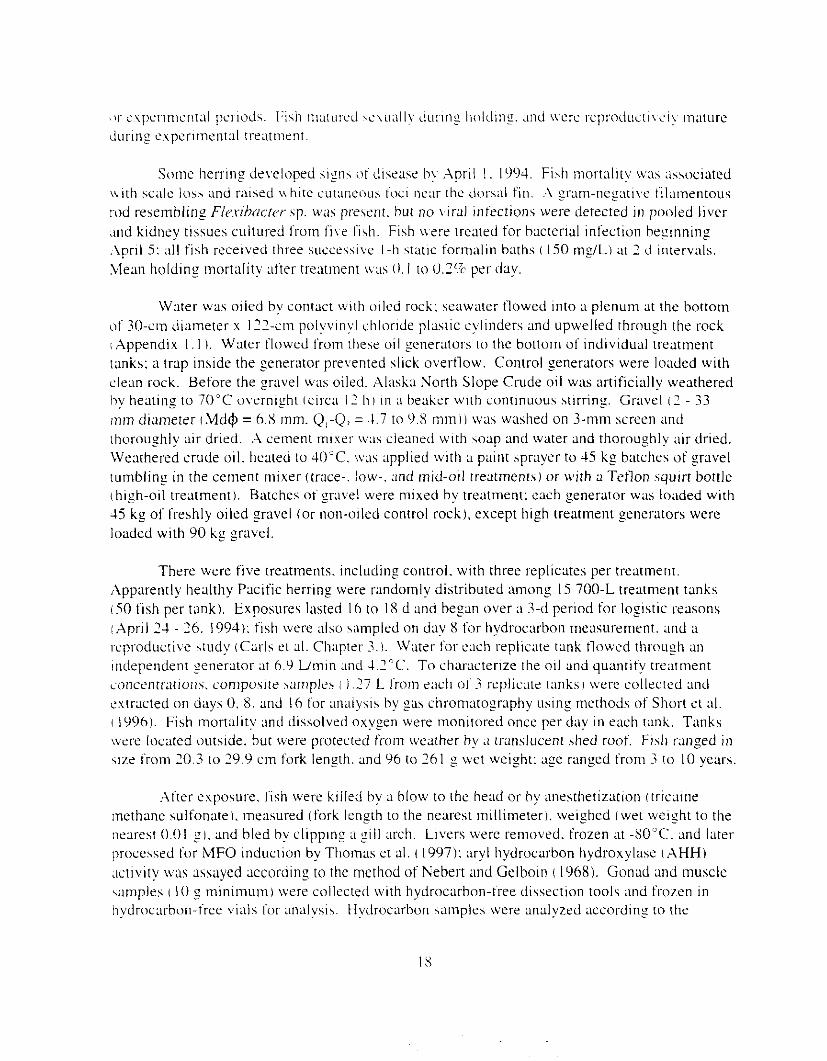
Some herrln? developed s1gn5 ot disease h! .Aprtl I . 1904. Fish nml-tnl i ty \v:lh :i\sociated w i t h sc;~Ie lo\\ and rclisrd \\bite catanenus toci (near the do-sal f i n . :\ p m - n e f a t i v c tilamentous trod resemblin,u Ncrihmfer sp. was present. but no \,iraI infections were detected i n pooled liver .~nd kidney tissues cultured from f i \e fib. Fish \\ere trcated for hacterlal infection heflnning .April 5 : d l fish received three successive 1-11 stat~c formalin baths 1 IS0 mgiLi at 2 d intervals. Mexi holding mortality after trexment W;IS 0. I to 0.2% pet-day.
Water was oiled by contact w t h o~led rock: seawater flowed into ;I plenum at the bottom o f ?O-cln diameter x I22-crn polyvinyl chloride plastic cylinders and upwelled through the rock (Appendix I . I ). Water flowed from thehe oil Zenerlltors to the bottom of individual treatment tanks: a trap inside the ,oenerator prevented slick overtlow. Control generators were loaded with clean rock. Before the gravel was oiled. .Alaska North Slope Crude o i l was artificially weathered thy heating to 70°C overn~sht (circa 12 I h I t n ;I beaker wtth conttnuous stirrin:. Gravel ( 2 - 33 rnm diameter I M d 4 = 6.S mm. Q!-Qz = 1 . 7 to iLY mmIi WLS washed on 3-mm screen and Ihoroughly air dried. . A cement t n ~ x e r W;IS cleaned with soap and water and thoroughly air dried. Weathered crude oil. heated to JO’C. \\‘;IS applied with ;I paint sprayer to 45 kg batches of gravel tumbling in the cement mixer (trace-. l o w - . and mid-oil t reatment) or with a Teflon squrrt bottle (high-oil treatment). Batches of p v e l were mixed by treatment: each generator was loaded with 4S kg of freshly oiled gavel (or non-oiled control rock). except high treatment generators were loaded with 90 kg gravel.
There were five treatments. including control. w i th three replicates per treatment. ,Apparently healthy Pacific herring were randomly distributed among 15 700-L treatment tanks i 5 0 fish per tank). Exposures lasted 16 to I8 d and b e p n over ;I 3-d period for logistic reasons (Apri l 24 - 26. 19941: fish were ;dso sampled o n day 8 for hydrocarbon measurement. and a wpl-oductive \rudy (Caris el d . Chapter - 3 . ) . Water for each replicxe tank flowed throuzh an ~ndependenr senerator at 0 . 9 L/mln and 1 . 2 ” C . To characterize the 011 and quantify treatment concentr;ttlot1s. composite samples I I .27 L fl-om each ot 3 r-cplicxe tanks) w1-e collected and sxtracted on days 0. S. and I6 for analysis by :as chromatography using methods o f Short et aI. I 1996). Fish mortality m d dissolved o x y e n were monitol-ed once per day i n each t m k . Tanks \\ere located outslde. hu t \+ere protected fr-om tveathel- by .I translucenl h e d roof. Fish r-mged in SIX from 20.3 to 29.9 c m fork length. and 96 to 261 wet weight: age ranged from 3 to I O years.
.After cxposu~-e. l.ish were killed by ;I blow to the head o r hy anesthetization (tricalne methane sulfonatel, measured (fork length to the nearest InillimeterJ. weighed (wet wetTht to the nearest 0.01 ;I. and bled by cl ipp~nf ;I fill arch. Livers were removed. frozen at 3 0 ° C . and later processed for IMFO induction by Thomas et al. ( 1997): ary l hydrocarbon hydroxylase (;\HH) activity \vas assaved according to the method of Nebert and Gelboin (19681. Gonad and tnuscle w n p l e s I I O g m i n i m u m ) were collected with hydrocarbon-free dissection tools and frozen in hydrocl~rbon-i~-ee v i a s for malysis. Hvdroc;~rhon sclmples were analyzed according to the
I S
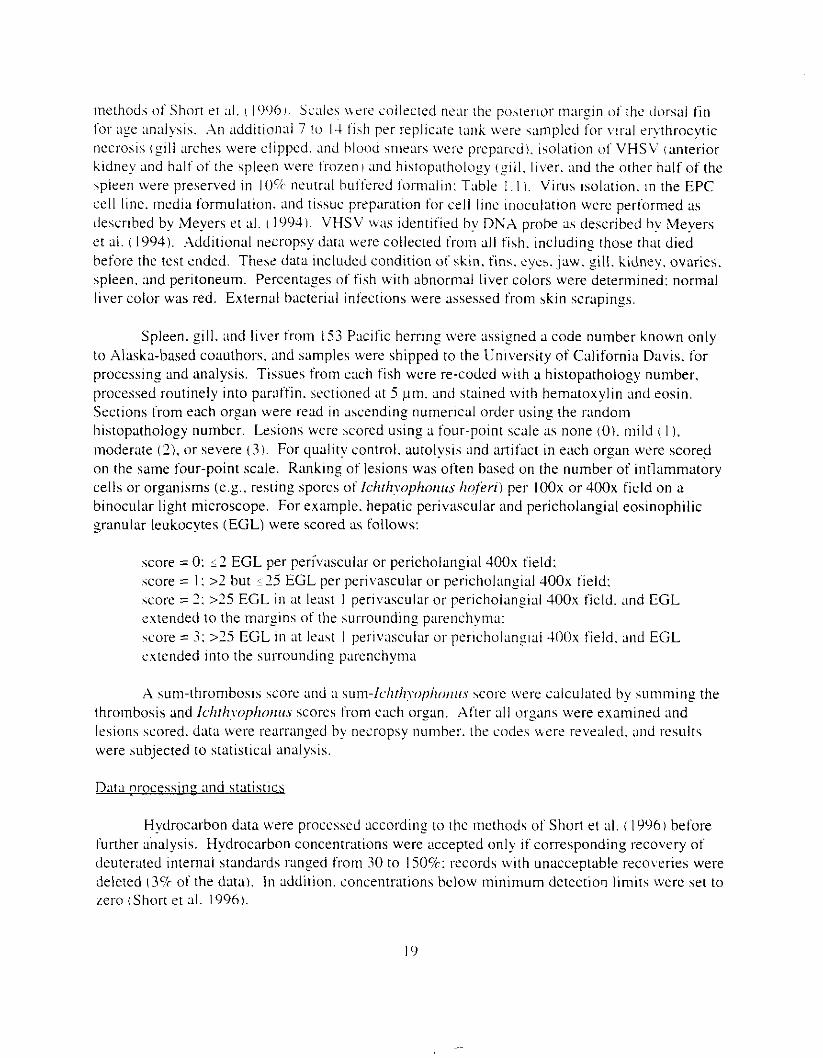
methods of Short et ;d. i l996!. Scales \\ere collected near the poter lor tnaryin o f thc clorsal tin for ;ye analys~s. An xid i t ion i 7 1 0 I 4 f i h per replicate tank were sampled for \,it-al et-ythrocytic necrosis i z i l l arches were clipped. and blood smears were prepared). iwlation of VHSV (anterior kidney and half o f [he spleen were t rozen ! m d histopatholozy cyill. liver. and the other half of the \pieen were preserved i n 10% 11eutr;11 buffered formalin: Table I , 1 1 . Virus isolation. In the EPC cell line. media formulation. and tissue preparation for cell line inoculation were performed as described by ,"eyers et ;11. I 19941. VHSV WLIS identified h v DNA probe as described thy LVeyers et ai. ( 1994). Additional necropsy data were collected from all fish. including those that died before the test ended. These data included condition of skin. fins. eyes. jaw. :ill. kidney. ovaries. spleen, and peritoneum. Percentazes of fish with abnormal liver colors were determined: normal liver color was red. External bacterial infections were assessed from >kin scrapings.
Spleen. gill. and liver from 153 Pacific herring were a s s i y e d a code number known only to Alaska-based coauthors. and samples were shipped to the University of California Davis, for processing and analysis. Tissues from each fish were re-coded with a histopatholosy number. processed routinely into paroffin. sectioned at 5 pm. and stained with hematoxylin and eosin. Sections from each organ were read i n awxnding numerlcal order using the random histopathology number. Lesions were hcored using a four-point scale as none ( 0 ) . mild I I ),
moderate (2). or severe (31. For quality control. autolysis and artifact in each organ were score? on the same four-point scale. Ranking of lesions was often based on the number of intlammatory cells or organisms (e.g., resting spores offcl~t/~~~~phornrs Irojeri) per l00x or 4OOx field on a binocular light microscope. For example. hepatic perivascular and pericholangial eosinophilic granular leukocytes (EGLI were scored as follows:
score = 0: 5 2 EGL per perivascular or pericholangial 400x field: score = I : >2 but 575 EGL per perivascular or pericholangial 4OOx field: x o r e = 2: >25 EGL i n at least I perivascular or pericholanyial 40Ox field. and EGL extended to the margins o f the surrounding par-enchyma: \core = 3: >75 EGL i n at least I perivascular or perlcholanglal 4OOx field. nnd EGL extended into the surrounding parenchyma
A sum-thrombosis \core and ;I sutn-/c/~th~o/~/lorlir.v 5co1-e were calculated by summing the thrombosis and fc1lth?.[~p/lOflll.s scores from each organ. 'After a11 organs were examined and lesions scored. data were rearranzed by necropsy number. the codes irere revealed. and rresults were ubjected to statistical analysis.
Data nrocessina and statistics
Hydrocarbon data were ~ I - O ~ K S S ~ ~ according to the methods of Short et 111. I IY96) before [urther analysis. Hydrocarbon concentrations were :!ccepted only if corresponding recovery of deuterated internal standards ronged from 30 to 150%: records with unacceptable recoveries were deleted ( 3 % of the data). I n addition. concentrations below minimum detection limits were set to ~e1-o (Short et 31. 1996).
21
RESULTS
Time (davsl
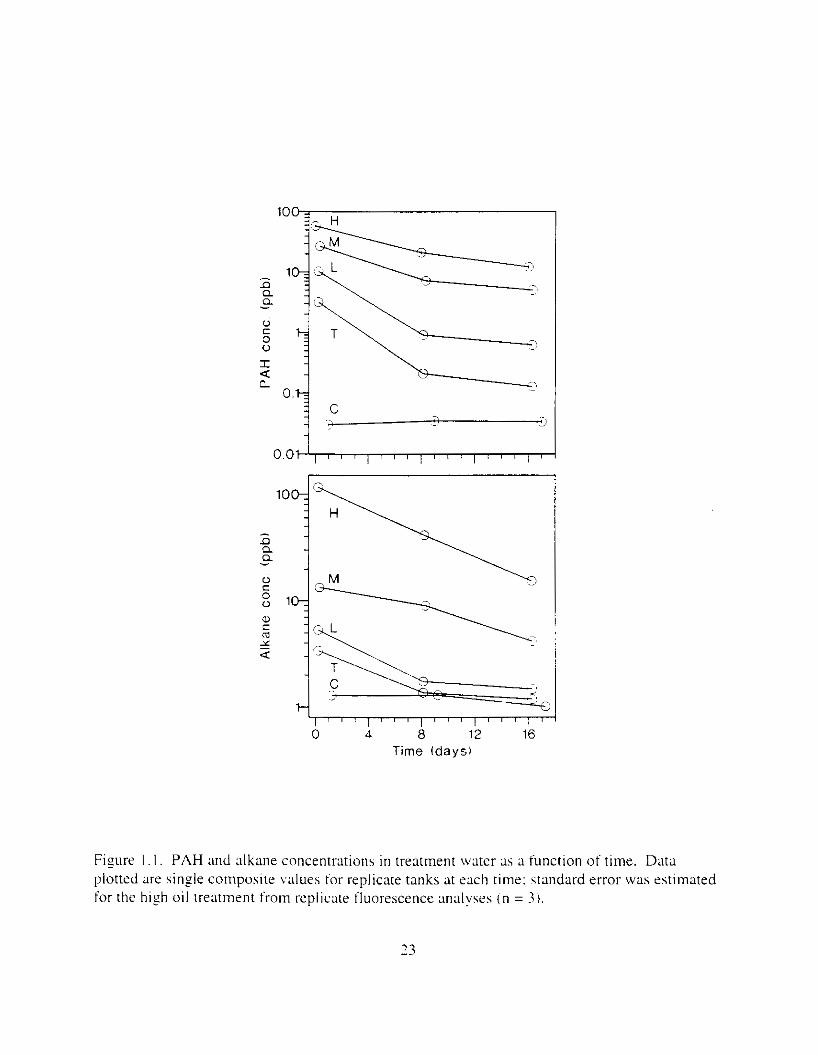
F i y r e I . I . PAH and dkane concentmtions in treatment water as a function of time. Data plotted are single composite values for replicate tanks at each time: standard error was estimated for the h i z h oil treatment from replicate fluorescence analvses ( n = 3 ) .
23
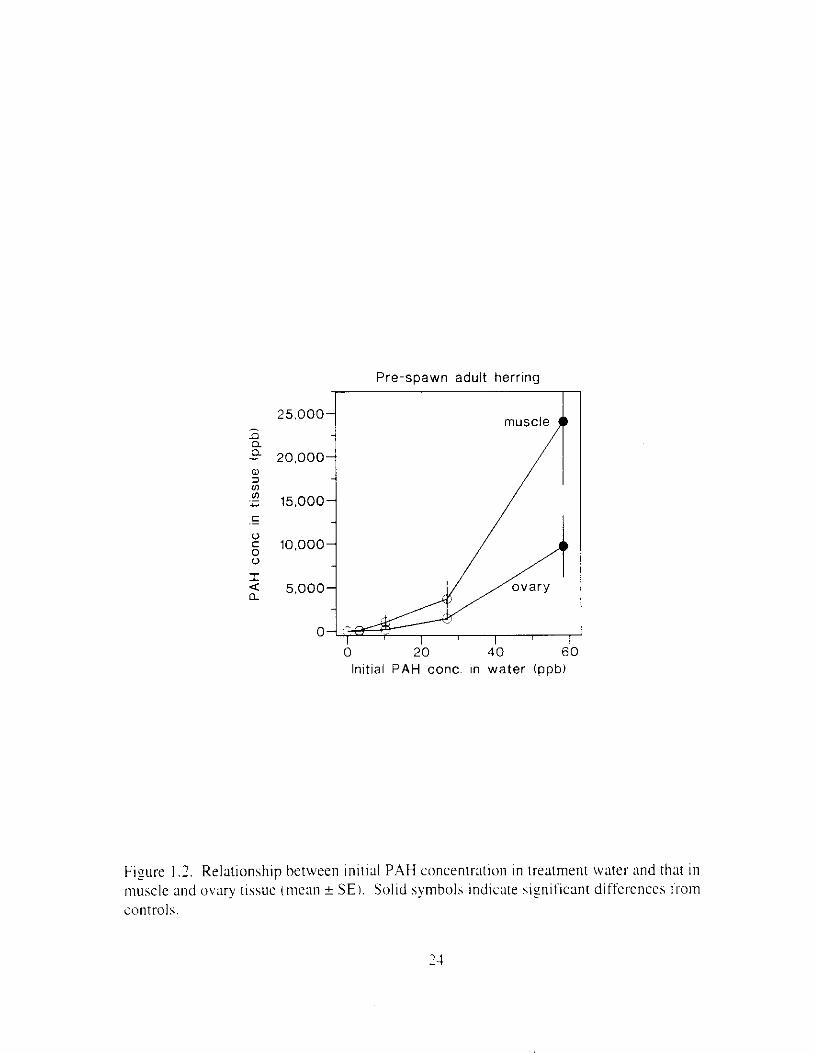
Pre-spawn adult herring
0 20 40 60 Initial PAH conc. In water (ppb)
Figure I .2. Relationship between inirial PAH concentr;ltion i n treatment water and that i n muscle and ovary tissue (mean ? S E I . Solid symbols indicate siyificant differences Irom controls.
Biolozical resoonse
.Mortality exceeded 1 0 ' 2 in only one high treatment tank durlng the first X d. hu t incl-eased i n the latter half of the experiment (Figure 1.3). Daily mortality w;is significantly related to time ( P = 0.01 I ) and treatment ( P < 0.001 ). and cumulative mortality was significantly correlated with initial PAH concentratior i j - = 0.62. P = 0.013: Table I . 2 ) . Du~ly mortality was significantly greater in the mid-oil treatment than in controls, but because mortality rates were unusually high in two of the mid-oil treatment tanks. the s~gnificance of elevated mortality in the high-oil treatment was masked i n the first round ANOVA. However. when a11 mid-oil responses were removed from the test to achieve homogeneous variance. the significance of daily mortality in the high-oil treatment was ;dso apparent. Tank-specific differences in mortality. estimated by nesting tank in treatment. were not significant ( P = 0.672). Of the fish that died. 97% had lesions characteristic of VHSV. including external m d internal hemorrhagins, f i n erosion. changes i n liver color. and gill pallor.
Gross lesions and other changes in adult herring were frequently correlated with initial PAH exposure concentration. Jaw hemorrhaging and erosion, changes in liver color. and hemorrhaging of integument. peritoneum. and gonad were significantly and positively correlated with initial PAH concentration (0.64 < r s 0.80, 0.001 5 P,,, 5 0.010: Figure I ,4), Trends in fin erosion and gill pallor were similar. but not significant (PreU = 0.088 and 0.068, respectively). Prevalence of jaw lesions and non-normal liver color was significantly elevated in mid- and high- oil treatments ( P , N I , V , < 0.001: Figure I .4). In contrast. enlargement of the spleen. and hemorrhaging of eye and kidney did not vary as a functlon of oil treatment (0.375 5 P,,, : 0.672). Correlation of gross lesions. or lack thereof. to prevalence of VHSV was similar to that of PAH.
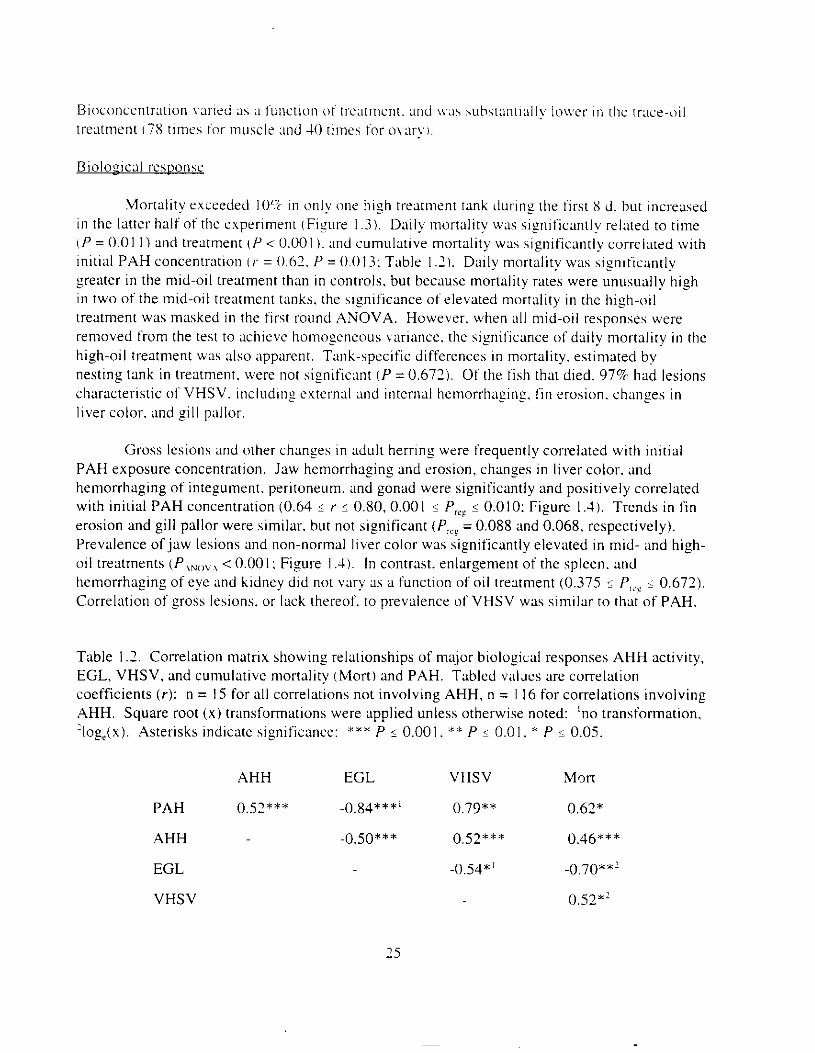
Table 1.2. Correlation matrix showing relationships of major biological responses AHH activity, EGL, VHSV. and cumulative mortality (Mort) and PAH. Tabled w l x s are correlation coefficients ( r ) : n = 15 for all correlations not involving AHH. n = I16 for correlations involving AHH. Square root ( x ) transformations were applied unless otherwise noted: 'no transformation. 'log,(x). Asterisks indicate significance: 'I** P 5 0,001. * * P < 0.01. * P c 0.05.
AHH EGL VHSV MOIT
PAH 0.52*** -0.84***' 0.79** 0.62*
AHH -0.50*** 0.52*** 0.46***
EGL -0.54*' -0.70**:
VHSV 0.52"
7 5
M
x
m ... H .- - - 25 z E r$! 20 - - ... m 2 15 E 3 L
10 C
T 5
0 I
I I I I I ' 0 4 a 12 16
Time (days)
Figure 1 3 . Cumulatl\'e mortality inlean 2 SE) in Pacific hrrr inz exposrd to weathered crude oil. Treatments were control (C) . irate IT'). low ( L ) . mid 1 . 1 1 ) . and high ( H i .
26
40 Jaw hemorrhaging and erosion Hemorrhaging of integument
1
-;/ - - -
*o.#
a 1 a, a, 2 C .
P = 0.006 .
2 1 1 - r r P ' 0.001
C a,
a, a - - -
10- - 0 - -
0 1 I I I I I I I 30
- P ' 0.001 - P - 0.088 - Abnormal liver color - Fin erosion
-
10- - -
- - -
0 1 -
I l l I " ' I I I e
I -
Hemorrhaging of peritoneum Hemorrhaging of gonad P = 0.010 P - 0.009 r = 0.64 r = 0.65 i
I ll
lnltial PAH conc. (ppb) Initial PAH conc. (ppb)
Figure I .1. Gross lesions (mean * SE) i n Pacific herring that significantly correlated with initial PAH concentration. Percentages were regressed against PAH or JPAH: P is probability of significant slope. and r i s correlation coefficient. Solid symbols indicate significant differences from controls determined by ANOVA.
Adult herring
r = -0.84 P ' 0.001
l 0 O j r = 0.78 1
2'ool .- m c c 75
r = 0.56 P = 0.029
0 20 4 0 60 Initial PAH conc. (ppb)
Figure I .5. Relationship o f EGL. VHSV. and cumulative mortality to initial PAW concentration Percentages were regressed against PAH or J P A H : P is probabilit!) of significant slope. and /- is correlation coefficient. Plotted data are means SE: solid symbols indicate significant differences from controls
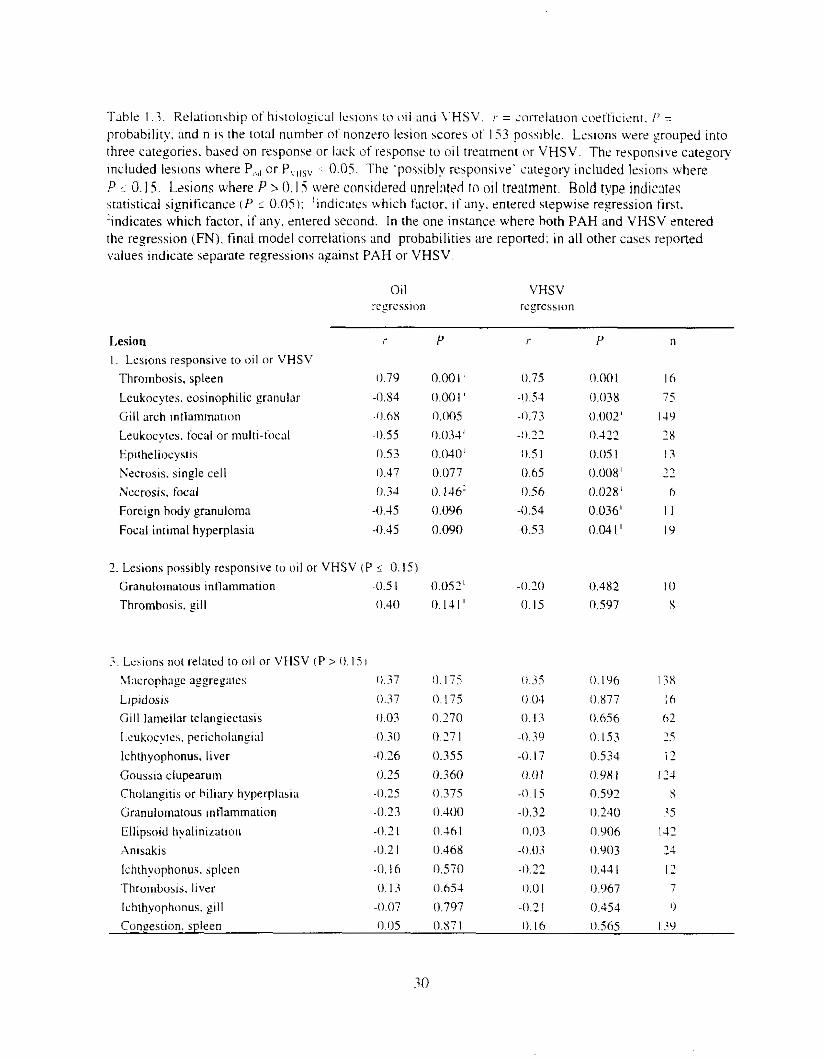
Table I..:. Kelationship of lhlstolo~lcal I e v o n s t o (III and \.HSV. r = iorrelatlon i .oe i i ic lm. I' = probability m d n I S the total number of nonzero lesion scores 11t I53 posslble. Leslons were grouped into three categories, based on response or lack of response t o oil treatment o r VHSV. The responsive category included Ieslons where P,,,, or P,Ilsv ~ 0.05. The 'possibly responsive' category included lesions where P 5 0. IS. Lesions where P 1 0. I S were considered unrelated to oil tremnent. Bold type indic:lteq mtis t ica l significance ( P i 0.051: 'indicate5 which factor. If any. entered stepwise regression first. 'indicates which factor, if any. entered second. In the one instance where both PAH and VHSV entered the regression (FN). tinal model correlations and probabilities are reported: in all other cases reponed \flaIues indicate separdte regressions against PAH or VHSV.
Oil VHSV Irrfresslon wgrcsslon
Lesion I . Lesions responsive to o i l or VHSV
Thrombosis. spleen Leukocytes. eosinophilic granular Gill arch intlammaum Leukocytes. focal or mulli-local Epttheliocystis Necrosis. single cell Necrosis. focal Foreign body granuloma Focal intimal hyperplasia
r
11.79 -0.x4 -0.68 J1.55 0.53 0.47 0.34 -0.45 -0.45
2 . Lesions possibly responslve t o o 1 1 or VHSV ( P I 0.15) Granulomalous lntlammatlon Thrombosis. pill
-2. L o l o n s not related to 011 or VHSV iP > 11. I 5 I \lncrophage aggregates 11.37
Llprdosls 11.37 Gill lamellar telangiectasis 11.03
Leukocytes. pericholangial ~ 0 . 3 0 Ichthyophonus. liver -0.26 Goursia clupearum 11.25 Cholangitis or hiliary hyperpiasla -0.25 Granulomatous d a m m a t i o n -11.23 Ellipsoid hyaliniratlon -11.2 I .Anisakis -11.2 I Ichthyophonus. spleen -11. I6 .Thrombosis, liver 0 . I 3
Ichthynphonus. gill ~0 .07
P
0.00 I ll.011 I ' O.IK)5 0.034' 0.030'
0.077 0 . 146'
0.096 0.090
0.052' Il.III'
11. I75 0. I75 (1.270 11.27 I 0.355 0.360 0.375 0.400
0.161 11.468
0.570 0.654 0.797
r
0.75 -0.s3 -0.73 -0.22 0 .5 I 11.65
lI.Sh -0.54 -0.53
-0.20 0.15
11.35 11.04
0 . I 3
-11.39 -0.17 0 . 0 I
-11. li -11.32 0.03
-0.03 - I I . ? ? 0.0 I
-0.2 I
P
0.00 I 0.038 0.002' 0.422 0.05 I ll.008~ 0.028' 0.036' 11.04 1 '
11.482 11.597
O.lYh
0.x77 11.656 0.15.1 0.534 0.9x I 0.592 11.240 11.906 ll.903
0.44I 0.967 0.454
Conpestion. spleen ll.ll5 O.87 I I ) . I6 11.565 . . .
:o
0
GAI r = -0.68
P = 0.005 0
100 FPL 1 r = -0.55
r - 0.69 P = 0.005
c
EPC r = 0.54 P - 0.039
- \_
30 3 , > 0
0 ~~
- - - 3 1 I I I I 0 20 40 6 0
PAH conc. (ppb)
j -1 30 " 9
I 1 I
a 20 40 PAH conc. (ppb)
60
Figure I .6. Histopatholoyical responses that correlated siznificantly with initial PAH concentration. Also reported are probability of significant slope cP). and correlation coefficient ( r ) .
31
~
I
Gill arch inflammatlon c
o c 3 I I I I I
Focal necrosis r = 0.57 P = 0.028
- 30
1
Focal intimal hyperplasia r = -0.61
P = 0.016
i
Foreign body granuloma r = -0.54 P = 0.037
10 C
00 0
0 10 2 0 30 40 Percent VHSV
Figure I .7. HistoloFical lesions that correlated significantly with prevalence of VHSV. Also Ireported are probability of s iy i f icant slope (PI . and correlation coefficient (VI.
.- 7 7
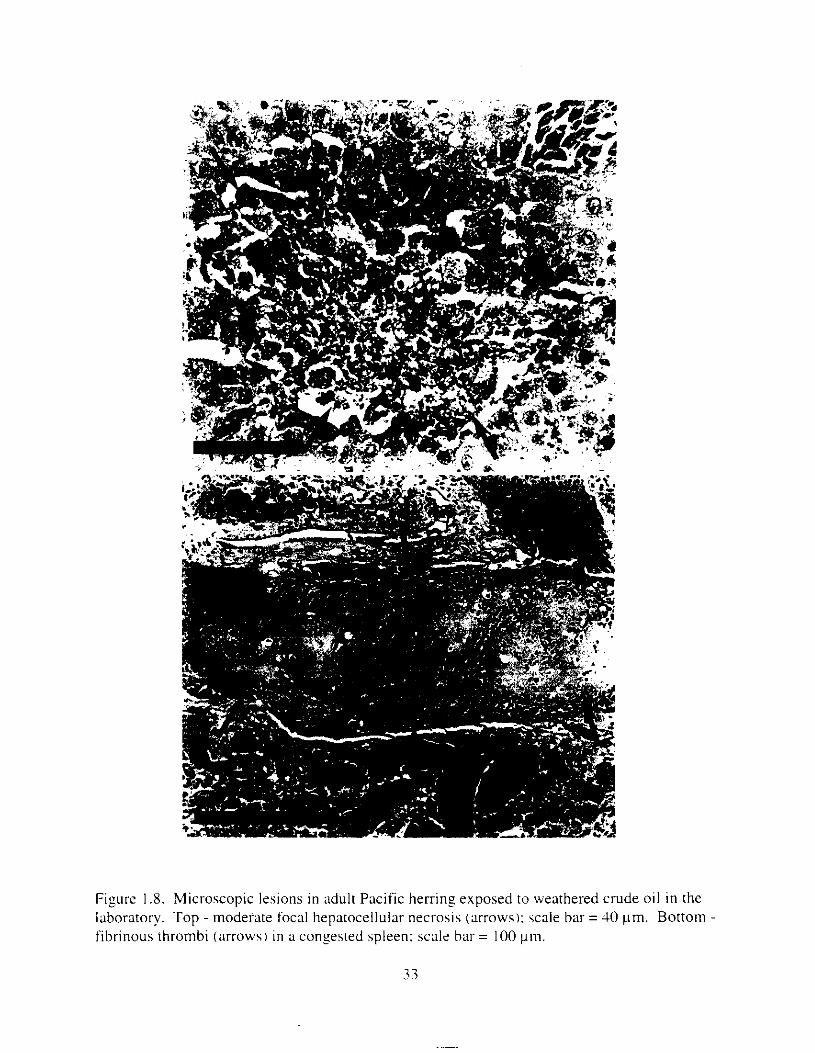
Figure I .8. Microscopic lesions i n adult Pacific herring exposed to weathered crude oil in the laboratory. Top - moderate focal hepatocellular necrosis (arrows): scale bar = 40 pm. Bottom fibrinous thrombi (arrows) i n a consested spleen: scale bar = 100 ptn.
33
.Abundance u t t ~ \ s u e le~~kac!:e~ \\a, kpre \ sed a\ 0 1 1 :~-c;~tnient ~ncre:l\cd. The number o f EGL declined LIS P.4H conccntr:ltion 111c1-ead ir’ = -.O.S4. P < 0 . 0 0 1 ) iuld with increu\ctl VHSV pre\alence ~r = -0.54. P = 0.0381: EGL \vert \ iy i f icmt ly drpl-eswi in mid- and hi$-oil treatments I Figure I .5 I . Prevalence o t EGL W;IS dso negatively correlared wirh AHH x t i v l t y o‘ = -0.50. P < 0.001 1 reported i n ;I compan~on ~ ~ d v (Thomas et ai. I997l. Focal or ~nultifocal parenchvlnal leukocytes were also Inversely correlated with PAH concentration ( r ’ = -0.55. P = 0.031). but not Lvith VHSV I!- = -1).22, P = 0.422) (Table I .:J. I n contrast. pericholangial leukocytes did not correlate with either P.4H i t - = -0.30. P = 0.271 %) or VHSV i f - = - 0 . 3 0 ,
P = 0.153). although trends were similar to those of other leukocytes (Table I .3 ) .
The pauc~ty o t intlxnmarory cells 111 Pacltic herrin? exposed to the highest dohe o f oil \vas particularly obvious. Among the f ivs treatment groups. organs fl-om fish exposed t o the highest dose o f oil had significantly lower mean scores for several inflammatory lesions: I )
hepatic perlvascular or pericholangial EGL: 2 ) gill arch intla~nmation or hematopoiesis: 3) focal or multifocal hepatic parenchymal leukocytes: and 4 ) granulomatous inflammation in the spleen iTahle I . 1 ) , For example. 2 I of 3 I livers trom control fish had pericholangial or perivascular EGL. whereas only 5 of 30 livers from the h~gh-dose group had EGL. EGL were nearly always scored as none or mtld: the two moderate cases \\‘ere in the control and lowest-dose groups. Mean scores for other intlarnlnatory leslons were lower i n the high-dose fish. but trends were not significant: I ) /chth?opho,~fr.s in the spleen and liver; 2 ) cholangitis or biliary hyperplasia: and 3) intrahepatic pericholangial leukocytes.
Lesions caused by parasites were not related to oil exposure or VHSV. Among 153 fish examined in this study. overall prevalences of various parasites were as follows: Ichrhvophonus i1oti.r; ( I I70), branchial E/~irhr/ioc,\sri.s iX.6%%). hepatic Golrssicf c/[lpcwr[tr?l ( X 170). and hepatic Anisakidae I 16%).
DISCUSSION
We have shown that exposu~-e ot wild Paclfic herring t o env~ronmentally relevant concentrations of crude oil resulted i n depression of immune funct~on and expression of VHSV. Histolosical lesions in these fish could ha\e resulted either directly trom the presence of hydrocarbons in tissues. o r secondarily to VHSV. Conccntrations of axenic hydrocarbons werc elevated in tissues of fish cxposed to o i l . and MFO enzymes were induced (Thomas et 111. 1997). Thus. it is possible that organ. tissue. or cellular damage was caused directly by hydrocarbons (concentrations o f PAH i n tissues exceeded those in water by more than two orders of ~naznitude). More likely, however. certain histological lesions were caused by expression of VHSV. which proliferated when immune tunction was suppressed by oil-induced stress. Alternatively. the lesions may have been caused by a combination of oil exposure and VHSV expression.
34
Although effects due to oil and VHSV effects were not definitively separable i n o u r \tudy. we suggest that gross and histological lesions prewously ;lttrlbuted holely to o i l exposure i n Pacific herring captured from PWS i n I989 (Moles et 31. 1993) may have been c;~used by expression of VHSV. induced by oil exposure. This suggestion is turther supported by occurrance of similar lesions i n VHSV-positive Pacific herring sampled from PWS in 1993 and 1994. when hydrocarbon exposure was no longer detectable (Meyers et XI. 1994: .Warty et ai. 1995).
In summary. correlatlons between oil exposure. Induction of AHH. suppression of leukocytes. prevalence of VHSV. and cumulative mortality were htrong, suggesting possible causal links between oil exposure and immunosuppression. immunosuppression and expression of VHSV. and between VHSV and mortality in Pacific herring exposed to oil. Results of this sludy do not prove causality, but they do show that stress caused by hydrocarbon exposure, and resultant immune response. disease, and mortality are closely related.
CONCLUSIONS
Herring accumulated hydrocarbons from oil-contaminated water: muscle tissue accumulated more PAH than ovarian tissue. Accurate estimation o f hiomagnification was difficult because of declines i n treatment concentrations. h u t biomaznification i n upper oil treatments apparently exceeded two ordel-s of magnitude.
Decreased inflarnmation as PAH concentration increased wsgested fenerdized immunosuppression in exposed fish. and decreased immune sui-velllance as a possible mechanism by which subclinical VHSV could he reactivated.
Gross pathological lesions cor[-elated with PAH concentration and prevalence of VHSV.
Prevalence 0 1 VHSV increased w i t h PAH concenmtlon. and \vas negatively correlated with EGL.
Histopathological lesions correlated with PAH concentration and VHSV. hut not with sender or length. Siznificanr microscopic lesions included increased hepatocellular necl-osis. disseminated vascular thrombosis. and decreased inflammation as determined by EGL.
37
IVe thank Lo!-i Ewin:. Dan FI-emgen. D ~ v e Lovc. Josie L u n a l n . Anita Martln. ;lnd Bob Stone for technical assistance. Carrita Morris for data entry. and Scott McAllister for collection o f herrinz. We thank Larry Holland. Marie Larsen. and stall lor the excellent quality hydrocarbon analyses. We thank Jeff Short for the original design of the toxicant delivery \vstenl. We thank Neil Willits for \tatistical analvsis and Wendy Widmann for historechnology. The research described i n this paper W;IS supported by the E~Y.YO~I b"dde: Oil Spill TI-ustee Council. However. the findings m d concluhions presented by the authors are theil- own. m d do ]not necessarily retlect the view o r posltion o f the Trustee Council.
I,ITER,\TURE CITED
.Amlacher E.. J . (.;de. C. Rudolph. mtl G. Erns[. 1980. Dit-ect elect[-on microxopical visualization of the presumptive virus of viral haemorrhqic septicaemia (VHSi 111 the rainbow trout . % t h o qoirheri Richardson and additlonal Ilisropatholo~ical and haematologlcal observations. J . F i h . Dis. .::S5-62.
.Anderson. D.P. 1990. Immunological indicators: effects ofenviI-onrrlental stress on Immune protection and disease outbreaks. Pp. .3X-50 if8 M S . ,Ad;mis led.]. Biological indicators of stress in fish. American Fisheries Society Symposium X. .American Fisheries Society. Bethesda. IMaryland.
Brown. E.D.. B.L. Norcross. and J.W. Short. 1996. A n intt-oduction to studies on the effects of the E.umrz V d k oil spill on e x l y l i fe history stages of Pacific herring. Cllrperr p c d l m i . i n Prince William Sound. Alaska. Can. J. Fish. Aquat. Sci. 53:2337-2342.
Bullock. G.L.. and H M . Stuckey. 1975. .Arrornorltr.s .xdmorzicic/rI: detection of asymptomatically infected trout. P r o p s s i v e Fish Cuiturist 37(4):237-239.
Carls. .M.G., D.M. Fremgen. J.E. Hose. D. Love. and R.E. Thomns. Chapter 3. The impact o f exposure of adult pre-spawn hel-ring (Chperr p l l t r s i ) to oil on subsequent progeny compared to that of direct exposure of eggs to oil during incubation.
Carlson. H.R. 1980. Seasonal distribution and environment of Pacific herring near Auke Bay, Lynn Canal. southeastern Alaska. Trans. Am. Fish. Soc. 109:71-78.
Eurell. J.A.C.. and W.E. Haensly. I98 I . The effects of esposure to water soluble fractions of crude o i l on selected histochemical parametel-s of the liver of the Atlantic croakel-. .Mic.ro/>o,qurl r r r d r t l t r r r r . s . L. J . Fish. Dis. 4: I X7- 194.
Hxns ly . W.E.. J.,M. Neff. J.R. Sharp. A.C. .Morris. M.F. Bedgood. and P.D. Boem l W 2 . Histopathology of P/ellrorlcw~,.s ploresscz L. from ~A.ber \Vrac'h and ;\her Benoit. Brittany. France: Ion$-term effects of the Ar~~oco Crldi: crude oil spill. J . Fish. Dis. 5:365-391
Hawkes. J .W. 1977. The effects of petroleum hydrocarbon exposure on the structure o f fish tissues. Pp. 115-178 i r l D.A. Wolfe [ed.], Fate and Effects o f Petroleum Hydrocarbons in ,Marine Organisms and Ecosystems. PerSamon Press. New York. 47R p.
H a y e s . E.. T. Rutecki. M. .Llut-phy. and D. Urban. 1995. Impacts of the E.v.rorl V c r i r l c : o i l spill o n bottomfish and shellfish in Prince William Sound. E.r.wrl Vcrlde: Oil Spill State/Federal Natural Resource Damage Assessment Final Report (FishiShellfish Study Number 18). National Oceanic and Atmospheric Administration. National Mal-ine
Ileyers. T.R.. S. Short. K. Lipson. W . S . Baits. J . R . Winton. J . Wilcock. and E. Brown. 1994. i\ssociatlon of viral hemorrhayc septicemia virus with epizootic hemorrhages of the skin i n Pacific herring Clrrperr / I ~ Y V J , ~ I I . S poliri.si from PI-ince William Sound and Kodiok Island. Alaska. USA. Dis. Aquat. Org. 19:17-37.
4 lol~s . AD.. S.D. Rice and M.S. Okihiro. 1993. Herriny paraslte and tissue alterations followins the E.~.wrr L'dde: oil spill. Pp. ?25-.328 i r r Proceedings o f t h e I993 Oil Spill Conference. American Petroleum Institute Publication No. 4580. API. Washington, D.C.
Nebert. D.W.. and H.V. Gclboin. 1068. Substrate-inducible microsomal aryl hydroxylase i n Inammalian cel l CUitLIre . I . Ashay and propcrties of Induced enzyme. 1. Biol. Chem. 2-!3:6142-6249.
SAS Institute, lnc. 1989. SASISTAT Usel-'s Guide. Version 6. 4 th Edition. Volume 2. Cary. Xorth Carolina. 846 p.
Short. J.W.. and P.M. Harris. 1996. Chemical sampling and analysis of petroleum hydrocarbons in near-surface seawater i n Prince William Sound after the E.rxon V d d e : oil spill. Pp. 17-28 i n S.D. Rice. R.B. Spies. D.A. Wolfe. and B.A. Wright [eds.]. Proceedinss of the E.\-xorI Vd&: Oil Spill Symposium. American Fisheries Society Symposium Number 18. American Fisheries Society. Bethesda. Maryland.
Shol-t. J.W.. T.J. Jackson. V.L. Larsen. a11dT.L. Wade. IW6. .Analytical methods sed for the analysis of hydrocarbons i n crude o i l . tissues. hediments. anti seawater collected for the Natural Resoul-ces Damaze Assessment of the E.\-uorr \ ' r r / r /o : oil s p ~ l l . Pp. 140- 148 in S.D. Rice. R.B. Spies. D.A. Wolfe. and B.A. Wright [eds.]. Proceedings of the Eu-orr Vdtle: Oil Spill Symposium. American Fisheries Society Symposium Number I 8. American Fisheries Society. Bethesda. Maryland.
Short. J.W.. and R.A. Heintz. In press. Identification of E~cr-uorl V d d r : oil i n sediments and tissues o f Prince William Sound and the northwestern G L I I ~ o f Alaska hased 011 P.4H weathering. Environmental Science and Technolosy.
Silkworth. J.B.. L. Antrim. and L.S. Kaminsky. 1984. Correlations between polychlorinated lhiphenyl immunotosicity. the a!-omatic hydrocarbon locus. and liver microsomal enzyme induction in C57BLI6 and DBAI? mice. Toxicology and Applied Pharmacology 75: 156- 165.
42
Winton. J .R . . and R. Kocm. Personal conmunicatlon. L.S. Fish and Wildlife. Yational Fisheries Research Centel-. Building 104 Naval Station. Seattle. WA 981 15 [Winton]: School of Fisheries. Box -355 100. L'niversity of Washington. Seattle. WA 98 195 [Kocan]
Chapter 2 : llixed t'unction oxygenase induction in pre- and post-spawn herring tC'llrpen p n l l n s i ) by petroleum hydrocarbons
R.E.Thom;l\. \ l . ( ; . C d \ . S.D. Rice. , ~ n d L. Shayun
INTRODUCTION
He~mng spawned i n Prince William Sound (PWS) ;I few weeks alter the 1989 E~rrotl
V d d e : 011 spill. Contamination i n the hound was so severe that all stages i n the life cycle of herring were potentially exposed to o i l . Direct negative effects on eggs and larvae. such as Increased abnormalities were summarized by Brown et aI. ( 1996). Even those larvae not hatched i n oiled areas were likely advected by currents to oiled parts o f the sound (Norcross et ;I]. 1996). ,Although the impacts of oil o n 1-eproductiw processes w r I e not studied i n the few yews followiny the sp~ll . concern increased ;IS the adult population declined rapidly betwKeI1 I989 and 1994. pal-ticularly i n I993 when the r p a u n ~ n g population dropped 75% to 50%. helow cxpectation (Brown et XI. IO96i. Disease appeared to be the prihm1-y cause brown c t XI. 199hi. lhut indirect links to o i l trom the \pill are wspected.
.Althou!jl mature herrlnf ;we h;lr\e\ted conlme~-c~ally i n PWS. stock htructu1-c. winter
[residence. and seasonal movements are poorly understood. consequently there w a s little damage .lssessment effort invcsted i n the adult life \tage lo l lowln~ :he sp~ll . The \~t~lne~-ahility 01 the he!-ring adults and the reproducthve process to oil w a s the subject of speculation by Rice et :11. ( 1987) followln: :I Iahoratol-v studv where high concentrations of o i l were found i n o v ; ~ r y and <ither tissues o f fish e ~ p o s e d to water soluble fractions i\VSF) of crude o i l .
In fish. as i n othel- wrtebrates. P.-\Hb are detoxified 01- actt\.xed by the cytochrome P-450 dependent .UFO system. Two o f the most htudied and w ~ ~ s i t i v e o t Ihese enzymes i n t i h are aryl hydrocarbon hydroxylase IAHH) and ethoxyresorufin 0-deethylae IEROD). Induct~un o f AHH snd EROD i n fish has been suggested as ;I useful and sensitive biomonitor of marine pollution (Payne et at. 1987: Holdwayet d . 1994: Kocan et 31. 19961,
Activation otcarcinogenlc PAH 1e.f. benzo[a]pyrene i b converted to a n x t i v e carcinogen by AHH) results i n ovarian toxlcity and oocyte destruction i n mammals mattis is on and Nishtingale 1980). A negative correlation has been shown to exist between reproducti\,e success and hepatic AHH activity i n species of flatfish (Spies and Rice 1988: Johnson et al. 1988). That exposure of adult fish to co~~taniinants can also impact the offsprlng 1s suggested by elevated .AHH activity i n the eggs o t lake trout atter rspohure o f ;Idults t o environmentc~l contaminants IBinder and Lech 1984).
The primary goal of this study was to examine the physiological vulnerability of adult pre-spawn herring to oil exposure. Specifically, we measured hydrocarbon uptake in pre- and post-spawn herring adults from similar exposures. and MFO induction in both sets of fish. MFO components measured were AHH. EROD. and cytochrome P-450. All oil exposures were tlow- through. for up to 16 d to low ppb PAH concentrations of North Slope crude oil. In companion studies. to be reported. we noted the impacts of oil exposure to :Idults on disease vulnerability and on spawnin, 0 SLICCKSS.
SIETHODS
Pt-e-\pawn herring \vue collrcred hy put-se \cine ne:~r soul11 Shelter Island. .Al;~ska 158.4'N Iat.. 134.8"W Ions.) on 20 Mal-ch 1994. Post-\pawn he~-rins were collected byjisglng i n the same general area between 6 and I3 July 1994 (approximately 40 d after natural spawnlng w a s observed in the area). P re - spaw fish W K I K gravid but not rtpe when captured. Ripeness \\as judged from percent gonad to total body weight. sonad color. and looseness of gametes. ,Approximately 1.500 pre-spawn herr~ng were placed i n ;I 24.000 L holding tank with running heawater at 60 10 I30 Limin at 3.5" t o 5.2" C and 3 I ppt. Some 01' tllese fish were artificially \pawned beginning 2 .May 1994. This spawning occurred at about the same time nat~tral spawning events i n the area were observed IA. .McGregor. Personal communic;~tion). Post-rpuwn herring were placed i n 700 L tanks with running seawater at approximately 7 Limin. 6.-5'C. and 33 ppt. .Llorphometrically the two groups were closely matched in ase. weiyht. and length. indicating that both the pre-5pa\vn and post-spawn ?roup\ were probably obtained from the same population.
Water was oiled by contact with oiled rock; seawater flowed into a plenum at the bottom of 30 cm diameter x 122 cm tall polyvinyl chloride plastic cylinders and upwelled through gravel. Water flowed from the top of these oiled-water generators to the bottom of individual 700 L treatment tanks. Control generators were charged with clean gravel. Before gravel was oiled, Alaska North Slope Crude oil was artificially weathered by heating to 70°C overnight ( I2 h ) in a beaker with continuous stirring. This process removed most of the low molecular weight monoaromatic hydrocarbons and produced a fraction more similar to that which occurs following an oil spill in the natural environment. Pea gravel ( 2 to 33 mm diameter) was washed on 3 mm screen and throughly air dried. A cement mixer was cleaned with soap and water and thoroughly air dried. Weathered crude oil, heated to 40°C. was applied to 45 kg batches of tumbling gavel in the mixer with a paint sprayer (trace. low. and mid treatments) or with a Teflon squirt bottle (high treatment). Batches of gravel were mixed by treatment to provide four concentrations of oiled water; trace, low, mid, and high-oil. Concentrations were chosen to bracket actual PAH concentrations measured in PWS during the spill (Short and Harris 1996). Each generator was charged with 45 kg of freshly oiled gravel (or non-oiled control gravel), except high treatment generators were charged with 90 kg gravel. Hydrocarbon concentrations in the treatment tanks were routinely monitored by fast-screen ultra-violet fluorescence (Krahn et ai. 1993) and treatments were characterized and quantified by gas chromatography (Short et ai. 1996). The PAH composition of the water accomodated fraction reflected the PAH concentrations in the oil, which was similar to the PAH composition in PWS measured by Short and Harris (1996).
To determine MFO induction time, pre-spawn herring were exposed to a single oil treatment (high) and compared to untreated controls. At 0.0.5, I , 2. 4, X, and 16 d, 25 fish were sampled from each treatment. To determine the effect of oil dose. 25 fish from each of three additional, concurrent treatments (trace. low, mid) were sampled at 8 and 16 d. Ripeness of pre-spawn fish was confirmed at the end of the 16 d exposures by artificial spawning. The femalemale ratio was 1.4: I . In pre-spawn tests. water flow was 6.9 Umin at 3.9" to 4.J"C (mean = 4.2"C) and 3 I ppt.
To compare MFO induction between the pre-spawn and post-spawn groups, post-spawn herring were exposed to oil in water in the same manner as the pre-spawn group except there were only two treatment groups, control and high oil concentration. Fish were exposed for 4, X , and 16 d. At each observation, 35 fish were sampled from each treatment. except controls were not sampled on day X . The fema1e:male ratio was 1 : I , In post-spawn tests. water flow was 6.4 Umin at 6.4" to 7.6"C (mean = 6 3 ° C ) and 32 ppt.
At the time of sampling, fish were killed by a blow to the head. length and weight determined, and exsanguinated by clipping a gill arch. Livers were removed, washed in cold 0.15M KCI. weighed and stored in pre-frozen 20 mi glass vials at -80°C. At least 10 g muscle tissue was taken from each fish for hydrocarbon analysis. In fish which were spawned. Inale and female gonads were also subsampled for hydrocarbon analysis: PAHs were analyzed by gas chromatography/mass spectrometry according to the method of Short et al. ( 1 996).
46
Microsomal fractions for MFO induction measurements were prepared as follows. Livers were homogenized in a Potter-Elvehjem homogenizer in 4 volumes of 0. I5M KC1 in 0. I M potassium phosphate buffer, pH 7.4. The microsomal fraction was isolated using a modification of the technique previously described (Thomas et al. 1989) and stored at -80°C until assayed. Prior to freezing, the microsomes were suspended in 0. IM potassium phosphate buffer. pH 7.4: prepared to 0. IM KCI, ImM EDTA, lmlM dithiothreitol. and 0. ImM phenanthroline. Microsomal protein concentration was determined by the method of Lowry et ai. (195 1 ) using bovine albumin standards.
AHH activity was assayed according to the method of Nebert and Gelboin (1968) and was determined for each fish in the study. In addition to AHH activity, EROD activity and cytochrome P-450 concentration were determined for all animals exposed to the high oil concentration and the corresponding controls. EROD activity was determined according to the method of Burke and Mayer ( 1 974) and cytochrome P-450 concentration according to the method of Omura and Sato ( 1964). AHH and EROD assays were run in triplicate and cytochrome P-450 assays were conducted in duplicate.
Observations were analyzed with analysis of variance (ANOVA), with treatment, time, and spawning condition as factors. When the overall test was significant, factors were compared to controls and each other with ( I priori multiple comparisons; probabilities less than or equal to 0.05 were considered significant.
RESULTS
Initial hydrocarbon concentrations were low; measured PAH concentrations in the pre- spawn tests were 0.03, 3.2, 10.3, 27.0, and 58.3 ppb for control, trace-, low-. mid-, and high-oil treatments, respectively. In post-spawn tests, initial PAH concentrations were 0.05 and 33.8 ppb for control and high-oil treatments. Composition of PAH i n treatment water was similar to that in North Slope crude oil, except monoaromatic hydrocarbons were removed by artificial weathering. This PAH composition was similar to that found in PWS shortly after the spill (Short and Harris 1996).
Hydrocarbon concentrations declined with time: PAH concentrations generally remained above baseline throughout the pre-spawn test, but dropped to near control levels within circa 8 d in the post-spawn test (Figure 2. I ). Test concentrations bracketed the maximum mean concentrations observed in the water of PWS following the spill (6.2 ppb PAH) (Short and Harris 1996). Slightly warmer temperatures in post-spawn tests than in pre-spawn tests (3°C difference) probably contributed to the more rapid decline in PAH concentrations in post-spawn tests. Composition of the doses also changed with time: naphthalenes dominated the initial concentrations, accounting for 6587%. but declined to 3 I-66% in 16 d. Conversely, the relative percentages of large compounds increased with time.
47
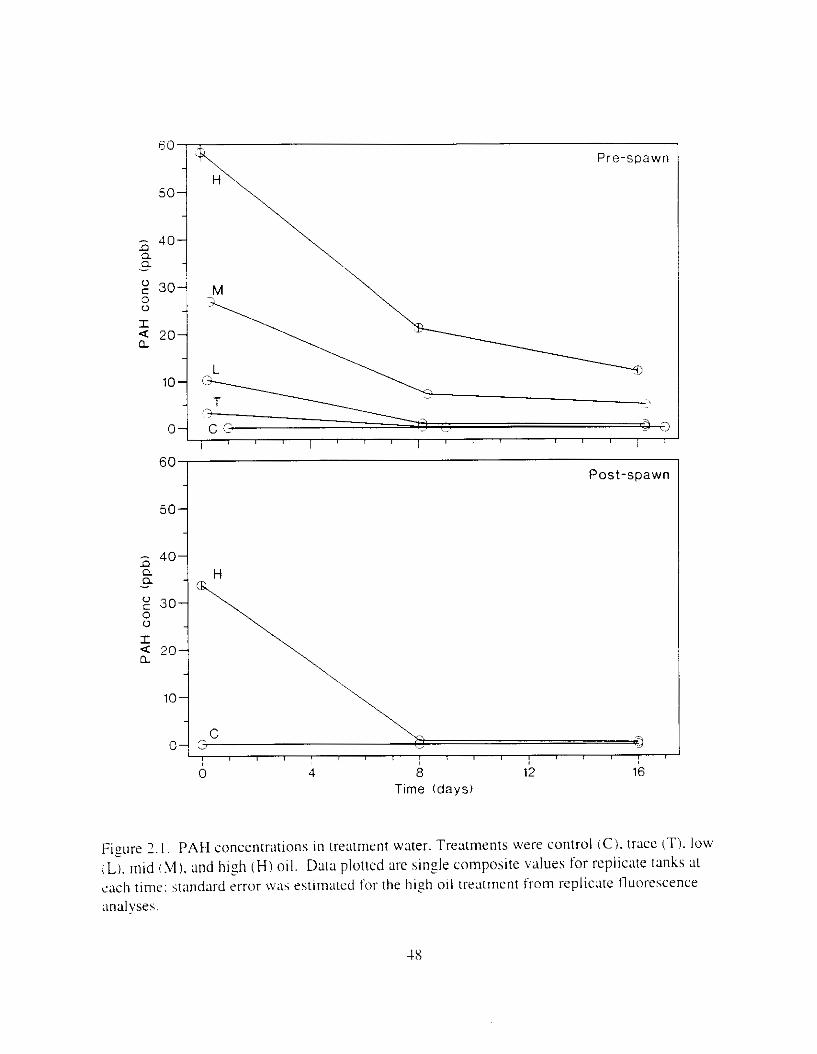
60 Pre-spawn
60 Post-spawn
1
- a 401 V 301 z a 204
10 4
H
\
- 40- n a a H - 30-
0
I V
a 20- -
10-
C 0- G
0 4 a 12 16 Time (days)
I
0 4 a 12 16 Time (days)
6t
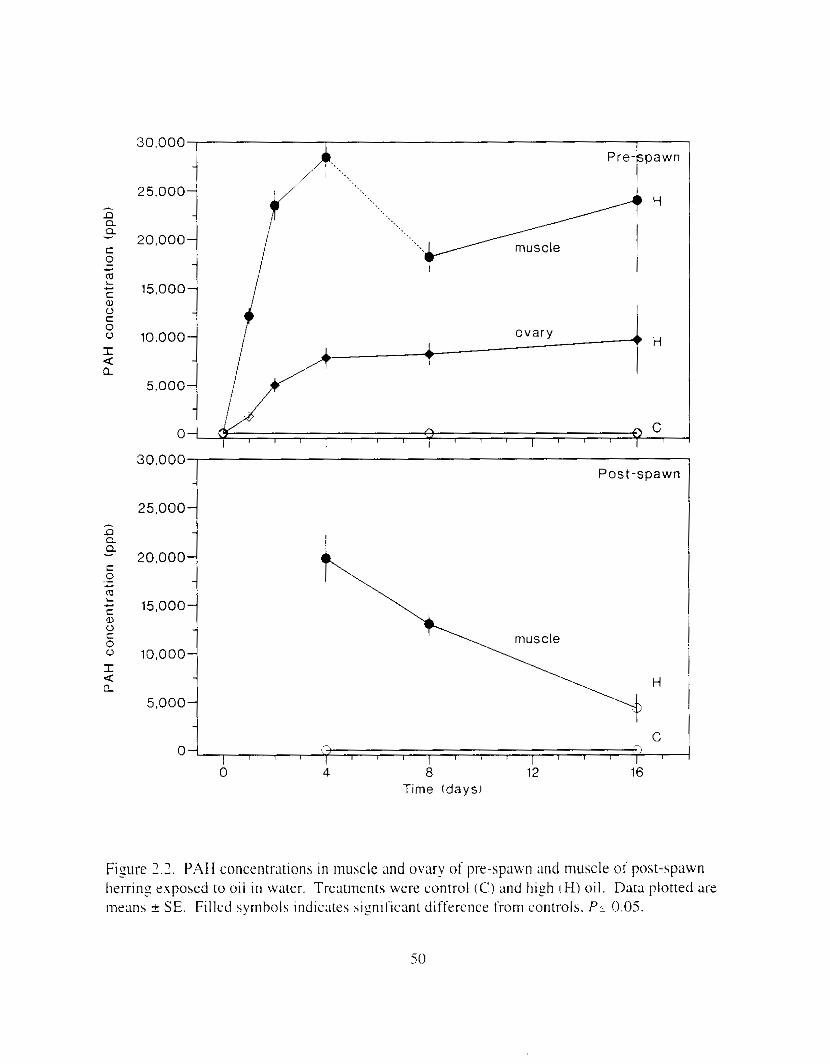
30.000 Pre- pawn
25.000- - n - a Q C 20.000- ' ' ' ' ~ ' ~ ~ ~ ~ ~ ~ ~ . ~ ,.....,,.,, -1 muscle
0 - 15,000- C
a, 0 - 0 C
I 4: a
u 10,000- ova ry 1 41 H
.
5,000- -
0- ,-. c , c I 1 I I I
30,000 Post-spawn
25.000- - n
- 20,000-
- 15.000- 2
Q Q
C 0 .- c
.
C a, 0 - 0 C
H
C 3 -
1 I I 0 4 8 12
I 16
Time (days)
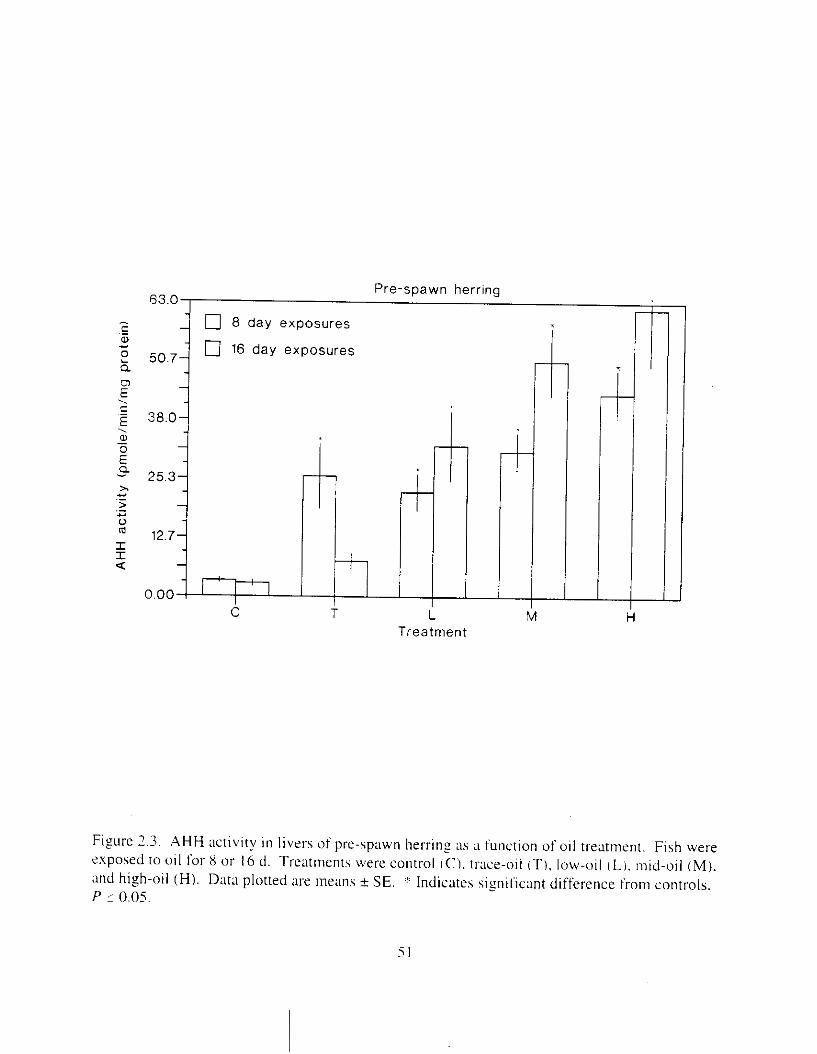
63.0 , Pre-spawn herring
- 4 0 8 d a y exposures .- C
.d a, 0 16 day exposures
C T L Treatment
t
I i I H H
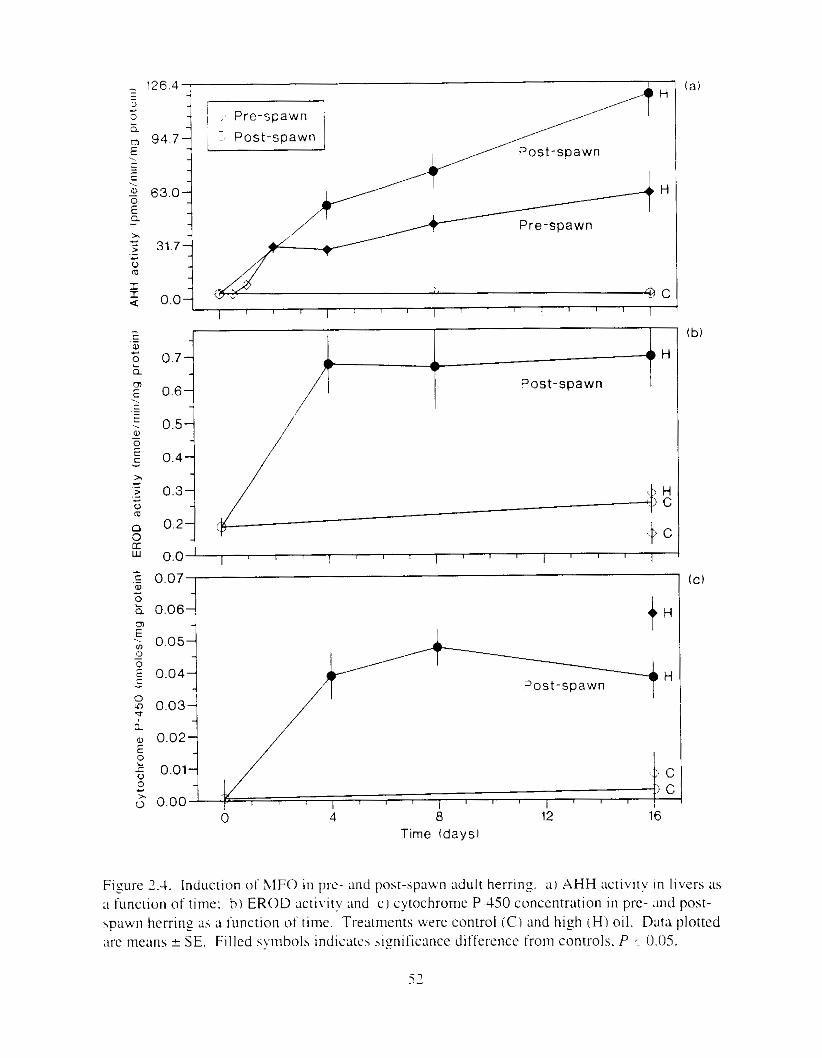
1 ; 0.05
E 0.04 H
0 0.03 P
0
0
LL
1 0.01 U 0
C C
0” 0.00 ’ n 4 8 12 16 -
Time (days)
Fizure 2.4. Induction o f &IF0 i n prc- and post-spawn adult herr~n:. a ) AHH ac t iv~ ty 111 livers ;LS :I function of time: b) EROD activity ;Ind c ) cytochrome P-150 cuncentration in pre- ;~nd post- spawn herrins ;is :I junction o f time. Treatments were control (Ci and high cH) oil. Data plotted ;Ire rncans ? SE. Filled s)mbolh indicate5 hiznificance difference from controls. P .~ 0 .05 .
5 2
I)IscussIo~
Inductlon oi AHH m c l €ROD dctivtty it1 prc-\pa\vr h e t - r ~ n ~ \\;I\ one-thlrd t o o~ne-l1alfof t h a t i n post-spawn fish despite reduced esposu~-c o f post-spawn tisin t o hvdrocarbonh. Thus. pre- rpawn tish are subject to greater tissue ;vxumulatlon ot lnydrocxbons during 011 c.sposure than post-spawn fish. beccluse diminished MFO capacity can rcsult i n tncreased bioaccumulation. The greater Iretention of PAH. ‘IS measured i n pre-spawn fish. strongly rupports dirnlnished MFO capacity. Excretion of hydt-ocarbons. ;IS monitored by bile fluorescence. has been positively correlated to level of.MFO induction (Collier anti Vuranasl 1991: Britvic’ et ;II . 1993). Failure of fish in the reproductive condition to express AHH induction at levels comparable t o non-reproductive fish has been noted i n other species as well (Ftjrlin m d Hansson 19x7: Walton et al. 1983: Collier et aI. 1986). .Although lower I K V ~ I S of induction in reproduct~vely ripe fish has not been explained. depression of induction levels probably has somethins to do with the energy cost o f reproduction and the hormonal constituency and control o f the reproductively tripe mimals. For example. treatment of t r o ~ ~ t with estradiol reduces cytochrome P-450 content and home ,MFO activities. and content ;Ind actiwty of P4501A is positively correlated with estradiol i n winter flounder (Hansson and Gurtafson 1981 : Fdrlin and Hans.wn 1987: Vodicnik and Lech 1983: Elskus 1992).
The diminished capability of pre-spawn herring to induce UFO enzymes. compared to post-spawn fish was undoubtedly caused by their diffel-ent physiological states. Estrogens. which
(Hansson and Gustafson 1981: Farlin and Hansson 1982: Vodicnik and Lech 1983: Elskus 1992). Also. pre-spawn fish were p e r a l l y not feeding and the primary metabolic demand was sonad maturation. In contrast. post-spawn fish were actively feeding and converting much of their absorbed enel-gy into somatic growth and fat reserves. I n the post-spawn fish. enzyme induction was not limited by the enersy demands o f reproduction Additionally. there was ;I
no~-m;~I seasonal temperxure difference between the two tests o f about 3°C. which likely also i!lfluenced metabolic rates. but this contribution W;IS probably minor compared to the impact of different physiolo_pical states.
- generally reach higher circulating levels i n pre-spawning fish. directly suppress P4501A
Although we generally did [not find ;I significant difference ~n AHH induction between males and females. there were apparent differences. This was most evident when pre- and post- spawn results were compared by gender: temales showed significant pre-reproductive depression of AHH activity. but males did not. These differences were likely due to gender-specific differences in hormonal constituency. and possibly lipid distribution. However. we did not Ineasure hormone and lipid content. and do not know specifically how they relate to the rrproductive cycle. Possible zender-specific differences 111 hydrocarbon accumulation might also he a factor. but onl)! female t iss~~es were analyzed i n pre->pawn tehts. Although the relationship might be different i n post-spawn fish. differences in hydrocarbon ;LccumuIation 111 were not apparent bKtWKKn hexes.
53
Oil cxposure\ 111 o u r test5 \\tt-t low. ;I I'c'iv ]parts pct- btllion. but \\et-e \utficIcnt 10 c x ~ s e bioaccumulation o f P;-\Hs a n d Induce . \IF0 enzyme\. Tcst cuncentrulons brxkcted c ~ n c e ~ n t r ; ~ t ~ o n s measured after line .pill 111 PWS (Short ;md H ; m s I T l f 1 1 . m d the PAH composition was \imilar to t l u t ohset-veri In PLVS. Over the I 6 d test period. cumposttion o t the water accommodated fraction \hiired from naphthalene dominated toward phenanthrene dominated. lnimicking weatherin: patterns observed in PWS (Short and Heintz In press^.
Bioaccumulation and retention o i PAH was greater In the pre-spawn fish w ~ t h diminished .LIFO capacity as compared to post-spawn fish. Bioaccumulatlon w x significant. and reached 500 times the water concentration ' up to 30.000 ppb i n muscle tissue). Bioaccumulation and retention were significant i n ovary tissue ;IS well. although not a s h i sh as in muscle tlssue. Composition of PAH hydrocarbons in tls\ues \vas similar to that 111 water. Accumulat~on of hydrocarbons i n earlier studies wlth pl-e-\pawn herring demonstrated similar patterns of uptake (Rice et al. 19871. althoush the accumulation of the unweathered oil (Cook Inlet crude) was significantly greater. In the previous htudy (Rice et 31. 1987). herring were exposed mostly to mono- and di-aromatic hydrocarbons: 111 o u r tests with weathered 0 1 1 . 11nono-aromatich were lnostlv absent and water-accummodated P.4Hs ranzed lrom di-aromatlcs upwards through chrysenes.
All exposure concentrations were sufficlent to induce the MFO system i n both groups of fish after at least 8 d of exposure. including the lowest PAH concentration of about 3 ppb (initial aqueous concentration). Induction of this enzyme system could have both beneficial and harmful effects. Cytochrome P-450 dependent MFOs can make hydrocarbons more polar and thus more excretable (Jimenez and Steseman 1990: Collier and Varanasi 1991: Britvic' et al. 1993). [resulting in less exposure to toxic parent hydrocarbons. However. metabolism may also result temporarily in increased toxicity of PAH metabolites (Nebert and Gelboin 1968: Wood et ai. 1976) and activation of carcinogenic aromatic hydrocarbons (Glover and Sims 1968: Grlboin 1972: Sirns et ai. 1974: 'Ahokas 1979). The MFO system may therefore compromise the health o f fishes in contaminated environments while concurrently preventin: tissue hydrocarbon xcumulation. Activation of carcinogenlc PAH compounds could \vel1 explain the ney t ive correlation between 1-eproductlve \uccess nnd AHH x t i \ t ry noted 111 t'latfish (Spies and Rice 1988: Johnson et al. 1988). Interaction of acti\';lted compounds has been shown i n \pawnin: English sole (Varanasi et 31. 19821 and is the method by which PAHs are thought to destroy oocytes and cause ovarian toxiclt! i n tn~a~nmals iAMattison et ;II . 19831. In a companion to this study however. no notable toxic effects o n eggs of oil expoxd pre-\pawn herring were noted (Carls et 21. Chapter 3).
The effect of exposure o i pre-spawn herrin: adults to weathered crude oil was probably Inore significant to mature fish than to their progeny. Eggs and larvae are vulnerable to direct exposures to oil. ;IS evidenced by observations in the laboratory (Linden 1978: Pearson et al. 1985: Curls 1987: Kocan et 21. 1987: Rice et 31. 1987: Koc;ln e t d . 19961 and field (Olnura and Sat0 1964: Brown et ; I I . 1996: Kocan et a . 19961. but there IS nelther tield nor laboratory evidence that eggs or larvae are h m e d when herriny adults are exposed to oil. In ;I companion
10 the current htudy. ~nea\urement o,tegf m d I x w l \ur \ ' t \aI . Ian ; I I abnormal~t~e\ . m d w v m ~ l other parameters for 40 d aftel- cxposu~-e o f xiult fish ind~cated that the progeny were not impacted by exposure I C a h et :d. Chapter .?I, However. interaction 0 1 act~\ated compounds ;~ t
the macromolecular level and subhequenl eit'ects showing up at much later time inter\,aIs cannot he ruled o u t . In contrast to gamete exposure as a result or exposure of pre-\pawn fish to o i l . adult herrins are apparently vulnerable t~ 011 exposure. Expohure concentrxions were below lethal levels. hu t oil exposed fish were more \~uinerable to disease ICaI.15 et :I]. Chapter I i. Disease lesions were prevalent i n the higher expohures. even though exposure concentrations were i n the ppb rmge. These results \vi11 be reported ~n a subsequent article. In PWS . the herring population collapsed. and the collapse is credited to disease (Brown et 31. 1996). While the linkage of the oil spill to disease is very speculative. part~cularly considering the time between events. the cause and effect relationship is worrisome. The relationship between oil. MFO induction. immune system depression. and disease is u n k n o u n . However. i t is clear that pre-spawning herring have diminished capacity to induce MFOs. and ;I greater potentia1 for hydrocarbon accum~~I;~t ion than post-spawn fish.
CONCLUSIONS
PAHs accumulated in muscle tissue of pre- and post-spawn herring. Pre-spawr herring accumulated higher concentrations of hydrocarbons and retained them longer.
Mixed function enzymes were induced by exposure to hydrocarbons. Induction in pre spawn fish was one third to one-half that i n post-spawn fish.
Inability of pre-spawn herrinz to induce MFOs at as high ;I level as post-spawn fish may explain higher tissue concentrations and tretention of hydrocarbons i n the pre-spawn ;~nimaIs.
.ACKSOWLEDG&IENTS
We thank Lori Ewing. Dan Fremgen. Dave Love. ;lnd Anita Martin for technical laborutory assistance. Josie Lunasin. Carrita Morris. Judy Thomas and Susan Thomas for data t-ecording and entry. and Scott McAllister ior collection of herr~ng. We thank Larry Holland. Marie Larsen. and staff for the excellent quality hydrocarbon analyses. The research described i n this paper was supported by the €.r.rou Vrdtlrr Trustee Council. However. the findings and conclusions presented by the authors ;Ire their own and d o not necessarily reflect the v ~ c w 0 1 -
position of the Trustee Council.
1.ITER.AI'URE CITED
Brown. E D.. T.T. Baker. J.E. Hose. R.M. Kocan. G.D. Marty. M.D. McGurk. B.L. Norcross. and J . W . Short. 1996. Injury to the early life h~story s t a y s o f Pacrfic herrinz i n P~-ince William Sound after the E.WN l'tritic.: oil spill. Pp. 418-467 ~ J I S.D. Rice. R.B. Sp~es . D.A. Wolle. B.A. Wright [eds.]. Proceedinp o f the E.Y.YOPJ Vtrldc~ Oil Spill Symposium. American Fisheries Societv Svrnposi~~m Number I X. Anwican Fisheries Society. Berhesda. .LIaryI;uld.
Britvic'. S.. D. Lucic ' . and B. Kurelrc. 1093. Bile fluorescence and home early hiolosical effects in fish as indicators of pollution by xenobiotlcs. Environ. Toxicol. Chern. 12:765- 773.
Burke. ,M. D.. and R.T. Mayer. 1074. Ethoxyresorufin: direct fluorimetric assay of a microsomal 0-dealkylation which is preferentially inducible by hnethylcholanthrene. Druz Metab. D I S ~ . 2:583-588.
Caris. L1.G. 1987. Effects o f dietary and water-born o i l exposure on larval Pacific herrins iCl!rprtr /~crrcv~y!r .s p t I / / c J . s i ) . Mar. Envlron. Res. 22141:25?-270.
Cuilier. T.K.. J .E . Stern. J .R. Wal lace. ;mi L'. V;u-anasi. 1086. Xcnobiotic ~ n e t a b o l ~ z t n ~ enzymes i n spawning EnFlish \o le t P ~ ~ r o p / r n ~ . s w r u i u s ~ exposed t o o r ~ a n ~ c - \ o l v r n t cstracts of ~ n a r ~ n e sediments trom cot1tarnrn;Ited and 1-eterrnce areas. C o ~ n p . Biochern Phvs~ol. SJC:291-798.
Culiicr. T.K.. and C. L'a~-an;~s~. 1 0 9 1 . Hepatic a c t ~ v ~ t i e s 0 1 ' xsnobiotic metabolizing ewymcs and biliary levels of xcnobiottcs in Enslish Sole (Ptwop/tn.s w r u i u s ] exposed to erlvtronrnental contaminants. .Arch. Environ. Contarn. Toxicol. 3l462-473.
Elskus. , L A , 1992. Polychlorinated biphenyl (PCB) effects. distributions. and cytochrome P450 ~-e:ulation in fish. Pt1.D. Disseration. Boston Lln~versity. Boston. Massachuetts.
Fiirlin. L.. .Ind T. f-lansson. 1982. Ellects o f rsrradiol-B ;~nd I1ypoph)sectotny on hepatic mixed l'ttnctio~l osysenascs 111 rainbow t r o ~ ~ t . J . Endocrinol. 95:745-252.
Fiirlin. L.. T . .Andersson. C . K O ~ V I I ~ ~ L L I I . .u~d T. HanssJn. I W 4 . I~ltluence or h ~ o l o ~ ~ c a l I'actors on hepatic steroid and xrnobiotlc metabolis~n 111 iish mvironmental intel-:lctlor wi th PCB and B-naphthofla\.one. .Mar. E n ~ ~ l - o n . Res. l4:47-5S.
Grlboin. H.V. 1972. Studies on the mechani~m uf m~crosomal hydl-oxylase induct~on and its role in urcinozen action. Rev. Can. Bioi. .31:39-60.
Glover. P.L.. and P. Sims. 1968. Enzyne-catalyzed reactions of polycyclic hydrocarbons with deoxyrlbonucleic acid and protein i n v i t r o . Biochem. J . I I O : 159- 160.
Hansson. T.. and J.A. Gustafsson. 1981. Sex differences i n the hepatic i n vitro metabolism of 4-androstene-3. I 7-dione i n rainbow trout Sdvro , y ~ ~ i r h e r i . Gen. Comp. Endocr. 44: 181-188.
Holdway. D.A.. S.E. Brennan. and J.T. .-\hokas. 1994. Use of hepatic MFO and blood enzyme hiomarkers in sand flathead I ~ / ~ I ~ ~ ( , ~ , ~ ~ / I ~ I / I ~ . ~ / x r s . s e m i . s ~ as ~ndicators of pollution ~n Port Phillip Bay. Australia. .Mar. Poll. Bul l . 28:683-695.
Jimenez. B.D.. and J.J. Stegemen. 1990. Detoxication enzymes as indicators of environmental stress on fish. Pp. 67-79 i r ~ S.h l . Adams [ed.]. Biological indicators of stress in lish. American Fisheries Society Synposium Number X . American Fisheries Society. Bethesda, Maryland.
Johnson. L.L.. E. Casillas. T.K. Collier. B.B. .McCain. and U. Varanasi. 1988. Contaminant effects on ovarian development i n English sole IPUO/J~TT.S w f d u . s ) from Puget Sound. Washington. C m J . Fish. Aquat. Sci. 45:2133-2146.
K o c m R.M.. J.E. Hose. E.D. Brown. and T.T. Baker. 1996. Pacific lhel-!-ins (Clicprit / J O / / ~ I . S ~ I
embryo sensitivity to Prudhoe Bay petroleum hydrocarbons: Laboratory ewIu;Ition and i r l
.situ exposure at o~ led and uno~led sites 111 Prince L'v'illiam Smnd. Cdn. J . Fish. .-\quat. Sci. 53:2366-2375.
K o c m R.M.. H. von Westernhagen. M L . Landolt. and G. Furstenberc. 1987. Toxicity of sea- hurface microlayer: effects of hexane ext~-act on Baltic herring (Clfrprlt h w r I y i f . s l and Atlantic cod (Glctlus r w v h l r c l ) embryos. Mar. Environ. Res. 23:291-305.
KI-ahn. M.M.. G.,M. Ylitalo. J . Buzitis. S.-L. Chan. U. Var;lnasi. T.L. Wade. T.J. Jackmn. J . M . Brooks. D.A. Wolfe. and C.A. .Manen. 1993. Comparison of high-performance liquid chromatographyifluorescence screening and gas ~hromatography/mass spectrometry analysis for ;iromatic compounds i n sediments after the E.ruorl Vdde.- oil spill. Environ. Sci. Technol. 27:699-708.
57
6 s
OTHER REFERENCES
McGregor. A. Personal communication. Alaska Departrnrnt o f Fish and Game. CFMD. P.O. Box 240020. Douglus. AK 99821-0020.

Chapter 3: The impact ot exposure of adult pre-spa\! n herring (Clupea paflasi) t o oil on progeny compared to that of direct exposure of eggs to oil during incubation
.ABSTRACT
Reproductively ripe Pac~fic herrin: were exposed to wate~- contaminated with weathered crude oil to determine if exposure could cause morphological and genetic effects i n pI-ogeny. Herring were exposed to 011 concentrations i n the range encountered in open water of Prince William Sound (PWS) followin? the E.rio,~ Voidr: oil spill ( 6 ppb) and beyond (initial polynuclear aromatic hydrocarbon I PAHi concentr;Ltions ranged up to 58 ppbi. Hydrocarbons accumulated in ovarian tissue. and similar concentrations were observed i n newly spawned eggs. There were. with one possible exception. 110 discernible effects in progeny. The exception. an increase i n yolk volume. \vas n o t retlected i n other parameters that should have also 1-eqonded if there were ;I true treatment eflecr. and the change In volume was about one-third of a11 Increase known to be related to oil exposure. In sharp contrast to the lack of response observed i n offspring as a result of adult exposure. direct exposure of herring eggs to oil during incubation was detrimental to developing embryos at low concentrations (9 ppbi. Many of the parameters observed in this study were sensitive measures of response in direct exposure tests. including egg death. hatch timing, larval death. spinal defects. yolk-sac edema. larval swimming, larval length. stage of larval development at hatch. and chromosomal abnormalities. Differences in tosicant composition in egg tissue may, i n part. cxplain the radically different responses between types of exposure. Hydrocarbon accumulation was srronsly biased toward naphthalenes in eggs from exposed adults. but greater percentages o f larger ring compounds and alkyl-substituted h o m o l o p were present in directly exposed eggs. Mechanlsms leading to the abnormal herring I m w in PWS i n 1989: therefore. were probably due IO exposure of eggs durin? incubation ( 0 1 - possibly exnosure of larvae to oil 1. and not ;I consequence of adult herring encountering oil. OUI- results do not exclude the possibility of longer-term damage to progeny o f conramlnated ~ ~ d u l t s . hut hypothetical mechanisms lor delayed effects are difficult to devise. Genetic &ma, "e W ; ~ S not detccted in .som;lric t~.s.sue of progeny. hence we predict i t \vas unlikely in reproductive tissues.
INTRODUCTION
Pacific herrin? typically rnl?r~te trorn offshore Ireding :~~uunds to nearshorr areas prior t o spawning: the E.rxor~ Vtdcfr:, o i l spill in PWS occurred just prior to this misration (Brown et ai. 1996). Thus. most or a l l of the l ire stages of herring in PWS may Ihave been ~ x p ~ s e d t o oil after the 1989 spill. .About halt' the spawned biomass was exposed to 011 (Brown et al. 1996). and elevated levels o f abnormalities and chromosome breakage were observed in newly hatched I;~rvae (Hose et aI. 1996). Bio1o:ically a\allable hydrocarbons from the E.rro,i V d d o : . 011 spill were p e r u l l y perv:lslve i n the uppel- \\';Iter column along the spill trajectorv inside PWS durin?
Herring populations may he adversely impacted by exposure to petroleum hydl-ocarbons. Because year-class strength may be determined by survival of herring larvae (Stevenson 1962: Taylor 1964; Outram and Humphreys 1974). contamination of eggs and larvae by o i l that causes \ignificant mortality or genetic damage may have a nesative impact on populations. Direct exposure of eggs to sufficiently elevated petroleum hydrocarbon concentrations frequently results i n abnor~nal larvae wlth poor survival potential (Linden 1976: Rosenthal and Alderdice 1976: Pearson et ai. 1985: Kocan et al. 1996). These abnormalities may he caused. in part. by somatic genetic damage. For example. a n elevated frequency of anaphase aberratlons was detected in the pectoral fins of exposed herring embryos i Hose et ai. 1996). It is not clear. however. if exposure of adult herring to hydrocarbons leads to yenetically damaged progeny. and if senetic damage occurs i n the germ line where i t can atfect hubsequent yenerations.
The purpose of this study was to determine if exposure of pre-spawning adult herring to petroleum hydrocarbons could cause genetic and morphological damage in larvae. Genetic damage was assessed by observation of maphase-telophase aberration rates i n the pectoral fins of newly hatched larvae. We anticipated that morphological damage might co-occur with genetic damage, and that size at hatch and maturation could be influenced by treatment. Accordingly, morphological data included yolk-sac and pericardial edema. and spinal abnormalities: size data included total larval length and yolk volume; developmental data included jaw maturation and stage at hatch. Effects of exposure on Fametes were judged by fertilization success. egg mortality. and hatch timing. and hatching success. We recognize that egg mortality. hatch timing, and hatch success effects could ;11so he due to exposure of emhryonlc tlssue to pl-eviously \equestered hydrocarbons ;IS lipid reserves are metabolized.
.A s ~ m i l a r study W;LS conducted i n 1985 (Rice et ai. l ' )X71 to scxch for effects i n progeny o f oil-exposed pre-spawn herring, Thel-e were two InaJor difterences i n our study and the precedinz study. First. w e exposed fish to water contain~ng PAH ranging from naphthalenes through chrysenes: the earlier study exposed fish to mono- and di-aromatic hydrocal-bons. Thus we anticipated that our exposures. which mimicked spill conditions in PWS. might be potentially more toxic to progeny. Second. a wider range of biological responses was examined. including ~norphological and genetic assessment.
Hydrocarbon concentrations and composition were determined i n treatment water. ovaries. and i n subsequently spawned esgs. Aliphatic and aromatic hydrocarbon data were collected. hu t because i t is likely that the aromatic fraction accounts for most toxic effects. we present only the PAH data in detail. Water i n this experiment W;IS contaminated via contact with rock coated with weathered ,Alaska North Slope crude oil. The composition o f PAH i n water
6 3
Iproduced hv o u r n~ethod clohely Imin~cked h a t ohserved 111 PWS \ \ ~ t h naphth;~Icnes throufh chryseneh reprehenred.
\\-e report the effect of exposure ot 1-eproductlvcly [ripe. prc-<pawn herrinz t o 011 o n cumeres and p r o p l y . a n d compare responhes t o thohe wI1cI-e were directly esposed to 011-
contamlnated water durlng incubation. I n companion htudics \\e report the effects of oil exposure o n adult herrlng (Cx ls . et ;11. Chapter I : Thomas ct ai. 19971 and the effects of direct exposure to o i l 01 Incubating herrlng e ~ g s (Caris et al. Chapter -1). t hus we detail only the pre- spawn esperiment and compare pre-spawn and direct exposure results in the discussion. In the discussion we demonstrate that PAH concentrations and composition in treatment water to which fish or eggs were exposed were very similar. For the purpose of interpreting and comparing pre- spawn and direct exposure results. direct exposure results have been Included in several p p h s .
METHODS
PI-e-spawn herring were collected near Shelter Island. southeast .\laska 158.4"N lat.. I3- l .Y"W long.) by purse seine on March 20. 1994. To Ininimize scale loss. fish were transferred in water and not netted. Approximately 1.500 fish were maintained in a 24.000 L holding tank: seawater flow was 60 to 130 L h i n at 3.5 t o 5.2"C and 3 I ppt. Fish were not fed during holding o r experlmental periods
Fish were p v i d but not ripe when captured. Ripeness was judged from percent gonad to total body weight to total body weight (gonosornatlc index) and from gamete color and texture. Males h e p n to show evidence of ripenins (softening of testes and m i l t extrusion) by April 1 I . Fernales showed evidence of ripenin: by April I4 (loosening of eggs and yellowing of ovaries). Excluding individuals that spawned. the zonosomatic index increased significantly from the time
o f capture through ,May 12. 1994 ( P < 0.001 I. Fish were artificially spawned on ,May 2 to 4. and ayaln on \lay 10 t o 12: these spawninzs occurred at about the same tlme natural spawning events In the area were observed (April 28 to :May 6 i n Berner's Bay ( A . McCregor. Personal ~01~111111nic.;ltion)1. Volitional spawnin: ~ v a h observed i n captlve fish as early ;IS April I I .
There were five treatments. including the control. with three rep!icates per treatment. Water for each replicate t a n k tlowed at 6.9 Urnin and -1.7 ' C throush independent cylinders containing rock or oiled rock (Appendix I . I ). Healthy pre-spawn herring were randomly distributed among fifteen 700 L treatment tanks (50 fish per tank). To characterize the oil and quantify treatment concentrations. composite water samples ( I .27 L from each of three replicate tanks) were collected on days 0. Y. and 16 for analysls by p s chromatography according to the methods of Short et A . ( 1096). Mortality and dissolved oxygen were monitored once per day i n each tank. Fish ranyed i n size from 20.3 t o 29.9 cm fork Ienzth. and 96 to 261 g wet weight: age ranged trorn 3 t o 1 0 !cars.
.After S m d 1 6 d esposul-c. t i h were x t1 t i cu I l y rpa\\ned. On clay S . 2 I temaie\ were \pawned per treatment. 011 day 16. 9 t o 18 females Lvere hpawneti per treatment: the number o f fish available tor spawning was limited by reproductlye cunditlon anti by mortality. Each fish \vas assigned a unique identification numbel-. Fish were killed by ;I blow to the head. measured (fork length to the nearest mlllirneterl. ivelghed lwet welght to the nearest 0.01 g ~ , anti bled by clipping a gill arch. For age analysis. ~ I Y scales were removed from the skin near the posterior lnargin of the dorsal f i n . placed succ~~ius down on a glass slide. .Ind covered with a second slide. Testes from up to three ripe males per replicate tank (three was the norm) were sealed i n plastic bags and maintained in chilled seawater u n t l l use. Ovarian membranes were cut longitudinally and eggs were removed with a hydrocarbon-free stainless steel spatula. From each female. approximately 150 eggs were deposited with a gentle swirling on each of ten 25 x 75 Inm glass hlides placed at the bottom o f a shallow glass dish in ambient seawater. Eggs from each female were placed in a staining rack and suspended I n separate beakers of seawater. Milt was prepared from collected testes by cutting sections from each contributing mnle into small segments: segments plus a small amount of seawater were mixed with a spatula. A few milliliters of milt were added to the beakers containing eggs: chunks of tissue were avoided. Eggs and milt !remained in contact 5 m i n with gentle stirring: milt was then poured off and the eggs were gently rinsed i n seawater. Eggs were fertilized within 34 min of deposition. Gonad and muscle samples ( I O g minimum) were frozen for hydrocarbon analysis. , A l l tools and glass vials used to collect hamples for hydrocarbon analysis were hydrocarbon free. Glassware was hydrocarbon free as received from the manufacturer: other tools were washed with soapy water. rinsed. dried. and [rinsed with methylene chloride. Additional eggs from multiple contributing females in each replicate high-oil treatment tank were deposited in shallow glass pans and fertilized with the previously described milt. These eggs were immersed in a 220 L seawater bath. Eggs were collected 0. 0.5. I . 2.1. X. 16. and 24 d after fertilization and frozen for hydrocarbon analysis. Tissue hydrocarbons were analyzed according to the methods of Short et d . ( 1996).
Ezgs. grouped by replicate tl-eatment tank. were incubated i n 40 to 50 L tanks for IS to I8 ti, Seawater input was approximately I Limin at 5.3 to 5.1'C. Stainlng racks containing eggs we1-e suspended from monofilament line attached to a pivorlng ov'xhead framework driven by ;In
offset cam to cause slow movement ( I rpm, through the water.
Lighting was natuI-aI. supplemented by overhead tluoresccnt light during daylight houl-s. Indirect natural light entered through windows along one hide: direc[ sunlight could cnter only brietly :it very low sun angles. At each location eggs were incubated. light levels were measured with a GE type 213 meter approximately 1.5 h after local noon on July 5. 1994: the sky was overcast. The ultraviolet contribution was estimated by placlng a photographic CV filter (Tristar number 8730) over the light meter and recording the difference in light intensity. Light intensity [ranged from 4 to 68 footcandles (mean 18 ? 2.0 footcandles). The estimated ult!-aviolet energy was 13% of the total light energy.
Eggs were examined for fertilization success and iie\,elopment I to 10 d after fertilization. Eggs susceptible to mechanical damage (those along slide margins). clumped eggs. and excess
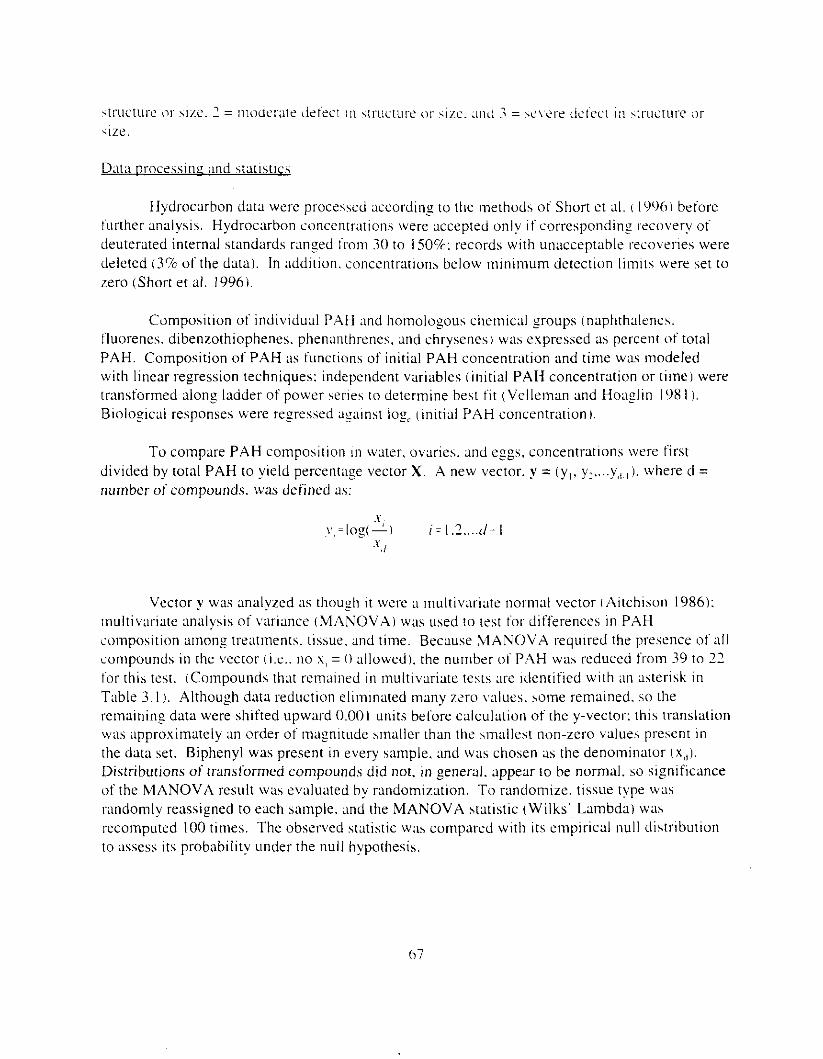
Data Drocessing and s t a t ~ s t ~ c s
Hydrocarbon data were processed according to the methods of Short et ai. ( 1906) betore further analysis. Hydrocarbon concentrations were accepted o n l y i f correspondins recovery of deuterated internal standards ranged from 30 to 150%: records with unacceptable recoveries were deleted (3% of the data). In addition. concentmtions below m i n i m u m detection l imls bvere set to zero (Short et al. 19961.
Composition of individual PAH and homologous cbemic;d groups (naphthalenes. i'luorenes. dibenzothiophenes. phenanthrenes. and chrysenes) was expressed as percent o f total PAH. Composition of PAH a s functions of initial PAH concentration and time was modeled with linear regression techniques: independent variables (initial PAH concentration or time) were transformed along ladder of power s e r w to determine best f i t (Velleman and Hoaglin 1 % I i. Biological responses were regressed a w n s t log? (inltial PAH concentration).
To compare PAH composition 111 water. ovaries. and eggs. concentrattons were first divided by total PAH to yield percentage vector X . A new vector. y = (yI , yI,...y,,,). where d = number of compounds. was defined a x
~ S ,
.'-,I
?',=log(-i i = 1.2 .... d- I
Vector y was analyzed as though it were ;I multivxiate norrn;d vector ~Aitchison 1986): multivariate analysis of variance (ViANOVAi was used to lest for differences i n PAH composition among treatments. tissue. and time. Because MANOVA I-equired the presence of a l l compounds in the vector (i.e.. no x , = 0 3Ilowed). the number of PAH was reduced ft-om 39 to 21 tor this test. (Compounds that remained i n multivariate tests are Identified with an asterisk in Table 3. I ) . Although data reduction elim~nated many zc'ro v;11ues. some remained. so the remaining data were shifted upward 0.001 units before calculation of the y-vector: this translation was approximately an order of magnitude snaller than the hlnallest non-zero V ~ I U K S present i n the data set. Biphenyl was present i n every sample. and was chosen as the denominator (xcl). Distributlons of transformed compounds did not. in general. appear to be normal. so significance of the MANOVA result was evaluated by randomization. To randomize. tissue type was I-andornly reassigned to each sample. and the MANOVA statistic (Wilks' Lambda) was recomputed 100 times. The observed statistic was compared with its empirical nul l distribution to assess its probability under the nul l hypothesis.
6 7
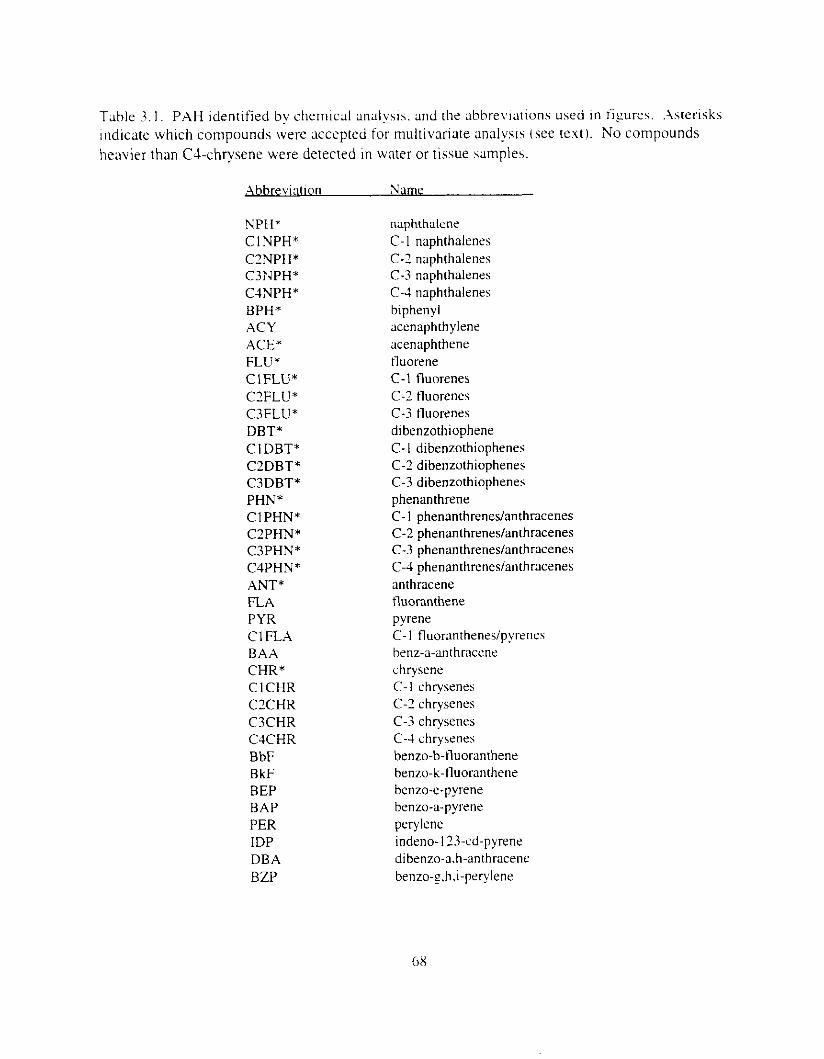
Table 3. I . PAH identified by chrrn~cal analysis. and the ahhrewations used in i i p m s . .hterlSkS Indicate which compounds were accepted for multivariate analysls (see textl. No conqmunds heavier than C-l-chrysene were detected in water or tissue samples.
.Ahbreviatlon Name
NPH' C I NPH* C2NPH* C3?JPH* C1NPH* BPH* ACY ACE* FLUC ClFLU* C?FLU* C3FLU* DBT* C I DBT* C2DBT* C3DBT* PHN* C1 PHN* C2PHN* C3PHN* C4PHN* ANT* FLA PYR CI FLA BAA CHR* ClCHR C2CHR C3CHR C4CHR BbF BkF BEP BAP PER IDP DBA BZP
naphthalene C-l naphthalenes C-2 naphthalenes C-3 naphthalenes C-4 naphthalenes biphenyl acenaphthylene acenaphthene fluorene C-1 fluorenes C-2 tluorenes C-3 tluorenes dibenzothiophene C- I dibenzothiophenes C-2 dibenzothiophenes C-3 dibenzothiophenes phenanthrene C-l phenanthrenes/anthracenes C-2 phenanthreneshthracenes C-3 phenanthreneslanthracenes C-4 phenanthreneshthracenes anthracene tluoranthene pyrene C-l fluoranthenes/pyrenes henz-a-anthracene chrysene C-l chrysenrs C-2 chrysenes C-3 chrysenes C-4 chrysenes benzo-b-tluoranthene benzo-k-tluoranthene benzo-e-pyrene henzo-a-pyrene
indeno- I?3-cd-pyrene dibenzo-a.h-anthracene benzo-g,h.i-prrylene
PKrylenK
~1.0 au:ment the tnulti\m;lte : I I I : I I > > I ~ o t P.4H c o n i p o s ~ ~ ~ o n . ~ ~ n s ~ ~ h s t i t u t e d f l t torc~~es. dibenzothiopheneh. and phenanthrene\ i n t~ssue were independentl~ compared. Each compound wi th~n its respective homologous chen~tc;~/ series w:~s normalized t o the S L I ~ o f that particular homolog (e.?.. lluorene/sunl tluol-enesi and analyzed with two-\v;Iy analysis o f vartance ( A N O V A ) (tissue and tinlei. Val-iat~on in composition among tt-ealments was \mall enough to ignore i n this test.
The 8 and 16 d esposut-e groups were generally treated as Independent experiments. The statistical design was essentially balanced i n the 8 d esposut-e g~-oup. but due to \.olitional spawning activity and disease. there were insufficient eggs available i n the 16 d exposure group for a balanced desien. The two exposut-e groups were not comple~ely independent because fish were sampled from the same populat~on pool i n each tank o n two occ;Isions. Reported means were based on least squares estimates.
The denominator used to calculate percentages varied by response type. Percentages o f eggs fertile. infertile. and in~tiallv dead were based on the total number of eggs counted near the heginning o f the experiment. Percentages ofefgs that hatched or died were based on the total number of hatched 1 a 1 - v ~ plus the number of dead eggs determined ;kt the endpoint. The number o f hatched larvae was subdivided into number alive. number moribund. and number dead. Accordingly. percent alive was the number of living larvae (excluding moribund larvae) divided by the total number hatched. Similarly. number hatched w a s used :IS the denom~nator to calculate percent moribund and percent dead larvae. Swimming Llbility of alive larvae was categorized as effective. ineffective. or incapable. Swimming ability of moribund and dead larvae was, by definition. nonexistent. thus number alive was used as the denominator for swimming categories. All larvae categorized as incapable of swimming had spinal defects. Spinal aberrations were assessed only i n alive and moribund larvae. Because dead larvae quickly become distorted after death. they were not assessed for spinal condition. Percent spinal ;Iherrations: therefore. \va\ number of ~~berrations divided by number alive plus moribund.
To estimate hatch t ~ m ~ n g . the peak hatch day wah determ~ned lo]- each tih. I n cases where two peaks ot equal ma?nitude occurred. the first pellk \vas reported. Median hatch day w a calculated by two-point 11ne;lr interpolatlon of cumulative percent hatch ( y ~ and d a y I x ) . trom data points that \panned SOYO hatch. based on the number of eggs that hatched.
Percentage data and hatch timing were analyzed with ANOVA. with treatment. replicate. and fish as class variables. replicate nested i n treatment. m d fish nested in replicate and treatment. Before analvsis with ANOVA. percentafe data were :Lrcsin transformed. and corrected for small where necessary (Snedecor and Cochrw 19XO). [The same conclusions were reached w ~ t h untranstormed datal. Scored abnormality data (yolk-sac edema and , j a w size) were recoded to yield incidence ot abnormality (e.g.. percent larvae with small . jaw) then malyzed with ANOV;-\.
6 9
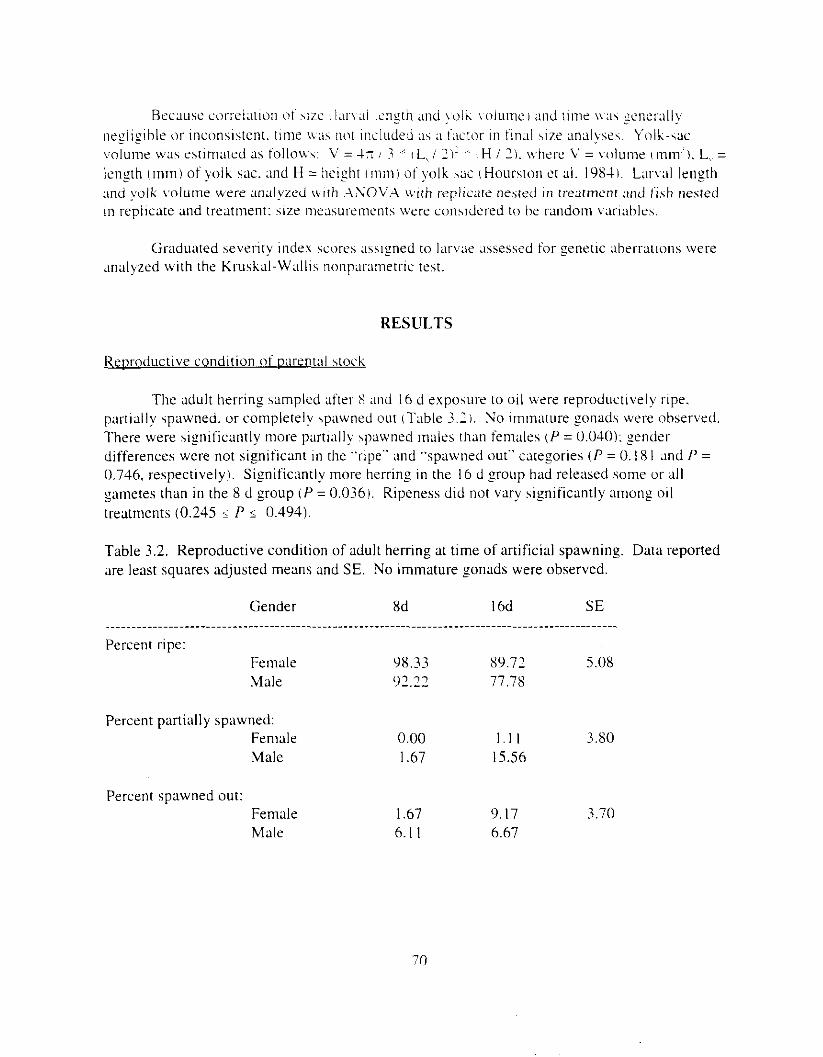
19'9 11'9 OL'E 11'6 L9' I
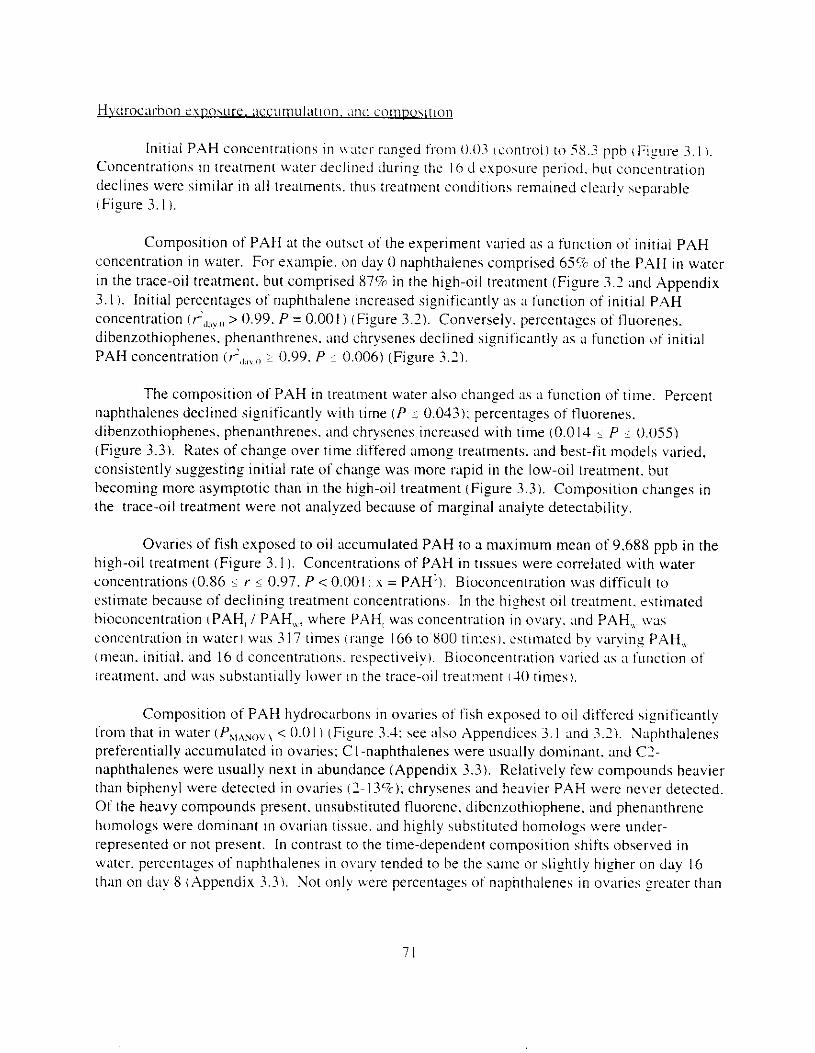
lL
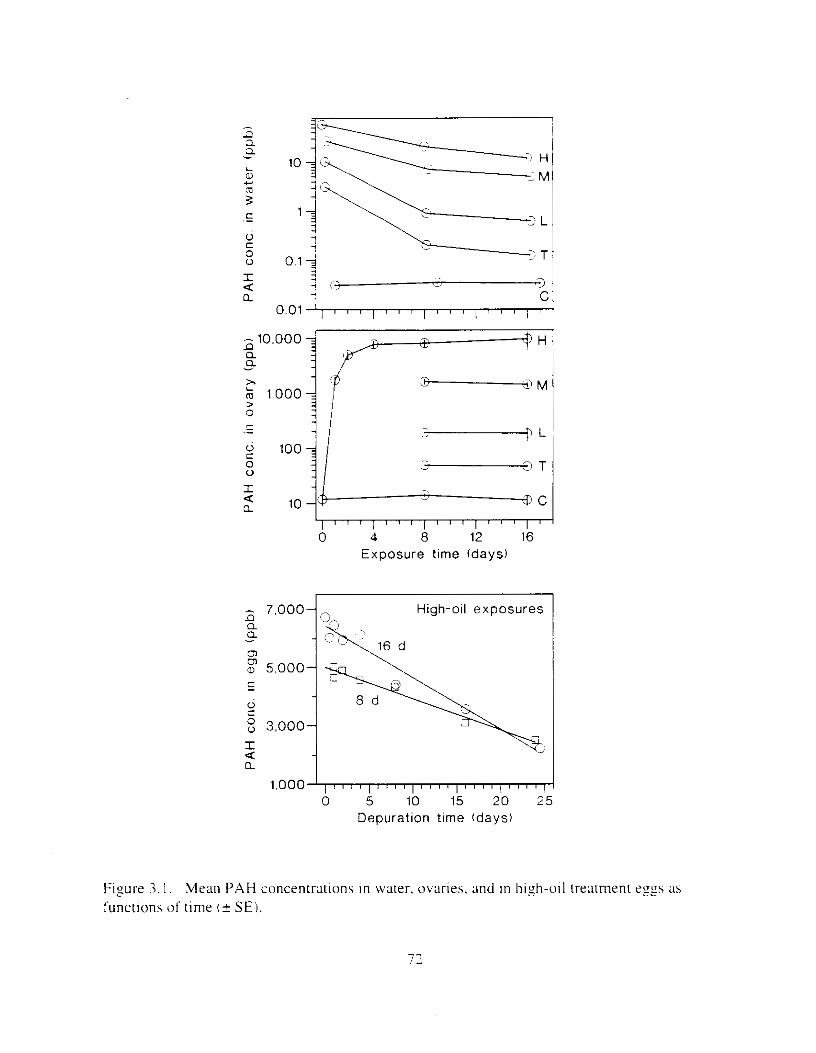
V C 0 0
10
1
0.1 j
0.01
.-
l o o y , ~, , , ,:=; c
0 C
0
X 2 10
0 4 8 12 16 Exposure time (days)
1 . o o o ~ l 0 5 10 15 2 0 2 5
Depuration time (days)
F i y r e 3. I . Mean PAH concentratlons In water. ovaries. and In hish-oil lreatment esss ;IS
functions o f time ir SEI.
77 I..
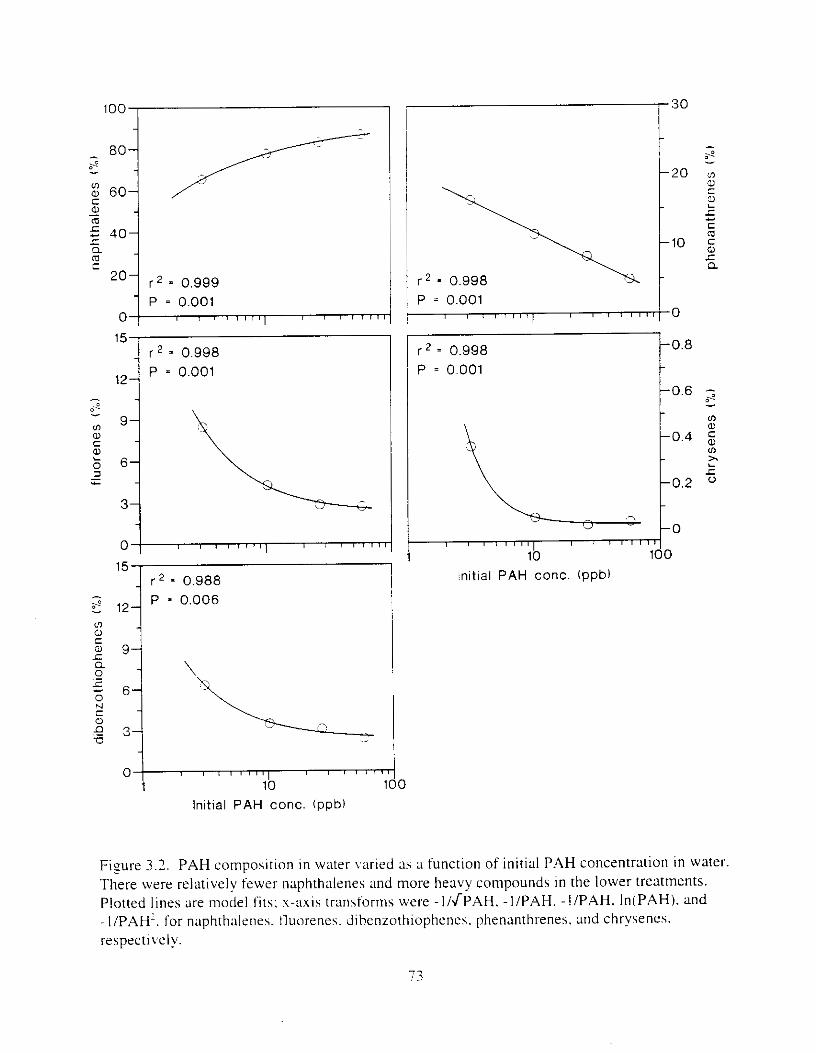
-- 1 I
0 , P = 0.001
I 15 1 r 2 = 0.998 12j P = 0.001
0 1 I
15 1 r 2 - 0.988 3 12J P - 0.006 -
0 1 1
I
Initial PAH conc. (ppb) 10 1
P = 0.001 1 0
r 2 = 0.998 P = 0.001
I I 10 100
Initial PAH conc. (ppb)
IO
F i y r e 3.1. PAH composition in water varied as ;I function of initial P.4H concentration in water. There were relatively fewer naphthalenes and more heavy compounds in the lower treatments. Plotted lines are model fits: x-axis transforms were -1IJPAH. -I/PAH. -I/PAH. In(PAH). and - IIPAH'. for naphthalenes. lluorenes. Jihenzothiophenes. phenanthrenes. and chryenes. respectively.
7 3
~ ._ I
- 1 E 20
0 4 8 12 16 Time (days)
t
0 4 12 16 Time (days)
Figure 3.3. Compos~tion o f PAHs varied as a function of t~me. Percentages of naphthalenes declined significantly: percentages o f heavier compounds increased. To avoid minimum detection limit artifacts. trxe-oil concentrations were not included.
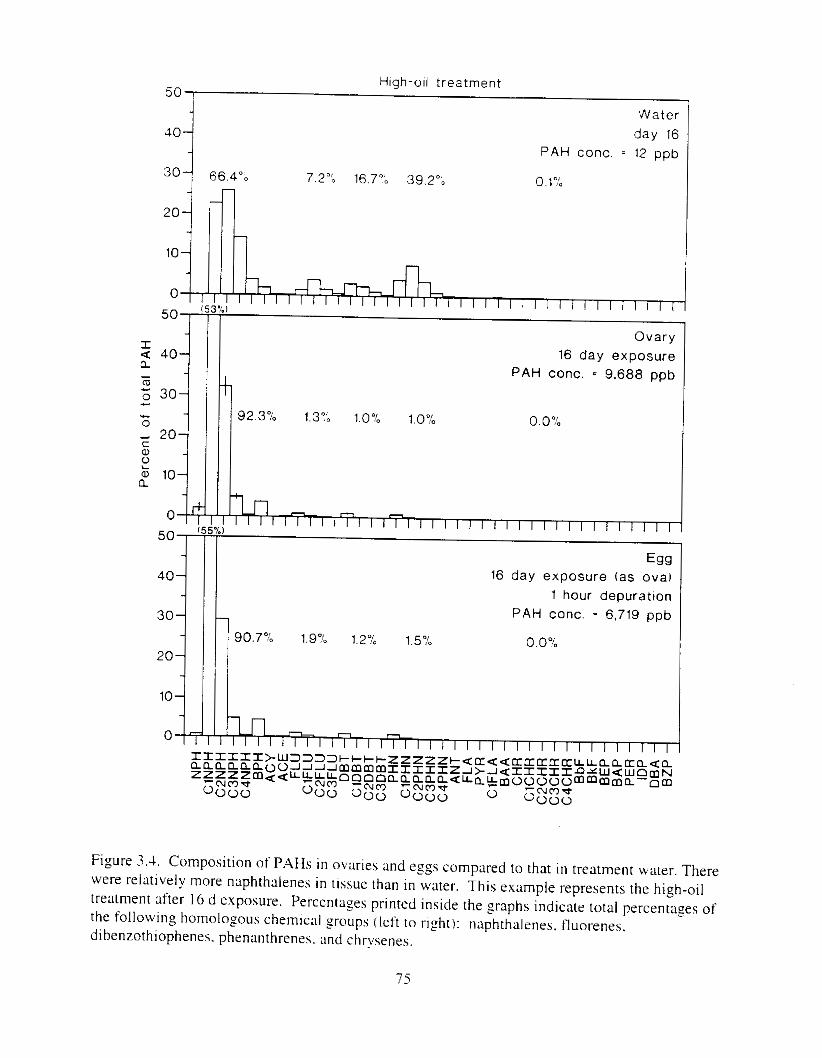
N
00
0
OP
- Percent
of
tota
l P
AH
2
NO
P
8
N
w r
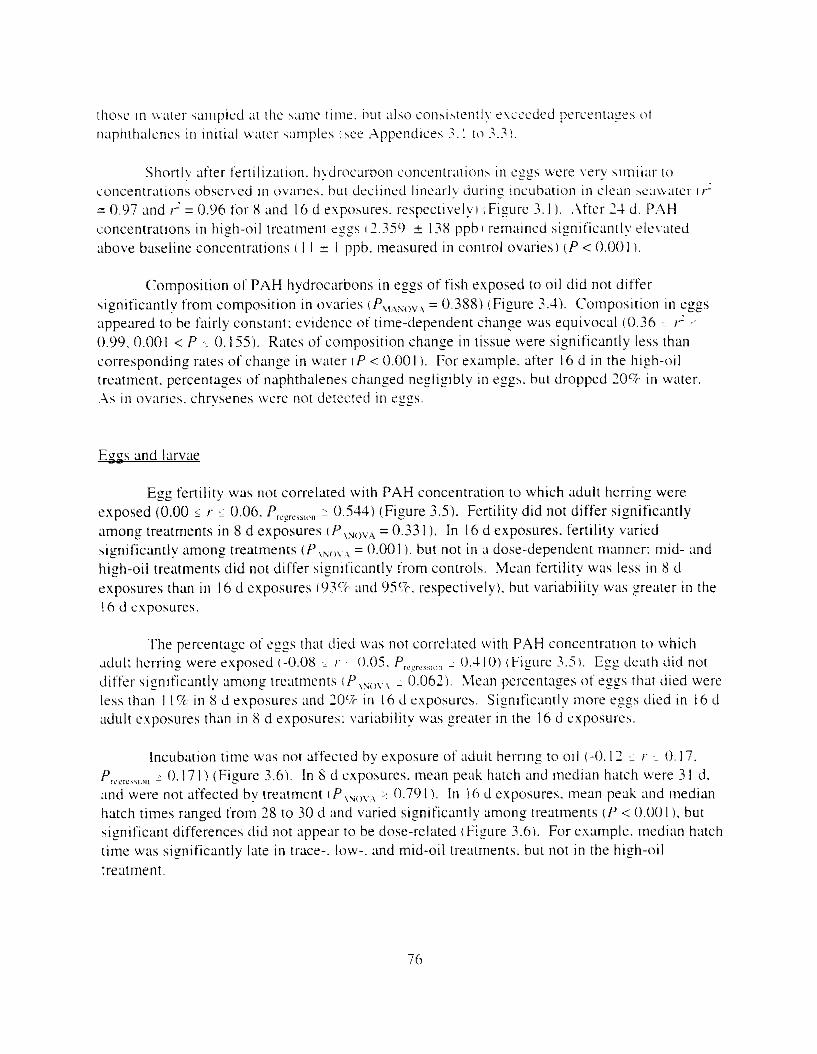
rho\e 111 n x e t - \ampled at the 5m1c t ~ m e . i w t :iw c o n r i ~ r e n t l ~ c ~ c w d e d percentage\ 0 1 naphthalsnes i n initial water \arnples 1 \ee .Appendices 3. I t o 3.7 1 .
Shortlv atter lertilizat~on. h>drocarhon concentration\ 111 eggs were very r1111iIx 1 0
c~ncentrations observed 111 ovimes. h u t declined lincarl! durln: Incubation In c I e m ~c':I\\;wI- 11'
= 0.97 and I' = 0.96 for 8 ;~nd I6 d espo~ures . respectivelyl ~Figut-e 3. I ) . .After 24 d. P.4H concentrations in high-o~l treatment esfs 12.3-59 ? I38 ppbl r rma~ned significanrly elevated above baseline concentr;ltions I I I -+ I ppb. ~neasured i n control ovariesl ( P < 0 . 0 0 1 1.
Composition of PAH hydrocarbons in eggs of fish exposed to o i l did not differ \ignificantlv from composition i n ovaries ~P, , . , sov . , = 0.388) (Figure 3.4). Compos~tion In eggs appeared to he fairly constant: evldence o f time-dependent chanze was equivocal (0.36 ~ I' c 0.99. 0.001 < P '~ 0.155'). Rates o f composition change i n tissue were significantly less than corresponding rates o f change i n Lvater rP < 0.001 1. Fol- example. after 16 d in the hizh-oil treatment. percentages of naphthalenes chanTed negligibly i n eyg'. hut dropped 70% i n water. .As i n ovaries. chrysenes were not detected i n e y y s .
Eoos and larvae
Egg fertility was not correlated with PAH concentration to which adult herring were exposed (0.00 5 I - 1 0.06. P,,,,,,,, ,,,, ~ '' 0.544) (Figure 3.5). Fertility did not differ significantly among treatments in 8 d exposures I f = 0.33 I ), In 16 d exposures. fertility varied \ignificantly amon,. treatments (P,,,,,, = 0.001 1, hut not i n ;I dose-dependent manner: mid- and high-oil treatments did not differ significantly from controls. Mean fertility was less i n X d exposures than i n 16 d exposures 193°C and 95T. respectively). but variability was greater i n the I6 d exposures
The percentage o f eggs that died w a s not cot-rel:ited w i t h PAH concentrat~on to which d u l : herrin? were exposed (-0.08 j - 0.05. P,,,,,,\,,,,, ~ 0.410) (Figure 3 . 5 ) . Eyg death did not differ s~gnlficantly among treatments IP,~,)~, ~ 0.062). Mean percentages o f eggs that died were less than I I "r i n X d exposures and 20% in I6 d exposureh. Sign~ficantly more esgs died in I6 d adult exposures than i n 8 d exposures: variability w a s greater in the 16 d exposures.
Incubation time was not affected by exposure of adult herrln: to oil (-0. I 2 1 I - : 0 . 17. Pr,l,,,,,,,,, : 0.171) (Figure 3.6). In 8 d exposures. mean peak hatch and median hatch were 3 I 11. and were not affected by treatment I P \Lo, , : 0.79 I i. In IO d exposures. mean peak x ld median hatch times ranged from 28 to 30 d and varied significantly among treatments ( P < 0 . 0 0 1 ). but siyificant differences did not appear to he dose-related (Figure 3.6). For esample. median hatch time was sipificantly late i n trace-. low-. and mid-oil treatments. but not i n the hizh-o~l treatment.
76
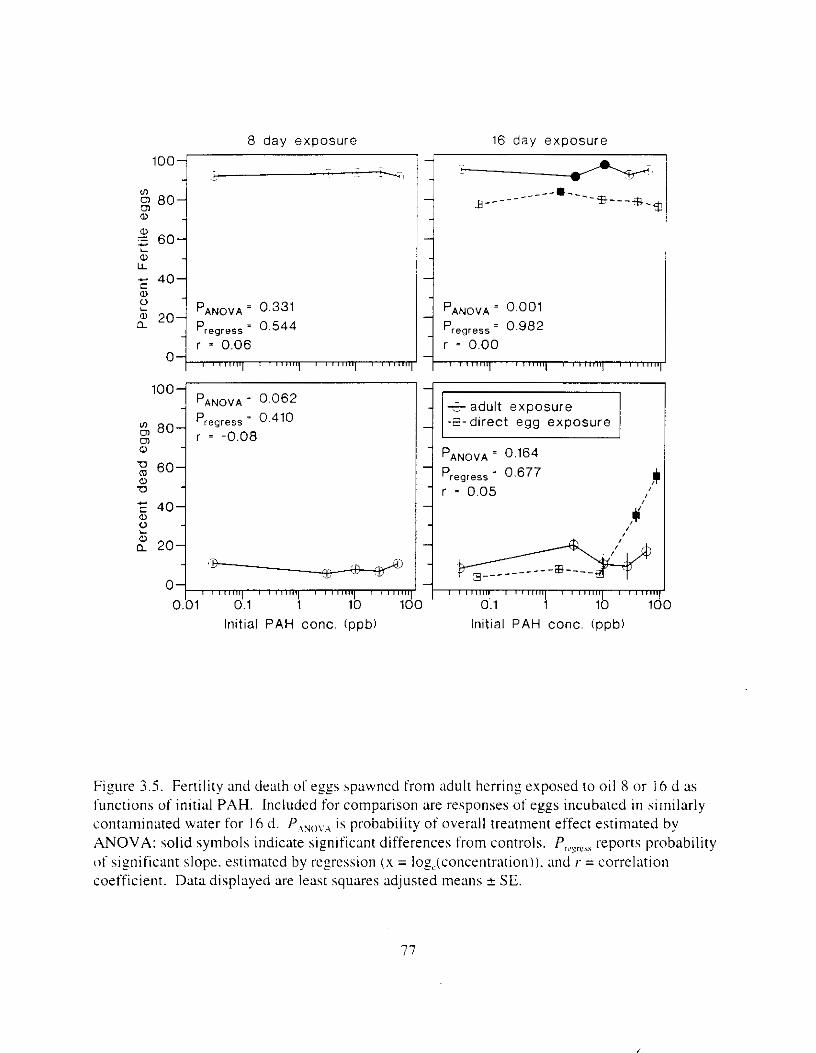
8 day exposure 100 - - . -
i ~
L L a, L
n PANOVA = 0.331
r = 0.06 Pregress = 0.544
100 PANOVA = 0.062
""I 20 a
0 I ' ' ' ' " 1 ' 1 ' ' ' ' " 1 ' 1 ' ' " ~ ~ 0.01 0.1 1 10 1c
Initial PAH conc. (ppb)
1 I
r'
PANOVA = 0.164 Pregress d r = 0.05 I ,i
I ' """'I ' """'I """" ' "lllllll I 0.1 1 l b 1 0 0
Initial PAH conc. (pph)
Fisure 3 , s . Fertility and death of eggs spawned from adult herrins exposed to oil X o r I6 d as functions of initial PAH. Included for comparison are responses of eggs incubated in similarly contaminated water for I6 d. P\yovr\ is probability of overall treatment effect estimated by ANOVA: solid symbols indicate significant differences from controls. P,,u,css reports probability of significant slope. estimated by regression (x = Iog,(concentrationl). and r = correlation coefficient. Data displayed are least squares adjusted means 2 SE.
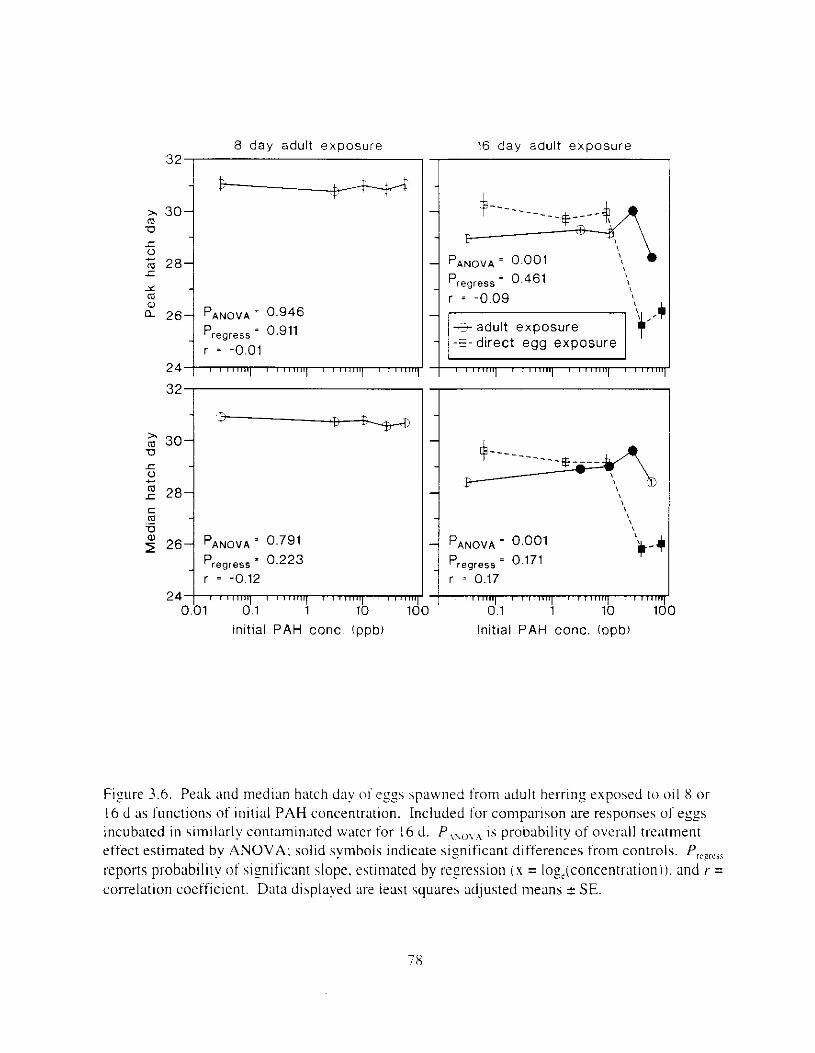
8 day adult exposure 16 day adult exposure
t i
" 1 2 28
C
PANOVA - 0.791
Pregress = 0.223 r = -0.12
2 4 1 0.01 0.1 1 10 1c
Initial PAH conc. (ppbl
P,,,,, - 0.001
piegress = 0.171 r = 0.17
0.1 1 10 1C Initial PAH conc. (ppbl
F i y r e .X6 Peak m d median hatch day (11 tggs spawned from adult herring exposed IO oil 8 or I6 d as functions of initial PAH concentration. Included for comparison are responses of eggs incubated i n similarly contaminated water tor 16 d. P ,,,],., is probability of overdl treatment effect estimated by ANOVA: solid symbols indicate significant differences from controls. Prcgccsq reports probability o f significant slope. estimated by regression ( x = lo~,(concentrlltionI). and r- = correlation coefficient. Data displayed are least squares adjusted means 5 SE.
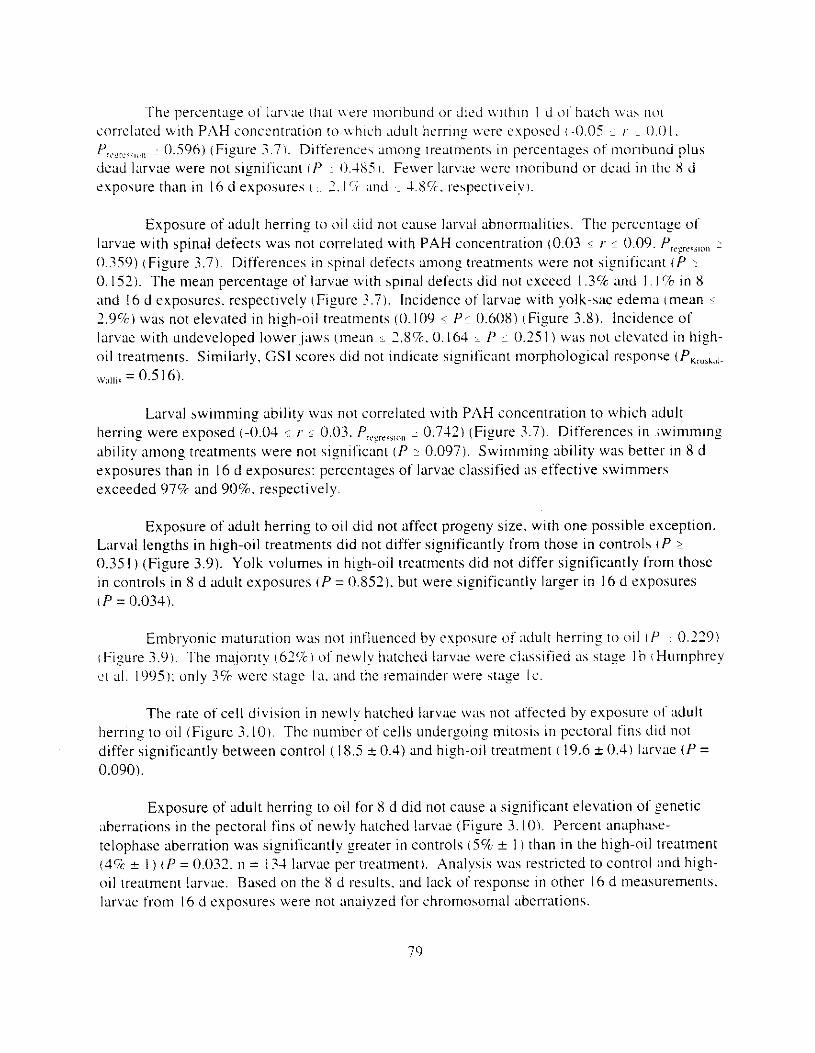
Exposure of adult herring t o o i l did not cause ImuI abnormalities. The percentage of larvae with spinal defects was not correlated with PAH concentration (0.03 I I' < 0.09. frcgre7s,,,,, I
0.359) (Figure 3.7). Differences in spinal defects among treatments were not significant tf %:
0.157). The mean percentage of larvae wi th spinal defects did not exceed I .3% and I . I ? i n X and 16 d exposures. respectively (Figure 3.7). Incidence of larvae with yolk-sac edema (mean 1 2.9%) was not elevated in high-oil treatments (0.109 T' P C 0.608) (Figure 3.8). Incidence of larvae with undeveloped lowerjaws (mean 1 2.8%. 0.164 P 1 0.251) was not elevated in high- o i l treatments. Similarly. GSI scores did not indicate significant morphological response (P,,,,,,,,,~
= 0.5 16).
Larval swimming ability was not correlated with PAH concentration to which x lu l t herring were exposed (-0.04 < I' 5 0.03. f:,, , , , , , , , , , ~ 0.742) (Figure -3.7). Differences in ,wirnrning ability among treatments were not significant ( f 10.097). Swimming ability was better i n 8 d exposures than in 16 d exposures: percentages of larvae classified ;IS effective swimmers exceeded 97% and 90%. respectively.
Exposure of adult herring to oil did not affect progeny size. with one possible exception. Larval lengths in high-oil treatments did not differ significantly from those in controls ( P 2
0.35 I ) (Figure 3.9). Yolk volumes in high-oil treatments did not differ significantly from those i n controls in 8 d adult exposures tf = 0.852) . but were significantly larger in 16 d exposures tf = 0.034).
Embryonic maturation was n o t influenced by csposure o f adult herring to oil IP 0.229) tFigure 3.9). The ma.jorit! 1 6 2 W of newly hatched larvae were classified ;IS stage I b t Humphrey ( c t al. 1995): only 3%. were stage l a . and the I-ematnder were stage I C .
The rate of cell division i n newly hatched larvae was not affected by exposure of adult herr~ng to oil (Figure 3. 10). The number of cells undergoing mitosis i n pectoral fins d i d not differ significantly between control i 18.5 f 0.4) and high-oil treatment ( 19.6 * 0.4) larvae ( P = 0.090).
Exposure of adult herring to oil for 8 d did not cause a significant elevation of Zenetic aberrations in the pectoral fins of ne\vl>J hatched larvae (Figure 3. 10). Percent anaphasr- telophase aberration was significantly greater i n controls (5% * I ) than in the high-oil treatment (4% 1 ) c f = 0.032. 11 = 134 larvae per treatment). Analysis was restricted to control and high- o i l ireatment larvae. Based on the Y d results. and lack of response i n other 16 d rneaurements. larvae from I6 d exposures bve1-e not analyzed for chromosomal aberrutions.
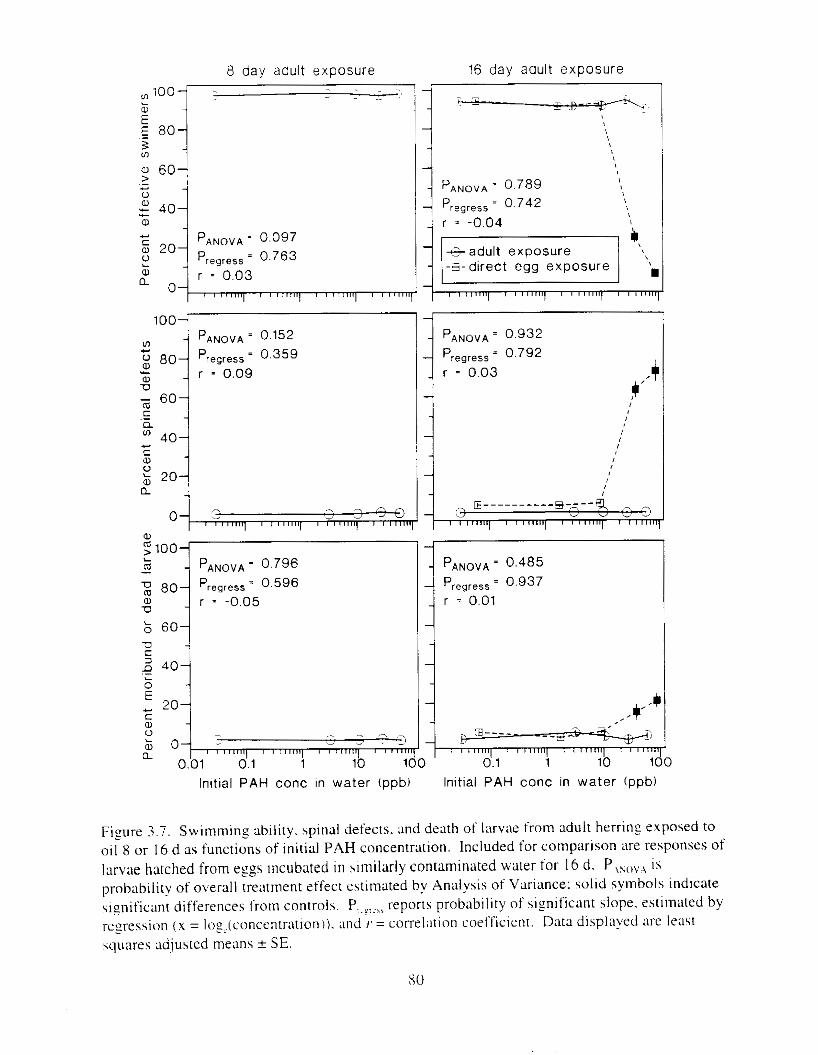
8 day aault exposure 16 day adult exposure
'" 100 . . ~~ - _ _ -
2 40 a,
PANOVA = 0.097
a, r = 0.03
PA,,,, = 0.789
a
i
lnltial PAH conc in water (ppb) Initial PAH conc in water (ppb)
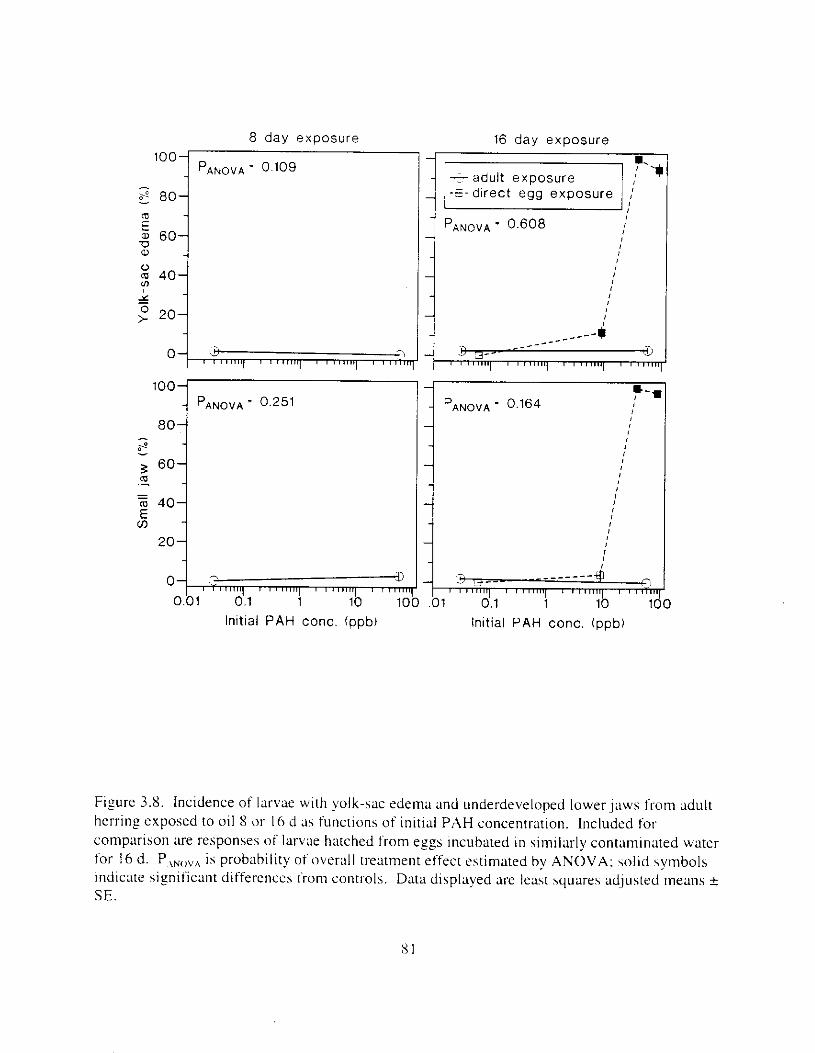
8 day exposure 16 day exposure 100-
P,,ovn = 0.109 - b'? 80-
? -
- PANOVA= 0.608
60- D 0
- -
2 40-
1 t" 20-
0- 'a ---4 - 3 z--
__-- __- - a I ' " " " ' I " " 1 I ' ' "'''7 ' ' '""Y I ' l r m
, '""A PANovn = 0.251
20] 0 , , ~ , , , , , , 1 , ,,,,,,,I , , , , ) , , , , , ,& 0.01 0.1 1 10 10
Initial PAH conc. (ppb)
r 0
1 1 PANOVA = 0.164
I
initial PAH conc. (ppb)
XI
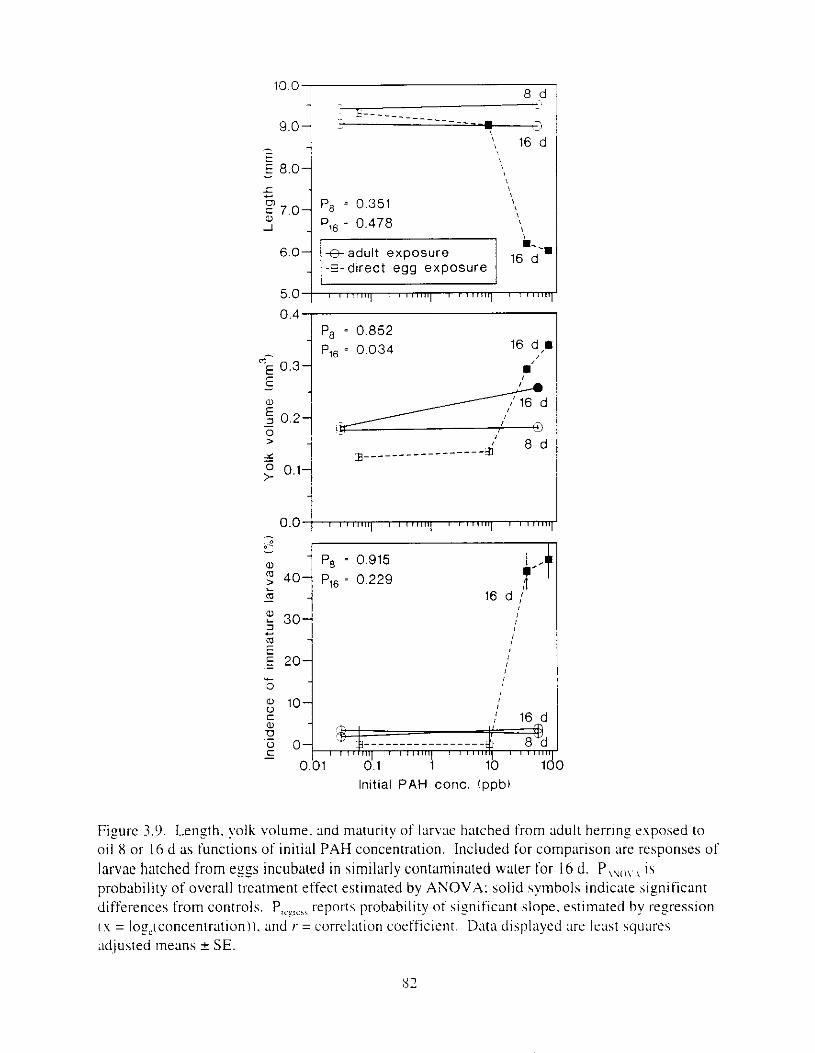
10.0 8 d
7.0 P, = 0.351 P,, = 0.478
! 16 r!
Initial PAH conc. (ppbl
Figure 3.9. Length. yolk volume. and maturity of larvae hatched from adult herring exposed to oil 8 or 16 d as functions of initial PAH concentration. Included for comparison are responses of larvae hatched from esss incubated in similarly contaminated water for 16 d. P,,,,,, is probability of overall treatment effect estimated by ANOVA: solid symbols indicate significant differences from controls. PreFres, reports probability of significant slope, estimated by regression ( x = lot-',(concentrationll. 2nd I' = correlation coefficient. Data displayed are least s q u r e s xijusted means ? SE.
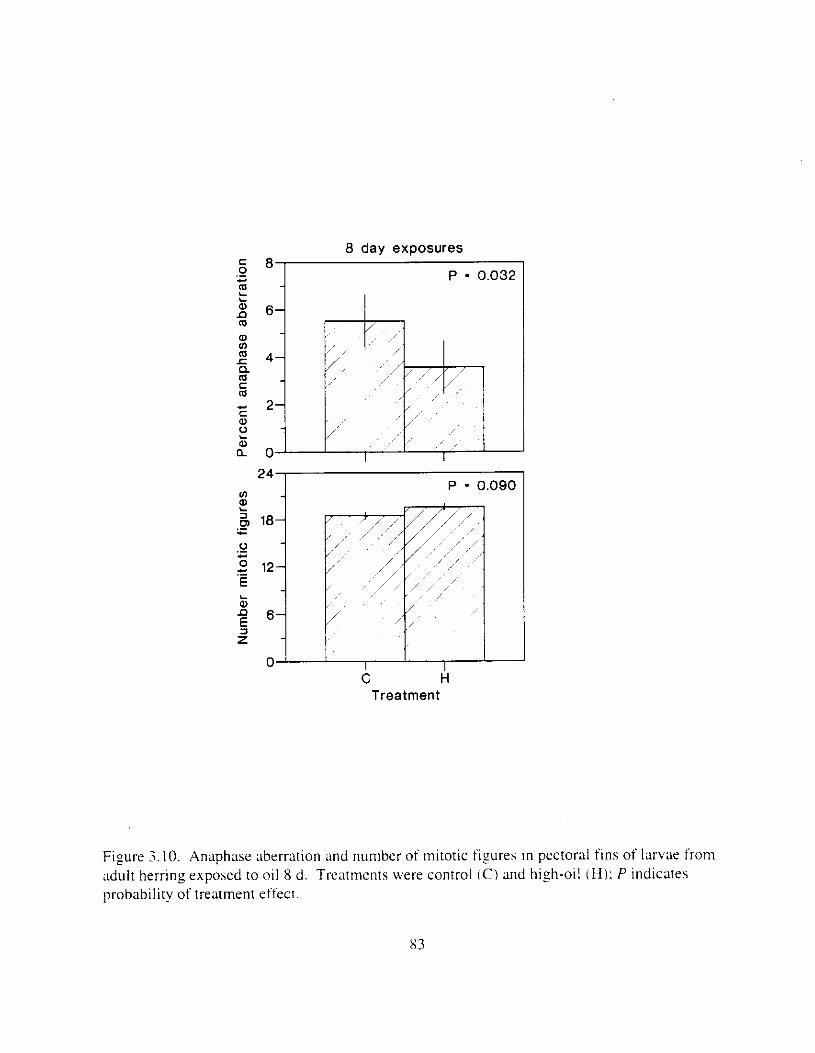
Num
ber mito
tic figur
es Per
cent
anap
hase
aber
ratio
n N
DISCUSSION
In this study. we e.<posed reproductively ripe Pacific herring to water contaminated with weathered crude oil and looked for effects in artificially spawned progeny. Adults were exposed to oil concentrdtions in the range encountered i n open water in PWS following the spill ( u p to 6.14 ppb PAH (Short and Harris 1996)) and beyond (initial PAH concentrations ranged up to 58 ppb). PAH hydrocarbons accumulated i n herring tissue. including muscle and ovary (Carls et al. Chapter I ). Although hydrocarbon Concentrations were allowed to fall as the oil weathered. adult herring remained i n contaminated \vater up to 16 d. Hydrocarbons that accumulated i n ovaries were detectable at similar concentrations shol-tly after fertilization. but declined durin? incubation. Despite adult exposure. and presence of hydrocarbons in eggs during incubation. there were. with one possible exception. no discernahle effects i n progeny. We will argue that the exception. an elevation in yolk volume i n 16 d exposures. was more likely due to random chance than treatment related. Response of the adult fish to oil exposure. including suppression of immune function. increased incidence of disease. and disease-related mortality. is covered in a separate paper (Carls et al. Chapter I ).
.As in PWS. o i l weathered :IS time progressed. resulting i n reduced concentrations i n water and changes in PAH composition. Composition in water shifted from naphthalene dominated to phenanthrene dominated. part~cularly at lower doses. Also due to Lveathering. PAH composition varied i n a predictable manner across treatments. Rates of naphthalene l o s s were apparently dependent on the volume o f oil i n o u r deliver): \?stem: thickness of the o i l f i l m on the rock hubstrate may have been a c r u c l i factor in controlling loss rates. similar loss I-;W patterns were observed i n another esperiment employing the s ~ m e apparatus. hut with different rock (Curls et al. Chapter 4). Thus. although weathering w x dlfkrent i n each treatment at tile beginning of the study. a11 treatments could he back-extrapolated to the same starting point. The same physical and chemical processes that caused ueatherlns i n our experimental Lipparatus were at plav in PWS (Short and Heintz. In press). although the situation In PWS was infinitely more comples.
The least toxic PAH preferentially accumulated i n ovaries. and were transterred to eggs. ,Accumulation was strongly biased toward naphthalenes. and. of the few large r in? P.AH detected. there w a s ;I tendency t o accumulate unsubstituted homologs. Other studies have shown that tox~citv increases both with ring size (Rice et al. 1977: Carls et ;LI. Chapter 41 and alkylat~on (Rice 19x5: Rice et al. 1977: Carls et d . Chapter 4). thus uptake patterns by ovarian tissue may have favored reduced toxicity to o v a We do not . howevct-. fully understand the chernlcal
pwtitloning that caused these c ~ ~ n i p o s ~ ~ i o n a l ciIftt.rences. C'ompo\ltlon 0 1 P;\H i n [Ishue\ may have heen partially modified by nlet;1bollc action: mixed lunctlorl cu~dase I.MFO) cnz!mes were Induced i n these pre-spawn herrlng IThomas et aI. 1997). Hydrocarbons ;xcumuIxed h y o \ ' a
trmsferred to subsequently spawned eggs: the PAH composition matched that 111 ovarim tissue. ;Ind concentrations i n eggs in~mediatsly after spawning weIe s imlar to h o s e 111 o v w e s .
Effects of exposure of [reproductively tripe herring to o i l i n \4ater were not discernable in the progeny. Parameters not affected included egg fertility. egg death. hatch timing. larval death. spinal defects. yolk-sac edema. larval swimming, larval length. stage of larval development at hatch. jaw development. rate of cell mitosis. anaphase-telophase chromosome abnormalities. number of pycnotic cells. and number of multinucleated or karyorrhectic cells. In several cases significant departure from control responses were observed. but not i n ;I dose-dependent manner For example. i n the 16 d exposure group. fertility was significantly low In the trace-oil treatment. and significantly high in the low-oil treatment. but not i n mid- and high-oil treatments (Figure 3.5). These significant differences were invariably confined to the 16 d exposure group. where variability of response was consistently greater than i n the 8 d group. In most cases. interpretation of rmdomly significant [responses as not dose dependent was clearly put i n context by comparison to responses to direct exposure of eggs during incubation (Figures 3.5 through 3.9).
There was one significant result. an elevation in yolk volume. that may have been dose related. but we hesitate to draw this conclusion. Although yolk volume was significantly elevated in the high-oil treatment of the I6 d exposure group ( P = 0.034), it is unlikely that i t represents a significant response. First a technicality: the acceptance criterion (a = 0.05) should he divided by two tests ( 8 and 16 d). thus marginalizing the statistical significance. Second. the I6 d exposure group tended to exhibit a pattern of random significance that was not dose related. and we suspect the increase in yolk \-olume belongs in this category. Third, there was no indication of similar response in the 8 d exposure group. Fourth. if the response were real. other parameters. includins larval length. developmental stage. jaw development. and yolk-sac edema should have also shown significant response or trends. hut did not. Jaw development m d yolk- hac edema were more sensitive measures of response to 011 than yolk volume i n direct c z g exposure tests (Carls et 31. Chapter 4). Comparison of increased yolk volume to that observed in eggs directly exposed to 0 1 1 during incubation does not exclude the possibility that the response was real: a 0.22 mmi increase was significant i n direct egg exposures. hu t an increase of0.0I mm' was not. The yolk volume increase observed i n this study \vas intermediate (0.08 Inmi). but substantially smaller than the significant 0.22 mm' increase.
Lack of response was not due to insufficient data or poor test design. The total number of eggs observed was high i n 8 and 16 d tests (>12.000 and >7.500. respectively). Second. in a highly similar experiment where eggs were exposed during incubation (Carls et ai. Chapter 41, many of the same parameters measured in this study were sensitive measures of response. including egg death. hatch timing, larval death. spinal defects. yolk-sac edema. larval hwimming. larval length. apparent stage of larval development at hatch. jaw size. and anaphase-telophase
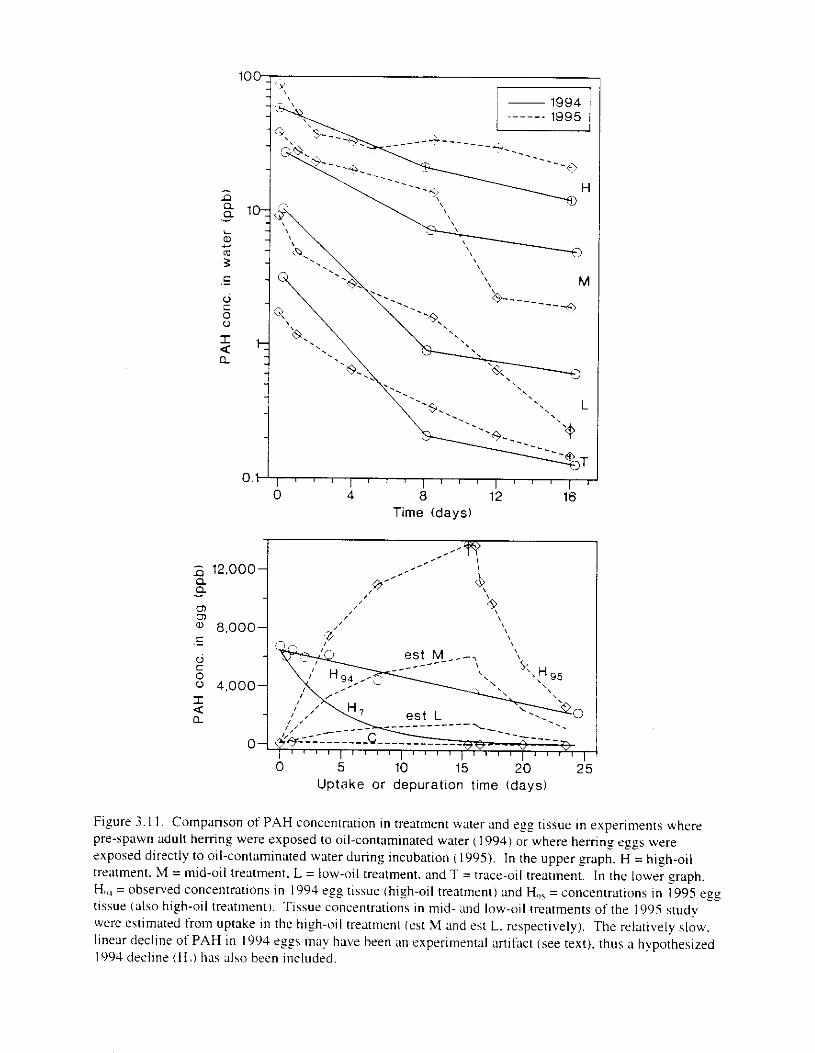
0 5 10 15 2 0 25 Uptake or depuration time (days)
Figure 3. I I . Comparison of PAH concentration in treatment water and e ~ g tissue in experiments where pre-spawn adult herring were exposed to oil-contaminated water [ 1994) or where herring eggs were exposed directly to oil-contaminated water during incubation ( 1995). In the upper graph. H = high-oil treatment. M = mid-oil treatment. L = low-oil treatment. and T = trace-oil treatment. In the lower graph. H,,, = observed concentrations i n 1994 reg tisue (high-oil treatment) and H,,< =concentrations in 1995 egg tissue ialso high-oil treatment). Tissue concentrations in mid- and low-oil treatments of the 1995 study were estimated from uptake in the high-oil treatment lest M and est L. respectively). The relatively slow. linear decline of PAH in 1994 eggs may have been an experimental artifact (see text), thus a hypothesized I994 decline (H, ) has also been included.
c o m p o s ~ ~ i o n o i PAH i n ulrectly espo\wl c f ~ s tended IO h e hlrnllar Io that i n \Later. ;Ind ;dthouzh there was a tendency tor i1;lphthalene enrlchmenr. this enrichment was not 3s pronounced as In 1994. Consequently. eggs exposcd directly t o hydrocarbon\ d u r ~ n s incubation contalned higher percentages of larfc r ~ n s compounds rhan did indirectly exposed eggs. Furthermore. percentages o f 1 q e tnn? compounds 111 directl? exposed e z z s increased durinf Incubation. and percentages o f alkyl-substltuted compounds were greater In 1995 than 111 IO94 (compare Appendices 3.3 and 4.4. I ) .
.-inother d~fference hetwecn 1994 and I W S experiments was PAH conce~l t r ;~ t i~n in eggs. (Data collection was restricted to the hifh-oil treatment i n both years.) In 1994. concentrations were maximum at the begrnning of the Incubation. ; m i declined throuchout (Figure 3. I I]. In 1995. concentrattons increased throughout incubation. then declined when egzs were transferred to clean water on day 16 (Figure 3.1 I I . Apparent concentrations were equal on day 3 ;~nd ilpproximately equal on day 25 . Peak concentrations in 1995 were twice those in 1994. The relatively slow. linear. concentration decline in 1994 may have been an artifact of incuhation conditions: the rate o f decline i n q g s on ?lass slides was pl-obablv much more rapid. In both years. spawn density of ezgs collected tor hydrocarbon analysis w x much higher than hpawn density of eggs followed for biolofic;ll observation. particularly in 1q94. Additionally. the 1994 uptake eggs were spawned in shallow pans. thus water circulation was likely significantly reduced compared to the 1995 uptake eggs. which were spawned on plankton net and suspended from mobile overhead racks much as other eggs were. We therefore suspect the true loss of hydrocarbons from eggs studied for biological effects in 1994 was exponential. much as in 1995, and may have approached baseline within roughly 15 d. Irrespective of loss rate adjustment. average concentrations in high-oil treatment eggs in 1995 were greater than those in 1994, and were p a t e r than I994 concentrations for the majority of incubation.
Determination of the relative importance of PAH composition and concentration as C ~ L I X S o f differences i n biological response between years was difficult because of uncertainties 111 true oil loss rares ( 19941 and because hydrocarbon c o I I ~ c t ~ o n s were limited to the hizh-oil treatment in 1995. To understand the ~mportance ot PAH concentration. i t appeared reasonable to compare the highest 1994 treatment :\pinst lower oil tremnents i n 1995. Thus. PAH concentrations i n 1995 low- and mid-oil treatment eggs were roughly approximated from the high-oil uptake data by applying calculated biomagnification at each observation time to the other treatments (Figure ?.I I). Assuming. for the moment. that 1994 loss l-ates were ;Iccurate. we find that mean concentrations in the 1994 high-oil ezgs (5.185 pph) were somewhat greater than in the mid-oil eggs in 1995 (3.668 ppb). hut that peak concentrations were highly s~milar (6.7 I9 and 6.049 ppb. rcspectively). This scenario suggesrs that PAH concentration 111 ezgs in the 1994 high-oil treatment was roughly equivalent to that In the 1995 mid-oil treatment. and implied that differences in PAH composition were primarily responsible for differences in biological response. (Recall that some biological responses were significant in the low-oil treatment in 1995. and all responses were significant i n the mid-oil treatment.) If. on the other hand. we dispute the 1994 hydrocarbon loss rate data. and assume loss rates were similar to those in 1995. the recalculated 1994 mean concentration becomes 1.335 ppb. intermediate to
111osc In I995 low- and mld-oil tl-atlnents: peak I994 icmcentr:1t1m euccedcd the c.sllm:ltcd low oil peak concentration ( 1.435 ppb) h! ;I rubstanllal nxirgin Thus \re estin1;lte that concentcltions ill low- and mid-oil treatment K Z ~ S i n 1995 bracketed those high-oil tl-eatlnent egzs In 1994, and conclude that differences i n PAH composlrion were likely a Inore important factor- than concentration i n causing differing hioIoZ1cal responses. There W;IS some evidence (C;Irls et a]. Chapter 4) that biomagnification increased as a function of treatment. thus PAH concentrations in low- and mid-oil treatments i n l99S may have been overestimated. The smaller the 1995 concentrations were relative to I994 concentrations. the more likely differences i n biological response were due to differences i n composition rather than i n concentration.
Comparison of herrins eggs Indirectly and directly exposed to hydrocarbons supports the hypothesis that toxicity varies LIS a functlon of ring size and alkylation. In this study. PAH concentrations up to 58 pph PAH !in water) did not evoke biological response i n progeny. but when eggs were exposed directly to the same compounds during incubation. responses were detectable at PAH concentrations as low :IS 9 ppb (Carls et 31. Chapter 4). When incubating eggs were exposed to more highly weathered o i l . where the proportion of large-ring and alkyl- substituted compounds was even greater. bignificant biological responses were detected at 0.2 ppb (Carls et al. Chapter 41. !Our minimum effective PAH concentrations may be high: they represent initial concentrations. and do not account for Zenerally rapid declines i n exposure concentration.) Previous studies have shown that much larger concentrations of mono- and di- aromatic hydrocarbons are required to cause toxicity. For example. i n tests where herring eggs were incubated i n the WSF of Cook Inlet crude oil (82% mono- and 18% di-aromatics). slgnificant reduction in hatch was observed at 1.400 ppb but not at 1.000 ppb (Rice et al. 1987: data were reanalyzed with authors’ permission). In contrast. we observed significant reduction in hatch (inverse of increase i n dead eggs) at concentrations as low as 9 ppb for highly weathered o i l (Carls et al. Chapter 4). Similarly. part-per-million concentrations of WSF were necessary to cause toxic effects in adult and larvd herring (Carls 19871. well above the part-per-billion concentrations effective i n these studies.
Concludine remarks
The reproductive implications of shifts towards naphthalene and unsubstituted P 4 H homologs in gametes of exposed adult herring are that gametes are protected from the more toxic PAH. This protection may be a consequence of differing aifinities of hydrocarbons for lipids or other tissue components, perhaps mediated by gradients in blood plasma. However. metabolic action may have also been a factor: MFO enzyme activity was induced i n adult fish (Thomas et d . 1997).
We have shown that short-term reproductive effects as a Iresult of exposure of pre-spawn adult herring to water contaminated with oil. as occurred i n PWS after the spill are unlikely. Progeny of adult herring that were exposed to oil during migration t o spawning grounds. or as they spawned intertidally. were probably not affected by this exposure. Our results d o not exclude the possibility of longer-term damage to proseny of contaminated adults. but
hypothetical 1necI1~1111snns for iiel.l!eii erfects .ire difficult to d r v ~ w (knetic &ma, ''1' \ \ ; I \ not detected 111 \omatic tissue. hence we huspect that I t \v:is unlikely i n [reproductive tissuch. However. available data suggests that the st~scepttbilities of these twn tissue types i n vertebrates is [not equivalent. thus lack o f s e n e t ~ c rft'cct i n mmatic cells does lnot guarantee sermiinc response. Hydrocarbons depurated from q ~ s durlnz inculx~tion. thus prolonged retentlot1 of biologically bisnificant hydrocarbon concentrations beyond hatch w a s also unlikely.
We have also shown that direct exposure of herring eggs to oil during incuhatlon I S
detrimental to developing embryos. In stark contrast t o the lack of response observed ,IS ;I result of gamete exposure. ,Mechanisms leading to the abnormal herring larvae in PWS following the \pill (Norcross et al. 19961 were. therefore. probably due to exposure of eggs during incubation. or possibly exposure o f larvae to oil (but direct larval exposure to similarly weathered o i l has not been studied). It is also possible that exposed gametes were spawned in oiled areas. t h ~ s adding to total toxicant exposure.
CONCLUSIONS
judged by egg fertility and mortality and subsequent normal development. Exposure of reproductively ripe parental herring did not measurdbly damage ymetes . L I S
The least toxic PAHs preferentlally accumulated in ovaries. and were transferred to eggs. Accumulation was strongly biased toward naphthalenes, and, of the few large ring PAHs detected, there was a tendency to accumulate unsuhstituted homologs.
I n sharp contrast to lack of biological response in progeny to exposure of adult herring to oil. direct exposure of herring eggs to o i l during incubation is detrimental to developing embryos.
Effects of exposure of reproductively ripe herrins to oil i n water were not discrrnable i n progeny. Somatic genetic darnage was [not detected i n Iarvx. hencr \+e conclude that developins rcproductive tissue will not be genetically damaged.
.ACKNOWLEDGILlENTS
We thank Lori Ewing. Josie Lunasin. Anita Martin. and Bob Stone for technical ;tssistance. Carrita Morris for data entry. and Scott McAllister for collection of herrins. We thank Larry Holland. Marie Larsen. and staff for the excellent quality hvdrocarbon ~nalyses. We thank Jeff Short for the original desizn of the toxicant delivery system The research described in this paper was supported by the t l l - r o r l Vrdtlr: Oil Spill Trustee Council. However. the tindings and conclusions presented by the cluthors are their own. and do not necessarilv retlect the view o r position of the Trustee Council.
LITERATCRE CITED
.Aitchiwn. J . 1986. The \t;ltlsticaI : I I ~ ; I I ! , S I ~ ~ ) I~o111p~~~i t1011;1I dat:l. l l o n o p p h h 011 Stat ist ics and .Applied Probability. Chapman .~nd Hall. New York. 416 p.
Brown. E.D.. T.T. Baker. J.E. Hose. R.M. Kocan. G.D. .Mart). M D . .McGurk. B.L. Norcross. and J.W. Short. 1996. Injury t o the early life history stases o t Pxific herrins in Prince William Sound after the E.~..rorl \'dde: oil spill. Pp. 448-462 i r l S.D. Rice. R.B. Spies. D.A. Wolie. and B.A. Wright (rds.]. Proceedings of the L~Y.YO~I Vtrldr: Oil Spill Symposium. American Fisheries Soc~ety Symposium Number I X . .American Fisheries Society. Bethesda. Maryland.
Ca~ds. M.G. 1987. Effects of dietary and water-born o i l exposure o n larval Pacific herring ( C / ~ r p e c ~ klrer~,q~r.s p e r i l u s i ) . Mar. Environ. Res. 22(4i:253-270.
Carls. M.G.. G.D. Marty. T.R. Meyers. D.E. Hinton. R.E. Thomas. and S.D. Rice. Chapter I . Immune function. disease. and mortality in pre-spawn Pacific herring (Clrrpen p c d l m i ) exposed to weathered crude oil
Carls. ,M.G.. D.M. Fremgen. J.E. Hose. S.W. Johnson, and S.D. Rice. Chapter 4. Effects of
Hose, J.E., M.D. McCurk, G.D. Marty. D.E. Hinton. E.D. Biggs and T.T. Baker. 1996. incubating herring (Clrcpe~ p / / ( r , s i ) eggs i n water contaminated with weathered crude o i l .
Sublethal effects of the E.r.ron Vcr/drz oil spill on herring embryos and larvae: morphologic. cytogenetic. and histopathological assessments. 1989-1991. Can. J . Fish. Aquat. Sci. 53:2355-2365.
Hourston. A.S., H. Rosenthal. and H. v o n Westernhagen. 1984. Viable hatch from eggs of Pacific herring (C/rrpw /~c~r .c r~g~r ,s [ J d / c l , Y i ) deposited at different intensities on ;I variety oi substrates. Can. Tech. Rep. Fish. ;\quat. Sci. 1274. I9 p.
Humphrey. E.C.. J.B. MarIia\,e. and D.I. Kent. 1995. .Clorpholog~cal stasins o f 1;Irv:iI Pacific herring. Pp. 207-217 i r r D.E. Hay and P. B. ,McCarter [eds.]. Proceedings ot' the Seventh Pacific Coast Herring Workshop. January 27-2s. 1994. Cm. Tech. Rep. Fish Aquat. Sci. No. 2060. Nanaimo. British Columbia.
Kocan. R.M., J.E. Hose. E.D. Brown. and T.T. Baker. 1996. Pacific herring (C/rcpecr [ x r / h s i ) embryo sensitivity to Prudhoe Bay petroleum hydrocarbons: Laboratory evaluation and i r ~ sirrr exposure at oiled and unoiled sites i n Prince William Sound. Can. J . Fish. ;\quat. Sci. 53:2366-2375.
Linden. 0. 1976. The influence ofc~-ude 0 1 1 and mixtures of crude oll/dispersants o n the ontogenic development o f the Baltic herring. Cl~rpew i ~ c r r - e r l q ~ t , ~ rr~er~rhrer.s L. ;\mbio 3 3 ) : 136- 140.
9 I
Pearson. W.H.. D.L. Woodruff. S.L. Kiesser. G.W. Fellin:ham. and R A Elston. 1985. Oil effects on spawning behavlor and reproductlon i n Pacific herring (Clrtprr~ htlrrrrv1t.s p ~ r k ~ i ) , Final Report t o Amer. Petrol. Inst.. Bartelle Marine Res. Lab. Sequim. Washington. OF-1742. .\PI publication No. 4412. 108 p.
Rice. S.D.. J .W. Short. and J.F. Karinen. 1977. ,A review of comparative oil toxicity and comparative anim;ll sensitivity. Pp. 78-94 i r r D.A. Wolfe led.], Fate and Effects of Petroleum Hydrocarbons 111 .Mal-ine Organisms and Ecosyhtems. Pergamon Press. Ne\ \ York. 478 p.
Rice. S.D. 1985. Review: etfects of oil on fish. Pp. 157-182 it1 F.R. Enselhardt Ied.1. Petroleum Effects in the Arctic Environment. Chapter 5 . Elsevier Applied Science Publishers. New York. 781 p.
Rice. S.D.. M.M. Babcock, C.C. Brodersen. J.A. Gharrett. and S. Korn. 1987. Uptake and depuration of aromatic hydrocarbons by reproductlvely ripe Pacific herring and the subsequent effect of residues on egg hatching and survival. Pp. 139-154 i r ~ W.B. Vernberg. A. Calabrese. F.P. Thurberg. and F.J. Vernberg [eds.]. Pollution Physiology of Estuarine Organisms. Belle W . Baruch Libr. Mar. Sci. 17. L'niv. ofS.C. Presh. Columbi;l. South Carolina. 545 p.
Rosenrhal. H.. and D.F. Alderdice. 1076. Sublethal etfects ofenvlronmental m x s o r s . !natural ;~nd pollutional. on marlne lish rfss and I x w e . J . Fish. Re\. Bd. Can i3:2017-2065.
Short. J.W.. and P.M. Harris. 1996. Petroleum hydrocarbons in caged mussels deployed i n Prince William Sound after the E.\-.YoJI l ' t r l r i c~ o i l spill. Pp. 19-39 i r r S.D. Rice. R.B. Spies. D.A. Wolfe. and B.A. Wright [eds.], Proceedings of the E . w m Vcride.- Oil Spill Symposium. American Fishel-ies Society Symposium Number 18. American Fisheries Societv. Bethesda. ,Maryland.
Short. J.W.. T.J. Jackson. M L . Larsen. and T.L. Wade. 1996. ,Analytical methods uscd for the analysis o t hydrocarbons ~n crude oil. tissues. sediments. and seawater collected for the Satural Resources D a m q e .Assessment of the E.Y.Y~J!I I.'trlde: o i l spill. Pp. 140-148 i n S.D. Rice. R.B. Spies. D . A Wolfe. and B.A. Wright [eds.l, Proceedings of the E~v-xorr
\'o/d~ O i l Sp11l S!lnposltln,. .AmcI-ic;in Fishel-ies Soc~er ! Symposlunl Number I S . .Americ;~n Fisheries Society. Bethesda. 41aryIand.
Short. J .W.. and R.A. Heintz. In press. I d e n t ~ f i c ~ t ~ o n o f E.v.voj1 \ . ( l / c / ~ : o i l i n scdimenrs and ~ I S S L I ~ S tl-orn Prince William Sound and the northwestern G u l f of ?\laska hased o n PAH weathering. Environmental Science and Technolozy.
Snedecor. G.W.. and W.G. Cochran. 1980. Statistical Methods. 7th Edition. The Iowa State Cniversity Press. Arnes. Iowa. 507 p.
Stevenson. J.C. 1962. Distribution and survival of herring larvae (Cllrpetl / J ~ L / / ~ ~ . Y I Valenciennes) i n British Columbia waters. J . Fish. Res. Bd. Can. 19(5):735-810.
Taylor. F.H.C. 1964. Life history and present status o f British Columbia herring stocks. Bull Fish. Res. Bd. Can. 143. 81 p.
Thomas. R.E.. M.G. Carls. S.D. Rice. and L. Shagrun. 1997. Mixed function oxidase induct~on in pre- and post-spawn herring (Chpecl p c l / L l s i ) by petroleum hydrocarbons. Comparative Biochemistry and Physiology 1 16C: 141-147. [Chapter 2, this report]
Velleman. P. F.. and D.C. Hoaglin I98 I . Applications. basics. and computing of exploratory data analysis. Duxbury Press. Boston, Massachusetts. 354 p.
OTHER REFERENCES
McGre~or. A. Personal communication. Alaska Department of Fish and Came. CF'MD. P . 0 Box 240020. Douglas. A K 99824-0020.
Chapter -I: Effects of incuhating herring (C[uperr pallasit eggs in water contaminated with weathered crude oil.
.ABSTRACT
Herring spawned i n Prince William Sound ( P W S ) a few ~veeks after the i9S9 E.~.wm V d d e z oil spill occurred. thus most or ; d l life stages rnay have been exposed. Genettc and histopathologlcal effects consistent with oil exposure were detected i n larval herring collected from oiled areas i n 1989. In the years tollowing the sp~ll. the herring population i n PWS collapsed. leading to speculation that the spill was directly or indirectly responsible. possibly through reproductive impairment by 011. In this laboratory study. designed to assess the potential impacts of the spill in PWS. herring eggs were exposed to varying concentrations of weathered .Alaska North Slope Crude oil (plus unexposed controls) for 16 d. ,Additional groups of eggs were exposed for variable amounts of time ( 0 to 8 dl. The ent~re experiment was irepealed tw~ce . first with hlgher polynuclear aromatic hydrocarbon (PAHI concentrations biased toward naphthalenes. and second. with lower concentrations biased toward heavier aromatics (e.g., phenanthrenes). In both experiments. exposure to oil induced early hatch. reduced hatching success, larval swimming, survival. and size. and caused edema. keletal. craniofacial. and finfold abnormalities. The frequency of chromosomal aberrations was significantly elevated in the pectoral fins of exposed larvae. E g s exposed to weathered oil during incubation were significantly affected by concentrations as low as 9 ppb. but effects of more highly weathered oil were significant at 0.2 ppb. susgesting the toxicity of the more persistent. heavier and more substituted PAHs was greater than that of lighter. less substituted PAHs. Exposures as short as 2 d elicited significant biological response. These results imply that relatively brief exposure to low concentrations of oil in PWS may have adversely aflected herring eggs spawned 111 oiled areas shortly lifter the spill. The implications of chrornosomal aberrations i n mitotic cells is not clear. It is likely most affected individuals died due to concomitant rnorpholozical abnormalities. hut the question of whether observed chromosomal damage could he herirable rern:uns unanswered.
INTRODUCTION
On ;March 24. 1989. the T/V Etworr li trlde: srountled in PWS. Alaska: the resultant oil spill was the largest in U.S. history. In the short-term aftermath of the spill. damage caused by oil was measured in severul species o f fish. including herr~ng, salmonids. and rockfish (Brown et d . 1996: Carls et al. 1996: Wertheimer and Celewycz 1996: Willette 1996: bleacham and Sullivan 1993). Herrins were .just besinninz to spawn when the spill occurred. thus Inost or all o f the life stages may have been exposed to oil (Brown et 111. 1996). Herring stock i n PWS may have been reproductively impaired hy the oil. and i t I S feared that continuiny long-lasting effects
94
i o ~ ~ l d hamper I-esto1-at1on ot the \tachs lh ;u have collapsecl \111ce the \pil l . The h e r n n ~ populatior collapse 111 PWS i n I Y93. poor rec~-uitment o f ~ u v e n ~ l e fish to the \pawning population. and a high incidence o f disease have raised concern that the oil hp111 directly o r indirectl! caused these delayed problems. Siyificant tissue ;dlet-atlons were ohserved i n adu l t herring collected i n oiled areas of PWS i n 1989 (Moles e[ a . l993i. ,uld about half ot the spawned hiornass \vas oiled (Brown et al. 19961. Esposure of herring eggs to petroleum hydrocarbons frequently results i n abnormal larvae with poor h u r v i v i potential (Linden 1976: Rosenthal and Alderdice 1976: Pearson et al. 1985: Kocan et al. 1996i. Herring larvae collected throughout PWS (May through July. 1989). exhibited conditions assoclated with oil exposure. including morphologic malformations. genetic damage. and small size (Norcross et al. 1996). Anaphase aberrations were elevated in the pectoral fins of herring embryos exposed to oil (Hose et al. 19961. riving some credence to the hypothesis that Ions term genetic damage was possible to the germ line. Because year-class strength is heavlly influenced by survival of herring larwe (Stevenson 1949: Taylor 1964: Outram and Humphreys 1974). contamination of pre-spawn adults. eggs. or larvae by petroleum hydrocarbons may have a n adverse impact on herring populations. At present. [recruitment failures i n herring i n PWS are llpparently continuing. and the standing biomass has decreased: the toxicological influence o f 011 on either is unknown.
Our god was to examine [he possibility or long term impacts of the s p ~ l l in PWS herring: this paper represents only part of the effort. The purpose of this particular study was to determine if genetic damage to early life stages of herring could he caused by exposure of eggs to oil similar in composition and concentration to that observed in PWS, and relate this damage to larval survival potential. Genetic damage was assessed by observation of anaphase-telophase aberrations in the pectoral fins of newly hatched larvae. Observation of genetic damage was confined to disruption of somatic cel l division. We assumed that disruption of normal somatic ~nitotic processes might reduce the potential of larvae to survive to reproductive age. Other !-elated studies investigated effects of oil exposure in pre-spawn adults (Curls et A . Chapter I : Thomas et al. 1997). gametes and progeny (Curls et al. Chapter 3 ) . and surveyed reproductive condition of herring ~n PWS herring six years after the s p ~ l l (Johnson c t al. In press^.
Specific experlmental objectives were a s follows: I i t o determine i f e s p o s ~ ~ r e 01 incubating herring eggs to oil would cause senetic defects 111 soma t~c cells: 21 to determine it' exposure of incubating eggs to oil would cause mortality. n1orphoIogical effects. behavioral effects. and changes i n hatch timin?: 3 ) to determine how much 0 1 1 W;IS required t o C;IUX
Yignificant effects. and how much exposure time was required belore significant response: 41 to quantify and characterize accumulation of hydrocarbons by eggs: and 5 ) to compare thc toxicity o f lighter PAHs with heavier PAHs.
METHODS
There were t w o C O I I S ~ C L I ~ ~ W esperiments. each tvlth ;I dose-series component I IO d ?sposuresl m d ;I time series component 1 0 . I . 2. 4. 8. and I6 dl :It ;I si11:le dose. Fertlle herring
Pre-\pawn herr~ng were collected f r o m t w o Iocatlons ~n wutheast Alaska. Herr~ng lor experiment one ( E I were collected neal- CLit Island (55.O"N lat.. I3 I .7"W long. 1 on .April I I . 1995. maintained on ice. transported t o Ketchikan. and artificially spawned. Fish for experimenr two (E?) were collected in Seymour Canal (57 .5"N lat,. l33.8"W long.) on ,May 13. 1095. maintained on ice, transported to Juneau. m d artificially spawned. Ovarian membranes were cut longitudinally and eggs were removed wlth a stainless steel spatula. From each female. eggs were deposited in a single layer on nine 25 Y 7 5 rnm glass slides placed at the bottom o t a shallow glass dish in ambient seawater. Deposition was accomplished with a gentle swlrling motion; approximately 100 to 150 eggs were deposited per slide. Eggs from each female were p l x e d in a staining rack and suspended in separate beakers of seawater. Milt was prepared from testes by cuttins sections lrom each of three contributing males Into small segments: se?ments plus a srnall amount of seawater were tnlxed w ~ t h ;I spatula. A tew milliliters o f m i l t were added t o each beaker. Eggs and milt rema~ned i n contact 5 m ~ n : eggs were removed and gently rinsed in seawater. Eggs were spawned within 3 0 m ~ n ot deposition. In both experiments. e::s from 21 females were fertilized in three separste spawning events: a total of 9 males conrributed sperm in each experiment. Fertilized eggs were incubated I d before experimental treatment.
Eggs were examined for fert~lization success within 5 d of spawning. Excess eggs were removed by scraping; eggs along slide margins and clumps of eggs where not a11 eggs were exposed to water were removed. Processing was accomplished in water with a minimum of emersion. Remaining fertlle. infertile. and dead eggs were counted.
There were some fertilization problems associated wi th the eggs used i n E l : lnlcm fertilizat~on rstes were genersllv above 65?r, but were pool- for S I Y females ( 17r+ t o 5 5 F ) . We wspect that this poor lertility w a s caused by excessive chilling hefore spawn~ng. Bec;~use previous experience indicated that bac t r r~a would overrun all c':zs when a high percentage o f eggs were infertile. we removed the r ~ g s from these six females from study. A11 ensutns resuits for E l refer only to the remain~ny 15 females (the aversge fertility rate was 80%). Fertility rates 111 E2 aversged 93'7r.
Water was oiled by contact w i t h o~ led rock: seawater tlowed into a plenum at the bottom ( 1 1 ;L 30-ctn diameter Y I ??-CIII polwinyl chloride platic cylindel-s and upwelled throuch rock [Appendix I . I ) . Water tlowed from these oil generators to the bottom of 40 t o 50 L individual treatment tanks: ;I trap inside the generator prevented slick overflow. Seawater tlow mtes were 6 Umin i n E l and 5 Umin i n E?. Water was delivered vi;l rnanifold to treatment tanks: one :enerator was used per dohe. Before the rock was oiled. A l ~ s k a Yorth Slope Crude oil was at-tificially weathered by heating t o 70°C overniFht ( 12 11) i n a beaker with continuous \tirring. Rock. approximately I - I I mm cMd@ = 5.2 mm. QLQ3 = 4.2 - 6.6 mm). w ; ~ s washed on 3 mm
rcreen and thorou~hly ;ur dried. .i cement 1111xcr IS cicallcd u l r t 1 wap and \c;lter ; I I I ~
thoroughly air dried. Weathered crude 0 1 1 . heated to 4O'C. \vas ;lppiied to 45 k? 0 batches of tumbling rock with a paint \prayer Itl-;lcc-. low-. and Inid-oil trearments) or with a Tellon squrrt bottle thigh-oll treatment). Each Fenel-ator was loaded with 45 kc of oiled rock lor non-oiled control rock). except the h ~ ~ h - o ~ l t1-eatme111 yxeratol- W;IS loaded w i t h YO k z rock.
P 4 H concentrations in watertO.01 ppb (control) to 87 ppb) were chosen to bracket maximum mean concentrations observed i n open water of PWS following the spill 16.74 ppb: Short and Harris 1996ai. ,At the beginning of treatment. and every fourth day thereafter. I to 3 replicate 3.8 L water samples were extracted from each dose for analysis by gas chromatography (Short et al. 1996) to characterize the oil and quantify treatment concentrations.
Eggs from each female were represented in each ol 9 treatments (control. trace-. Iow-. mid-. and high-oil. plus additional I. 2. -1. and 8 d exposures i n the mid-oil treatment). Eggs were first exposed to oil I d after fertilization. Exposure continued for a maximum of 16 d: time heries sroups were transferred to clean se;water at approprlate intervals. After 16 d. all remaining eggs were transferred to clean seawater. Eggs were isolated by female and treatment I d later: each slide was individually suspended i n a I L jar filled with seawater. Temperature was controlled by placing jars i n a tlowins seawater bath. To avoid oxygen depletion in water immediately surrounding the eggs. slides containing eggs were attached to mobile racks designed to cause slow movement through the water. Mean temperature was 5 . I 'C (4.0 to 6.7"C) i n E l . and 6 2 ° C (5.6 to 7. I "C) i n E2: estimated temperature increase over the entire study period was 0.0S"C.d~' . Mean salinity was 32 ? 0.3 ppt.
Lighting was natural. supplemented by overhead tluorescent light during daylight hours. Indirect natural light entel-ed through windows along one side: direct sunlight could enter only briefly at very low sun angles. To minimize naturi light. all experimental tanks were located away from the windows. Light levels were estimated with ;I GE type 2 I3 meter o n May 14. 1997: the sky was clear. The ~ l t ~ v i o l e t ( C V ) contribution \vas estimated by placlng ;I
p h o t o p p h i c UV filter (l'ristar number X730) over the l i y h t meter and recording the difference i n light intens~ty.
To more accurately estimate UV emission. a n intensity spectrurn for ;I tluorescent light was measured with a Perkin-Elme~- model 650-10s fluorescence hpectrophotometer. Thc spectrophotometer was operated at the lowest sensitivity setting with the light source oft': emission slit width was 2 nm. The standard sample cell was replaced with ;I small i 13.3 cmi tluorescence tube operated with weak batteries to minimize intensity. Area ~ lnder the intensity curve was measured for UV light ( 5 400 nm) and for visible light (400 to 750 nm): the EV contribution to total light energy \vas expressed as ;I percentage.
Dosing generators were covered with black plastic tops to cxclude light. Light could enter the ;.lass distribution manifolds. hut they were protected from direct light. and water flow lutes were high t5 to 6 L/rnin). further reducing the likelihood o f significant molecular excitation
Light illtensity r;ungcd t ro~n h to 7 0 tootc:undles innem .;I footcmdles) . tBb compurison. ;it the tlme of these measurements. outstde 11ght \\a\ 4.367 lootcandles. hut contributed only 7% o f light In the laboratory. I The estltnated CV energy was I6 2 I L"r o f the total energy. ;IS measured with the hand-held meter. Spectral output of the representative tluorescent rube was 14.4% UV (;\ppendix I .71. There \vet-e t \vo prominent L'V peaks. centered at 3 IS and 365 nm. The shorter wavelength L V peak \vas at the border ( 3 10 to 330 nm) of UV-A and UV-B wavelengths. and represented I .7% ot the spectral energy.
During peak hatch. hatch timinc 11nd success. larval viability. and larval abnormalities were observed daily. Duriny periods o f low hatch. observation frequency was reduced to two or three day intervals. and larvae were collected only if five or more were present per jar. Living larvae were assessed tor swimming ahllity and gross morphological deformities. anesthetized with tricaine methanesulfonate. and preserved i n 5Or hutfered formalin. Dead larvae were discarded. After hatch was complete. the rema~n~ny eygs and embryos were inspected and enumerated.
The swimming ability of live / ; w a e was categorized as effective. ineffective. or incapable. Effective swimmers were active. frequented the water column, and avoided capture Ineffective swimmers were generally more lethargic than effective swimmers, and were more likely to he found on jar bottoms. Incapable larvae were unable to swim in a straight line, and were often o n l y capable of spasmodic twitchin:.
Hydrocarbon uptake and depuration by e g y s was tneasul-ed by gas c h r o m a t o p p h y , Eggs from several females were \pawned on nylon plankton nettiny: q g density WLIS hiyh (often multiple luyersi and fertilized with m i l t ft-or several 111aleh. In E l . q g s were incubated i n the high-oil treatment o r clean seawater (controls) tor I t o i h d . .Approximately I O s samples were collected for hydrocarbon analysls attel- I. 2. 4. 3. and Ih d cxposu~-e. .Aftel- I6 d exposure. remaining eggs were transferred to clean water and sampled periodically (0.5. I. 2. -1. and 8 d ) u n t i l hatch. Control eggs were collected at similar frequencies. I n E?. uptake was measured for a11 [re;~t~nents after -1, S. and 16 d: In addition. esgs were \ampled from the mid-oll rrrmnent ;liter I and 2 d exposure. As they were collected. eggs were inspected visually for coating by oil: no evidence of coating was detected i n any tr-eatment (1111s obscrvxion was also recorded photoyraphically~.
For ~norpholufical ~neasurennent (total body length. yolk vcolume. and spinal curvature). five preserved larvae were randomly \LlbSampkd from each o f 15 o r 71 females i n each treatment croup. Lateral v ~ e w s were disitized with a video camera and a frame grabber. To minimlzr \.ariance. specimens were 1-otated to align ryes before image capture. Initial magnification varied from 6 or I2x for total length measurement to 50.r for yolk measurement. Total lenyth was
~ ~ x ~ s u r e d from snout to t l p ( I t I ~ O I O ~ ~ ~ O I - C I . tlhlng ;IS man! line ~ e p e n t s ;I\ necehsary 1 0
.Ipprosimate larval posture. Spinal curvature \v;~s est~mated from the 5;une line segments as the hum of I 180” - seynent ;1n?1e1. Yolk5 \\ere p l e r a l l y c.Ilipticd: the maJor UIS. defined ;IS yolk lencth. \vas measwed parallel t o the 1notoct1o1-d. m d the minor :ISIS. defined ;IS yo lk hetsht. was perpendicular to the body ;ISIS. Yolk volume was est~mated from length and height Inleasures according to Hourston et 2 1 . I I984). .Muscle width. measured tor staging purposes. was immediately dorsal to the yolk heisht measurement.
Edema and jaw size were scored from digital images. Yolk-sac edema was indicated if the anterior margin of the yolk membrane was bounded by un area of clear tluid. Pericardial edema was noted when the pericardial area was conves ventrally or had an unusually lar, me area. Jaws were classified as small i f absent or posterior to the anterior margin of the eye.
Genetic and additional morphologic responses were evaluated using blind review. The number of treatments thus analyzed was limited due to cost: I O larvae were randomly hubsampled from 15 randomly selected females. Each larvae was examined at 30X magnification. The severtty of skeletal. craniofacial. and finfold defects was scored ustng the zraduated severity index (GSI) method described in Hose et a]. ( 1996) where 0 = no effect: I = slight defect in structure or size: 2 = moderate defect in structure or size: and 3 = severe defect in structure or size. Types of skeletal defects evaluated were kyphosis or lordosis of the notochord and stunting. Craniofacial abnormalities consisted of reduction. malformation or absence of one or both jaws, ocular and otic capsule defects. and microcephaly. Reductions of the dorsal and ventral finfold were observed. The development of both pectoral fins was categorized as a bud (no fin ruys visible) or containing fin ruys.
Both pectoral fins were removed. placed onto a glass microscope slide. and stained with aceto-orcein. Cytogenetic analysis was performed at I .OOOX magnification using the method of Hose et ai. (1996). All mitotic figures i n a fin were enumerdted. and anaphase-telophase configurations (AT) were visually assessed for evidence of chromosomeichromatid breakage I hridges and attached frugments~. mult~polx spindles. and aneuploidy (unequal masses o f chromatin in daughter cellsl. The mttotic index was the IlUmbKr of mitoses per f i n . Thus. two mitotic indices were calculated per larva and were generally in good agreement. A n anaphase :lberration rate was calculated fol- each dose treatment by dividins the total number of aberrant ,AT by the total number o f AT present.
Data Drocessinz . and statistics
The denominator used to calculate percentages varied according to response type. Percentages of eggs fertile. infertile. and initially dead were based on the total number of eggs counted near the beginning of each experiment. Percentages of eggs that hatched or died were based on the total number of hatched larvae plus the number of dead eggs determined at the endpoint. The number of hatched la{-vae was subdivided into number alive. moribund. and dead. .Accordingly. percent alive was the number o f l ivins larvae (excluding moribund larvae) divided
The primary experimental design was a randomized block : I 5 or 71 females were represented in each of 9 treatment.s. All treatments (dose series and time series) were ;In;llyzed simultaneously with analysis of variance (ANOVA): where the overall test was significant. treatments were compared to controls with ( I priori multiple cornparlsons. Before analysis with ANOVA. percentage data were arcsin transformed, and corrected for small n where necessary (Snedecor and Cochrm. 1980). [The same general conclusions were reached with untransformed data]. In c;lses where multiple larval observations occurred for each female le.?.. larval lenzths). larvae were nested in female. I n xldition. time series data were analyzed with linear 1-egression techniques.
Scored abnormality data were either analyzed with the Kruskal-Wallis nonparametric test. or recoded to yield incidence of abnormality (e.3.. percent larvae with small jawl. If the overall P i n Kruskal-Wallis tests (SAS Institute. lnc. 1989) was significant. treatment groups were compared to controls using the Dunn multiple comparison procedure (Sigmastat 1994). Incidence of abnormality was calculated on a per female basis, arcsin transformed. and analyzed with single factor ANOVA: dose series and time series data were analyzed simultaneously. [Conclusions reached with either technique were similar. hut incidence data tended to detect smaller differences than scored datal.
Median effective concentrations tEC50) were estimated from logit fits by female I Y = ', initial PAH concentrationl: independently cstinxlted EC5Os were averaged. .Analyses were restricted t o cases where response In controls and highest 11-eatmrnts \panned 5O'?i.
Stepwise resression was used to test the influence ot morplloloslcal abnormalities on larval swimming ability. In this assessment. dose-series and time-series data from both csperirnents were combined. Predictive factors tested included incidence of spinal defects. y o l k - \ac edema, pericardial edema. and lower jaw size. Although jaw size probably did not affect swimming directly. it served as an estimator of maturation: immature larvae mizht n o t hwim as \vel1 as their more mature counterparts.
Hydrocarbon data were p~-ocessed according to the rnethods of Short et ; I I . I lc)cKii before furthel- analysis. Hydrocarbon concentrat~ons were accepted only i f corresponding recovery of deuterated internal standards ranged from 78 to 150%: records with unacceptable ~'ecovc'r~es were deleted (6% of the data). I n addition. concentrations belo\v minimum detection limits were set to zero (Short et a] . 1996).
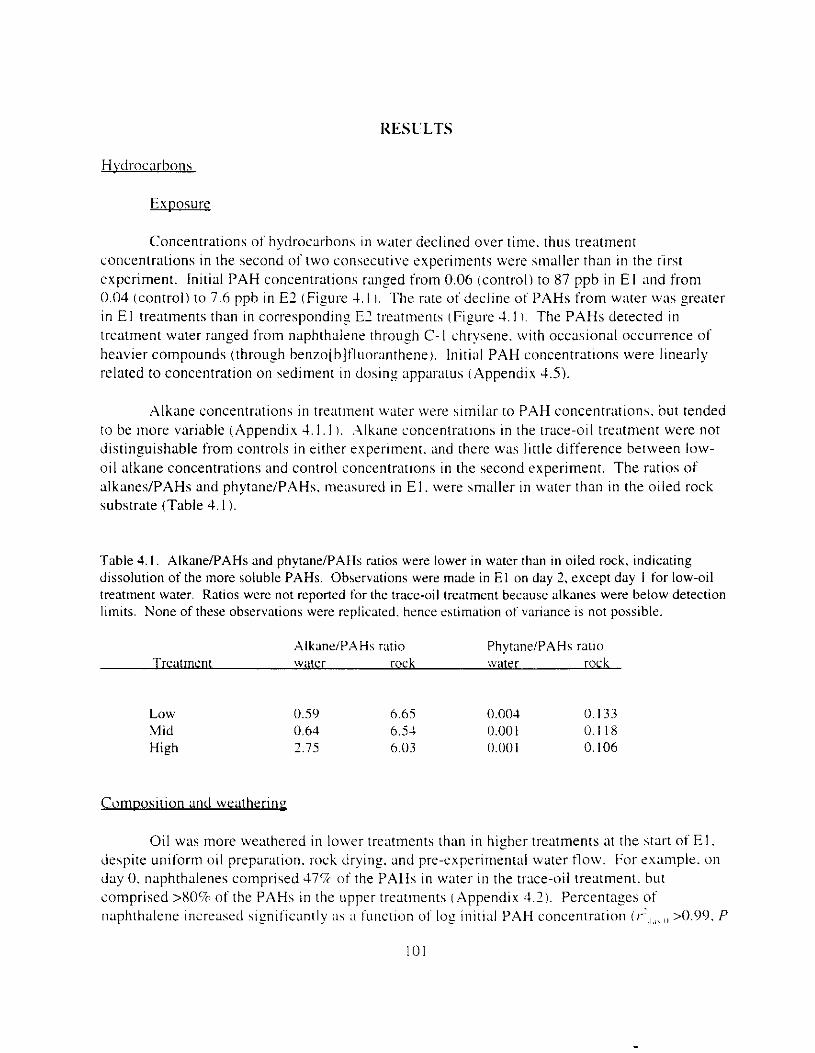
RESULTS
Hsdrocarbons
Exposure
Concentrations of hydrocarbons In water declined over time. thus treatment concentrations in the second o i two cor1secutive experiments were smaller than i n the first experiment. Initial PAH concentrations ranzed from 0.06 (control) to 87 ppb i n E l and from 0.04 (control) to 7.6 ppb i n E? (Figure 4. I I . The rate of decline o f PAHs from water was greater in El treatments than i n corresponding E2 treatments (Figure 4. I / . The PAHs detected in treatment water ranged from naphthalene throuzh C- l chl-ysene. with occasional occurrence of heavier compounds (through benzo[b]tluor3nthene~. Initial PAH concentrations were linearly related to concentration on sediment i n dosing ;~pparatus (Appendix 4.5).
Alkane concentrations i n treat~nent water were htrnilar to PAH concentrations. but tended to be more variable (Appendix 4. I . I ). .Alkane concentrations in the trace-oil treatment were not distinguishable from controls in either experiment. and there was little difference between Iow- oil alkane concentrations and control concentrations in the second experiment. The ratios of alkanes/PAHs and phytaneiPAHs. measul-ed in E l . were smaller i n water than i n the oiled rock substrate (Table 4. I ).
Table 4. I . AlkanePAHs and phytane/PAHs ratios were lower in water than in oiled rock. indicating dissolution of the more soluble PAHs. Observations were made in E l on day 1. except day I for low-oil treatment water. Ratios were not reported for the trace-oil treatment because alkanes were below detection limlts. None of these observations were replicated. hence estimation of variance is not possible.
AlkanelPAHs ratio Phytane/PAHs ratio ~ w' r
Low Mid High
Composition and weatherinx
0.59 6.65 0.004 0. I33 0.64 6.54 0.00 I 0.1 18 1.75 6.03 0.001 0. IO6
Oil was more weathered in lower treatments than in higher treatments at the start of E l . despite uniform oil preparation. rock dryin:. and pre-experimental water flow. For esample. on day 0. naphthalenes comprised 47% of the PAHs i n water i n the trxe-oil treatment. but comprised >XO% of the PAHs in the upper treatments (Appendix 4.1). Percentages of naphthalene increased hIgnificclntly ;IS ;I function o f log initial PAH concentration It',,,,\ ,, M.99. P
I 0 I
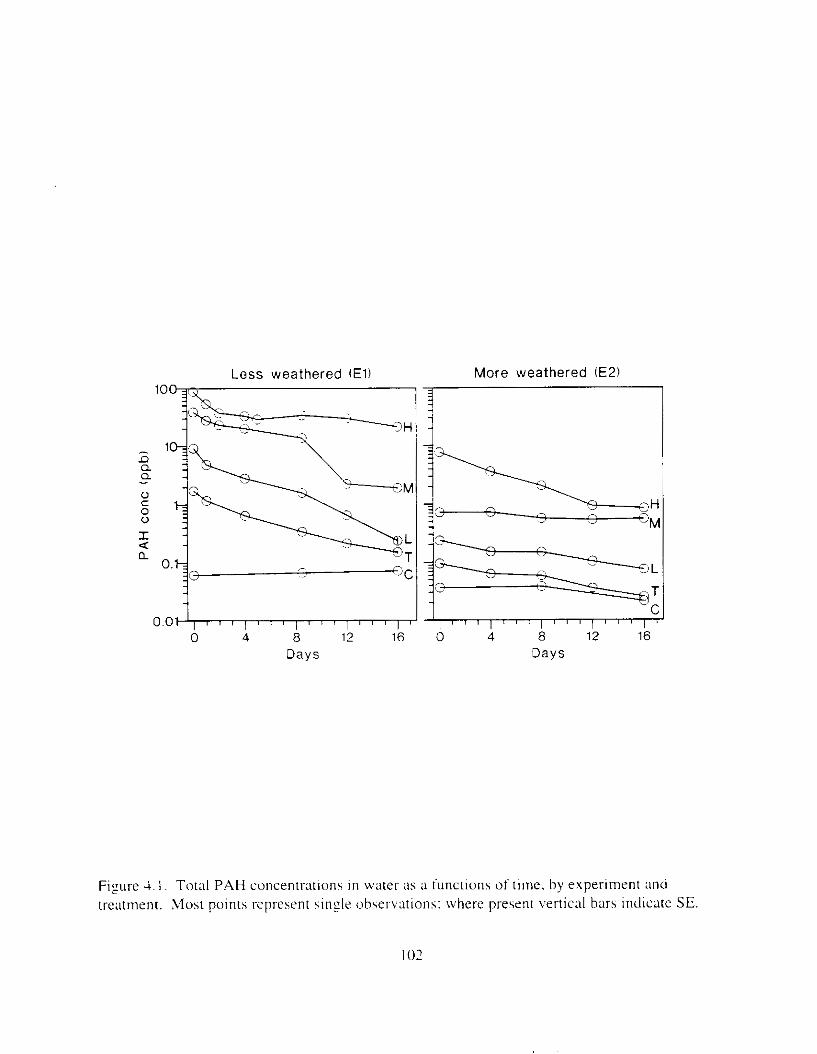
Less weathered (E l ) More weathered (E2)
0.0 0 4 a 12 16
Days 0 4 a 12 16
Days
Figure 4. I . Total PAH cwcentratlons in water as a tunctions ot t ime. by experiment and treatment. Most points Irepresent sinzle ohset-vations: whet-e present vertical bars indicate SE
IO2
= i l .042) (Figure 4 . 2 1 . Conversel>. 1 x 1 - c c n t a p o ~ p h r n a n t h r e n e ~ ilcclined sl~nll'icanti! a h ;I
tunctlon o t log initial PAH concentr;ltlorl ~ r ~ , , ~ ,, >O.W. P = 0 . 0 3 3 ) I F i p r e 1.21. Percentazes ot chrysenes ~11so declined a h ;I functlon o f inltial P.4H concentratio11 (!',:,,\,) > 0.99. P = 0.0131 !Fiyure 4.21. These composition - treatment relationships persisted over the first 12- 16 d of treatment. Relationships between tluorenes and inital concentrution. and dibenzothiophenes and initial concentration. were not as clear (Figure 42i . and varied with time.
In contrast to the composltion Irelationships observed in water i n E I . the relationship of most homologous PAH families and initial PAH concentration in E? was not clear: relative quantities of naphthalenes. tluorenes. dibenzothiophenes. and phenanthrenes either peaked or were depressed in intermediate treatments (Figure 4.3). Only chrysenes exhibited ;I relationship with treatment: percentage declined as ;I function o f - I /PAH ( r ' , , , , , , , = 0.99. P = 0.05) (Figure 4.3) Chrysenes remained related to initial PAH concentration in similar tashion through the 16 d exposure.
Relationships between PAH composition and concentration i n the rock substrate used to prepare treatment water were similar to those observed i n E l treatment water !Appendice 4.4. I m d 4.4.7). The percentage of naphthalenes increased as concentration increased: percentages of tluorenes. dibenzothiophenes. phenanthrenes. and chrysenes declined with concentration increases. However. few measurements were taken (five). and these were completed on a single day.
Up to this point. PAH composition has been presented on a relative basis. Ln terms of absolute concentration. total naphthalenes. tluorenes. dibenzothiophenes, and phenanthrenes concentrations in El consistently exceeded those in E?. but for chrysenes. the situation was generally reversed (Appendix 4.3). However, concentrations of the more substituted compounds within homologous families i n the high-oil treatment were generally yeater in E2 than E l : these included C3-tluorenes (days 0-8). C3-dibenzothiophenes (days 0.8). C3- and C4-phenanthrenes (days 0-81 (Appendix 4.31. Concentrations of all chrysenes in the lhigh-oil treatment of E2 were consistently greater than In E l , except no C4-chrysenes were detected. Additionally. C3 and C1- phenanthrene. and C k h r y s e n e concentratlons in the mid-oil treatment of E2 frequently exceeded those i n E 1 .
The oil weathered with time in both expel-iments: trends observed i n El generally continued through E2. Described linearly. percent naphthalenes declined with time ( P < 0.001): percentages of tluorenes. dibenzothiophenes. phenanthrenes. and chrysenes increased with time (P < 0.001) (Figure 4.4). Data from both experiments were analyzed together. with ;I I d offset between experiments. Rates of change over time frequently differed among treatments. and fitted lines were generally not coincident. Correlation of percentage naphthalenes. phenanthrenes. and chrysenes with time (0.61 s I-' < 0.90) was generully better than that of lluorenes and dibenzothiophenes with time IO. I? I I-' .I 0.87). Weathering in the trace-oil treatment was not analyzed because of marginal analyte detectability.
I03
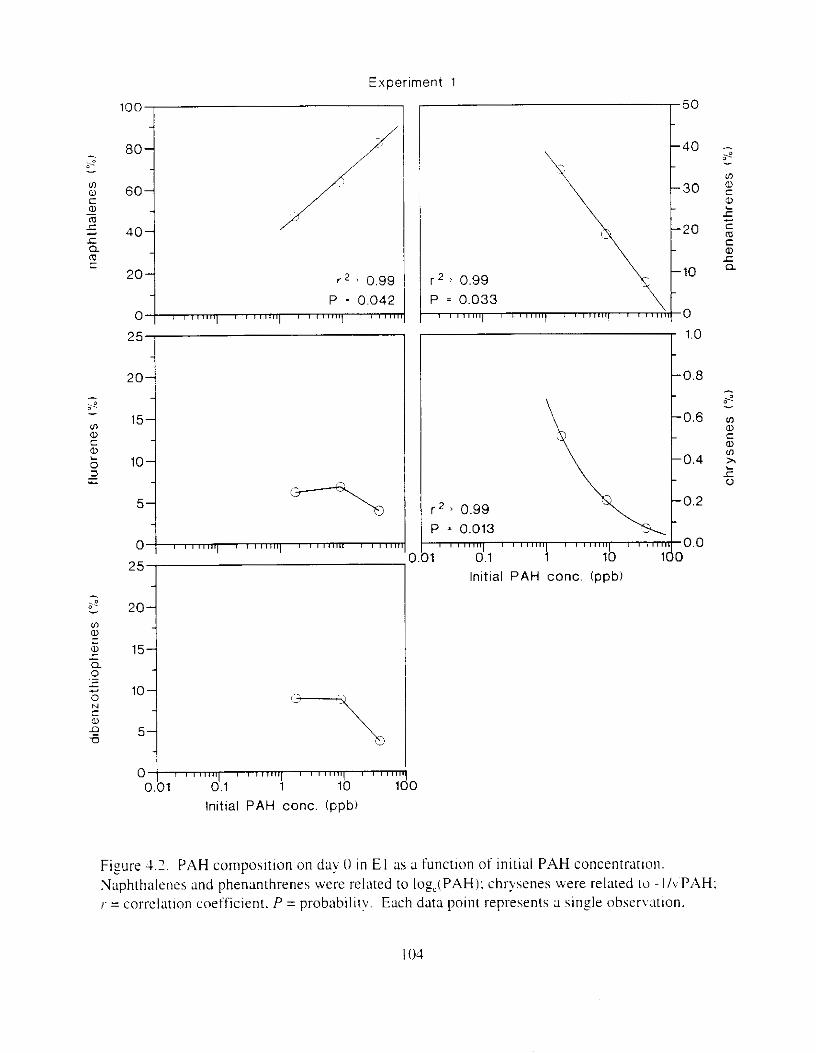
Expertrnent 1
100 50 - -40 -
,--"
30 2 5
- (I)
C
m 8 Q m C
a, 2 20 : 5 40
C a, .c
20 r 2 3 0.99 r 2 0.99 10
P = 0.042 P = 0.033 0 0
25 1.0 -
20- -0.8 - - - I
;: - 15-
3 5- - 0.2 r
, , , , , , , , , / , , , , ) , ;.; -
s -0.6 v)
- (I) a, c
a, C a, Ul 2
0 10- 0.4 - I
r * 0.99 P - 0.013
0
0 I ' """'I ' """'I ' ' ' ' ' ' T 1
25 -- 0.0
0.01 0.1 1 10 1 0 Initial PAH conc. (ppb) - -
_ o "' 20-
? - 15- Q -
(I)
a, .c
0 .-
5 10- 0 N C m G 5- D 1 ' z 7
0 1 ' """'I ' """ ' 0.01 OI. 1 1 10 100
initial PAH conc. (ppb)
Figure 4.7. PAH composltlon on day 0 in E l as a functlon of initial PAH concentratlon. Naphthalenes and phenanthrenes were related to log,(PAHI: chrysenes were related to - IivPAH: I' = correlauon coefficient. P = probability. Each data p i n [ represents ;L sinsle observation.
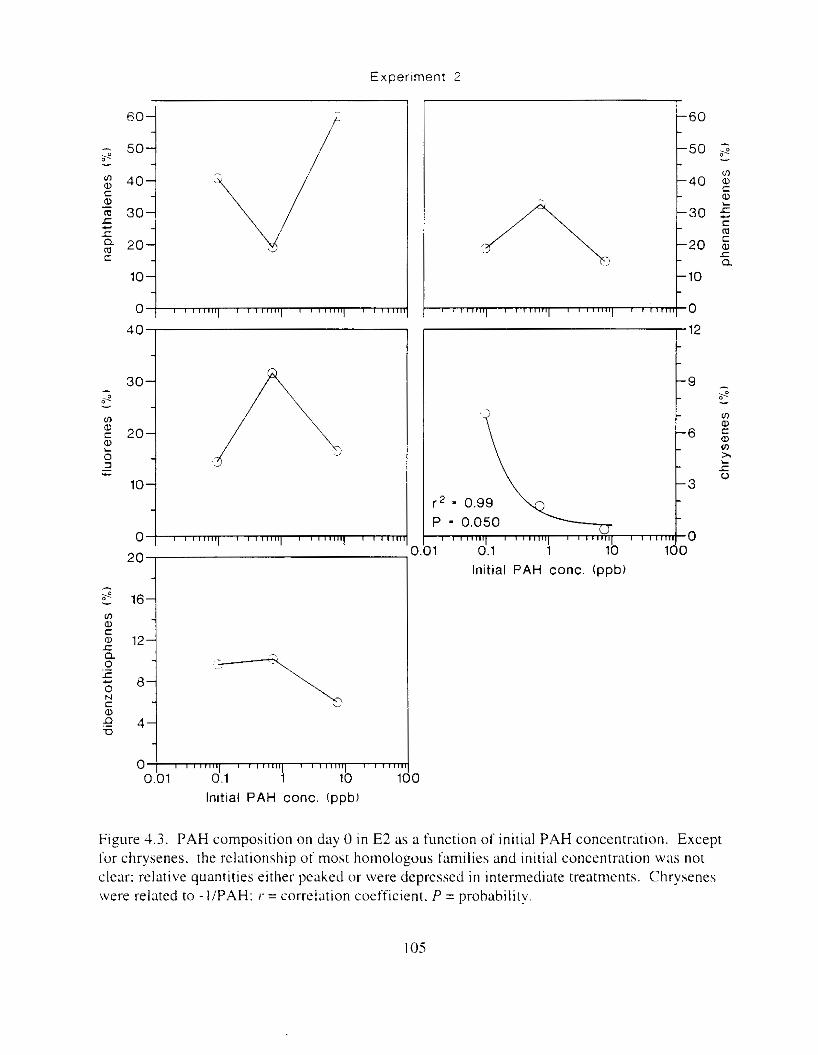
Experiment 2
L"
- - e 16- Y) a,
S
C
0
al 12- a
5 8- 2 C a,
U 0 4-
0 0.01 d . 1 1 10 1
lnltial PAH conc. (ppb)
1 , , ,,,i:' 0
1.01 Initial PAH conc. (ppb)
Figure 4.3. PAH composition on day 0 in E2 as a function of initial PAH Concentration. Except for chrysenes. the relationship of most homologous families and initial concentration was not clear: relative quantities either peaked 01- were depressed i n intermediate treatments. Chrysenes were related to - IIPAH: r = correlation coefficient. P = probability.
I os
Hydrocarbons accumulated i n esposed eggs i n both experiments. but tnaxlmunl concentrations were m a i l e r i n € 2 . and there were differences in accumulation patterns. In E l . PAH concentrations In egg tmue increased throughout exposure and peaked at 13.746 ppb (high- oil treatment) on day 16. Hydrocarbons depurated exponentially from egg tissue when contaminated eggs \\ere transferred IO c l c m \ v a t u I Figure 4.5). I n E2. PAH concentr;ltlons i n eggs accumulated durlng the tirst 4 d o t ~ s p o s u r e . but declined thereafter tFizure 4.5).
Bioconcentration was difficult to estlmate because o f declining PAH concentr;rtlons in water and variable concentrations in tissue. Mean estimated bioacculnulation in E l was -106 times (range 157 to 643). determined by varying the estimate of water concentration (mean. initial. and 16 d concentrations, respectively). Estimated bioconcentration in E2 was 157 (19 to 335) times the aqueous PAH concentration (summarized across time and treatment).
Composition o f PAHs i n egg tissue tended to chanze i n ;I manner similar to that in water in E I , but at a slower rate: there was no evidence o f consistent cornposition change in E2 eggs. I n E l eggs, naphthalene percentages trndcd to decline lineurly if = i1.104i. while slopcs o f Iheavier co~npounds increased (0.001 P 0.236 for other lhomologh~. Rates of change were :It
least twice as t 3 t in water ;IS in tissue ( 2 . 3 ~ p\\, p, ~~ 86.4. where p,,, = rate ofchanze i n water. and 0: =rate o f c h m g e i n egg tissue. est~mc~ted l inexly lor each homologous chem1c;ll family). I n E2 egg\. virnatton in composition \V;IS unl-elated 10 ttrne 10.214 ~ P ' 0.961 rsccpt P = 0.083 for chryscnes i n the hizh-oil treatment).
Compared o n a per treatment husls. compo\lLion n t PAHs i n csgs differed siglt icantly between the two experiments. (Because ot limited sampling. the only possible inter-experiment comparison was the high-oil treatment. I Data from days 4. 8. and I6 were grouped 1 hy experiment1 and analyzed by .ANOVA. This combination oi times \\ab treasonable because the r x e of change in PAH composition i n eggs was small i n E l (0.01 < Ip,l 5 0.14 % d ~ ' 1 or unrelated to time (E:). The percrntaze of naphthalenes \vas significantly p a t e r i n the first experiment (85%) than i n the second i-197r) i P < 0.001 i. Thus. percentages of heavler compounds i tluorenes. dibenzothiophenes. phenanthrenes. and chrysrnes) were conststently highet- In E2 than i n E l i P c 0.0141 (Appendis 4.4.1 ~ l n d 4.4.41.
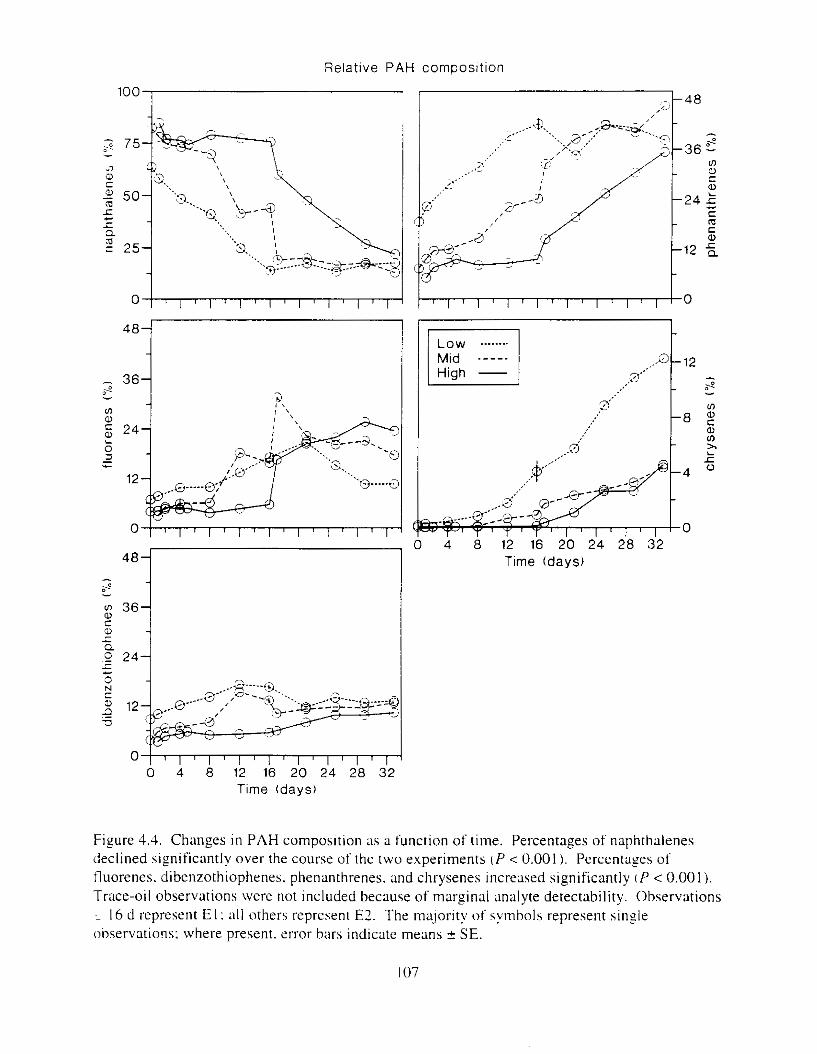
0 4 8 12 16 20 24 28 32 Time (days)
Figure 4.4. Changes in PAH composition as a function of time. Percentages of naphthalenes declined significantly over the course of the two experiments ( P < 0.001 ). Percentages of tluorenes. dibenzothiophenes. phenanthrenes. and chrysenes increased significantly iP < 0.001). Trace-oil observations were not included because of marginal analyte detectability. Observations L I6 d represent E I : d l others represent EZ. The majority of symbols represent single observations: where present. error bars indicate means SE.
I07
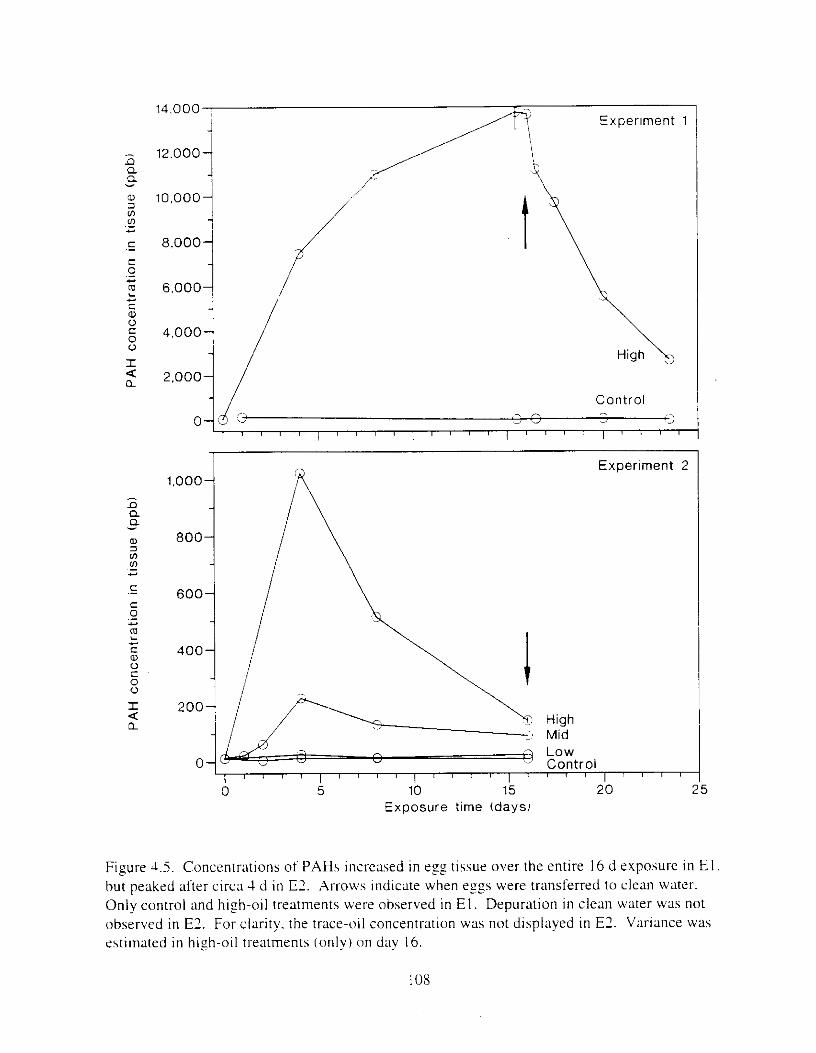
14,000 , J
I Experiment 1
12,000
10.000
8,000-
High I,
2 ,000 Control
'3
Exoerlment 2 Experlment 2
/ " " l " " l " " l " " ~ " " 0 5 10 15 20
0 " I " " l " " l " " l ' 0 5 10 15
Exposure time (days)
High Mid Low Control
I " ' / 20 2 5
Figure 4.5. Concentrations of PAHs increased in egg tissue over the entire 16 d exposure in E l hut peaked after circa 4 d in E?. ,Arrows indicate when eggs were transferred to clean water. Only control and hizh-oil treatments were observed in E l . Depuration i n clean water was not observed in E?. For clarity. the trace-oil concentration was not displayed in E?. Variance was estimated i n hish-oi l treatments ( o n l y ) o n day 16.
IO8
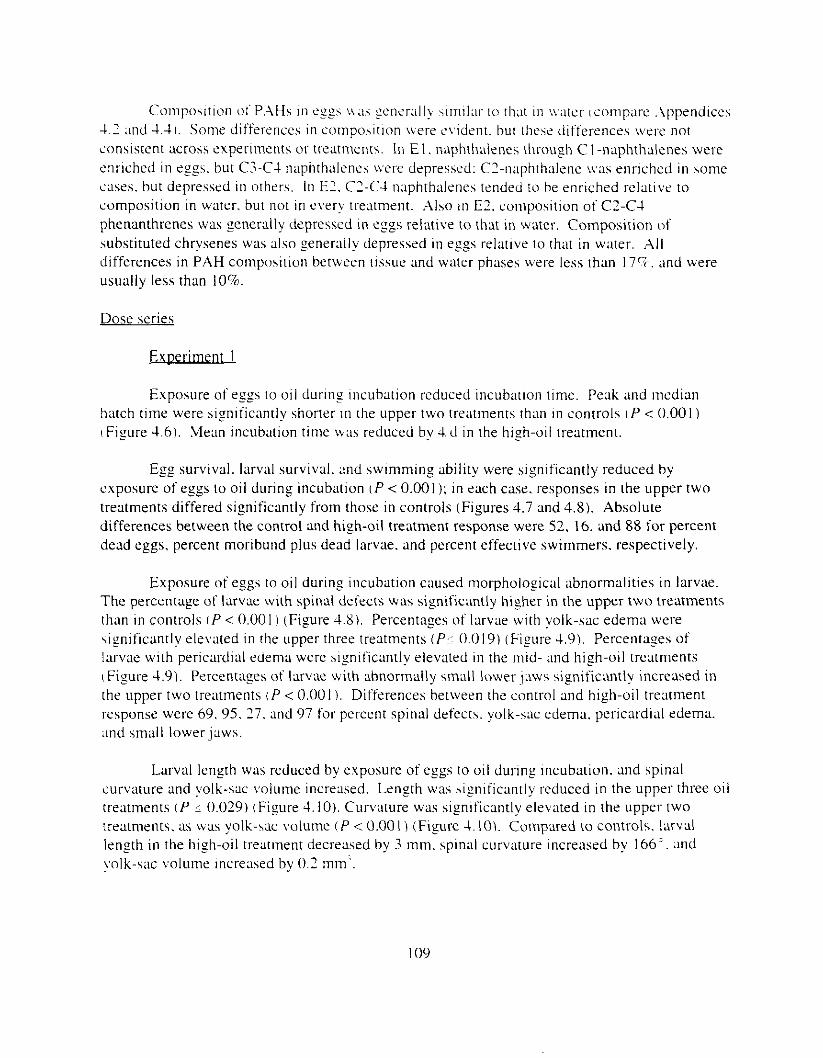
Compos~tion o f P.-\Hs III eggs \\;IS genera l l~ \1m11;1r to that 111 \vater ~ c o ~ n p x c .-\ppend~ccs 4.2 and 4.41. S o m e differenccs i n cornpoution ivere cvident. bur these differences \\ 't1t 1. not consistent across experiments 01- treatments. I n E I , naphthdenes through C I -naphthalenes were enriched in eggs. but C3-C-I naphthalenes WWK depressed: Chaphthalene \vas enriched in home cases. but depressed i n others. I n E?. C2-C-4 naphthalenes tended to he enriched relative to composition In water. but n o t in every treatment. Also in E'. composition of C2-C-l phenanthrenes was generally depressed in esgs relative to that In water. Composition o f substituted chrysenes was also generally depressed in eggs relative to that i n water. All differences in PAH composition between tissue and water phases were less than l7? and were usually less than 10%.
Dose series
Experiment I
Exposure of eggs t o oil dur~ng ~ncubation reduced incubation time. Peak and median hatch time were significantly shorter 111 the upper two treatments than ~n controls ( P < 0.001 ) I Figure 4.6). Mean incubation time t v ~ s ]-educed by 4. d i n the high-oil treatment.
Egg survival. larval survival. and swimming ability were significantly reduced by exposure of eggs to oil during incubation ( P < 0.001); i n each case. responses in the upper two treatments differed significantly from those i n controls (Figures 4.7 and 4.8). Absolute differences between the control and high-oil treatment response were 52. 16. and 88 for percent dead eggs, percent moribund plus dead larvae. and percent effective swimmers. respectively.
Exposure o f eggs to oil during incubation caused morphological abnormalities in larvae. The percentage of larvae with spinal defects was significantly higher in the upper two treatments than i n controls ( P < 0.001) (Figure 4.8). Percentages o f larvae w i t h yolk-sac edema were \ignificantly elevated i n the upper three treatments ( P i 0.019) (Figure 4.9). Percentages of larvae wJith pericardial edema were significantly elevated i n the mid- and high-oil treatments (Figure 4.9). Percentages of larvae with abnormally small lower j:\ws significantly increased in the upper two treatments i P < 0.001 ). Differences between the control and high-oil trearment response were 69. 95. 27. and 97 for percent spinal defects. yolk-sac edema. pericardial edema. and small lower jaws.
Larval length was reduced by exposure of eggs to oil during ~ncubation. and spinal curvature and yolk-sac volume increased. Length was hignificantly reduced in the upper three oil treatments ( P 5 0.029) (Figure 4. IO) . Curvature was significantly elevated in the uppel- two treatments, as \vas y o 1 k - s ~ volume ( P < 0.001 ) (Figure 4. IO). Compared to controls. larval length in the high-oil treatment decreased by 3 mm. spinal curvatul-e increased by 166'. and yolk-sac volume ~ncreased by 0.2 mm'.
I09
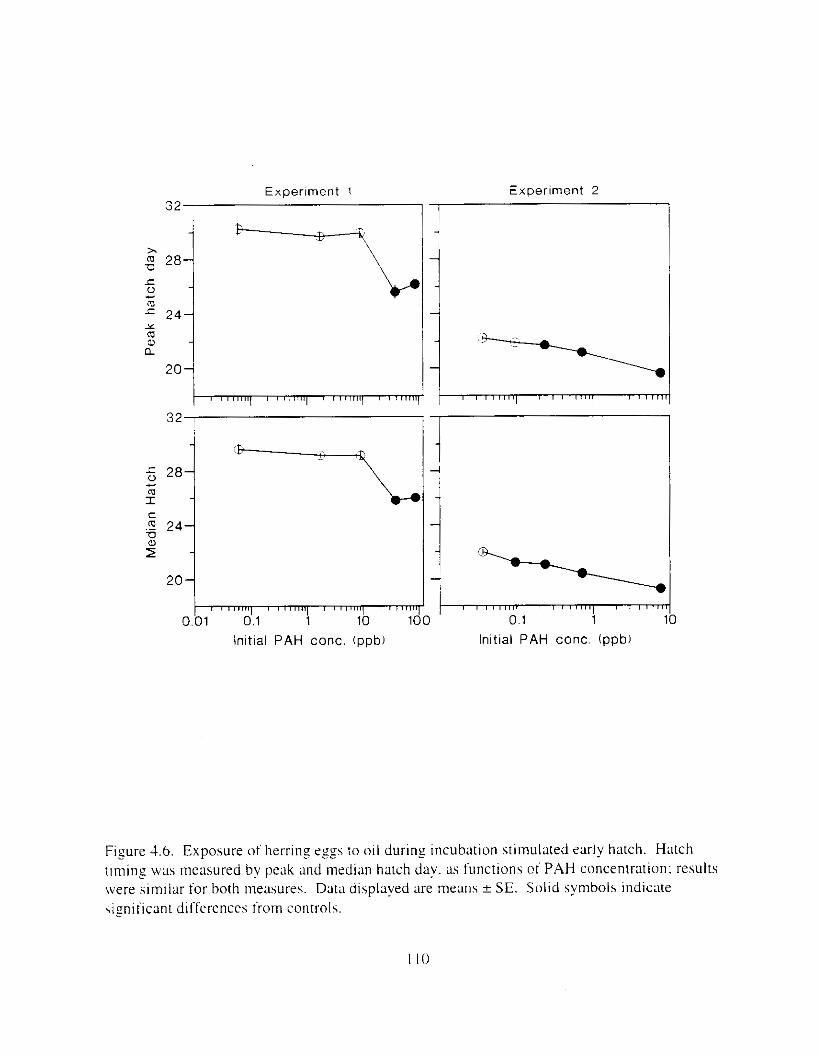
Experlment 1 3 2
Experiment 2
I /
U c - 2 0 2 8 1 - t-\l: m
24- - x m a, - a
20- '\ I
I ' """ ' I ' """'I ' """' ' ' ' """I ' " " " ' I ' ' "" ' 32
-
'O I - m ------x .? 24- C
U -
r" 20- I\
I ' """'I ' """'I ' " I N I ' ' ""'SI ' " " "
0.01 0.1 1 10 100 0.1 1 Initial PAH conc . (ppb) Initial PAH conc . (ppb)
b
Figure 4.6. Exposure of herrins esgs to o i l during incubation stimulated early hatch. Hatch timing was measured by peak and median hatch day. as functions c f PAH concentration: results were simllar for both measures. Data displayed are means f SE. Solid symbols indicate \ignificant differences fl-om controls.
I I O
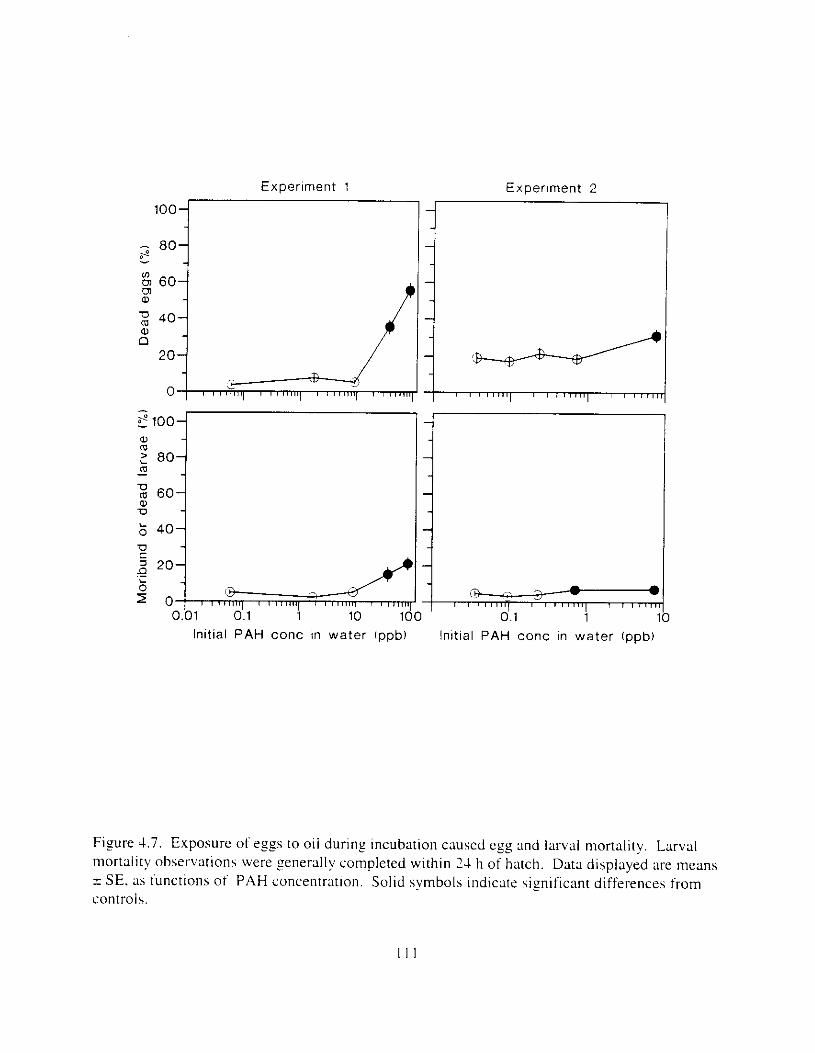
Experiment 1 Experlment 2
100- - - - s - 80- -
(I)
n a,
20
0 - e 100-
2 80-
m 60-
a, m m U a, U
-
- -
- 40-
v - 0
r o z *O: , ,,,d L
0.01 0.1 1 10 1c
Initial PAH conc in water Ippb)
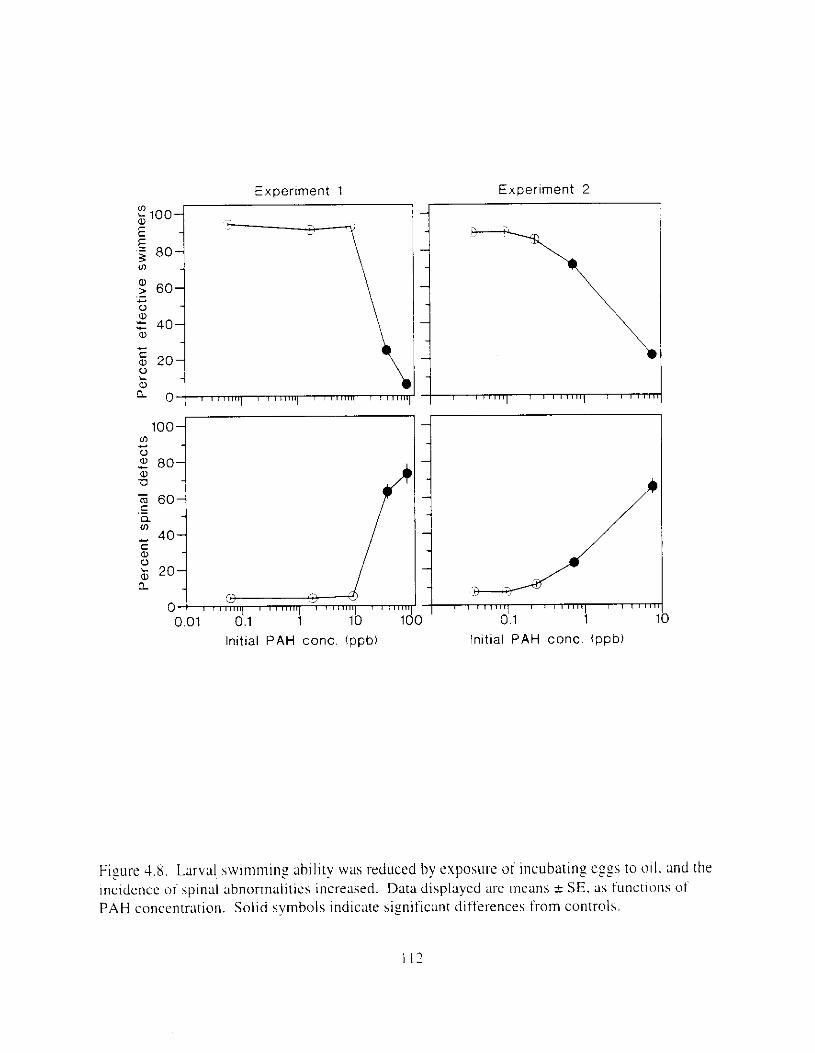
Experiment 1 Experiment 2
Initial PAH conc. (ppb) Initial PAH conc. (ppb)
Figure 4.8. Larval swimminz ilhility was 1-educed by exposure of incubating egzs to o i l . and the Incidence or spinal ahnorrnalities increased. Data displayed at-e means i SE. as functions of PAH concentration. Solid symbols indicate sigificant differences from controls.
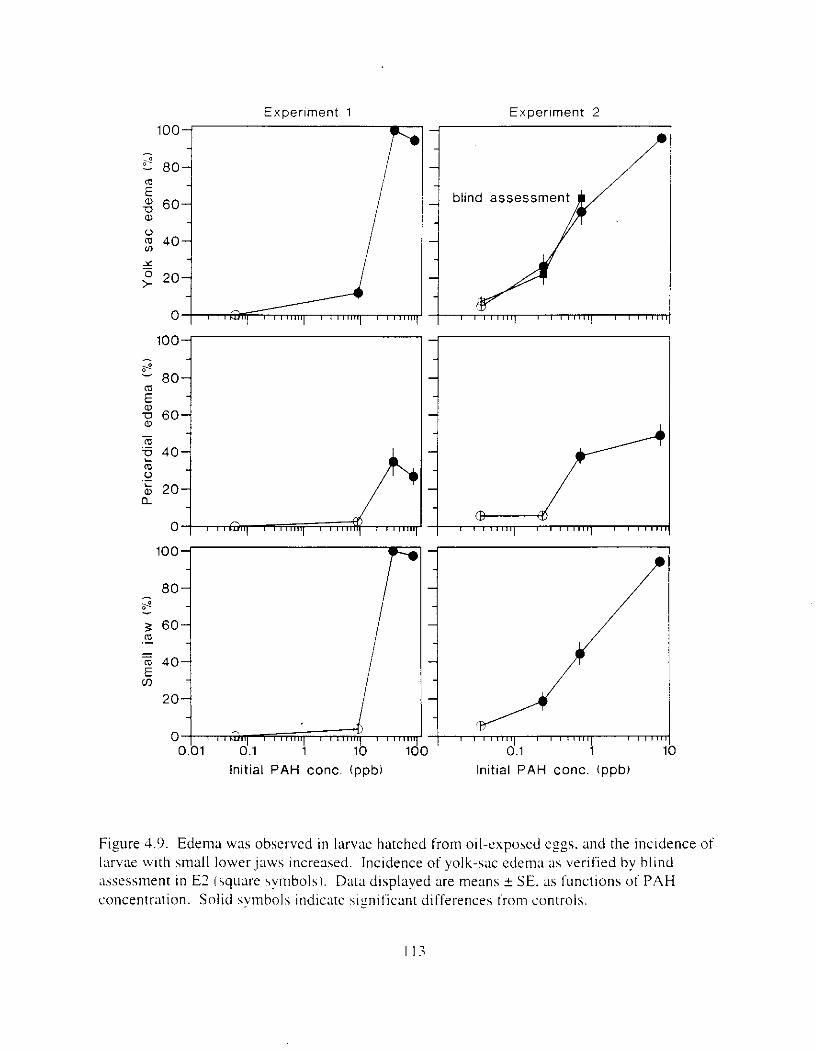
a,
40 2ou 0
Experlment 2
l o o m
401 20
I 0 - $ , , , , , ,, 0.bl
u, I 1 " " ' I 0.1 1 10 1(
Initial PAH conc. (ppb)
I ' ' ' I ~ ' ' ' 1 ' " ~ ' ' ' ' 1 ' """
Initial PAH conc. (ppb) ) 0.1 1 3
Figure 4.9. Edema was observed i n larvae hatched from oil-exposed e ~ g s . and the incidence of larvae with small lower J a w s increased. Incidence of yolk-sac edema as verified by blind assessment in E2 (square hynbols). Data displayed are means 2 SE. as functions of PAH concentration. Solid symbols indicate siyificant differences froln controls.
I13
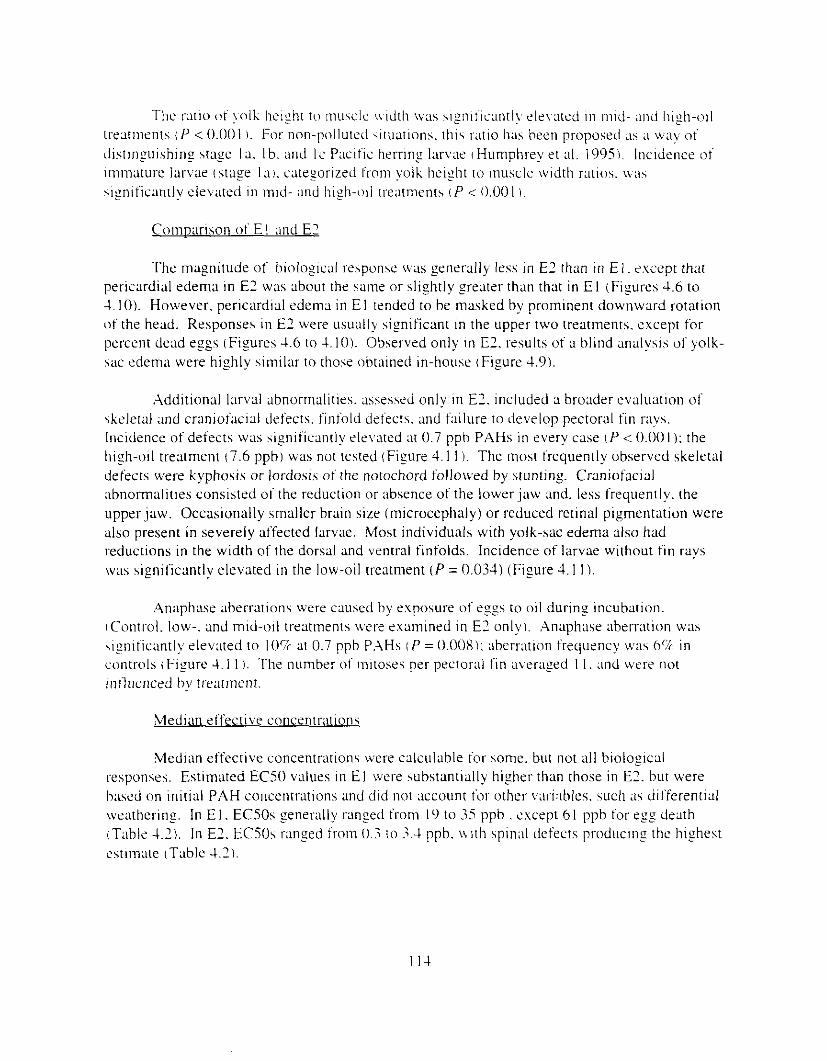
The 1ra11o of ~ o l k lhelsht t u muscle \\ldth W;IS sI~nlticantl! elevated 111 mid- .Ind hifh-ull ~reatments i f < 0.001 !. Far non-pollured \ ~ t t ~ a t ~ o n s . this 13110 Ihas been proposed ;I\ a way of J i s t l n y i s h i n ~ s t a y la. Ib. and I C Pacific herrinz l a r v x ~Humphrey et ai. 1995'1 Incidence of immature larvae cstase I ~ I . catesorized f r o n ~ yolk height 1 0 muscle w~dth rxios. \\;I\
\Iplficanrly elevated i n m ~ d - and lhigh-mi treatments if < 0.001 !.
Comparison of E I m d E?
Thc magnitude of hiological rehponsc \vas generally less 111 E2 than in E I. ?.ucept that pericardial edema in E2 was about the same or slightly yea ter than that in El (Figures 4.6 to 4 . IO). However. pericardial edema i n E l tended to be masked by prominent downward rotation of the head. Responses i n E2 were usu;~lly significant i n the upper two treatments. cxcept for percent dead eggs (Figures 4.6 to 4. I O ) . Observed only ~n E2. results of a blind malysis of yolk- sac edema were highly similar t o those obta~ned in-house (Figure 4.9)
Additional larval abnormalities. assessed only in € 2 . included a broader evaluation of skeletal and craniofacial defects. tinfold detects. and failure to clevelop pectoral f i n mvs. Incidence of defects was significantly elevated a t 0.7 pph PAHs i n every case ( P < 0 . 0 0 1 ): the high-oil treatment (7.6 pph) was not tested (Figure 4. I I ). The most frequently observed skeletal defects were kyphosis or lordosis of the notochord followed by stuntin_r. Craniofacial abnormalities consisted of the reduction o r absence of the lower jaw and. less frequently. the upper jaw. Occasionally smaller brain size (microcephaly) or reduced retinal pigmentation were also present in severely affected larvae. Most individuals with yolk-sac edema also had reductions in the width of the dorsal and ventral finfolds. Incidence of larvae without fin rays \vas significantly elevated in the low-oil [reatment ( P = 0.034) (Figure 4.1 I ).
Anaphase aberrations were caused by exposure o f eggs to oil durins incubation. (Control. Iow-. and mid-oil treatments we!-e examined i n E2 only). .Anaphase ~tberration was \ iy~l icant ly e levated to IO% at 0.7 ppb P.AHs I P = 0.00Xi: abcrratlon frequency v a s 6% i n controls t Figure 4. I I). The number of ~ n ~ t o s e s per pectoral fin a\erafed I I . m d were n o t influenced bv tr-e;~tment.
Median effective concentrations
:Median effective concentrations were calculable tor some. but not a l l biological responses. Estimated ECSO values i n E l were substantially higher than those in E2. but were based on initial PAH co11centrations and did not account t b r other vari:thles. such as tlifferent~al weathering. In E I . ECSOs generally ranged from I9 to .35 ppb . except 6 I ppb for e:: death (TL1hIe 4.2). In € 2 . EC5& ran@ from 0.3 to -34 ppb. w ~ t h s p i n d defects produciny the highest chtlmate (Table 4.2).
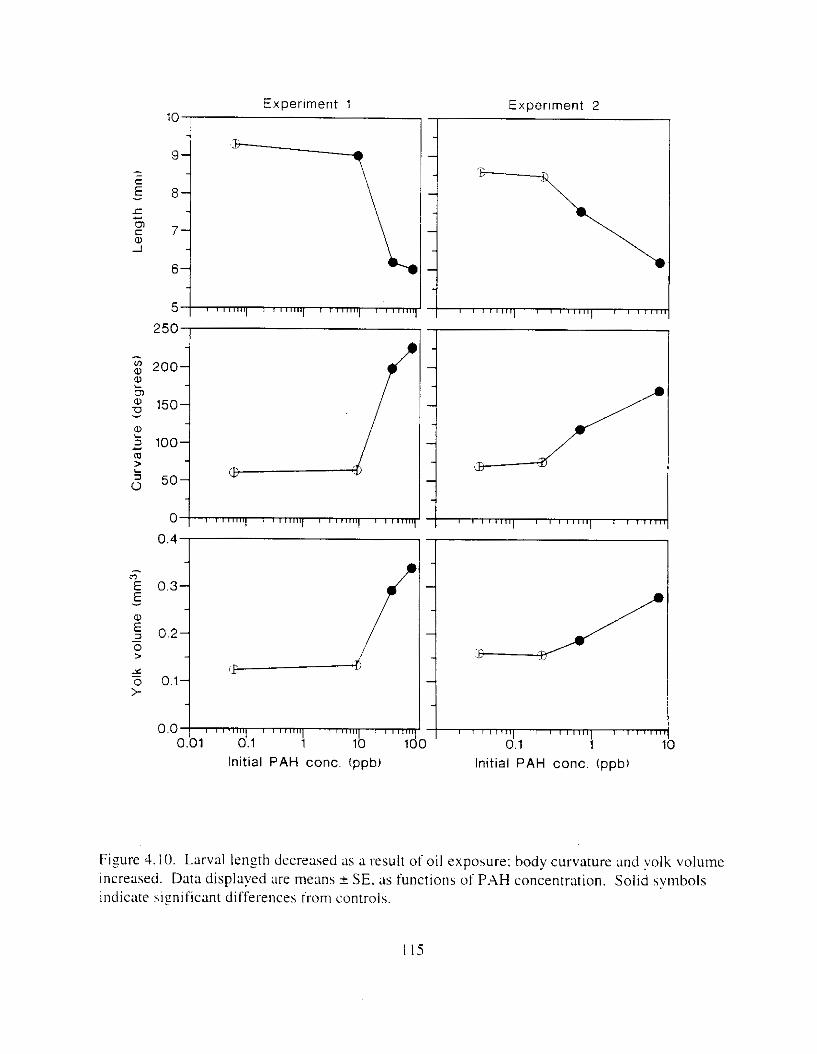
0.3 4
0.0 O . l i 0.01 0.1 1 10 1c
Initial PAH conc. (ppb)
1 ,- 0.1 1 I
Initial PAH conc. (ppb)
Figure 4. I O . Larval length decreased as a result of oil exposure: body curvature and yolk volume increased. Data displayed are means * SE. a s functions of P.4H concentration. Solid symbols indicate siyificant differences from controls.
I15
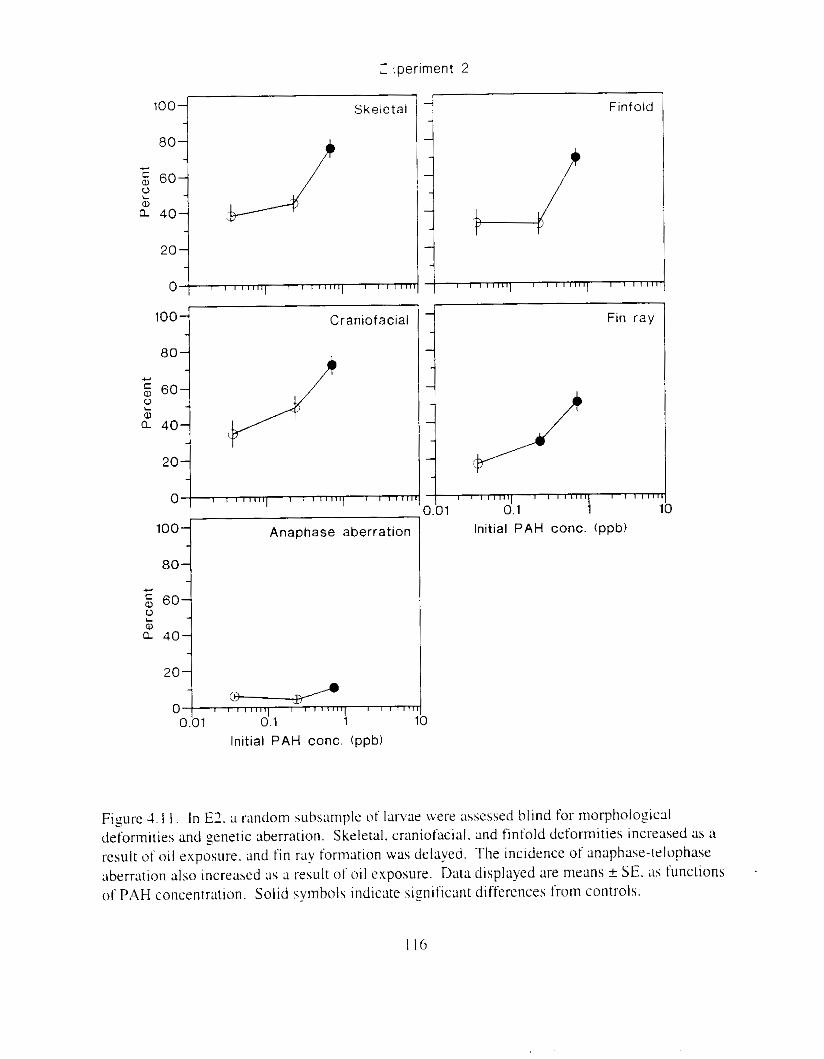
1 tperlment 2
201 I l
0 e, I 0.bl 0.1 1 10
Initial PAH conc. (ppb)
I16
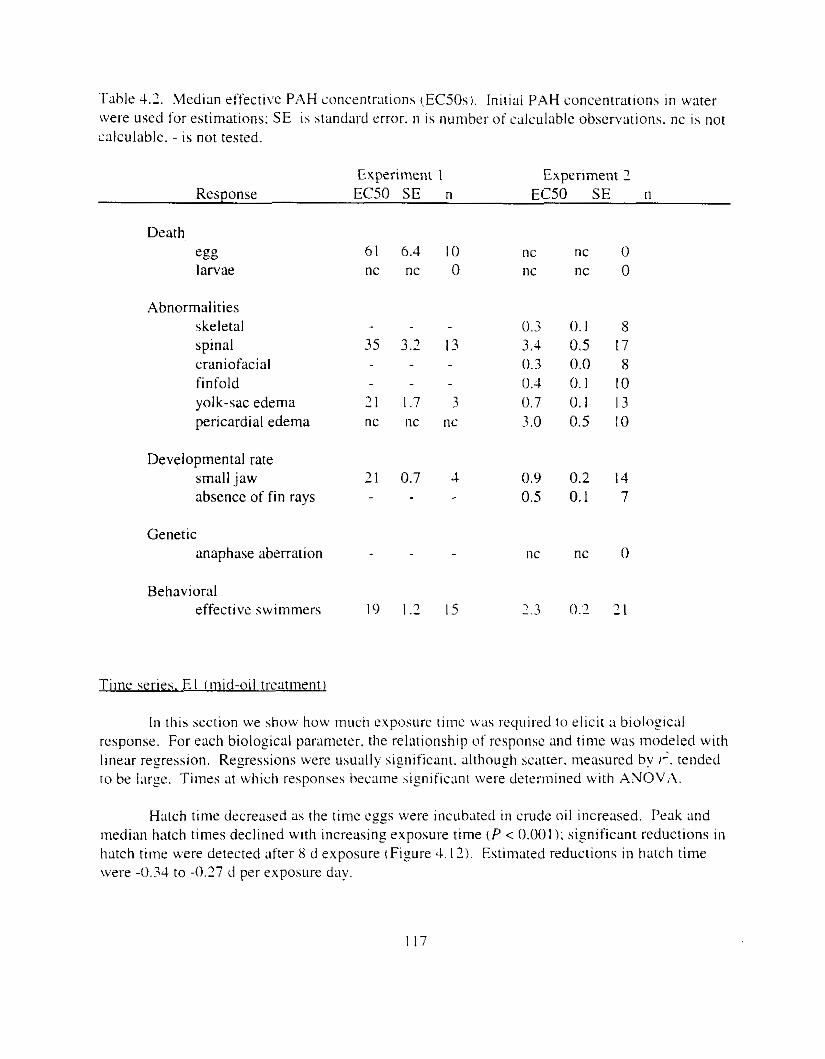
Table 4.2. Median effecti\,e PAH concentrations 1,ECSOsi. Initial PAH concentranon., i n water were used for estimations: SE is standard error. 11 is number of calculable observations. nc is not calculable. - is not tested.
Experiment I Experiment 2 Response ECS0 SE n EC50 SE n
Death egg larvae
61 nc
Abnormalities skeletal spinal 35 craniofacial finfold yolk-sac edema ‘I pericardial edema nc
Developmental rate small jaw 21 absence of f in rays
Genetic anaphase aberration
Behavioral effective swimmers I9
6.4 nc
3.2
I .7 nc
0.7
1.2
I O nc 0 nc
0.3 13 3.4
0.3 0.1
3 0.7 nc 3.0
4 0.9 0.5
nc
I5 7.3
nc nc
0. I 0.5 0.0 0. I 0.1 0.5
0.2 0.1
nc
0.2
0 0
8 17 8
10 13 IO
14 7
0
21
Time series. E l (mid-oil treatment]
I n this section we show how much exposure time was required to elicit :I biological response. For each biological parameter. the relationship o f response and time was modeled with linear regression. Regressions were usually siyificant. although scatter. measured by I-‘. tended to be large. Times at which responses became siyificant were determined with ANOV.4.
Hatch time decreased as the time eggs were incubated i n crude oil increased. Peak and median hatch times declined with increasing exposure time ( P < 0.001): significant reductions i n hatch time were detected after 8 d exposure (Figure 4.12). Estimated reductions in hatch time were -0.34 to -0.27 d per exposure day.
I17
Pcr~ccnr hatchtng. Ix\JI ~LIIV I\;II. .md ~ \ v t m t n I n ~ . I h l l i i y Jecltned \lgtllficmtl! %IS cxposure [Imc Incl-e:lsed tP < 0 . 0 0 1 I . Percent c.~f hxch W;IS r iplficantly rcduced Litter 2 d exposure. hut )not after 4 d : Ireductions \\ere hiylilicanr for : S ti exposures iFiSure 4.171. Percentages of l iv iny Iavac were significantly reduced d t c r ; m S d exposure tfisure 4.13). The percentase or Ixvae [hat swam normally were signlticantlv ~rcduced by 4 d exposures i F i y r e 4.14). Hatch declined hy I.YJ%.d~'. l iving I a rvx declined by 0 . 7 5 % d ' . and etfectlve swimmers declined by 4.S6c/cd1 .
Incidence of morphologicul abnormalities increased signlficantly with increllsin: exposure time ( P < 0.001 !. Incidence o f splnal abnormalities and yolk-sac edema became significant after 4 d exposure (Figures 4, I4 and 4.15). Incidence of pericardial edem:l was jiznificant after 8 d exposure (Figure 4.15). Incidence of larvae with small or missln: lower jaws became significant after 7 d exposure t F i y r e 4.151. Incidence of abnormalities increased by 6 . 6 5 % d ' . 2 .53%d1 . and h . 2 7 % d for ),olk-sac edema. pericardial edema. 2nd larvae with small jaws. respectively.
Larval lensth decreased slgnificantly ;IS esposure time increased. and spinal c twature and \olk-sac volume increased signlficantly tf c: 0.001 I : 2 d exposures caused slznificant changes tn each case t F i y r e 4.16). Lcnzth decreared hy 0.70 m m d l . \pinal curvature increased by ~l .13°. t i~ ' . md yolk-sac volume increased hyO.O1O m t n ' d ' .
Cornuarison of E I and E2
As observed in the dose series. the magnitude of biological response in E2 time series tests was less than in E l . Magnitudes of corresponding slopes were smaller i n E2 than E l . and in two cases. percent eggs hatched and percent larvae alive. rezression slopes were not significant. I n E?. significant biological responses were observed Lrfter 4 to 16 d exposure. except no \i:nificant reduction i n percent hatch occurred (Figures 4. I2 to 4. Ih!. I n some cases. the exposure time required to elicit a significant response \vas the same i n E2 as In E l . IC.:.. percent ctfective hwirnmers and spinal defects] while i n other c;~ses. longel- exposures were requlred 1e.c .. larval length and yo lk volume). Observed only in € 2 . results o l ;I blind analysls o f yolk-sac &ma were similar to those ohtaincd in-house: slopes were parallel. but the blind assessment Indicated LI rlightly grexer Irequency 01 edema I P ,,,.,,,, 1,1,), C,,i.,r ,,,, =0 .001) (F ig t t l - e J . l j ) .
Other larval abnormalitie\. ashesscd only i n El. included general skeletal and craniofacial defects. finfold defects. and failure to develop pectoral fin rays. Incidence of defects increased jtgnificantly with exposure time i n every case ( P < 0.001 ): except for skeletal defects. these I-ehponses were significant after X d exposure (Figure 4.171. The map i tude of these I-csponses were similar. ranging from 7.14 to 2 .5Yr / r .d ' .
Swimming and I;Irval condition
The ability of newly hatched larvae to swim w x likely :I tunctlon of physicd condition: defective larvae were less able to swim normally. Spinal condition was the most important
I18
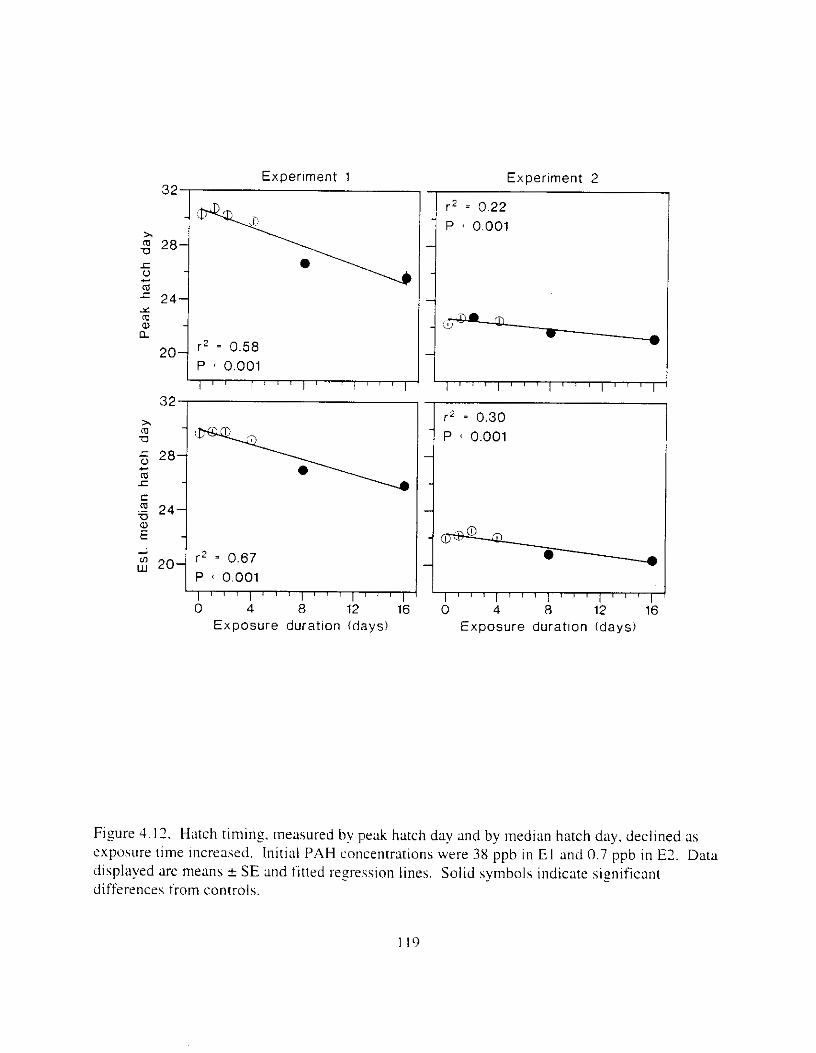
32 I Experment 1
x m Q
20 r 2 = 0.58 P 0.001
Experiment 2
r z = 0.22 P ' 0.001
i 0 4 a 12 16 0 4 8 12 16
Exposure duration (days) Exposure duration (days)
Figure 4.12. Hatch timing. measured bv peak hatch day and by median hatch day. declined as exposure time increased. Initial PAH concentrdtions were 38 pph in El and 0.7 ppb i n E?. Data displayed are means k SE and fitted r e p s s i o n lines. Solid symbols indicate significant differences from controls.
I19
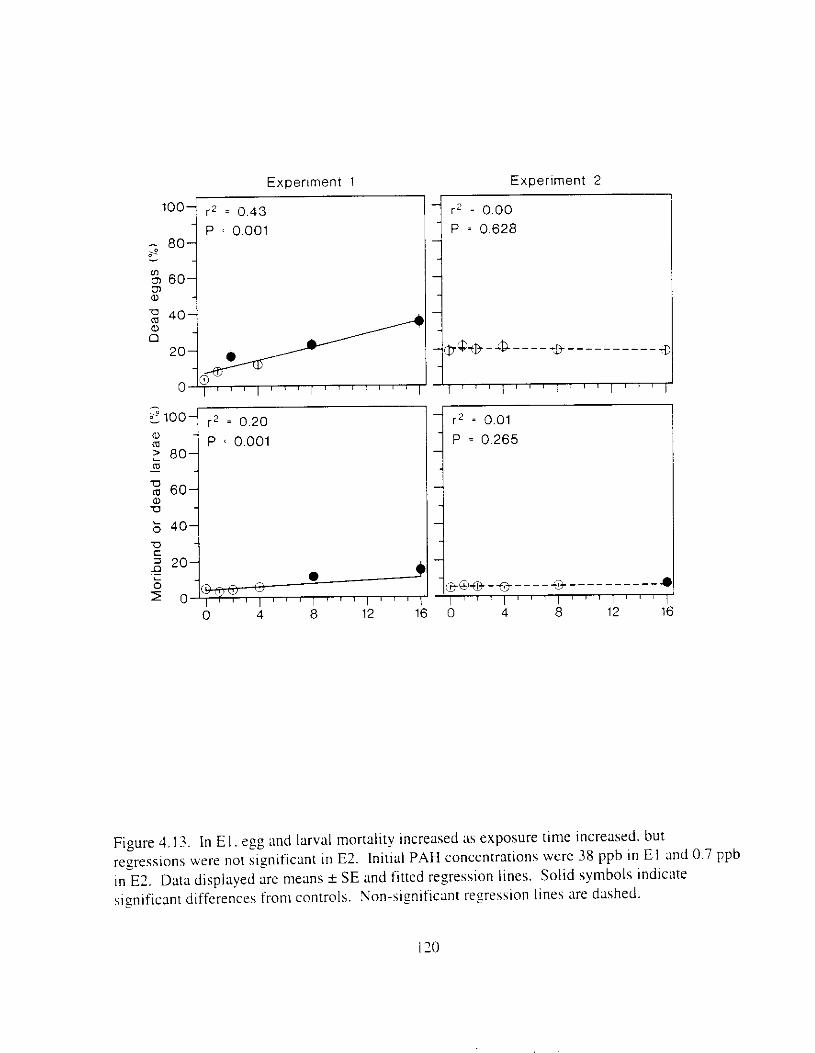
a,
- m < O.Ool
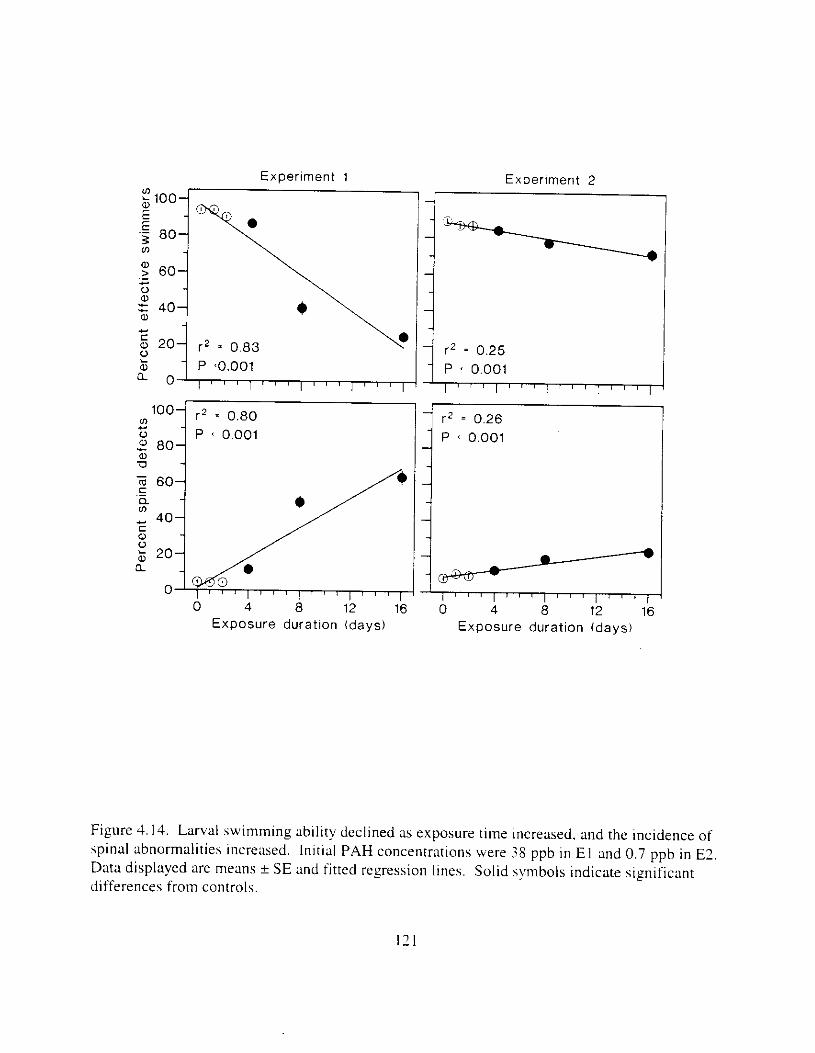
E x p e r i m e n t 1 E x p e r l m e n t 2
P ~0.001 u.
0 ' , 1 1 , , , , , I , / , 1 , , / P ' 0.001 I " ' I " ' / " ' : " ' /
1
E x p o s u r e d u r a t i o n ( d a y s )
1 r 2 = 0.26 P ' 0.001
0 4 8 12 16 E x p o s u r e d u r a t i o n ( d a y s )
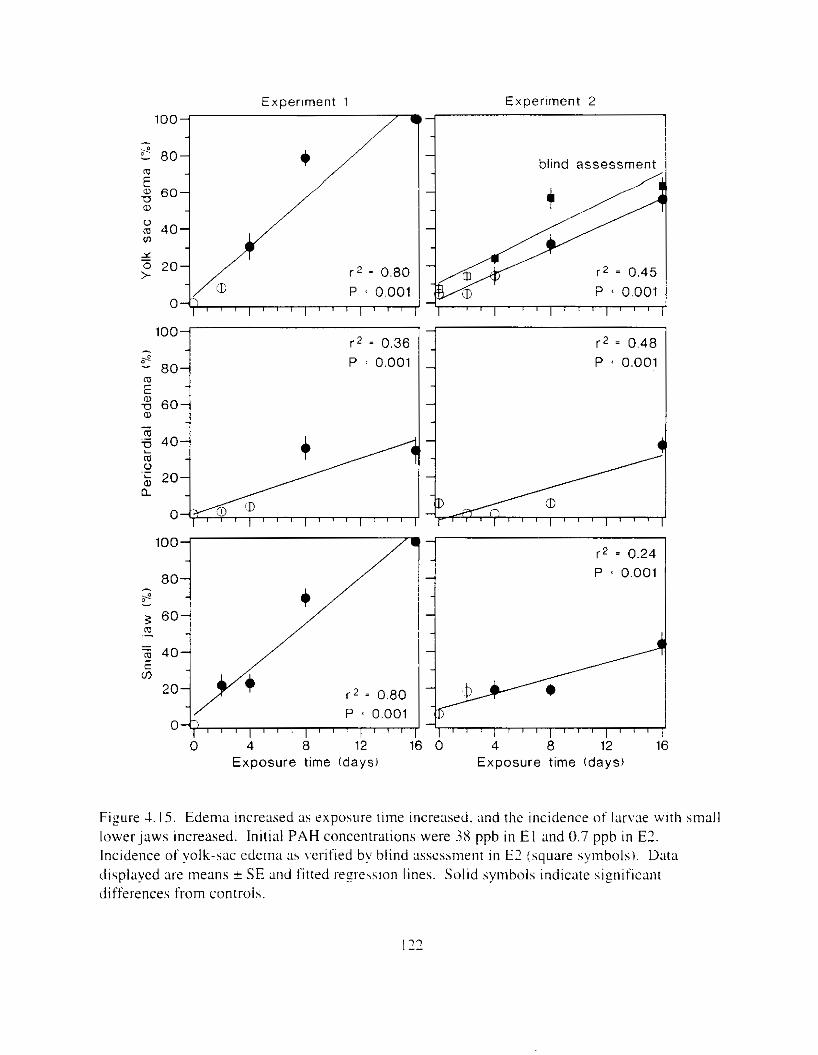
Experlment 1 Expertment 2 100-
- 2 80- -
E -
U a,
60-
% 40-
1 0 20- >
v) -
- r 2 = 0.80 P 0.001
O ? , , , l " ' i " ' l
1 - blind assessment
r 2 = 0.45 P 0.001
? " ' I " ' I ~ " I " ' I
P 0.001
0 4 8 12 16 Exposure time (days) Exposure time (days)
Figure 4.15. Edema ~ncreased as exposure lime increased. and the incidence of I;~rv;~e with small lower Jaws increased. Initial PAH concentrations were 38 ppb in E l and 0.7 ppb i n E2. Incidence of yolk-sac edema as verified by blind assessment i n E2 (square symbols). Data displaved are means * SE and fitted reye\sion lines. Solid symbols indicate significant differences from controls.
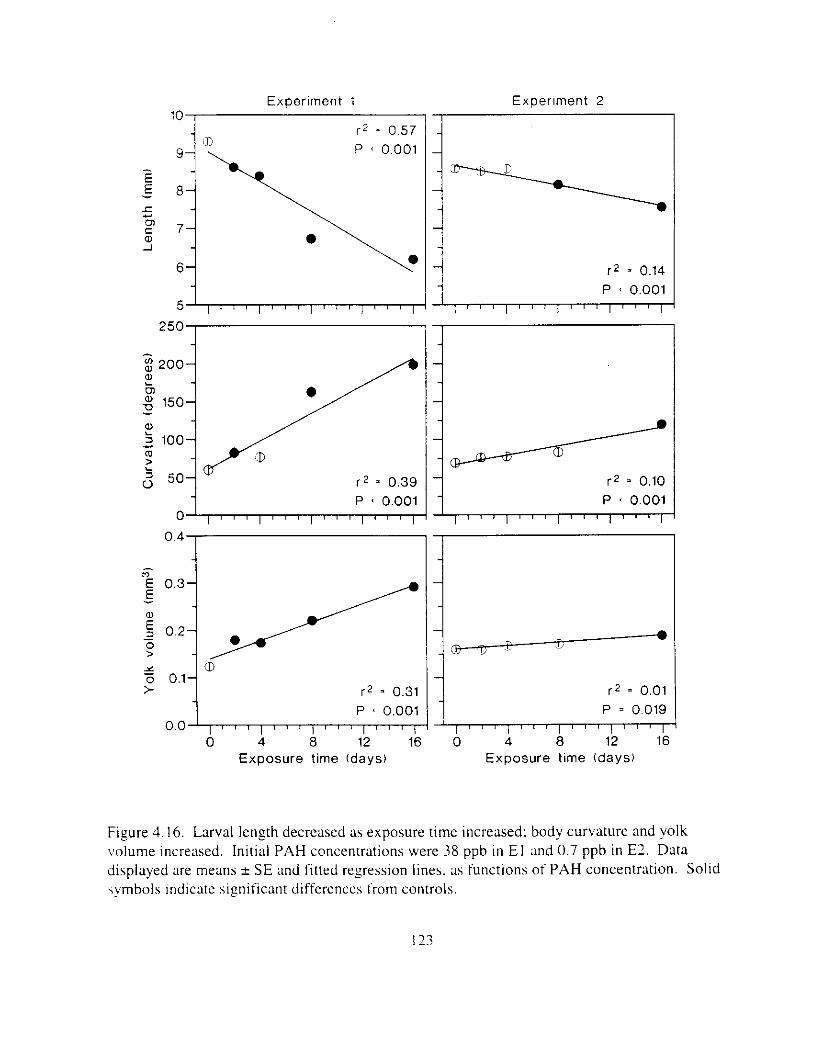
10 Experiment 1
r 2 = 0.57 P f 0.001 9- -
P 7
E E
5
1 Q)
8;\.
-
6
5 I " ' l " ' l " ' l " ' l
2507
r 2 - 0.31 P 0.001
0 4 8 12 16 Exposure time (days)
0.0
Experiment 2
I
L P r2 ' - 0.001 0.14
,, P ' 0.001
1 r * = 0.01 P = 0.019
0 4 a 12 16 Exposure time (days)
Figure 4.16. Larval length decreased as exposure time increased: body curvature and yolk \,olume increased. Initial PAH concentrations were 38 ppb i n E l and 0.7 ppb in E?. Data displayed are means k SE and fitted regression lines. as functions of PAH concentration. Solid symbols indicate significant differences from controls.
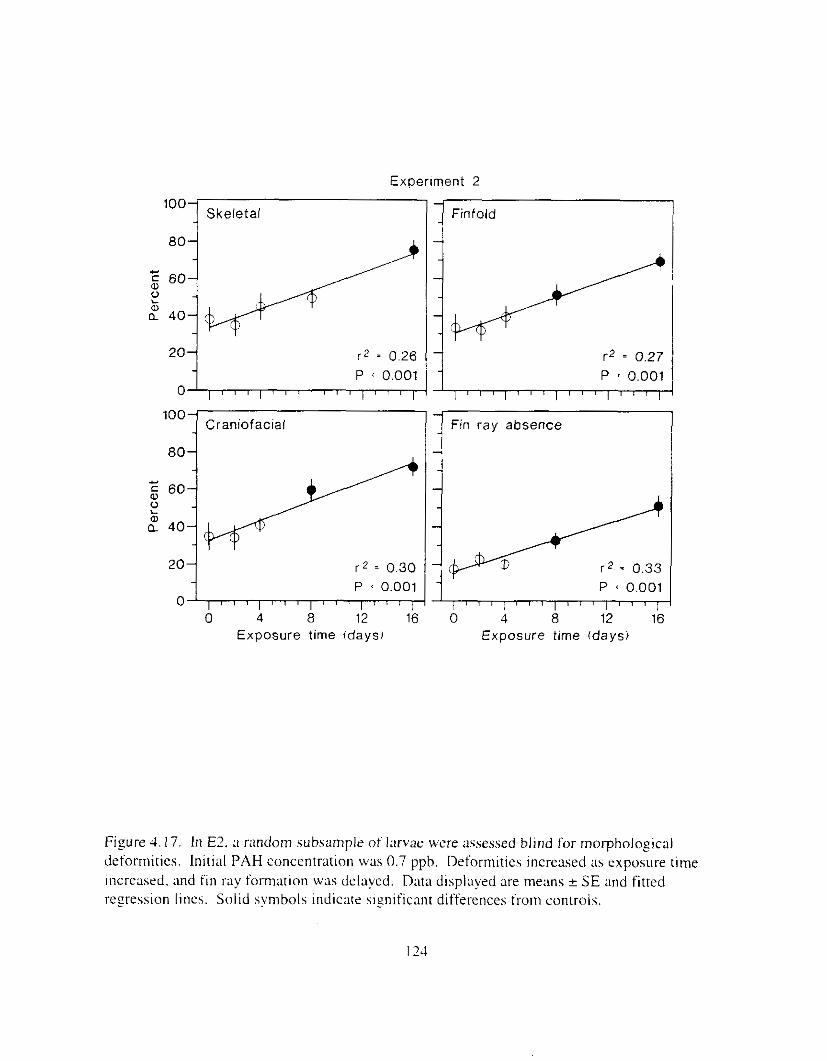
Experiment 2
loo: Skeletal 2
Finfold .
m
I? ? 40 20
I ' ' ' l ~ ' ' l ' " l ' " l
P 0.001 - P 0.001
r2 = 0.27 FII;/ r 2 = 0.26 -
0 , , 1 1 [ 1 1 / 1 1 1 / / 1 8 I I
1002 - Craniofacial Fin ray absence -
80- -
a,
a $ 40 2 0
0 4 a 12 16 0 4 a 12 16 / " ' / " ' I " ' / " ' I
P ' 0.001
:/ r 2 = 0.33 z 6 0 : / r 2 = 0.30 - P ' 0.001 -
0 , 1 1 1 1 1 1 1 1 / 1 / 1 1 l I ,
Exposure time (daysl Exposure time (days)
Figure 4.17. In € 2 . a random .subsample of larvae were assessed blind for morphological deformities. Initial PAH concentration was 0.7 ppb. Deformities increased a s exposure time increased. and f i n my formation was delayed. Data displayed are means + SE and fitted reyession lines. Solid symbols indicate slznificant differences f r o r controls.
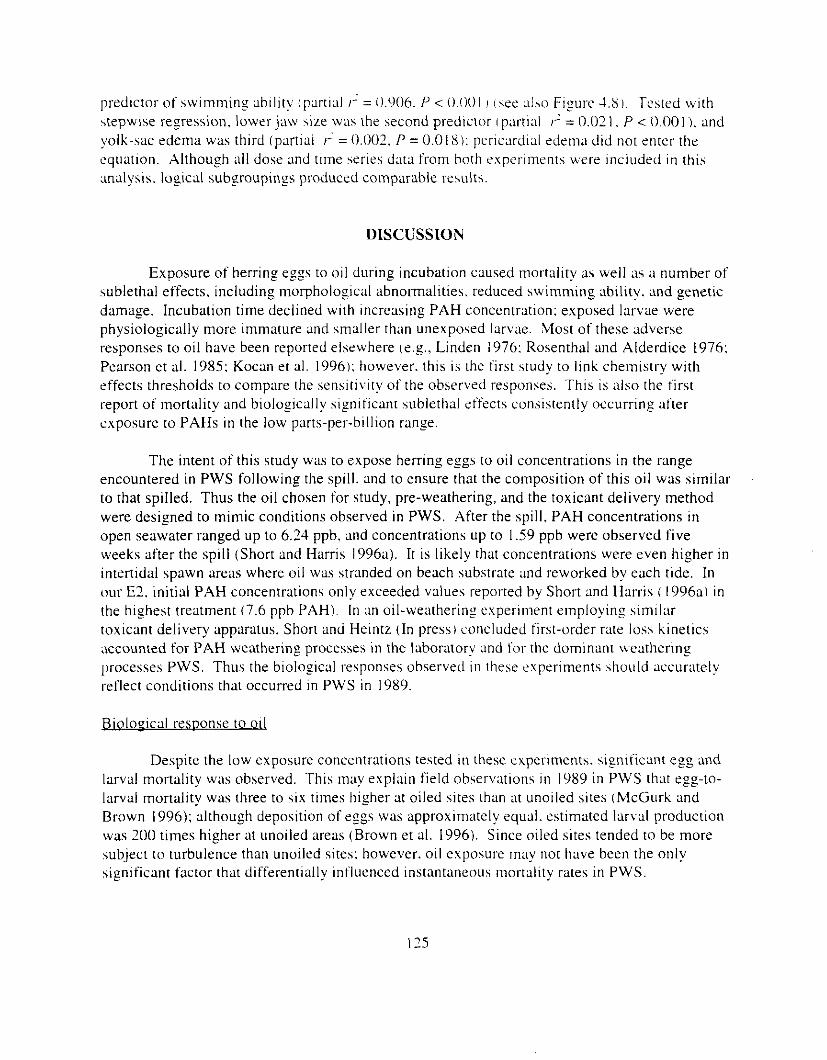
predictor ofswimmlng abllitv ipartid I- = 0.906. P < 0 . 0 0 1 I i s r e d h o F i p e .+.SI. Tested with \tepwise resression. lower jaw hize w a s the second predictor parti id )' = 0.021. P < 0.001 ), and yolk-sac edema was third ipartlai I-' = 0.002. P = 0.018): pericardial rden1;l did not enter the equation. Although all dose and time senes daw from both experiments were included in this :uulysis. losical subgroupings produced comparable results.
DISCUSSION
Exposure of herring eggs to oil during incubation caused mortality as well as a number of sublethal effects. including morphological abnormalities. reduced swimming ability. and genetic damage. Incubation time declined with increasing PAH concentratlon: exposed larvae were physiologically more immature and smaller than unexposed larvx. Most of these adverse !responses to oil have been reported elsewhere (e.g., Linden 1976: Rosenthal and Alderdice 1976: Pearson et ai. 1985: Kocan et al. 1996); however. this is the first study to l i n k chemistry with effects thresholds to compare the sensitivity of the observed responses. This is also the first (report of mortality and biologically significant sublethal effects consistently occurring after exposure to PAHs in the low parts-per-billion range.
The intent of this study was to expose herring eggs to oil concentrations in the range encountered in PWS following the spill. and to ensure that the composition of this oil was similar to that spilled. Thus the oil chosen for study, pre-weathering, and the toxicant delivery method were designed to mimic conditions observed in PWS. After the spill. PAH concentrations in open seawater ranged up to 6.24 ppb, and concentrations up to I .59 ppb were observed five weeks after the spill (Short and Harris 1996a). It is likely that concentrations were even higher in intertidal spawn areas where oil was stranded on beach substrate and reworked by each tide. In our E2. initial PAH concentrations only exceeded values reported by Short and Harris i 1996a) in the highest treatment (7.6 ppb PAH). In an oil-weathering experiment employing similar toxicant delivery apparatus. Short and Heintz ( I n press) concluded first-order rate loss kinetics accounted for PAH weathering processes in the laboratory and for the dominant weathering processes PWS. Thus the biological responses observed i n these experiments should accurately [reflect conditions that occurred in PWS in 1989.
Biolozical response to 011
Despite the low exposure concentrations tested i n these experiments. significant cgg and larval mortality was observed. This may explain field observations i n 1989 i n PWS that egg-to- larval mortality was three to six times higher at oiled sites than at unoiled sites (McGurk and Brown 1996); although deposition of eggs was approximately equal. estimated larval production was 200 times higher at unoiled areas (Brown et al. 1996). Since oiled sites tended to be more ub.ject to turbulence than unoiled sites: however. oil exposure m a y not have been the only significant factor that differentially influenced instantaneous mortality rates in PWS.
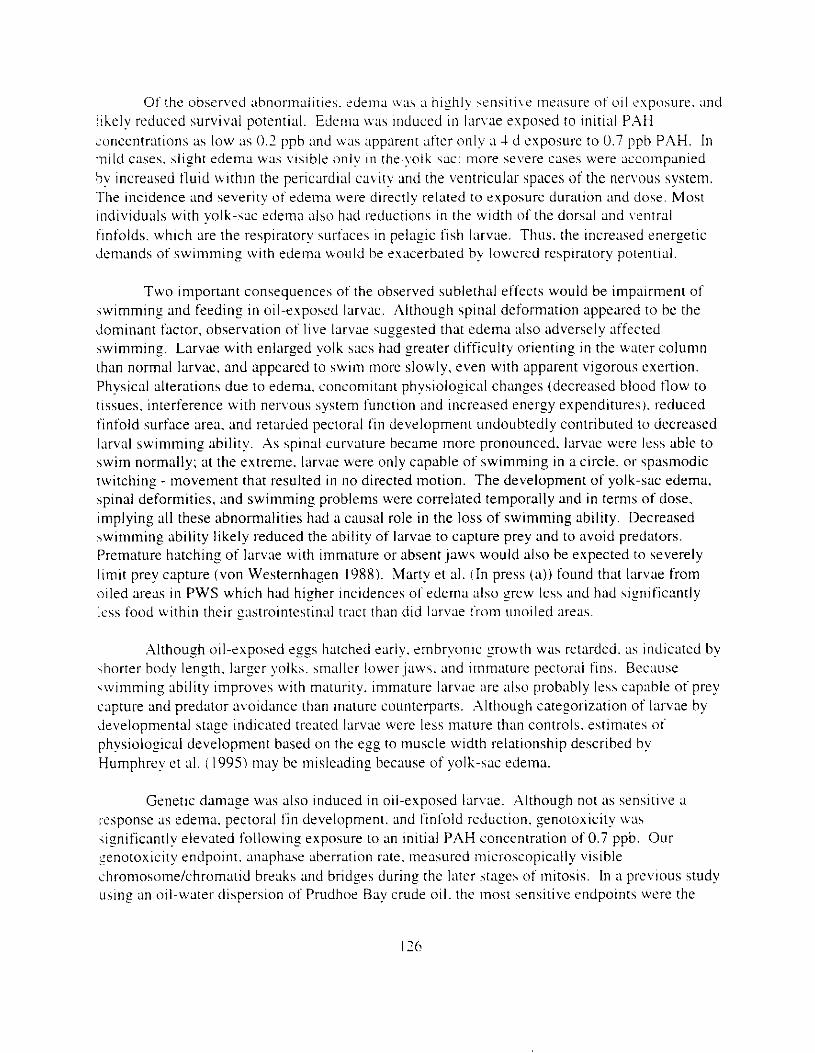
anaphase aberratlon rate. craniofacial deiects. m d finiold abnorrndities. This inlethod 112s been previously used to demonstrate ynotoxiclty i n field studies of the E . w m \'u/&: oil spill (Hose et ai. 1996: Brown et aI. 1996). the ,Arro .M~,rchmr o i l spill 1 Longwell 1977). the New Yol-k Bight (Longwell and Hughes 1980). and i n sediment from San Francisco Bay (Long et ai. lY90). In each case. mitotic aberrations were quantltatively or spatially related to oil. The consequences of the low level of genetic damaee observed i n this study cannot be predicted hut might Include reductions in successful cell division and Zrowth. It may he possible to develop more sensitive endpoints using methods to assess breakage of individual chromosomes.
In sharp contrast to the distinct biological responses caused by exposure of incubating herring eggs to oil. exposure of adult herring to similar quantities of oil shortly before spawning did not produce any discernable effects i n progeny (Carls et ai. Chapter 3 ) . The clear implication is that contamination of intertidal habitat where herring eggs incubated i n PWS likely c l u e d adverse developmental effects. hut exposure of reproductively ripe herring as they migrated to spawning grounds was reproductively inconsequential. However. neither study addressed whether the presence of oil i n water affected migratory behavior. site selectlon. or spawn timing.
Toxicitv of wcathered oil
Based on concentration alone. a stronger biological response to oil was expected in El than in E2 because oil concentrations were much higher in E I . Nonetheless, biological responses i n the upper two treatments of both experiments were usually significant. Had the study ended after the first experiment, the conclusion would have been that initial PAH concentrations in water of about 9 ppb could cause significant problems in developing herring eggs, and that smaller concentrations would not cause significant biological response. When the second experiment was completed with all initial PAH concentrations below the originally predicted effective concentration: however. significant biological responses occurred. and the predicted initial effective dose fell to 0.7 ppb.
Based on biological response. i t is apparent that weathered oil is relatively more toxic than unweathered oil. Similar results were obtained when pink d m o n eggs were incubated in oiled rock: eggs incubated in weathered rock were affected more strongly than was predicted by concentration alone (Heintz and Short. In prep.). The implication is that oil persistent i n intertidal spawning areas may have adversely affected egg development a year or more after the spill. Such a circumstance was documented for pink salmon: egg mortality in oiled streams was higher than in unoiled streams for three years after the spill (Bue et al. 1996).
Two factors. time and initial oil concentration. were important in the oil-wrathel-ing process. As time progressed. concentrations of lighter aromatics declined relative to those of heavier aromatic compounds. Within homologous groups. concentrations of parent compounds declined more rapidly over time relative to substituted homologs. Oil weathered more rapidly on lightly oiled rock than heavily oiled rock: with less oil available and thinner layers of oil. water tlow [equal i n ;ill treatments) depleted the lighter aromatic compound reservoir more I-apidly in
I27
lightly o~ied rock. Some \ve:uhering. duc to v ~ l : ~ t ~ l i z a t ~ o n . m a y a l s o /have taken place when the rock was allowed to stand i n air.
Due to time-dependent weatherlng. differences in PAH composition were obvious within the same treatments between expertments. I n these comparlsons. concentrations of heavier aromatics were greater than those of lighter aromatics in the second experiment. This leads to rhe general inference that the toxiclty of heavier PAHs ce.:.. phenanthrenes and chrysenes) is sreater than toxicity of lighter PAHs (e.:., naphthalenesi. Increases in toxicity o f PAHs with increasing molecular size has been documented in other studies and summarized by Rice et a]. ( 19771.
Up to this point. discussion of PAH composition 111 the less and more weathered experiments has been presented on a relative basis. Comparison of PAH concen t r a t~o~~s on an absolute basis supports the idea that larger PAH molecules are more toxic. including increased alkylation within homologous familes: except in naphthalenes. concentrations of the more substituted compounds and a11 chrysenes in E? generally cqualed o r exceeded those i n E I However. this raises an interesting chemical problem - what was the underlying mechanism responsible for these relationships?.
We expected o i l would be lost from rock in the oil generators as time progressed: more specifically, we expected the slope of each component PAH concentration in water would be negatively correlated with time. Under this hypothesis. time-dependent changes in PAH composition would be entirely dependent on differential loss rates. In practice. most PAH concentrations were negatively correlated with time, except that concentrations of the more refractory (multi-ring, and more substituted components) did not correlate with time (C3- tluorenes. and CI-chrysenes) or were positively correlated with time (C3-dibenzothiophenes. C3- ;mi C4phenanthrenes. chrysene. and C?-chrysene), particularly i n the uppermost oil treatment (most C3- and C k h r y s e n e concentrations were below minimum detection limits). These relationships were not as clear i n an earlier experiment. but concentrations of C3-tluorenes. C3- dibenzothiophenes. C4phenanthrenes. chrysene. and C I-chrvsene were constant over tlme: C?- chrysenes were positively correlated wlth time (CarIs et ;II. Chapter 3 ) . The presence of constant or increasing concentrations of components suspected of disproportionately high toxicity explains the high toxicity of weathered oil. hut brings the mechanlsm whereby this might happen into question. We suggest that the oil-coated rock acted 3s a chromatographic column: component PAH molecules may have migrated through the column at different rates. depending on their tendency to re-enter the organic phase. The fact that the rock column was twice as long in the high-oil treatment as i n other treatments. and that more oil was present. thereby increasins the probability of resorption. is in keeping with observation. More study is required to confirm or refute the chromatographic column hypothesis.
The issue of relative PAH toxicity may be more complex than indicated by simple comparison of composition within treatments. Two factors lead to awareness of increased complexitv i n interpretation of PAH toxicity. First. differential weathering rates as a function of initial hydrocarbon concentrations yielded treatments with different composition at the outset of
I28
experimentation. Second. total PAH concentrations m the low-011 treatment of El tvrrr very \imilar those in the high-oil treatment o f E2 (Figure 4. I ) . Additionally, biological responses i n the low-oil treatment of El ivere generally not significant. but responses in the high-oil treatment o f E? were usually significant. Because total PAH concentrations were very similar in the two experiments. we suggest differences 111 composition caused the distinctly different biological responses. In the treatment. there were consistently more C4 naphthalenes. tluorenes, and compounds heavier than C2 phenanthrenes than in the E I,,)% treatment (Figure 4.18). Phenanthrene concentrations were initially greater in El,,,, than in E?,,,,, but were greater in E2,,,, by day 8. Comparison of these two specific treatments supports the idea higher molecular welght PAHs are more toxic. but also suggests that the more substituted homologs may he more [oxic than less substituted homologs. The same conclusions were reached when PAH percentages were compared (Appendix 4 . 4 2 and 4.2.8). It has been previously reported that dkylation of aromatic rings leads to increased toxicity (Rice 1985: Rice et al. 1977) These two factors (ring size and substitution) are confounding, thus the specific compounds responsible for increased toxicity of weathered oil i n our tests were not readily identifiable.
Because the composition of PAHs that accumulated i n egg tissues was senerally similar to that in water (usually within 1 0 % ) . the previously presented comparison of PAH composition in water appears to be a reasonable first approximation for describing chemical toxicity. Composition of PAHs i n tissue of pink salmon eggs and alevins was also similar to that in treatment water in a study by Many et ai. ( I n press (b)). Some minor differences in PAH composition did occur between tissue and water phases (generally less than 10%). These differences, however, were not consistent across experiments, thus interpretation was not clear. For example. i n E I , naphthalene through C I-naphthalene composition was enriched in tissue relative to that in water. but composition o fC3- to C4-naphthalenes was depressed: these enrichments and depressions declined over time. In contrast. C2- to C4-naphthalenes in E2 were generally. but not always. more enriched in tissue. Others have observed more rapid uptake rates of lighter PAHs by teleosts. but after sufficient time. accumulation of heavier PAHs rnay exceed that of lighter PAHs (Kuhnhold and Busch 1978: Sharp et ai. 1979: Solbakken et ai. 1984).
Improved determination of which compounds contrlbuted to toxicity misht have been possible had tissues from all treatments been analyzed. but the fact that percentages of heavier compounds were consistently greater in egg tissues i n E? than i n E l also suggests toxicity increases with molecular welght.
Bioaccumulation. deouration. and chemical toxicity
Observed biomagnification in E l (406 times) was similar to that reported in ova ( 3 17 times) of similarly rxposed adult herring (Carls et al. Chapter 1 ) . Biomagnification of mono- and di-aromatics in ova of herrlng exposed to the WSF of crude oil was somewhat lower ( I70 - 140 times) (Rice et al. 1987). but others have observed accumulation increases with ring size and methylation (Lee et al. 1972: Korn et 31. 1977; Roubal et al. 1977).
I29
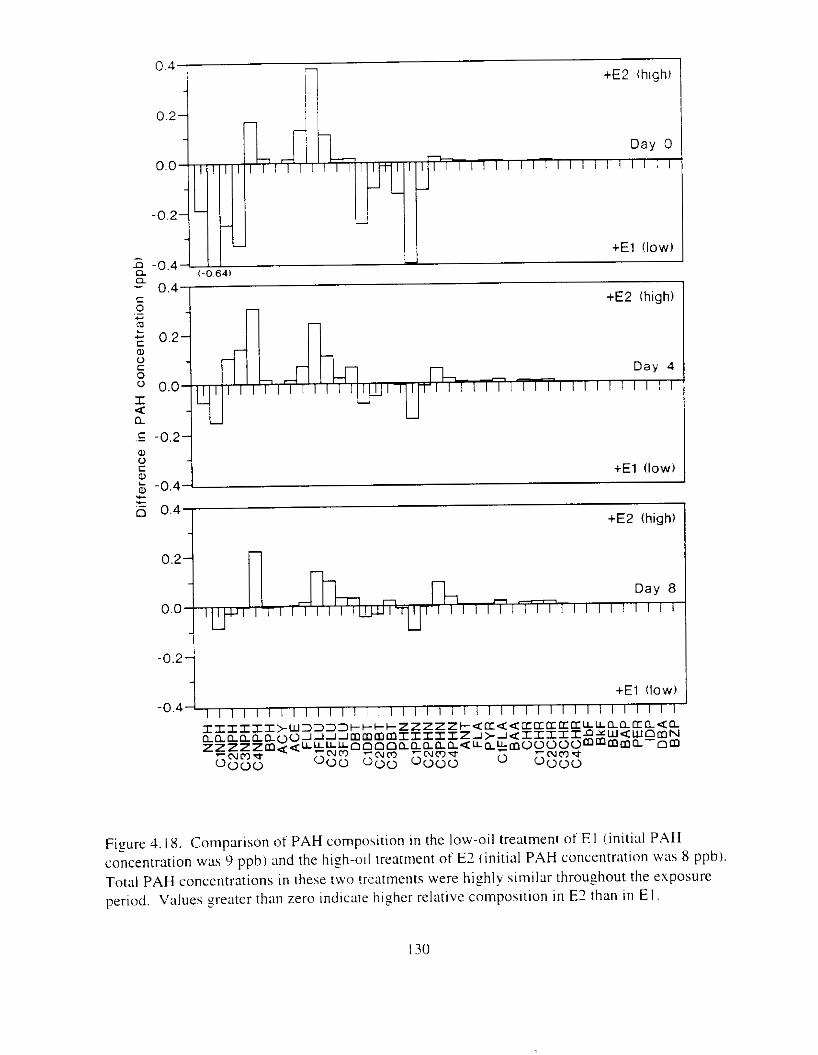
ClN
PH
-
NP
H -
C2N
PH
-
C3N
PH
-
C4N
PH
-
BP
H -
AC
Y -
AC
E -
ClF
LU
-
FLU
-
CZ
FLU
-
C3F
LU -
DB
T -
C2D
BT
-
ClD
BT
~
C3D
BT
-
PH
N -
ClP
HN
-
C2P
HN
-
C3P
HN
-
C4P
HN
-
AN
T -
F
LA -
PY
R -
CiF
LA
-
BA
A -
CH
R -
ClC
HR
-
C2C
HR
-
C3C
HR
-
C4C
HR
-
BbF
-
BkF
-
BE
P -
BA
P -
+
PE
R - '
DB
A - 2
IDP
- =
B
ZP
- -
Diff
ere
nce
in P
AH
con
cen
tra
tion
(pp
b)
P
0
P
4
3
?
L--,
0
P
?
P
w-&
I
The pattern oi bioaccumulatlon observed i n the I1loI-e weathered exposures LVLIS not anticipated: P.4H concentrations In eggs peaked within crrca 4 d. then declined. Declines may have simply been caused by the entropic relationship between PAH accumulation i n tissue and loss i n water. Another possibility was active metabolism and elimination of hydrocarbons by eggs. In juvenile and adult fish wlth inducible mixed function oxidase (MFO) enzymes. including herring. similar patterns of PAHs decline from tissue have been observed. even when PAH concentrations in water or food remained elevated iSchwartz 1985: Thomas et al. 1997). Cod eggs may metabolize aromatic hydrocarbons (Solbakken et al. 1984). thus occurrence of .UFO activity in herring eggs is plausible. We recommend that additional egg exposures should be conducted to determine MFO activity according to the immunohistochemical procedures of Smolowitz et al. ( I99 I ).
The biological response of herring eggs to oil and weathered oil suggests that observed effects were due to chemical toxicity. not other factors such as surface coatins as has been suggested by some researchers (Pearson et 31. 1985). This conclusion is based on several factors, including the dissolved state of PAHs. toxicity at very low concentrations. absence of visible coating, absence of visible slicks in incubatlon tanks. and demonstration of PAHs in internal tissues of similarly exposed adult herring. Had surface coating been the mechanism causing biological effects. toxicity should have been dramatically reduced at lower concentrations because significantly less coating would have been possible. Instead. toxicity in E2 remained high even though absolute PAH concentration dropped more than an order of magnitude, and effective concentrations were less than I ppb. Eggs were carefully inspected visually for evidence of oil coating, but no coating was observed. Furthermore. the toxicant delivery system was designed to exclude surface slicks. and slick formation was not apparent in treatment tanks. During incubation. the eggs remained below the water surface, further reducing the likelihood of coating.
Our data Indicate that dissolved PAHs entered eggs and interacted directly with embrvonic tissue. Enrichment of PAHs to alkanes in water relative to that in parent oil indicated solublization because PAHs are more soluble than aliphatic hydrocarbons (Marty et al. In press (b)). Dissolved. lipophilic PAHs can pass through egg chorions and bind to lipid rich material inside (Kuhnhold and Busch 1978: Solbakken et 21. 1984). In a study involving cod (Gdrrs morhcri, most of the radiolabeled hydrocarbons (including naphthalenes. phenanthrenes. and benzo[a]pyrene) accumulated by eggs were associated with the yolk. not the chorion (Solbakken et al. 1984). Similarly. 98% of radiolabeled naphthalene and 90% of labeled benzopyrene penetrated the chorion in Atlantic salmon ( S o l m o .valrrr) within 3 d (Kuhnhold and Busch 1978). The amount of aromatic hydrocarbon accumulated by herring eggs correlated with yolk size (Eldridge et al. 1978: Struhsaker 1977). indicating that the lipid rich yolk may store significant amounts of hydrocarbon. As yolk reserves are metabolized. hydrocarbons sequestered in yolk lipid likely interact with embryonic tissues. In a companion study. PAH concentrations increased i n interior tissues of similarly exposed adult herring. including ova (Curls et al. Chapter 3). clearly demonstrating that these hydrocarbons passed through biological membranes. Other
131
investlFators lhave ai50 observed t h a t hydrocarbons pas5 [hroush hioloycai ~nemb~-:~nt.h 111 ;ldult fish tKorn et al. 1976: Struhsaker 197:: Rice et ;II . I%37'l.
The intenslty of U V light 111 o u r laboratory during the lest procedures was prohahly n o t sufficient to activate a significant fractton o f the PAH molecules In our tests. However. clevated toxicity of PAHs as a result of photoactivation by UV light has been well documented (e,g.. Landrurn et a]. 1987). Although we did not measure the intensity of our representative fluorescent light source below 300 nm. our data suggested rapidly decreasing spectral energy at hhorter wavelengths. Other investigators have tound UV-B (265 to 330 nm) was not detectable from fluorescent light sources. and have used fluorescent lights as controls in tests designed to study photoactivation by UV light (Ankley et al. 1994). In addition. dosing apparatus was covered. distribution manifolds were protected from direct light. and estimated light intens~ty was 5 70 footcandles. of which 14- I 6 r t was UV. and less than 2% was below 330 nm.
Although we cannot prove that PAH toxicity was not elevated as a result of UV radiation i n the laboratory. photoactivation of P;\Hs in PWS after the spill was more likely because of direct exposure to sunlight at greater intensities. Thus. even if photoactivation did occur in the laboratory. it likely had a greater role in the natural environment. and thus one could argue that the surprisingly low effective PAH concentrations we mellsured (0.2 ppb) were conservative. We concede that light conditions in the natural environment were more variable i n the laboratory, e.g., varying water depth and clarity. but contend that the potential for photoactivation was greater in PWS than i n the laboratory.
Water auality standards
In light of the variable toxicity of petroleum products due to weathering, and the high toxicity of weathered oil. the water quality standards of the State of Alaska. 10 ppb aromatics. need refinement. In these experiments. significant biological responses were observed ah low as 0.2 ppb PAH. well below the published standard.
The relatively high toxic~ty cahibited by weathered oil in these experlments also suggests the conclusions reached by some invehtigators (Neff and Stubblefield 19951 that PAHs i n PWS in 1989 did not adversely effect biota i s likely erroneous. Short and Harris ( 1996a) observed PAH concentrations i n the water column up to 6.2 ppb. declining to :: I .6 ppb five W C K ~ S after thc spill. Although mean PAH concentrauons declined to 0.01 to 0.10 ppb by midsummer. concentrations in excess of 2 ppb were apparently observed i n open waters of PWS five months post-spill (Neff and Stubblefield 1995).
Concentrations of PAHs i n w a e r may have been even higher i n intertidal al-eah (1f PWS than suggested by the preceding observations. Oiled substrate can serve as a reservoir of oil capable of contaminating water that comes i n contact with i t . This was clearly demonstrated i n our experiments where this mechanism was exploited to contaminate treatment water. I n an oil spill situation. such ;IS i n PWS. we eupect [hat tidal interaction with oiled substrate would lead to
I32
similar water contamination patterns. and that the concentrations 111 and very near to the oiled substmte would be higher than i n open water. Indeed. the weatherin," patterns observed in these experiments were very similar to weathering patterns observed i n oiled substrate in PWS (Babcock and Short 1996). and the underlyin? weatherin: mechanism was the same (Short and Heintz. In press). Loss rates of PAHs in this type of laboratory study and in PWS both f i t first- order loss-rate kinetics. and demonstrated that laboratory results predict weathering behavior of petroleum introduced into subarct~c mar~ne env~ronments (Short and Heintz. In press).
The aromatic compounds observed in water i n this experiment, rmging from naphthalenes to chrysenes. were similar to those observed in PWS (e.?., Babcock and Short 1996: Carls et ai. 1996), but are fundamentally different from those observed in many earlier studies (e.g.. Rice et ai. 1979). Prior to 1989. oil-contamination tests routinely conducted at the Auke Bay Laboratory involved principally mono- and di-aromatic hydrocarbons. and the presence of compounds with more than two rings was negligible. Because the toxicity of aromatics increases with ring size. the toxicity observed i n our experiments is correspondingly greater than the toxicity published i n earlier work. For example. compare the 12 d LC50 for herring eggs published by Rice et al. ( 1987) of 1.500 ppb to the 61 ppb value observed i n this study. Again we emphasize that i t is not only how much oil is important. but also that the composition of the oil should he considered when formulating water quality standards.
Recommendations for future observation
Sensitivity of a wide variety of larval herring responses to oil were similar. and indicated significance at 0.7 ppb PAH i n E?. Yolk-sac edema and fin ray formation were the most sensitive measures of response. and indicated significance ut 0.2 ppb ( in E2). Lower jaw size was also significantly affected at 0.2 ppb ( i n E?), but was a less sensitive measure of response in the first experiment.
Our experience indicated that observation of yolk-sac edema yields maximum experimental sensitivity at minimum cost: preserved larvae could he assessed rapidly Ihr edema. For little more cost, these same individuals could be simult-neously assessed for other ~norphological defects. f in ray formation. and lower jaw size. However. larval age must be considered when determining measurement parameters. For example. edema is obvious in yolked larvae but may not be obvious i n older larvae. Other abnormalities. such as spinal deformation may be more important in older larvae.
Genetic assessment may he the best assessment tool i n field situations because capture may cause tissue damage. thus obscuring true morphological condition. Because it is labor intensive and not as sensitive as morphological assessment. the genetic assessment technique used in this study would be of less importance in similar experimental research, but was necessary in these tests to establish the relationship between morphological and genetic response Development of more sensitive genetic techniques would be useful.
I33
individuals. mixture with unaffected Ianae from other areas. ;I\ \\ell as home recovel-v of j3w development (Hose et d . 1996).
. .
.4lthough the existence of toxic effects in PWS herring efgs and larvae has been disputed (Pearson et al. 1995). PAH concentrations i n eggs measured at many locations i n 1989 appeared to be sufficient to elicit toxicity, based on the minimum effective concentrations estimated here 122 to 108 ppb i n egg tissuel. Herring eggs collected from some oiled sites in PWS i n 1989 had PAH concentrations in excess of 100 ppb (Pearson et al. 1995). Although Pearson et :II. (1995) claim the Es.ro~ V(1lde: crude oil fingerprlnt was not strong. sites exhibiting elevated concentrations were located within slick trajectories. suggesting that Exron Vuldez crude oil was the defircto source of contamination, Pearson et al. (1995) found correlation between egg mortality and total PAHs. due principally to response at the most contaminated site observed (about 350 ppb PAH i n egg tissue). but was unable to find a significant correlation between abnormalities and PAHs. In contrast. other studies (Brown et al. 1996: Hose et 31. 1996) observed morphologic and genetic responses identical to ours among herring larvae of differing ages that decreased with distance and time from the spill.
The mechanisms whereby herring eggs in PWS may have been exposed to oil likely varied. Some exposure may have been due to dissolved PAHs. as was tested in our study. Other exposure mechanisms may have involved mechanically dispersed oil (Short and Harris 1996b). adherent oil droplets (Pearson et al. 1985). exposure of intertidally spawned eggs to a PAH-rich surface layer (von Westernhagen et al. 1987), and direct coating by surface film or slick. Pearson et al. (1985) demonstrated that short exposure ( I d) of herring eggs to low concentrations (4 ppb) of mechanically dispersed oil could cause a significant increase i n larval abnormalities when oil droplets adhered to the eggs. Direct coating by visible slicks is an extension of this situation; the amount of adherent oil was apparently the major factor in determining toxicity in tests by Pearson et al, (1985). Even in the absence of a visible slick, petroleum hydrocarbons may be significantly concentrated i n the upper S O pm of the water column. leading to elevated toxicity when intertidally spawned eggs come i n contact with the microlayer during low tides (von Westernhagen et al. 1987: Kocan et 31. 1987).
Although i t is imposslble to directly relate E.r,rorl Vtrldez oil-PAH concentrations in ambient seawater. mussel tissue. and herring eggs, it is likely that biologically effective oil concentrations were exceeded at many oiled sites. To overcome problems with detection of low level PAHs, Hose et al. (1996) relied on PAH concentrations in intertidal mussels adjacent to herring egg beds since mussels bioaccumulate, but do not metabolize PAHs. All areas within the o i l trajectory sustained some level of oil exposure in 1989. and over 85% of pelagic larvae were collected within the oil trajectory. Ex,ron Vczldez PAH fingerprints were present at all oiled sites. although oiling was highly patchy. Identical types of sublethal damage were found in newly hatched and pelagic (offshore) larvae from oiled areas. consisting of premature hatching. growth depression. morphological defects. and genetic damage (Brown et al. 1996). In general. morphologic and genetic effects i n herring larvae were significantly correlated to the E.rxon
I35
CONCLL'SIONS
The frequency of chromosornal aberratlons was \iy~ificantly elevated i n the pectoral fins of larvae hatched from eggs exposed to oil during incubation.
Exposure to oil induced early hatch. caused egg and larval mortality. affected larval swimming and size. and caused skeletal. craniofacial. finfold. and pericardial abnormalities
Minimum effective concentmtions o1 the less weathered oil were 9 ppb (initial PAH). In the more weathered oil. minimum effective concentrations were 0.2 ppb PAH.
I n the less weathered oil. 2 d exposures to 38 ppb (initial PAH concentration) occasionally elicited significant responses: responses were frequently significant after 4 d exposure. In the more weathered oil. significant biolozical responses occurred after 4 d exposure to 0.7 ppb PAH.
Responses of herring larvae to the more weathered oil were greater than could be predicted by total PAH concentrations in less weathered tests, suggesting that toxicity of heavier, more substituted PAHs was greater than that of lighter. less substituted PAHs.
The implications of chromosomal aberrations i n mitotic cells is not clear. However. i t is likely most affected individuals would die due to concomitant morphological abnormalities.
Based on the biolo@cally effective PAH concentrations determined in this study. and concentrations observed in PWS. i t is likely that concentrations o f E u m Vtritic: crude o i l caused darnage i n incubating Pacific herring egzs i n PWS. This conclusion is consistent with the results o f Brown et al. (1996) and Hose et a / . ( 19%). hut not Pearson et :II. (1995).
I36
.ACKNOWLEDGMENTS
We thank John Campbell. Jamison Clark. Mary Dre\v. Cht-1s Hanson. Dave Love. Siaohong Luan. Nathan ,Magaret. Joshua .Millstein. Catherlne Pohl. Jeff Regelin. June Sage. Michele Sleeter. Justin Stekoll. and Bob Stone for technical laboratory assistance. We thank Larry Holland. Marie Larsen. and staff for the excellent quality hydrocarbon analyses. We thank Jeff Short for the original design o f the toxicant delivery system. We also thank the Alaska Department of Fish & Game Commercial Fisheries Divisions i n Juneau and Ketchikan for help i n collecting herring and for providing laboratory space. The research described i n this paper was supported by the error^ Vc~ldr: Oil Spill Trustee Council. However. the findings and conclusions presented by the authors are their own. and do not necessarily reflect the vxw or position of the Trustee Council.
I37
LITERATURE CITED
.Alderdice. D.F., and F.P.J. Velsen. 197 I . Some effects of salinlry and temperature on early development of Pacific l1er1-ins ~ C / u p e ~ r p n / / c z s i I . 1. Fish. Res. Bd. Can. 28: 1545-156'2
Ankley. G.T.. S.A. Coilyard. P.D. .Monson. m d P.A. Kosian. 1994. Influence of ultrav~olet light on the toxicity of sediments contamlnated wi th polycyclic aromatic hydrocarbons. Environ. Toxicol. Chem. 13: I79 I - 1796.
Babcock. M.M.. and J.W. Short. 1996. Prespill and postspill concentrations of hydrocarbons In sediments and mussels at intertidal sites i n Prince William Sound and the Gull ol Alaska. E w m Vdde: Oil Spill State/Federal Natural Resource Damage Assessment Final Report (Coastal Habitat Study Number IB). National Oceanic and Atmospheric Adm~nistration. National Marine Fisheries Service. Auke Bay Laboratory. I 1305 Glacier Highway, Juneau. Alaska 9980 I .
Brown. E.D.. T.T. Baker. J.E. Hose. R . M . Kocan. G.D. Marty, M.D. McGurk. B.L. Norcross. and J . Short. 1996. Injury to the early life history stages of Pacific herring in Prince William Sound after the E s r o , ~ Vrride: 011 spill. Pp. 448-462 irl S.D. Rice. R.B. Spies. D.A. Wolfe. and B.A. Wright [eds.], Proceedings of the E.r,wrf Vddez Oil Spill Symposium. American Fisheries Society Symposium Number 18. American Fisheries Society. Bethesda, Maryland.
Bue. B.G.. S. Sharr, S.D. Moffitt. and A. Craig. 1996. Effects of the Exxon V d d e oil spill on pink salmon embryos and preemergent fry. Pp.619-627 i r ~ S.D. Rice. R.B. Spies. D.A. Wolfe, and B.A. Wright [eds.]. Proceedings of the Errorl V d d r z Oil Spill Symposium. American Fisheries Society Symposium Number 18. American Fisheries Society. Bethesda. Maryland.
Carls. .M.G.. and S.D. Rice. 1990. Abnormal development and growth reductions of pollock T/wrtr,ynl c . h a l c . r , , y , r r , ~ r r n ~ ~ embryos exposed to water-soluble fractions of oil. Fish. Bull.. L1.S. 88:29-37.
Carls. M.G.. A.C. Wertheimer. J.W. Short. R.M. Smolowitz. J . J . Stegeman. 1996. Contamination of juvenile pink and chum salmon by hydrocarbons i n Prince William Sound after the €.r.wrl Vdde: oil spill. Pp. 593-607 i~ S.D. Rice. R.B. Spies. D.A. Wolfe. and B.A. Wright [eds.]. Proceedings of the Ex.rorr V d d c Oil Spill Symposium. American Fisheries Society Symposium Number 18. American Fisheries Society, Bethesda. .Maryland.
C;lrls. M.G.. G.D. Marty. T.R. Meyers. D.E. Hinton. R.E. Thomas. and S.D. Rice. Chapter I. Immune function. disease. and mortality in pre-spawn Pacific herring (Cl~cprrr prdlasi) exposed to weathered crude o i l .
I38
Carls. 41.G.. D.11. FI-erngen. J.E. Hohe. D. Love. R.E. Thomas and S.D. Rice. Clutper 3 . The lmpact of exposure of adult pre-spawn herring ( C / r r / w t l / x r / / t l . s i ) to oil on p r o p > ( compared to that of direct exposui-e otegss L O 0 1 1 during incubation.
Dushkina. L.A. 1973. Influence of salinity on egss. sperm m d 1;~v:te of low-vertebral herring reproducing in the coastal waters of the Soviet Union. .Mar. Biol. 19:210-223.
Eldridge. .M.B.. T. Echeverria. and S. Korn. 1978. Fate of I4C-Benzene in eggs and larvae of Pacific herring (Cllrprtl / ~ c i r r r ~ , ~ ~ r . s p c ~ / / c r . s i ) . J . Fish. Res. Bd. Can. 35(61:Y61 -865.
Heintz. R.. and J.W. Short. In prep. Effects of incubating i n oiled gravel on pink salmon. part I : Direct effects on embryo survival and development.
Hose. J.E.. M.D. McGurk. G.D. hlarty. D.E. Hinton. E.D. Brown. and T.T. Baker. 1996. Sublethal effects of the E.r.~or7 Vtrldr: oil spill on herring embryos and larvae: morphologic. cytogenetic. and histopathological assessments. 1989- I99 1 . Can. J . Fish Aquat. Sci. 532355.2365.
Hourston. A S . . H. Rosenthal. and H. von Westernhagen. 1984. Viable hatch from eggs of Pacific herring (Clllpetl I1tlrrngus p d I c u i ) deposited at different intensities on LL variety of substrates. Can. Tech. Rep. Fish. Aquat. Sci. 1274. 19 p.
Humphrey, E.C.. J.B. Marliave. and D.I. Kent. 1995. Morphological staging of larval Pacific herring. Pp. 207-217 irx D.E. Hay and P.B. McCarter [eds.], Proceedings of the Seventh Pacific Coast Herring Workshop. January 27-28. 1994. Can. Tech. Rep. Fish. Aquat. Sci. 2060. Nanaimo. British Columbia.
Johnson. S.W.. M.G. Carls. R.P. Stone. C.C. Brodersen. and S.D. Rice. In press. Reproductive success of Pacific herring (C/ I I /J~W p d / c l s i ) i n Prince William Sound. Alaska. hix years after the E.r.rorz V d d c oil spill. Fishery Bulletin. [Chapter 5 . this report].
Kocan. R.M., H. van Westernhagen. M.L. Landolt. and G. Furstenberg. 1987. Toxicity of sea- surface microlayer: effects of hexane extract on Baltic herring (Cluprtr /wrrrl,yrr.s) and .Atlantic cod (Gt~c/r~.s rjtorhrul) embryos. ,Mar. Environ. Res. 3 2 9 1 - 3 0 5 .
Kocan. R.M.. J.E. Hose, E.D. Brown. and T.T. Baker. 1996. Pacific herring ( C / I ~ / J ~ ~ I /xri/usi) embryo sensitivity to Prudhoe Bay petroleum hydrocarbons: labomtory evaluation and i n siru exposure at oiled and unoiled sites in Prince William Sound. Can. J . Fish. Aquat. Sci. 53:2366-2375.
Korn. S.. N. Hirsch. and J.W. Struhsaker. 1976. Uptake. distribution. and depurdtion of "c- benzene in Northern Anchovy. E,I,yrclltlis rnorclc~x. and Striped Bass. Mororlr . sc l sc l r iks .
Fish. Bull. 74:545-551.
I39
Kuhnhold. W.W.. and F. Busch. 1978. On the uptake ot three different types o f hydrocarbons by salmon eggs ~ . S d m o s t r i w l . Meeresforschung ?6:50-59.
Landrum. P.F.. J.P. Giesy. J.T. Oris. and P.M. Allred. 1987. Photoinduced tox~city ot polycyclic aromatic hydrocarbons to aquatic organisms. Pp. 304-3 18 i r ~ J.H. Vandermeulen and S.E. Hrudey [eds.], Oil in freshwater: Chemistry, biology. countermeasure technolosy. Proceedings of the Symposium of Oil Pollution i n Freshwater. Edmonton. Alberta. Canada. Pergamon Press. .Ueb York.
Lee. R.F.. R. Sauerheber. and G.H. Dobbs. 1072. Uptake. metabolism and discharge o t polynuclear aromatic hydrocarbons by marine fish. Mar. Biol. 17(3):201-208.
Linden. 0. 1976. The influence of crude oil and mixtures of crude oil/dispersants on the ontogenic development of the Baltic herring, Cluprtr iwrCwqus rnernhrcrs L. .\mbio 5(3):136-140.
Long, E.R.. M.F. Buchman. S.M. Bay. R.J. Breteler, R.S. Carr. P.M. Chapman, J.E. Hose. A.L. Lissner. J. Scott, and D.A. Wolfe. 1990. Comparative evaluation of five toxicity tests with sediments from San Francisco Bay and Tomales Bay. California. Environ. Toxicol. Chem. 9:l 193-1714.
Longwell. A.C. 1977. A genetic look at fish eggs and oil. Oceanus 20(4):46-58.
Longwell. A.C.. and J.B. Hughes. 1980. Cytologic. cytogenetic and developmental state of Atlantic mackerel eggs from %I s u r f x e waters of the S e w York Bight. and prospects lor biological effects monitoring wl th ichthyoplankton. Rapp. P:v. Reun. Cons. I n t . Explor. Mer 119:275-291
Marty. G.D.. J.E. Hose. M.D. McGurk. E.D. Brown. and D.E. Hinton. In press ( a ) . Histopathology and cytogenetic evaluation of Pacific herring larvae exposed to petroleum hydrocarbons in the laboratory or i n Prince William Sound. Alaska, after the E ~ r o r ~ Vtrlde: oil spill. Canadian Journal of Fisheries and Aquatic Sciences.
Marty, G.D.. J.W. Short. D.M. Damback. N.H. Willits. R.A. Heintz. S.D. Rice. J.J. Stegeman, m d D.E. Hinton. In press (bi . Ascites. premature emergence. increased Sonadal cell 3poptosis. and cytochrome P4501A induction in pink salmon larvae continuously exposed to oil-contaminated gravel durins development. Canadian Journal o i Zoology.
11cGurk. M.D.. D. Warhurton. T. Pukel- . ; ~ n d kt. Litke. 1990. E x I y life hlstory 01' Pacliic herring: 1989 Prince William Sound herrins egg incubation cxperiment. Final Report. Contract number 5OABNC-7-OOI4 I . Triton Environmental Consultants LTD.. 41 20- 135 I I Commerce Parkwav. Richmond. British Co1urnhi;I. Canada. V6V 1L I.
McGurk. M.D.. and E.D. Brown. 1996. Egg-larval mortality of Paclfic herring in Prince William Sound. Alaska. after the E . w m Vdde: oil spill. Can. J . Fish. Aquat. Sci. 53:2343-2354.
.Meacham. C.P.. and J.R. Sullivan. 1993. Summary of injuries to fish and shellfish associated with the Ex~rorz I'crlder oil spill. Pp. 27-29 in E.rrorf V d l r : Oil Spill Symposium. Program and Abstracts. E.r,wrr b'ulde: Oil Spill Trustee Council. University of Alaska Sea Grant College Prosram. American Fisheries Society, Alaska Chapter. Anchorage. Alaska.
.Moles. A.D., S.D. Rice and M.S. Okihiro. 1993. Herring parasite and tissue alterations following the E.rxorz Vdde: oil spill. Pp. 325-328 i r l Proceedings of the 1993 Oil Spill Conference. American Petroleum Institute Publication No. 4580. API. Washington. D.C.
Yeff. J.M.. and W.A. Stubblefield. 1995. Chemical and toxicological evaluation of water quality following the E n o n Vdde: oil spill. Pp. 141-177 irl P.G. Wells. J.N. Butler, and J.S. Hughes [eds.], E.rmn Vtrkkz Oil Spill: Fate and Effects in Alaskan Waters. ASTM STP 1219. American Society for Testing and Materials, Philadelphia.
Norcross. B.L.. J.E. Hose, M. Frandsen. and E.D. Brown. 1996. Distribution. abundance. morphological condition and cytogenetic abnormalities of larval herring in Prince William Sound, Alaska following the E S X O ~ I Vtrlde: oil spill. Can. J . Fish. Aquat. Sci 5312316-2387.
Outram. D.. and R. Humphreys. 1974. The Pacific herring i n British Columbia waters. Fisheries and lMarine Service Pacific Biol. Station Circular #loo. Nanaimo. British Columbia.
Pearson. W.H.. D.L. Woodruff. S.L. Kiesser. G.W. Fellingham. and R.A. Elston. 1985. Oil effects on spawning behavior and reproductlon i n Pacific herring (Cl~rpcw irnrerfqtrs p t f k t s i ) . Final Report to Amer. Petrol. Inst. Battelle Marine Res. Lab. Sequim. Washington. OF-1742. API publication No. 4412. 108 p.
Pearson. W.H.. E. Moksness. and J.R. Skalski. 1995. A field and laboratory assessment of oil spill effects on survival and reproduction of Pacific herring following the E.rwrf l'c~ldr: spill. Pp. 626-661 i r z P.G. Wells. J.N. Butler. and J.S. Hughes [eds.]. E.r.ron Vnlrle: Oil Spill: Fate and Effects i n Alaskan Waters, ASTM STP 1219. American Society tor Testing and Materials. Philadelphia.
Purcell. J.E.. D. Grosse. and J . 1. Glober. IOcIO. &I;ISS abundance> ot abnormnl Pucltic herrlng larvae at a %,pawning yound In Brltish Columbia. Trans. .\mer. Fish. Soc. I I O : -163-469.
Rice. S.D. 1985. Review: Effect5 o 1 ' 0 1 1 on tish. Pp. l57-IS1 I J I F.R. En_pelbal-dt [ed . ] . Petroleum effects i n the Ai-ctlc environment. Chapter 5 . Elsevier Applied Sc~ence Publishers. New York. 28 I p .
Rice. S.D.. J.W. Short. and J.F. Karinen. 1977. A review of comparative oil toxicity and comparative animal sensitivity. Pp. 78-94 in Wolfe. D.A.[ed.]. Fate and Effects of Petroleum Hydrocarbons i n Marine Organisms and Ecosystems. Pergamon Press. New York. 478 p.
Rice. S.D.. D.A. Moles. T.L. Taylor. and J.F. Karinen. 1979. Sensitivity of 39 Alaskan marine hpecies to Cook Inlet crude 011 and S o . 2 fuel oil. Pp. 549-554 in API. EPA. and USCG. 1979 Oil Spill Conference (Prevention. Behavior. Control. Cleanup). Proceedings. American Petroleum Institute. Wclshington. D.C. 728 p.
Rice. S.D.. M.M. Babcock. C.C. Brodersen. 5.4. Gharrett. and S. Korn. 1987. Uptake and depuration of aromatic hydrocarbons by reproductively ripe Pacific herring and the subsequent effect of residues on egg hatching and survival. Pp. 139- 154 i r r W.B. Vernberg, A. Calabrese. F.P. Thurberg. and F.J. Vernberg [eds.], Pollution and Physiology of Estuarine Organisms. Belle W. Baruch Libr. Mar. Sci. 17. Un iv . of S.C Press, Columbia. South Carolina. 545 p.
Rosenthal. H. and D.F. Alderdice. 1976. Sublethal effects of environmental stressors. natural and pollutional. on marine fish eggs and larvae. J. Fish. Res. Bd. Can. 33:2047-2065.
Roubal. W.T.. T.K. Collier. and D.C. Malins. 1977. .Accumulation and metabolism of I4C labeled henzene. naphthalene. and anthracene by young coho salmon I ~ ~ I ~ ~ ~ ~ , - / I \ . ~ I ~ . / I I ~ . s Ximrcll). Arch. Enwron. Toxicol. 5 5 13-529.
SAS Instltute. Inc. 1989. SASISTAT L'5er.s Guide. Vel-sion 6. 4 t h Edition. Volume 2. Cary. North Carolina. X46 p.
Sharp. J.R.. K.W. Fucik. and J.M. Neff. 1979. Physiological basis of differential sensitivity of fish embrvonic stages to oil pollution. Pp. 85-108 in W.B.Vernberg, .1. Calabrese. F.P. Thurberg. and F.J. Vernber: [eds.]. Marine pollution: functional responses. .Academic Press. New York. 454 p.
Schwartz. J.P. 1985. Effects of oil-contaminated prey on the feeding and growth rate of pink ralmon frv O ~ ~ c . o r / ~ ~ ~ ~ c h ~ r . s vorhu.so/lci. Pp. 459-476 in F.J. Vernberg. F. Thurberz. A. Calabrese and W . Vernberg [eds.]. Pollution and Physiology of Marine Organisms. Belle W . Baruch Libr. Mar. Sci. 17. L ' n i v . of S.C. Press. Columbia. South Carolina. 545 p.
Short. J.W.. and P..M. Harris. I996a. Chsmlcal sampling md :Inalysls o t petroleurn hydrocarbons i n near-surfxe 5eaw;Lter of Prince William Sound after the E.Y.VOII V<~kk,: oil spill. Pp. 17-28 i r ~ S.D. Rice. R.B. Spies. D..A. Wolfe. and B.A. Wright [eds.]. Proceedings of the E~v.w/l V ~ ~ i t l e : Oil Spill Symposium. Amerlcan Fisheries Society Symposium Number 18. .-\mertcan Fisheries Society. Bethesda. .\/laryland.
Short. J.W.. and P.M. Harrls. l996b. Petroleum hydrocarbons i n cased mussels deployed in Prince William Sound after the E . w m Vdde: 011 spill. Pp. 79-39 i r t S.D. Rice. R.B. Spies. D.A. Wolfe. and B.A. Wriyht [eds.], Proceedings o f the E s ~ o r t V(~ir/c,: Oil Spill Symposium. American Fisheries Society Symposium Number 18. American Fisheries Society. Bethesda. .Maryland.
Short. J.W.. T.J. Jackson. .M.L. Lursen. and T.L. Wade. 1996. Analytical methods used for the analysis of hydrocarbons i n crude oil, tissues. sediments. and seawater collected for the Natural Resources Damage Assessment of the E-erorz V d d e ; oil spill. Pp. 140- I48 i r l S.D. Rice. R.B. Spies. D.A. Wolle. and B.A. Wright [eds.]. Proceedings of the E . Y . Y ~ Volde: Oil Spill Symposium. .American Fisheries Society Symposium Number 18. American Fisheries Society. Bethesda. Maryland.
Short, J.W.. and R.A. Heintz. In press. Identification ofE.xxon Vddc: oil in sediments and tissues from Prince William Sound and the northwestern Gulf of Alaska based on PAH weathering. Environmental Science and Technology.
Sigmastat. 1994. Sigmastat Statistical Software. Jandel Scientific. San Rafael. California
Smolowitz. R.M.. M.E. Hahn. and J.J. Stegeman. 1991. Immunohistochemical localization of cytochrome P-450IAI induced by 3.3'.4.4'-tetr;lchlorobiphenyl and by 2.3.7.8- tetrachlorodibenzo-furan i n liver and extrahepatic tissues of the teleost Sruwfom1(.s d l r T s o p s (Scup). Drug Metabolism and Disposition 19: I 13- 123.
Snedecor. G.W.. and W.G. Cochran. 1980. Statistical .Methods. 7th Edition. The Iowa State University Press. ,Ames. Iowa. 507 p.
Solbakken. J.E.. S. Tilseth nnd K.H. Palmork. 1984. Uptake and elimination o f arotnatfc hydrocarbons and a chlorinated biphenyl in eggs and larvae of cod C d u s t m w / f u [ [ . Mar, Ecol. Prog. Ser. 16:297-301.
Stevenson. J.C. 1949. The extent of herring spawning i n British Columbia in 1949. Pro, uress Reports o f the Pacific Coast Stations 80:57-58.
Struhsaker. J.W. 1977. Effects of benzene (;I toxic component of petroleum) on spawning Pacific herring, Clupec~ / w c w q I ( . s p l l n s i . Fish. Bull. 75:43-49.
I43
.
Taylor. F.H.C. i964. Lite 1h1sro1-y and present sti1tt15 o t B~- i t~sh Co lu~nb ia he r r in~ brocks. Bull Fish Res. Bd. Can. 143. Slp.
Thomas. R.E.. h1.G. Caris. S.D. Rice. ;md L. ShaZI-un. 1007. .Mixed function oxidase ~nduction In pre- 2nd post-spawn herrinf (C/u/mr / l d / t l . S i J by petroleum hydrocarbons. Comparat~ve Biochemistry ~ n d PhysloioZy I16C: 141-147. [Chapter 2. this report].
yon Westernhagen. H. 1988. Sublethal cffects o f pollutants on fish eggs and larvae. Pp. 253-346 i n W.S. Hoar and D.J. Randall [eds.]. Fish Physiolosy. Vol. XIA. Academic Press. New York.
von WesternhaZen. H.. 4 1 . Landolt. R. Kocan. G. Fursrenber:. D. Janssen. and K. Krernling. 1987. Toxicity of Sea-hurface microlayer: effects on he!-ring and turbot embryos. Mar. Environ. Res. 13:173-290.
Wertheimer. A.C.. and A G . Celewycz. 1996. Abundance and growth ofjuvenile pink salmon in oiled and non-oiled locations of western Prince William Sound after the Exvorf Vrddr: oil hpill. Pp. 518-532 i n S.D. Rice. R.B. Spies. D.A. Wolfe. and B.A. Wright (eds.]. Proceedings of the EXYO~I Vultle: Oil Spill Symposium. American Fisheries Society Svmposium Number 18. American Fisheries Society. Bethesda. Maryland.
Willette. M. 1996. Impacts of the E~LYO~I Vdde,- oil spill on the migration. growth and survival of juvenile pmk salmon in Prince William Sound. Pp. 533-550 i n S.D. Rice. R.B. Spies. D.A. Wolfe. and B.A. Wright [eds.], Proceedings o f the E.eror1 Vtrlde: Oil Spill Symposium. American Fisheries Society Symposium Number 18. American Fisheries Society. Bethesda. Maryland.

I45
Chapter 5: Reproductive success of Pacific herring (Clupeu puflusi) in Prince IVilliam Sound. Alaska. six years after the Exxorz Vulder Oil Spill
S.W. Johnson. .M.G. Carls. R.P. Stone. C.C. Brodersen. and S .D . Rice
ABSTR.ACT
The E . ~ x o r ~ Vdrir; o i l spill occurred just prlor to the sprln: migration oi Pacific herring (Cluq~ecr pdlus i ) from offshore feeding grounds to nearshore spawning areas in Prince William Sound (PWS). Alaska. .Most or all of the life stages of herring in PWS may have been exposed to oil after the lMarch 1989 spill. Delayed impacts from the spill were suspected as one possible cause in the unprecedented crash of the adult herrlng population i n 1993 and stimulated studies to ~ S S K S S reproductive success. In spring 1995. mature herring were collected from four sites in PWS and from three unoiled sites i n southeast Alaska (SEAKI to determine if reproductive impairment was evident in PWS herring six years after the spill. Herring were artificially spawned and resultant eggs were reared in a laboratory unt i l hatch. Observed response parameters included fertilization success. hatch timing, hatch succcss. and larval viability. swimming ability. and spinal abnormalities. Responses of all year-classes combined or restricted to the same year-class did not differ significantly between regions ( P > 0.50); the best and worst responses generally occurred i n SEAK. Within each site, response of the 1989 year-class (most likely impacted by the oil spill in PWS), generally did not differ significantly from any other year class. To verify macroscopic observations. a subset of larvae from the 1989 year class was also inspected microscopically for yolk and pericardial abnormalities and yolk volume was measured: no significant regional differences were observed for m y morphological category. Based on the parameters examined in this study. evidence of reproductive impairment of Pacific herring i n PWS by the spill was not detected in 1995. and the chances of detecting any 0 1 1 related effects against the natural background variation appear neglizible
The oil spill i n PWS occurred just a few weeks prior to the Pacific herring ( C / I ~ W J p / / m i ) spawning season. Most or all o t the life stases of herring 111 PWS ma! have been exposed to oil after the March 1989 spill. Biologically available hydrocarbons were present i n the upper water column of PWS for several weeks following the spill (Short and Hams 19963) and residual oil may have persisted i n some areas into 1090 (Short and Harris i996bi. .An estimated 40.50% of the egg biomass in PWS was deposited within the oil trajectory in 1989 (Brown et al. 199hai. The failure of the 1989 year class to recruit to the fishery and subsequent population crash i n 1993 iMeyers et al. 1994) suggested the early life stages of herring were Impacted either from exposure of pre-spawning adults or by direct exposure o i eggs and larvae. Thus. as fish exposed to oil were recruiting into the fishery (20% by age 3. 80% by q e 4. 100% h y age 5 funk I994)), the herring population crashed. and recovery was minimal throuch the
1996 season ( J . Wilcock. Personal ~OtllnlLllltcationI. Genetlc damage. Imorpholoycal deform~t~es. and small size were Ireported for newly hatched Iarwe following the spill (Brown et dl. l996a: Hose et ;)I. 1996: Norcros et ;)I. 1996: Marty et 21. I n pressi. but long-term effects remain unknown. In a preliminary htudy i n 1992. Kocan et a i . (1996h) observed decresed reproductive success of herring from im oiled area i n PWS compared to an unoiled area: results were inconclusive. however. because only two sites were compared. Delayed impacts from the spill were suspected as one possible cause In the population decline and stimulated the need for more definitive studies to assess ceproductive success of herring.
The purpose of this study was to determine if reproductive impairment potentially caused by the spill was evident i n PWS herrins six years after the spill. There were two major focuses in the study: I i a comparison o f reproductive success between regions (PWS and SEAK) and 2 ) a comparison of reproductive success between year classes within sites. particularly the I989 year class [most likely impacted by the 0 1 1 spill) to other year classes i n PWS.
Sites sampled within PWS included all areas where spawning occurred i n 1995: spawning was absent i n areas that were heav~ly oiled 111 1989. For example. Naked Island which was in the middle of the spill trajectory. had 22 km of spawn in I989 (Brown et al.1996ai but none i n 1995. .Although some have speculated that herring home to the same general spawning area each year (Zi.ilsrra 1963: Hourston 1982). site fidelity is poorly understood and we can only assume that herring sampled in PWS in 1995 may or may not have been exposed to oil at some earlier time i n their life history (adult. eggs, or larvae).
METHODS
Herring were collected at four sites in PWS and at three sites in SEAK (Figure. 5 . I ): all sites had spawn i n previous years. Two o f the sites in PWS (St. .Mathews Bay and Fish Bay) were not directly oiled from the sp~ll. whereas the other two sites (Port Chalmers and Rocky Bav) were at least lightly olled. Shortly after the spill. elevated hydrocarbon levels were detected i n mussels at Rocky Bay (Brown et 31. 1996b) and i n seawater at Pot-t Chalmers (Cat-ls 1996). Additionally in Port Chalmers. concentrations ot oil metabolites in bile of adult herrtng sampled i n spring 1990. were similar to metabolite concentrations observed i n 1989. suggesting continued contamination (Brown et 31. I996b). Herring were collected i n St. .Mathews Bay on 7 April. Fish Bav on I 4 April. Port Chalmers on 30 April. and Rocky Bay on I May 1995. In SEAK. herring were collected i n Sitka on 29-30 March. Ketchikan on I I April. and Seymour Canal o n 13 May 1995.
.Mature herring were captured durinz or just prior to spawnlng at all sites. sorted by size, and artificially spawned. Capture methods included gill net. cast net. and purse seine. Fish were chilled immediately after capture and transported within 7 I1 to a field laboratory. except Seymour Canal fish that were rransported directly to the A u k Bay LaborJtol-y (ABL). To approximate the
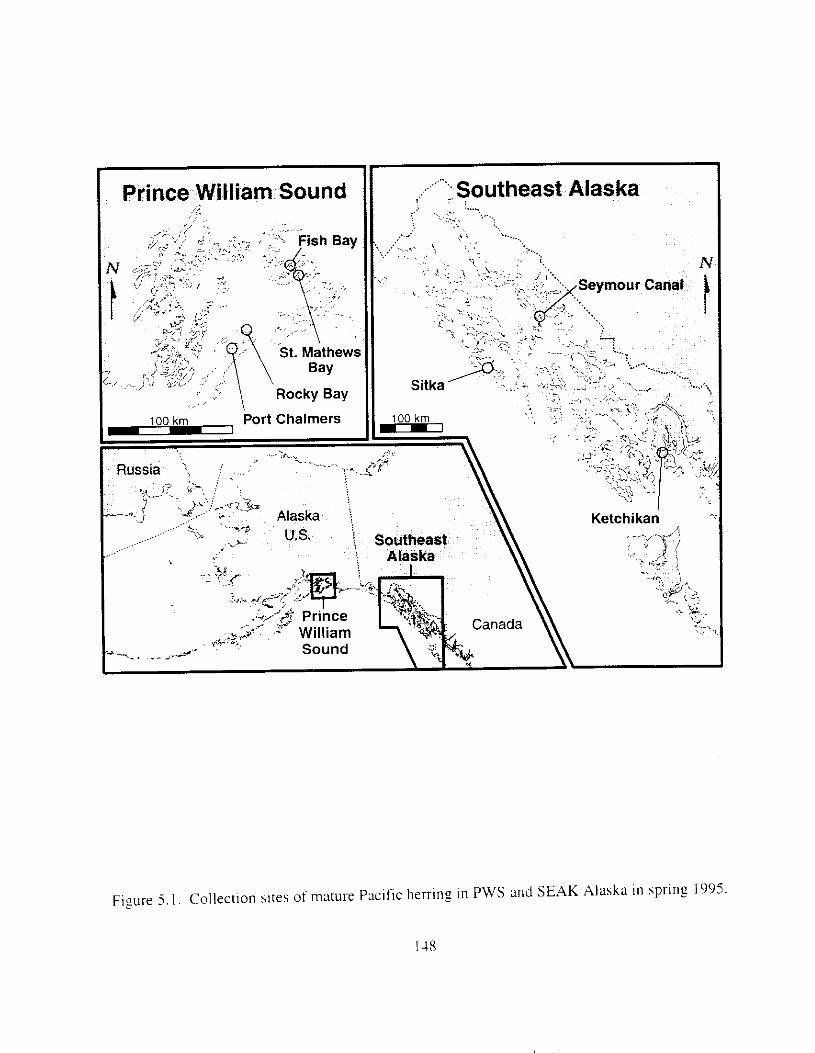
Jifferenr >?e-classes present. t i h h were sorted by S K Y ;mi ~ I Z C ' i u u a l l y i n IO mtn increments: e.g.. 720-230 mm fork lengthl. Six or more size classes were t h ~ ~ a l l y Identified at each site. From each size class. 25 females were artifici;llly spawned with males ot the same size: ~enerully 3 Inales contributed sperm for all 25 c~-osses. Size classes were processed at randorn. Each fish \vas assigned a unlque identification number. measured to the ne:are\t mm (fork length). and weighed to the nearest 0. I g (wet weight,. To determine age. three scales were removed from the left side of each spawned fish near the posterior margin o f the dorsd fin. placed succulus side down on a glass slide. and covered with a second slide.
For spawning, testes were removed and sealed i n :I plastic bag and maintained in chilled seawater until use; ovarian membranes were cut longitudinally and eggs were removed with a hydrocarbon-free stainless steel spatula similar to methods used by E.D. Brown (Personal communication). From each female. approximately 150 eggs were deposited with gentle swirling onto a 25 x 75 mm glass slide placed on the bottom o f a shallow plastic dish filled with seawater. Individual slides from each female were placed i n a stalning rack and suspended in separate I L beakers of seawater. Milt was prepared from collected testes by cutting sections from each contributing male into small segments: segments plus a small amount of seawater were mixed with a spatula. A few ml of m i l t were added to each beaker containing eggs. Eggs and milt remained i n contact for 5 min: milt was then poured off and the eggs were gently rinsed in seawater. Slides were kept i n staining racks and maintained i n ambient seawater with constant aeration until transport to ABL by air. To transport the eggs. staining racks were placed in plastic containers filled with seawater and placed i n coolers with blue ice.
Slides with eggs from each site were randomly distributed among twelve. 600 L living streams with flow-through seawater. Slides were suspended from monofilament line attached to a pivoting overhead framework designed to cause slow movement ( I rpm) through the water. During the first 16-18 d of incubation. all slides were maintained directly in the seawater bath. A few days before hatch. each slide was isolated i n a I L ?lass jar containing seawater: ,jars were surrounded by flowing seawater. Lighting was natural. supplemented by overhead tluorescent light during daylight hours. Seawater flow was approximately I Linlin at 3.9'C. warming to 7.1 "C due to normal seasonal change. Salinity was 32 t I ppt.
Reproductive success of female herring was defined as the production of morphologically and functionally normal larvae. Key reproductive parameters included hatching success and larval viability, swimming ability, and spinal abnormalities. These four parameters were sensitive to oil i n laboratory studies (Curls et (11. Chapter 41. Other parlrmeters examined included fertility and hatch timing. Fertility was not considered a key parameter because it may have been negatively intluenced by unavoidable handling conditions at the different sites and by variable gamete storage time prior to spawning. Hatch timing was not considered a key parameter because it was stransly intluenced by seasonal increases in water temperature.
Fertilizatlon success and stage of development were determined I to IO d after spawning. Eggs along slide margins that were susceptible to mechanical damage. and clumps of eggs not
1-10
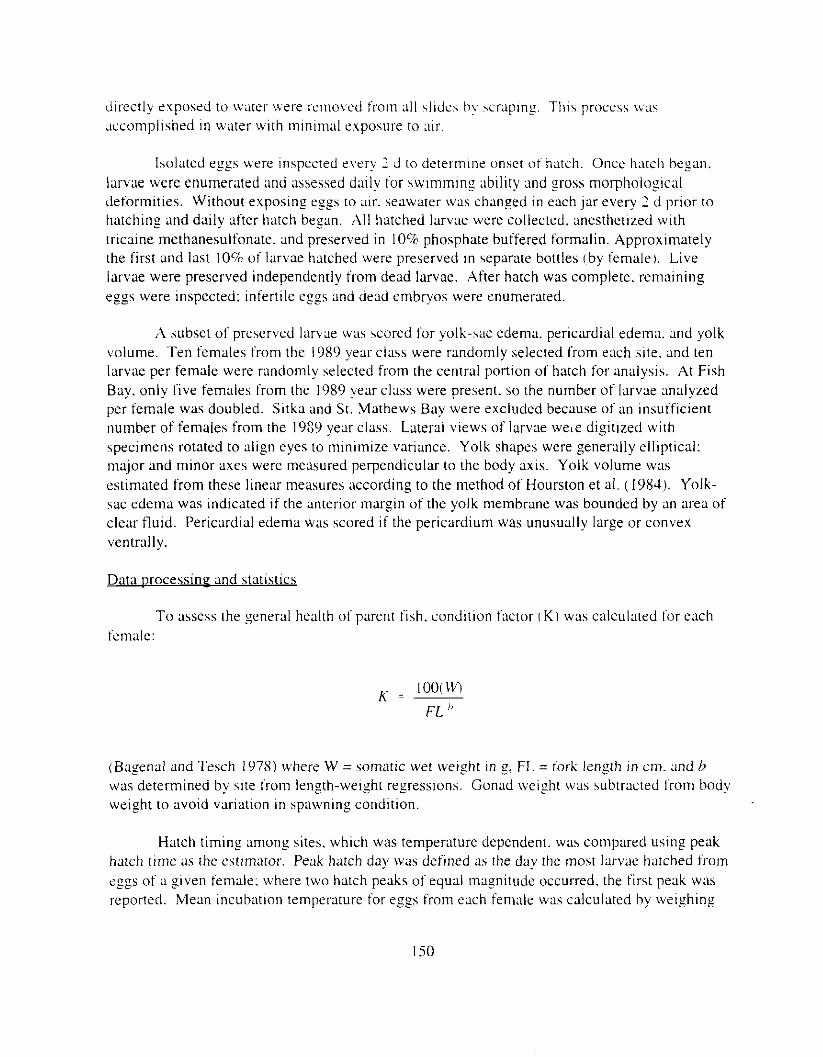
os I
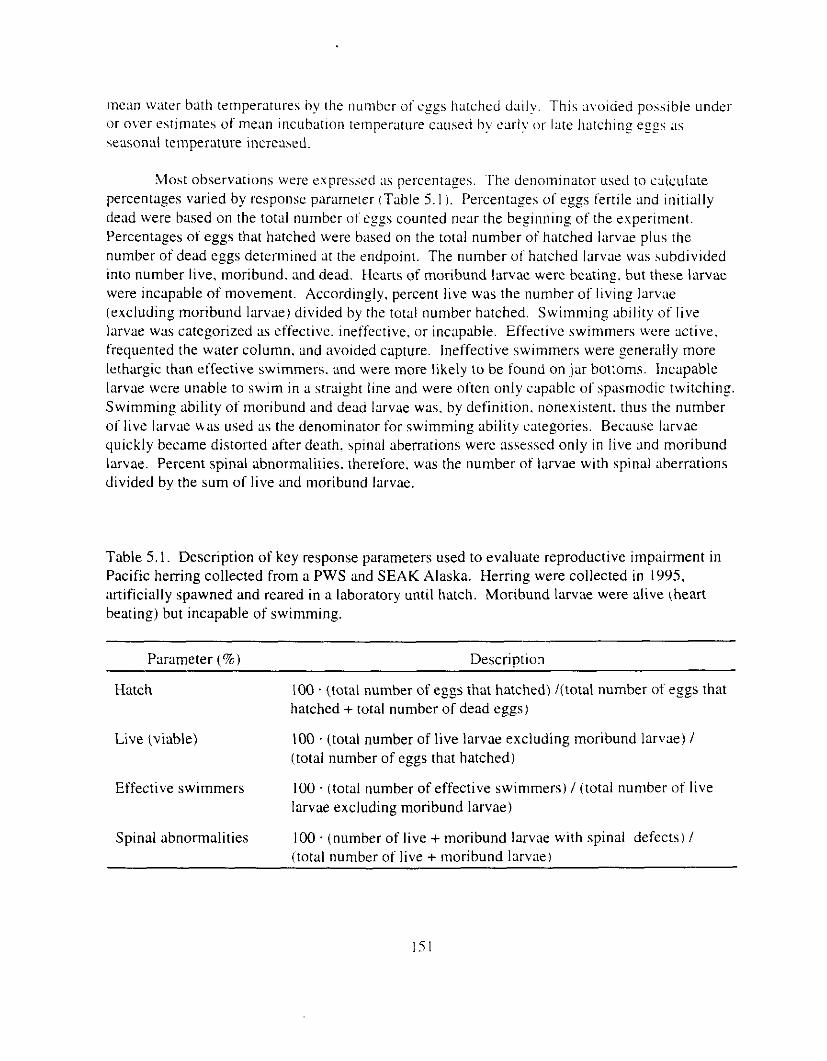
mean water bath temperatures by [he number o i e g s hatched d u l y , This avoided possible under or over estimates of mean incuhatlon temperxure caused h! early 01' late hatching eggs ;IS seasonal temperature increased.
Most observatlons were expresscd :IS percentages. The denominator used to calculate percentages varied by response parameter (Table 5 . I ) . Percentages of eggs fertile and initially dead were based on the total number of e g g counted near the besinning of the experiment. Percentages of eggs that hatched were based on the total number of hatched larvae plus the number of dead eggs determined at the endpoint. The number of hatched larvae was subdivided into number live. moribund. and dead. Hearts of moribund larvae were heating but these larvae were incapable of movement. Accordingly, percent live was the number of living larvae (excluding moribund larvae) divided by the total number hatched. Swimming ability of live larvae was categorized as effective. ineffective, or incapable. Effective swimmers were active, frequented the water column. and avoided capture. Ineffective swimmers were generally more lethargic than effective swimmers. and were more likely to he found on jar botzoms. Incapable larvae were unable to swim in a s t r ight line and were often only capable of spasmodic twitching. Swimming ability of moribund and dead larvae was. by definition. nonexistent. thus the number of live larvae was used as the denominator for swimming ability categories. Because larvae quickly became distorted after death. spinal aberrations were assessed only in live and moribund larvae. Percent spinal abnormalities. therefore. was the number of larvae with spinal Ilberrations divided by the sum of live and moribund larvae.
Table 5 . I . Description of key response parameters used to evaluate reproductive impairment in Pacific herring collected from a PWS and SEAK Alaska. Herring were collected in 1995, artificially spawned and reared in a laboratory until hatch. Moribund larvae were alive (heart beating) but incapable of swimming.
~
Parameter (%) ~~
Descriution
Hatch 100 ' (total number of eggs that hatched) /(total number of eggs that hatched + total number of dead eggs)
Live (viable) 100. (total number of live larvae excluding moribund larvae) / (total number of eggs that hatched)
Effective swimmers 100 . (total number of effective swimmers) /(total number of live larvae excluding moribund larvae)
Spinal abnormalities 100. (number of live +moribund larvae with spinal defects) / (total number of live + moribund larvae)
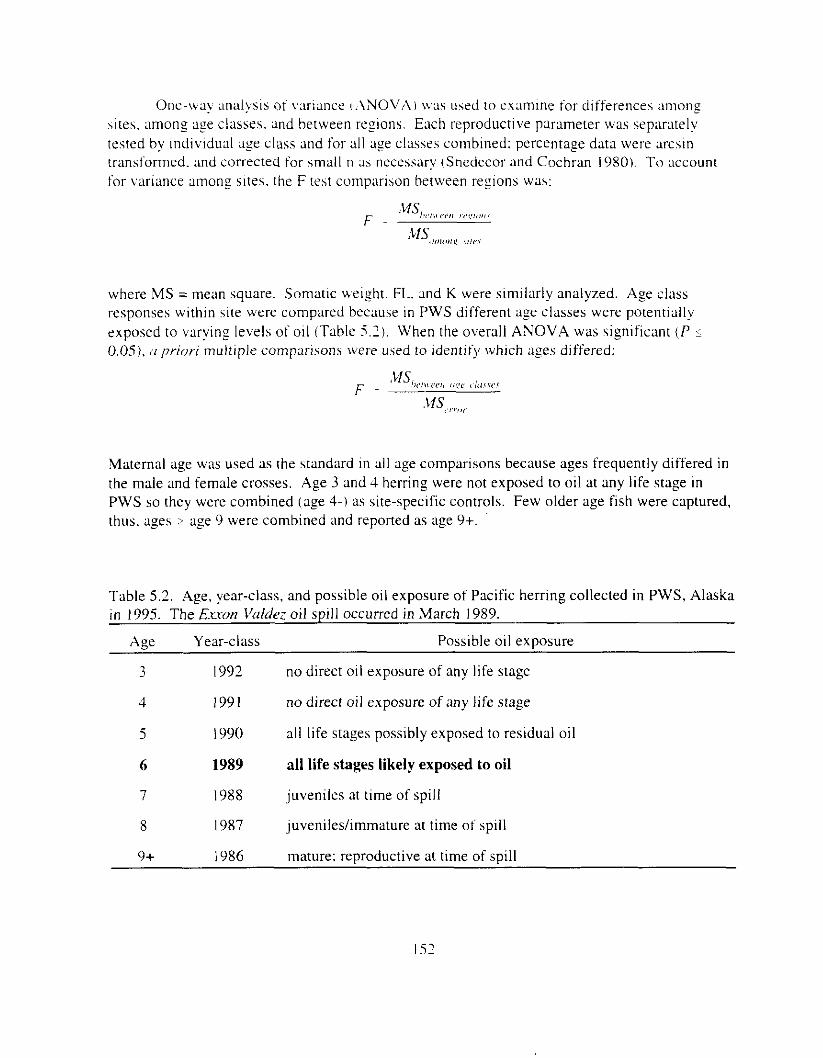
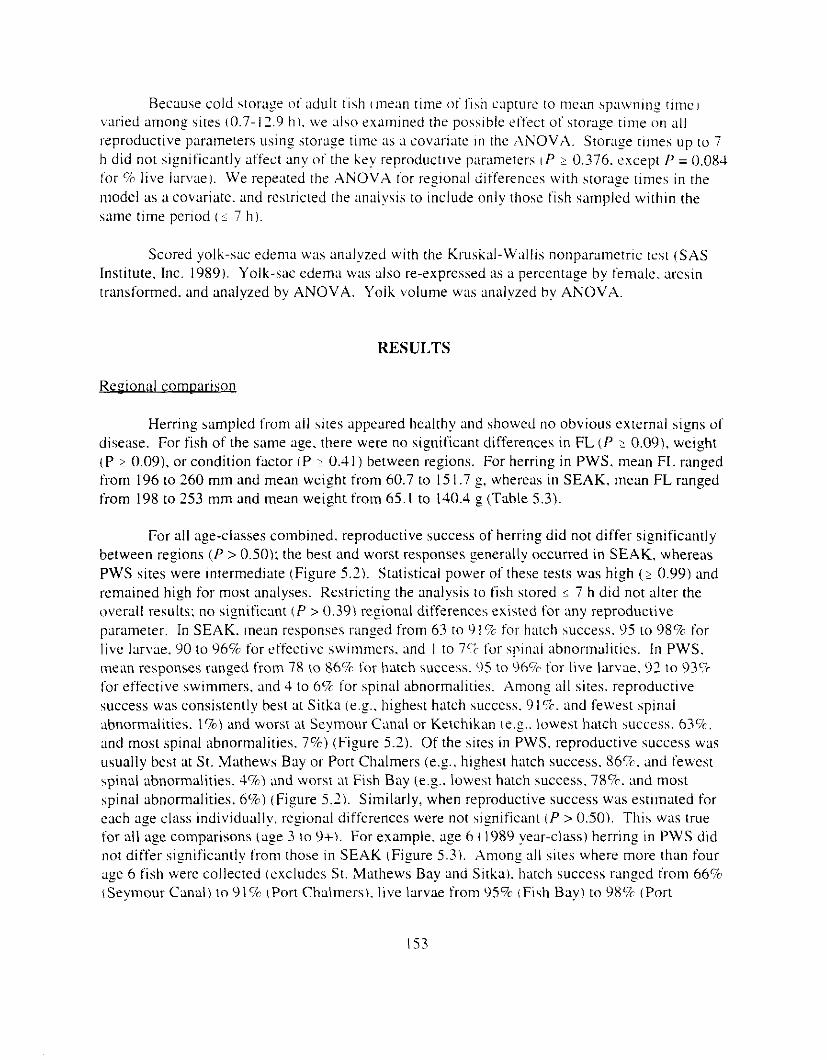
Because cold storage nladult tis11 (mean time o f f i s h capture to m e m sp;l\vning time] varied among sites (0.7- 12.9 h ) . we Aso examined the posslble el'fect of storuge tlme on all reproductive parameters u i n g storage time as a covariate 111 the ANOVA. Storage times up to 7 h did not significantly affect any o f the key reproduct~ve parumeters I f 1 0.376. except P = 0.084 for % live lar\'aeJ. We repecued the ANOVA for reglonal differences with storage times i n the model as 3 covariate. and restricted the analysis to include only those fish sampled within the same time period (1 7 h ) .
Scored yolk-sac edema wxs analyzed with the Kruskal-Wallis nonparumetrlc test (SAS Institute, Inc. 1989). Yolk-sac edema was also re-expressed as a percentage by female. arcsin trmsformed. and analyzed by ANOVA. Yolk \)olume was analyzed by ANOVA.
RESULTS
Regional comoarison
Herring sampled from all sites appeared healthy and showed no obvious external signs of disease. For fish of the same age. there were no significant differences in FL ( P 1 0.09). weight ( P 2 0.09), or condition factor iP 2 0.4 I) between regions. For herring in PWS. mean FL ranged from 196 to 260 mm and mean weight from 60.7 to 151.7 g, whereas in SEAK, mean FL ranged from 198 to 253 mm and mean weight from 65.1 to 140.4 g (Table 5.3).
For all age-classes combined. reproductive success of herring did not differ significantly between regions (P > 0.50): the best and worst responses generally occurred in SEAK. whereas PWS sites were intermediate (Figure 5.2) . Statistical power of these tests was high ( 2 0.99) and remained high for most analyses. Restricting the analysis to fish stored 5 7 h did not alter the overull results: no significant i P z 0.39) regional differences existed for any reproductive parameter. In SEAK. mean responses [ranged from 63 to 9 1 % fol- hatch success. 95 to 98% for live larvae. 90 to 96% for effective swlmmers. and I to 7'; for spinal abnormalities. In PWS. mean responses ranged from 78 to 86% for hatch success. 95 to 96'7~ for live larvae. 92 to 93% for effective swimmers, and 4 to 6% for spinal abnormalities. Among all sites. reproductive success was consistently best at Sitka (e.g.. highest hatch success. 91 5%. and fewest spinal abnormalities. 170) and worst at Seymour Canal or Ketchikan (e.&. lowest hatch success. 63%. and most spinal abnormalities. 7 % ) (Figure 5.2). Of the sites in PWS. reproductive success was usually best at St. Mathews Bay or Port Chalmers ie.g .. highest hatch success. 86%. and fewest spinal abnormalities, 4%) and worst at Fish Bay icg.. lowest hatch success. 78%. and most spinal abnormalities. 6%) (Figure 5.2). Similarly, when reproductive success was estimated for each age class individually. resional differences were not significant ( P > 0.50). This was true for all age comparisons (age 3 to 9+\. For example. age 6 ( 1989 year-class) herring i n PWS did not differ significantly from those in SEAK (Figure 5.3). Among a11 sites where more than four age 6 fish were collected (excludes St. Mathews Bay and Sitka). hatch success ranged from 66% tSeymour Canal) to 9 1 7 c {Port Chalmers). live larvae from 957c (Fish Bay) to 98% (Port
I53
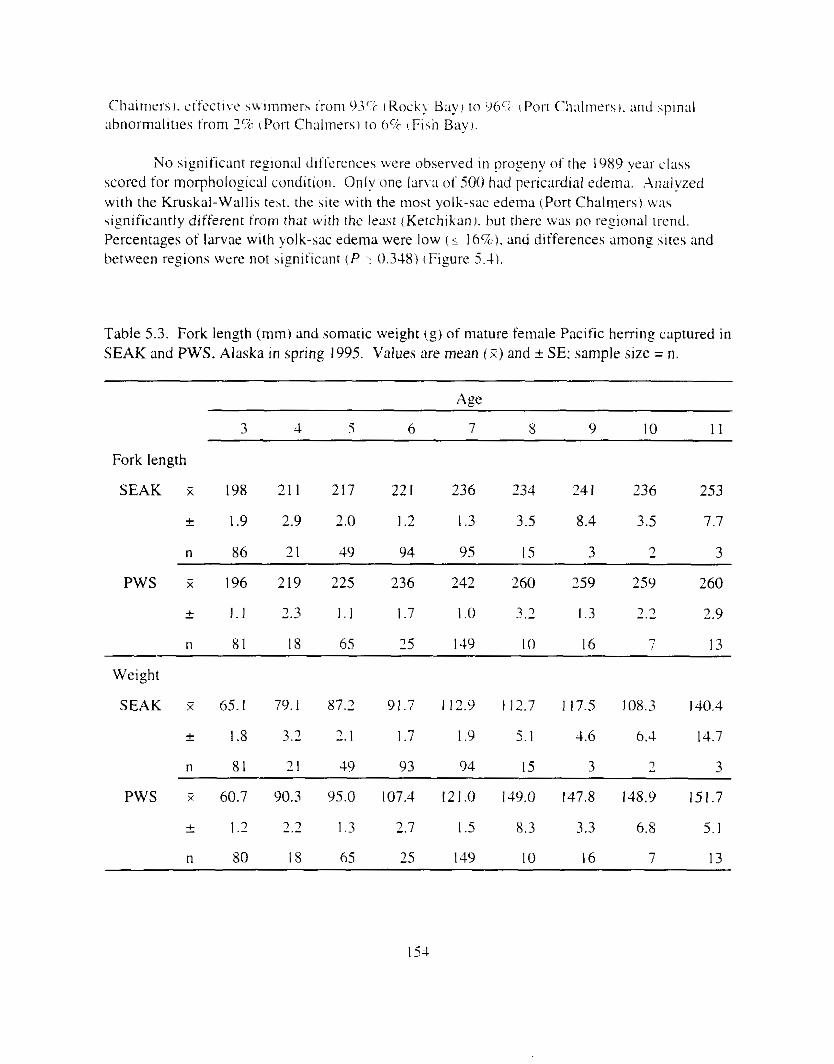
No slgnificant regional differences were observed i n proFeny o f the 1989 year class scored for morpholosical condition. Onlv one larva ot.500 had pericardial edema. ,Analyzed wlth the Kruskal-Wallis test. the site with the most yolk-sac edema iPort Chalmers) was siyif icant ly different from that with the I K L ~ S ~ (Ketchikan). but there \vas no regional trend. Percentages of larvae with yolk-sac edema were low ( 5 16%). and differences among si tes and between regions were not significant ( P : 0.348) (Figure 5.4).
Table 5.3. Fork length (mm) and somatic weight (5) of mature female Pacific herring captured i n SEAK and PWS. Alaska i n spring 1995. Values are mean ( 2 ) and f SE: sample size = n.
3 4 5 6 7 Y 9 10 I I
Fork length
SEAK z 198 211 217 22 I 236 234 24 I 236 253
* 1.9 2.9 2.0 1.2 I .3 3.5 8.4 3.5 7.7
n 86 21 49 94 95 15 3 2 3
PWS x 196 219 225 236 242 260 259 259 260
- 1 . 1 2.3 1 . 1 I .7 I . o 3.2 I .3 7 7 2.9
n 81 18 65 25 I49 I O 16 7 13
+
Weight
SEAK X 65.1 79.1 87.2 91.7 112.9 112.7 117.5 108.3 140.4
* I .8 3.2 2. I 1 .7 I .9 5 . I 4.6 6.4 14.7
n 81 21 49 93 94 15 3 - 1 3
PWS x 60.7 90.3 95.0 107.4 121.0 149.0 147.8 148.9 151.7
* I .2 2.2 1.3 2.7 I .5 8.3 3.3 6.8 5. I
n 80 18 65 25 I49 10 16 7 13
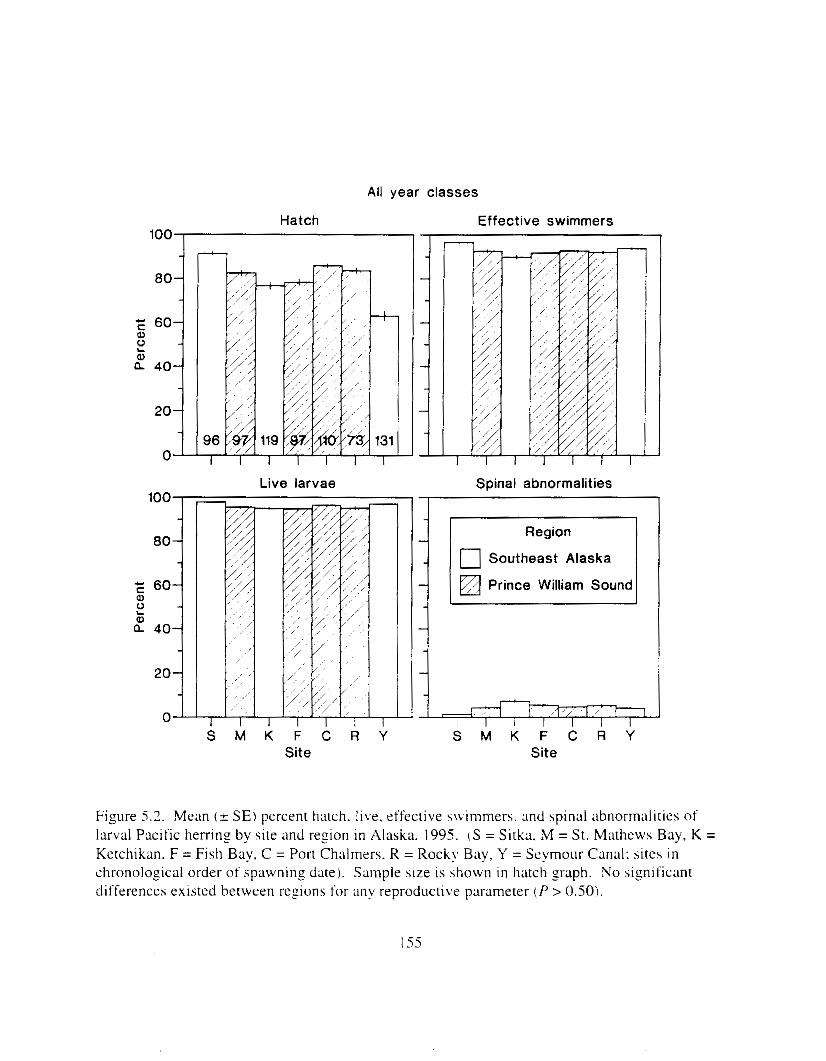
All year classes
100 Hatch
1
Effective swimmers c.
SDinal abnormalities
Southeast Alaska
Prince William Sound
,', 1 , I I I 1 I I I S M K F C R Y
Site
Figure 5.2. Mean (+ SEI percent hatch. live. effective swimmers. and spinal abnormalities of larval Pacific herring by site and region in Alaska. 1995. IS = Sitka. M = St. Mathews Bay, K = Ketchikan. F = Fish Bay, C = Port Chalmers. R = Rocky Bay, Y = Seymour Canal: sites in chronological order of spawning dare). Sample S I X is shown i n hatch p p h . No significant differences existed between rqions for any reproductive parameter ( P > 0.50).
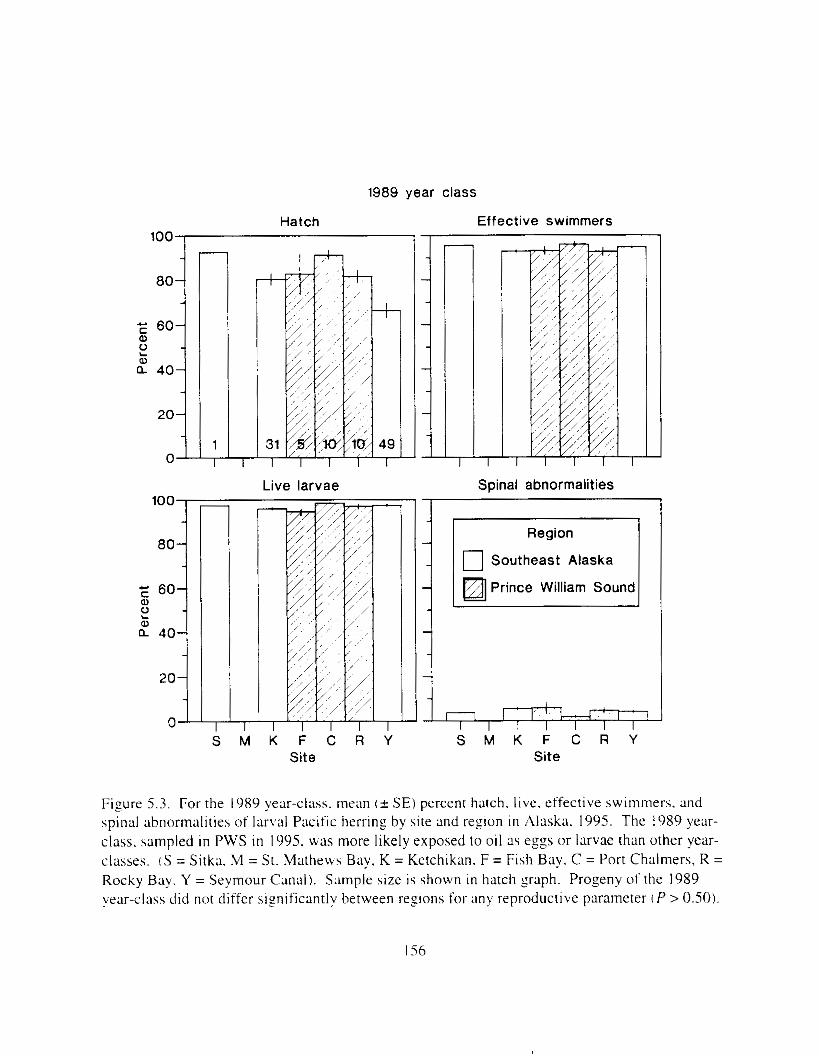
1989 year class
100 I Hatch
40
20
1
r
I T
Live larvae
S M K F C R Y Site
Effective swimmers Ir 1 T
Spinal abnormalities
I
1 Region
0 Southeast Alaska
Prince William Sound
S M K F C R Y Site
J
Fifure 5.3 , For the 1989 year-clus. mean ( ? SE) percent hatch. live. effective swimmers. and spinal abnormalities o f larval Pacific herring by site and region i n Alaska. 1995. The 1089 year- class. sampled in PWS in 1995. was more likely exposed to oil as exgs or larvae than other year- classes. ( S = Sitka. ,M = St. Mathews Bay. K = Ketchikan. F = Fish Bay. C = Port Chalmers. R = Rocky Bay. Y = Seymour Canal). Sample size is shown in hatch graph. Progeny of the 1989 war-class did not differ siFnificantly between reyons for any reproductive parameter if > 0.501.
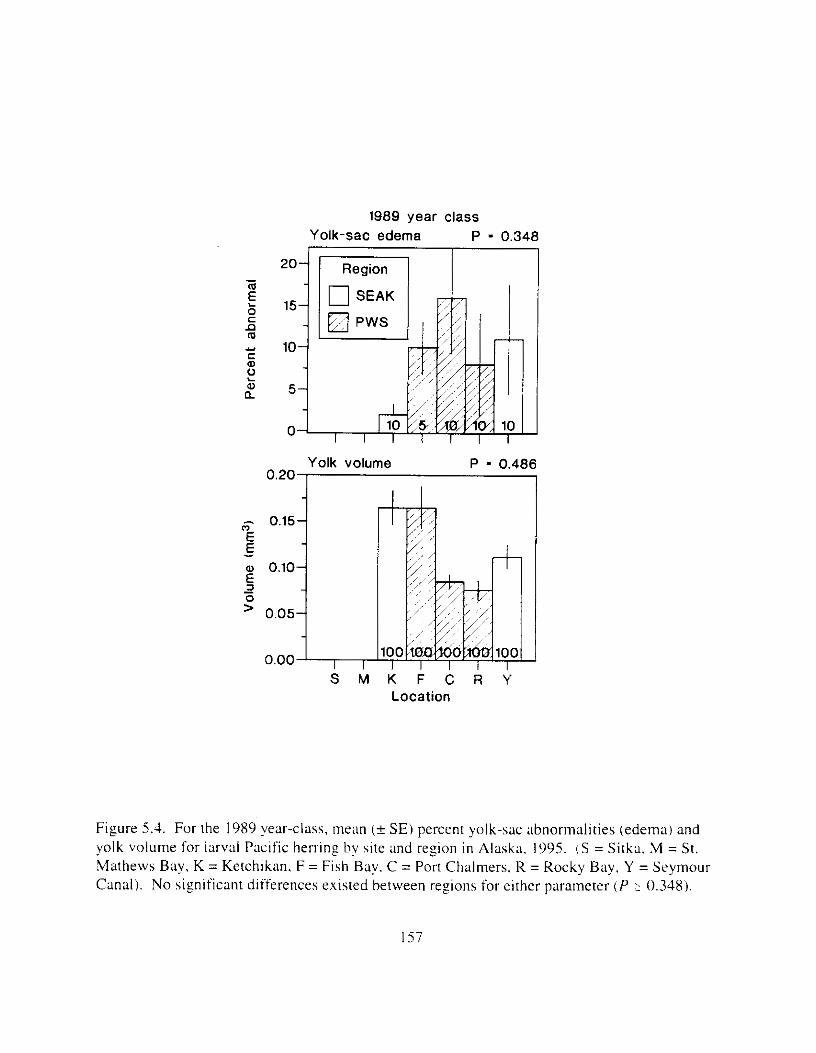
1989 year class Yolk-sac edema P - 0.348
Yolk volume
O ' * O P
P - 0.486
S M K F C R ? Location
Figure 5.4. For the 1989 year-class. mean (? SE) percent yolk-sac abnormalities (edema) and yolk volume for larval Pacific herring by site and region in Alaska. 1995. I S = Sitka. M = St. Mathews Bay, K = Ketchikan. F = Fish Bay. C = Port Chalmers. R = Rocky Bay. Y = Seymour Canal). No significant differences existed between regions for either parameter ( P 2 0.348).
I57
Yolk \olulne 111 iarvx' I'ron1 [he I%%) )~LII- cI;ls\ did tiot differ significantly tP = 0.4Xbl bctween r e ~ i o n s . but may have been related to Incubation renlperature. The larye\[ and smallest mean yolk volumes were observed in P\i;S. hut closely overlapped those i n SEAK ( F I ~ L I I - ~ 5.4). Although scatter was high (r' = 0.13i . y l k wlurnes declined stgnificantly (P < 0.001 ) LIS
temperature increased. I t I S poss~ble. ho\ve\,er. [hat s1[e differences and incubation temperature were confounding factors.
Comparison amone are-classes within sites
Reproductive success differed significantly amon? some age-classes at Sitka. Ketchikan. Port Chalrners. and Rocky Bay but not among aze classes at St. Mathews Bay. Fish Bay. and Seymour Canal (Figures 5.5 to 5.8). The few significant differences we observed were highly variable. inconsistent among sites. and no pattern existed for the 1989 year class. For example. at Rocky Bay, age 4- fish had a significantly lower percentage of live larvae than age 5 . 6. and 7 fish (Figure 5.61, whereas at Sitka. age 4- fish had a significantly higher percentage of effective swlmmers and a significantly lower percentage of spinal abnormalities than age 7 fish (Figures 5.7 and 5.8).
Other parameters
Hatch timing decreased steadily wlth increasing incubat~on temperature (Figure 5.9). For Sitka. the first site sampled. peak hatch occurred about 33 d after start of incubation at a mean temperature of about 4.5"C. whereas in Seymour Canal. the last site sampled. peak hatch occurred about 26 d after start of incubation at a mean temperature of about 6.0"C.
Fertility did not differ significantly ( P > 0.50) between regions for all ages combined or when the comparison was restricted to fish of the same age. For a11 ages combined. fertility i n SEAK ranged from 80% at Seymour Canal to 96% at Sitka: in PWS. fertility ~rc~nged from 88% a t Fish Bay to 94% at St. Mathews Bay.
DISCUSSION
Six years alter the spill. reproductive tmpairment was not detected i n PWS herring. This conclusion was reached by comparing reproductive success of fish collected in PWS and SEAK and among age classes within specific sttes. Specifically. hatch success. larval viability. and fertility did not differ significantly between PWS and SEAK. including response of the I989 year-class. In fact. discrimination of responses between regions was not possible because the best and worst responses were usually found in one region (SEAK). Therefore. the chances of detecting any oil related effects against the natural background variation were negligible when herring were compared between regions. Although responses among some age-classes within Port Chalmers and Rocky Bay were occasionally significant. these differences were highly
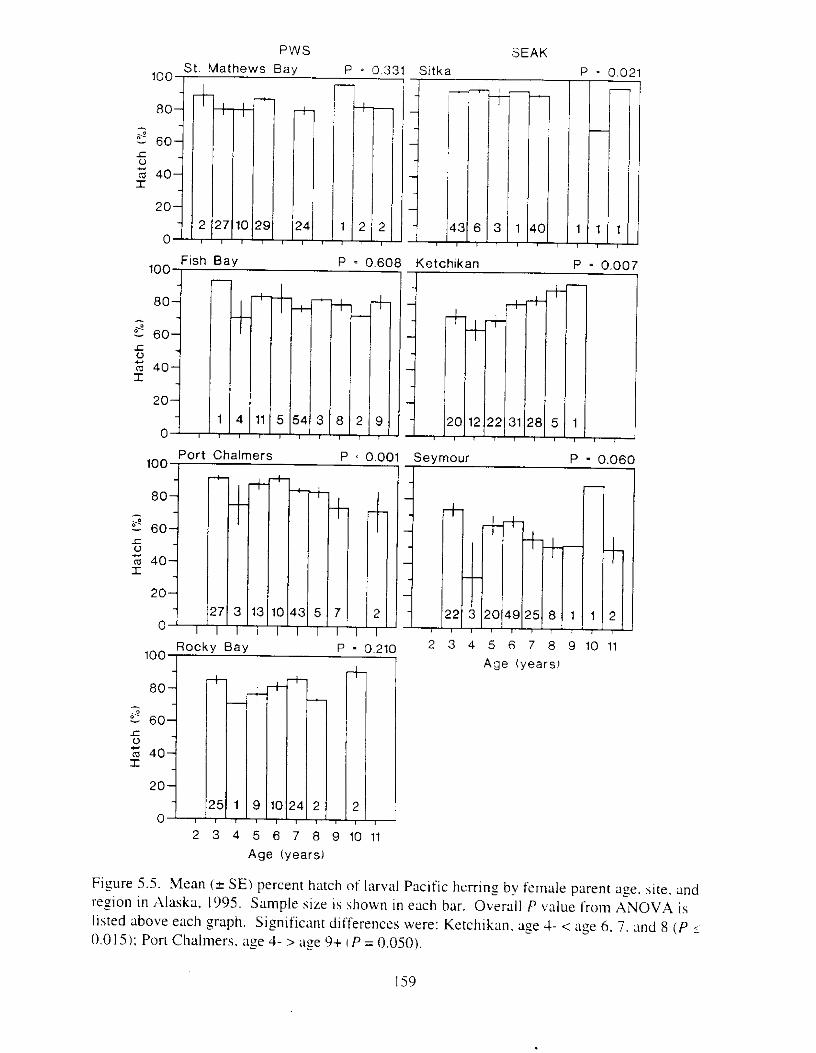
PWS SEAK
100
80
St Mathews Bay P = 0.331 Sitka
- 60
.c U
r 2 40
20
0
100 , Fish Bay P = 0.60
)1 1 100 , Port Chalmers P ' 0.oc
100 , Rocky Bay P - 0.210
Ketchikan P = 0.oc I
r
I7 1
r,l !2 31 28 5 1 i
Seymour P - 0.061
J
2 3 4 5 6 7 8 9 1 0 1 1 Age (years)
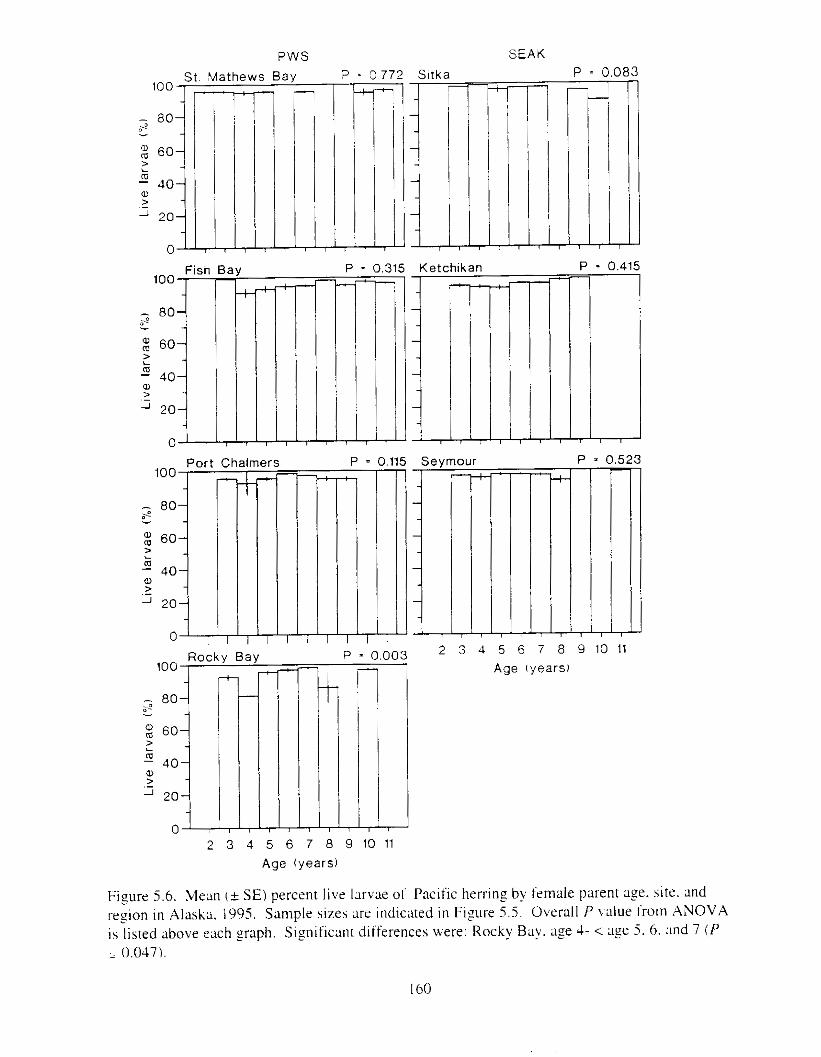
PWS SEAK
t. Mathews Ba ? = 0 772 Sltka 100
- 80 s z 60
- 40 ?
?
P = 0.083
- m m
20
0
I l Y 'P Port Chalrner
60
m a, > - 40
2 0
P - 0.31!
1 m P - 0:
I P - 0.41
Rock Ba P - 0.003 100
;? - 80 -
60
- 40
2
L > m e,
20
n
Se mour P - 0.5
2 3 4 5 5 7 8 9 1 0 1 1 Age (years)
.
2 3 4 5 6 7 8 9 1 0 1 1 Age (years)
Figure j.6. Mean ( + SE) percent live larvae of Pacific herring by female parent age. site. and region I n Alaska. 1995. Sample sizes are indicated in Figure 5.5. Overall P val~le from ANOVA is listed above each graph. Significant differences were: Rocky Bay. age 3- < age 5 . 6 . and 7 ( P :. 0.0371.
I60
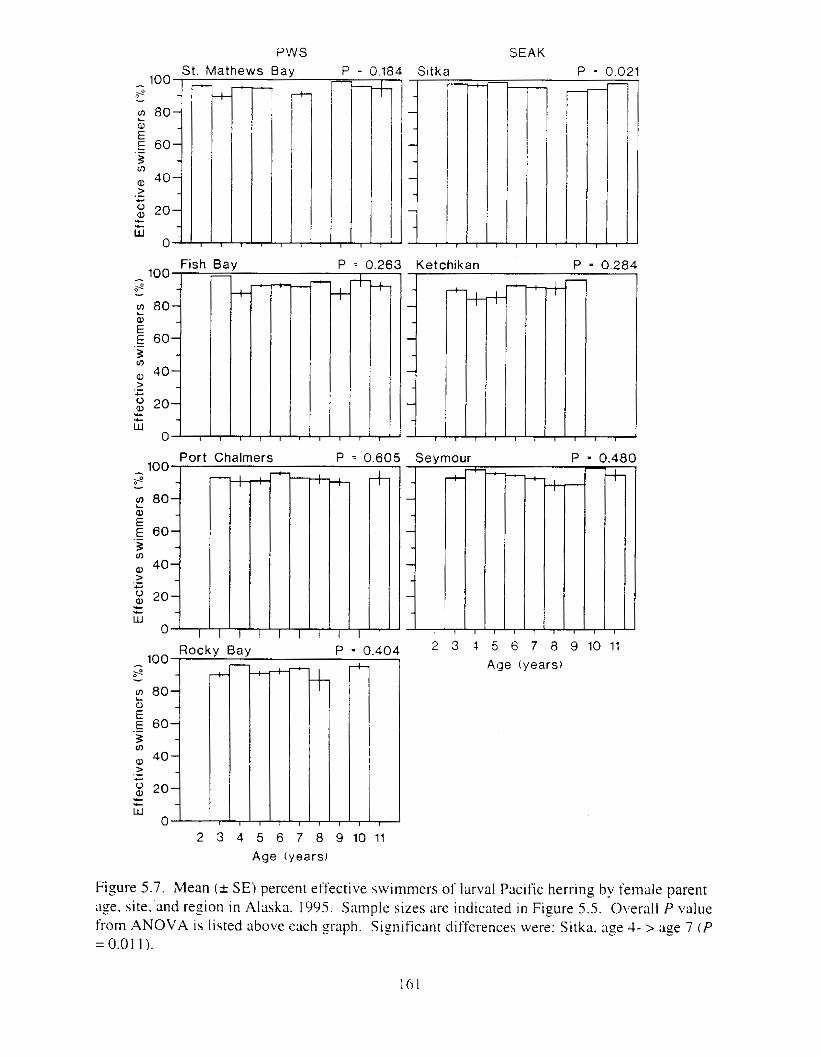
PWS SEAK
Age (years)
Figure 5.7. iVean (k SE) percent effective swimmers of larval Pacific herring by female parent age. site. and rezion in Alaska. 1995. S;lmpIe sizes are indicated i n Figure 5.5. Overall P value from ANOVA is listed above each Zrdph. Significant differences were: Sitka. age 4- > age 7 ( P =0.01 I ) .
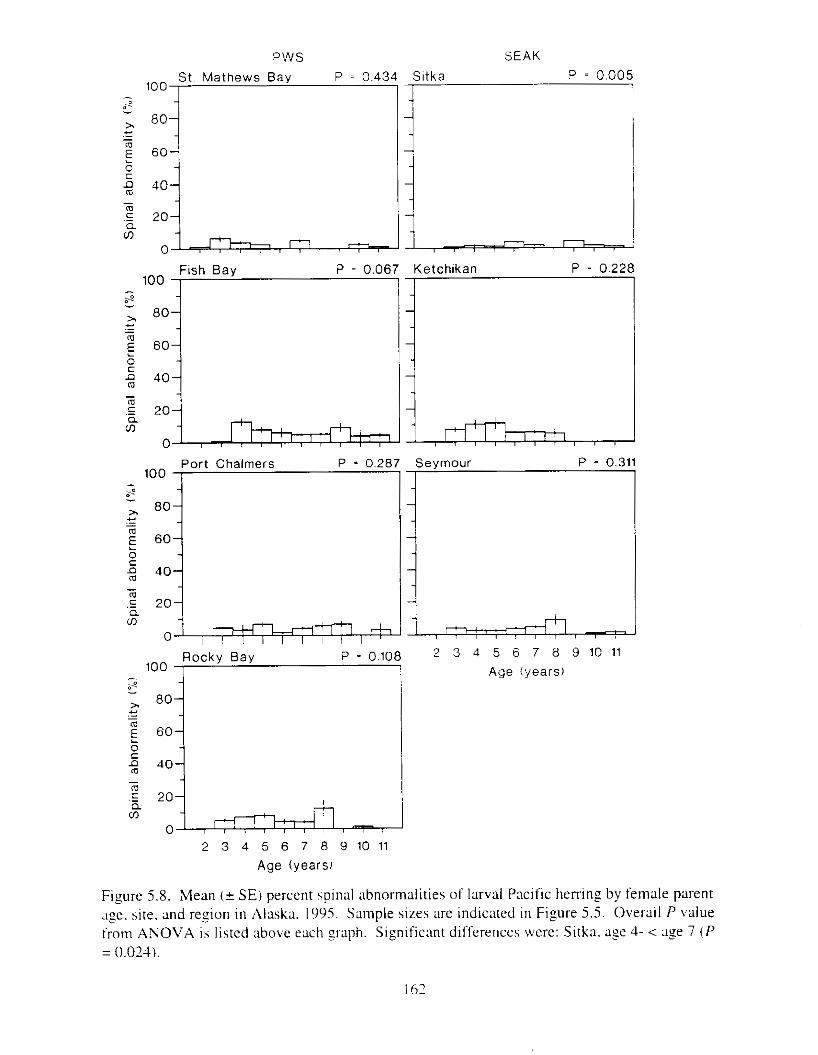
PWS SEAK
2 3 4 5 6 7 8 9 1 0 1 1
Age (years)
Figure j .8 . Mean (k SE) percent spinal abnormalities of larval Pacific herring by female parent ;,:e. site. and region i n Alaska. 1995. Sample sizes are indicated i n Figure 5.5. Overall P value from ANOVA is listed above each p p h . Significant differences were: Sitka. a y 4- < age 7 ( P = 0.024).
I67
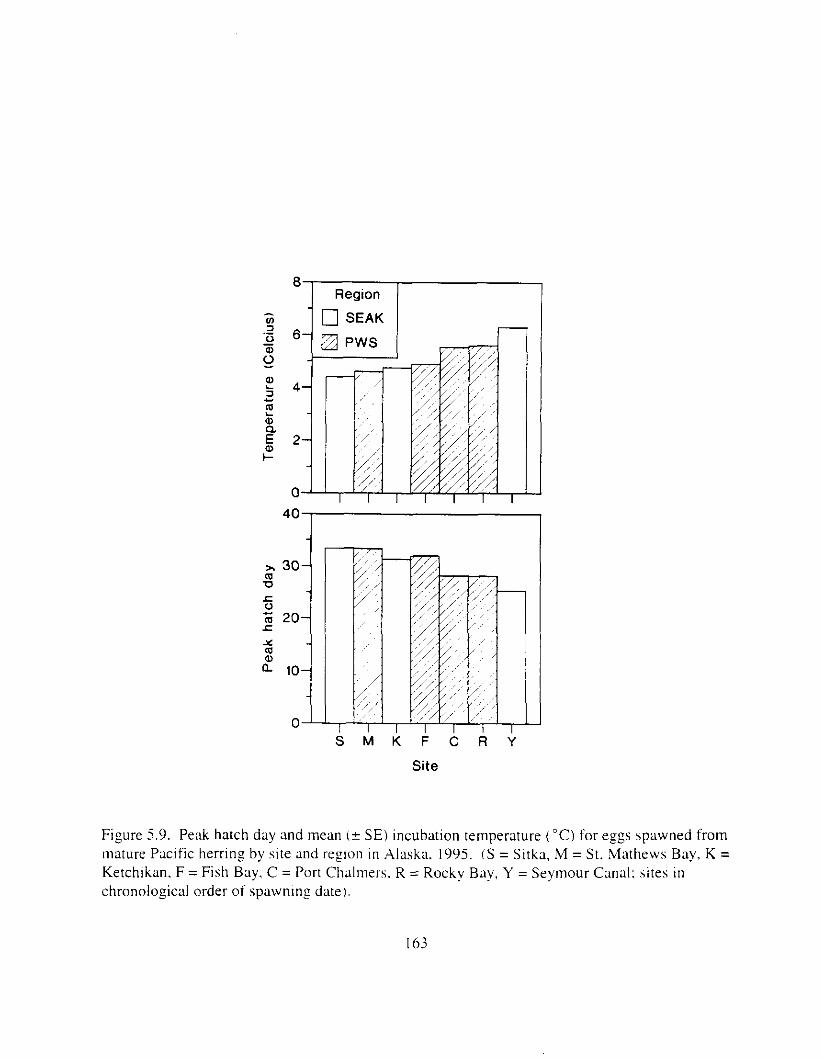
Y m
S
Site
Figure 5.9. Peak hatch day and mean (+ SE) incubation temperature ("C) for eggs spawned from mature Pacific herring by site and reyon i n Alaska. 1995. i S = Sitka. M = St. Mathews Bay, K = Ketchikan. F = Fish Bay. C = Port Chalmers. R = Rockv Bav, Y = Seymour Canal: sites in chronological order of spawnlng date).
I63
procedural differences be~ween earlier 5ludit.s and ours may part~ally ;lccount for differences 111 iwessment of reproductive s~~ccess . responses we observed i n I905 were consistently the best.
To interpret the effects of the spill on herring i n PWS requires an understanding of the life stage exposed and the magnitude and duration of exposure. Which life stages were impacted. and to what extent. however. is largely ;I matter of conjecture. Adult fish may have encountered oil before. during. or after spawning. but determining what percentage of the population was significantly impacted is impossible. Metabolites of aromatic hydrocarbons were detected in adult herring (Haynes et al. 1995). hut sample sizes were very low. Nematode prevalence in adult body cavities differed significantly between oiled and non-oiled areas (Moles et. a l . 1993), also indicating adult exposure. The duration and magnitude of oil exposure of herring eggs and larvae is also unknown. After hatch. herring larvae from both oiled and unoiled sites may have been exposed to oil as they passively traversed the spill trajectory. For example, some of the largest concentrations of larvae i n June were found in the southwest portion of PWS. well within the oil trajectory (Norcross et al. 1996). By inference. juvenile herring occupying the same nearshore habitat utilized by juvenile salmonids may have also been exposed to oil; such esposure was documented in juvenile plnk and chum salmon (Carls et aI. 1996).
Response of wild herring to an oil spill can be partially inferred from laboratory studies. For example, laboratory exposure of mature herring to hydrocarbons did not cause discernable damage in progeny, including fertility. viability. and larval swimming, morphological. and genetic abnormalities (Rice et al. 1987; Carls et al. Chapter 3). In contrast, the early life stages of herring are more susceptible to the effects of oil based on laboratory (Linden 1978; Pearson et al. 1985; Carls 1987: Kocan et ai. 1987: Rice et al. 1987) and field studies (Brown et al. 1996a; Norcross et al. 1996). Abnormal larvae have poor survival potential (Kocan et al. 1996a) and thus, the exposure of eggs and larvae to oil in PWS may have resulted i n increased mortality. Furthermore, the same oil concentrations that caused significant Zenetic damage also caused significant morpholozical damage in developing embryos iCarls et 3 1 . Chapter 4). suggesting that early death would likely preclude recruitment of genetically d a m q e d individuals to spawning populations.
Although genetic damage was detected in larvae collectLd i n oiled areas of PWS in 1989 (Hose et al. 1996: Brown et :11. 1996a). we did not inspect larvae for genetic damage. Concomitant laboratory measurements of artificially oiled larvae suggested genetic response was not a more sensitive measure of oil exposure than the parameters we examined (Carls et ai. Chapter 4). In addition. artificial exposure of pre-spawn adults to relatively high oil concentrations ( 5 8 ppb. inirial PAH) did not cause genetic defects i n artificially spawned progeny (Carls et al. Chapter 3). Other defects observed in larvae from PWS In 1989 included lnorphological damage. assessed by scored indices (Hose et ai. 1996). Caris et al. (Chapter 4) observed that two of these indices. pericardial edema and finfold condition. were more sensitive to oil than the genetic response. Failure to detect sisnificant pericardial abnormalities in larvae from PWS six years after the spill suggests that the genetic condition ot these larvae has not been adversely affected.
I65
The tallure o f the I989 yeal--clahh of herring in PWS to rt'cru~t to rile ~ p a w n l n ~ population 1n;l) have been partly attributable to the >pill. but it is impossible to separate oil effects trom other natural factors. ,At the sites we han~pled i n PWS. [he 1989 year-class usually compr~sed <4.0% of the spawning population t J . Wilcock. Personal co~nmunicationl. Larval surv~val in PWS was reduced an estimated 5 2 q i n 1989 as a result of the spill brown et ai. I99)ha): such loss supports inferences of poor survival based on laboratory observation. Xaturd envlronmental conditions. however. can also cause a h igh degree of variability i n herring recruitment (Stevenson 1962; Anthony and Fogarty 1985). For example. the 1989 year-class at Sitka also comprised ;I small proportion of the spawninz population in 1995 1<2%: J. Wilcock. Personal communication), indicating that factors other than oil are important determinants of cohort size.
Whether or not herring in PWS were ever reproductively impaired by the spill is unknown. but the time lapse between the spill and our study probably precluded any detection of reproductive impairment. Measurable etfects likely declined. probably most rapidly during the first year as the most adversely affected individuals died. Although oil-related abnormalities were observed in larvae ilnmediately fcllowing the spill. both developmental and genetic damage progressively decreased with time (Brown et al. 1996a) and were undetectable In I990 and 1991 (Hose et ai, 1996). The extent ofspawnlng site fidelity in herring is poorly understood but unaffected individuals from other geographic areas have probably joined remaining. less affected spawners. diluting possible residual effects. The disease epidemic observed in PWS i l l 1993 (Meyers et al. 1994) may have removed additional marginal spill survivors. Thus. it is not particularly surprising that reproductive impairment was not detected in 1995.
Understanding the long-term implications of exposure of Pacific herring to oil i n PWS was the principal objective of this research. Regardless of the life stage and likelihood of possible oil exposure, herring we sampled i n PWS in 1995 appeared to he reproductively fit and similar to herring in SEAK. ,Although herring stocks are still depressed in PWS. factors other than reproductive impairment are probably linuting !recovery.
CONCLUSIONS
Reproductive impairment of PWS herring by the ET.YO~I l'[r/dr: oil spill was not detected i n 1995.
At this time. discrimination o f an)' oil-related reproductive effects i n herring from natural background variation appears negligible.
I66
W e thank John Campbell. Jamson Clark. .Clary Drew. Dan Fremzen. Chl-is Hanson. Dave Love. Xiaohong Luan. Nathan .Magaret. Joshua Millstein. Catherme Pohl. Jeff ReFelin. June Sage. ,Michele Sleeter. and Justin Stekoll for technical laboratory assistance. LVe ;dso thank the Alaska Department of Fish and Game Commercial Fisheries Division i n Sitka. Ketchikan. Juneau. and Cordova for help i n collecting herring and for providing laboratory space. The research described in this paper was supported by the Esrcm Vddez Oil Spill Trustee Council. The findinss and conclusions presented by the authors. however. are their own and do !not necessarily reflect the view or position ot the Trustee Council.
I 67
LITERATURE CITED
.Alderdice. D.F.. ;Ind F.P.J. Velsen. 1971. Some effect o f sa l in i ty and temperat~~re (111 early development of Pacific herrin: I C/lr/xw p d / u . s i ~ . J . Fish Res. Bd. Can. 7 8 : 1545: I562
.Anthony. V.C.. and M. J . Fogarry. 1985. Environmental effects on recruitment. growth. and vulnerability of Atlantic herring iC/~rpcw / ~ ~ r r r ~ , q r ~ . s h r - m q r ~ , ~ ) i n the Gulf of Maine reyon. Can. J . Fish. Aquat. Sci. 42 1 I ): 158-173.
Bagenal. T.B.. and F.W. Tesch. 1978. .Age and Growth. Pp. 101-136 i r ~ T . Bagenal Led.], Fish production i n fresh waters: Chapter 5: Aze and zrowth. Blackwell Scientific Publications. 3rd Edition. iIBP Handbook No. 3 ) .
Brown. E.D.. T.T. Baker. J.E. Hose. R..M. Kocan. G.D. .Marry. M.D. McGurk. B. Norcross, and J . Short. 19962. Injury to the early life history s t q e s of Pacific herring in Prince William Sound after the E.r.uor~ V d d e ; o i l spill. Pp. 448-467 it1 S.D. Rice. R.B. Spies. D.A. Wolfe. and B.A. Wright [&.I. Proceedinrs of the E.r,wri Vdde: Oil Spill Symposium. American Fisheries Society Symposium Number 18. American Fisheries Society. Bzthesda. Maryland.
Brown. E.D., B.L. Norcross. and J.W. Short. 1996b. An introduction to studies on the effects of the Exxorl Vdrie: oil spill on early l i fe history stages of Pacific herring, Clrcprtr / J ~ / ~ I s I , in Prince William Sound. Alaska. Can. J . Fish. Aquat. Sci. 532337-2342.
Carls. M.G. 1987. Effects of dietary and water-born oil exposure on larval Pacific herring (Clrrprcl h r r w r ~ g r r s /xrllasi). Mar. Environ. Res. 22(4):253-270.
Carls. M.G. 1996. Prince William Sound Oil Database. National Marine Fisheries Service. Auke Bay Laboratory. I1305 Glacier Hizhway. Juneau. Alaska 99801-8626.
Cxls. M.G.. .LC. Wertheirner. J.W. Short. R.M. Smolowitr. a ~ i d J . J . Stegeman. 1996. Contamination oE.juvenile pink and chum salmon by hydrocarbons ~n Prince Williarn Sound after the E W N I Vo/&: o i l spill. Pp. 593-607 it1 S.D. Rice. R.B. Spies. D.A. Wolfe. and B.A. WI-ight [eds.\. Proceedings of the L w m \.'&/e: Oil Spill Sympos~um. .American Fisheries Society Symposium Number 18. Amerlcan Fisheries Society. Bethesda. Maryland.
Cads. h1.G.. D.M. Fremgen. J.E. Hose. D. Love. and R.E. Thomas. Chapter 3. The impact of exposure of adult pre-spawn herrins (Cllrprr~ / J ~ ~ L I . S ~ J to oil o n prozeny compared to that of direct exposure of eggs to o i l during incubation.
Carls. M.G.. D.M. Fremgen. J .E. Hox . S.W. Johnson. and S.D. Rice. Chapter 4. Effects of incubating herring (C/IJ/JLW / u r / / u . y i ~ eggs i n water contaminated with weathered crude oil.
69 I
4lart!,. G.D.. J.E. Hose:. M.D. 1lcCurk. E.D. Brown. and D.E. Hinton. I n press. Histopatholog and cytogenetic evaluation of Pmfic herrins larvae exposed to petroleum hvdrocarbons i n the laboratory or In Prince William Sound. A l a s k ~ . aftel-the E.uurl P'dde: O I I spill. Canadian Journal of Fisheries and Aquatic Sciences.
,McGurk. M.D.. D. Wsrhurton. T. Parker. and >I. Litke. 1990. Early l i fe history of P x ~ f i c herrlng: 1989 Prince William Sound herrins q g incubation experiment. Final Report. Contract number 50ABNC-7-0014 I . Triton Enwronmental Consultants LTD.. # I 20- 1351 1 Commerce Parkway. Richmond. British Columbia. Canada. V 6 V 2LI
McGurk. M.. T. Watson, D. Tesch. B. Mattock. and S. Northrup. 1991. Viable hatch of Pacific herring eggs irom Prince William Sound and Sitka Sound. Alaska. in 1990. Report number 2060NP4269. Triton Enwronmental Consultants LTD.. #I20- l iS l I Commerce Parkway. Richmond. B. C.. Canada. V6V 2L1
.Meyers. T.R.. S. Short. K. Lipson. W.N. Batts. J.R. Winton. J . Wilcock. and E. Brown. 1Y94. Association ot viral hemorrhagic septicemia v i r ~ ~ s wi th epizootic hemorrhages of the skin in Pacific herring Cluprei / M I - ? ~ I L ~ . s p c d i c ~ s i from Prince William Sound and Kodiak Island. Alaska. USA. Dis. Aquat. Org. 19:27-37.
Moles. A.D.. S.D. Rice. and M.S. Okihiro. 1993. Herring parasite and tissue alterations following the Erxon Vrrldr: oil spill. Pp. 325-328 ir1 Proceedings of the 1993 Oil Spill Conference. American Petroleum Institute Publication No. 4580. API. Washington. D.C.
Norcross, B.L.. J.E. Hose. M. Frandsen. and E.D. Brown. 1996. Distribution. abundance. morphological condition. and cytosenetic abnormalities of larval herring in Prince William Sound, Alaska. following the E.r.rot? Volck: oil .spill. Can. J . Fish. Aquat. Sci 53:2376-2187.
Pearson. W.H.. D.L. Woodruff. S.L. Kiesser. G.W. Fellinzham. and R.A.. Elston. 1985. Oil effects on spawnins hehav~or and reproduction i n Pacific herr~ng (Cl~rpcw / ~ e w c v ~ , ~ ~ u ~
p c d l c z . ~ i ) . Final Report to Amer. Petrol. lnst. Battelle Marine Res. Lab.. Sequim. Washington. OF-1742. API publication Yo. 4412. 108 p.
Rice. S.D., M.M. Babcock. C.C. Brodersen. J.A. Gharrett. and S. Korn. 1987. Uptake and depurxion of aromatic hydrocarbons by reproductively ripe Pacific herring and the subsequent effect of residues on egg hatching clnd survival. Pp. 139-15-1 i n W.B. Vernberg, A. Calabrese. F.P. Thurberg. and F.J. Vernberg Leds.], Pollution Physiology of Estuarine Orsanisms. Belle W. Baruch Libr. Mar. Sci. 17. Univ. ofS.C. Press. Columbia. South Carolina. 545 p.
SAS Institute. Inc. 1989. SAS/ST,\T Uher's guide. Version 6.4th Edition. Volume 2. Cary North Carolina. 846 p.
Short. J . W . . m d P.M. Harris. 1990~1. Chemical samplin? and analysis otpetroleum hydrocarbons i n near-surfnce heawater of Prince William Sound after the E.rror~ V d d c oil spill. Pp. 17-28 i n S.D. Rice. R.B. Sples. D.A. wolf^. and B.A. Wright [rdh.]. Proceedings of the €.nm C ' d d r : Oil Spill Symposium. American Fisheries Society Symposium Number 18. Ainerlcan Fisheries Society. Bethesda. Maryland.
Short. J.W.. and P.M. Harris. 1996b. Petroleum hydrocarbons i n c q e d mussels deployed in Prince William Sound after the E . w m Vd&: oil spill. Pp. 19-39 I J I S.D. Rice. R.B. Spies. D.A. Wolfe. and B.A. Wright [eds.]. Proceedings o t the E.r.rorl Vd&: Oil Spill Symposium. American Fisheries Society Symposium Number 18. American Fisheries Society. Bethesda. .Maryland.
Smith. R.L.. and J.A. Cameron. 1979. Effect of water soluble fraction of Prudhoe Bay crude oil on embryonic development of Pacific herring. Trms. Am. Fish. SOC. 108:70-75.
Snedecor. G.W.. and W.G. Cochran. 1980. Statistical methods. 7th Edition. Iowa State University Press. Ames. Iowa. 507 p.
Stevenson. J.C. 1'962. Distribution m d wrvival of herring larvae (Clupetr p d l n s i Vderfciemes) in British Columbia waters. J . Fkh. Res. Bd. Can. 19(5):735-810.
Zijlstra. J.J. 1963. On the recruitment mechanisms of North Sea autumn spawning herring Rapp. P.-V. Reun. Cons. Int. Explor. Mer. 154:198-202.
OTHER REFERENCES
Bro~vn. E.D. Personal communication. Alaska Department of Fish und Game. Com~nercial Fisheries Management and Development Division. P. 0. Box 669. Cordova. Alaska 99574.
Wilcock. J . Personal communication. 'Alaska Department of Fish and Game. Commercial Fisher~es ,Management and Development Division. P. 0. Box 669. Cordova. .Alaska 99574.
171

.APPENDICES
I72
Appendix Contents
Appendix I General Information . . . . . . . . . . . . . . . . . . . . . . . . . . . . . . . . . . . . . . . . . . . , . . . , . . . . I74 Appendix 1.6 Polynuclear aromatic hydrocarbon composition ofEr,rorl Vrlldr: . . . . . 174 Appendix I . I Seawater for each replicate was delivered at a constant rate . . . . . . . . . I76 Appendix I .2. Polynuclear aromatic hydrocarbons identified by gas chromatoyaphy
Appendix I .3. Alkane hydrocarbons identified by gas chromatography . . . . . . . . . . . 178 . . . . . . . . . . . . . . . . . . . . . . . . . . . . . . . . . . . . . . . . . . . . . . . . . . . . . . . . . . . . . . 177
Appendix 1 .-I Structural formulas of naphthalenes. tluorenes. dibenzothiophenes . . , I79 Appendix 1.5. Structural formulas demonstrating substitution in naphthalenes . . . . , 180 Appendix I .6. Polynuclear aromatic hydrocarbon composition of Euon V a / d c . . . . I8 I Appendix I .7. Representative spectral intensity output of a fluorescent light . . . . , . . 182
Appendix 2 Histopathological scores: preliminary. non-parametric analyses . . . . . . . . . . . . . . . . , . I84 Appendix 2. I . Lesion scores classified as artifact or autolysis as functions of treat . . I85 Appendix 2.2. Lesion scores in spleen as functions of treatment , , . . . . . , . . . . . . , . . 186 Appendix 2.3. Lesion scores in liver as functions of treatment . . . . . . . . . . . . . . . . , , 187 Appendix 2.4. Lesion scores in gill as functions of treatment . . . . . . . . . . . . . . . . . . . I88
Appendix 3. I Composition of polynuclear aromatic hydrocarbons i n 1994 treatment water . . . . , . . 190 Appendix 3.1. I . Composition of PAH in trace-oil treatment water in 1994 . . . . . . . . 191 Appendix 3.1.2. Composition of PAH in low-oil treatment water in 1994 . . . . . . . . . 192 Appendix 3.1.3. Composition of PAH i n mid-oil treatment water in 1994 . . . . . . . . . 193 Appendix 3.1.1. Composition of PAH in high-oil treatment water i n 1994 . . . . . . . . . 194
.Appendix 3.2 Composition of polynuclear aromatic hydrocarbons in niuscle and ovary . . . . . . . . . . I96 Appendix 3.2. I . Composition of PAH in muscle and ovarian tissue in the trace-oil . . I97 Appendix 3.2.1. Composition of PAH in muscle and ovarian tissue i n the low-oil . . . I98 Appendix 3.2.3. Composition of PAH in muscle and ovarian tissue in the mid-oil . . . 199 Appendix 3.2.4. Composition of PAH in muscle and ovarian tissue i n the
high-oil . . . . . . . . . . . . . . . . . . . . . . . . . . . . . . . . . . . . . . . . . . . . . . . . . . . . . . . 200 Appendix 3.2.5. Composition of PAH in muscle and ovarian tissue i n the trace-oil . . 201 Appendix 3.1.6. Composition of PAH in muscle and ovarian tissue i n the low-oil . . . 202 Appendix 3.2.7. Composition of PAH in muscle and ovarian tissue i n the mid-oil . . . 203 Appendix 3.2.8. Composition of PAH in muscle and ovarian tissue in the high-oil . . 204
Appendix 3.3 Composition of polynuclear aromatic hydrocarbons i n eggs ( 1994) . . . . . . . . . . . . . . . 206 Appendix 3.3. I ( ( i r ri,qhr). Composition of PAW i n egg tissue. high-oil treatment . . . . 207
,Appendix 3.4 Comparison ofpolvnuclear aromatic hvdrocarbon composition in water . . . . . . . . . . . 210 Appendix 3.4. I . Comparison oi PAH composition In trace-oil treatment water . . . . . 2 1 1 Appendix 3.4.2. Comparison of PAH composition in low-oil treatment water . . . . . . 212 Appendix 3.4.3. Comparison of PAH composition in mid-oil treatment water . . . . . . 213 Appendix 3.4.4. Comparison of PAH composition in high-oil treatment water . . . . . 214
Appendix 3.5 Example polynuclear aromatic hydrocarbon concentration in water . 1994 . . . . . . . . . . 216 Appendix 3 . 5 . I . Naphthalene concentrations i n the high-oil treatment . . . . . . . . . . . . 217 Appendix 3.5.1. Fluorene concentrations in the high-oil treatment . . . . . . . . . . . . . . . 218 Appendix 3.5.3. Dibenzothiophene concentrations in the high-oil treatment . . . . . . . 219 Appendix 3.5.4. Phenanthrene concentrations in the high-oil treatment . . . . . . . . . . . 220 Appendix 3.5.5. Chryene concentrations i n the high-oil treatment . . . . . . . . . . . . . . . 221
Appendix 4.1 Alkane concentrations in water ( 1995) . . . . . . . . . . . . . . . . . . . . . . . . . . . . . . . . . . . . . 222 Appendix 4 . I . I . Total alkane concentrations in water . by experiment and treat . . . . . 223 Appendix 4 . I . 2. Concentrations of total alkanes increased in egg tissue . . . . . . . . . . . 224
Appendix 4.2 Composition of polynuclear aromatic hydrocarbons in I995 treatment water . . . . . . . . 226 Appendix 4.2. I ( r r r ri.qhfJ . Composition of PAH in trace-oil treatment water . . . . . . . 227 Appendix 4.2.2 itrf righfj . Composition of PAH in low-oil treatment water . . . . . . . . 228 Appendix 4.2.3 iot r ight) . Composition of PAH in mid-oil treatment water . . . . . . . . 229 Appendix 4.2.4 ((It r.i,qhr/. Composition of PAH in high-oil treatment water . . . . . . . . 230 Appendix 4.2.5 ltrr r igh t ) . Composition of PAH in trace-oil treatment water . . . . . . . 231 Appendix 4.2.6 I n r ri.qht) . Composition of PAH in low-oil treatment water . . . . . . . . 232 Appendix -1.2.7 l u r ri.qilr) . Composition of PAH in mid-oil treatment water . . . . . . . . 233 Appendix 4.2.8 itrr ri.qhrj . Composition of PAH i n high-oil treatment water . . . . . . . . 234
,Appendix -1.3 Comparison of polynuclear aromatic hydrocarbons conceprations in water of less and more weathered oil experiments (1995) . . . . . . Appendix 4.3 . I . Comparison of naphthalene concentrations . . . . . . Appendix 4.3.2. Comparison of CI-naphthalene concentrations . . Appendix 4.3.3. Comparison of C2-naphthalene concentrations . . . Appendix 4.3.4. Comparison ofC3-naphthalene concentrations . . . Appendix 4.3.5. Comparison of C1-naphthalene concentrations . . .
Appendix 4.3.6. Comparison of fluorene concentrations . . . . . . . . . Appendix 4.3.7. Comparison of C I -fluorene concentrations . . . . . . Appendix -1.3.8. Comparison of C1-tluorene concentrations . . . . . . Appendix 4.3.9. Comparison olC3-tluorene concentrations . . . . . .
. . . . . . . . . . .
. . . . . . . . . . .
. . . . . . . . . . .
. . . . . . . . . . .
. . . . . . . . . . .
. . . . . . . . . . .
. . . . . . . . . . .
. . . . . . . . . . .
. . . . . . . . . . .
. . . . . . . . . . .
. . . 236
. . . 237
. . . 238
. . . 239
. . . 240
. . . 241
. . . 242
. . . 243
. . . 244
. . . 245
.Appendix -L ..3 . I O . Comparison o l dibenzothiophene concentrations . . . . . . . . . . . . . . 246
.Appendix 4.3. I I . Comparison o f CI-dibenzothiophene concentrations . . . . . . . . . . . 247 Appendix 4.3.12. Cornparison of C1-dibenzothiophene concentrations . . . . . . . . . . . 248 Appendix 4.3.13. Comparison of C3-dibenzothiophene concentrations . . . . . . . . . . . 249 Appendix 4.3.14. Comparison of phenanthrene concentrations . . . . . . . . . . . . . . . . . . 250
Appendix 4.3.16. Comparison of C2-phenanthrene concentrations . . . . . . . . . . . . . . . 252
Appendix 4.3.18. Comparison of C4-phenanthrene concentrations . . . . . . . . . . . . . . . 254 Appendix 4.3.19. Comparison of chrysene concentrations . . . . . . . . . . . . . . . . . . . . . . 255 Appendix 4.3.20. Comparison of c I -chrysene concentrations . . . . . . . . . . . . . . . . . . . 256 Appendix 4.3.2 I . Comparison ut'C2-chrysene concentrations . . . . . . . . . . . . . . . . . . . 257 Appendix 4.3.22. Comparison of C3-chrysene concentrations . . . . . . . . . . . . . . . . . . . 258
Appendix 4.3.15. Comparison of c I -phenanthrene concentrations . . . . . . . . . . . . . . . 251
Appendix 4.3.17. Comparison of C3-phenanthrene concentrations . . . . . . . . . . . . . . . 253
Appendix 4.4 Composition of polynuclear aromatic hydrocarbons in esg tissue ( 1995) . . . . . . . . . . . 760 Appendix 4.4. I ( ( i t ri.qhr) . Composition of PAH in eggs exposed during incubation
to the high-oil treatment . . . . . . . . . . . . . . . . . . . . . . . . . . . . . . . . . . . . . . . . . . . 261 Appendix 4.4.2 ((If righr) . Composition of PAH i n eggs exposed during incubation
to the low-oil treatment . . . . . . . . . . . . . . . . . . . . . . . . . . . . . . . . . . . . . . . . . . . 262 Appendix 4.4.3 (at righr) . Composition of PAH in eggs exposed during incubation
to the mid-oil treatment . . . . . . . . . . . . . . . . . . . . . . . . . . . . . . . . . . . . . . . . . . . 263 Appendix 4.4.4 ( a r righr) . Composition of PAH in eggs exposed during incubation
to the high-oil treatment . . . . . . . . . . . . . . . . . . . . . . . . . . . . . . . . . . . . . . . . . . . 264
Appendix 4.5 Polynuclear aromatic hydrocarbons in rock substrate of oil delivery apparatus ( 1995)
Appendix 4.5. I . Composition of PAH in rock as a function of PAH concentration . . 267 266
Appendix 4.5.2. Initial PAH concentration in treatment water And that measured
Appendix 4.5.3. Polynuclear aromatic hydrocarbon (PAH) composition in rock inrock 268
. . . . . . . . . . . . . . . . . . . . . . . . . . . . . . . . . . . . . . . . . . . . . . . . . . . . . . . . . . . . . . . . . . . .
. . . . . . . . . . . . . . . . . . . . . . . . . . . . . . . . . . . . . . . . . . . . . . . . . . . . . . . .
substrate and treatment water . . . . . . . . . . . . . . . . . . . . . . . . . . . . . . . . . . . . . . . 269
.Appendis 1 Gcneral Information
Inlormation common to the complete report I S contaned 111 [his appendix. ~ncludiny ~ h e m a t l c representation of the dosin: apparatuh. Iihts of analytes reported in chemical analyses i including abbreviations used i n f i y r e s ) . and structural formulae of the five major homologous polynuclear aromatic hydrocarbon (PAH) groups discushed in this htudy including examples of d k y l substitution within a groupl
.4ppendix I
Appendix I
Appendix I
1 Method of contamination of seawater.
.2 Polynuclear aromatic hydrocarbons names and abbreviations.
.3 Alkane hydrocarbons and their abbreviations,
Appendix I .4 Structural formulas ot naphthalenes. Iluorenes. dibenzothiophenes. phenanthrenes. and chrysenes.
Appendix I .5 Structurd formulas demonstrating substitution in naphthalenes
Appendix I .6 Polynuclear aromatic hydrocarbon composition of E.r.xon Vtrlde: crude oil compared to the Alaska North Slope crude oil used in these studies.
Appendix 1.7 Representative spectral intensity output o l a tluorescent light source. including ultraviolet (UV) and visible wavelengrhs.
17-1

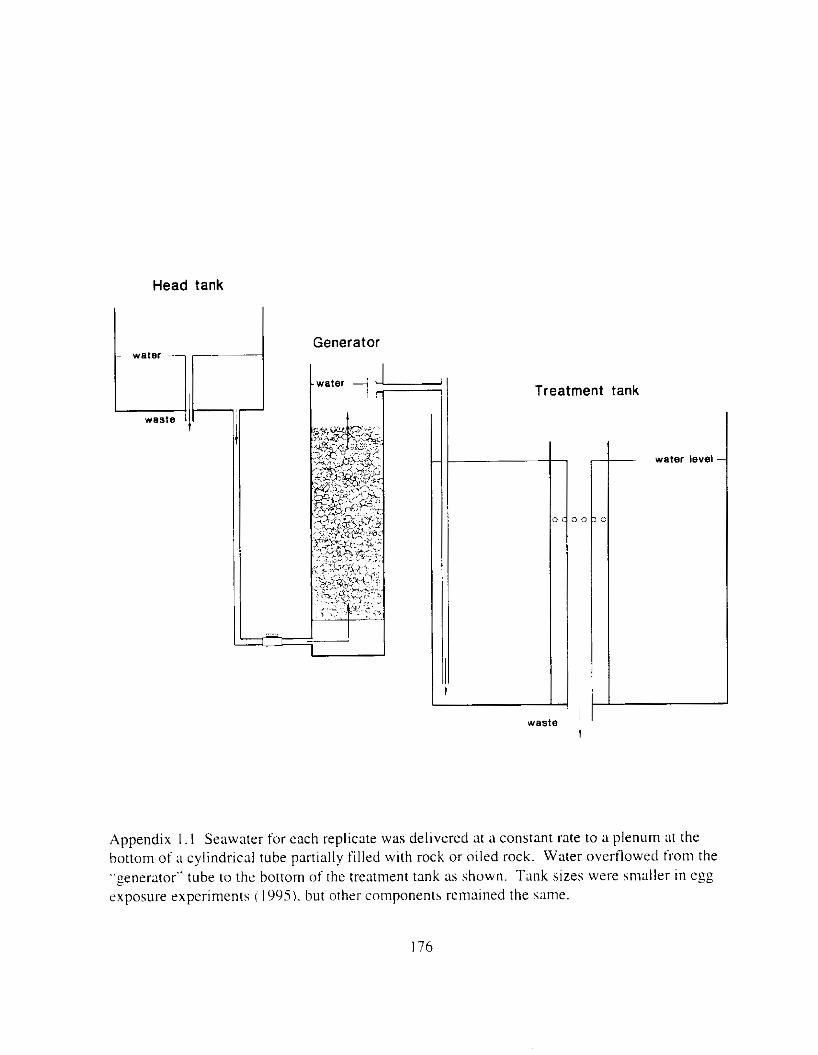
Head tank
1
Treatment tank r I
waste
- water level -
Appendix I . I Seawater for each replicate was delivered at a constant rate to a plenum at the bottom of a cylindrical tube partially filled with rock or oiled rock. Water overflowed from the "menerator" 2 tube to the bottom of the treatment tank as shown. Tank sizes were smaller in egg exposure experiments ( 1995). hut other components remained the same.
176
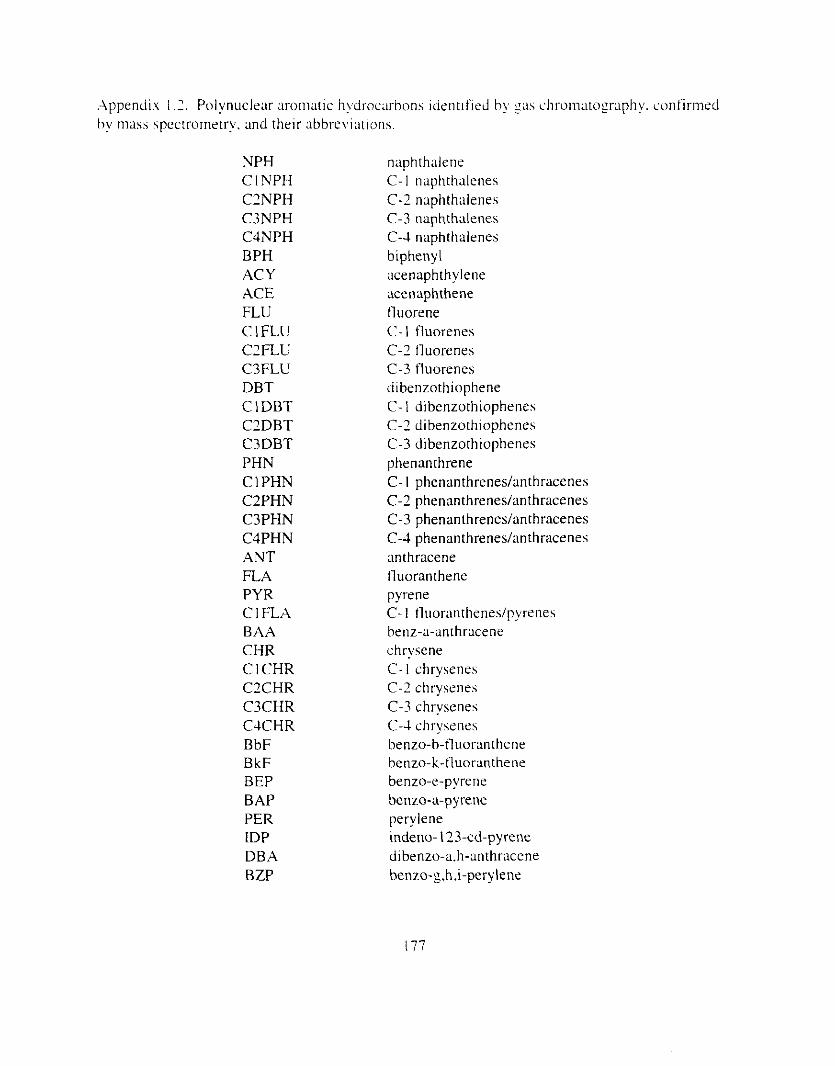
NPH C I NPH C2NPH C3NPH C4NPH BPH ACY ACE FLU C 1 FLU C2FLU C3FLU DBT C I DBT C2DBT C3DBT PHN C I PHN C2PHN C3PHN C4PHN ANT FLA PYR C I FLA BAA CHR C 1 CHR C X H R C3CHR C4CHR BbF B kF BEP BAP PER D P DBA BZP
naphthalene C- I naphthalenes C-2 naphthalenes C-3 naphthalenes C-4 naphthalenes biphenyl acenaphthylene acenaphthene tluorene C- 1 fluorenes C-2 tluorenes C-3 tluorenes dibenzothiophene C-l dibenzothiophenes C-2 dibenzothiophenes C-3 dibenzothiophenes phenanthrene C- I phenanthreneskanthracenes C-2 phenanthrenes/anthracenes C-3 phenanthreneskanthracenes C-3 phenanthrenedanthracenes anthracene tluoranthene pyrene C- I tluoranthenes/pyrrnes benz-a-anrhracene chrysene C- I chrysenes C-2 chrysenes C-3 chrysenes C-4 chrysenes benzo-b-tluomnthene henzo-k-tluor~nthene benzo-e-pyrene benzo-a-pyrene perylene indeno- 123-cd-pyrene dibenzo-a.h-anthracene benzo-g,hi-perylene
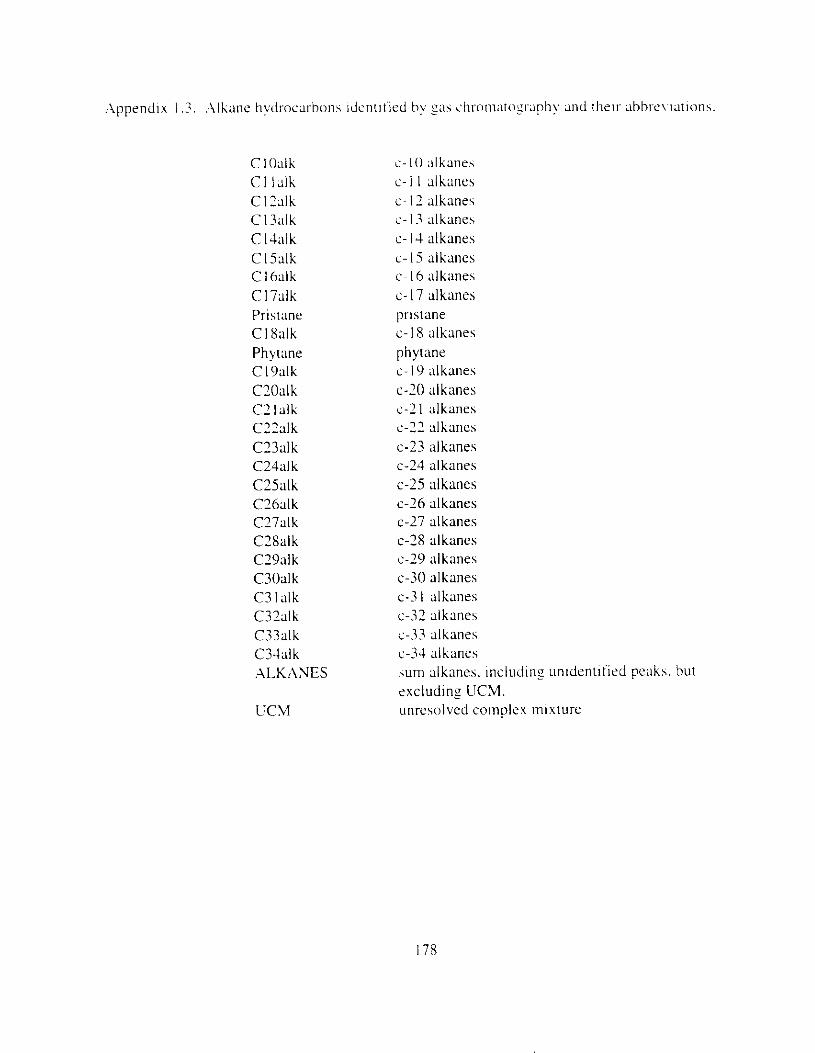
c I Olllk
e1 l d h C I2alk C 13aIk CI4;llk C15alk Cl6alk c 1 7 a k Prihtme C I8alk Phytane C I9alk C2Oalk c2 I alk C22alk C23alk C24alk C25alk C26alk C27alk C28alk C29alk C30alk C 3 I a lk C32alk C33alk C34alk 'ALKANES
UCM
c- I O alkane5 c - I I a1k;:nes c - I7 alkanes c- I3 alkane5 c - I 4 alkanes e - I5 alkanes c- I6 alkanes c- I7 alkanes prtstane e - IS alkanes phytane c-I 9 alkanes c-20 alkanes c-21 alkanes e-77 alkanes c-23 alkanes e-24 alkanes c-25 ~ ~ l k a n e s c-26 alkanes c-27 alkanes c-28 alkanes c-29 alkanes c-30 alkanes c-3 I alkanes c-32 alkanes c-33 alkanes c-34 alkanes sum alkanes. Includin: untdentified peak>. but rxcludinz UCM. unresolved complex mixture
178
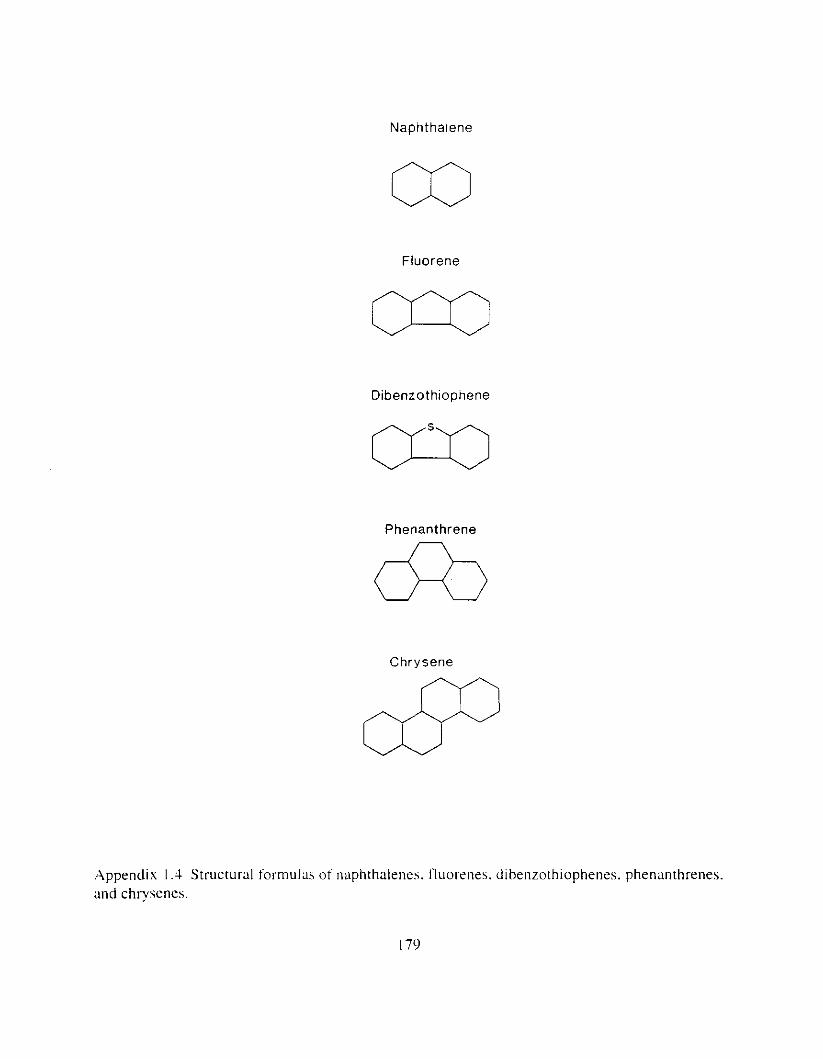
NaDhthalene
Fluorene
Dibenzothiophene
Phenanthrene n
Chrysene
Appendix I .1 Structural formulas of naphthalenes. fluorenes. dibenzorhiophenes. phenanthrenes. and chrysenes.
I79
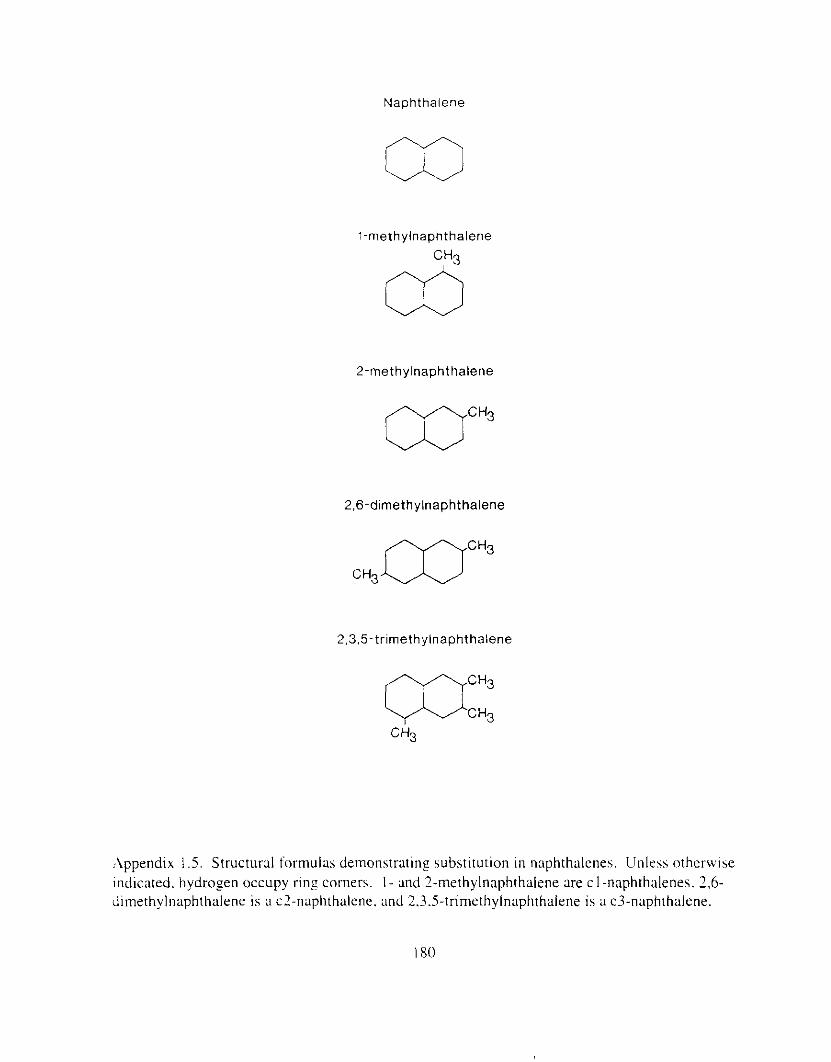
Naphthalene
1-methylnaphthalene
03 2-methylnaphthalene
2,6-dirnethylnaphthalene
2.3.5-trimethylnaphthalene
Appendix I .5. Structural formulas demonstratin_e substitution i n naphthalenes. Unless otherwise indicated. hydrogen occupy rin: corners. I - and 2-methylnaphthalene are c I-naphthalenes. 2.6- dimethylnaphthalene is a c2-naphthalene. and 2.3.5-trimethylnaphthalene is a c3-naphthalene.
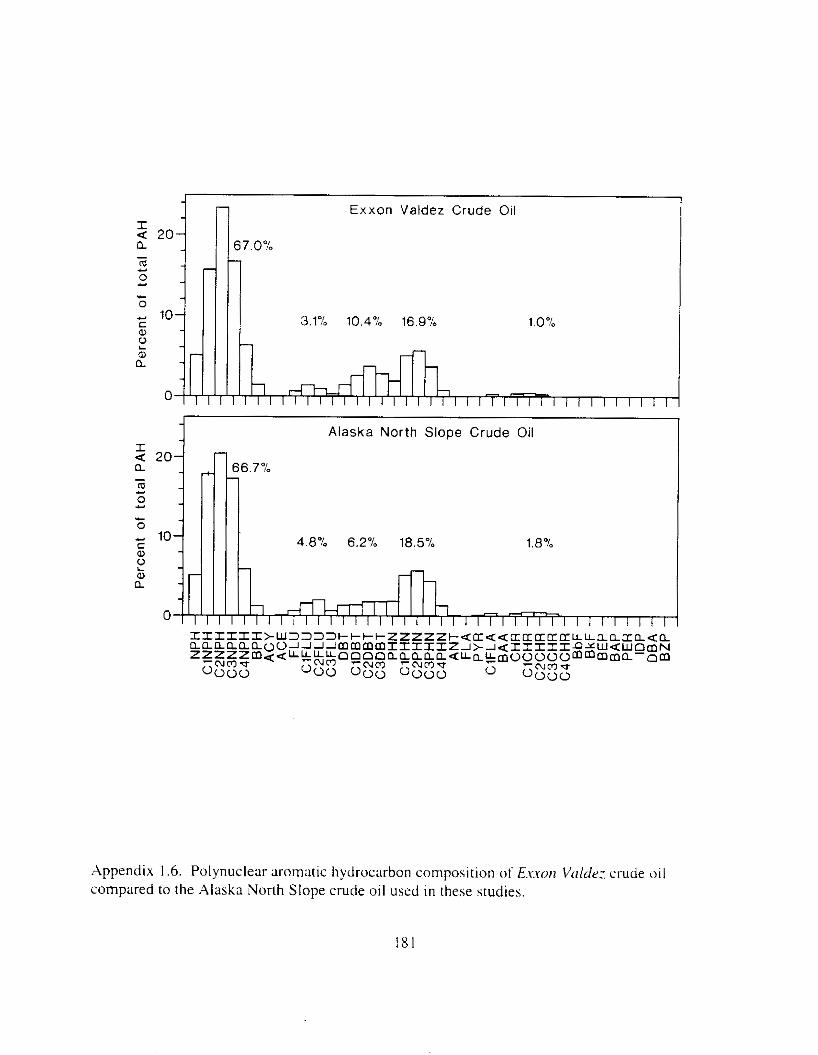
rr 2 %
Per
cent
of
tota
l PA
H
0
,3 N
0
0
c
Q
m
-7
Pe
rce
nt
of
tota
l PA
H
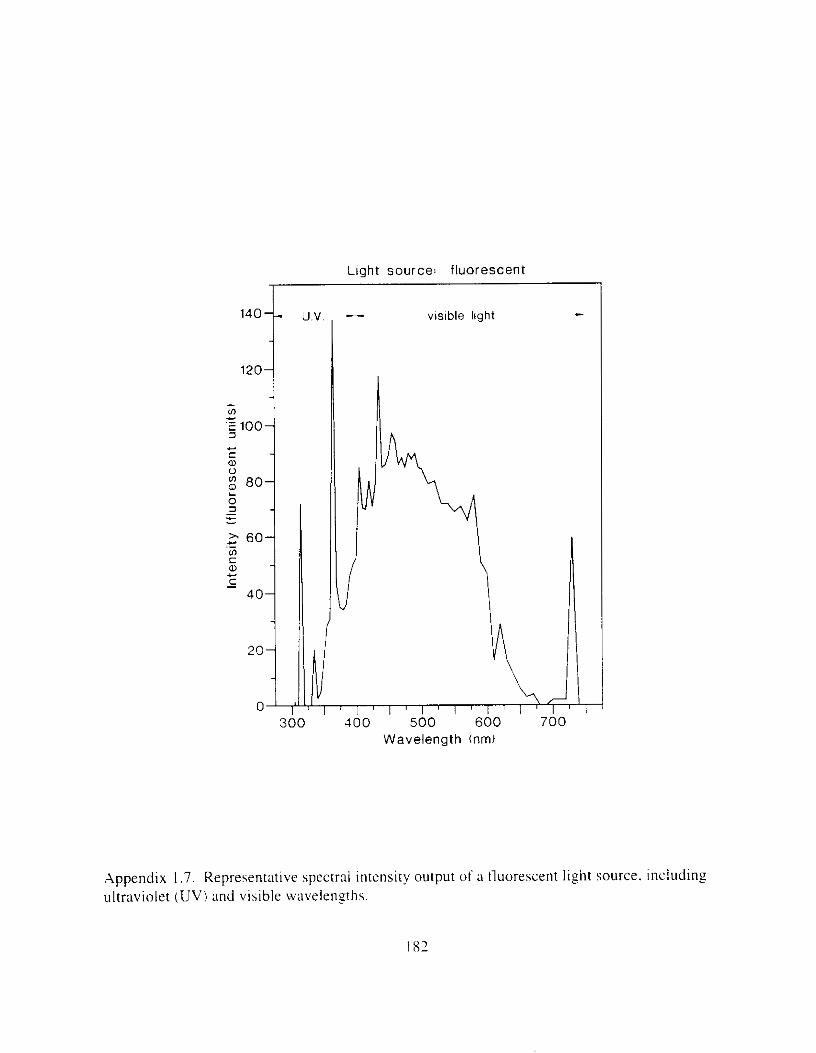
Llght source: fluorescent
140--
-
120-
- - 1 '5 100- (I)
c - a, C
0 $ 80- 0 3
L
- c - 2 60- .- (I) C a C I
- 40-
20-
0- 3(
u.v I
I 1 ' 1 ' l ' I ' l ' l ' I ' I
Wavelength (nm)
I
400 500 600 700
Appendix I .7. Representative spectral intensity output of a tluorescent light source. including ultraviolet ( U V ) and visible wavelenghs.
I s2

I83
Individual histopatholozical scores were alialyzed wi th the Kruskal-Wallis non-12a~11netr.1~. test. Results were pooled by treatment In these tests.
Appendix 2.1. Lesion scores classllied as artlfact or autolys~s as functions of treatmen[.
Appendix 2.2. Lesion scores i n spleen as functions of treatment.
Appendix 2.3. Lesion scores in liver :IS functions o f treatment.
Appendix 2.4, Lesion scores i n sill as funcrlons of tre:~trncn~.
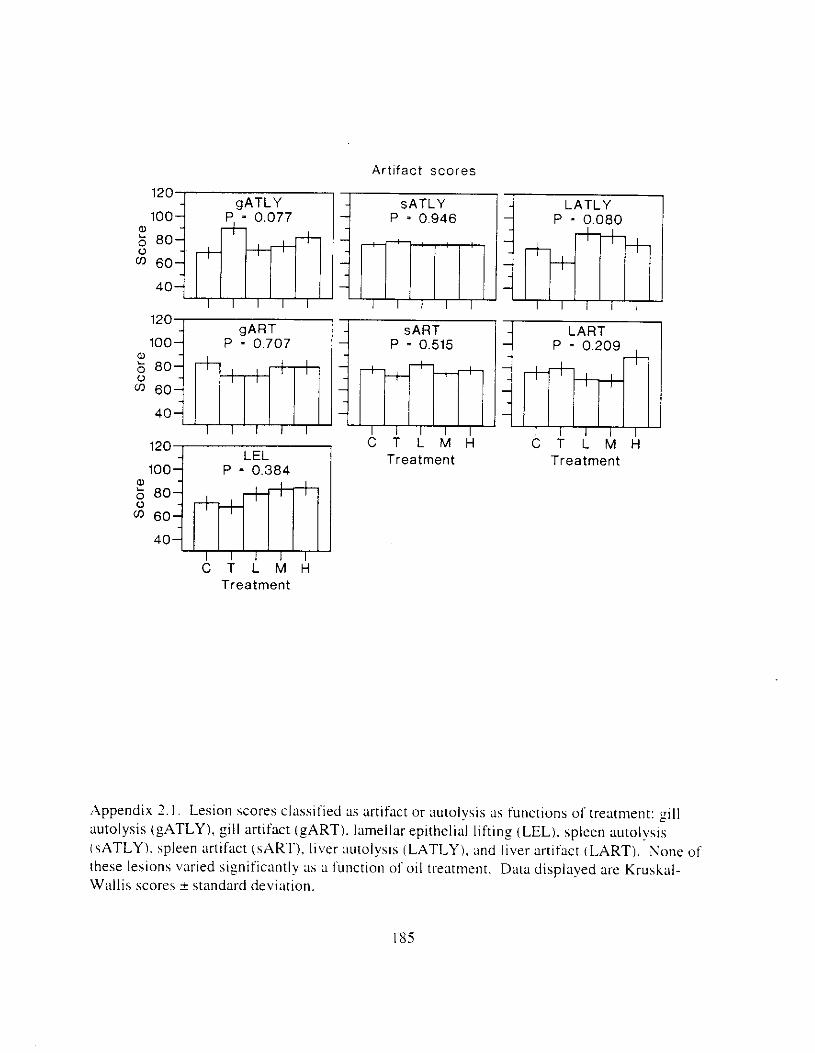
Artifact scores
P = 0.077 P - 0.946 P - 0.080
80
40
120
100 P - 0.707 1 4 P = 0.515 gART sART
120
100 LEL
P - 0.384
C T L M H Treatment
Treatment
P = 0.209 , LART m C T L M H
Treatment
I X5
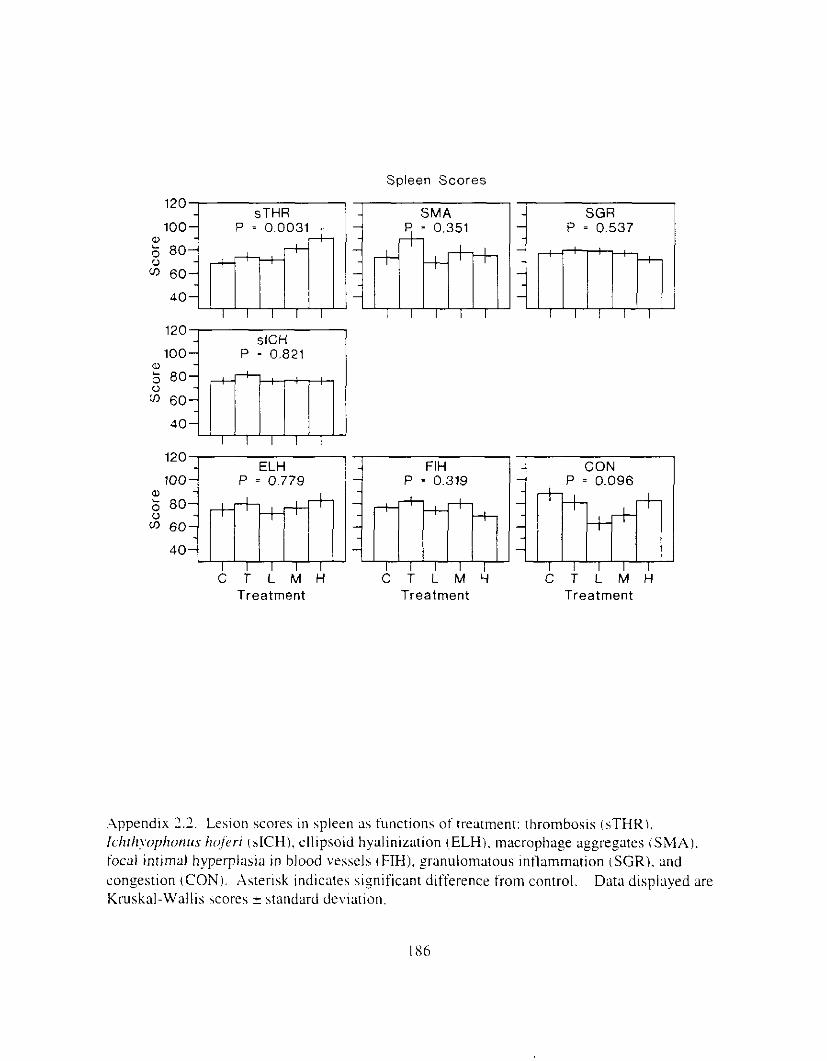
Spleen Scores :::mi - SMA
& I I I I I
P = 0.0031 . - a,
P - 0.351 P = 0.537
i; 8 0 - 60 - +++ 4 0 -
- 120
100 slCH
P - 0.821
:": 40
Q)
P = 0.779 P - 0.319 P = 0.096
: 8 0 60
40
C T L M H C T L M H C T L M H Treatment Treatment Treatment
,Appendix 1.2. Lesion scores in spleen as functions o f treatment: thrombosis (sTHRi. Ichtlryophonus h j e r i (sICH), ellipsoid hyalinization tELH), macrophage aggregates (SMA). focal intimal hyperplasia in blood vessels rFIH), granulomatous intlammation (SGR). and congestion (CON). Asterisk indicates siyificant difference from control. Data displayed are Kruskal-Wallis scores ? standard deviation.
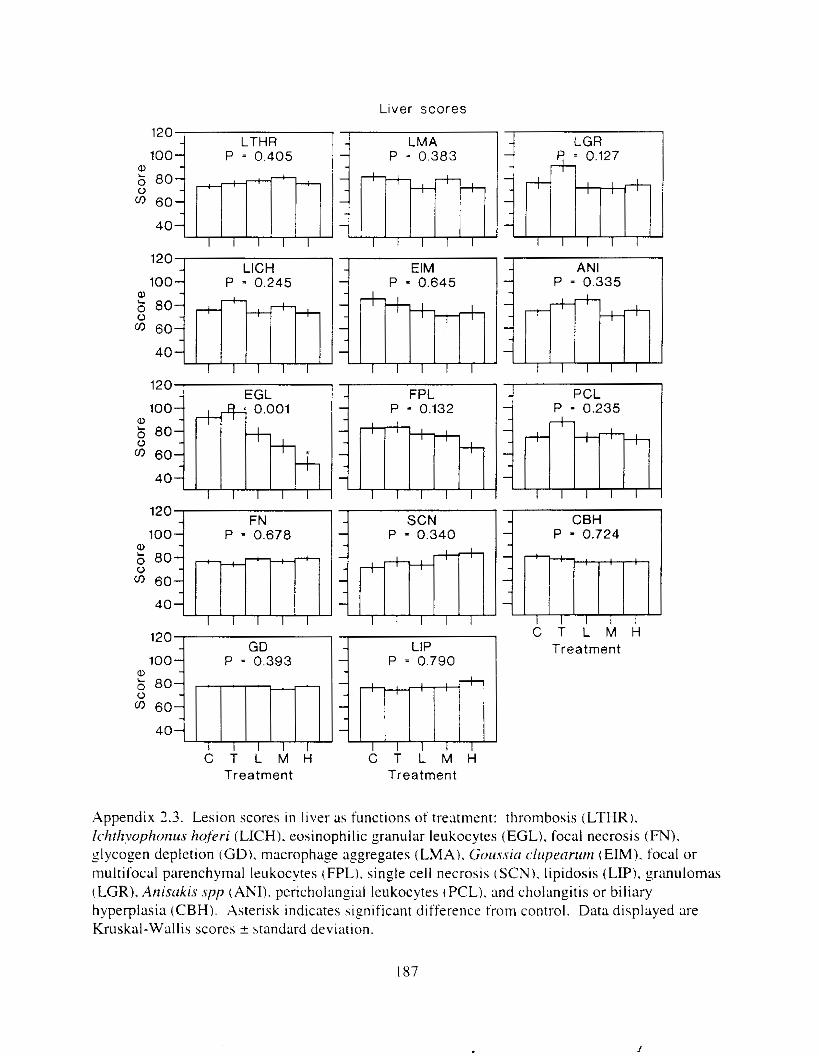
Liver s co res
P = 0.405 P = 0.383
40
ANI P - 0.245
0) P - 0.645 P = 0.335
5 80 ++ 60
40 I I I I I
40
120
100 P - 0.678 FN
P - 0.132 FPL m
P - 0.340 SCN
120
100 GD
P = 0.393
Treatment
4 P = 0.790 LIP I m C T L M H
Treatment
4 P - 0.235 PCL
m C T L M H
Treatment
Appendix 2.3. Lesion scores in liver as functions o f treatment: thrombosis (LTHR). Ichrhyophonus hoferi (LICH). eosinophilic granular leukocytes (EGL), focal necrosis tFN), slycogen depletion (GD). macrophage aggregates (LMA). Goussicl cfuprcrnmz ( E M ) . focal or multifocal parenchymal leukocytes (FPL). single cell necrosis tSCN). lipidosis (LIP). granulomas (LGR). Anisczki.7 .spp (ANI). pericholangial leukocytes t PCL). and cholangitis or biliary hyperplasia (CBH). Asterisk indicates sisnificant difference from control. Data displayed are Kruskal-Wallis scores & standard deviation.
I87
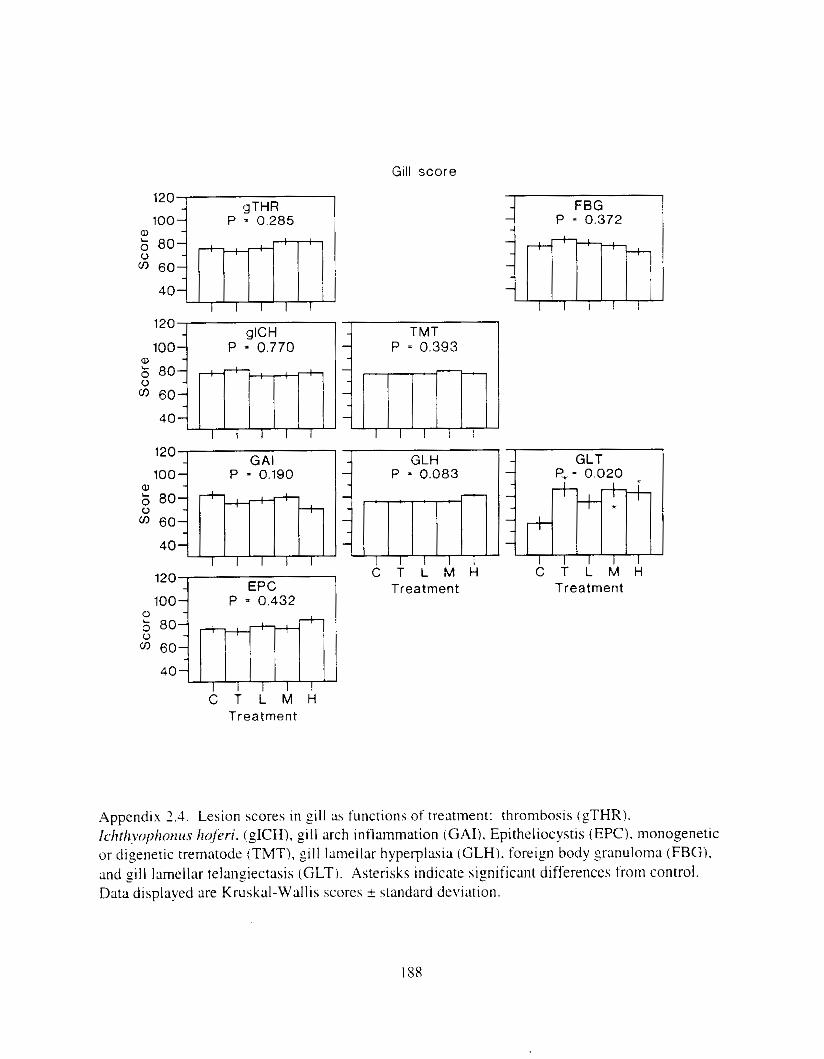
Gill sco re
120
100 P = 0.285 gTHR
40
100 P - 0.770 P = 0.393
120 , GAI P = 0.190 1
0) 60
40
,,, P = 0.083
I I I I I
P = 0.432
60
40
C T L M H
C i i M H Treatment
1
P * 0.372 FBG m
Treatment
Treatment
Appendix 2.4. Lesion scores in gill as functions of treatment: thrombosis (fTHR). /c/lr/lvr,p/lorlus hoferi. (gICH), gill arch inflammation (GAI). Epitheliocystis (EPC). monogenetic or digenetic trematode iTMT). sill laneliar hyperplasia (GLH). foreign body granuloma (FBG),
gill lamellar telangiectasis (GLT). Asterisks indicate sisnificant differences from control. Data displayed are Kruskal-Wallis scores k standard deviation.

.Appendix 3.1 Compos~tion ot polynuclear m m a t i c hydrocarbons 111 1094 treatment \vatel
Composition of polynuclear aronutic hydrocarbons IP..\HI i n water In 1994. Character~stic t~me- dependent weathering patterns were cvident: percentages of lighter compounds. particularly naphthalenes. decreased. while percentages ot heavier compounds. particularly phenanthrenes. increased. Differential weathermy across treatments was also evldent: for example compare total naphthalenes on day 0 for each treatment. Abbreviations of chemical compounds are found i n Appendix 0.2.
Appendix 3. I . I . Compos~tion of PAH i n trace-oil treatment water i n 1994 at the beynning. midpoint. and end of the experiment.
Appendix 3.1.2. Composition of P.4H in low-011 trearment \vater i n 1994 at the he:innlns. midpoint. and end of the experlment.
Appendix 3. I .3. Composition of PAH in mid-oil treatment water i n 1994 at the beginning, midpoint. and end of the experiment.
Appendix 3.1.4. Composition o f PAH i n high-oil treatment water i n 1994 at the beginning, midpoint. and end of the experiment.
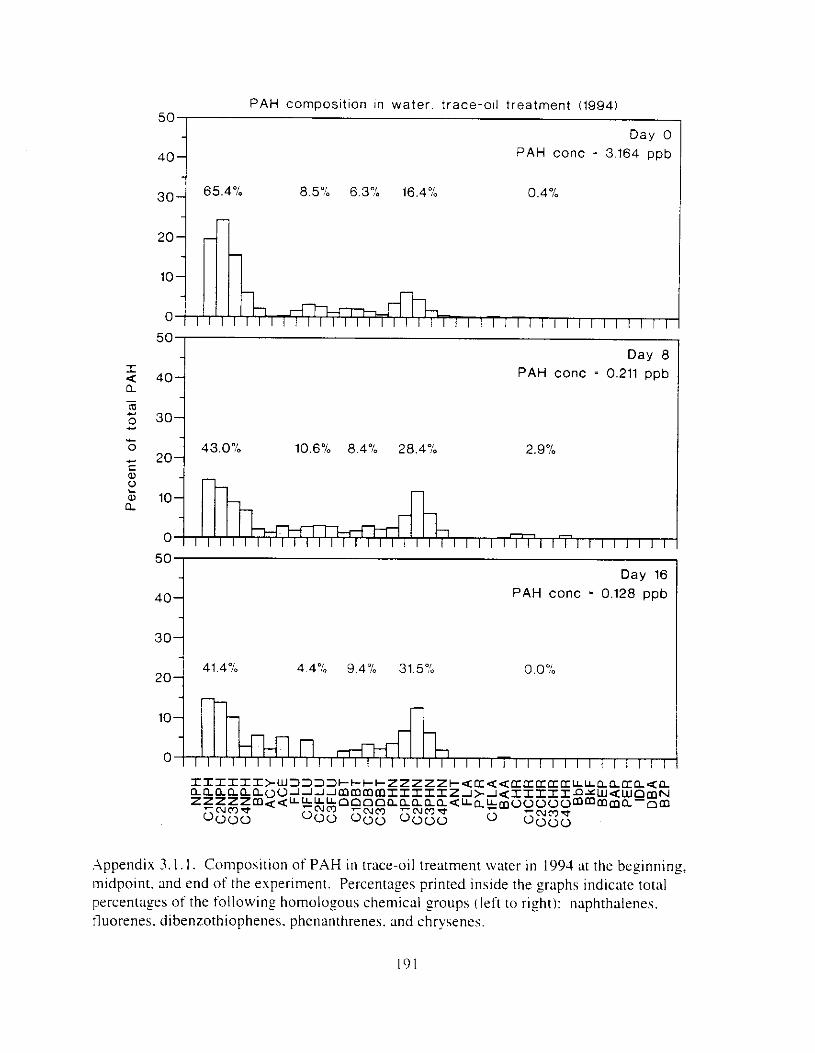
0~
00
0
NO
P
NP
H
ClN
PH
C3N
PH
C
2NP
H
C4N
PH
AC
Y
BP
H
AC
E
ClF
LU
F
LU
C2F
LU
C3F
LU
DB
T
C2D
BT
C
lDB
T
C3D
BT
P
HN
C
lPH
N
C2P
HN
C
3PH
N
C4P
HN
A
NT
F
LA
PY
R
ClF
LA
B
AA
C
HR
C
lCH
R
C2C
HR
C
3CH
R
C4C
HR
B
bF
BkF
B
EP
B
AP
PE
R
DB
A
IDP
BZ
P
P b
a?
Pe
rce
nt
of
tota
l PA
H
P
0 w s
2
00
00
0
NO
P
P
U
(D
I
9
s 0
0 3 0
L
U P I
0 2 0 w m
PO
*
W D
IC
U uo
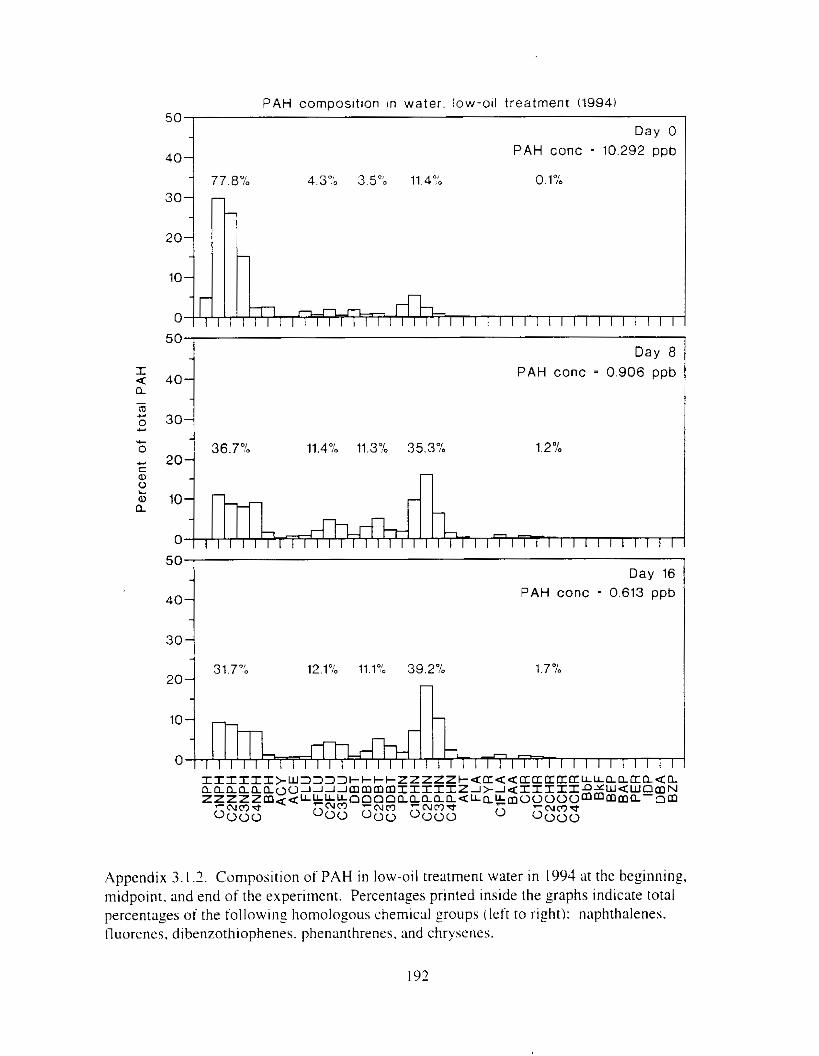
PAH composltion In water. low-011 treatment (1994) 50
- PAH conc = 10.292 ppb
Day 0
40- - 77.8-lo 4.3"b 3.5% 11.4% 0 .lei*
30- - - -
20-
10- -
0 [lJlml I 1 1 I I I I I I / 1 1 I I I I I I I I I I I 50
Day a I a 40- a
i; 30-
PAH conc = 0.906 ppb
- m
I
20 36.7"b 11.4% 11.3% 35.3% 1.2 %
50 Day 16
PAH conc - 0.613 ppb 40-
3 0 1
1.7%
Appendix 3.1.2. Composition of PAH i n low-oil treatment water in 1994 at the beginning, midpoint. and end of the experiment. Percentages printed inside the graphs indicate total percentages of the following homologous chemical groups (left to right): naphthalenes. fluorenes, dibenzothiophenes. phenanthrenes. and chrysenes.
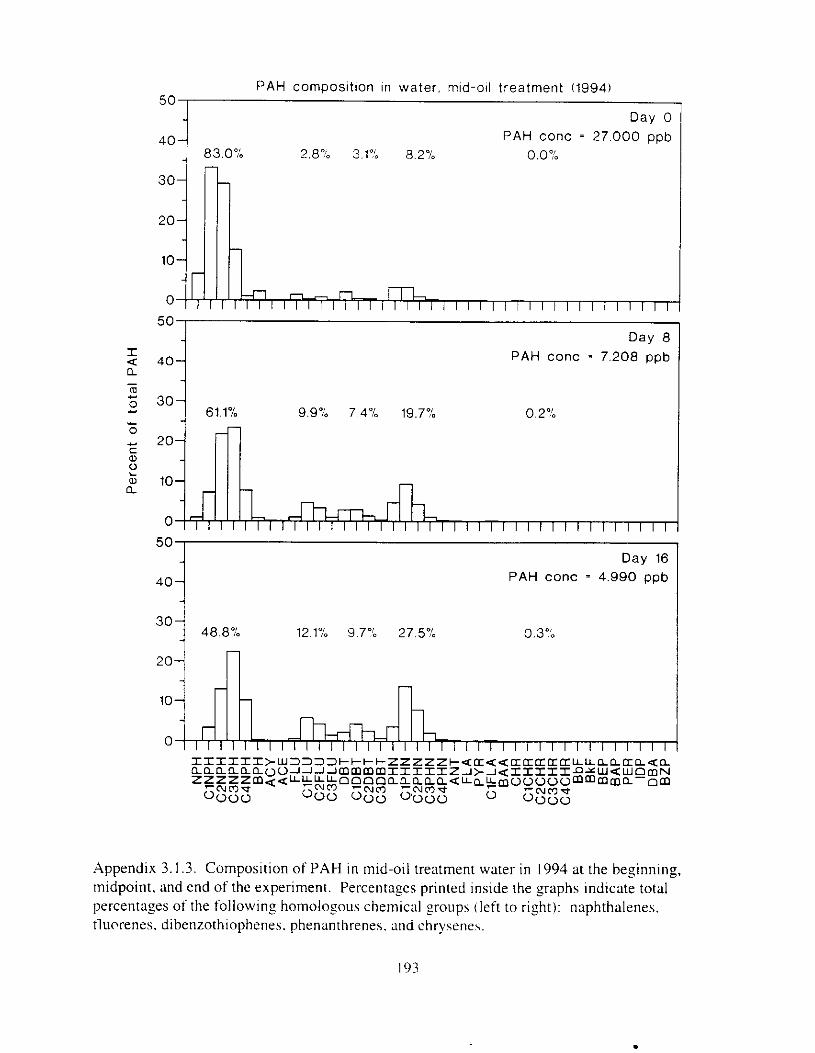
.
NP
H
ClN
PH
C
2NP
H
C3N
PH
C
4NP
H
BP
H
AC
Y
AC
E
ClF
LU
F
LU
C2F
LU
C3F
LU
DB
T
C2D
BT
C
lDB
T
C3D
BT
ClP
HN
P
HN
C2P
HN
C
3PH
N
C4P
HN
A
NT
FLA
P
YR
C
lFLA
B
AA
C
HR
C2C
HR
C
lCH
R
C3C
HR
C
4CH
R
BbF
B
kF
BE
P
BA
P
PE
R
DB
A
IDP
BZ
P
Pe
rce
nt
of t
ota
l PA
H
NO
+
P
;? N
0
0 3
0
P m sp
N
N
5 0
0
00
U
uD
I<
D)
uo
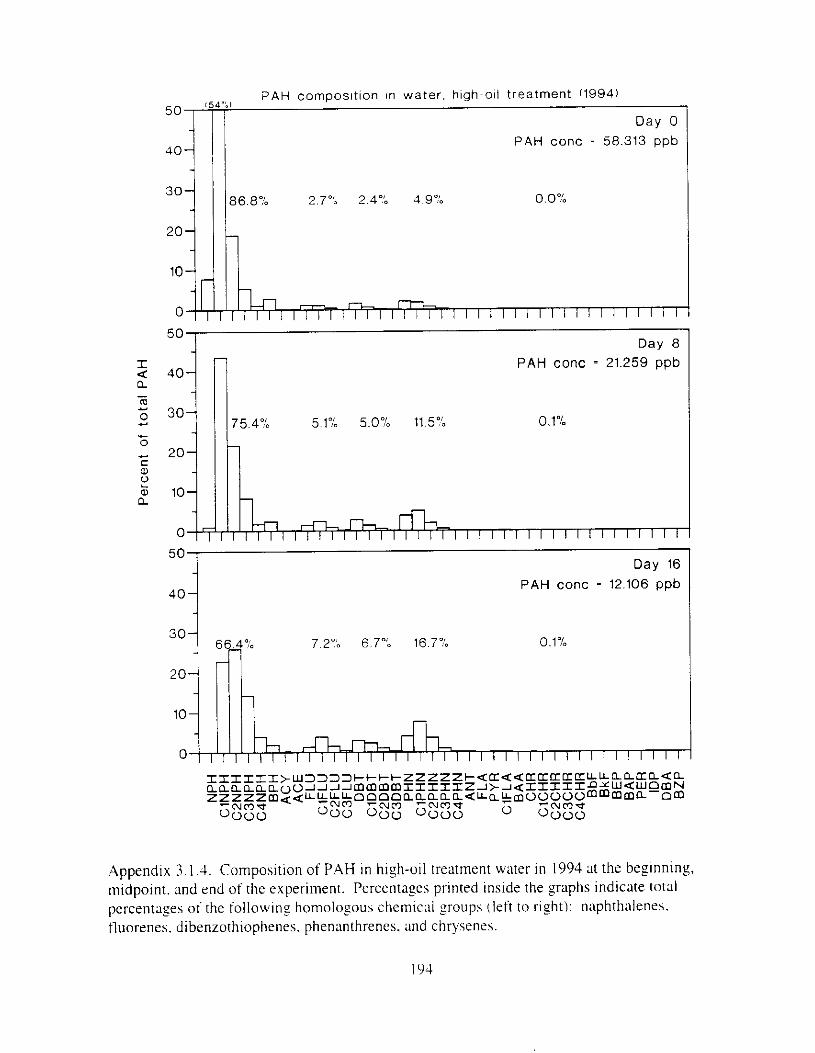
11
Per
cent
of
tota
l P
AH
I I

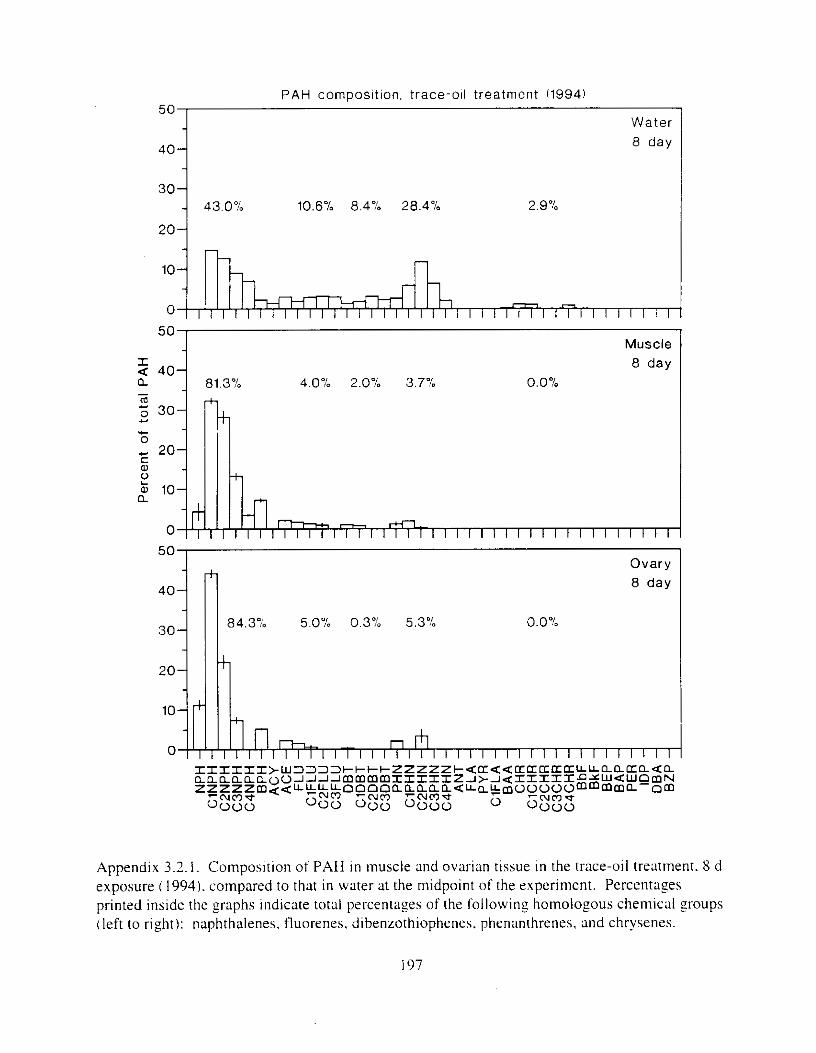
Per
cen
t of
to
tal
PA
H
NW
P
s
0~
00
0
N
UP
L
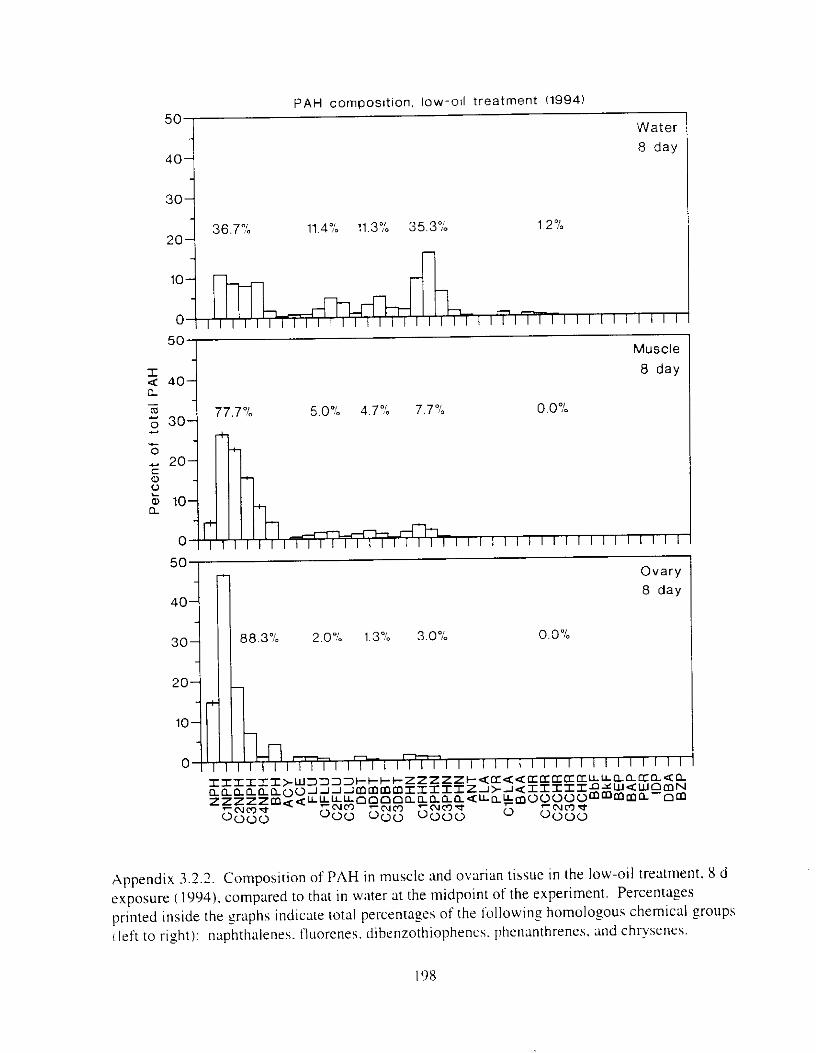
A
no
OO
OI
W
WP
I
-
~
II
II
II
I'
N
PH
-
C3N
PH
-
I C
2NP
H -
I C
lNP
H -
t
m
C4N
Pt-1
-
m
BP
H -
G2
AC
Y -
A
CE
-
ClF
LU -
FLU
-
C2F
LU -
C3F
LU -
ClD
BT
-
C2D
BT
-
C3D
BT
-
PH
N -
ClP
HN
-
C2P
HN
-
C3P
HN
-
C4P
HN
-
AN
T -
PY
R -
FLA
-
ClF
LA -
BA
A -
CH
R -
ClC
HR
-
C2C
HR
-
C3C
HR
-
C4C
HR
-
BbF
-
BE
P -
BkF
-
BA
P -
PE
R -
IDP -
DB
A -
BZ
P -
W v ;9
0
DB
T -1
- w m- w >
?
0 P
0 s
mo
Q
<
YY
w
e
Pe
rce
nt
of
tota
l P
AH
u
NO
P
P
0
'0
06
00
F
Jw
P
0 li
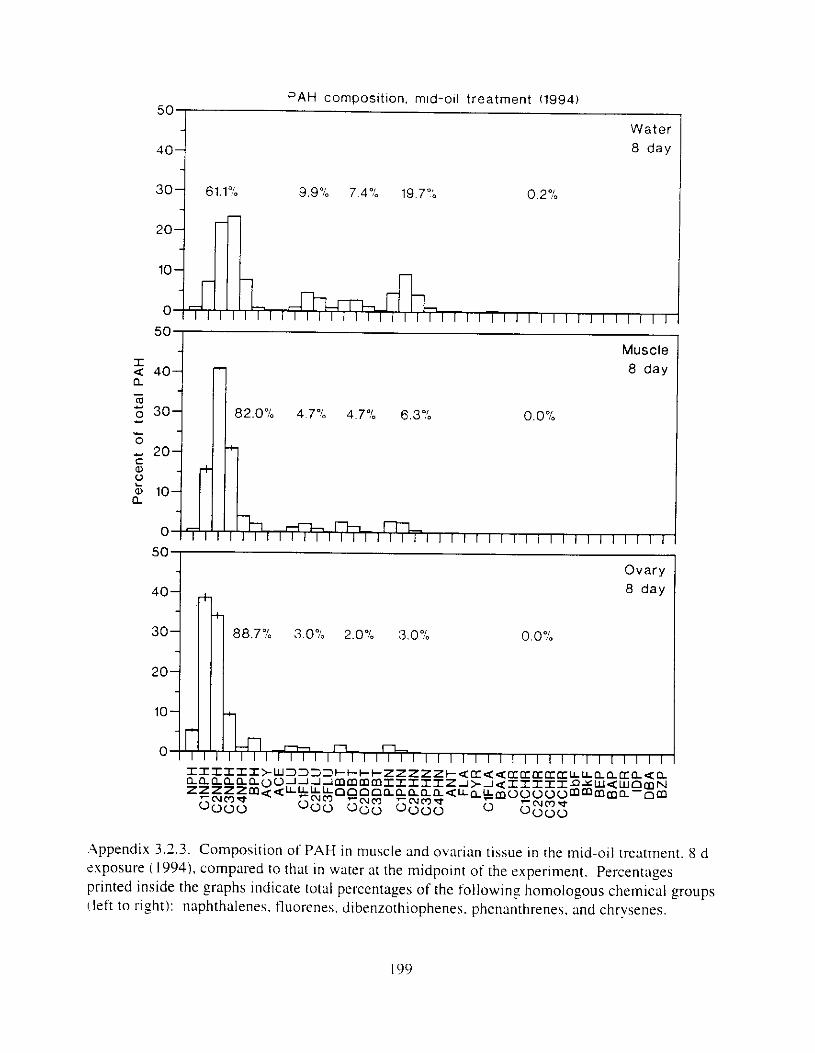
2
00
00
0
WW
P
I,
I,
I,
I,
N
PH
-1
ClN
PH
-
C3N
PH
-
+ C
2NP
H -
C4N
PH
-
BP
H -
AC
Y -
AC
E -
FLU
-
C2F
LCI -
C
lFL
U -
0
0
C3F
LU -
s
ClD
BT
-
P
C2D
BT
-
C3D
BT
-
0
PH
N -
s
C2P
HN
-
ClP
HN
-
0
C3P
HN
-
&.e C
4PH
N -
AN
T -
PY
R -
FLA
-
ClF
LA
-
BA
A -
ClC
HR
-
CH
R -
C2C
HR
-
C3C
HR
-
C4C
HR
-
BbF
-
BE
P -
BkF
-
BA
P -
PE
R -
IDP
-
mo
D
BA
-
a<
BZ
P 7
Y
Y
De
t m
m s
U
DB
T -7
0
P s
0
P s
0
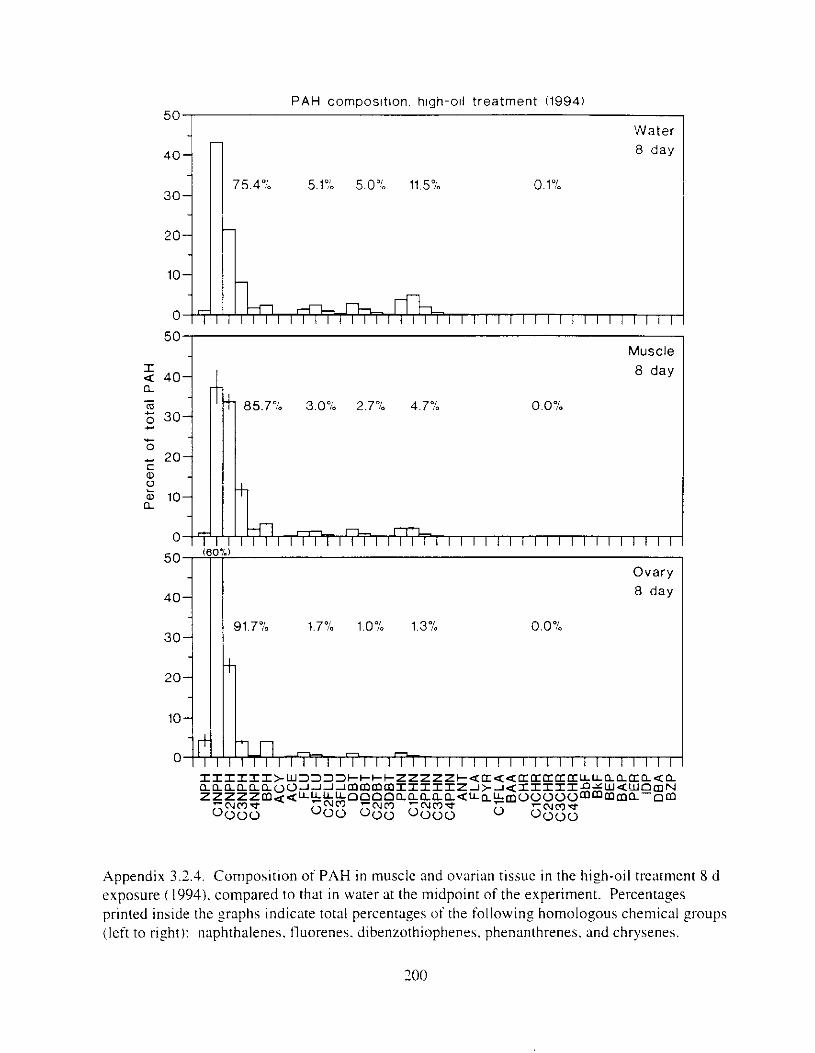
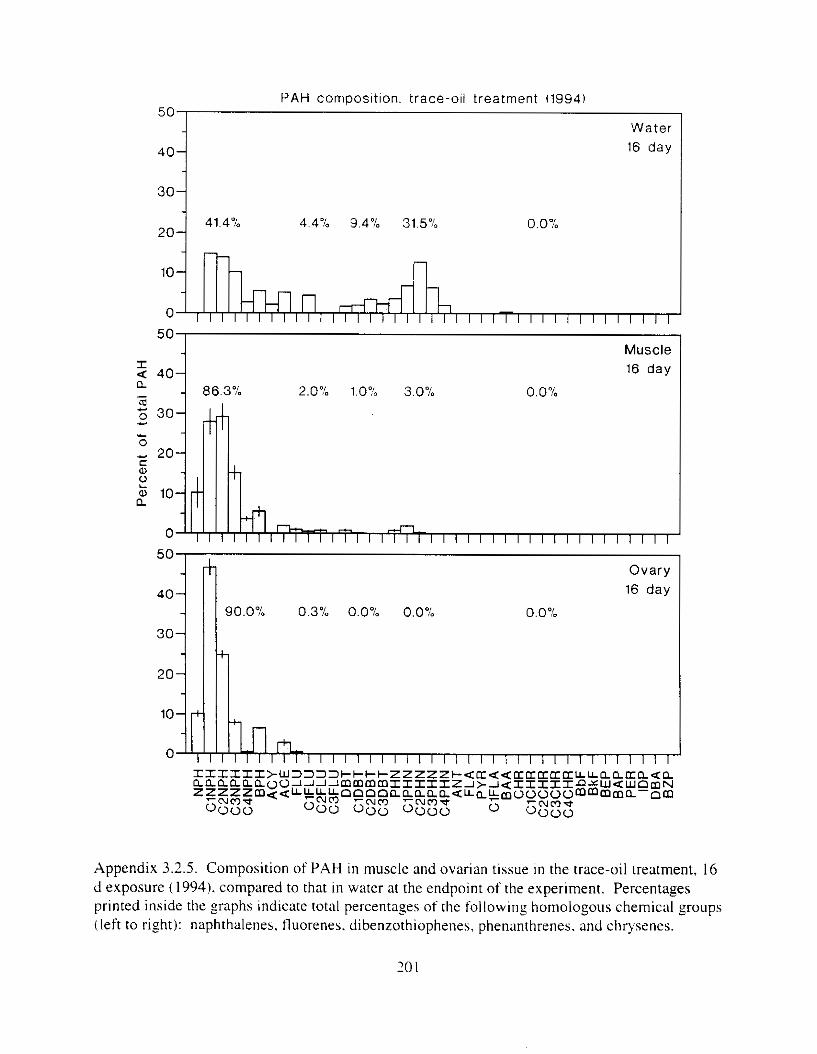
NP
H -7
ClN
PH
-
C3N
PH
t
C2N
PH
-
+ C
4NP
H -
. -2
BP
H -1
AC
Y -
AC
E -
3
FLU
-.
(D
0
P s
ClF
LU
-
C2F
LU -
C3F
LU -
DB
T -
ClD
BT
-
C2D
BT
-
C3D
BT
-
PH
N -
ClP
HN
-
C2P
HN
-
C3P
HN
-
C4P
HN
-
AN
T -
PY
R -
FLA
-
ClF
LA
-
BA
A -
ClC
HR
-
CH
R -
C2C
HR
-
P
C3C
HR
-
s C
4CH
R -
BbF
-
BE
P -
BkF
-
BA
P -
PE
R -
IDP
-
DB
A -
BZ
P -
P s
0 s 0 s
W
0
0
0
ZF
a
YY
w
e
Pe
rce
nt
of t
ota
l P
AH
0
0 s
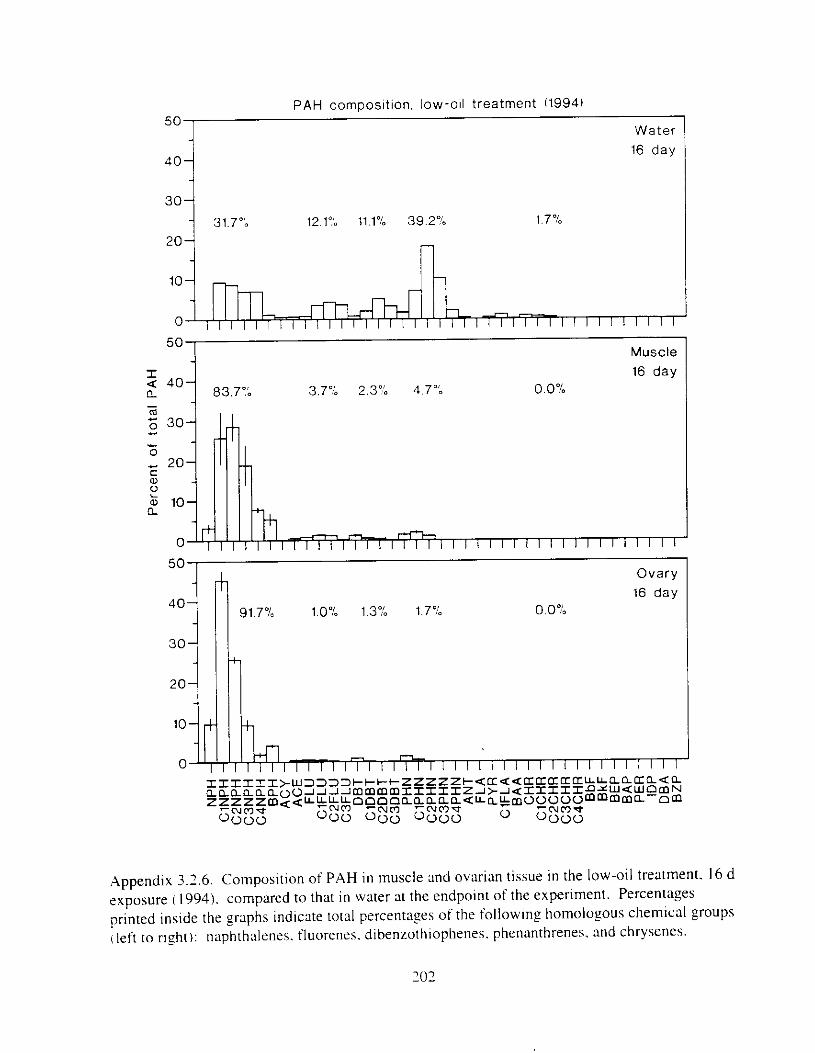
I
Per
cent
of
tota
l P
AH
L
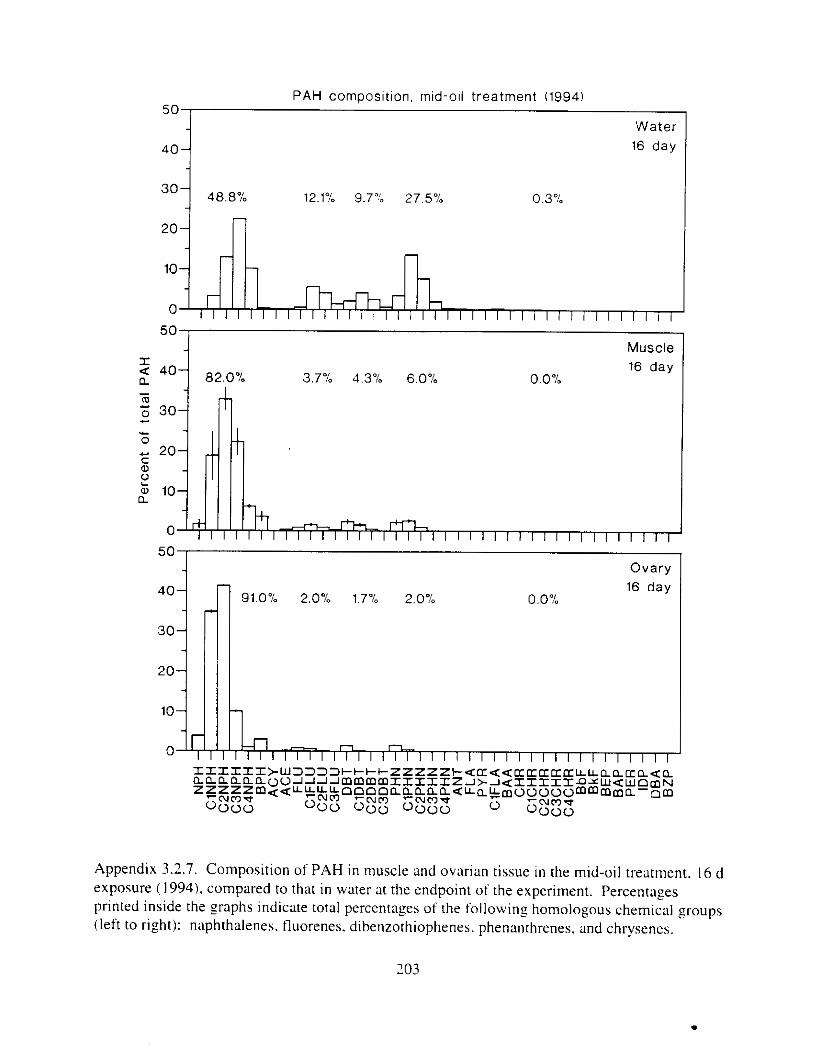
Per
cent
of
tota
l P
AH
2
IU
WP
w s
P s
.4
0
P,
0 s
r P s
w
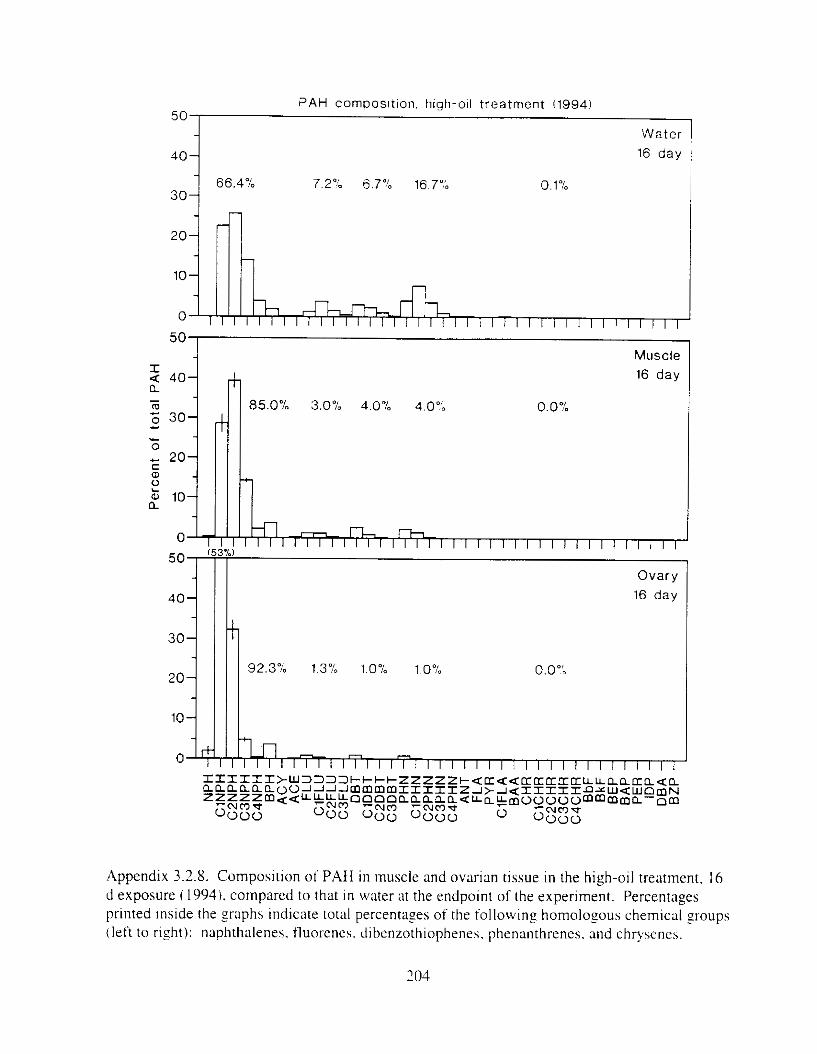
Per
cen
t of
to
tal
PA
H
... 0
-
NO
P i

.Appendix 3.3 Cotnpositlon of polynuclear aromattc hydrocarbons i n eggs ( 199.1)
Composition o f polynuclear aromattc hydrocarbons (PAHI i n e ~ g s resultiny from exposure of pre-spawn adult herrtng to otl-contaminated water. Composition in eggs appeared to he fairly constant over the I6 d observation period. but relative concentrations of naphthalenes did tend to decline with depuration time (0.092 L P L 0 . 157'1. and relative concentrations of a11 heavier compounds tended to increase with time (0.001 < P L 0.093). These changes in composttion in eggs during incubation were slight. Abbreviations of chemical compounds are found i n Appendix 0.2.
Appendix 3.3. I . Composition of PAH i n egg tissue. hish-oil treatment. 8 d adult exposure. Indicated times are depuration times.
Appendix 3.3.2. Composition o t PAH it1 e z g tissue. hlsh-oil treatmen[. 16 d adult exposure. Indicated times are depurmon t t n w
206

Appendix 3.3. I ( ( l r ri,q/u). Composition of PAH in egg tissue. high-oil treatment. Y d adult exposure. Indicated times are depuration times. Percentages printed inside the p p h s indicate total percentages of the following homologous chemical youps cleft to right): naphthalenes. tluorenes. dibenzothiophenes. phenanthrenes. and chrysenes.
207
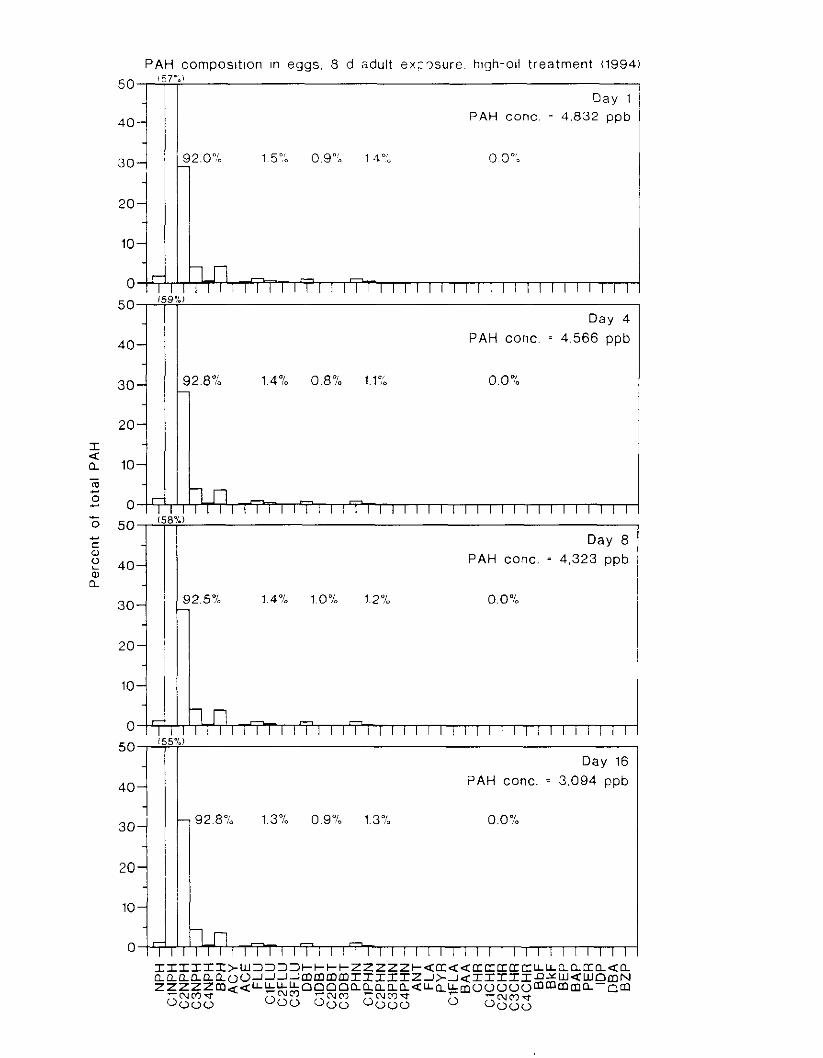
PAH composltlon In eggs, 8 d adult exrqsure. hlgh-oll treatment 119941
30
10
20
a a 10 I
a
20
10
40
3 0
10
15921
i Day 1
PAH conc. = 4.832 ppb
?.04b 1 5 % 0.9"; 1 4 % 0 O",
Day 4 PAH conc. = 4,566 ppb
Day 8 PAH conc. = 4,323 ppb
Day 16 PAH conc. = 3,094 ppb
i 92.8% 1.3% 0.9% 1.3% 0.09b
i
1

Appendix 3.3.2 f u r r - ight ) . Composition of PAH in egg tissue. high-oil treatment. 16 d adult exposure. Indicated times are depuration times. Percentages printed inside the graphs indicate total percentages o i the following homologous chem~cal :coups (Icft to right): naphthalenes. tluorenes. dibenzothiophenes. phenanthrenes. and chrvscnes.
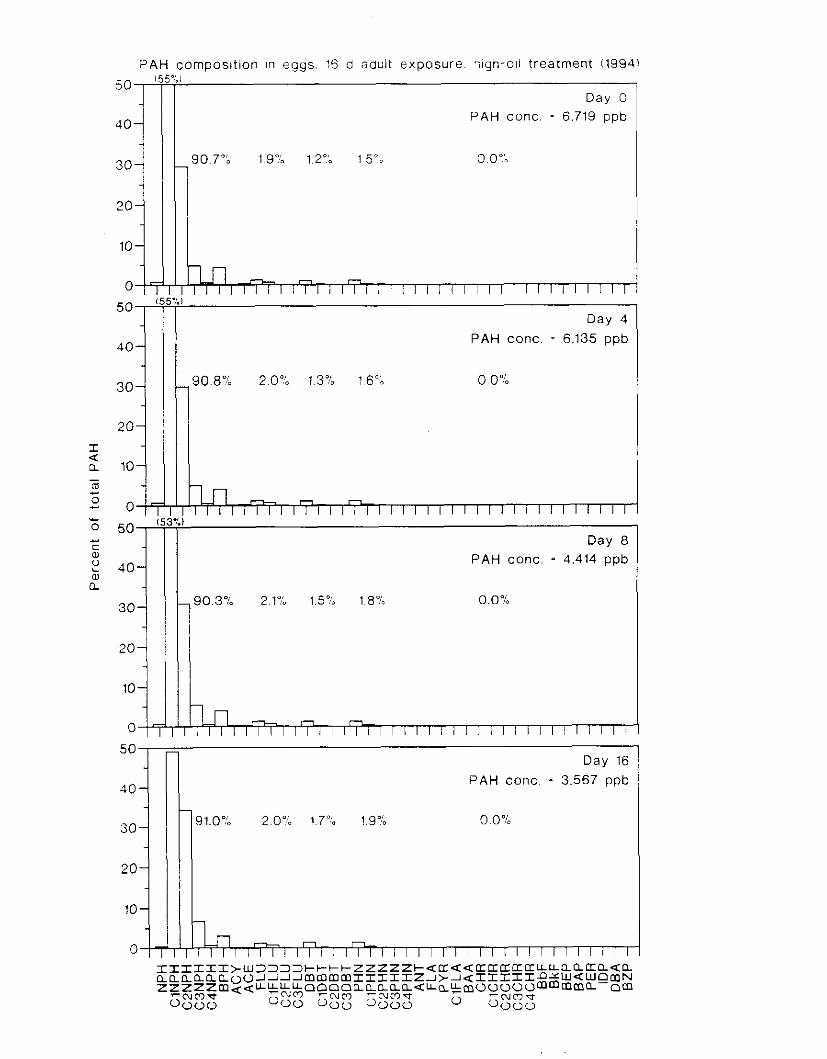
?AH composition In eggs, !Fj c acult exposure. I igh-ol l treatment (19941
40
10
20 I a a 10 m 0
L
- 0 0 50 c
a a,
20
10
1 i'
PAH conc. = 6.719 D a y ppb O I 90.7"b 1.9% 1.29; 1 ! j e O 0 0"b I
Day 4 PAH conc. = 6.135 ppb
90.8% 2.0% 1.3"b 1 6 % 0.0%
Day 8 PAH conc. = 4,414 ppb
,90.3% 2.1% 1.596 1.896 0 . 0 *IO
Day 16 ?AH conc. = 3.567 ppb
91.09b 2.0"; 1 7 % 19% 0.0%

Polynuclear aromat~c hkdrocarhon (PAHI composition 111 tteatment water was compa~-ed between years 1994 and 1995 visuallv bv \uhtracting 199s v:tIues l r o m 1904 V~IIUKS. Beginn~nz. md-. and end-point exposure times were compared ( d a y 0 . 8. and 16. respectivelyl. There were insufficient data to allow ;I detailed multivariate comparison between years. An alternali\,e way to compare composition between years is to match appropriate Zraphs in Appendices 7. I and 4.2. Abbreviations of chemical compounds are found i n Appendix 0.2.
. .
Appendix 3.4. I . Comparison o f PAH composition in ttxe-oil treatment water. years 1994 and 1995.
,Appendix 3.4.2. Cornparison ot PAH compos~ t~on in l o \ v - o ~ l 11-eartnent water, years I994 and 1995.
Appendix 3.4.3. Comparison ot PAH composition i n mid-oil treatment water. years 1994 and 1995.
Appendix 3.4.4. Comparison of PAH composition i n high-oil treatment water. years I994 and 1995.
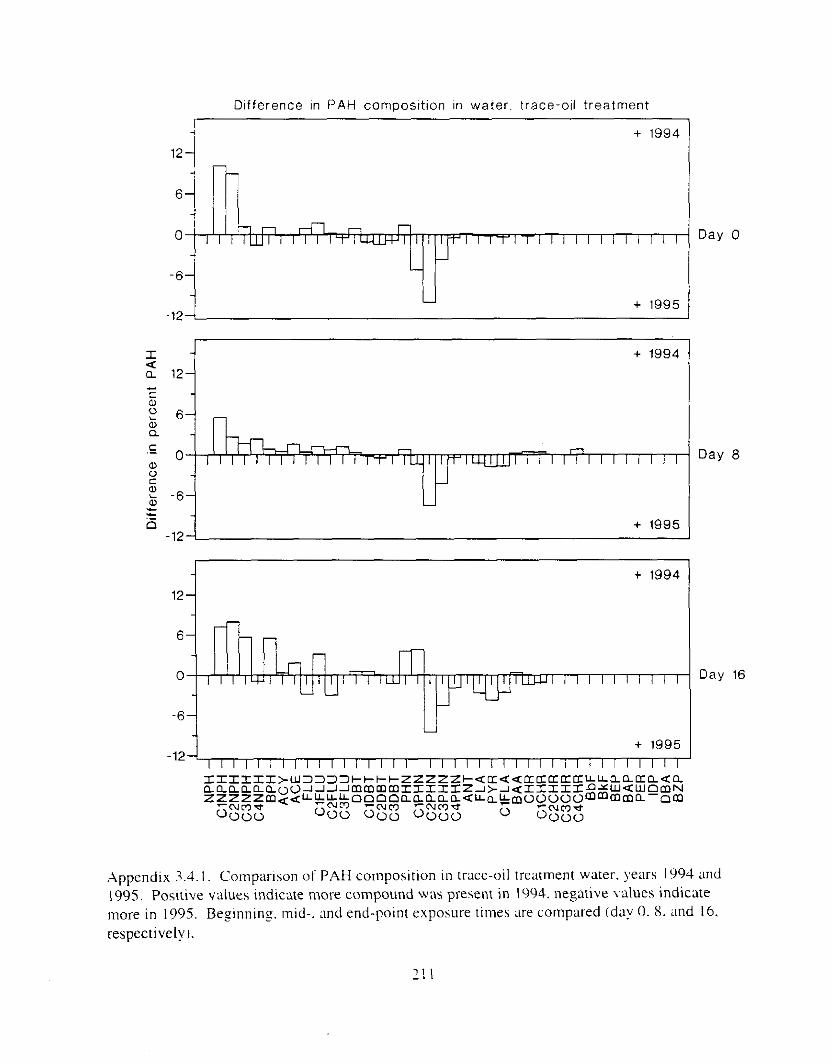
Difference In PAH cornposttion In water, trace-oll treatment
I a n
.- C
+ 1994 12
6
0
-6
+ 1995
i + 1994 1 1 2 i
-12 + 1995
Dav 0
l21 -
+ 1994
-6-
-12- + 1995
1 1 / / 1 1 1 / I I / I I I I ' I / I / I / / I I I I / I l i I I I I I I
Day a
Day 16
21 I
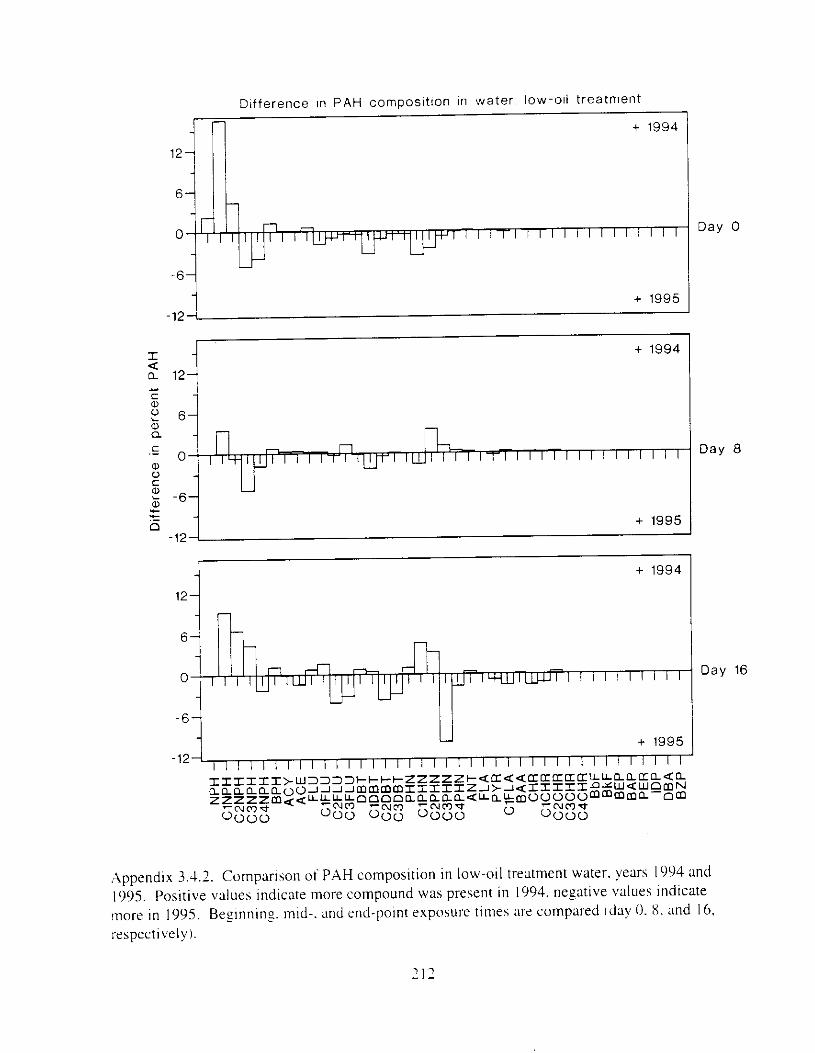
ClP
HN
C
ZP
HN
C
3PH
N
C4P
HN
A
NT
Dif
fere
nce
in pe
rcen
t PA
H
2
+ (D
W
cn
2
O
W Y m
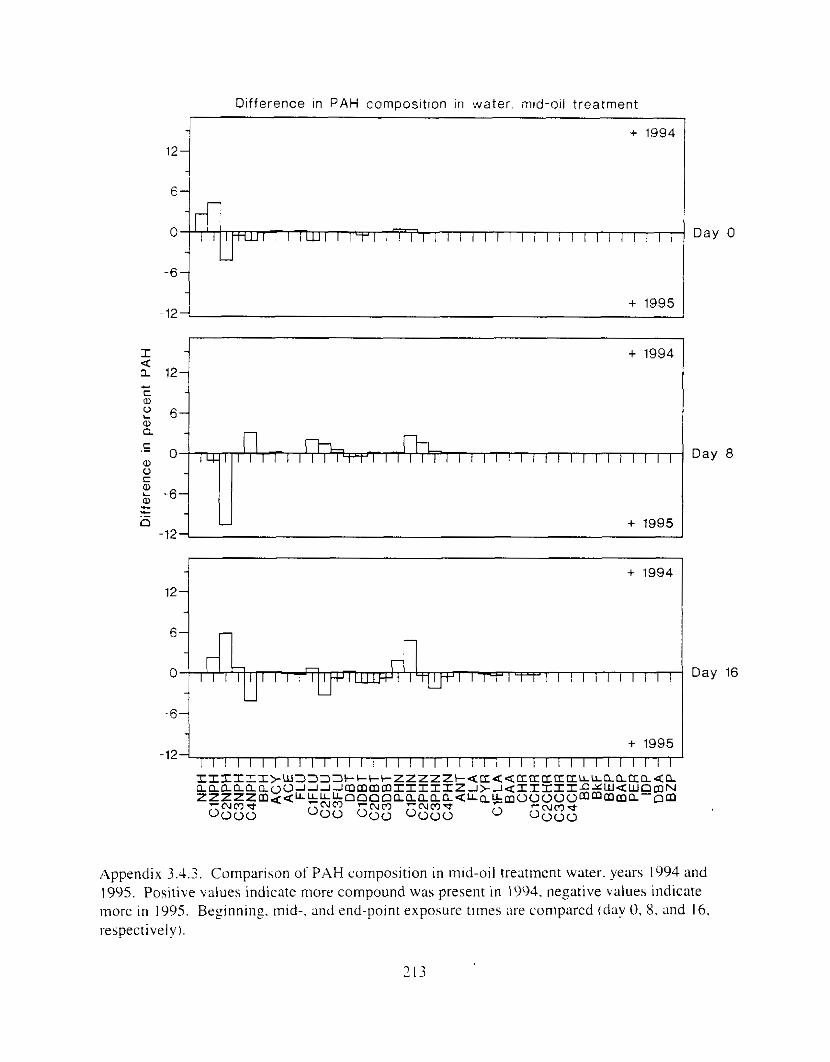
Difference In PAH cornposltlon In water. mtd-oll treatment
+ 1994
I C I
-6-
+ 1995 -121
$ 4 a i 2
+ 1994
l2{
+ 1994
Day 16
- 6 1 I -12
+ 1995 I l / l l l l / l l l l l l l l l l l I l l l l l l i l l l l l l l l l l l
Appendix 3.1.3. Comparison of PAH composition in mld-oil treatment water. years 1994 and 1995. Positive values indicate more compound was present in 1994. negative vaJues indicate more in 1995. Beginning. mid-. and end-point exposure times ;we compared (day 0, X. and 16. (respectively).
713
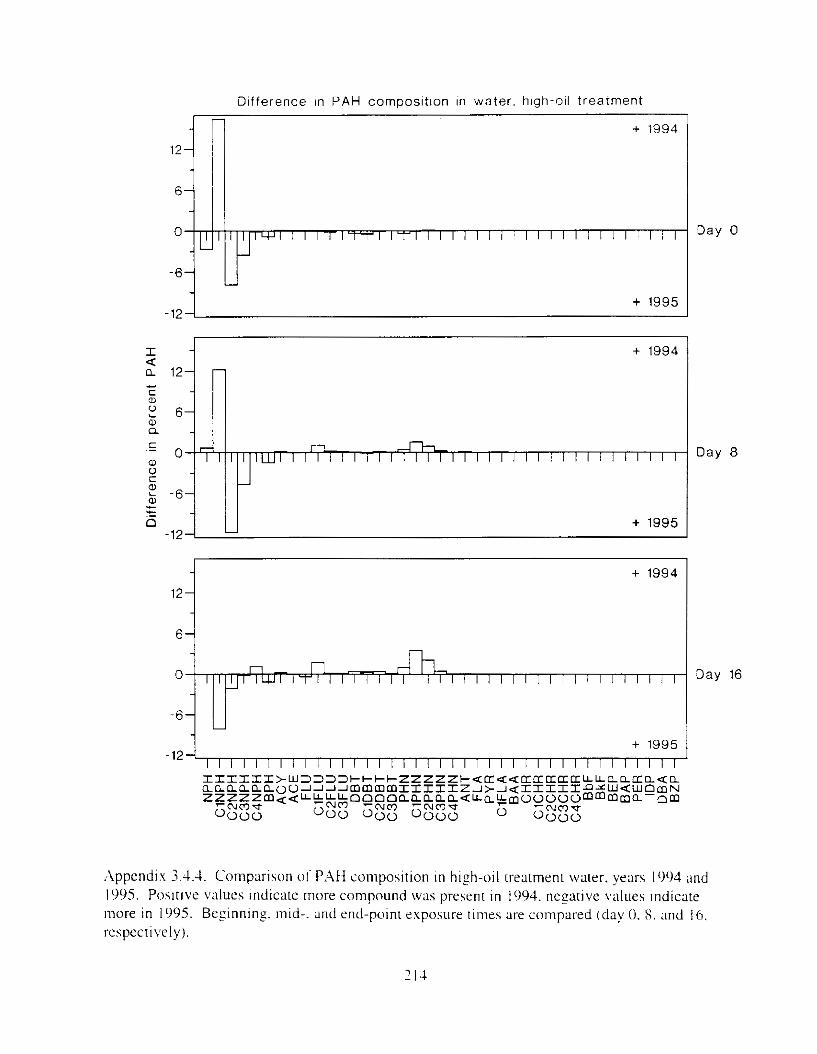
Di f fe rence In PAH cornposltlon In water . hlgh-oil t reatment
+ 1994
-I3- u - + 1995
-12-
12! 6
+ 1994
+ 1995 1 1 1 1 1 l l I l l l l l l / l l l / l l 1 1 1 1 1 1 1 1 / 1 l / I I / I -127
Day 0
Day 8
Day 16
Appendix 3.J.J. Comparison o f PAH composition In high-oil treatment water. years I994 and 1995. P o s ~ t ~ v e values indicate more compound was present i n 1994. nezative values Indicate ]nore in 1995. Beginnins. mid-. 2nd end-point exposure limes are compared (day 0. S. and 16. respectively).

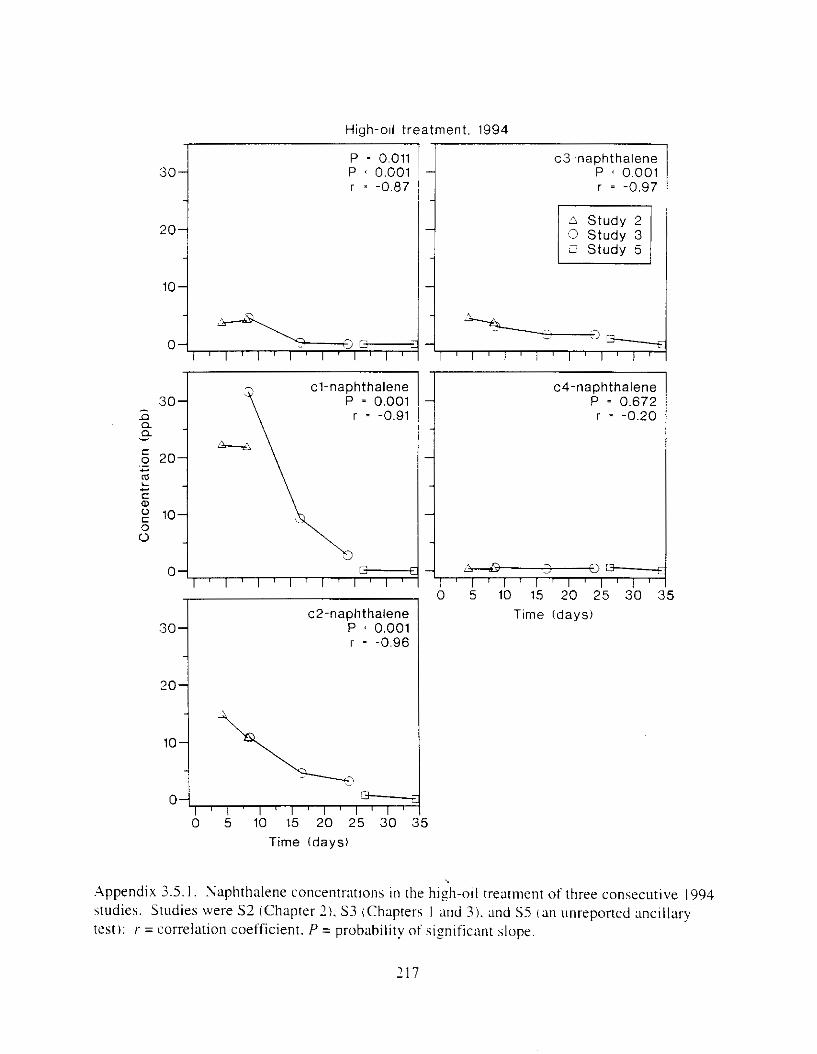
High-oll treatment, 1994
P 0.001 P = 0.011
r * -0.87
2ol 10
cl-naphthalene P = 0.001
r = -0.91 30- - n
Q Q
.- ,-
t a,
0 0
30i 2 0 -1
c2-naphthalene P ' 0.001 r = -0.96
0 i ' l ' l ' l ' l ' l '
0 5 10 15 2 0 2 5 30 : Time (days)
i c3-naphthalene P e 0.001 r = -0 .97
~~~~
A S t u d y 2 0 Study 3
1
-I i
c4-naphthalene P = 0.672
r - -0.20
i
lI :I , , = , I ,al> 0 5 10 15 20 25 30
Time (days)
5
5
.Appendix 3.5. I . Naphthalene concentratlons in the high-oil treatment of three consecutive I994 studies. Studies were S2 (Chapter 2 ) . S3 (Chapters I and 3). and S 5 (an unreported mci11ary test): I' = correlation coefficient. P = probability of significant slope.
217
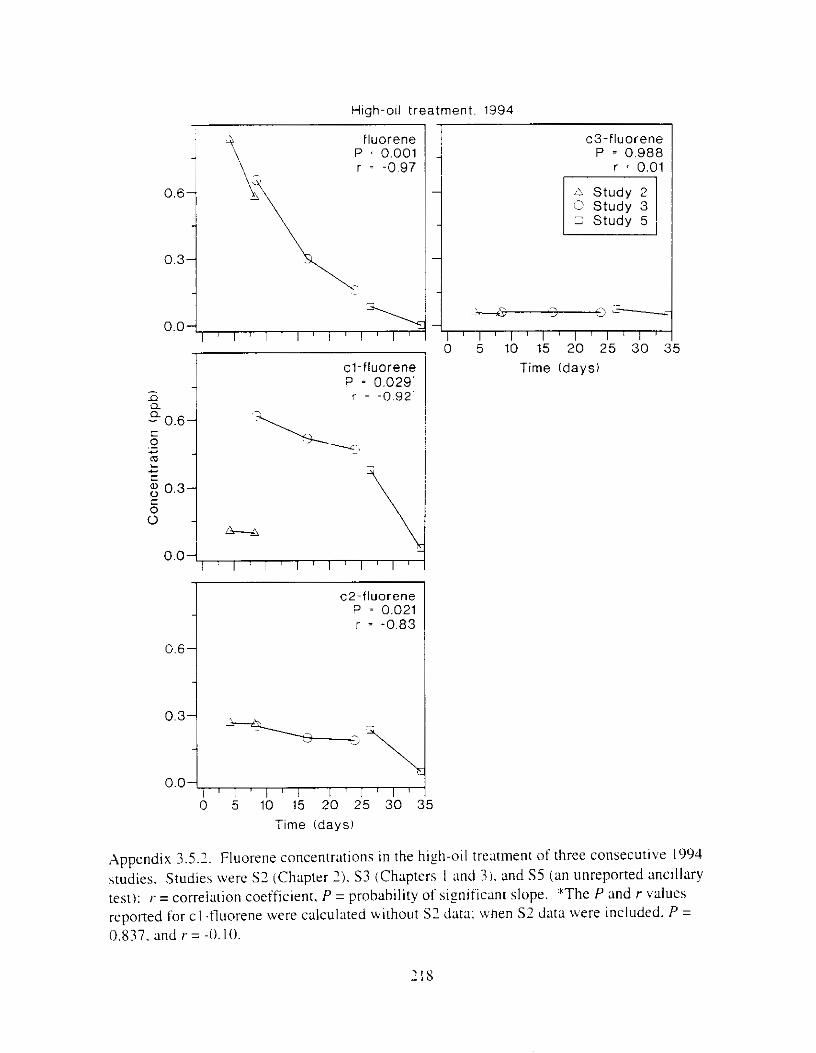
High-oll treatment. 1994
- A Study 2 I Z Study 5 I C Study 3
0.0 I ' I ' I ' I ' I ' I ' I
1 0 5 10 15 2 0 25 30
0.04 I ' l ' l ' 1 ' 1 ' 1 '
c2-fluorene P = 0.021 r = -0.03
0.64
1
1
0.04 l ' l ' l ' l ' I ' l i I ' 0 5 10 15 20 25 30
Time (days)
i 3!
Time (days)
3
5
71x
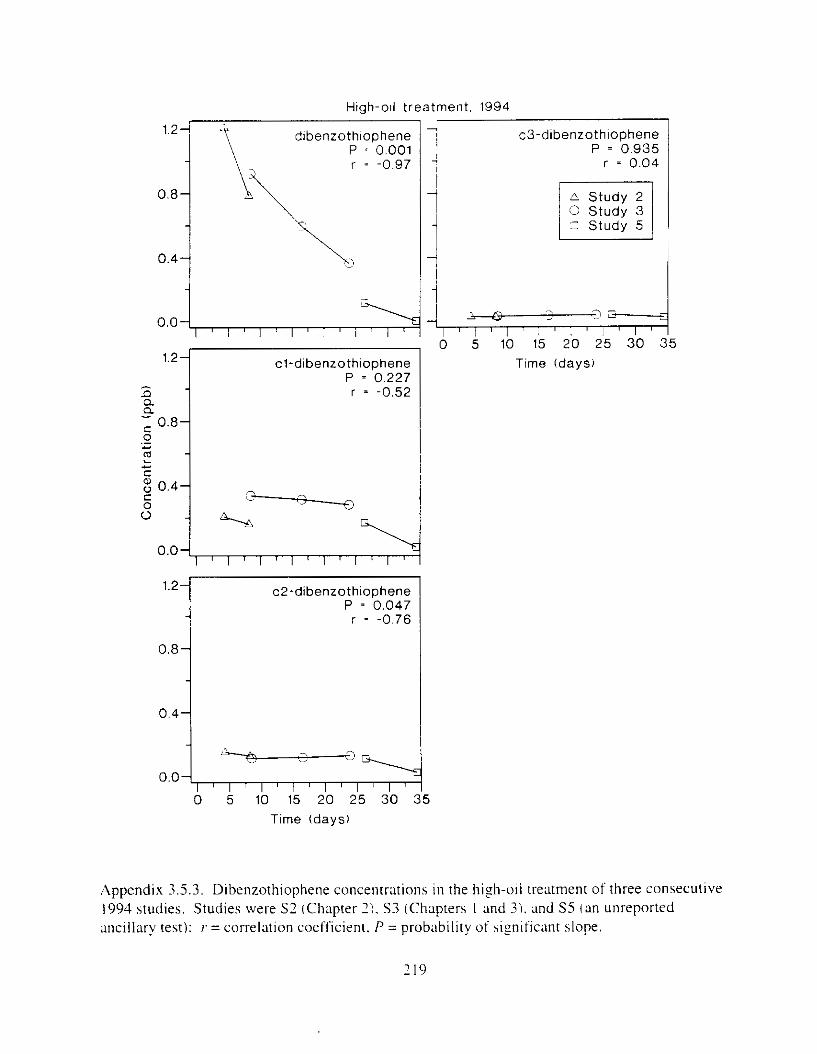
High-all treatment, 1994
1.2 dibenzothiophene P 0.001 r = -0.97
0.8
1
1.2 cl-dibenzothiophene P = 0.227
I
.n Q a C 0
- r = -0.52
- 0.8-
m .- I - 1
0.4- 0 C
0 - '3 n
C
i Q %
0.0- 1 ' 1 ' 1 ' 1
1 .21 c2-dibenzothio~hene P = '0.047
r = -0.76
0.0
0 5 10 15 20 25 30 Time (days)
1 c3-dibenzothiophene P = 0.935
r = 0.04
0 Study 3 A Study 2
3 E+----.+
0 5 10 15 20 25 30 Time (days)
5
5
Appendix 3.5.3. Dibenzothiophene concentrations i n the hish-oil treatment of three consecutive 1994 studies. Studies were S? (Chapter 21. S3 (Chapters I and 3 ) . and S 5 (an unreported ancillary test): r = correlation coefficient. P = probability of siznlficant slope.
219
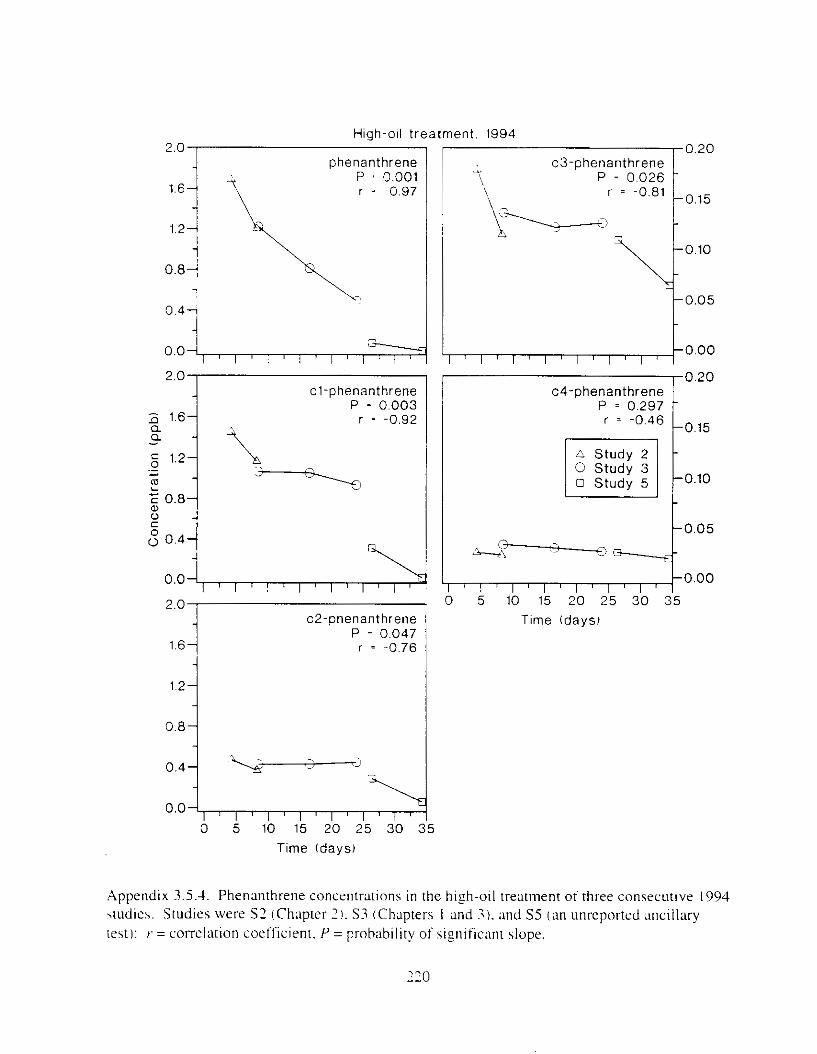
High-oil treatment. 1994
phenanthrene c3-phenanthrene
r = -0.97 r = -0.81
0.20
0.15
-\:)
0.10
0 0 .4
i \ 0.04 ,
I ' I ' I ' I ' I ' \
P = 0.047 1.6 r = -0.76
i 1.2-1
:::I1 ,;, , I l~
\ 0.0
0 5 10 15 20 25 30 : Time (days)
3
".L"
c4-phenanthrene P = 0.297 r = -0.46
o,15
0 Study 3 0 Study 2
-0.05 > J 9 Q----f-
-0.00 1 ' 1 ' 1 ' 1 ' 1 ' 1 ' 5 10 15 2 0 25 3 0 35
Time (days)
Appendix 3.5.4. Phenanthrene concentrations in the high-oil treatment of three consecutlve 1994 \rudies. Studies were SZ (Chapter 21. S 3 (Chaprers I and 3 ) . and S 5 ( an unreported ancillary test): r = correlation coefficient. P = probability of siylificant slope.
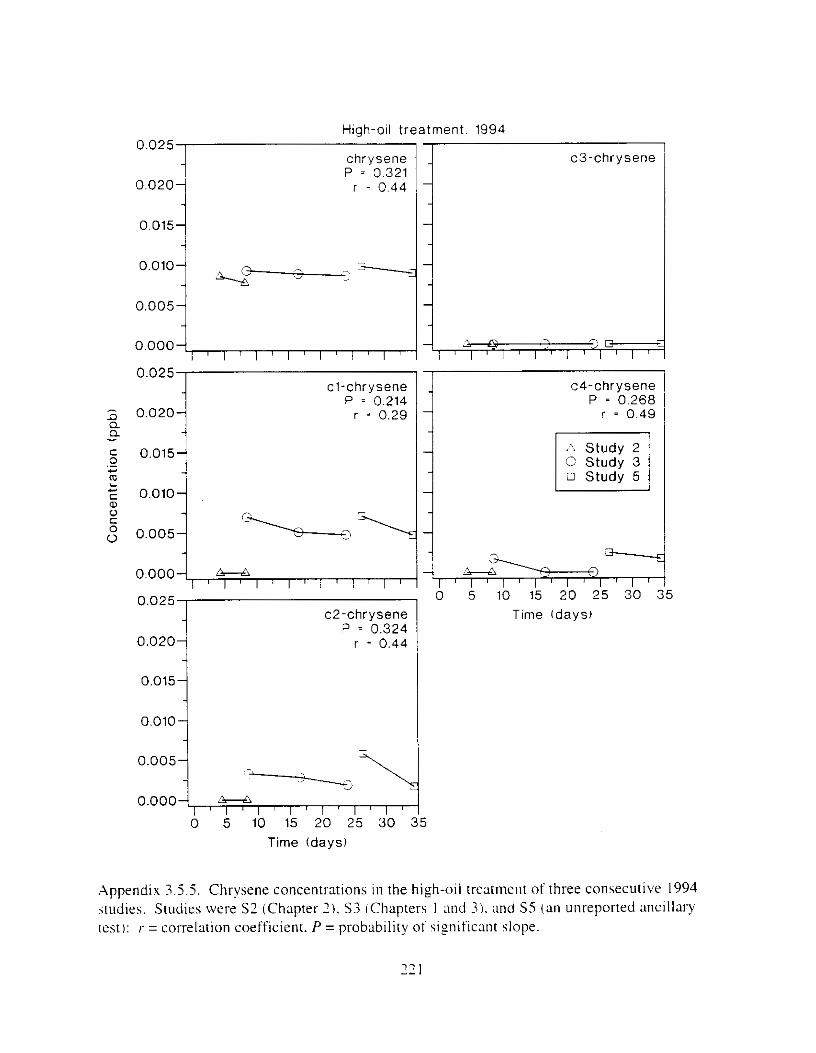
0.025 High-oil treatment. 1994
0.015
0.010 "
0.025 I
c4-chrysene P = 0.268
r = 0.49 0 0.020 a a -
cl-chrysene P = 0.214
0.025 c2-chrvsene
A Study 2 C Study 3 3 Study 5
0.000 n--n I ' I ~ I ' I ' I ' I ' I
1 0 5 10 15 20 25 30 :
0 . 0 2 0 4 P = b.324
r ~ 0.44
0.015
0.010
0.005
0.000
0 5 10 15 20 25 30 Time (days)
1 3 !
Time (days)
5
5
Appendix 3.5 .5 . Chrysene concentmtions in the high-oil treatment of three consecutive 1994 studies. Studies were S2 (Chapter 2 ) . S 3 (Chapters I and 3 ) . and SS (an unreported ancillary rest): I' = correlation coefficient. P = probability of significant slope.
7 2 I
.More alkanes were detected in treatment water and tissues than polynuclear aromatic hydrocarbons IPAHI. but were not emphasized i n this report becau\r PAH are more to\Ic Variability in the alkane data was proportionately much Frealer than in PAH h t a .
Appendix 4, I . I . Total alkane concrntr;ltion.s 111 w:wr. by experlment and treatment
Appendix 4.1.2. Concentrations of total alkanes i n expel-iments I and 2
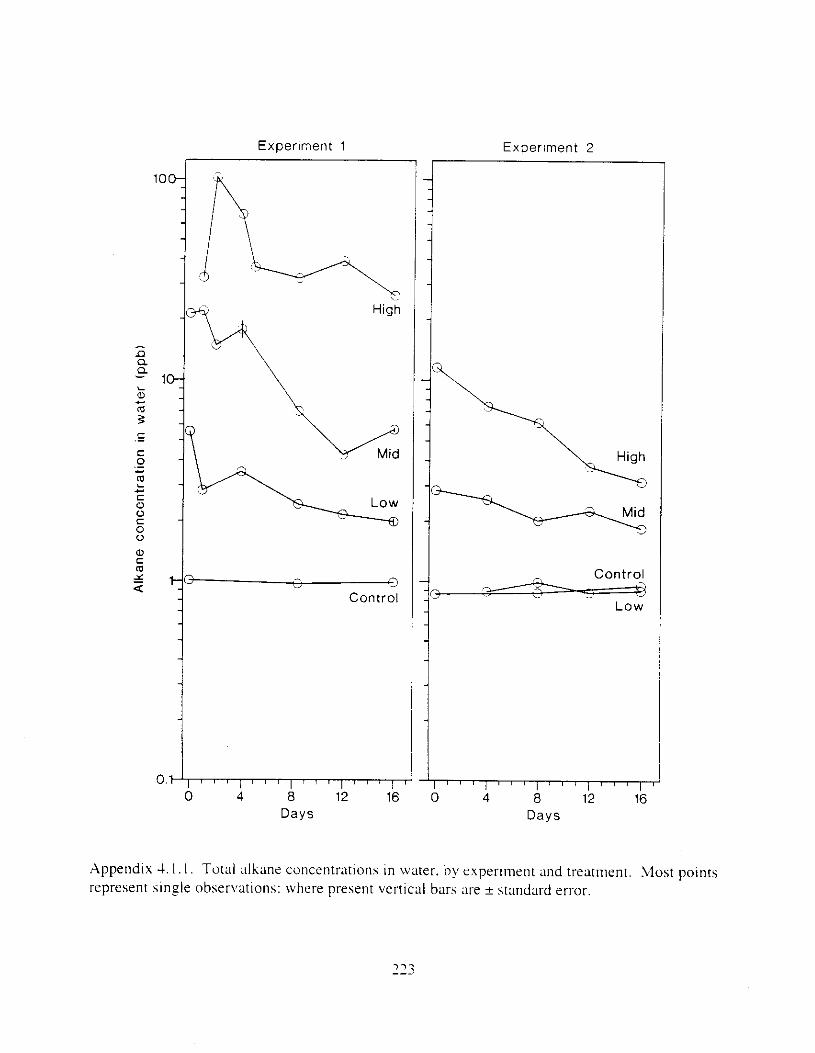
Experiment 1 I
0. 117 0 4 a 12 16
Days
Experiment 2
Control
L O W
- , I 3
J I , , , , , , , I , , , , , , , , 0 4 a 12 16
Days
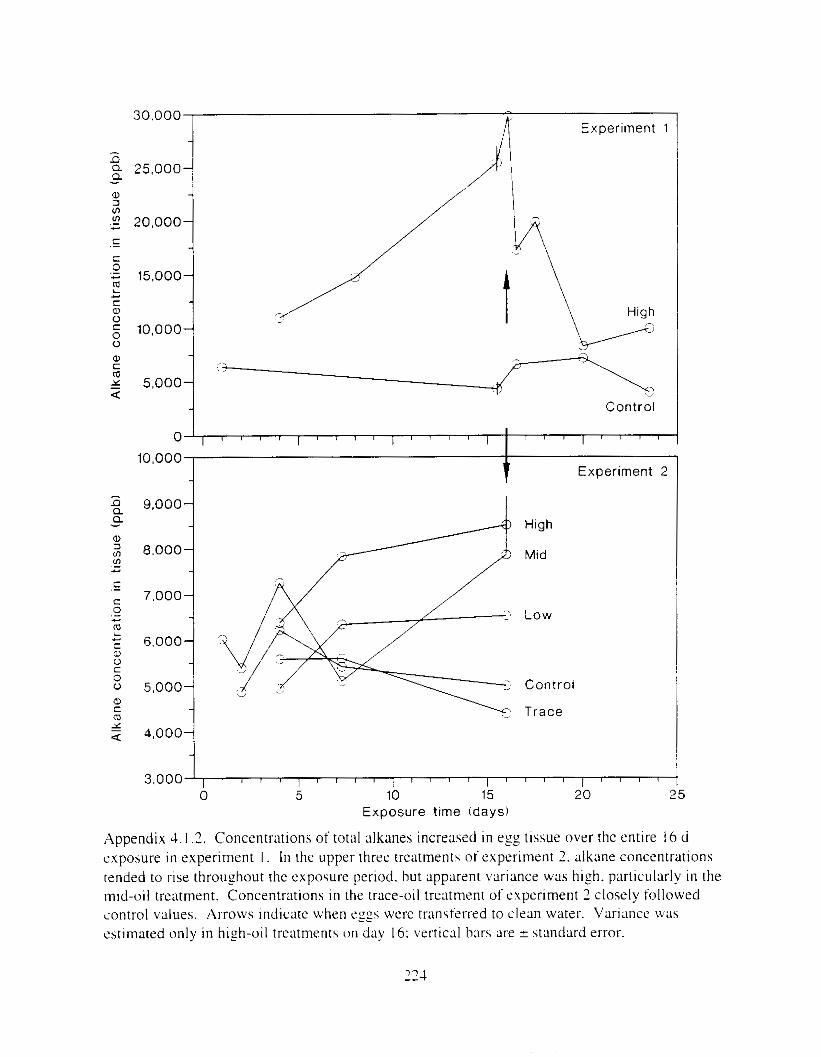
30,000 n Experiment 1
I
Appendix 4.I.7. Concentrations of total alkanes increased in egg tissue over the entire I 6 d exposure i n experiment I . I n the upper three treatments of experiment 2. alkane concentrations tended to r1se throushout the exposure period. but apparent Variance was high. particularly i n the mid-oil treatment. Concentrations i n the trace-oil treatment of experiment 2 closely followed control values. AI-rows Indicate when egzs were transterred to clean water. Variance was estlmated only i n high-oil treatments on day 16: vertical bars are *standard error.

Polynuclear aromatic hydrocarhon IP.-\HI cumposition data in water. by rreatlnent and experiment. Charncterlst1c time-dependent weatherin: patterns were evldent in m o s t treatments: percentazes o f lizhter compounds. parrtcularly naphthaleneh. decreased while p e r c e n t a p of heavier compounds. particularly phenanrhrenes. increased. Differential weatherin: acro\~\ treatments was also evident: i n particular. compare day 0 observations anany treatments i n experiment I . Abbreviations of chemical compounds are found i n Appendix 0.2.
Appendix 4.2.1, Composition of PAH i n trace-oil treatment water. experiment I ( 1995)
Appendix -1.2.2. Composition o f PAH i n low-011 treatment water. experiment I ( 19951
Appendix -1.2.3. Composition o f PAH i n mid-oil treatment water. experiment I i 1995)
.Appendix -1.2.4. Composltion of PAH i n hifh-oil II-earment wacer. experiment I I 1995).
.Appendix 4.2.5. Composition of PAH i n trm-oil treatment water. experiment 2 ( 1945)
'Appendix 4.2.6. Composition of PAH i n low-oil treatment water. experiment 2 (1995)
Appendix 4.2.7. Composition of PAH in mid-oil treatment water. experiment 2 (1995)
.Appendix 4.2.8. Composition of PAH i n hizh-oil treatment water. experiment 2 ( 1995)

Appendix 4.2.1 i l r r ri,yhf). Composition of PAH in trace-oil treatment water. experiment I ( 1995). Data for days 4 and 16 are means o f paired observations ? standard error. Percentages printed inside the graphs indicate total percentazes o f the followlnz homologous chemical groups (left to r i zh t ) : naphthalenes. tluorenes. dibenzothiophenrs. phenanthrenes. and chrysenes.
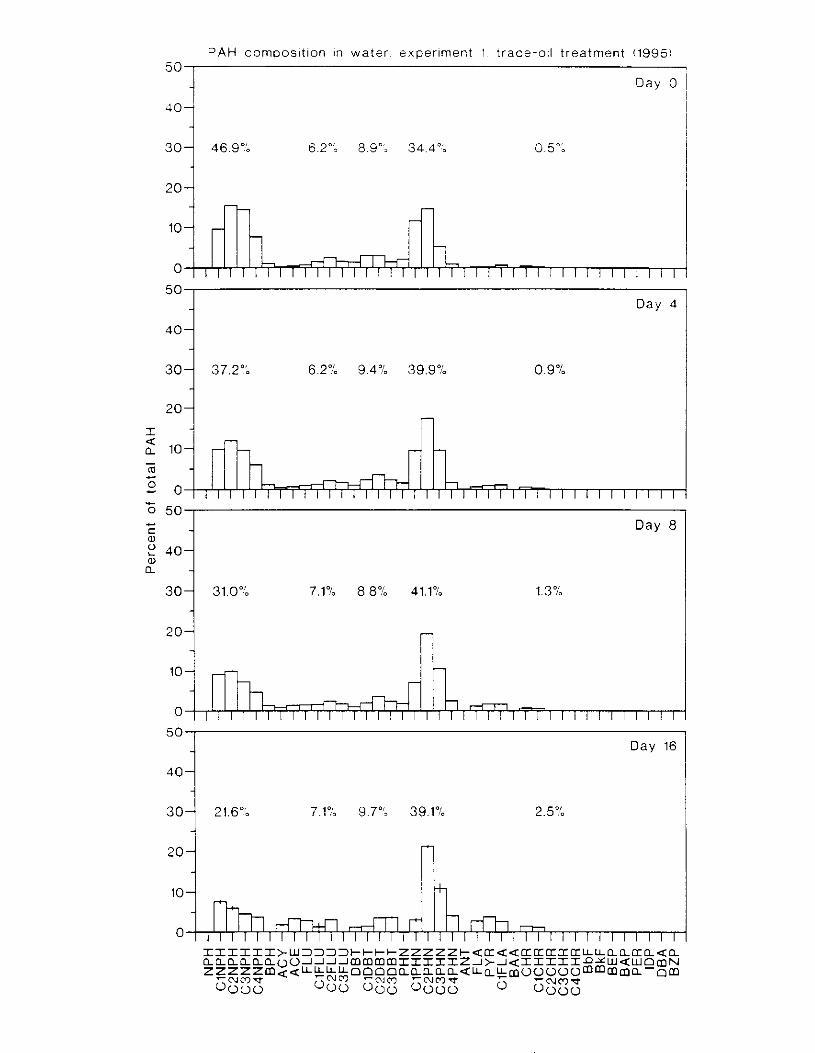
50 PAH cornposltion In water experlrnent 1 t race-ol l t reatment (19951
Day 0
3 0 1 46.9% 6.2"; 8.9": 34.4% 0.50:
20-
10-
0-
Day 4
6.2% 9.4% 39.9% 0.9%
20
301 31.0"b 7.1% 8.8% 41.1% 1.3%
2oj n 104 4 l h
50 - Day 16
40-
30- 21.6"b 7.1% 9.7": 39.1% 2.5% 1

Appendix 4.2.2 f ( r t , - i ,yhti . Composltlon of PAH i n low-oil t!-earment water. experiment I ( 1995,. Data for days 4 and 16 are means of paired observations ? htandard error. Percentases printed inside the yraphs indicate total percentages of the following homolosous chemical groups (left to right): naphthalenes. tluorenes. dibenzothiophenes. phenanthrenes. and chrysenes.
228
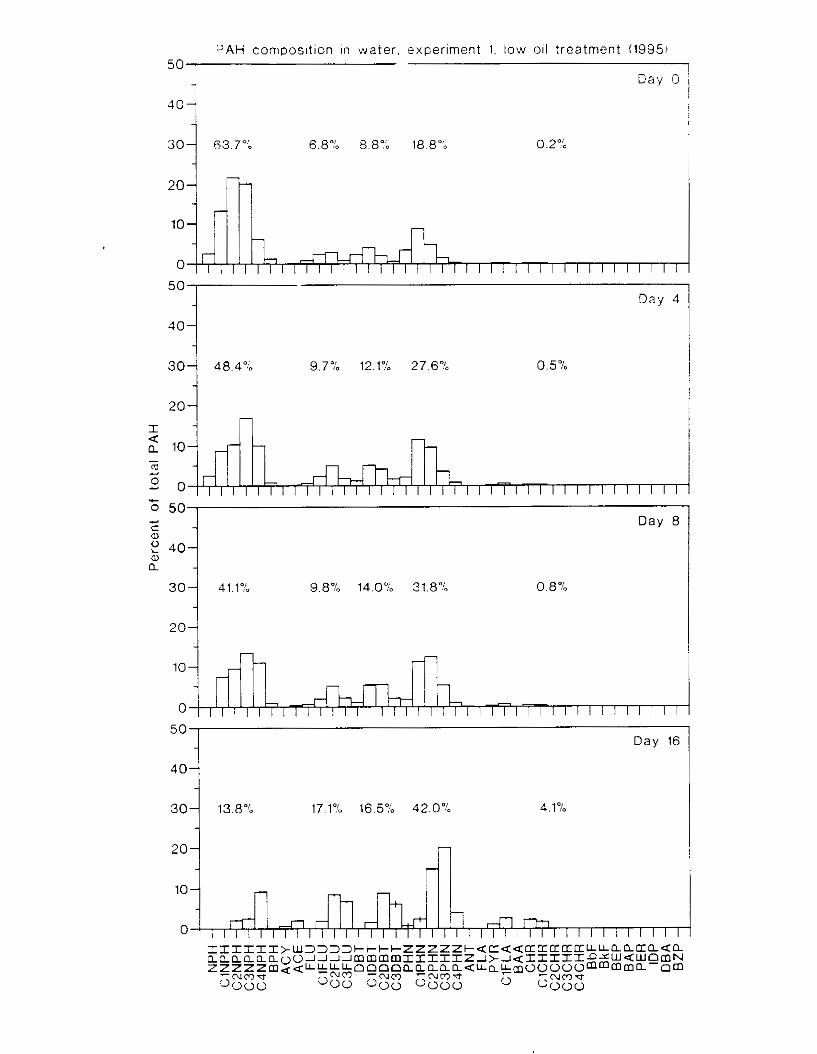
50r Day 4
1
50 +- C a,
- Day 0
? 40- a a,
30- 41.19'- 9.8% 14.0% 31.896 0.8 */- -
20-
.Appendix 4.2.3 ((If r i y h t ) . Composition of PAH i n mid-oil treatment water. experiment I (1995). Data for day I6 are means of paired observations k standard error. Percentages printed inside the sraphs indicate total percentages o f the tollowing homologous chernrcal groups (left t o right): naphthalenes, tluorenes. dibenzothiophenes. phenanthrenes. and chrysenes.
229
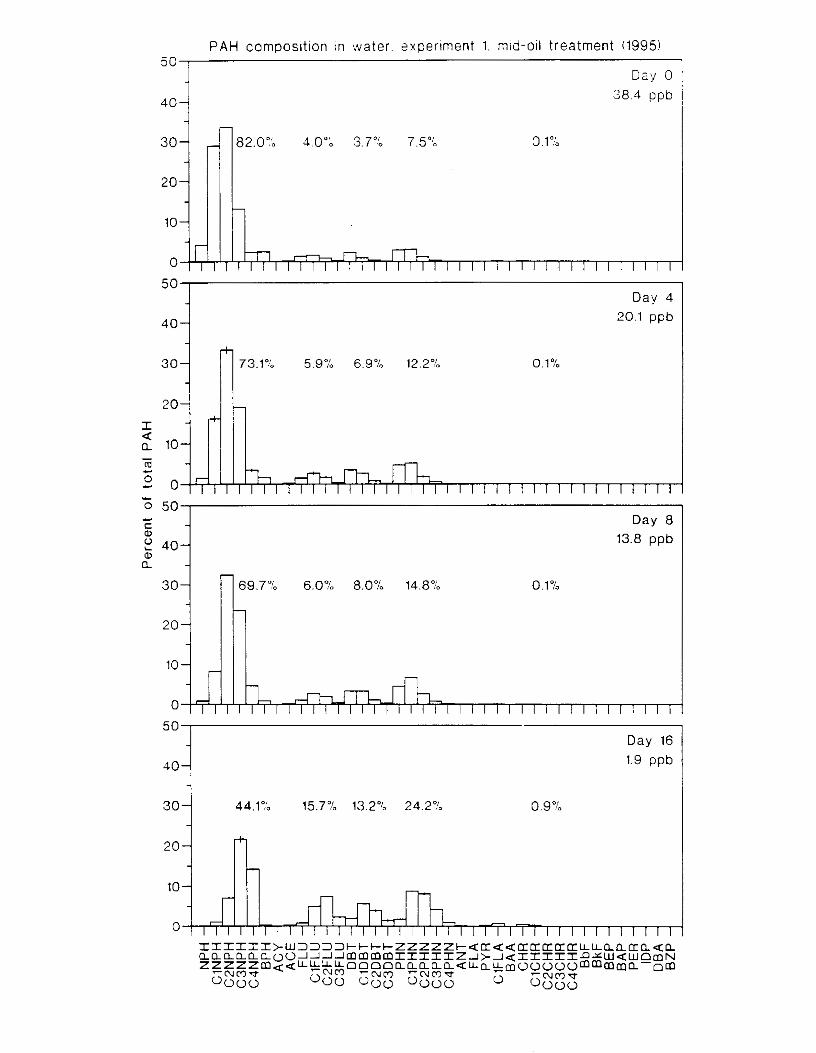
50 PAH composltlon In water. sxperlment 1. mid-oil treatment (1995)
D a y 0 38.4 ppb
40-
- 30- - 82.09', 4 0": 3.7": 7.5% 0.19:
- 20-
- - 10-
-
50 Day 4
20.1 ppb 4 0 1
30 73.1% 5.9% 6.9% 12.2% 0.1 %
20 1 it
d"4 40
44.1% 15.7% 13.2% 24.2%
20
Day 16 1.9 ppb
0.9%

Appendix 1 . 2 . 1 ( c l r J . I , ~ / I ~ ) . Composition o f PAH i n high-oil treatment water. experiment I ( 19951. Percentages printed inside the yaphs indicate total percentages of the followins homologous chemical g o u p s (left to risht): naphthalenes. tluorenes. dibenzothiophenes. phenanthrenes. and chrysenrs.
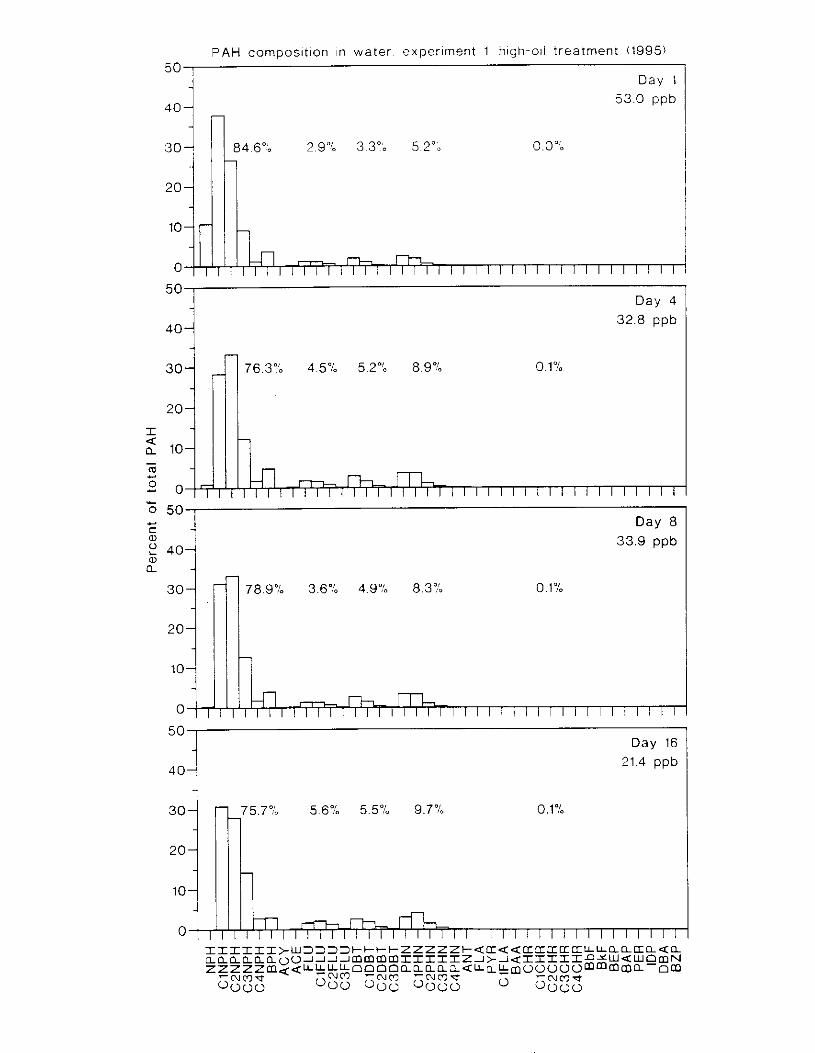
O.0"b
0.1 %

Appendix 4.2.5 ( ( { I t - i , y / ! f ) . Composition of PAH in trace-oil treatment water. experiment 2 I 1995). P e r c e n t a p printed inside the p p h s indicate total percentages of the followins homolosous chemical sroups (left to nght): naphthalenes. lluorenes. dibenzothiophenes. phenanthrenes. and chrysenes.
.
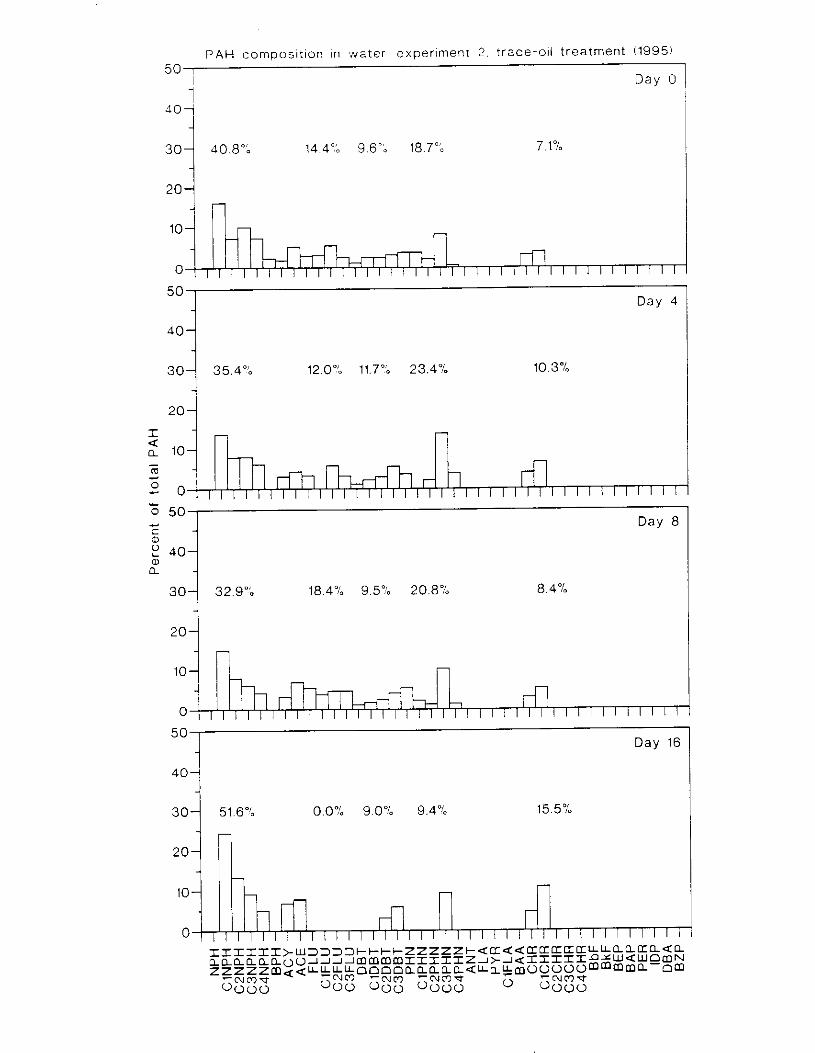
7 . 1 % 30- 40.8% 14.44, 3.6"; 18.7"b .
20- - -
12.0"b 11.7% 23.4% 10.3%
20 4
10-
I I l l l l l I l l l l l l l 1 l r
5 0 Day 16
4 0
0.096 9.0% 9.4% 15.5%

Appendix 4.2.6 ( r l r t - i , y / z f ) . Composition of PAH i n low-oil treatment water. experiment 7 ( 1995). Percentases printed inside the graphs indicate total percentaxes of the following homologous chemical Zroups (left to right): naphthalenes. Iluorenrs. dlhenzothiophenes. phenmrhrenes. ond chrysenes.
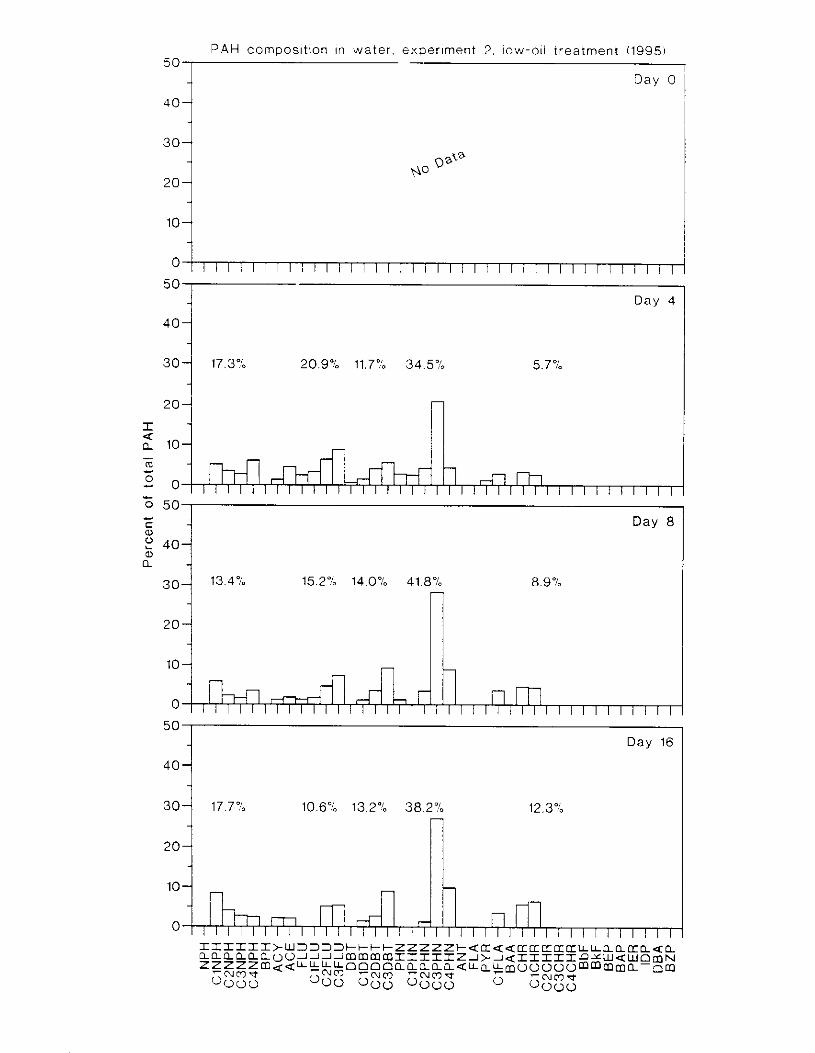
PAH composition In water. exper lment 2. !ow-011 treatment il995,
Day 0
20
10
Day 4
20.9% 11.79b 34.5% 5.7 4b
50 I
C a,
a,
Day 8
2 40- n -
30- 13.4% 15.2% 14.0% 41.8% m
8.9%
-- -I Day 16
10.6% 13.2% 38.296 -
20$
12.3"L

Appendix 4.7.7 fc l r ri,qhr). Composition o f PAH i n mid-oil treatment water. experiment 2 (1995). Percentages printed inside the sraphs indicate total percentages of the following homologous chemical youps ( left to r i zh t l : naphthalenes. fluorenes. dibenzothiophenes. phenanthrenes. and chrysenes.
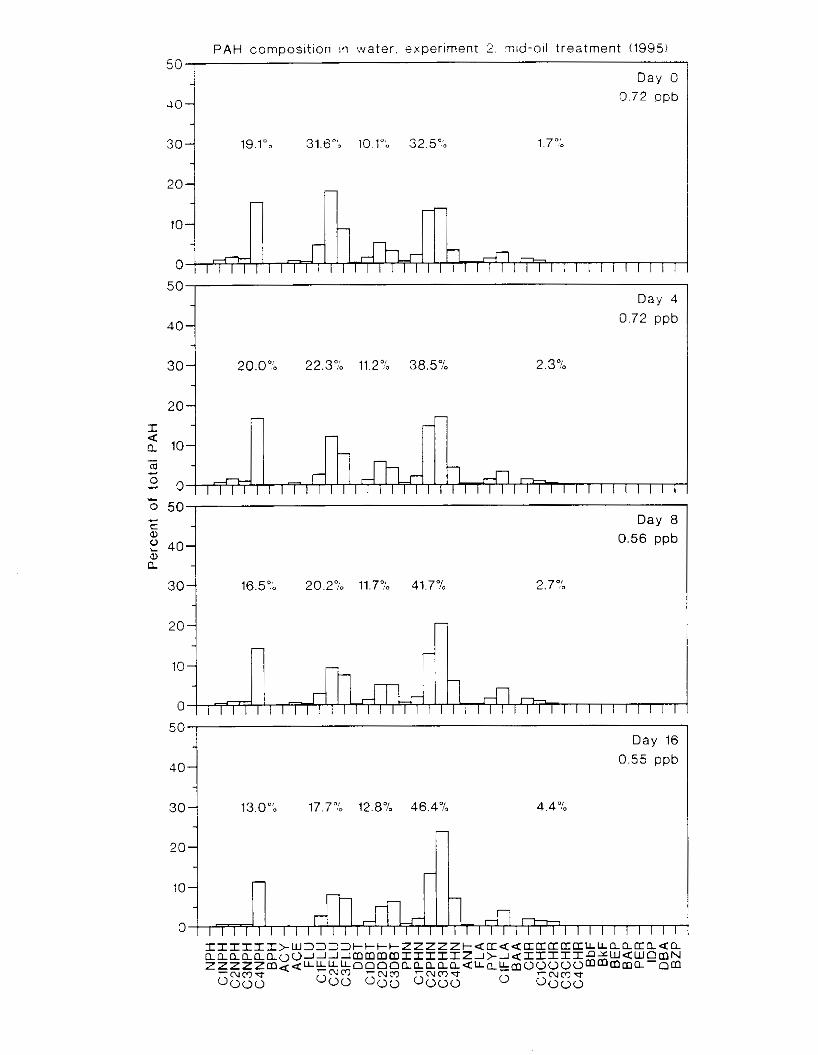
50 , PAH composi t ion !n ,water. experlment 2. mid-011 treatment (1995)
Day 0 0.72 Dpb
1
5 50 c c a,
Day 8 0.56 ppb ? 40-
a - a,
30- 16.59, 20.2% 11.7% 41.7% 2.7";
20- - -
10-
0 I , , , 1 , , , 1 ~ 1 1 ~ 1 ~ 1 1 1 1 1 1 1 1 1 1 1 1 50
Day 16 0.55 ppb
- 40-
30- 1 3 . 0 " b 17.7'k 12.8% 46.4% 4 .4 7" - -
20- -
i

Appendix 4.2.8 f o r ~ - I , ~ / I T J . Composi~ion of PAH i n high-oil treatment water. experiment 2 i 1995). Percentages printed inside the Sruphs indicate total percentages of the following homologous chemical groups ileft to r15ht) : naphthalenes. fluorenes. dibenzothiophenes. phenanthrenes. and chrysenes.
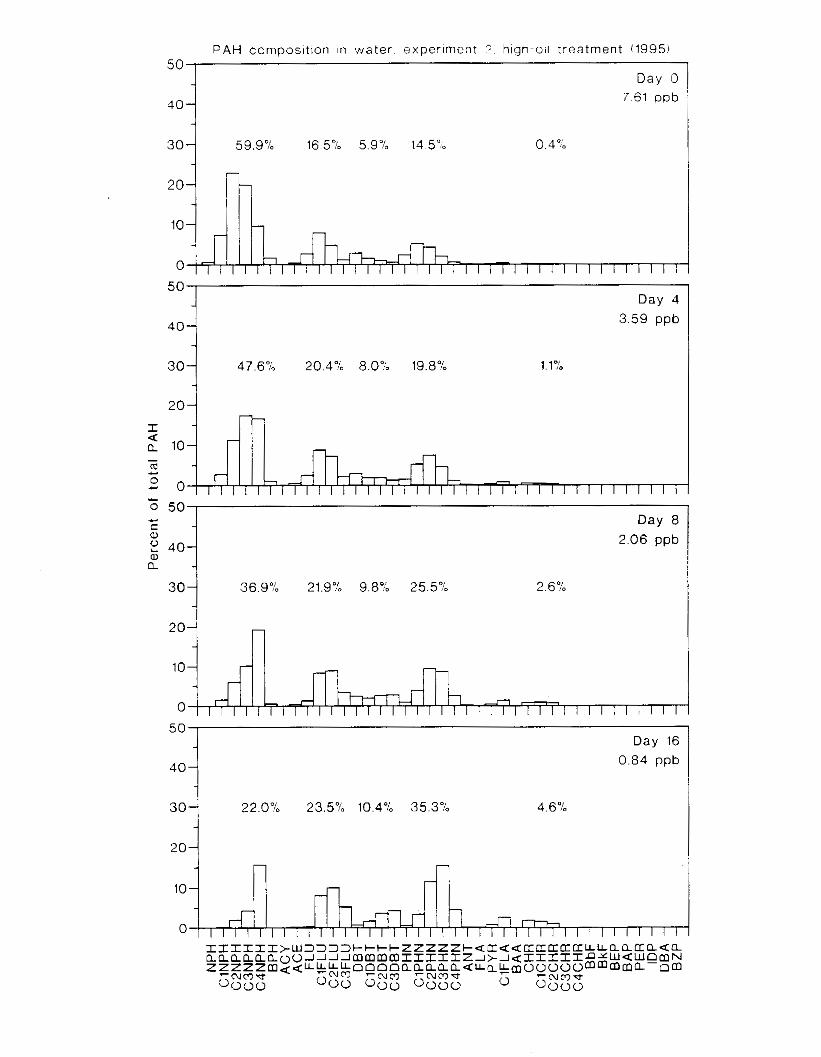

9c i
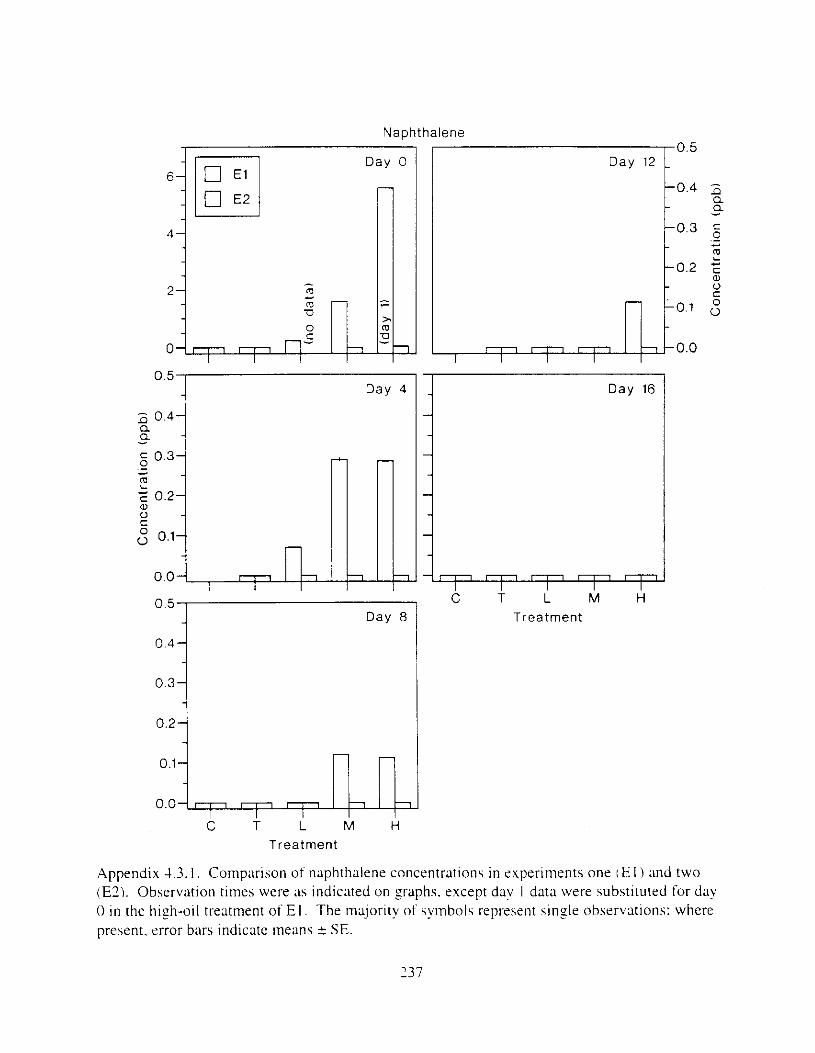
Naohthalene
0.4
0.3
0 a, C 0 0 0.1
0.0
Day 4
r I I 0.5
Day 8
0 . 4 1
0.0 O . ’ U C T L M H
Treatment
Appendix 4.3. I . Comparison of naphthalene concentrations in experiments one iE I i and two (E?). Observation times were ;IS indicated on p p h s . except dav I data were substituted for day 0 i n the hish-oil treatment of E l . The majority of symbols represent single observations: where present. error bars indicate means 2 SE.
237
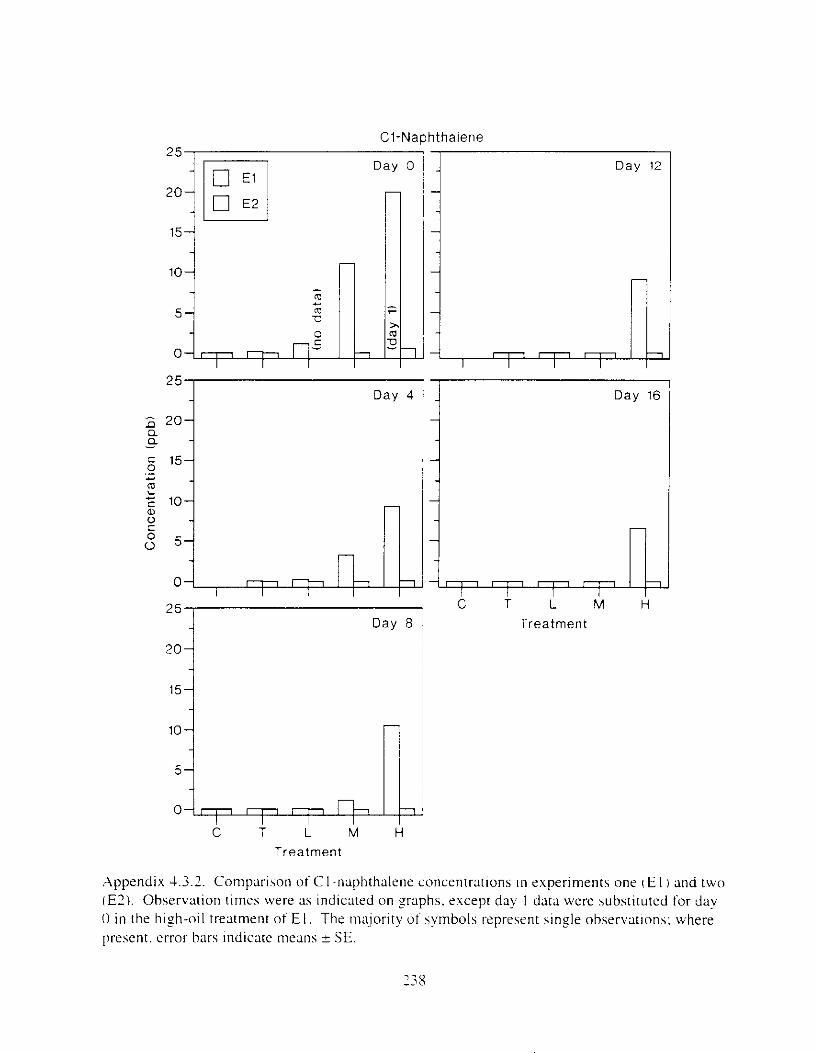
Treatment
.Appendix 4.3.2. Comparison of CI-naphthalene concentrations 111 experiments one t E I and two iE2). Observation times were ;IS indicated on p p h s . except day I data were substituted for day 0 in the high-oil treatment of E I . The majority of symbols represent s i n ~ l e observations: where present. error bars Indicate means i- SE.
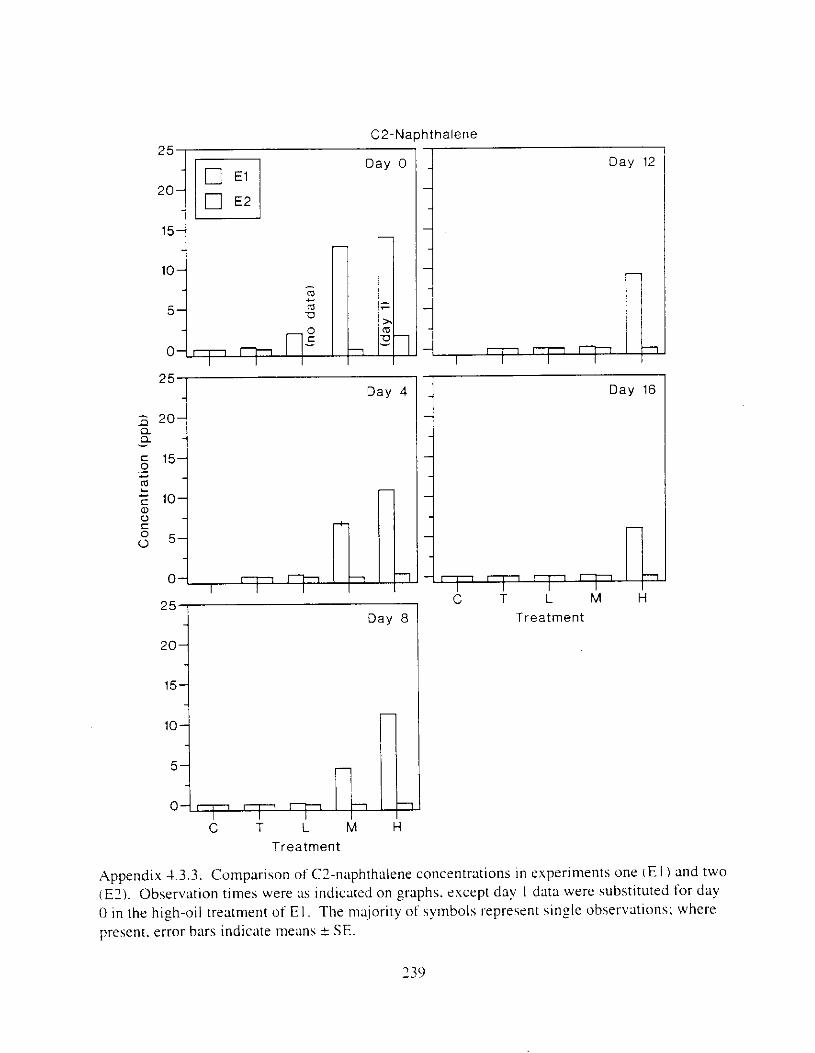
hthalene
i Day 12
25r 2 0
Treatment
Appendix 4.3.3. Comparison of C?-naphthalene cor Ice mtratior
Treatment
239
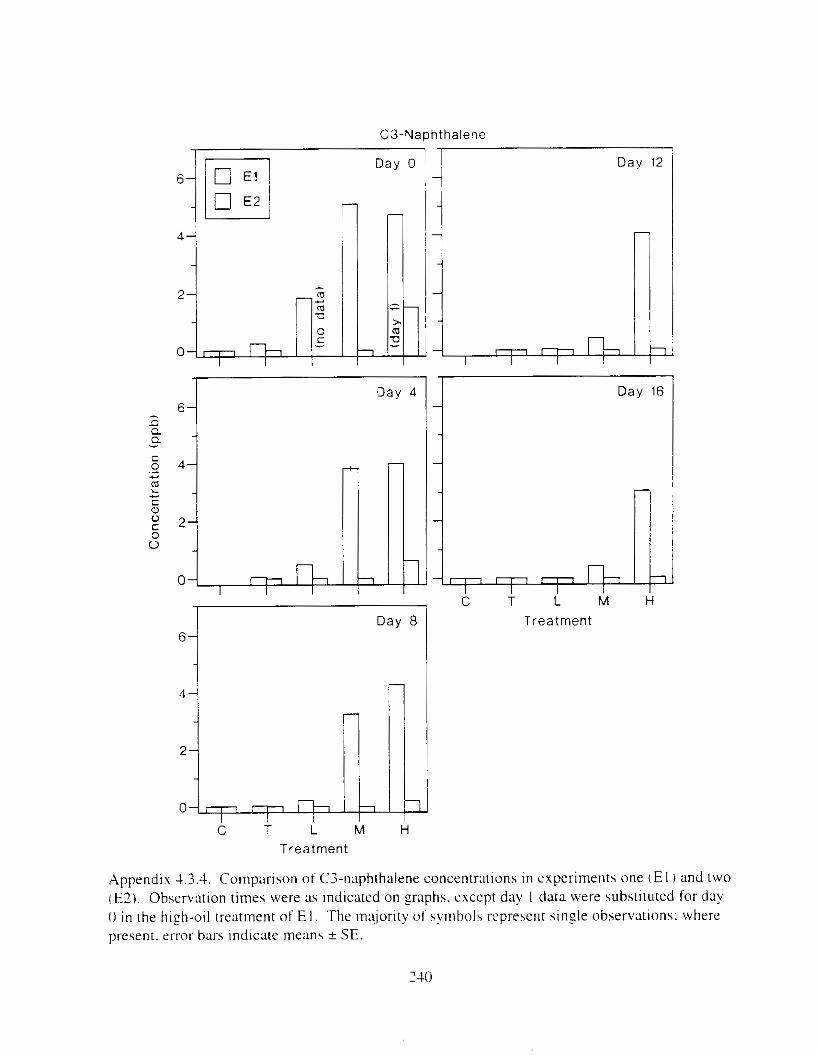
6 -I
6 1
I Day 16 1
Treatment
c T L M H Treatment
Appendix -1.3.4. Comparison of C3-naphthalene concentrations in experiments one ( E l 1 and two (E?). Observation times were as Indicated on graphs. except day I data were substituted for day 0 i n the hizh-oil treatment of E l . The majority of symbols represent sinTle observations: where present. error bars indicate means f SE.
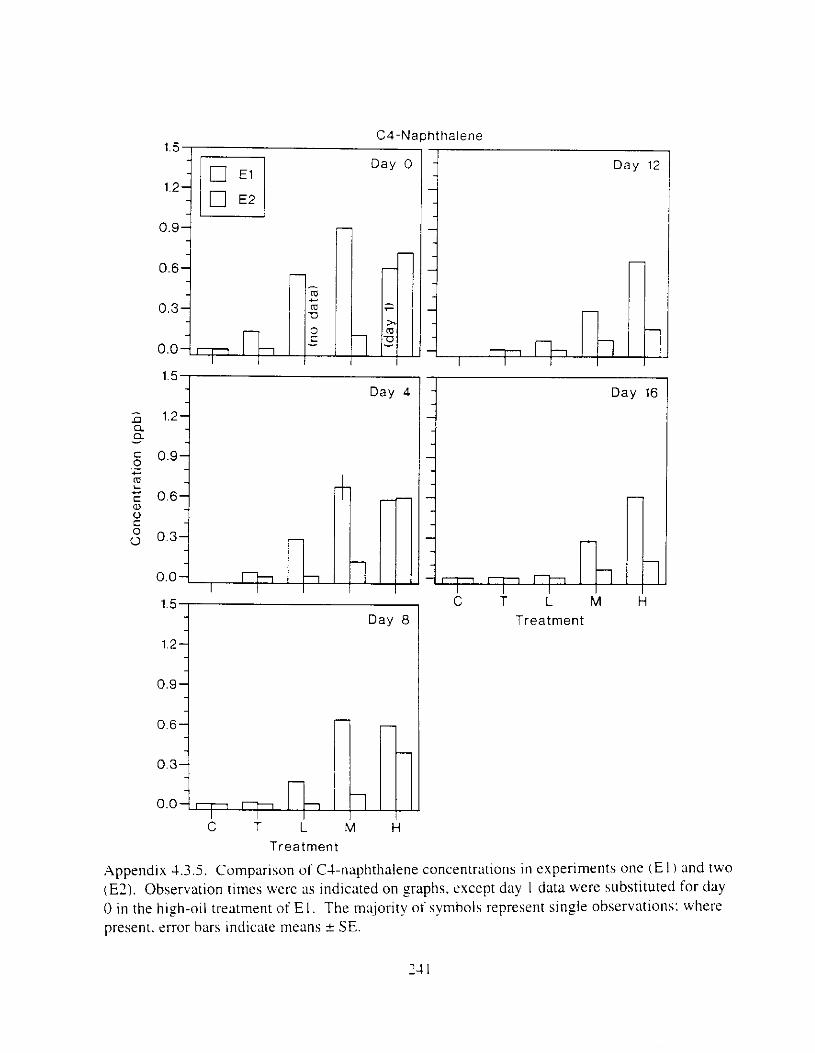
C4-Naphthalene 1.5
1.2
0.3
0.0
- R l.2j a a -
0.6 O.gl 0.0 0 ' 3 L - - + L
i L-m Day 4
1 1.5 I l.2j Day a
1
Day 12
1 Jr 1
I Day 16
Treatment
0.3
0.0 l?4ub C T Treatment L M H
Appendix 4.3.5, Comparison of C4-naphthalene concentrations i n experiments one ( E l ) and two (E?). Observation rimes were as indicated on graphs, except day I data were substituted for day 0 in the high-oil treatment of E I . The majority of symbols represent single observations: where present. error hars indicate means ? SE.
24 I
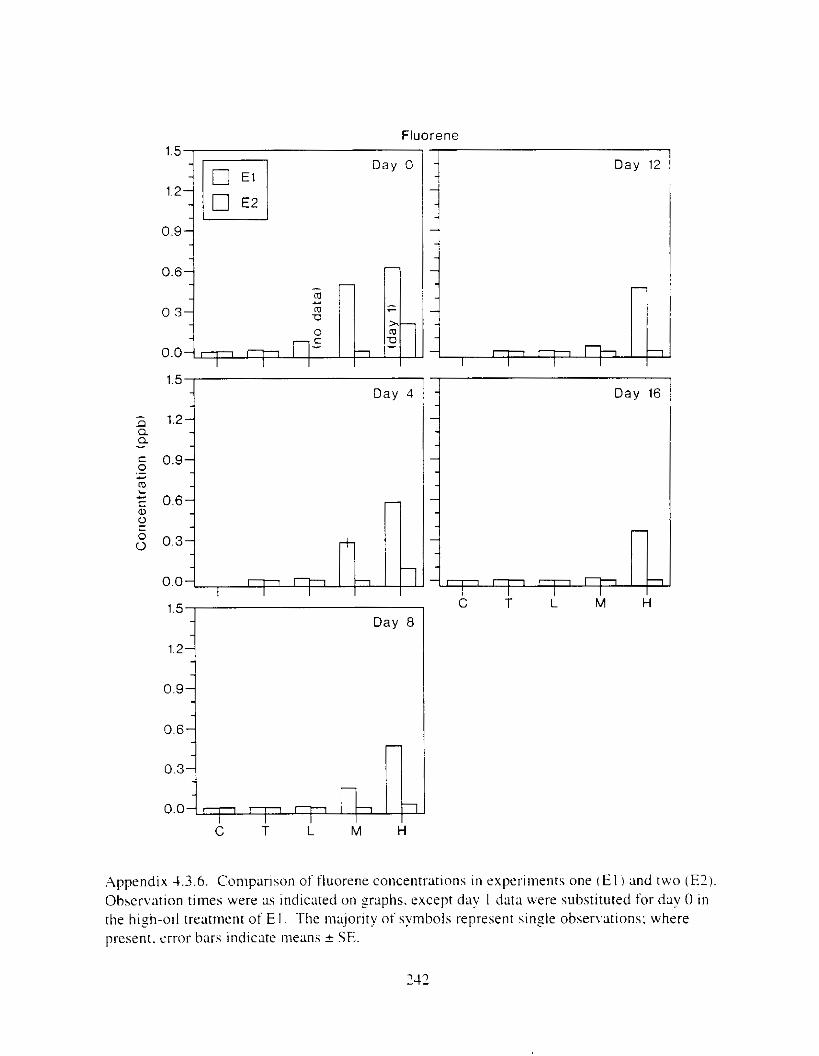
Fluorene
1 ' IC.
Day 0
0.9
0.3
n
1.5 Day 4
1 4
I 1'5r 1.2
0.6
1
i D a y 12 L Dav 16
C T L M H
,Appendix -1.3.6. Comparlson of fluorene concentranons i n experiments one ( E l and two (E21 Observation times were as indicated o n graphs. except day I data were substituted for day 0 i n the hish-oil treatment of E I . The !majority of symbols represent .;inzle observations: where present. error bars indicate means 2 SE.
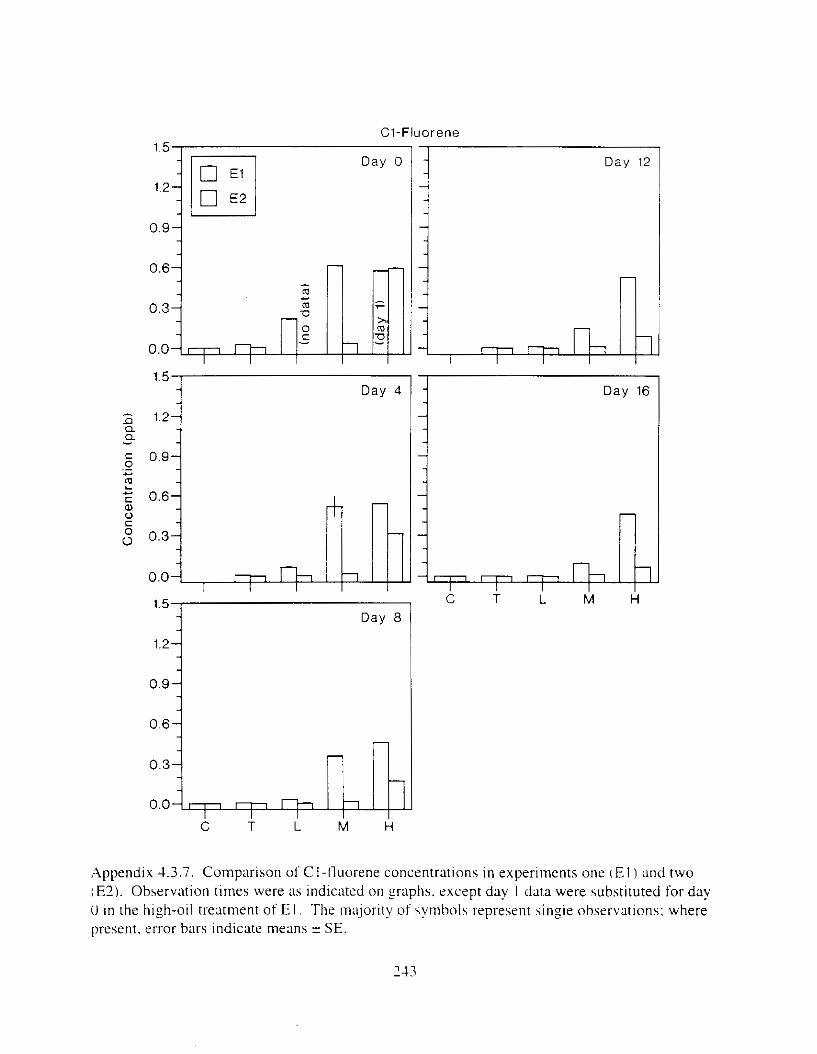
C1-Fluorene 1 1'5r 1.2
0.3
C 0.0
1.5 Day 4
Day a
0.9
0.6
1
Dav 12
Day 16
C T L M H
Appendix 4.3.7. Comparison of Cl-tluorene concentrations in experiments one I E I ) and two I E ~ ) . Observation times were as indicated on Sraphs. except day I data were substituted for day 0 in the high-oil treatment of E l . The lnajority of symbols represent sinsle observations: where present. error bars indicate means k SE.

C2-Fluorene
j 5 r 1.2
0.3$ - 0.64
1 . 5 1 Dav 4
0.0 L-F-4 1.5
Day a
Day 16
0.3- - 0.01 1 r - r l m n-
C T L M H
- -
1 r - I - l - 1 I I C T L M H
Appendix 4.3.8. Comparison of C?-fluorene concentrations in experiments one ( E l ) and two ( E ? ) . Observation times were as indicated on graphs. except day I data were substituted for day 0 i n the high-oll treatment of E l , The malority o f symbols represent single observations: where present. error bars indicate means ? SE.
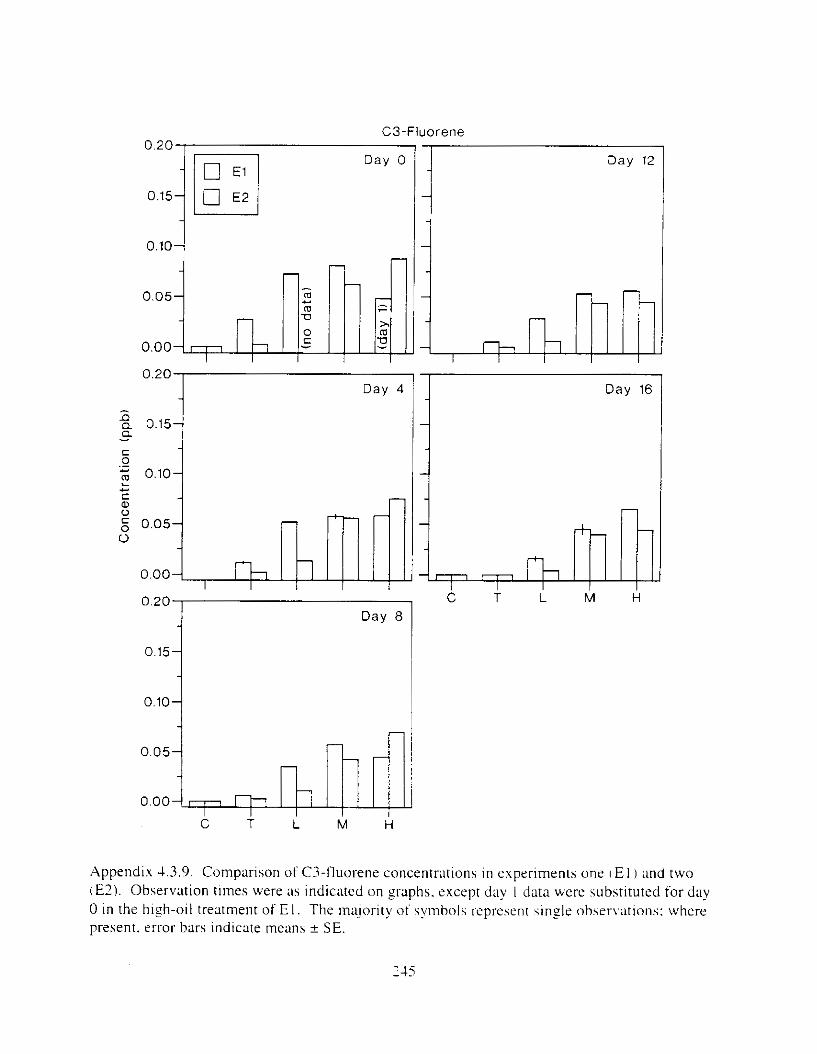
0.20 C3-Fluorene
Day 0 1 Day 12 I
-I Day 4 - D a 0.15 a -
o ' 2 0 r - - - - - - 0.15
0.10 -1
1 -I Day 16
0.00 0 . 0 5 L - 4 & D . t 1 C T L M H
C T L M H
Appendix 4.3.9. Comparison of C3-fluorene concentrxions i n experiments one [ E l 1 and two (E?). Observation tlmes were as indicated on graphs. except day I data were substituted for day 0 i n the hizh-oil treatment of E I . The majority of symbols [represent sinsle observations: where present. error bars indicate means t SE.
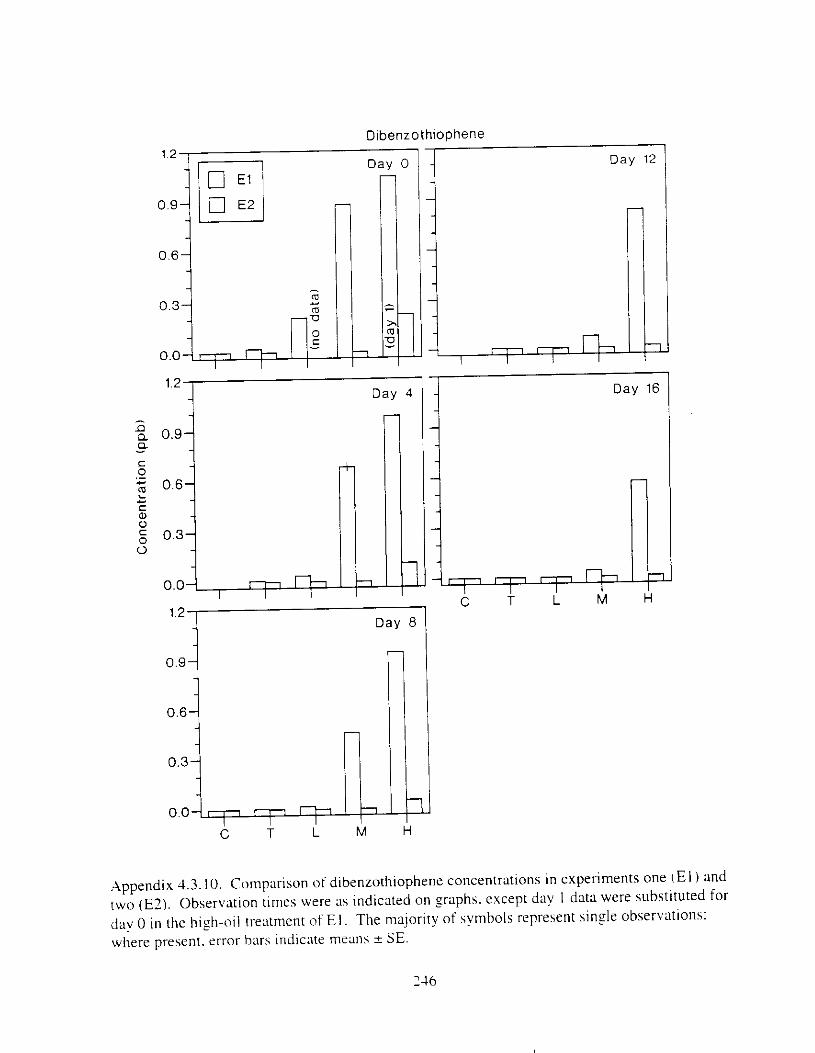
1 . 2 7
0.04+++ I Day 4
1.2 Day a
0.94 n
O . ; I _ 0.3 0.0 C T L
1 Dav 16
o,6m 0.3 0.0 C T L M H I' M H
1__1 C T L M H
Appendix 4.3.10. Comparison of dibenzothiophene concentrations in experiments one ( E l ) and two (E?). Observation times were as indicated on graphs. except day I data were substituted for day 0 i n the high-oil treatment of El . The majority of symbols represent single observations: where present. error hars indicate means f SE.
116
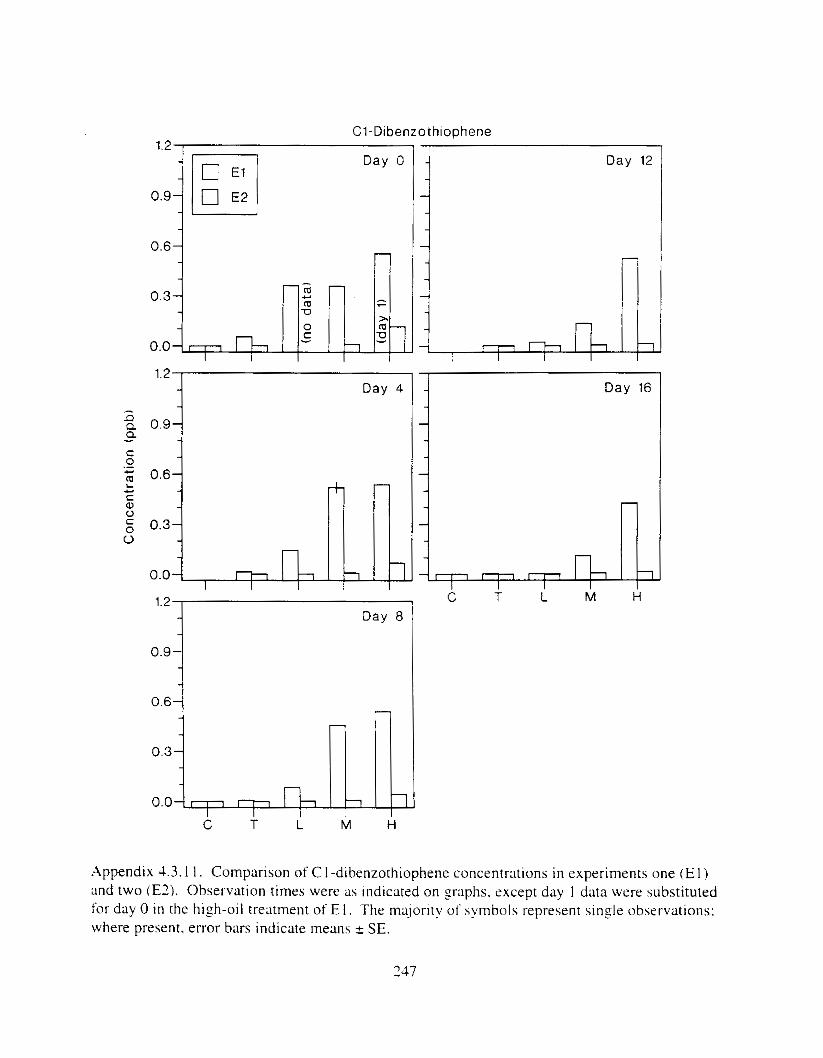
C1-Dibenzothlophene 1.2
Day 12
0.9 -
0.6 - -
0.3
0.0 - mTh I I
1
1 3 .
c i i M H
Appendix 4.3. I 1 . Comparison of C I -dibenzothiophene concentrations in experiments one (E I ) and two (El ) . Observation times were as Indicated on p p h s . except day I data were substituted for day 0 i n the hi&oil treatment of E I . The majority of hymbois represent single observations: where present. error bars indicate means 2 SE.
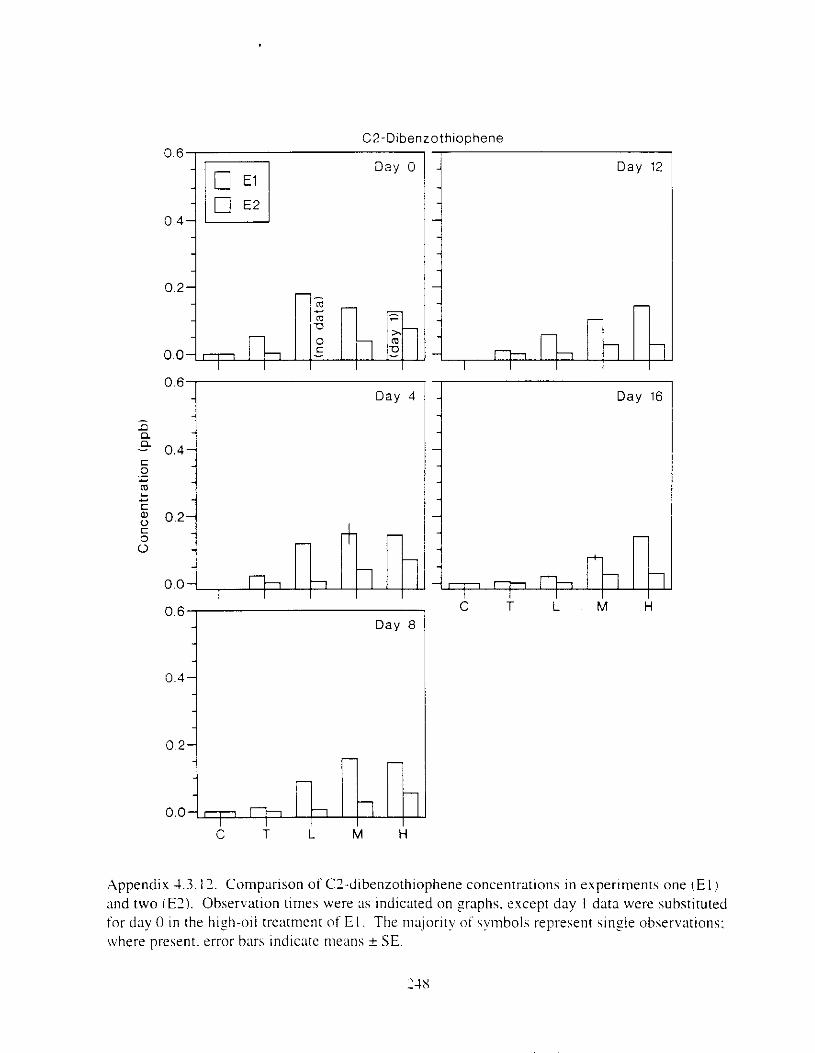
o'6r 0.4
0.2 i 0.0 m C T L M H L
Appendix 4.3.12. comparison of C2-dibenzothiophene concentt-ations in experiments one ( E l ) and two ( E l ) . Observation times were as indicated on yraphs. except day 1 data were substituted for day 0 i n the hizh-oil treatment of E I . The majority o f symbols represent sinyle observations: where present. error bars indicate nieans + SE.
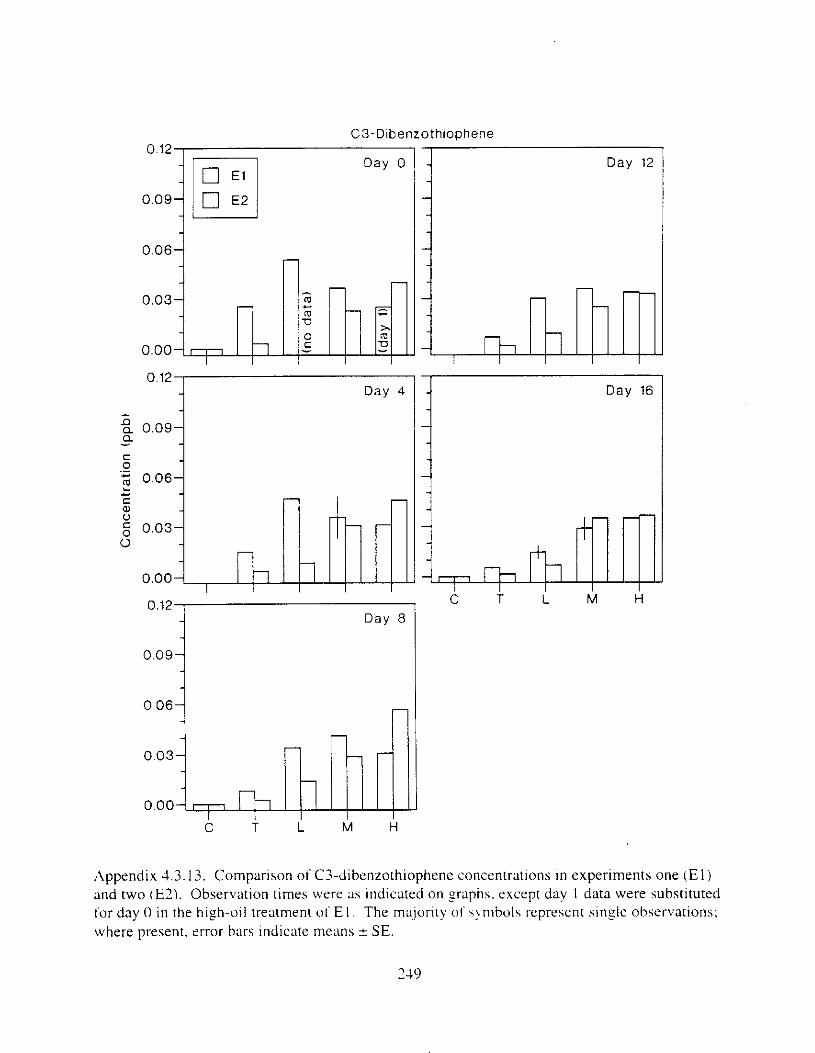
C3-Dibenzothiophene
v. I L I Day 4
- n a 0.09 a -
0.12 Day a
Day 12
Day 16
Appendix 4.3.13. Comparison of C3-dibenzothiophene concentrations in experiments one ( E l ) and two (E?). Observation times were as indicated on sraphs. except day I data were substituted for day 0 in the high-oil treatment o f E I . The majority of symbols [represent sinsie observations: where present. error bars indicate means 2 SE.
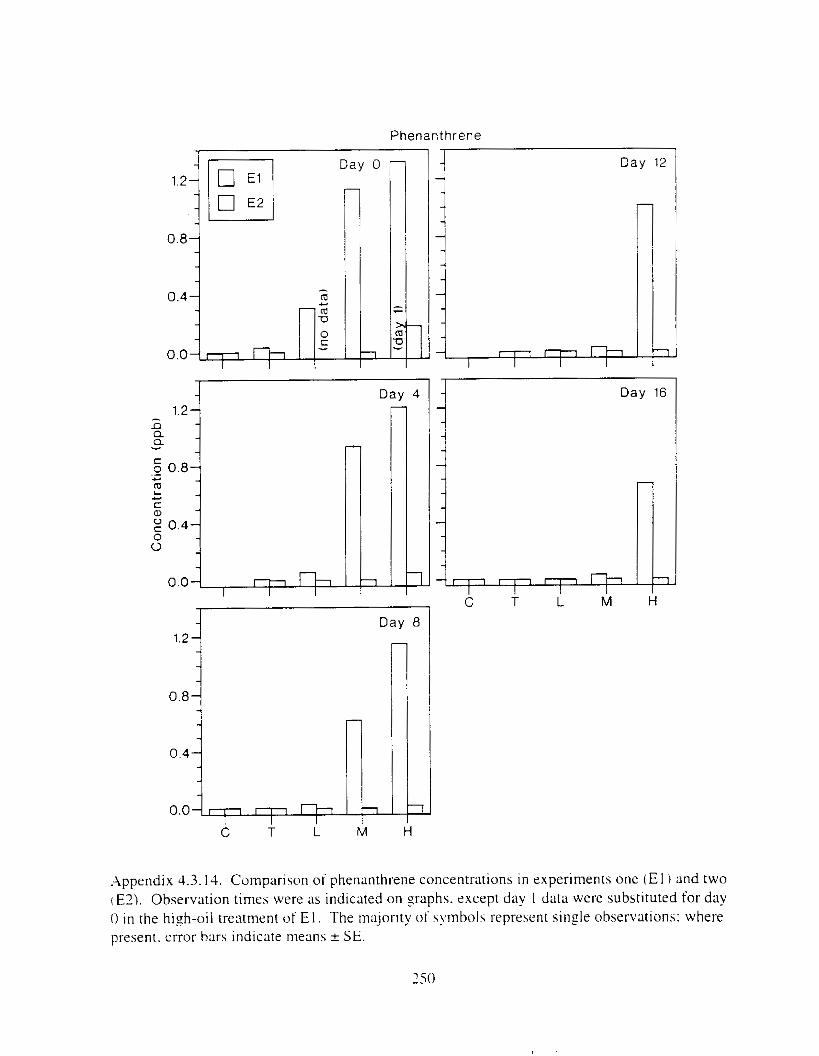
Phenanthrene
0.0 0'4h - C
r 1 Day 12
i 1
:-I 0.4 0.0 C T L
Day 8
1 d M H
E l ) L md tw 0 Appendix 4.3.14. Comparison of phenanthrene concentrations i n experiments one ( (€2). Observation times were as indicated on Zraphs. except day I data were substituted for day 0 in the hish-oil treatment of E I . The majority of symbols represent single observations: where present. error bars indicate means -t SE.
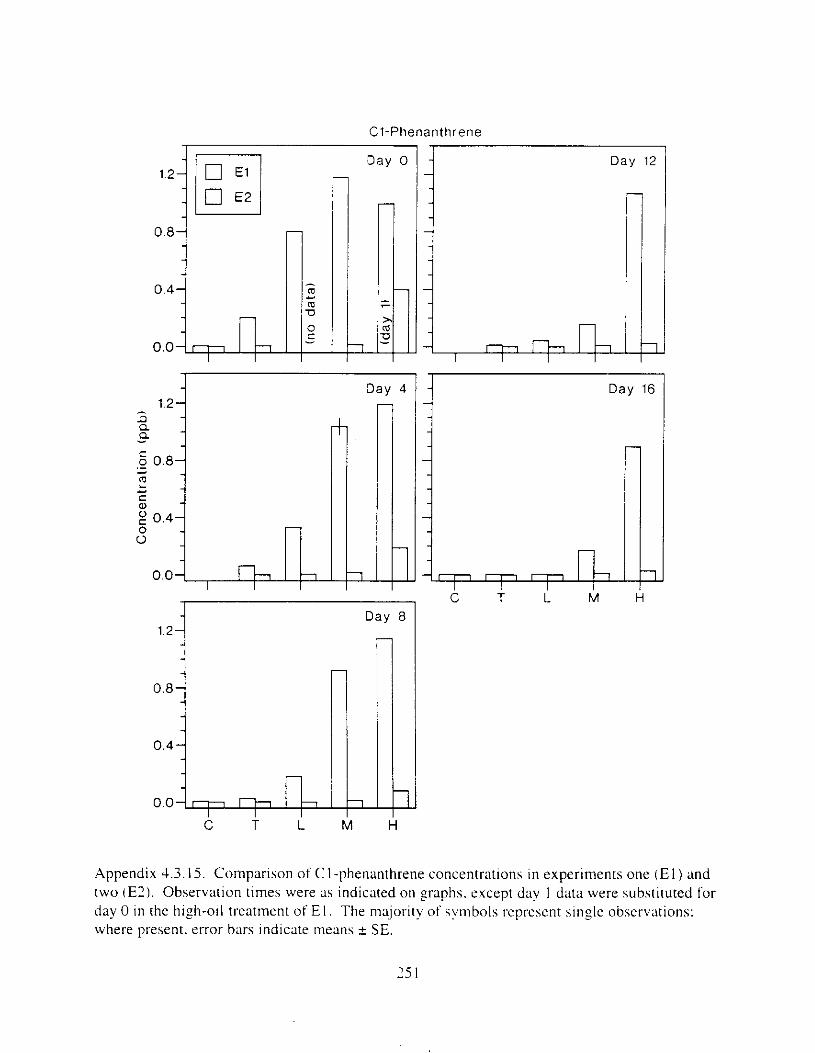
C1-Phenanthrene
Day 0
,, 1
Day 4 I 1 . 2 4
1
Day a
n - Day a
1.2- - -
0.8-
0.4-
0.0- rn rll 1 I
C T L M H
1
c T i M H
i D a y 12
-I Day 16
m m - 1 I C T L M
1
Appendix 4.3.15. Comparison of CI-phenanthrene concentrations in experiments one ( E l ) and two (E?) . Observation times were as indicated on graphs. except day I data were substituted for day 0 i n the high-oll treatment of E I . The majority of symbols represent single observations: where present. error bars indicate means k SE.
7 5 I
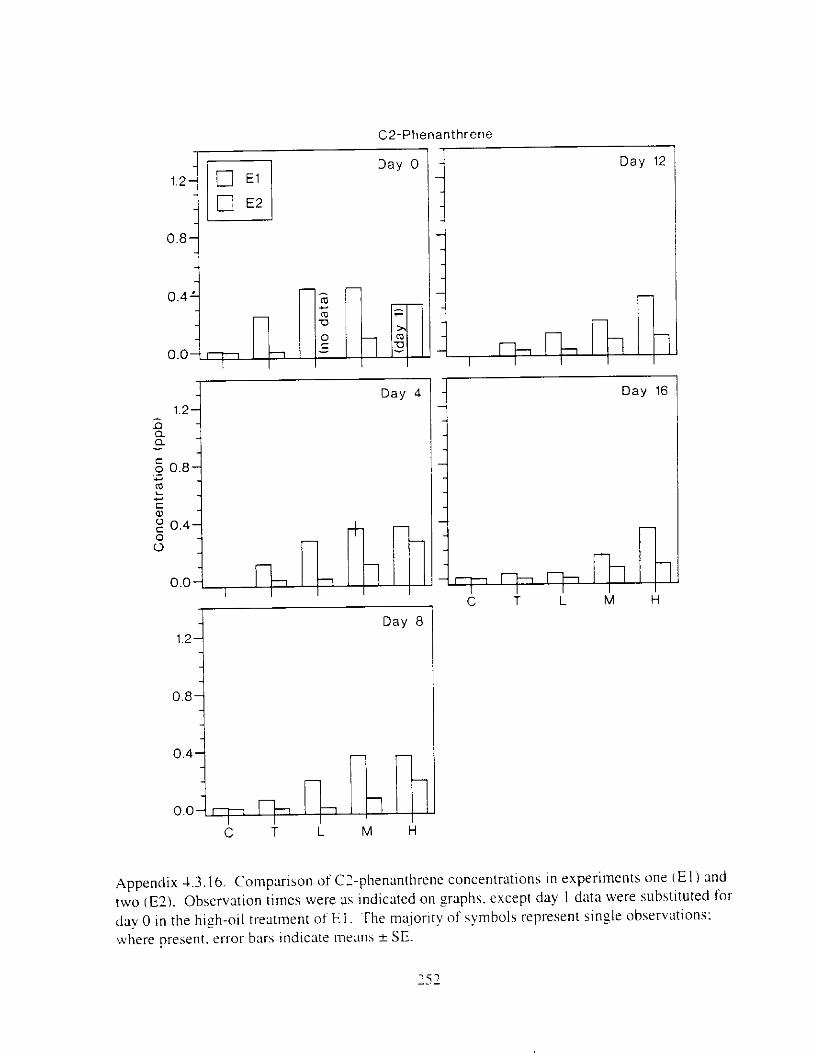
4 Day 4 1
0.8 '.I Day a
0 ' 4 L - + d M 0.0 C T L M H
i Day 16
u C T L M H
Appendix 4.3.16. Comparison of C1-phenanthrene concentrations in experiments one ( E l ) and two (E?). Observation times were as indicated on yaphs. except day I data were substituted for day 0 i n the high-oil treatment o f E l . The lnajorlty o f symbols represent single observations: where present. error bars indicate mems f SE.
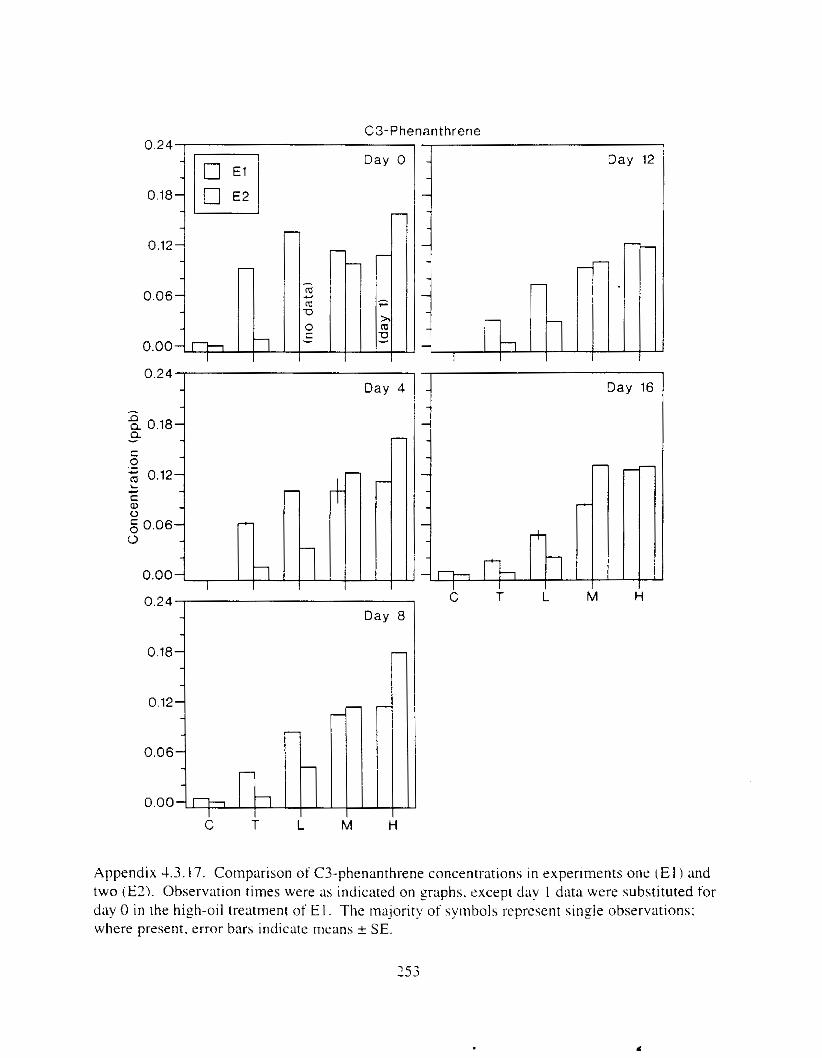
0.18 jm I 1
Day (
0.24 , C3-Phenanthrene
Day 12
0.24 I
II' Day I
T L M H 0.24 c Day a
c T i M H
Appendix 4.3.17. Comparison of C3-phenanthrene co mncer Itrations in experiments one ( E l ) and two (€2) . Observation times were as indicated on p p h s . except day I data were substituted for day 0 i n the high-oil treatment of E I . The majority of symbols represent sin$e observations: where present. error bars indicate means ? SE.
253
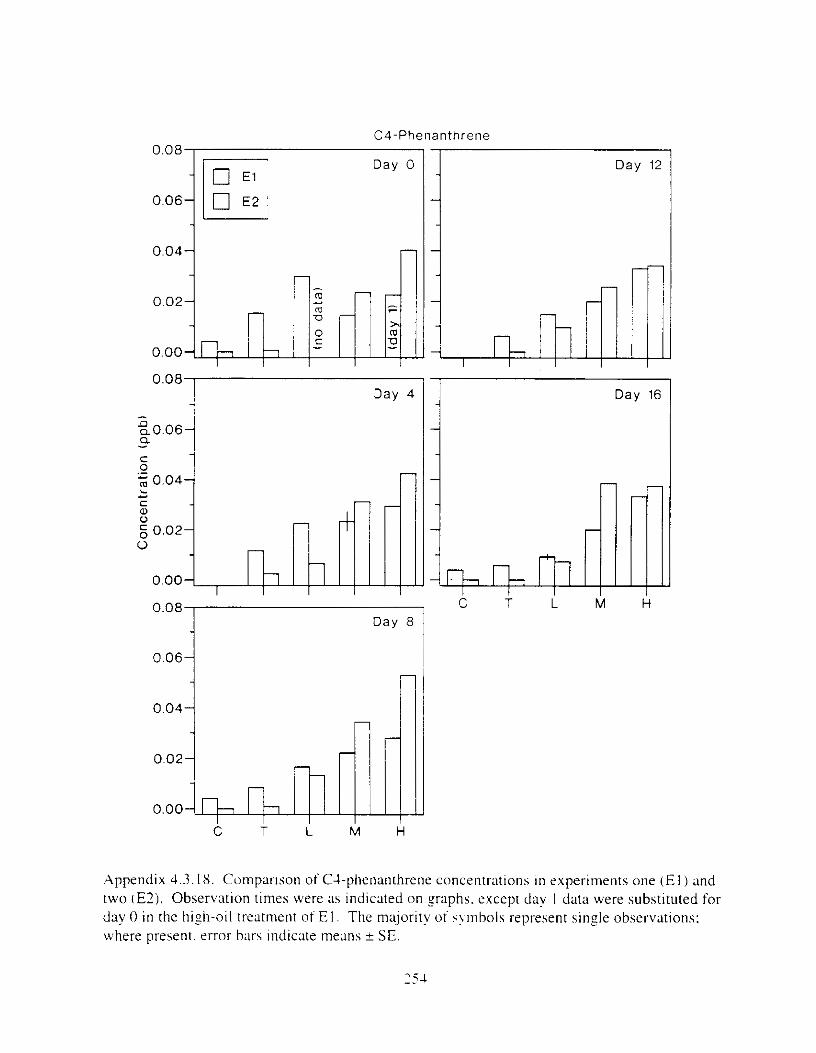
C4-Phenanthrene 0.08
D a y (
0.04 r
0.08 D a y 2
- R
a 0.0.06
1 D a y 12
$ 1 i D a y 16 1
0.08 I
i D a y 8
0.064
Appendix 4.3. IS. Cumparlson of C1-phenanthrene concentrati ons in exc leriments one ( E 1 ) and two tE2). Observation times were as indicated on Zraphs. except day I data were substituted for day 0 in the hiFh-oil treatment of E l . The majority o f s!mbois represent sinzle observations: where present. error bars indicate means i SE.

u 0.015
0.010
0.005
0.000
0.025 Chrysene
Day 0
0.020- -
n n?c. "."LI
Day 8
5 0.020 a a -
I
4 Day 12
7 Day 16
0.020
0.015
0.010
0.005
0.000
C T L M 1 H
Appendix 4.3.19. Comparison of chrysene concentrations i n experiments one (El and two (E?). Observation times were as indicated on p p h s . except day I data were substituted for day 0 in the high-oil treatment of E I . The majority o f symbols [represent single observations: where present, error bars indicate means r SE.
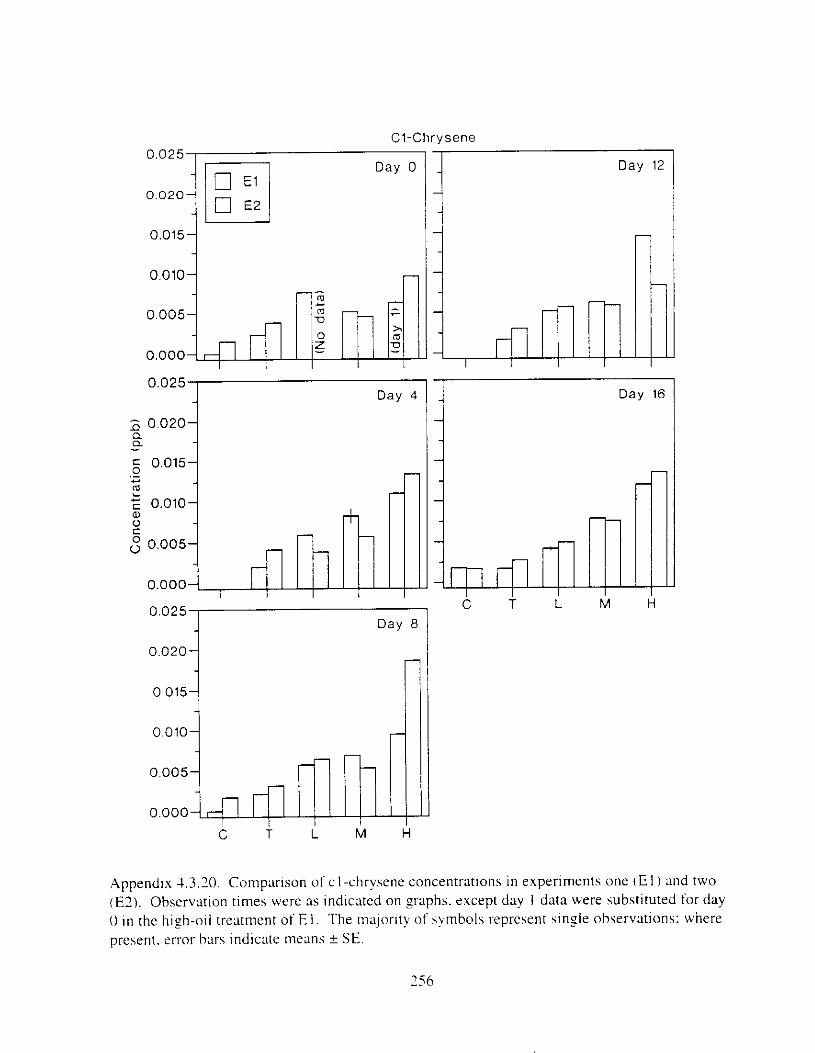
C1-Chrysene
0.020 0 ' 0 2 5 # q - - - -
0.015- -
0.010- - _- m U m
0
- 0.005-
- - 7
- x m 0.000- A z E
l 0.025
Day 1
;j 0.0201
I
0. Q 1 ._ 6 0.015
2 E 0.010
.,-
a 0 C
0.005
0.000
0.025 Day 8
0.020
0.015 i il 0.010
0.005 i
Day 12
i Day 16
0.000 A- , I I I
C T L M H
Appendix 4.3.70. Comparison o f c I -chrysene conc tT;ltl 011s I n experiments one ( E l ) and two (E?). Observation times were as indicated on p p h s . except day I data were substituted for day 0 in the hish-oil treatment of E l . The majority of hynbols I-eprcsent sinsie observations: where present. error bars indicate means + SE.
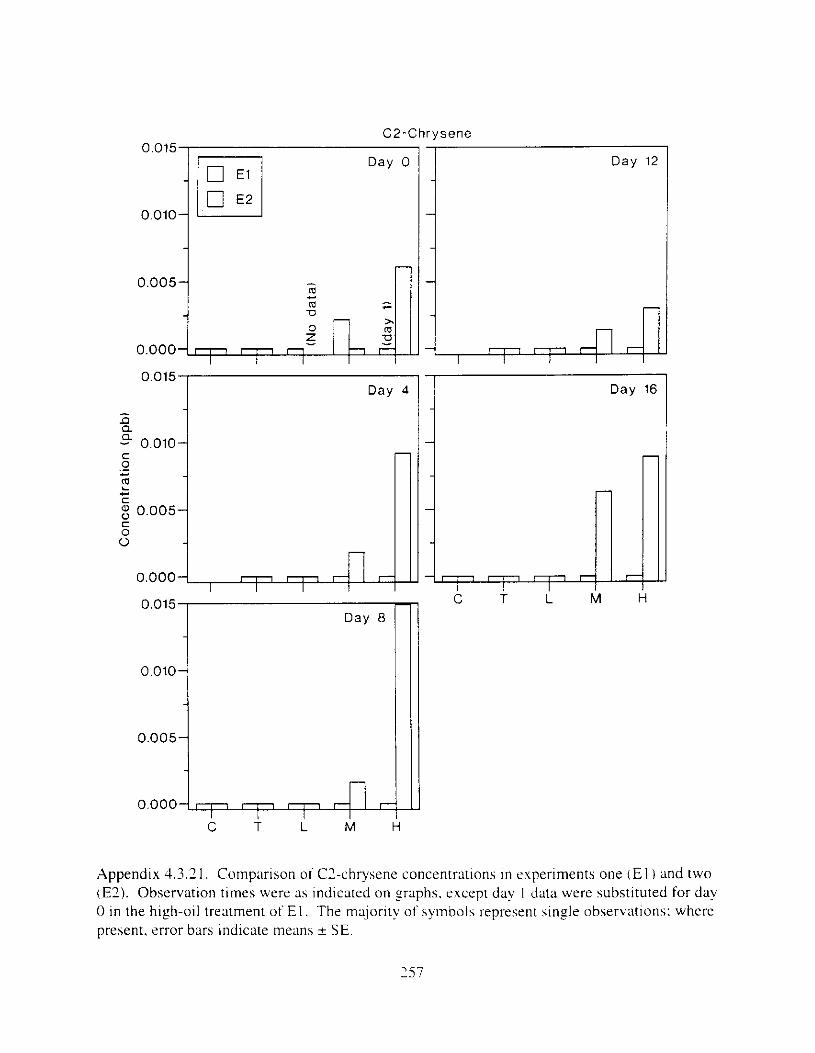
C2-Chrysene 0.015
0.010
0.005
0.000
0.015 Day L
0.000 1 --
i r-
I Day 12 I
L c T i
---
I' Day 11
[E I ) and two Appendix 4.5.21. Comparison o f C1-chrysene concentr3tlons i n experiments one (E?). Observation times were as indicated on graphs. except day I data were substituted for day 0 i n the high-oil treatment of E l . The majority of symbols represent sincgle observations: where present. error bars indicate means f SE.
357
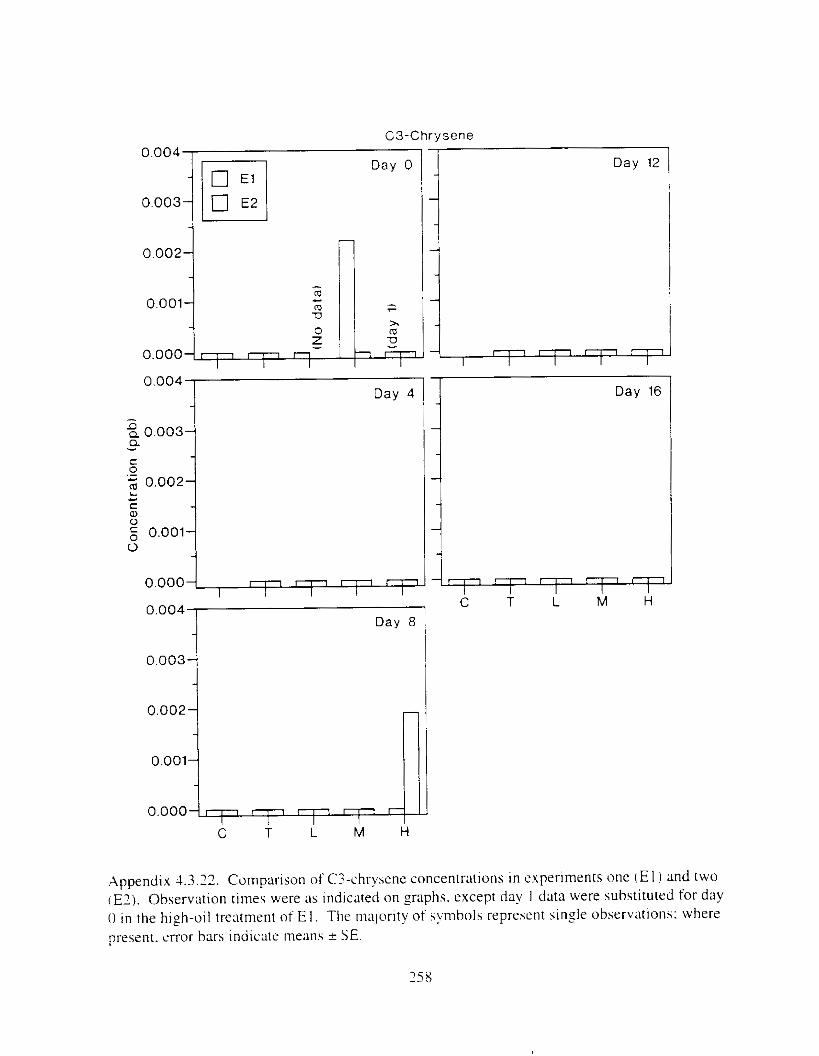
C3-Chrysene
0.004 Day 4
C 0 ._ - 0.002 2 I
C a, 0
0.001 0
0 . 0 0 0 4 ~ ~
0.003
0.002 i 0.001
0.000 L C T L M
j Day 16
Appendix 4.3.22. Comparison of Ckhrysene concentrations in experiments one ( E l ) and two (E?). Observation times were as indicated on graphs. except day I data were substituted for day () in the high-oil treatment o f E l . The maiorlty of symbols reprehrnt sin$e observations: where present. error bars indicate means ? SE.
258

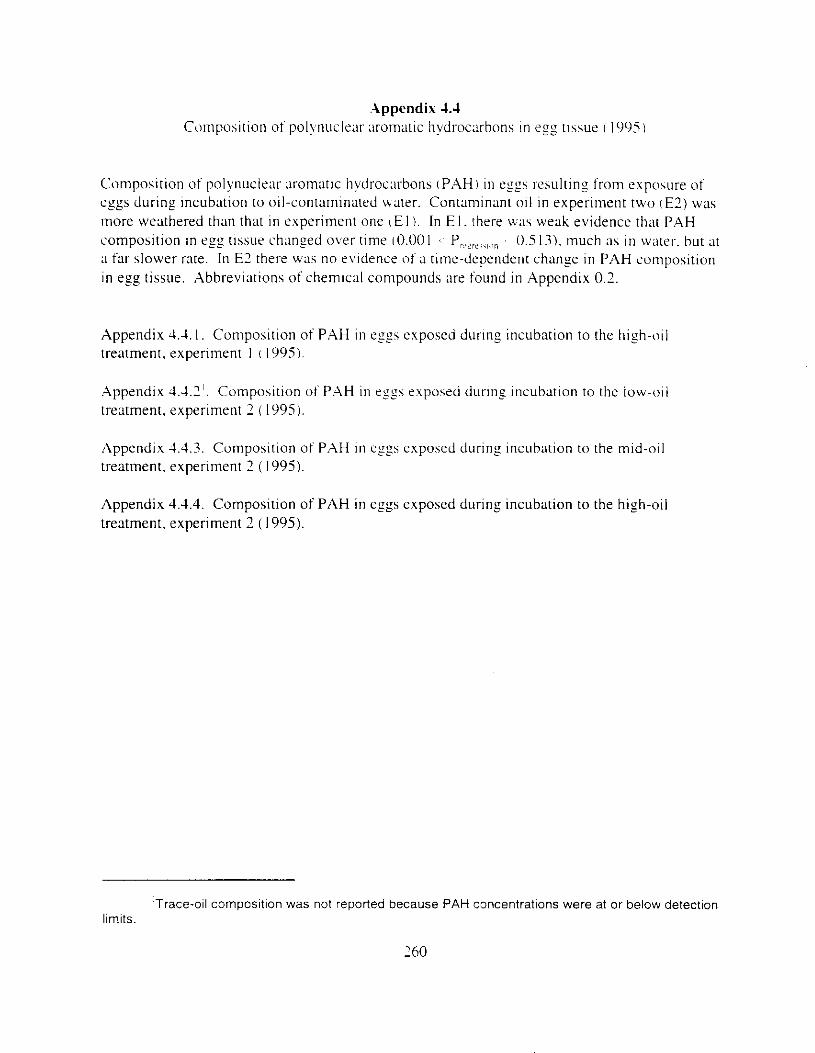
Composition of polynuclear x o m a t ~ c hydrocarbons I P A H ~ 111 esgs resultin: from expowre o f eggs during incubation to oil-contam~nated water. Contaminant 0 1 1 i n experiment two IE?) was more weathered than that i n experiment one ( E l ) . In E l . there was weak evidence that P 4 H composition in e g z t~ssue chanzed over t~me 1 0 . 0 0 1 '~ P~,.l,,,,,,,,, L 0.5 13). much as i n water. hut L I ~
;I far slower rate. In E? there was no ev~dence o f 3 time-dependent change i n PAH composition i n egg tissue. Abbreviations of chemical compounds are found i n Appendix 0.2.
Appendix 4.4. I . Cornposition ot PAH i n e g s exposed durlng incubation to the hizh-oil treatment, experiment I ( 1995).
.Appendix 4.4.7'. Composition o f P.AH i n r s ~ s exposed durlns incuhatlon to the low-oil treatment. experiment 2 ( 1995).
Appendix 4.4.3. Composition of PAH i n e s z s exposed during incubation to the mid-oil treatment. experiment 2 (1995).
Appendix 4.4.4. Composition of PAH in eggs exposed during incubation to the high-oil treatment, experiment 2 ( 1995).
limlts. 'Trace-oil cornposltion was not reported because PAH concentratlons were at or below detection
260

Appendix 4.4.1 I c r r r i , y / ! f ) . Composltion of PAH i n efgs exposed during incubation to the high- oil treatment. experiment I i 1995). E X ~ O S U I - K continued for 15 d. then eggs 'were trdnsferred to clean water. Percentages printed inside the ,graphs indicate total percentages of the following homolo~ou.s chemical groups (left to right): naphthalenes. fluorenes. dibenrorhiophenes. phenanthrenes. and chl-ysenes.
76 I
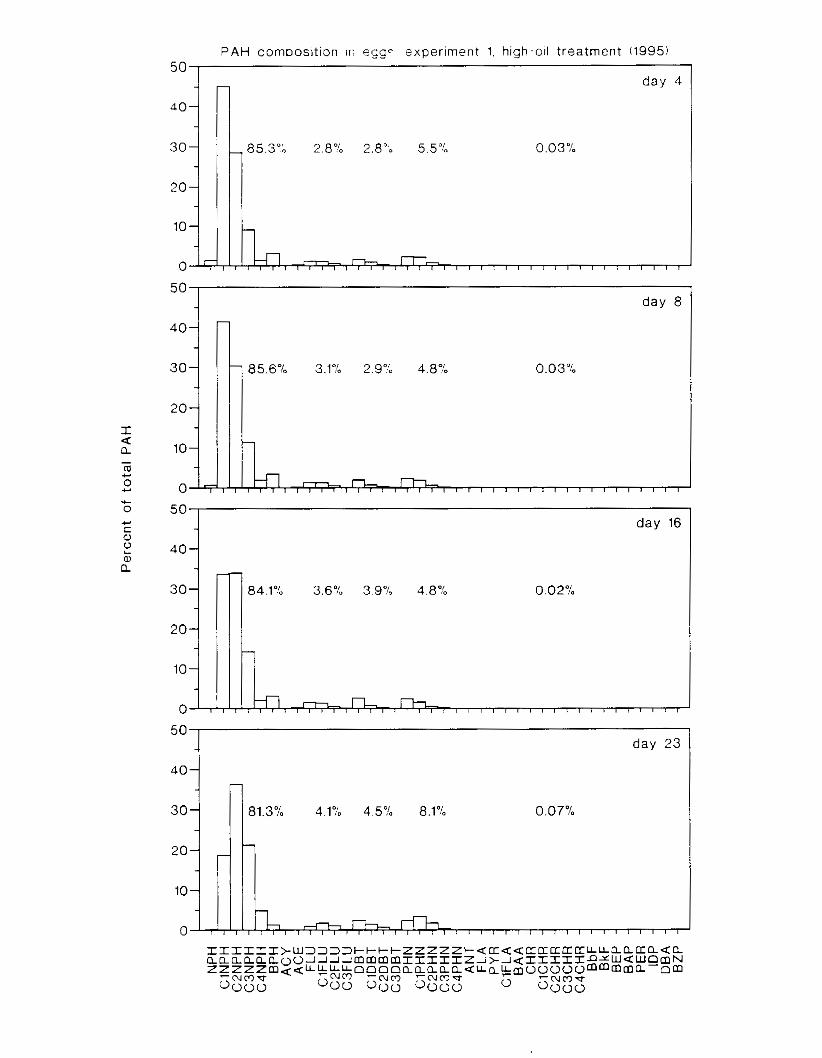
50 I PAH composition in egg? experiment 1. high-oll treatment 11995)
day 4
4 0 4 20
0 - 4
85.3% 2.8% 2.8". 5.5% 0 . 0 3 %
c 0 50 I
day 16
84.1% 3.6% 3.9% 4.8% 0.02%
50 I day 23 4
404
-:lr 10 0
81.3% 4.1% 4.59'. 8.1% 0.07%

Appendix 4.4.2 ( tr t t-i,qhtl. Composition of PAH in eggs exposed during incubation to the low-oil treatment. experiment 2 ( 1995). Exposure continued for 16 d. then eggs were transferred to clean water. Percentages printed inside the graphs indicate total percentages of the following homolosous chemical goups (left to r ight) : naphthalenes. tluorenes. dibenzothiophenes. phenanthrenes. a d chrysenes.
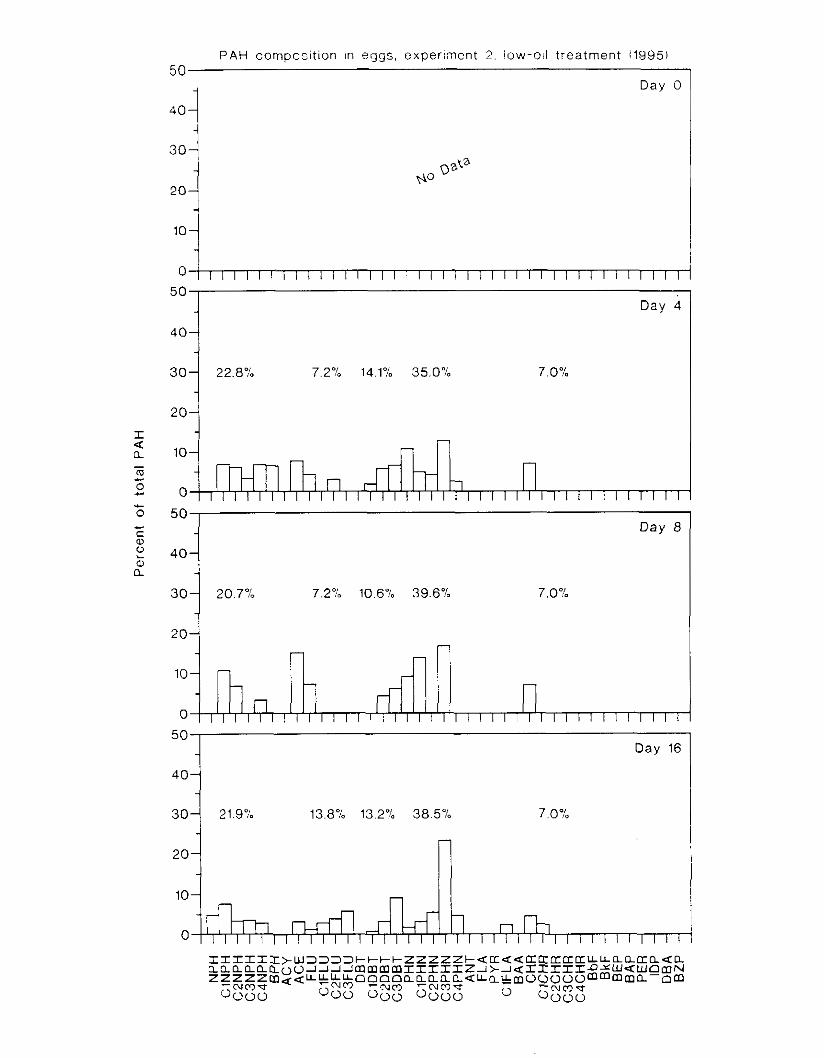
50 PAH composition In eggs, experiment 2 . low-011 treatment 11995)
Day 0
:i 2 0
10
0 / 1 1 1 1 1 ( / / 1 1 / 1 1 1 1 1 1 1 1 1 / / 1 1 / 1 1 / 1 ( / 1 / / [ 1 / 1 1
7.0%
5 0 - Day 4
40-
30- 22.8% 7.2% 14.196 35.0% -
20- -
10-
1 ~ 1 / 1 , 1 1 1 , 1 1 1 , 1 1 1 1 1 1 , 1 1 [ / 1 1 1 1 1
50 - Day 8
40-
30- 20.796 7.2% 10.6% 39.6% 7.0% -
2 0 1

Appendix 4.4.3 ( u r ri,qhr). Composition of PAH i n eggs exposed during incubation to the mid-oil treatment. experiment 2 ( 1995). Exposure continued io!- 16 d. then eggs were transferred to clean water. Percentages printed inside the graphs indicate total percentages of the following homolosous chemlcal groups I left to !right): naphthalenes. tluorenes. dibenzothiophenes. phenanthrenes. and chrysenes.
263
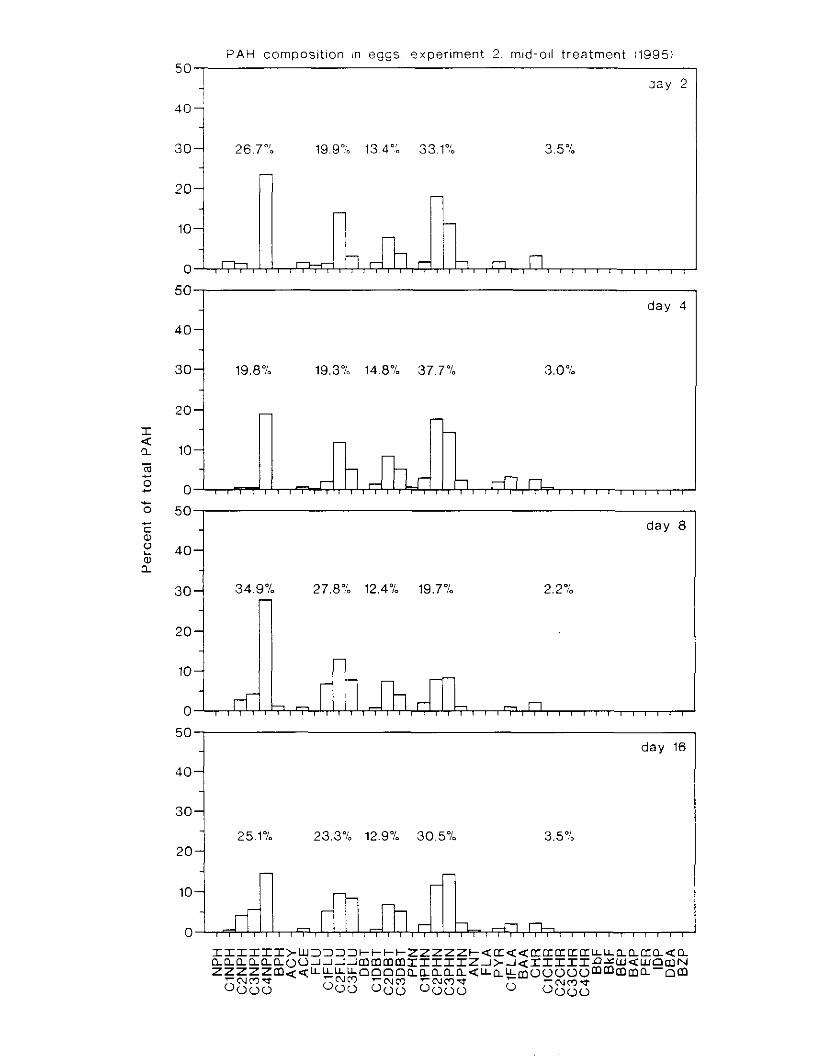
50 P A H composltion in eggs, experment 2. mid-oll treatment 11995)
i cay 2 !
30 26.7"; 19.9"'- 13.4"; 33.1% 3 .5 "b
day 16
4 0
25.1% 23.3% 12.9% 30.5% 3.5 %

Appendix 4.4.4 (ctf riqhr). Composition o f PAH i n eggs exposed during incubation to the high- oil treatment. experiment 2 (1995). Exposure continued for 16 d. then eggs were transferred to clean water. Data for day I6 are means of paired observations t standard error. Percentages printed inside the p p h s indicate total percentages of the following homologous chemical groups (left to right): naphthalenes. tluorenes. dibenzothiophenes. phenanthrenes. and chrysenes.
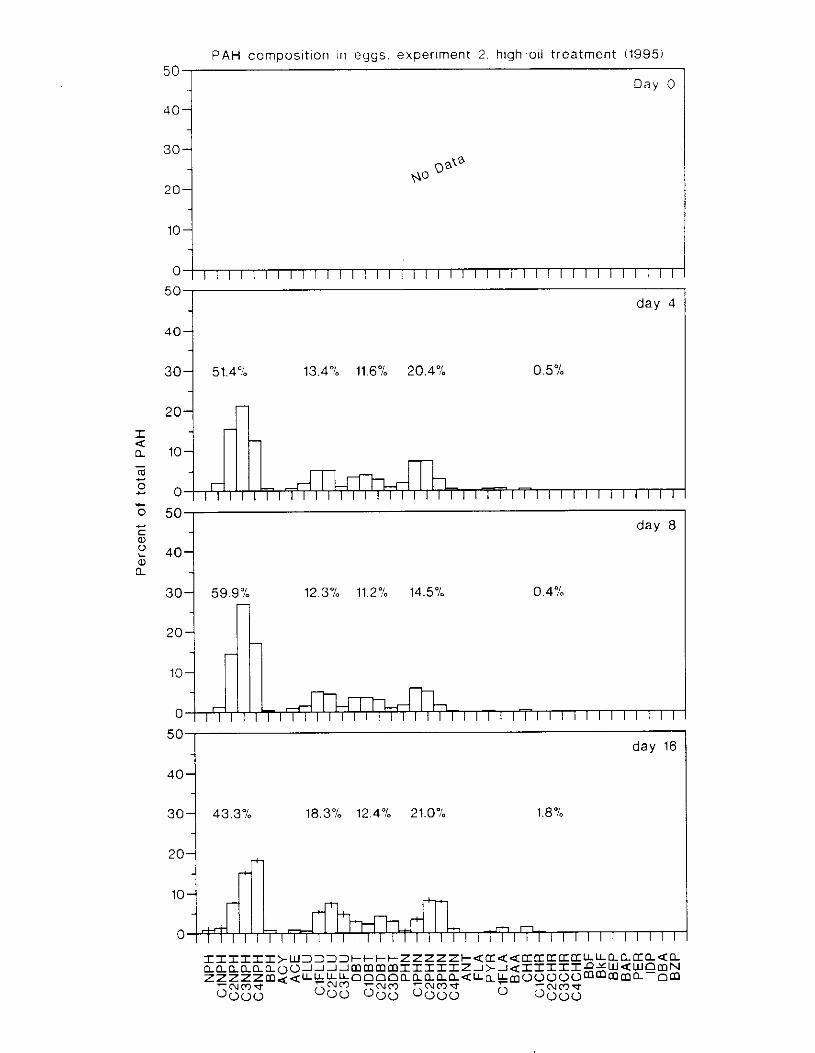
50 PAH composltlon In eggs, experlment 2, hlgh-oli treatment (1995)
D a y 0
:I 20
10
T day 4
1.8 % 18.3% 12.4% 21.0%

.\ppendix 4.5 Polynuclear ;Ironlatlc hydrocarbon5 In rock hubstrate o f o i l drlivery apparutus I 1~1951
Weatherins of polynuclear xomatic hydrocarbons (PSrHI i n the rock suhstrxr of the 0 1 1 delivery apparatus. and the relationshlp herween P.AH concentr:ltlon and composition 111 rock suhstrate and those in water.
Appendix 4.5. I . C o ~ n p o s ~ t ~ o n o f PAH i n [rock ;IS a lunction o f P.4H concentration i n rock on day 2. experlmenr I .
Appendix 4 .52 . Initial PAH concentration In treatment water and that rneusured i n [rock on day 7 (experiment I ) were linearty related (r2 = 0.997. P < 0.001 ) .
Appendix 1.5.3. Polynuclear aromatic hydrocarbon IPAH) composition in rock substnte and treatment water.
766
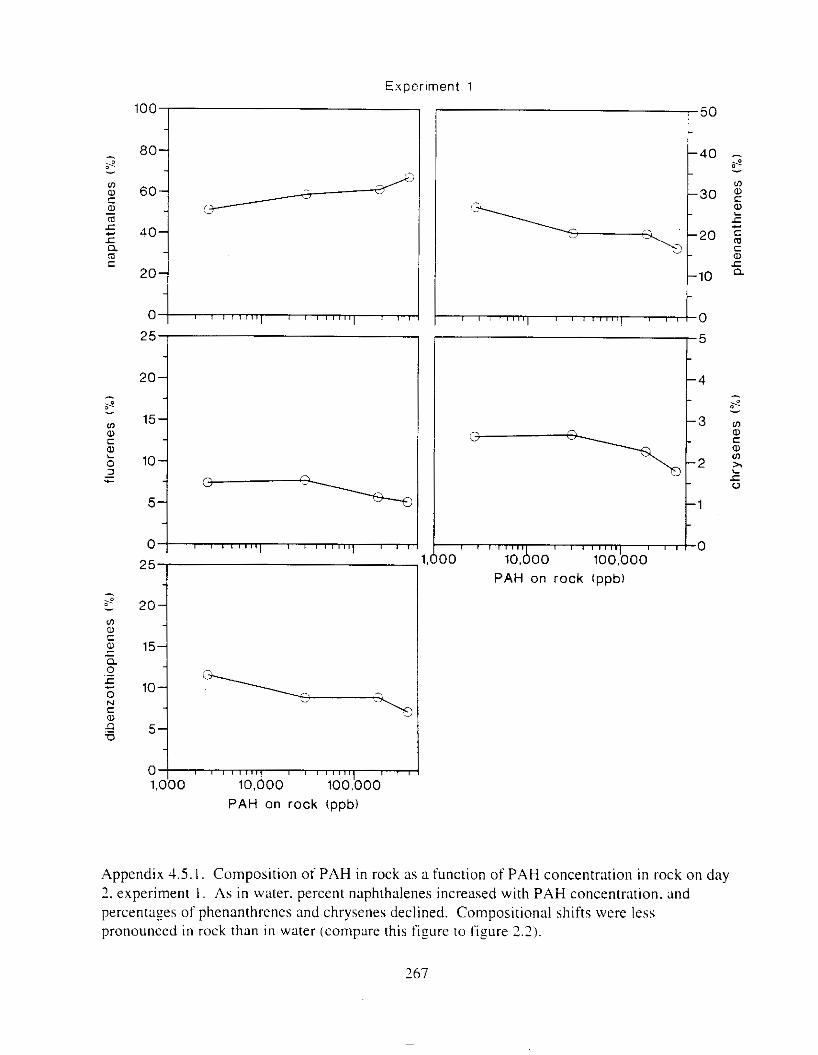
E x p e r l m e n t 1
100 50 -
80- -40 - s . -
60- Lo
-30 -
!-\--\; -20 2 ? 5
40- -
.c e, C
a 20- -10 - .
0 I I 5 25
t o I 1
- 20- - 4
- - 15-
s -
10-
c - .c 0
5- -1 - -
0 I I 1,000 25 10,doo 100.b00
I I 0
PAH on rock (ppb)
20-
15-
lo! 5 \
0 1.000 10,600 loo,boo
PAH on rock (ppb)
Appendix 4.5. I . Composition of PAH in rock as a function of PAH concentration in rock on day 2 . experiment I . As in water. percent naphthalenes increased with PAH concentration. and percentages ofphenanthrenes and chrysenes declined. Compositional shifts were less pronounced i n rock than i n water (compare this figure to figure 1.2).
267
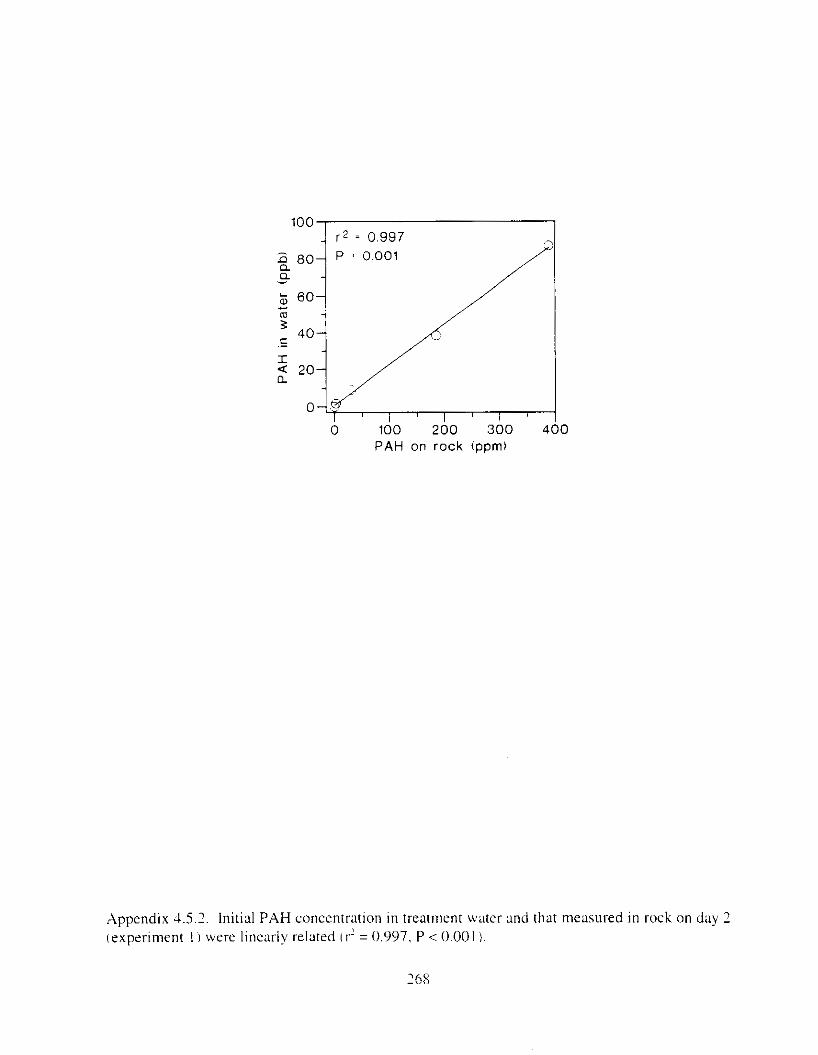
Appendix -1.5.2. Initial PAH concentration in treatment water and that measured in 1-ock on day 2 (experiment I I were linearly related ir' = 0.997. P < 0.001 1.
268
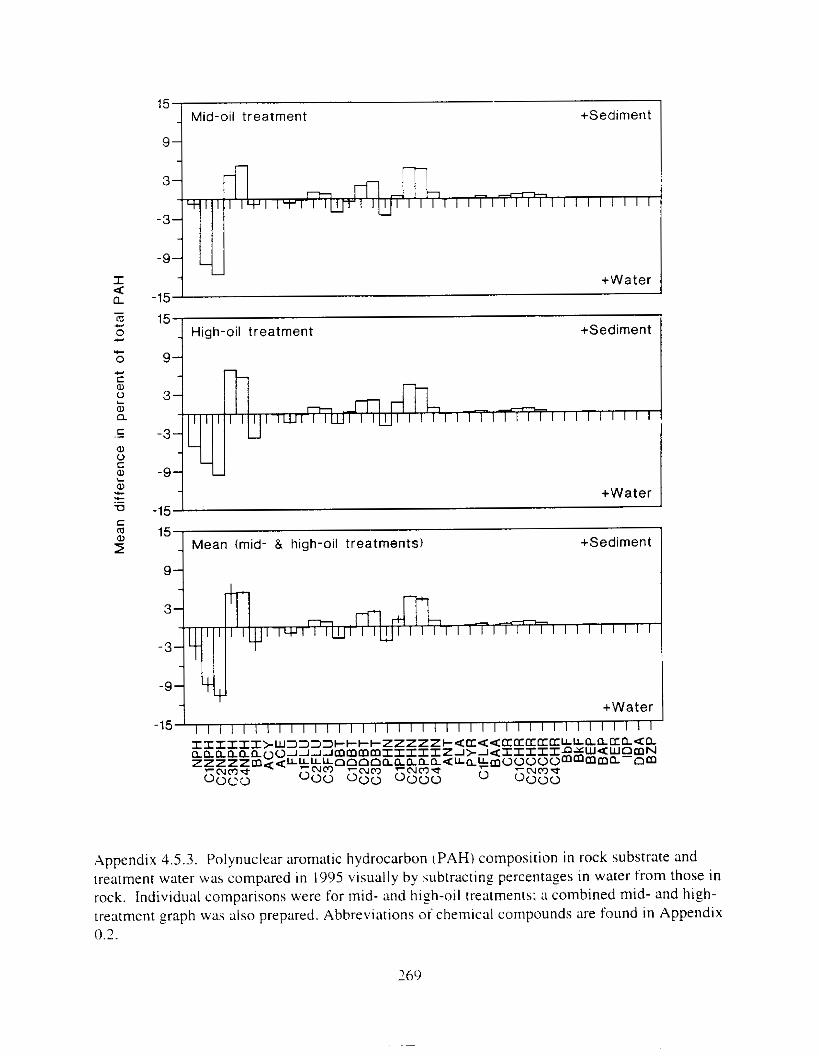
Mea
n d
iffe
ren
ce i
n p
erce
nt
of t
ota
l P
AH
4 F
t