Embed Size (px)
Citation preview

ORIGINAL ARTICLE
Progressive Addition Lens Measurement byPoint Diffraction Interferometry
Sara Chamadoira*, Ralf Blendowske*, and Eva Acosta*
ABSTRACTPurpose. Design a device for accurate measurements of local optical properties of progressive addition lenses (PALs).Methods. A point diffraction interferometer has been adapted to measure local prescriptions of PALs.Results. The most basic configuration of the interferometer for the measurement of PALs showed in this work presents highdynamic range and accuracy as well as the possibility of choosing the number and position of measurement points.Measurements are taken within a region of interest within a radius of about 0.4 to 1.5 mm. Different PAL designs aremeasured by the method proposed here and compared with results by a last generation commercial lens mapper. Withthe point diffraction interferometer we also compared several PAL designs in order to analyze their properties in theprogression zone.Conclusions. The device is compact, robust, and fairly accurate, and the operational principle is very simple. By directmeasurements it provides the local dioptric power, i.e., the second order wavefront properties, of the lens for selectedregions of interest. The position and area can be chosen by the user. The only mobile part of the setup allows for theselection of the measurement points without any additional prismatic correction or movement of the PAL.(Optom Vis Sci 2012;89:1532–1542)
Key Words: progressive addition lenses, point diffraction interferometer, local optical properties, optometricinstrumentation, lens mapper
So called progressive addition lenses (PALs) are produced asophthalmic devices, which compensate for presbyopia. Theyare aspheric in the most general sense and made up of sur-
faces without any spatial symmetry. Lenses made up by one or twoof such surfaces are called freeform lenses. Freeform essentiallymeans that a surface is described and manufactured by pointwiseinformation on a given grid, according to a given optical design.Typically, the design comprises a near zone and far zone, whichshow a more or less constant power distribution and a corridor, theprogression zone, where the power increases smoothly from the farzone to the near zone. Various designs might differ in the way theprogression zone is designed. Because of the theorem of Mink-witz,1 the design parameters of the progression zone have directconsequences to the unwanted astigmatism beside the progressionzone. Thus, the performance of the lens depends crucially on thechanges in the progression zone, which have to be validated in afinished lens. Since, globally, such lenses produce highly de-formed wavefronts, which challenge the dynamic range of any
metrology tool, a closer look to the progression zone requiresspecial approaches.
For many years, PALs were only produced with one standardprogressive surface. The individual spherocylindrical power,changing from lens to lens, was included by the second surface,which might be of toric shape. Compared with the freeform sur-face, this shape is geometrically simple. The most complex surfacemight have changed with certain classes of dioptric power but hasto be controlled, say, only once for several batches in production.At present, there are modern lenses, where one or both surfaces areof freeform type, and, additionally, according to individual param-eters of the patient, these surfaces change from lens to lens. Theselenses are generated by highly flexible multiaxis spindle machines.The obvious problem during production is the validation of thefinished lenses and the comparison with the optical design data.
Various approaches are used to measure PALs. The main dis-tinction stems from the mode of how the lens is tested. Either theentire lens is measured in transmission mode or the two surfaces areserially controlled in reflection mode.
Phase measuring deflectometry is a way to investigate surfaces inthe reflection mode.2 Although of high accuracy this method up tonow has the disadvantage that the results of both surfaces have to
*PhDFacultad de Física, Universidade de Santiago de Compostela, Compostela,
Spain (SC, EA), and the Department of Mathematics and Natural Sciences, Uni-versity of Applied Sciences at Darmstadt, Darmstadt, Germany (RB).
1040-5488/12/8910-1532/0 VOL. 89, NO. 10, PP. 1532–1542OPTOMETRY AND VISION SCIENCECopyright © 2012 American Academy of Optometry
Optometry and Vision Science, Vol. 89, No. 10, October 2012

be combined, say numerically, to describe the final lens. Relativecentration problems of the two surfaces must be carefully con-trolled. Additionally, until now, the back surface has to be black-ened during the measurement. Clearly, this prohibits the use of thelens after the measurement.
Moire-deflectometry, Hartmann-sensors, or Hartmann-Shack-sensors3–7 are used to measure the complete lens in transmission.Also, shape of surfaces has been characterized by physical heightmeasurement and hence the second-order optical properties.8 In-terferometric tests have the advantage of high accuracy, but gener-ally, the dynamic range is not enough for ophthalmic lenses (OLs)and the use of a reference lens or non-null interferometers is oftenmandatory.9 This approach is not useful if individualized lenseshave to be measured. Additionally, in an industrial environment,interferometric measurements are not robust enough because oftheir sensitivity for vibrations. However, as we will show here thepoint diffraction interferometer (PDI)10 can be tailored to measurePALs. As a common path interferometer, it is less sensitive toenvironmental disturbances.11–13
We applied this type of interferometer to characterize PALs byspatially resolved measurements of the local values for the sphere,cylinder, and axis in a serial way. Although the spatial resolution ofHartmann-Shack sensors is limited by the microlens array’s pitch,the resolution of this device is only limited by the pixel density ofthe captured imaged. It goes without saying that noise is the ulti-mate limit in every metrology setup.
THEORETICAL BASIS
The PDI consists basically in a semitransparent plate with a clearpinhole as shown in Fig. 1. When a beam reaches the plate, aspherical reference wave is produced by diffraction at the clearpinhole, whereas the rest of the beam passes through the platewithout any change in its phase. Only its amplitude is attenuatedby the transmittance of the plate (t). If the size of the pinhole andthe transmittance of the plate are chosen in such a way that bothbeams have similar amplitude then well-contrasted fringes will beseen in any observation plane, �, placed after the plate.
An extended development of the theoretical basis of the inter-ferometer can be found in Acosta et al.10; here, we will only reviewthose features that form the basis to PAL measurement.
On the one hand, it is easy to understand that if an incomingspherical wave focuses exactly on the pinhole, a bright field illumi-nates the observation plane, as both transmitted and reference
beam are essentially the same beam. If the incoming wave focusesafter or before the pinhole, two different spherical waves are gen-erated, and the classical interference pattern of concentric sphericalfringes will be observed in �. The density of the interference fringeswill increase with the axial distance between the focus of the waveand the pinhole plate while contrast will decrease (from here on wename defocus, and it will be represented by ε). Fringe patterns willshow a contrast inversion depending on which side of the PDIplane the wave focuses.10
FIGURE 2.Interference patterns for an incoming spherical wave depending on defocus, �.Mind the contrast inversion for different signs of the defocus. (A) In focus, (B)� � �500 �m, (C) � � 500 �m, (D) � � �3000 �m, (E) � � 3000 �m, (F) � ��6000 �m, (G) � � 6000 �m, (H) � � �15000 �m, (I) � � 15000 �m.
FIGURE 1.Basic principle of a PDI.
Progressive Addition Lens Measurement by Point Diffraction Interferometry—Chamadoira et al. 1533
Optometry and Vision Science, Vol. 89, No. 10, October 2012

On the other hand, for big pinholes, the contrast of interferencefringes is not constant across the observation plane because of thefact that the transmitted wave is modulated by a Bessel function.10
This translates in three effects as follows:
For very small defocus, i.e., for a few interference fringes in theobserved region, no true interference pattern can be detected.As defocus increases, the contrast of the periphery fringes decreasesand some fringes disappear, nevertheless the central fringes re-mains and correspond to those of the interference between thereference spherical beam and the incoming beam.As defocus increases, the radius and the visibility of the centralfringes also decrease. The image acquisition system will determinethe upper limit of measurable defocus.
Fig. 2 summarizes these characteristics.If the PDI plate is illuminated by an astigmatic wave, the shape
of the fringes turns into general conics depending on the relativeposition of the focal lines with respect to the pinhole. The shape ofthe interference maxima and minima is defined by
2m � 1 �� x2 � y2�
�D� � x2
��D � εx��
y2
��D � εy�� ,
m � 0,�1, �2 … (1)
where D is the distance from the PDI plate to the observationplane, � the wavelength, and εx and εy the distance from the pin-hole to the focal lines. If both focal lines lay on one side of thepinhole plane, εx. εy � 0, the interference patterns becomeellipses with a central maximum or minimum depending on thesign of εx and εy. On the contrary if εx εy 0 the fringesbecome hyperbolas.
In case of ellipses (or circles), it can be straightforwardly deducedthat from the measurement of the major and minor axes (or radius)of any interference fringe both the distance and the sign of the focallines (or focus) related to the pinhole plane can be easily evaluated.
Moreover, the center of the interference fringes in the observationplane will change with the relative lateral shifts between the incom-ing beam (or equivalently a tilted wavefront14) and the pinhole ([xs,ys] and [xp, yp]) with respect to a given optical axis, being theposition of the center given by:
X0 �� xs � xp�D
εx� xp Y0 �
� ys � yp�Dεy
� yp (2)
Being the angular tilt of the wavefront given by14
FIGURE 3.Interference pattern for tilted wavefront and displaced pinhole plate.
FIGURE 4.Interference pattern for a tilted astigmatic incoming beam with axis at �.
1534 Progressive Addition Lens Measurement by Point Diffraction Interferometry—Chamadoira et al.
Optometry and Vision Science, Vol. 89, No. 10, October 2012

tan � �xs
εxtan � �
ys
εy(3)
For illustrative purposes see Fig. 3.The interferograms will be rotated if focal lines are rotated, i.e.,
the angle of astigmatism, , can be also obtained from the orien-tation of the fringes (Fig. 4).
Finally, as this will be the key point for the working principle ofthe interferometer for PALs, it is worthwhile to stress the fact thatfor a pure spherical or astigmatic incoming beam, the measure-ment of the radius or axis and orientation of a single interferencefringe (maxima or minima) will provide the values of ε and εx, εy,and , respectively.
EXPERIMENTAL SETUP
The experimental setup is shown in Fig. 5. A monochromaticsource, S (He-Ne laser @633nm) is collimated by means of amicroscope objective and positive doublet, the plane wave illu-minates the OL placed 100 mm before a converging lens (CL)with a focal length of f � 50 mm. The observation plane, wherethe interferograms are going to be recorded, is placed at 100
mm from CL; in this way, the OL and the observing plane areconjugated with magnification �1. The PDI plate is made on aglass substrate coated with a chromium oxide layer with anoptical density of 2.3. The clear pinhole has a diameter of 15�m. The position of the PDI plate will define what we callabsolute configuration, i.e., when the plate is placed in the focalplane of the CL, � � 0, and differential configuration, when theplate is not in the focal plane, � � 0. The change from oneconfiguration to another only implies an axial movement of thePDI plate what will allow us, as we will explain below, toincrease the dynamic range of the apparatus. Fig. 5 shows ascheme of the device and the laboratory setup.
CALIBRATION AND DYNAMIC RANGE
To calibrate the device and establish the dynamic range andaccuracy, we used a set of trial lenses with dioptric powers rangingfrom �10.00D to �10.00D at steps of 0.25D. First, we placed thePDI plate at the focal plane of CL (absolute configuration, � � 0)and we measured the radius of the first minima; hence, we evaluatethe defocus, ε, with respect to the focal plane with eq. 1 (m � 2 forpositive powers and m � 1 for negative one). Taking into account
FIGURE 5.A, Schematic and (B) experimental setup.
Progressive Addition Lens Measurement by Point Diffraction Interferometry—Chamadoira et al. 1535
Optometry and Vision Science, Vol. 89, No. 10, October 2012

that the position of the trial lens is known (2f from CL), a verysimple geometrical calculation provides the dioptric power of thelens from the measured values of defocus, ε.
In Fig. 6A, a comparison between measured results and thenominal power of the trial lenses is shown. Results are fitted to astraight line passing through the origin of coordinates. Theslope of the line, a, as well as the regression coefficient, r, showsa good agreement between both values. Due to the fact thatcommercial trial lenses are produced under some tolerances,additional small deviations from a perfect linear behavior mayshow up in the results. The radii of the first minimum fringe vs.the power of the trial lenses are plotted in Fig. 6B. Since theobservation plane and trial lenses are placed at conjugate planeswith magnification �1 what implies that measurements corre-spond to the dioptric power within circles with radii rangingfrom 0.4 to 1.8 mm.
From Fig. 6A it can be deduced that small powers within theinterval of �0.5D to �0.5D cannot be evaluated in this con-figuration because the image spots fall near the focal plane andbecause the size of the pinhole interference fringes do not cor-respond to the interference pattern between two sphericalbeams (as in Fig. 2B, C). It can be also deduced that only alimited range of dioptric powers from �3D to �6D can bemeasured in this configuration.
The so-called differential configuration overcomes these twoproblems; in other words, it increases the dynamic range in bothdirections: larger powers and smaller ones as well. The reason whythe absolute configuration cannot go beyond the aforementionedrange is because the image spots lie so far away from the pinhole orthe focal plane that fringes are too small. With such a low contrast,the CCD device cannot detect them (as in Fig. 2H, I). The obviousway to increase the size of the fringes as well as the contrast is to
FIGURE 6.Calibration of the setup in absolute configuration: A, Defocus obtained by interferometry vs. displacement of the plate. B, Radius of the first minimumfringe vs. displacement of the plate.
FIGURE 7.Calibration of the setup in differential configuration. The nominal values of the trial lenses are represented by horizontal lines. Vertical arrow showsthe position where the pinhole can not be further displaced due to size of translation stages.
1536 Progressive Addition Lens Measurement by Point Diffraction Interferometry—Chamadoira et al.
Optometry and Vision Science, Vol. 89, No. 10, October 2012

translate axially the PDI plate toward the focused spot to get fringesas in Fig. 2D to G.
Displacing the pinhole by an amount �, is equivalent to com-pensate for some amount of vergence of the OL, and in this way,the dynamic range can be extended. Besides by displacing thepinhole far enough from the focal plane for those lenses with smalldioptric power makes that contrasted central fringes appear andtherefore they can be measured.
Fig. 7 shows the measured powers of trial lenses (in steps of1.00D) for the range of � values where fringes can be accuratelydetected. For dioptric powers equal to or bigger than �7.00D,the lower limit in � values is not because of the low contrast andsmall size of the fringes but to the mechanical constraints of theexperimental setup (delimited with a vertical arrow).
Table 1 shows the nominal power and the averaged measuredpower (for all � values) of the trial lenses (in steps of 1.00D) as well
as the standard deviation of the measurements from the nominalvalue what allow us to establish the dynamic range of the setupbetween �10.00D and �10.00D and an accuracy of about 0.1D(as an upper limit). In all cases, the radius of the first minimumfringe ranged from 0.4 mm to 1.8 mm.
As explained earlier in the text, the shape of the interferencefringes turns into conics for toric lenses. Ellipses are obtained if thepinhole is placed right after or right before both focal lines andhyperbolas if in between. In order to apply the same image pro-cessing for the fringes and avoid the mechanical constraints ofexperimental setup in what follows we are going to choose onlydifferential configurations, where elliptical or circular fringes witha central minimum are obtained.
All these calibrations have been performed when both thetrial lens and the pinhole are centered on the axis of the opticalsystem. We have already shown that the dioptric power of thelens can be evaluated within a small region. The size of thispatch can be chosen just by controlling the axial position of thepinhole.
When the pinhole plate is translated in its own plane, the fringesalso displace transversally in the observation plane. Because � andthe OL are placed at conjugate planes, the fringes provide the localpower of that portion of the lens whose image falls on the firstminimum fringe’s region.
In this way, a simple translational movement of the pinhole canscan the whole lens without any prism system for both absolute anddifferential configuration as shown in Fig. 8.
In Fig. 9, a superposition of interferograms for three differentOLs and different configuration of the setup are shown. Dioptricpowers have been evaluated from the first minimum fringe in allcases. From Fig. 9A, B, it can be deduced that both absolute anddifferential configuration provides the same results for the samelens.
FIGURE 8.Selection of the position and size of the measurement region of the lens by combined axial and transversal pinhole movements.
TABLE 1.Nominal power and averaged measured power of trial lenses
Nominalpower (D)
Measuredpower (D)
Nominalpower (D)
Measuredpower (D)
�10.00 �10.08 � 0.09 10.00 9.99 � 0.06�9.00 �9.04 � 0.10 9.00 9.02 � 0.08�8.00 �7.97 � 0.06 8.00 7.99 � 0.10�7.00 �6.95 � 0.05 7.00 6.98 � 0.06�6.00 �5.99 � 0.06 6.00 6.00 � 0.05�5.00 �5.00 � 0.06 5.00 4.97 � 0.05�4.00 �3.98 � 0.08 4.00 4.05 � 0.07�3.00 �3.00 � 0.06 3.00 2.95 � 0.05�2.00 �1.98 � 0.06 2.00 1.96 � 0.04�1.00 �1.05 � 0.05 1.00 1.02 � 0.05
Progressive Addition Lens Measurement by Point Diffraction Interferometry—Chamadoira et al. 1537
Optometry and Vision Science, Vol. 89, No. 10, October 2012

It can be also deduced that the local dioptric power for a lowpower spherical lens is the same at the different points on thelens surface. In Fig. 9C, the superposition of interferograms indifferential configuration is shown for a spherical lens with adioptric power of �9.00D. It can be seen how aberrationstranslate in elliptical fringes at the periphery of the lens. In Fig.9D, we show the local power in both meridians of a cylindricallens. It can be also observed how the dioptric power is slightlychanged as the measurement points are displaced toward theperiphery of the lens.
Now, we will show how the PDI performs for a set of PALs.
RESULTS
There are two aims in our measurements of PALs. First, we wantto demonstrate that the PDI-setup produces the global informa-tion on the performance all over the lens. To this end, we compareour results with a commercial system. Second, we like to emphasizethe possibility to concentrate on regions of interest, like the pro-gression zone, where the spatial resolution can be adapted to the
FIGURE 9.A, Superposition of interferograms and measured local dioptric powers of a spherical lens with a dioptric power of S � �1.00D measured in absoluteconfiguration; (B) a spherical lens with a dioptric power of S � �1.00D measured in differential configuration (� � �3500 �m); (C) a spherical lenswith dioptric power of �9.00D measured in differential configuration (� � �28,000 �m); and (D) a toric lens with spherocylindrical power S � 0.00D,C � �1.00D at � � 0 degrees in differential configuration (� � �2800 �m).
1538 Progressive Addition Lens Measurement by Point Diffraction Interferometry—Chamadoira et al.
Optometry and Vision Science, Vol. 89, No. 10, October 2012

properties under consideration. This renders the option to com-pare PAL-designs according to selected preferences.
We have found that for a PAL elliptic or circular fringes about apoint on the lens can be also observed by means of the proper axialand transverse displacement of the pinhole. Depending on thespherocylindrical power and the addition of the lens, the totalmapping can be performed with the pinhole placed in a uniquefixed axial position (whether absolute or differential configuration)or for several axial positions changing from one to another whenfirst minimum fringes become too small to be detected or too bigand because of the presence of high order terms, the second orderapproach within this region is not valid, and therefore fringes areno longer good approaches to conic sections. Six PALs were mea-sured with the interferometer and the corresponding power mapscompared with those obtained with a Rotlex Class Plus lens map-per. The axial position of the pinhole was selected in such a waythat the radius (or axis) of the first minimum circular (or elliptical)fringe ranges from 0.4 mm to 1.5 mm in order to keep the second-order approach accurate. Table 2 shows the parameters of the 6lenses.
Fig. 10 shows a superposition of interferograms for lens L3(without cylindrical power) and for only one position of the pin-hole for the whole mapping.
Fig. 11A to F show the corresponding addition (first row) andcylinder (second row) maps obtained from the two different de-vices (first column for the PDI and second one for the Rotlex ClassPlus lens mapper). Here, we must point out that the laboratorysetup is not yet automatic; therefore, each point is selected by hand.Therefore, maps are drawn from approximately 300 measurementpoints in a square grid. For an automatic device, this number andposition can be chosen by the user, and therefore spatial resolutioncan be dramatically improved as well speed up the process but thisgoes beyond the scope of this work.
The mapping of lenses with addition smaller than 2.5D could bedone with only one differential configuration. The other lensesneeded two different positions of the pinhole to ensure the size ofthe major axis of the ellipses smaller than 1.5 mm. Lenses L3 andL4 have the same dioptric power, but they are from different man-ufactures. It is clear that they have different addition and cylinderdistributions.
The slight differences come from the smaller number used hereby the PDI and the consequent differences in the interpolation ofpoints to find the isolevel lines by the software.
Finally, another advantage of the device is the possibility ofisolating a point or a set of points where the local dioptric valueswant to be evaluated. Therefore, we will show how we can findslight differences in the designs between two lenses with the samedioptric power (S � 0.25D, Add � 2.25D) and the same mount-ing height manufactured by different lens makers by analyzing thedifferences along the corridor.
For a given height of the lens, we perform a horizontal scan ofthe local dioptric powers and we choose the point where the cylin-drical power minus the prescribed cylindrical power reaches aminimum. In Fig. 12, we show a scan with the correspondingmeasured cylinder values for lens L4 at a height �11 mm having asorigin of coordinates the fitting cross. The point with coordinates(�1mm, �11mm) is chosen as a corridor point.
After choosing all the points of the corridor in both lenses, weplotted in Fig. 13 addition profiles and the differences betweenmakers arise like slight differences in the slope of the addition.
CONCLUSIONS
We propose here a modified PDI as a lens mapper of PALs. Theexperimental setup has only one movable part that allows to mea-sure dioptric powers ranging from �10.00D to �10.00D, choosethe point or the set of points on the lens where the local spherocy-lindrical power is going to be measured and select the radius of themeasurement region between 0.4 mm and 1.5 mm. This ensuresthat the local approximation of a second order wavefront workswith an accuracy better than 0.1D.
The possibility to measure the local dioptric matrix in one pointor a set of desired points all over the lens allows to analyze orcompare lens designs in the regions of interest.
Finally, it is worthwhile to say that the axial movement of thepinhole allows considering bigger regions of interest within whichhigher order aberrations of the wavefront can be measured, but thiswill be dealt with in a future work.
FIGURE 10.Superposition of interferograms for L3. All of them taken in 1 differentialconfiguration.
TABLE 2.Tested lenses
Lens S (D) C (D) Axis (degrees) Add (D)
1 0.00 0.00 0 2.002 �2.00 0.00 0 3.503 �2.00 0.00 0 1.504 �2.00 0.00 0 1.505 0.00 �2.00 90 0.756 �2.00 0.00 0 2.50
Progressive Addition Lens Measurement by Point Diffraction Interferometry—Chamadoira et al. 1539
Optometry and Vision Science, Vol. 89, No. 10, October 2012
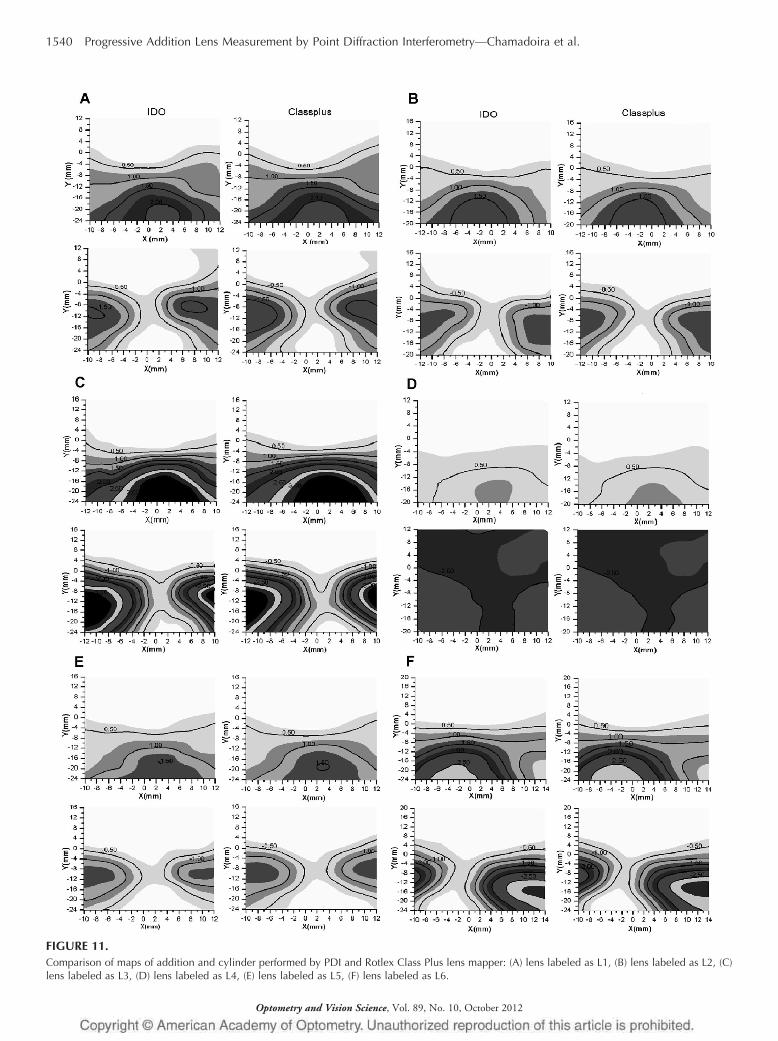
FIGURE 11.Comparison of maps of addition and cylinder performed by PDI and Rotlex Class Plus lens mapper: (A) lens labeled as L1, (B) lens labeled as L2, (C)lens labeled as L3, (D) lens labeled as L4, (E) lens labeled as L5, (F) lens labeled as L6.
1540 Progressive Addition Lens Measurement by Point Diffraction Interferometry—Chamadoira et al.
Optometry and Vision Science, Vol. 89, No. 10, October 2012

FIGURE 13.Addition profile for lenses with same spherocylindrical power but different brands.
FIGURE 12.A, Election of the points of the corridor; (B) cylinder values.
Progressive Addition Lens Measurement by Point Diffraction Interferometry—Chamadoira et al. 1541
Optometry and Vision Science, Vol. 89, No. 10, October 2012

ACKNOWLEDGMENTS
We thank INDO LENS GROUP S.L.U for let us measure the lenses withRotlex Class Plus. This work was supported by the Spanish Ministerio deEducacion y Ciencia grant FIS2010–16753, the FEDER and AiF, grantFKZ: 1782X07.
Received February 23, 2012; accepted June 14, 2012.
REFERENCES
1. Minkwitz G. [On the surface astigmatism of a fixed symmetricalaspheric surface]. Opt Acta (Lond) 1963;10:223–7.
2. Ettl S, Kaminski J, Knauer MC, Hausler G. Shape reconstructionfrom gradient data. Appl Opt 2008;47:2091–7.
3. Rottenkolber M, Podbielska H. Measuring ophthalmologic surfacesby means of Moire deflectometry. Opt Eng 1996;35:1124–33.
4. Castellini C, Francini F, Tiribilli B. Hartmann test modification formeasuring ophthalmic progressive lenses. Appl Opt 1994;33:4120–4.
5. Villegas EA, Artal P. Spatially resolved wavefront aberrations of oph-thalmic progressive-power lenses in normal viewing conditions. Op-tom Vis Sci 2003;80:106–14.
6. Ares M, Royo S, Caum J. Shack-Hartmann sensor based on a cylin-drical microlens array. Opt Lett 2007;32:769–71.
7. Zhou C, Wang W, Yang K, Chai X, Ren Q. Measurement andcomparison of the optical performance of an ophthalmic lens based
on a Hartmann-Shack wavefront sensor in real viewing conditions.Appl Opt 2008;47:6434–41.
8. Raasch TW, Su L, Yi A. Whole-surface characterization of progressiveaddition lenses. Optom Vis Sci 2011;88:217–26.
9. Greivenkamp JE, Gappinger RO. Design of a nonnull interferometerfor aspheric wave fronts. Appl Opt 2004;43:5143–51.
10. Acosta E, Chamadoira S, Blendowske R. Modified point diffractioninterferometer for inspection and evaluation of ophthalmic compo-nents. J Opt Soc Am (A) 2006;23:632–7.
11. Smartt RN, Steel WH. Theory and application of point diffractioninterferometers. Jpn J Appl Phys 1975;14:351–6.
12. Koliopoulos CL, Kwon O, Shagam R, Wyant JC, Hayslett CR. In-frared point diffraction interferometer. Opt Lett 1978;3:118.
13. Gong Q, Geary JM. Modeling point diffraction interferometers. OptEng 1996;35:351–6.
14. Acosta E, Blendowske R. Paraxial propagation of astigmatic wave-fronts in optical systems by an augmented stepalong method forvergences. Optom Vis Sci 2005;82:923–32.
Eva AcostaFacultad de Física
Universidade de Santiago de CompostelaCampus Vida, 15782
Santiago de CompostelaSpain
e-mail: [email protected]
1542 Progressive Addition Lens Measurement by Point Diffraction Interferometry—Chamadoira et al.
Optometry and Vision Science, Vol. 89, No. 10, October 2012