Embed Size (px)
Citation preview

Progress modeling topographic variation in temperature and moisture for inland
Northwest forest management
Zachary Holden - US Forest Service Region 1, Missoula MT
Alan Swanson – University of Montana Dept. of Geography
David Affleck – University of Montana (Forestry)
Solomon Dobrowski – University of Montana (Forestry)
Marco Maneta – University of Montana (Geosciences)

Vegetation management in Complex Terrain Fine-scale gradients drive large variation in vegetation and fuel dynamics
We lack fundamental tools and data needed to make informed decisions about:
What to plant where
How fast it will grow
How it will burn
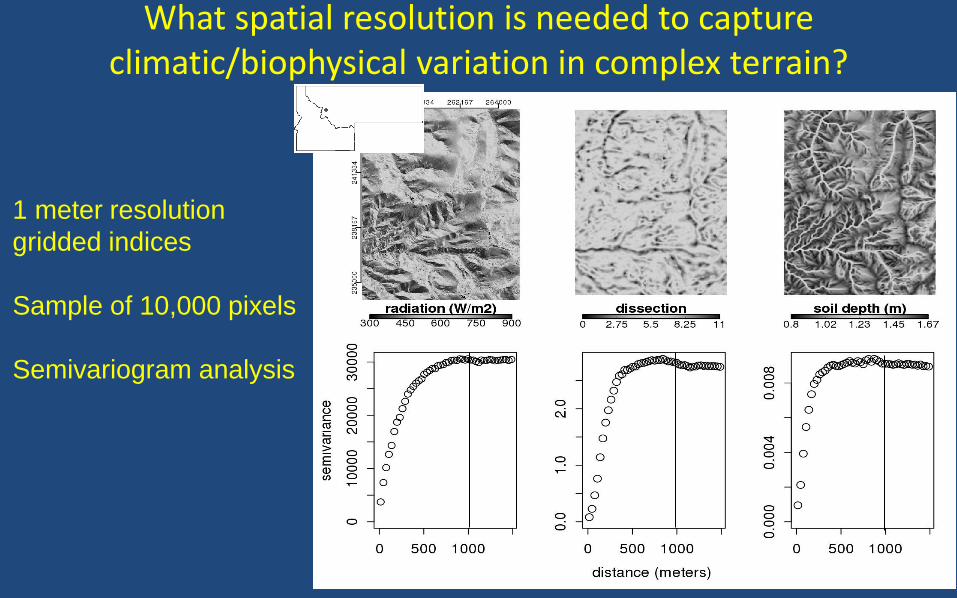
What spatial resolution is needed to capture climatic/biophysical variation in complex terrain?
1 meter resolution
gridded indices
Sample of 10,000 pixels
Semivariogram analysis
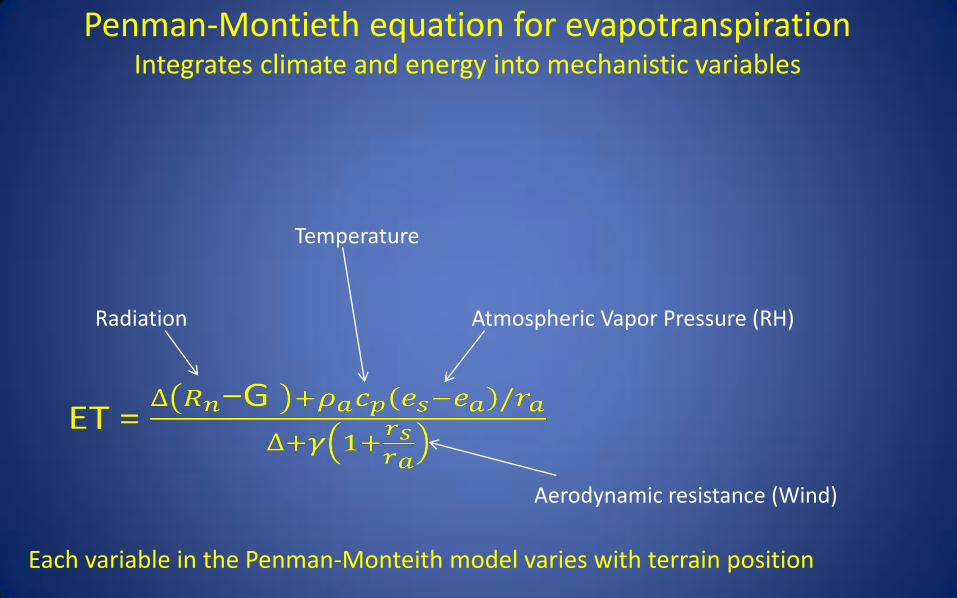
Penman-Montieth equation for evapotranspiration Integrates climate and energy into mechanistic variables
Radiation Atmospheric Vapor Pressure (RH)
Aerodynamic resistance (Wind)
Temperature
Each variable in the Penman-Monteith model varies with terrain position
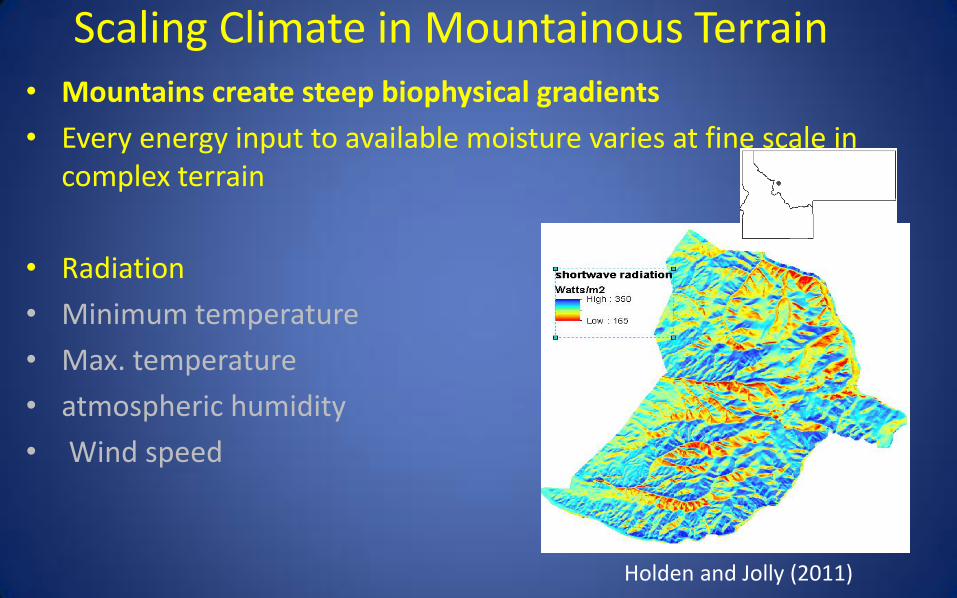
• Mountains create steep biophysical gradients
• Every energy input to available moisture varies at fine scale in complex terrain
• Radiation
• Minimum temperature
• Max. temperature
• atmospheric humidity
• Wind speed
Scaling Climate in Mountainous Terrain
Holden and Jolly (2011)

• Mountains create steep biophysical gradients
• Every energy input to available moisture varies at fine scale in complex terrain
• Radiation
• Min. temperature
• Max. temperature
• atmospheric humidity
• Wind speed
Scaling Climate in Mountainous Terrain
Holden and Jolly (2011)
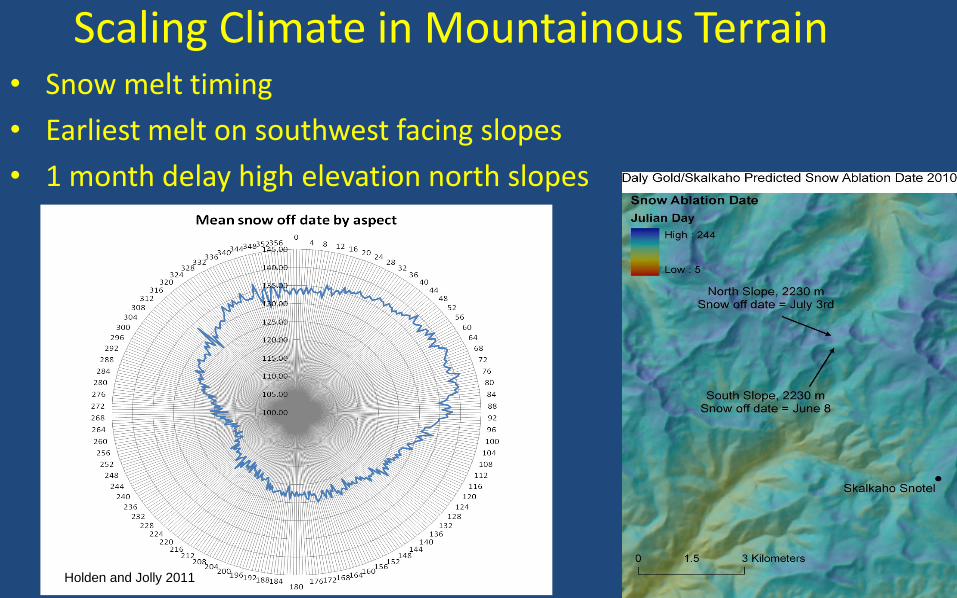
• Snow melt timing
• Earliest melt on southwest facing slopes
• 1 month delay high elevation north slopes
Scaling Climate in Mountainous Terrain
Holden and Jolly 2011

• Mountains create steep biophysical gradients
• Every energy input to available moisture varies at fine scale in complex terrain
• Radiation
• Min. temperature
• Max. temperature
• atmospheric humidity
• Wind speed
Scaling Climate in Mountainous Terrain
Holden and Jolly (2011)

• Mountains create steep biophysical gradients
• Every energy input to available moisture varies at fine scale in complex terrain
• Radiation
• Minimum temperature
• Max. temperature
• atmospheric humidity
• Wind speed
Scaling Climate in Mountainous Terrain
Holden and Jolly (2011)


Topographic variation in windspeed Slower wind speeds in valley bottoms
Higher wind speeds on ridge tops
Large effect on ET
WindNinja Simulation for August 13, 2013
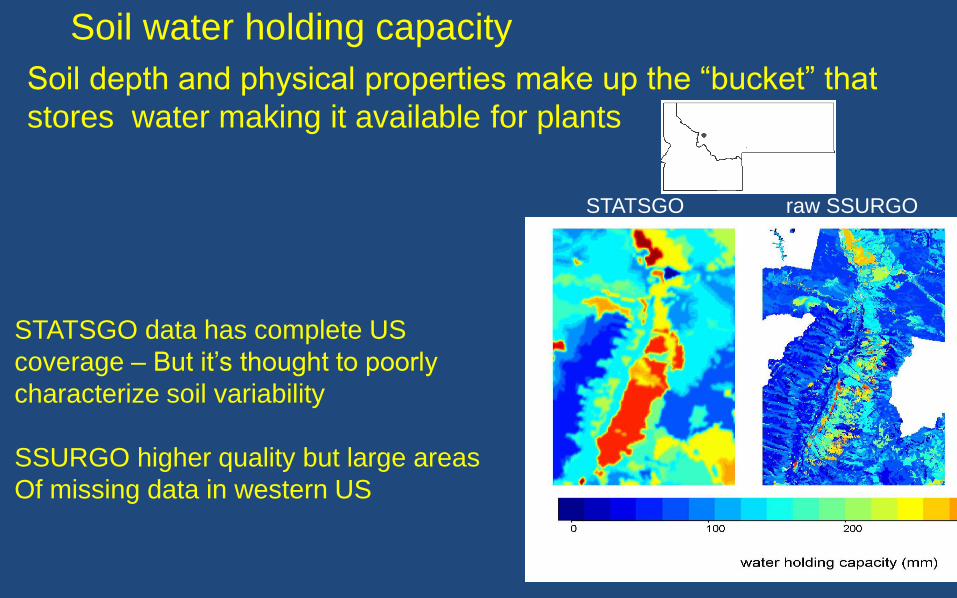
Soil water holding capacity
STATSGO data has complete US
coverage – But it’s thought to poorly
characterize soil variability
SSURGO higher quality but large areas
Of missing data in western US
STATSGO raw SSURGO
Soil depth and physical properties make up the “bucket” that
stores water making it available for plants
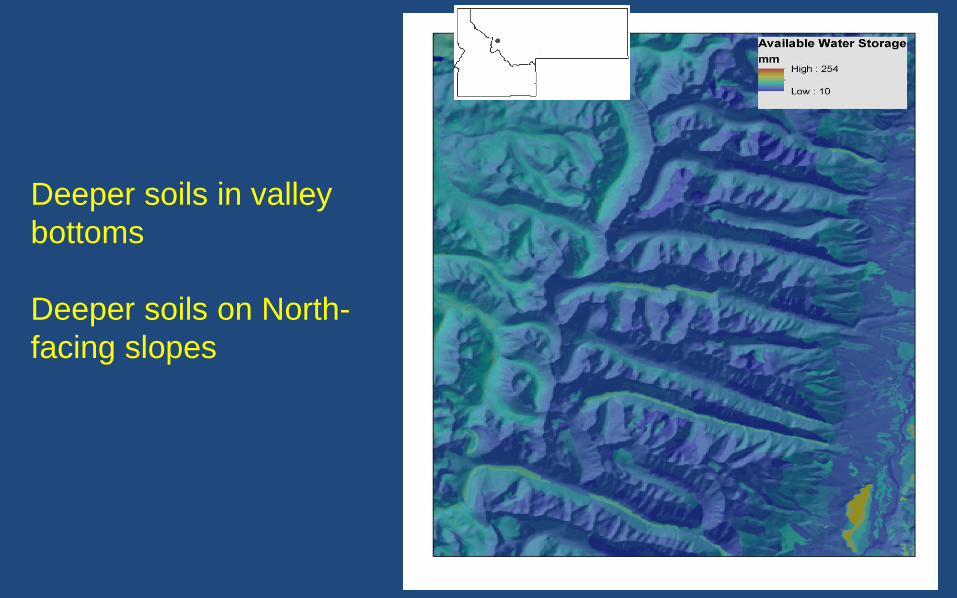
Deeper soils in valley
bottoms
Deeper soils on North-
facing slopes
| 14
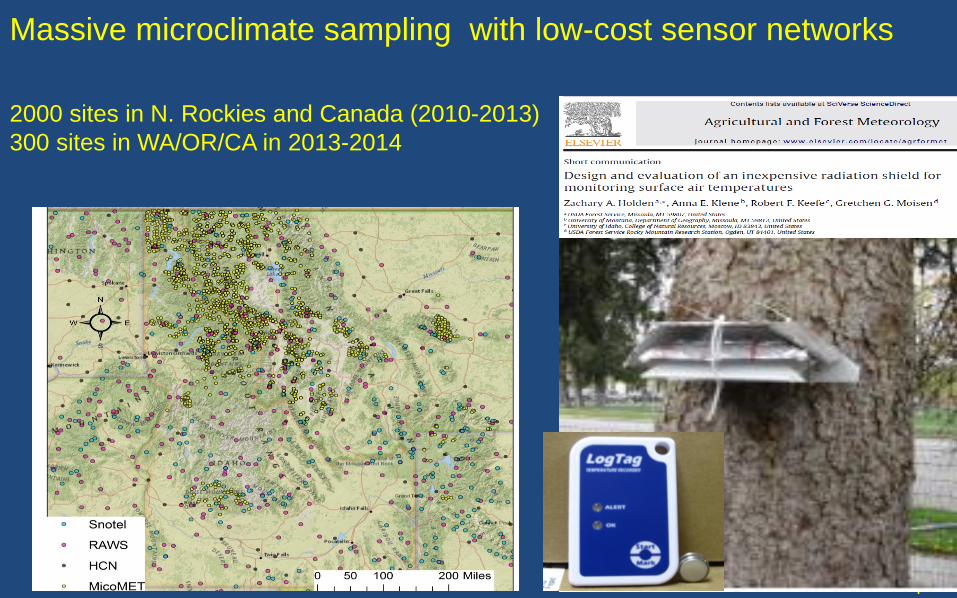
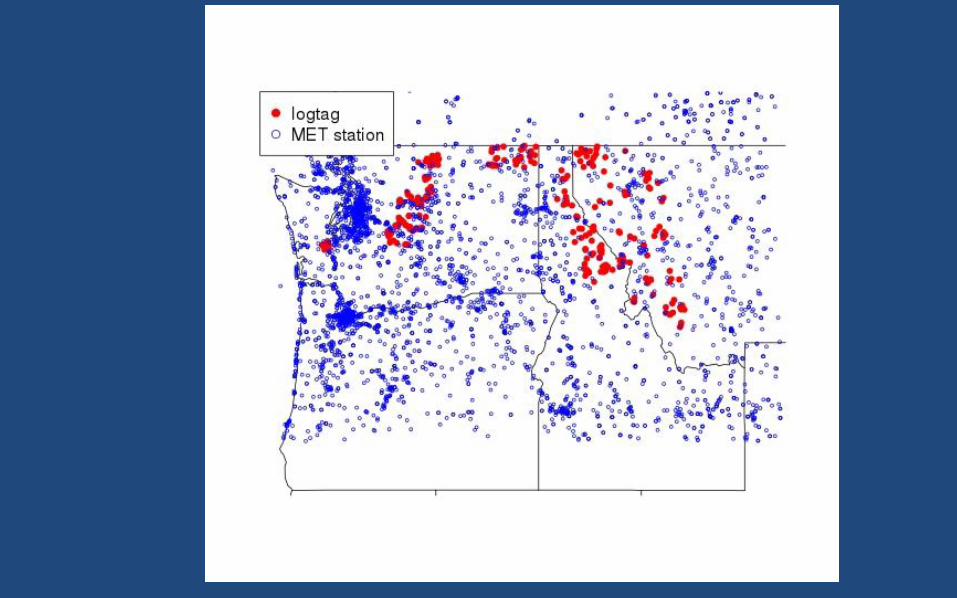
Massive microclimate sampling with low-cost sensor networks
2000 sites in N. Rockies and Canada (2010-2013)
300 sites in WA/OR/CA in 2013-2014

16
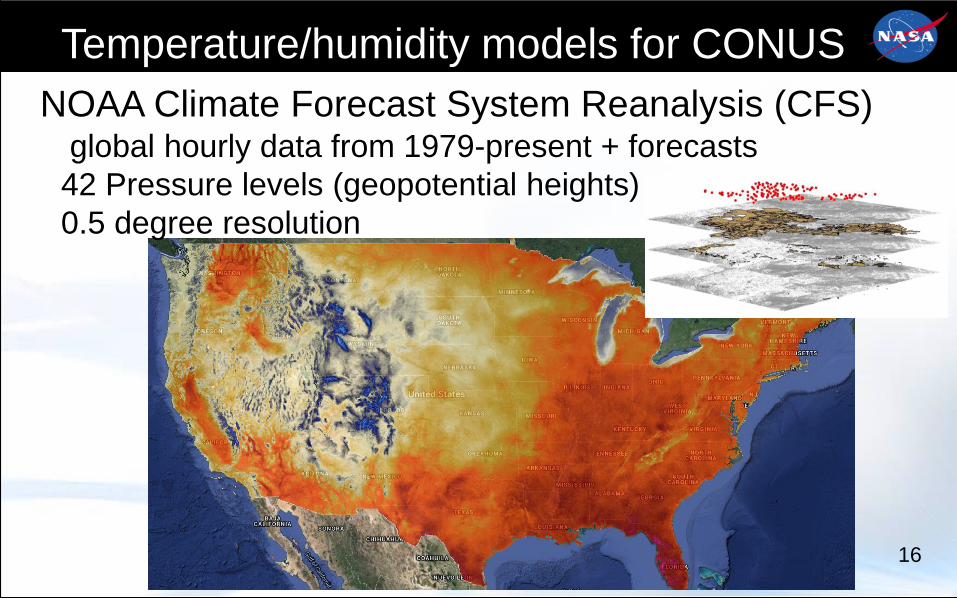
Temperature/humidity models for CONUS
NOAA Climate Forecast System Reanalysis (CFS) global hourly data from 1979-present + forecasts
42 Pressure levels (geopotential heights)
0.5 degree resolution

Daily cloud/shade corrected radiation (1979-present) Covariate in maximum temperature model
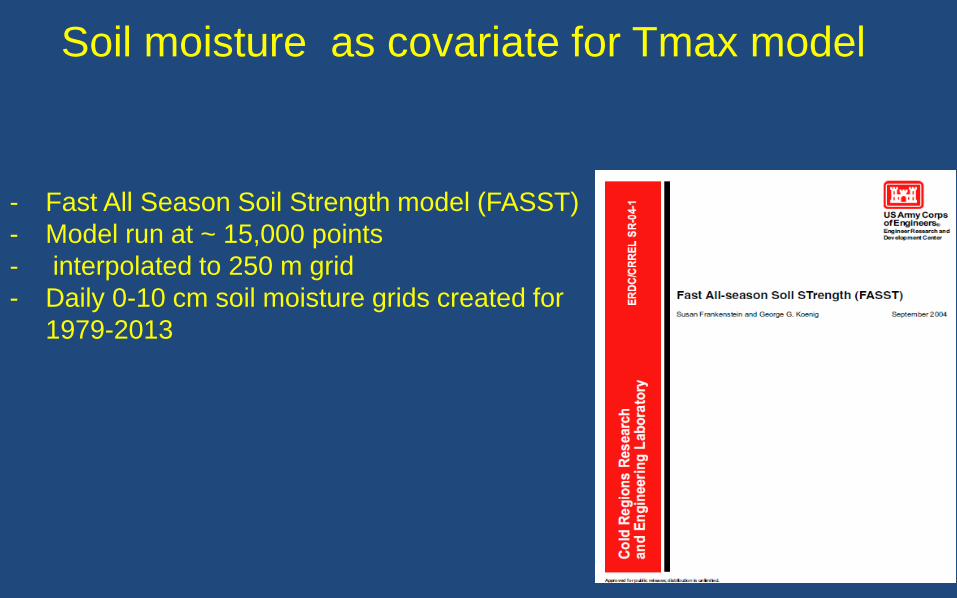
- Fast All Season Soil Strength model (FASST)
- Model run at ~ 15,000 points
- interpolated to 250 m grid
- Daily 0-10 cm soil moisture grids created for
1979-2013
Soil moisture as covariate for Tmax model
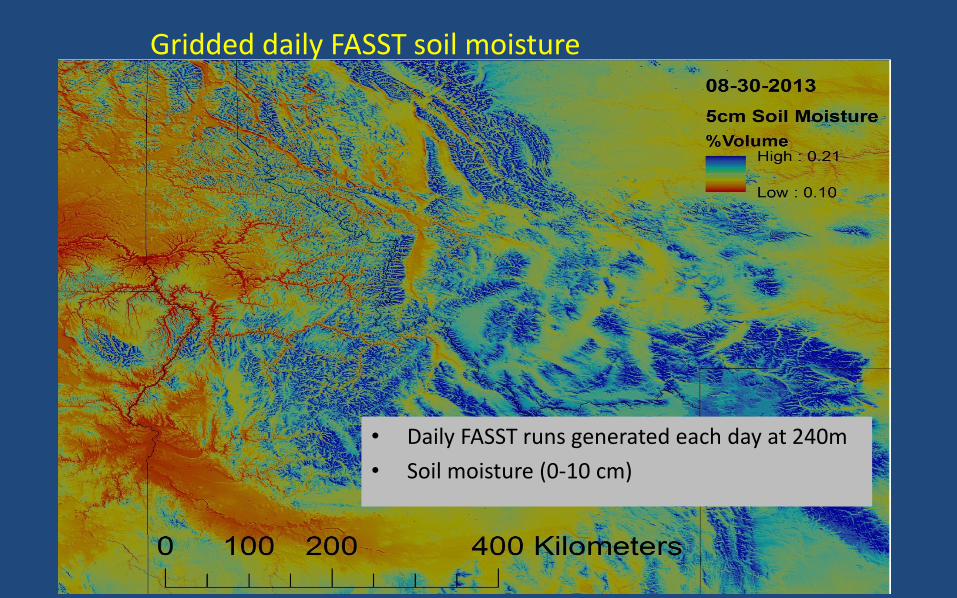
• Daily FASST runs generated each day at 240m
• Soil moisture (0-10 cm)
Gridded daily FASST soil moisture
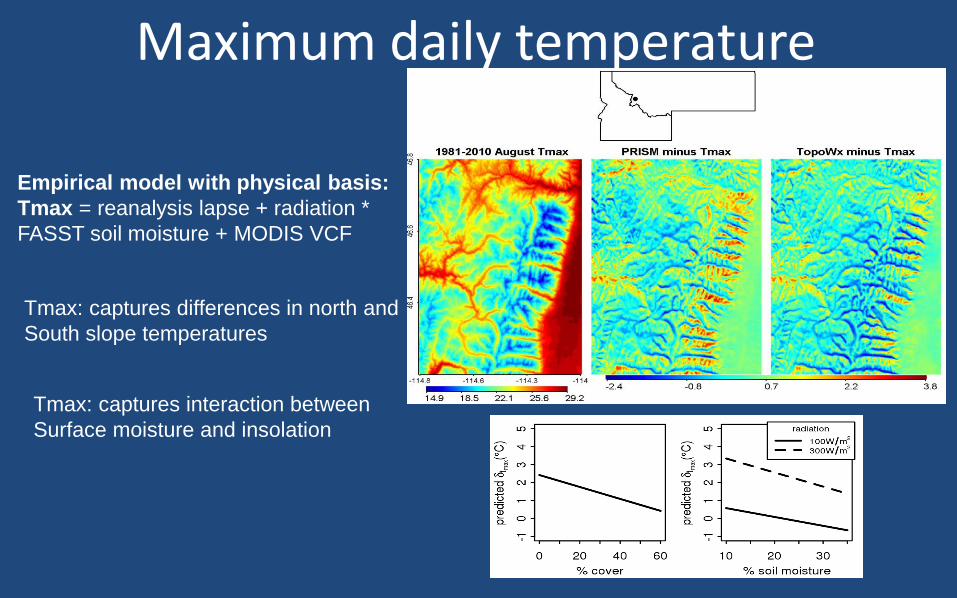
Maximum daily temperature
Empirical model with physical basis:
Tmax = reanalysis lapse + radiation *
FASST soil moisture + MODIS VCF
Tmax: captures interaction between
Surface moisture and insolation
Tmax: captures differences in north and
South slope temperatures
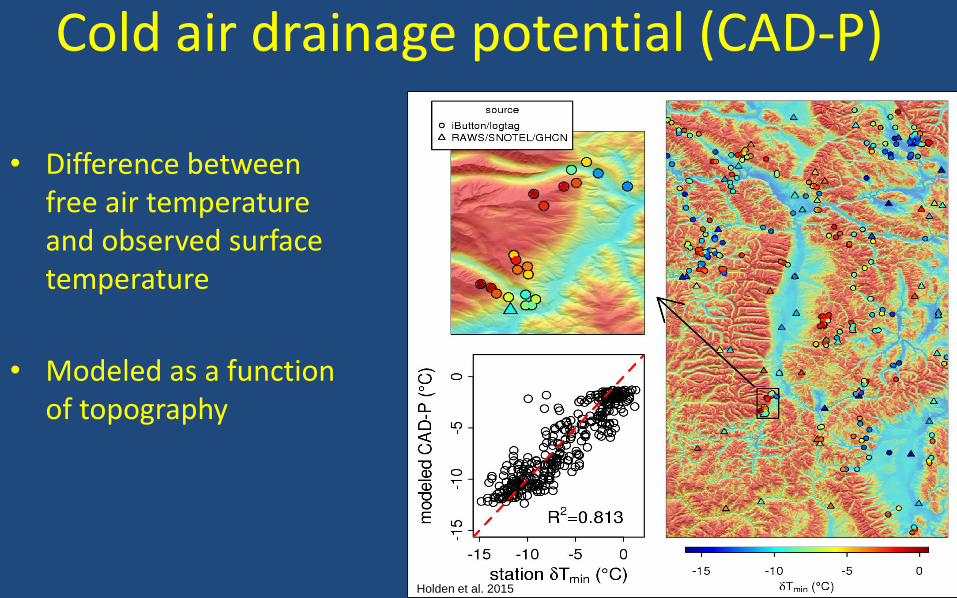
Cold air drainage potential (CAD-P)
• Difference between free air temperature and observed surface temperature
• Modeled as a function of topography
21
Holden et al. 2015

22
Cold Air Drainage potential model Difference between free air temperature (NARR) and sensor observations
Modeled as a function of terrain covariates
23
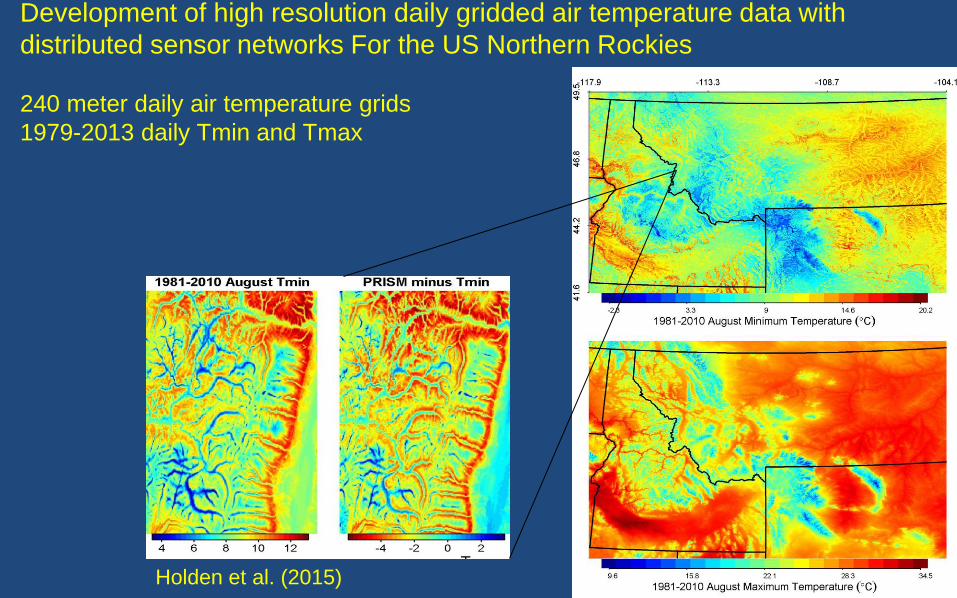
Development of high resolution daily gridded air temperature data with
distributed sensor networks For the US Northern Rockies
240 meter daily air temperature grids
1979-2013 daily Tmin and Tmax
Holden et al. (2015)
| 24
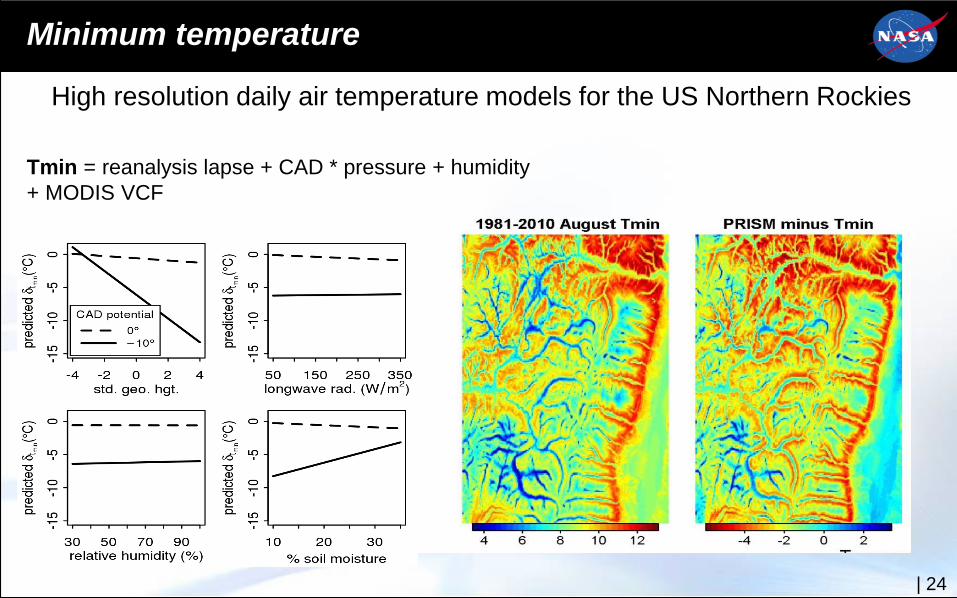
High resolution daily air temperature models for the US Northern Rockies
Tmin = reanalysis lapse + CAD * pressure + humidity
+ MODIS VCF
Minimum temperature
25
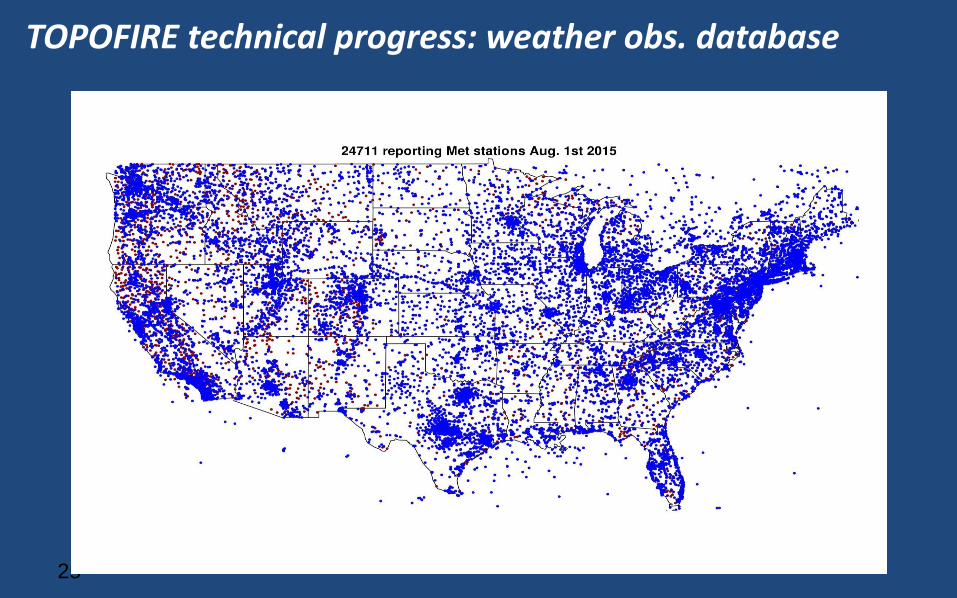
TOPOFIRE weather obs database
TOPOFIRE technical progress: weather obs. database

27
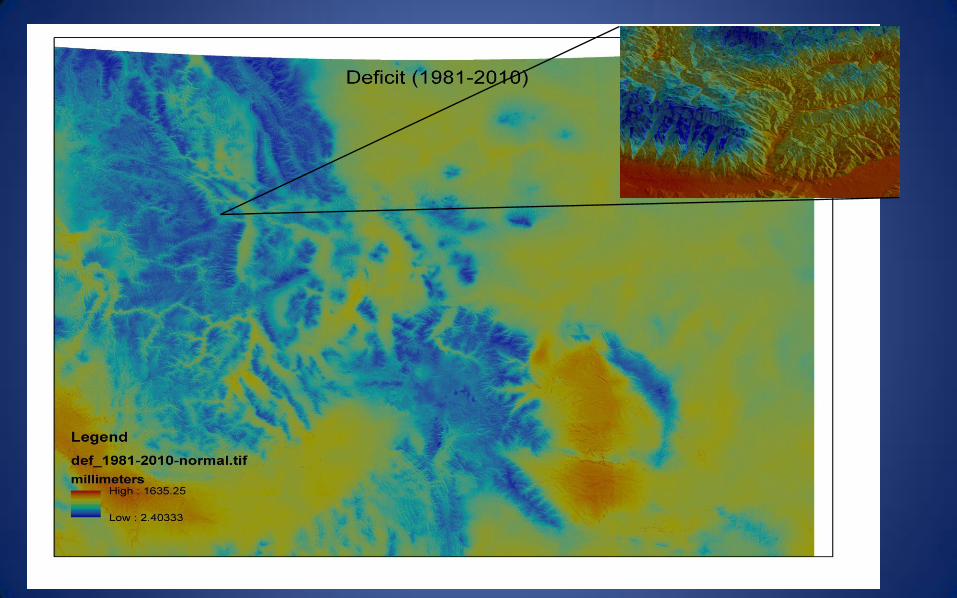
Daily evapotranspiration and soil moisture (1979-present)
Daily Penman-Monteith evapotranspiration
-250 m resolution, including solar radiation
-Strong aspect differences/drier south facing slopes

28
Daily snow accumulation and melt model (1979-present)

29
Daily Minimum/Maximum air temperature (2000-present)
30
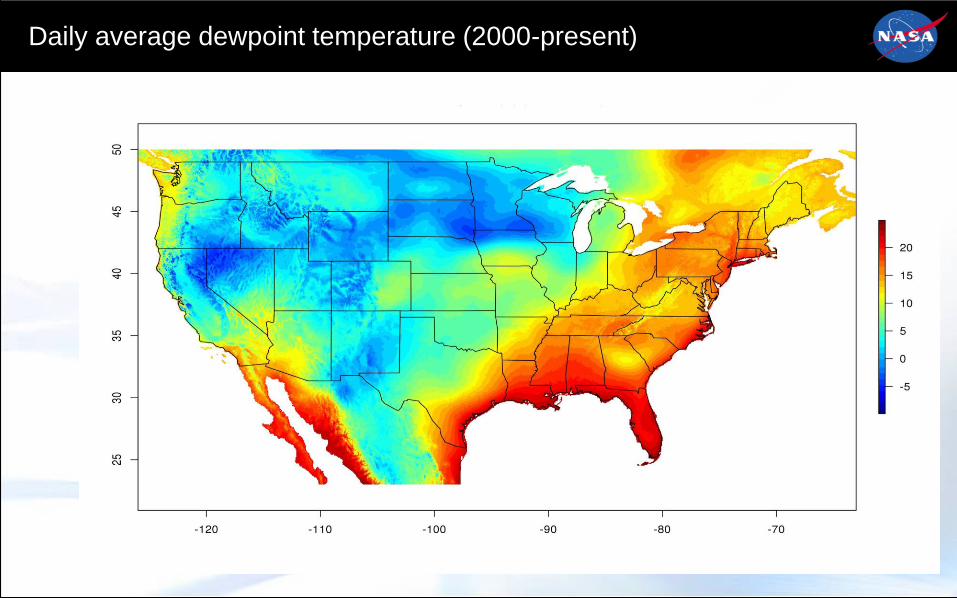
Daily average dewpoint temperature (2000-present)

| 31
Spatially complete maps of soil properties (gSSURGO)
Imputation of missing SSURGO data using terrain and satellite data
Deeper soils on
Shaded slopes
shallow soils on
steep slopes
Deeper soils in areas
of local accumulation
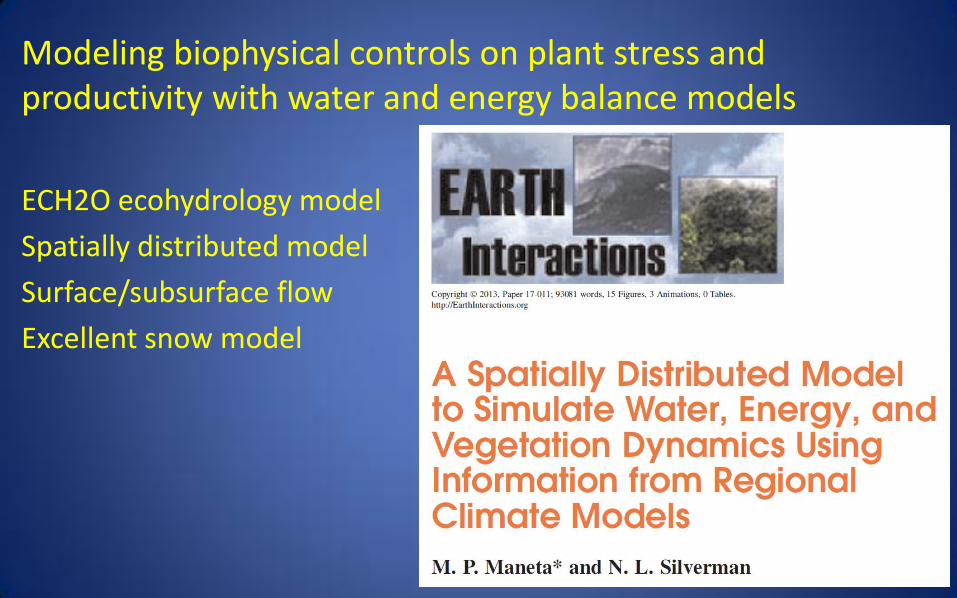
Modeling biophysical controls on plant stress and productivity with water and energy balance models
ECH2O ecohydrology model
Spatially distributed model
Surface/subsurface flow
Excellent snow model
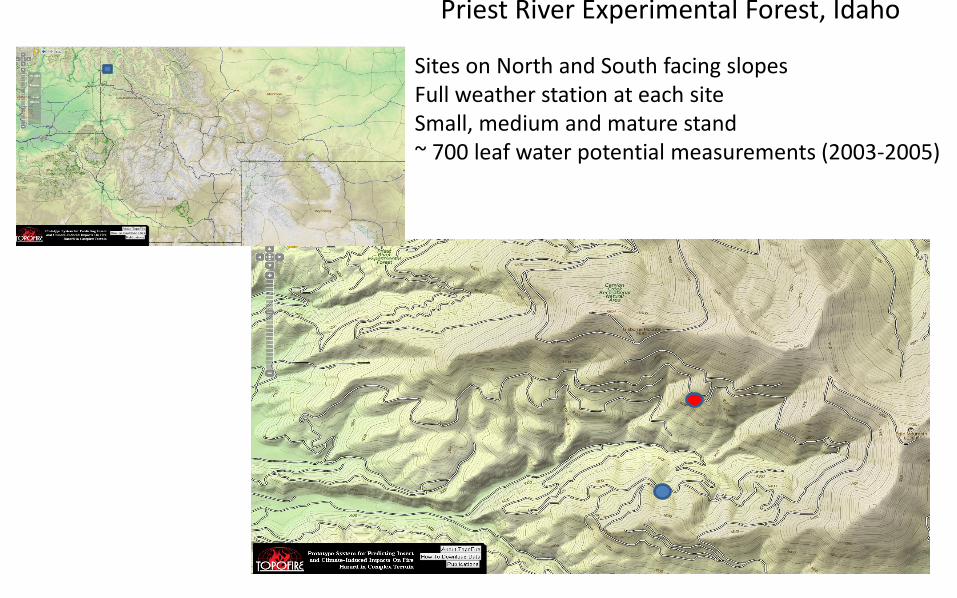
Priest River Experimental Forest, Idaho
Sites on North and South facing slopes Full weather station at each site Small, medium and mature stand ~ 700 leaf water potential measurements (2003-2005)
Empirical modeling of Leaf Water Potential (Psi)
• LWP depends on supply (soil moisture) and demand (vapor pressure deficit)
• Under high demand (high temperature, low RH) trees close stomates/minimize water loss
• Low soil moistures increase resistance; more difficult to move water from soil to atmosphere
• Species-specific responses
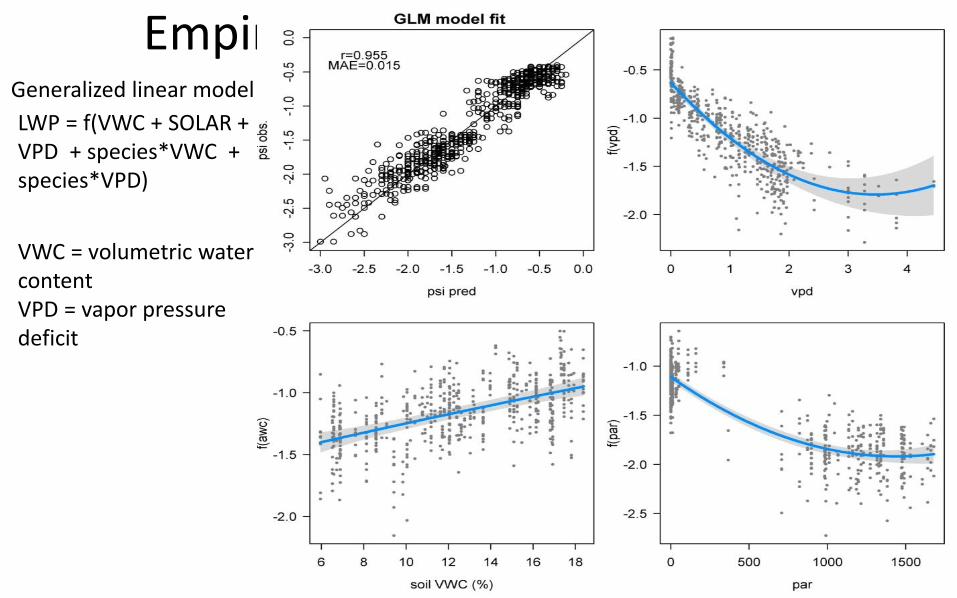
Empirical modeling of LWP
LWP = f(VWC + SOLAR + VPD + species*VWC + species*VPD)
Generalized linear model
VWC = volumetric water content VPD = vapor pressure deficit
Boosted regression tree fit
r= 0.98
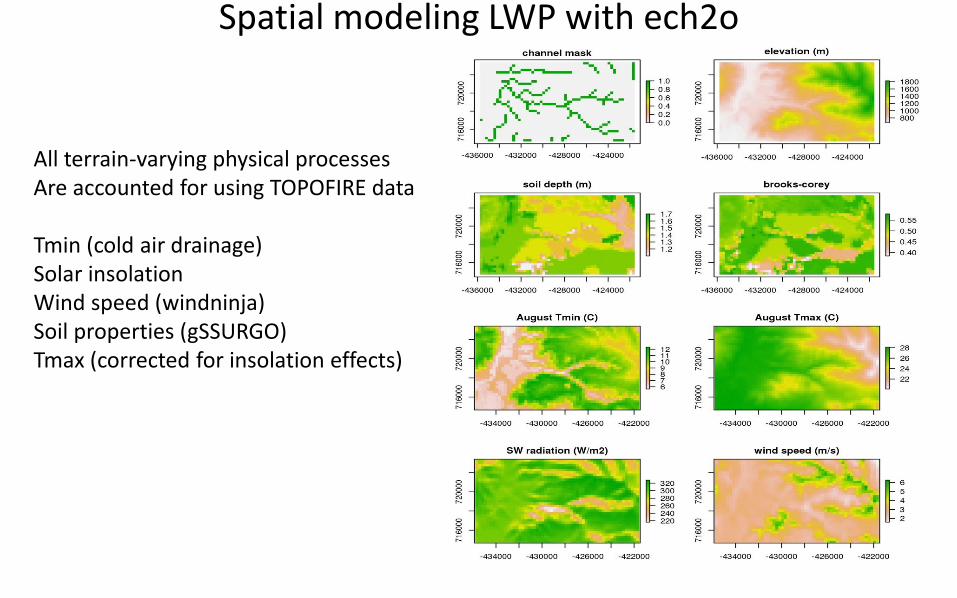
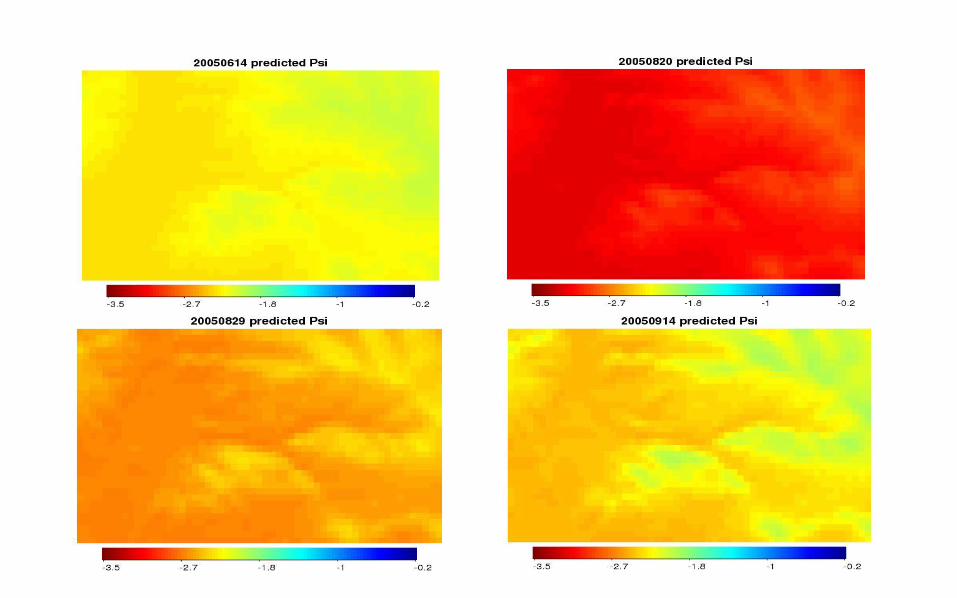
Spatial modeling LWP with ech2o
All terrain-varying physical processes Are accounted for using TOPOFIRE data Tmin (cold air drainage) Solar insolation Wind speed (windninja) Soil properties (gSSURGO) Tmax (corrected for insolation effects)

Soil moisture modeling with ech2o

ECH2O coupled with 3P-G
Models carbon assimilation in
roots and above ground
Tracks stand age and LAI
Potentially powerful tool for
understanding site productivity
Climatic influences on tree
growth, stress, mortality

summary
• Rapid progress developing topographically resolved temperature/humdity gridded data
• Preliminary PNW datasets should be completed by August 2016
• Coupling these datasets with hydrologic models could be useful for characterizing physical controls on tree occurrence/growth
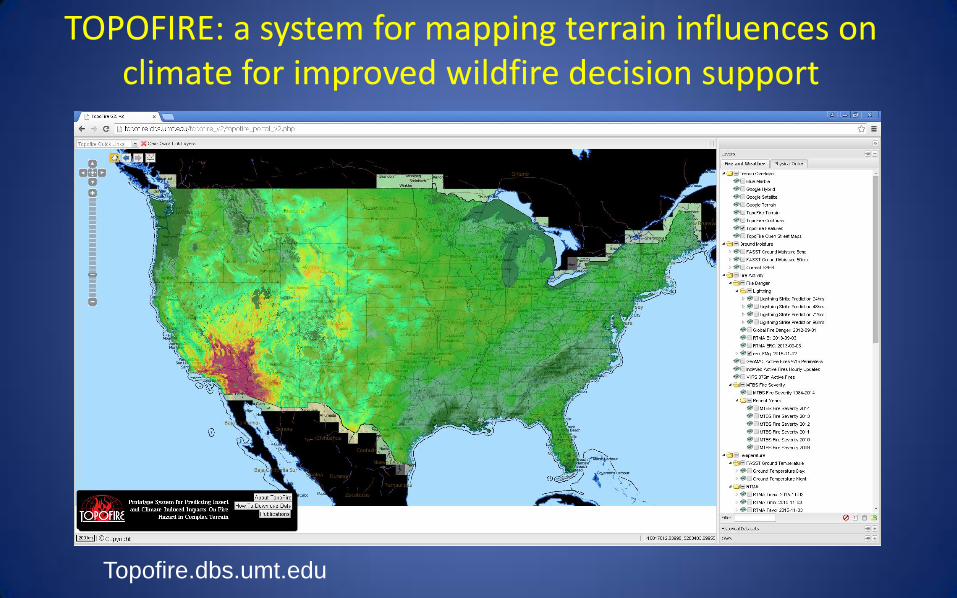
TOPOFIRE: a system for mapping terrain influences on climate for improved wildfire decision support
Topofire.dbs.umt.edu

questions