Embed Size (px)
Citation preview
November 2007
Progress ChartYour Health and Human Ser vices
Depar tment of Health and Human Ser vices

Your Health and Human Services: Progress Chart November 2007 �
Published by Shared Services, Department of Health and Human Services, Tasmania.
© Copyright State of Tasmania, Department of Health and Human Services, 2007.
This publication is copyright. No part may be reproduced by any process except in accordance with the provisions of the Copyright Act 1968.
Published on www.dhhs.tas.gov.auNovember 2007 ISSN 1823-3015
Your Health and Human Services: Progress Chart November 2007 �
Progress ChartOverall, 2007 has been a year of gradual improvement in many areas of the health and
human services portfolio, although there is also evidence of increasing demand which is
putting pressure on our system.
Those pressures reinforce the importance of the reforms that I have been progressing
this year, in particular Tasmania’s Health Plan. Significant planning and initiatives in
disability services, mental health, child protection, public housing, alcohol and drug
services and early intervention and support for families are also being undertaken.
The September quarter Progress Chart shows significant improvements in some key
areas of performance across the Department of Health and Human Services, including
child protection where the unallocated list is down by over 50 per cent on last year.
Public housing waiting lists have also decreased slightly.
There has been a drop in the waiting list for dentures, although the need for emergency
dental care has increased.
The Progress Chart shows continuing pressures on our hospitals in particular, with
increases in waiting lists statewide. The employment of an extra 75 nurses across our
acute care hospitals should help to re-open beds and theatres, enabling more patients
to have their operations. It is encouraging to see the median waiting time for elective
surgery trending downwards.
As we approach the festive season, I would like to wish you all the very best for a happy,
healthy and safe Christmas and New Year.
Lara Giddings MPMinister for Health and Human Services
Your Health and Human Services
Lara Giddings, MP
Your Health and Human Services: Progress Chart November 2007 �
1 95
7
8 05
3
10 0
22
8 53
19 96
1
3 93
3
9 06
1
10 7
91
4 03
9
8 92
311 4
08
3 98
9
0
2 000
4 000
6 000
8 000
10 000
12 000
RHH LGH NWRH
(no.
)2004 2005 2006 2007
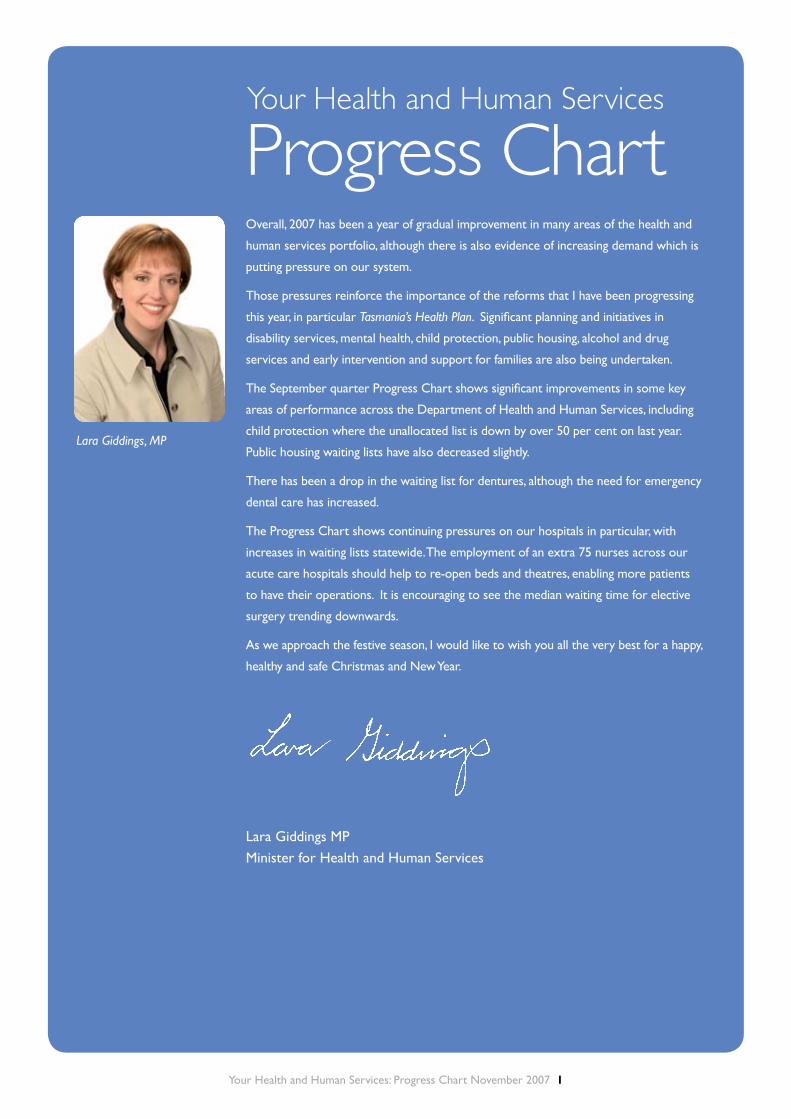
What is the overall level of activity in our hospitals?
A separation refers to an episode of admitted patient care. Raw separations are not adjusted for the complexity of the episode of care and represent each individual episode of care in a given period.
Overall, the number of raw separations continues to increase at a steady rate. The total number of raw separations for our state’s public hospitals increased by 1.8 per cent in the three months ending 30 September 2007 when compared with the same period in 2006. The RHH increased its activity levels by 5.7 per cent over this period.
Weighted separations show the level and complexity of the work done in public hospitals, by combining two measures: the number of times people come into hospital and how sick people are when they come into hospital.
The number of weighted separations in our hospitals has continued to increase in recent years, with a 3 per cent increase for the three months to 30 September 2007 when compared to the same period in 2006. The increase in activity reflects the increasing demand for acute care services.
The number of weighted separations at the RHH increased by 3.2 per cent and at the LGH by 4.7 per cent over the period.
Figure 1: Admitted Patients – Number of Raw Separations (for the 3 months ending September)
Figure 2: Admitted Patients – Number of Weighted Separations (for the 3 months ending September)
2 35
4
7 19
8
12 5
48
4 62
5
7 72
0
12 5
40
4 79
3
7 96
2
12 6
65
4 77
7
8 34
0
13 0
71
0
2 000
4 000
6 000
8 000
10 000
12 000
14 000
RHH LGH NWRH
(no.
)
2004 2005 2006 2007
Your Health and Human Services: Progress Chart November 2007 �
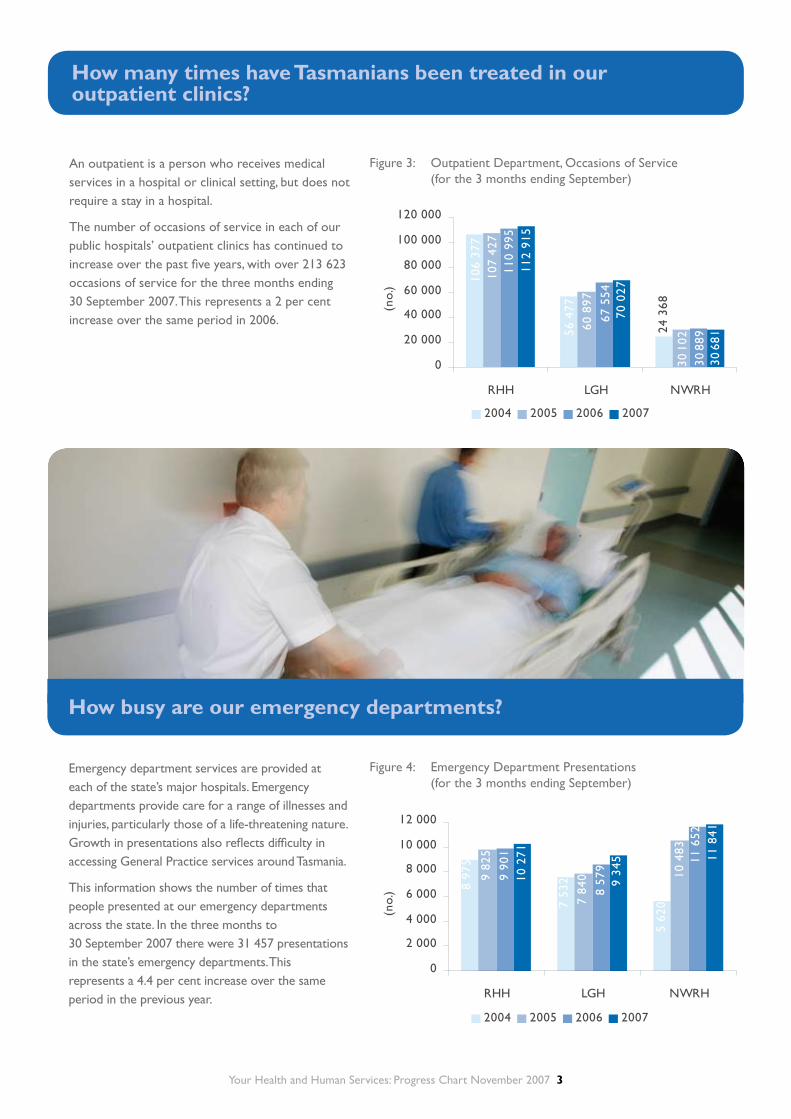
Emergency department services are provided at each of the state’s major hospitals. Emergency departments provide care for a range of illnesses and injuries, particularly those of a life-threatening nature. Growth in presentations also reflects difficulty in accessing General Practice services around Tasmania.
This information shows the number of times that people presented at our emergency departments across the state. In the three months to 30 September 2007 there were 31 457 presentations in the state’s emergency departments. This represents a 4.4 per cent increase over the same period in the previous year.
How many times have Tasmanians been treated in our outpatient clinics?
An outpatient is a person who receives medical services in a hospital or clinical setting, but does not require a stay in a hospital.
The number of occasions of service in each of our public hospitals’ outpatient clinics has continued to increase over the past five years, with over 213 623 occasions of service for the three months ending 30 September 2007. This represents a 2 per cent increase over the same period in 2006.
Figure 3: Outpatient Department, Occasions of Service (for the 3 months ending September)
Figure 4: Emergency Department Presentations (for the 3 months ending September)
How busy are our emergency departments?
7 53
28 97
5
5 62
07 84
09 82
5
10 4
83
8 57
9
9 90
1 11 6
52
9 34
5
10 2
71 11 8
41
0
2 000
4 000
6 000
8 000
10 000
12 000
RHH LGH NWRH
(no.
)
2004 2005 2006 2007
56 4
77
106
377
24 3
68
60 8
97
107
427
30 1
02
67 5
54
110
995
30 8
8930
681
70 0
27
112
915
0
20 000
40 000
60 000
80 000
100 000
120 000
RHH LGH NWRH(n
o.)
2004 2005 2006 2007

Your Health and Human Services: Progress Chart November 2007 �
What is the rate of hospital readmissions?
This shows the percentage of people whose readmission to hospital within 28 days of discharge was unplanned and unexpected. This could be due to a relapse or a complication resulting from the illness for which the patient was initially admitted.
Tasmania’s unplanned readmission rate of 2.2 per cent for the three months ending 30 September 2007 remains below the Australian average (2004) of 2.8 per cent for public hospitals (Source: ACHS Clinical Indicators Report for Australia and New Zealand 1998-2004).
The RHH has recently adopted a new counting methodology for this measure to align with current industry reporting. The rate for the three months ending 30 September 2007 is therefore not directly comparable to the previous figures.
What percentage of patients is seen within recommended timeframes in our emergency departments?
Australian Triage Scale Category 2 patients are those who require emergency treatment for very severe pain or imminently life-threatening or time-critical treatment. The Australasian College for Emergency Medicine has set a target of 80 per cent of Category 2 patients to be seen within 10 minutes.
For the three months ending 30 September 2007, the percentage of Category 2 patients seen statewide within the recommended time frames remained stable at 67.5 per cent compared to the same period in the previous year. The RHH increased from 60.8 per cent to 65.7 per cent, while the LGH decreased from 68.6 per cent to 63.7 per cent. The NWRH decreased from 84.2 per cent to 77.8 per cent, but still exceeds the most recent Australian average (2005-06) of 75 per cent (Source: Australian Hospital Statistics 2005-06).
These fluctuations reflect the difficulties experienced by Departments of Emergency Medicine in meeting the increasing demand for services.
Figure 5: Patients who were seen within the Recommended Timeframe for DEM Australian Triage Scale Category 2 (for the 3 months ending September)
Figure 6: Unplanned Readmissions Within 28 Days (for the 3 months ending September)
73.9
78.4
70.7
69.1
72.8
71.1
68.6
60.8
84.2
63.7
65.7 77
.8
0
20
40
60
80
100
RHH LGH NWRH(%
)
2004 2005 2006 2007
0.4
0.8
2.4
0.5
1.4
0.4
0.50.
8
0.8
0.2
3.5
1.8
0.0
0.6
1.2
1.8
2.4
3.0
3.6
RHH LGH NWRH
(%)
2004 2005 2006 2007
Your Health and Human Services: Progress Chart November 2007 �
512
1 15
1
1 70
8
1 24
0
1 31
51 56
2
1 15
1
1 09
7
1 65
6
9631
2531
528
0
500
1,000
1,500
2,000
RHH LGH NWRH(n
o.)
2004 2005 2006 2007
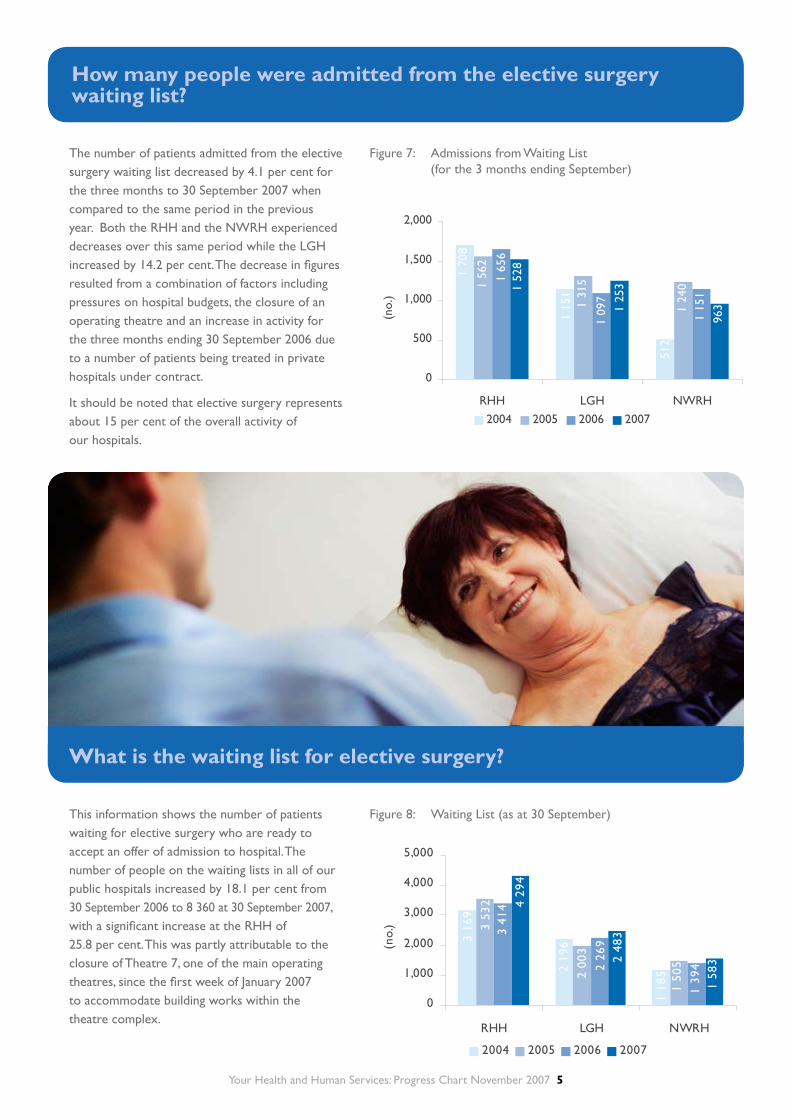
How many people were admitted from the elective surgery waiting list?
Figure 7: Admissions from Waiting List (for the 3 months ending September)
This information shows the number of patients waiting for elective surgery who are ready to accept an offer of admission to hospital. The number of people on the waiting lists in all of our public hospitals increased by 18.1 per cent from 30 September 2006 to 8 360 at 30 September 2007, with a significant increase at the RHH of 25.8 per cent. This was partly attributable to the closure of Theatre 7, one of the main operating theatres, since the first week of January 2007 to accommodate building works within the theatre complex.
Figure 8: Waiting List (as at 30 September)
What is the waiting list for elective surgery?
The number of patients admitted from the elective surgery waiting list decreased by 4.1 per cent for the three months to 30 September 2007 when compared to the same period in the previous year. Both the RHH and the NWRH experienced decreases over this same period while the LGH increased by 14.2 per cent. The decrease in figures resulted from a combination of factors including pressures on hospital budgets, the closure of an operating theatre and an increase in activity for the three months ending 30 September 2006 due to a number of patients being treated in private hospitals under contract.
It should be noted that elective surgery represents about 15 per cent of the overall activity of our hospitals.
3 16
9
2 19
6
1 18
5
3 53
2
2 00
3
1 50
5
3 41
4
2 26
9
1 39
4
4 29
4
2 48
3
1 58
3
0
1,000
2,000
3,000
4,000
5,000
RHH LGH NWRH
(no.
)
2004 2005 2006 2007
Your Health and Human Services: Progress Chart November 2007 �
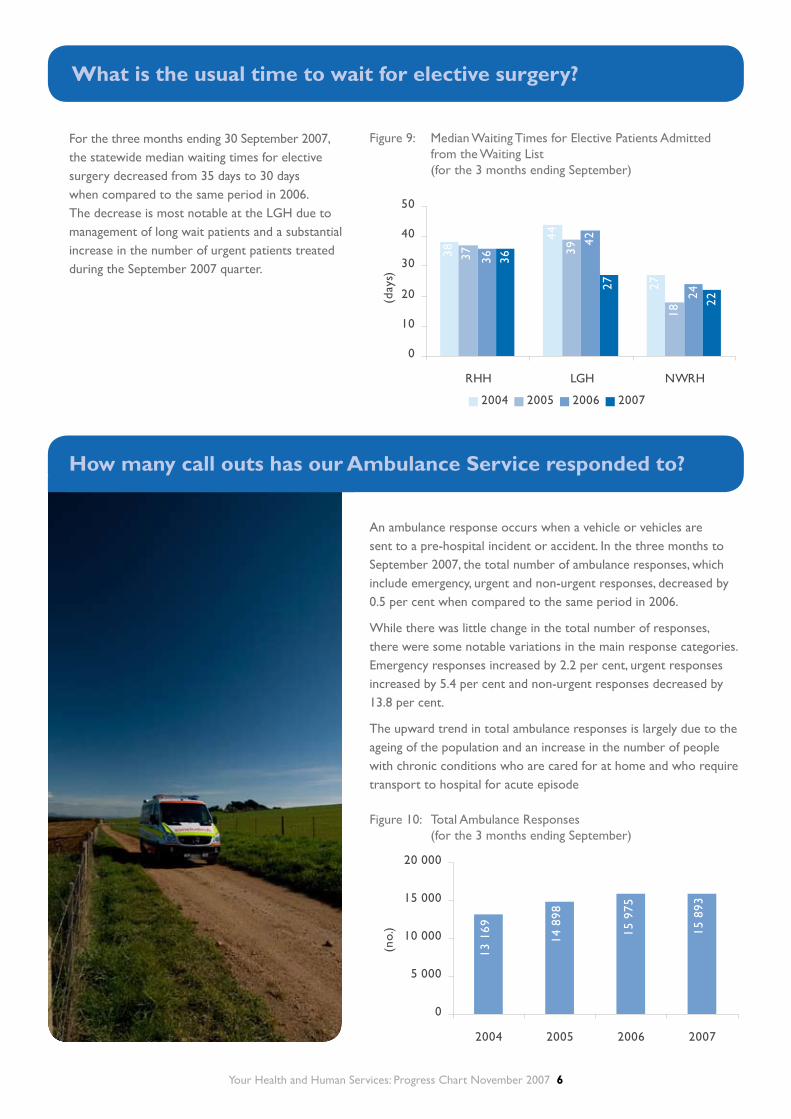
How many call outs has our Ambulance Service responded to?
An ambulance response occurs when a vehicle or vehicles are sent to a pre-hospital incident or accident. In the three months to September 2007, the total number of ambulance responses, which include emergency, urgent and non-urgent responses, decreased by 0.5 per cent when compared to the same period in 2006.
While there was little change in the total number of responses, there were some notable variations in the main response categories. Emergency responses increased by 2.2 per cent, urgent responses increased by 5.4 per cent and non-urgent responses decreased by 13.8 per cent.
The upward trend in total ambulance responses is largely due to the ageing of the population and an increase in the number of people with chronic conditions who are cared for at home and who require transport to hospital for acute episode
What is the usual time to wait for elective surgery?
For the three months ending 30 September 2007, the statewide median waiting times for elective surgery decreased from 35 days to 30 days when compared to the same period in 2006. The decrease is most notable at the LGH due to management of long wait patients and a substantial increase in the number of urgent patients treated during the September 2007 quarter.
Figure 9: Median Waiting Times for Elective Patients Admitted from the Waiting List (for the 3 months ending September)
Figure 10: Total Ambulance Responses (for the 3 months ending September)
27
44
38
18
3937
24
42
36
22
27
36
0
10
20
30
40
50
RHH LGH NWRH(d
ays)
2004 2005 2006 2007
13 1
69 15 9
75
14 8
98
15 8
93
0
5 000
10 000
15 000
20 000
2004 2005 2006 2007
(no.
)

Your Health and Human Services: Progress Chart November 2007 �
How many people access community palliative care services?
This indicator provides a measure of the overall level of activity, which includes clients assessed and admitted to the community (non-inpatient) Palliative Care Service.
In the three months to 30 September 2007 there was a 13.6 per cent increase in the number of clients accessing the service compared to the same period in 2006.
How quickly does our Ambulance Service respond to calls?
Emergency response time is the period from when the 000 call is received until the vehicle arrives at the scene. The median response time is the time within which 50 per cent of emergency cases are responded to. While Tasmania appears to have a larger response time than other states and territories, this data is not strictly comparable as some do not count the call answering time. Tasmania also has the largest proportion of its population dispersed throughout rural areas (almost twice the national average).
Median response times for the more populated areas of Tasmania such as Hobart (9 minutes), Launceston (10 minutes), Devonport (7 minutes) and Burnie (8 minutes) are similar to many urban areas of other states and territories.
Emergency response times have remained consistent over the past few years and extra crewing allocated by government has been aimed at ensuring response performance is maintained.
Figure 11: Ambulance Emergency Response Times (for the 3 months ending September)
Figure 12: Palliative Care - Clients Accessing the Service (for the 3 months ending September)
10.1 10.6
10.4
10.5
0.0
2.0
4.0
6.0
8.0
10.0
12.0
2004 2005 2006 2007(m
inut
es)
1 28
4
9661 11
7
1 09
7
0
400
800
1 200
1 600
2004 2005 2006 2007
(no.
)
Your Health and Human Services: Progress Chart November 2007 �
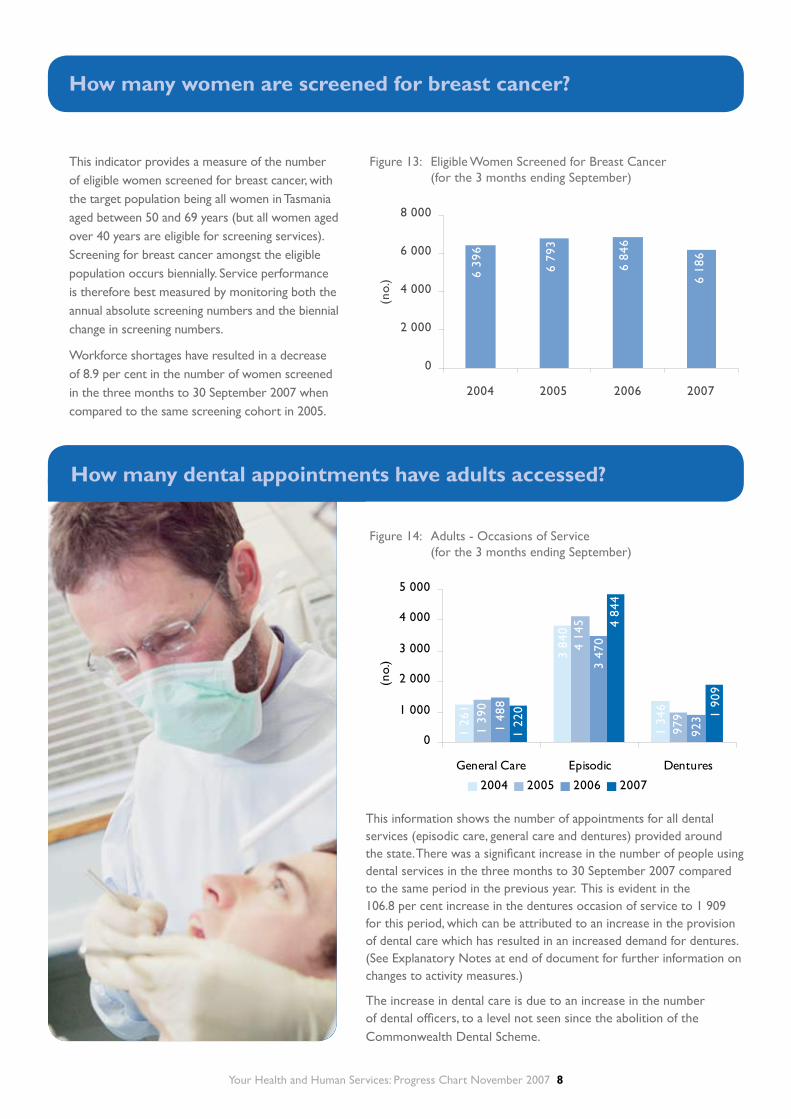
This information shows the number of appointments for all dental services (episodic care, general care and dentures) provided around the state. There was a significant increase in the number of people using dental services in the three months to 30 September 2007 compared to the same period in the previous year. This is evident in the 106.8 per cent increase in the dentures occasion of service to 1 909 for this period, which can be attributed to an increase in the provision of dental care which has resulted in an increased demand for dentures. (See Explanatory Notes at end of document for further information on changes to activity measures.)
The increase in dental care is due to an increase in the number of dental officers, to a level not seen since the abolition of the Commonwealth Dental Scheme.
How many women are screened for breast cancer?
This indicator provides a measure of the number of eligible women screened for breast cancer, with the target population being all women in Tasmania aged between 50 and 69 years (but all women aged over 40 years are eligible for screening services). Screening for breast cancer amongst the eligible population occurs biennially. Service performance is therefore best measured by monitoring both the annual absolute screening numbers and the biennial change in screening numbers.
Workforce shortages have resulted in a decrease of 8.9 per cent in the number of women screened in the three months to 30 September 2007 when compared to the same screening cohort in 2005.
Figure 13: Eligible Women Screened for Breast Cancer (for the 3 months ending September)
Figure 14: Adults - Occasions of Service (for the 3 months ending September)
How many dental appointments have adults accessed?
6 79
3
6 84
6
6 39
6
6 18
6
0
2 000
4 000
6 000
8 000
2004 2005 2006 2007(n
o.)
1 34
6
1 26
1
3 84
0
979
1 39
0
4 14
5
923
1 48
8
3 47
0
1 90
9
1 22
0
4 84
4
0
1 000
2 000
3 000
4 000
5 000
General Care Episodic Dentures
(no.
)
2004 2005 2006 2007

Your Health and Human Services: Progress Chart November 2007 �
459 53
1
780
489
0
200
400
600
800
2004 2005 2006 2007
(no.
)
What are the waiting lists for Oral Health Services?
This indicator provides a measure of the number of people waiting for full (upper and/or lower) dentures. This does not include people who are waiting for partial dentures, as these are included in the general care waiting list. Oral Health Services uses private providers to help address denture demand.
Between June 2004 and June 2007, the number of people on the dentures waiting list decreased by 438, or 52.9 per cent, and is continuing to decrease, with a 7.9 per cent reduction in the figures between 30 September 2006 and 30 September 2007.
This indicator provides a measure of the number of adults waiting for general care oral health services. The number of adults waiting for general care has remained relatively constant.
Oral Health Services has received funding to purchase care in the private sector for those on the waiting list. Services to these clients commenced in the north-west in April 2007 with a positive effect on the waiting list in that region. Oral Health Services continues to negotiate the purchase of services in the north and south of the state and it is anticipated that these will commence in 2007-08.
How many dental appointments have children accessed?
There has been a decrease of 24.4 per cent in the number of times children accessed dental care for the three months ending 30 September 2007 compared to the same period in the previous year.
A growing national shortage of dental therapists and an ageing workforce is likely to continue to affect Oral Health Services’ capacity to see children. Oral Health Services is working in partnership with the University of Tasmania to address this issue through the development of training for oral health professionals within Tasmania.
Figure 15: Children - Occasions of Service (for the 3 months ending September)
Figure 16: Dentures – Waiting List (as at 30 September)
Figure 17: General Care (Adults) Waiting List (as at 30 September)
19 4
19
20 8
76
20 4
77
15 7
90
0
5 000
10 000
15 000
20 000
25 000
2004 2005 2006 2007
(no.
)
10 8
56
8 65
1
9 73
5
9 30
0
0
2 000
4 000
6 000
8 000
10 000
12 000
2004 2005 2006 2007
(no.
)
Your Health and Human Services: Progress Chart November 2007 �0
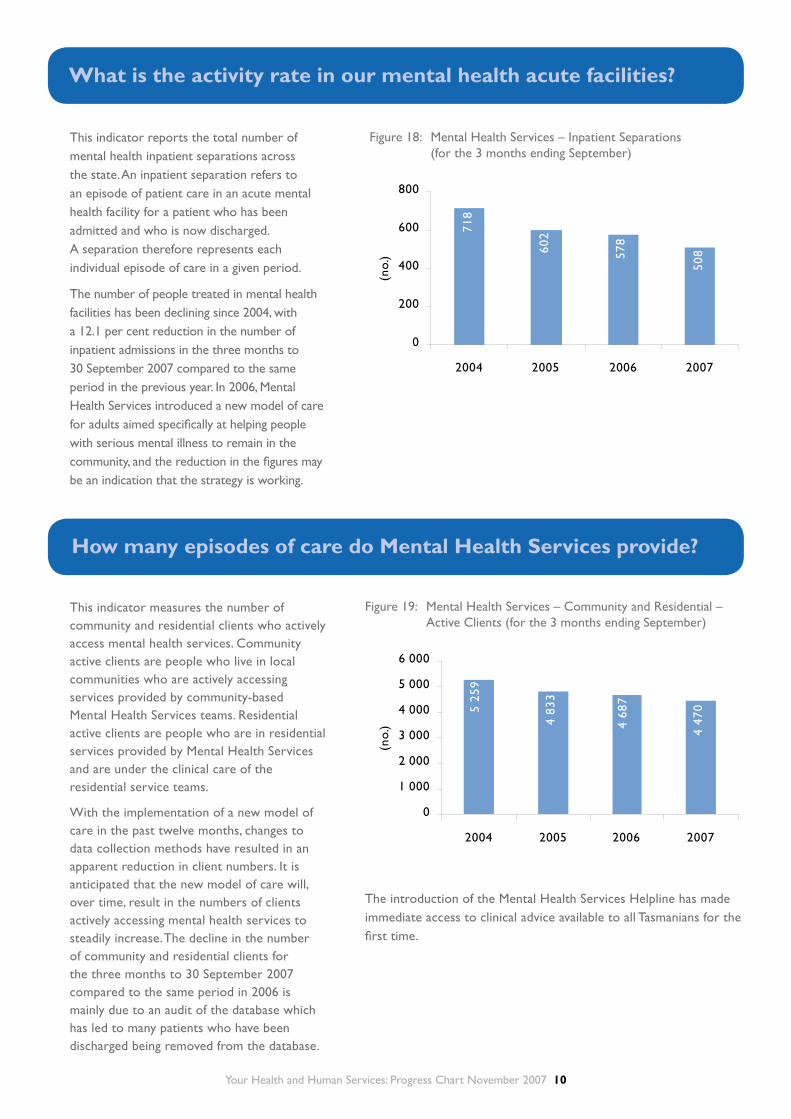
What is the activity rate in our mental health acute facilities?
This indicator reports the total number of mental health inpatient separations across the state. An inpatient separation refers to an episode of patient care in an acute mental health facility for a patient who has been admitted and who is now discharged. A separation therefore represents each individual episode of care in a given period.
The number of people treated in mental health facilities has been declining since 2004, with a 12.1 per cent reduction in the number of inpatient admissions in the three months to 30 September 2007 compared to the same period in the previous year. In 2006, Mental Health Services introduced a new model of care for adults aimed specifically at helping people with serious mental illness to remain in the community, and the reduction in the figures may be an indication that the strategy is working.
How many episodes of care do Mental Health Services provide?
This indicator measures the number of community and residential clients who actively access mental health services. Community active clients are people who live in local communities who are actively accessing services provided by community-based Mental Health Services teams. Residential active clients are people who are in residential services provided by Mental Health Services and are under the clinical care of the residential service teams.
With the implementation of a new model of care in the past twelve months, changes to data collection methods have resulted in an apparent reduction in client numbers. It is anticipated that the new model of care will, over time, result in the numbers of clients actively accessing mental health services to steadily increase. The decline in the number of community and residential clients for the three months to 30 September 2007 compared to the same period in 2006 is mainly due to an audit of the database which has led to many patients who have been discharged being removed from the database.
Figure 18: Mental Health Services – Inpatient Separations (for the 3 months ending September)
The introduction of the Mental Health Services Helpline has made immediate access to clinical advice available to all Tasmanians for the first time.
Figure 19: Mental Health Services – Community and Residential – Active Clients (for the 3 months ending September)
508
718
578
602
0
200
400
600
800
2004 2005 2006 2007(n
o.)
4 83
3
4 68
7
5 25
9
4 47
0
0
1 000
2 000
3 000
4 000
5 000
6 000
2004 2005 2006 2007
(no.
)
Your Health and Human Services: Progress Chart November 2007 ��
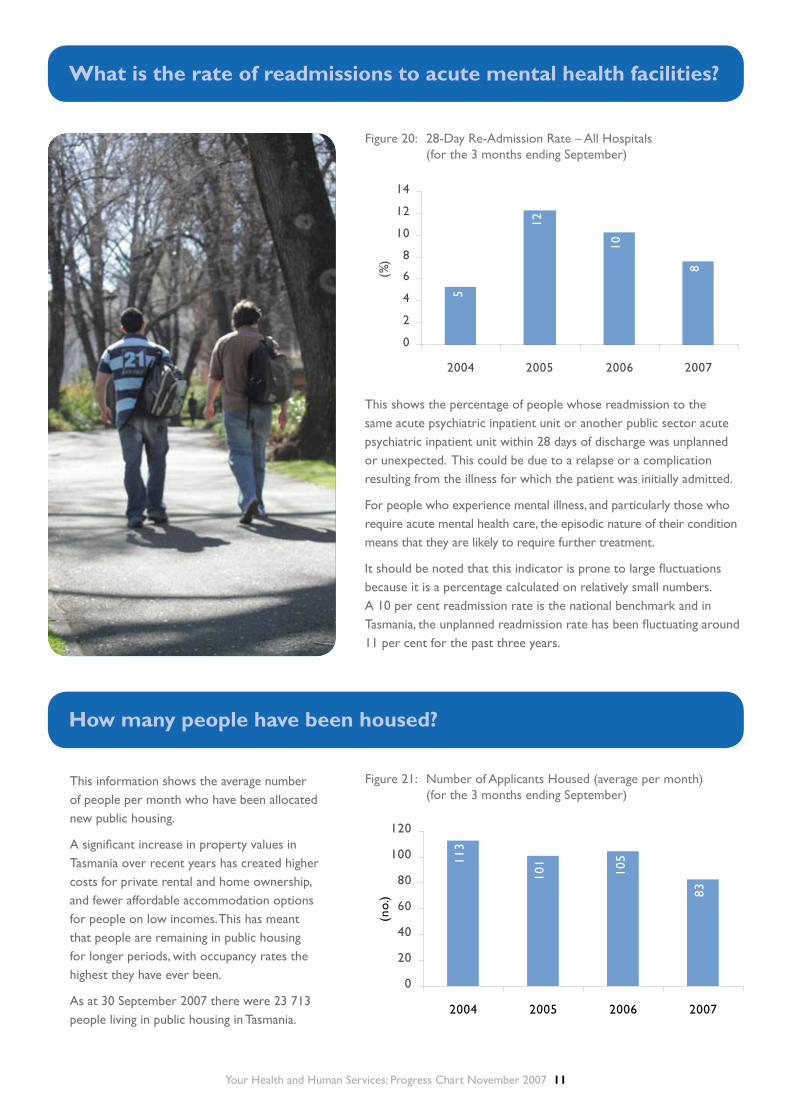
What is the rate of readmissions to acute mental health facilities?
How many people have been housed?
This information shows the average number of people per month who have been allocated new public housing.
A significant increase in property values in Tasmania over recent years has created higher costs for private rental and home ownership, and fewer affordable accommodation options for people on low incomes. This has meant that people are remaining in public housing for longer periods, with occupancy rates the highest they have ever been.
As at 30 September 2007 there were 23 713 people living in public housing in Tasmania.
Figure 20: 28-Day Re-Admission Rate – All Hospitals (for the 3 months ending September)
Figure 21: Number of Applicants Housed (average per month) (for the 3 months ending September)
This shows the percentage of people whose readmission to the same acute psychiatric inpatient unit or another public sector acute psychiatric inpatient unit within 28 days of discharge was unplanned or unexpected. This could be due to a relapse or a complication resulting from the illness for which the patient was initially admitted.
For people who experience mental illness, and particularly those who require acute mental health care, the episodic nature of their condition means that they are likely to require further treatment.
It should be noted that this indicator is prone to large fluctuations because it is a percentage calculated on relatively small numbers. A 10 per cent readmission rate is the national benchmark and in Tasmania, the unplanned readmission rate has been fluctuating around 11 per cent for the past three years.
8
5
10
12
0
2
4
6
8
10
12
14
2004 2005 2006 2007(%
)
101
10511
3
83
0
20
40
60
80
100
120
2004 2005 2006 2007
(no.
)

Your Health and Human Services: Progress Chart November 2007 ��
What are the waiting lists for public housing?
This indicator measures the total number of people waiting for public housing as at 30 September.
The waiting list for public housing has continued to decline, largely due to a range of housing options introduced through the Affordable Housing Strategy. The Strategy assisted over 6 700 households to access public housing, private rental and home ownership initiatives from December 2004 to September 2007. Between 30 September 2006 and 30 September 2007, the waiting list numbers decreased by 2.5 per cent.
The establishment of Tasmanian Affordable Housing Limited will increase the participation of private and not-for-profit sector investors in the provision of affordable housing.
Figure 23: Number of Applicants on Waitlist (as at 30 September)
Over 1 000 households received assistance through the Private Rental Support Scheme in the three months ending 30 September 2007, representing a 4.7 per cent decrease from same period in the previous year. This decline in the numbers is a reflection of high rental costs, increasing the cost of support provided to each household under the scheme. There are also very low vacancy rates in a tight rental market.
However, a greater number of people are being assisted through Intensive Tenancy Assistance through the Affordable Housing Strategy. This means that more people with greater needs are receiving intensive support and increased financial assistance to establish or maintain a private rental tenancy.
Figure 22: Number of Households Assisted Through the Private Rental Support Scheme (for the 3 months ending September)
How many people receive private rental assistance?
1 17
2
1 10
2
1 08
2
1 05
0
0
200
400
600
800
1 000
1 200
2004 2005 2006 2007
(no.
)
2 66
63 31
2
2 73
5
3 09
0
0
1 000
2 000
3 000
4 000
2004 2005 2006 2007
(no.
)

Your Health and Human Services: Progress Chart November 2007 ��
How many child protection cases are referred for investigation?
The number of notifications of child abuse and neglect that were referred for further investigation increased significantly over the past few years, following the introduction of the Family Violence Act 2004 and the Safe at Home initiative.
The decrease in referral numbers between September 2006 and September 2007 quarters is due in part to a delay in data becoming available and the September 2007 figure is expected to increase. However, the reform of the child protection system which is currently underway will impact on the number of referrals to service centres.
In response to a wide-ranging review of Tasmania’s child protection system released in November 2006, the Tasmanian Government has commenced reform of the child protection system as recommended in the 2006 Review of Child Protection. This involves a redesign of elements of the Child Protection and Family Services system with the aim of implementing an efficient system that meets the needs of at-risk children, young people and their families. The report from the review is expected to be completed in December 2007.
What is the usual wait for people with priority housing needs?
This indicates how long it takes to house applicants with priority housing needs. The identification of priority applicants involves an assessment of need, based on adequacy, affordability and appropriateness of housing, with Category 1 being the highest level of need.
The average time to house Category 1 applicants has increased in the three months to 30 September 2007 because the number of people in Category 1 has increased. This, combined with a reduction in turnover, has resulted in slightly longer wait times.
While there is no national comparison available for time to house Category 1 applicants (as jurisdictions determine priority allocations according to their own policies), Tasmania performs exceptionally well in regard to housing people in greatest need when compared to other states and territories.
Figure 24: Average Time to House Category 1 Applicants (for the 3 months ending September)
Figure 25: Number of Notifications Referred to Service Centres for Further Investigation (for the 3 months ending September)
16
14
19
16
0
5
10
15
20
2004 2005 2006 2007
(wee
ks)
982
312
1,43
8
681
0
400
800
1,200
1,600
2004 2005 2006 2007
(no.
)

Your Health and Human Services: Progress Chart November 2007 ��
There are six categories of ‘children in out-of-home care’: extended family; family group homes; approved children’s homes; foster care; kinship care; and ‘other placements’.
The steady increase in the number of children in out-of-home care reflects the commitment by the Department to provide safe placements for children affected by abuse and neglect.
The greatest proportion of children in out-of-home care is placed in foster care and the second greatest proportion is placed in extended family/kinship care arrangements. The current project to redesign child protection services and enhance family support services is expected to reduce the number of children in out-of-home care in the future by improving early intervention and support.
How many child protection notifications are not allocated?
This refers to the number of notifications of child abuse and neglect received by the Department that are not allocated for investigation within established time frames.
Reform of the child protection system is currently underway in Tasmania. As part of this, a central team of five staff members was created to work on the unallocated list on a time limited basis and an additional 20 staff were also recruited until 30 June 2007 to increase the capacity of the system to decrease this list. This resulted in a significant improvement in the situation in 2007. For the three months to 30 September 2007 there was a 53.2 per cent decrease in the number of unallocated cases compared to the same period in the previous year, from 1 721 to 805.
Figure 26: Child Abuse or Neglect: Number of Unallocated Cases (as at 30 September)
Figure 27: Children in Out-of-Home Care (as at 30 September)
How many children are placed in out-of-home care?
805
138
1,72
1
570
0200
600
1,000
1,400
1,800
2004 2005 2006 2007(n
o.)
575
696
488
745
0
200
400
600
800
2004 2005 2006 2007
(no.
)
Your Health and Human Services: Progress Chart November 2007 ��
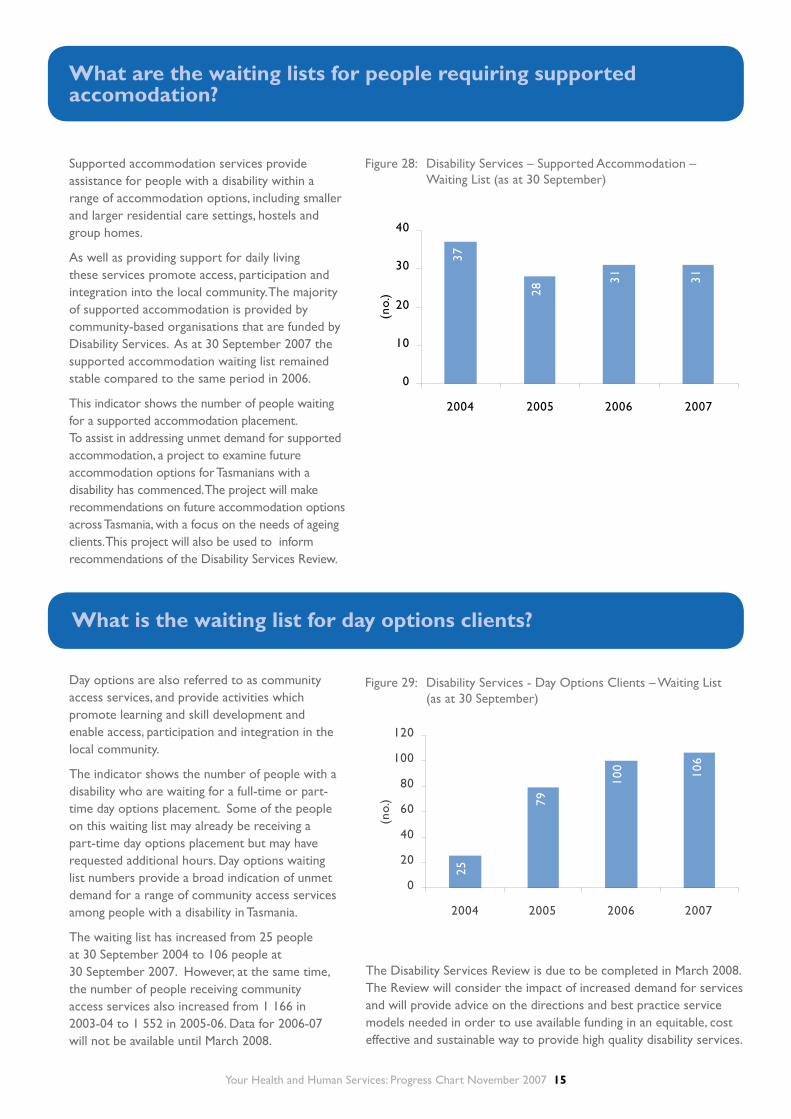
What is the waiting list for day options clients?
Day options are also referred to as community access services, and provide activities which promote learning and skill development and enable access, participation and integration in the local community.
The indicator shows the number of people with a disability who are waiting for a full-time or part-time day options placement. Some of the people on this waiting list may already be receiving a part-time day options placement but may have requested additional hours. Day options waiting list numbers provide a broad indication of unmet demand for a range of community access services among people with a disability in Tasmania.
The waiting list has increased from 25 people at 30 September 2004 to 106 people at 30 September 2007. However, at the same time, the number of people receiving community access services also increased from 1 166 in 2003-04 to 1 552 in 2005-06. Data for 2006-07 will not be available until March 2008.
What are the waiting lists for people requiring supported accomodation?
Supported accommodation services provide assistance for people with a disability within a range of accommodation options, including smaller and larger residential care settings, hostels and group homes.
As well as providing support for daily living these services promote access, participation and integration into the local community. The majority of supported accommodation is provided by community-based organisations that are funded by Disability Services. As at 30 September 2007 the supported accommodation waiting list remained stable compared to the same period in 2006.
This indicator shows the number of people waiting for a supported accommodation placement. To assist in addressing unmet demand for supported accommodation, a project to examine future accommodation options for Tasmanians with a disability has commenced. The project will make recommendations on future accommodation options across Tasmania, with a focus on the needs of ageing clients. This project will also be used to inform recommendations of the Disability Services Review.
Figure 28: Disability Services – Supported Accommodation – Waiting List (as at 30 September)
The Disability Services Review is due to be completed in March 2008. The Review will consider the impact of increased demand for services and will provide advice on the directions and best practice service models needed in order to use available funding in an equitable, cost effective and sustainable way to provide high quality disability services.
Figure 29: Disability Services - Day Options Clients – Waiting List (as at 30 September)
31
37
31
28
0
10
20
30
40
2004 2005 2006 2007
(no.
)
79
100
25
106
0
20
40
60
80
100
120
2004 2005 2006 2007
(no.
)
Your Health and Human Services: Progress Chart November 2007 ��
1. This edition of Your Health and Human Services: Progress Chart presents data for the three months to 30 September 2007.
2. It should be noted that from December 2004, patient activity at the Mersey Campus has been included in the figures for the North West Regional Hospital, as the Government assumed management of the facility from that date. Consequently, direct comparisons with previous years are not possible for the North West Regional Hospital.
3. From 1 January 2007, the activity measure for dental ‘Emergency Occasions of Service’ has been renamed ‘Episodic Occasions of Service’ to better reflect the new service model and the nature of care provided. Due to a change in the definition of ‘General Occasions of Service’ in January 2007, trend comparisons between the number of general and episodic occasions of service are not comparable with data prior to that date. However, since the end of January 2007 to 30 September 2007, the number of episodic occasions of service increased from 1 527 to 1 705 and the number of general occasions of services decreased from 444 to 406. This figure is expected to increase within the next few months following the commencement of four more dentists.
4. The following acronyms are used in this report:
• ACHS Australian Council of Healthcare Standards
• CSHA Commonwealth State Housing Agreement
• DEM Department of Emergency Medicine
• DHHS Department of Health and Human Services
• LGH Launceston General Hospital
• NWRH North West Regional Hospital
• RHH Royal Hobart Hospital
Explanatory notes

Your Health and Human Services: Progress Chart November 2007 ��
CONTACT
Depar tment of Health
and Human Services
GPO Box 125
Hobar t TAS 7001
Telephone: 1300 135 513
www.dhhs.tas.gov.au