Embed Size (px)
Citation preview
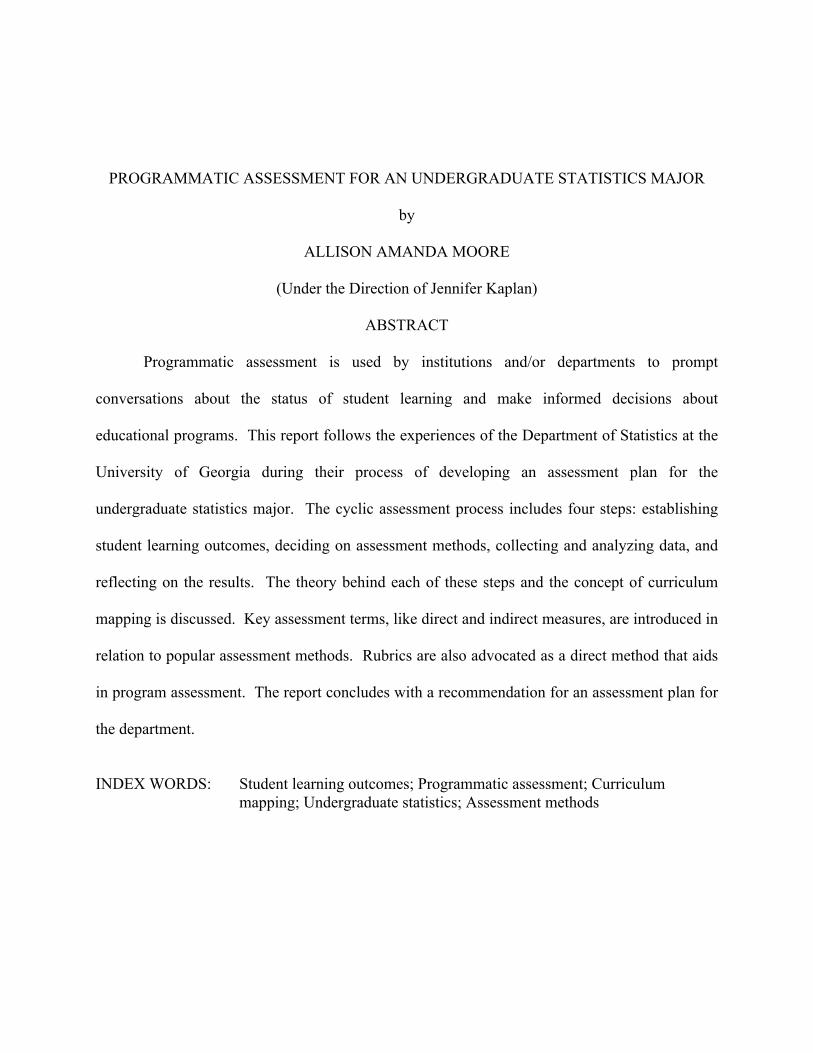
PROGRAMMATIC ASSESSMENT FOR AN UNDERGRADUATE STATISTICS MAJOR
by
ALLISON AMANDA MOORE
(Under the Direction of Jennifer Kaplan)
ABSTRACT
Programmatic assessment is used by institutions and/or departments to prompt
conversations about the status of student learning and make informed decisions about
educational programs. This report follows the experiences of the Department of Statistics at the
University of Georgia during their process of developing an assessment plan for the
undergraduate statistics major. The cyclic assessment process includes four steps: establishing
student learning outcomes, deciding on assessment methods, collecting and analyzing data, and
reflecting on the results. The theory behind each of these steps and the concept of curriculum
mapping is discussed. Key assessment terms, like direct and indirect measures, are introduced in
relation to popular assessment methods. Rubrics are also advocated as a direct method that aids
in program assessment. The report concludes with a recommendation for an assessment plan for
the department.
INDEX WORDS: Student learning outcomes; Programmatic assessment; Curriculum
mapping; Undergraduate statistics; Assessment methods
PROGRAMMATIC ASSESSMENT FOR AN UNDERGRADUATE STATISTICS MAJOR
by
ALLISON AMANDA MOORE
B.S., Virginia Tech, 2012
A Thesis Submitted to the Graduate Faculty of The University of Georgia in Partial Fulfillment
of the Requirements for the Degree
MASTER OF SCIENCE
ATHENS, GEORGIA
2014

© 2014
Allison Amanda Moore
All Rights Reserved
PROGRAMMATIC ASSESSMENT FOR AN UNDERGRADUATE STATISTICS MAJOR
by
ALLISON AMANDA MOORE
Major Professor: Jennifer Kaplan
Committee: Jaxk Reeves Lynne Seymour Electronic Version Approved: Maureen Grasso Dean of the Graduate School The University of Georgia May 2014
iv
ACKNOWLEDGEMENTS
I would like to thank my advisor, Dr. Kaplan for all of her help and guidance throughout
this project. I am grateful to the faculty of the Statistics Department for their support during the
assessment process, especially my thesis committee, Dr. Reeves and Dr. Seymour and the
Learning Outcomes Assessment Committee. Thank you to my research group, aka “Team
Kaplan”: Adam, Alex, Kristi, and Kyle. Finally, thanks to my friends and family for everything
that you have done to help me through graduate school.
v
TABLE OF CONTENTS
Page
ACKNOWLEDGEMENTS ........................................................................................................... iv
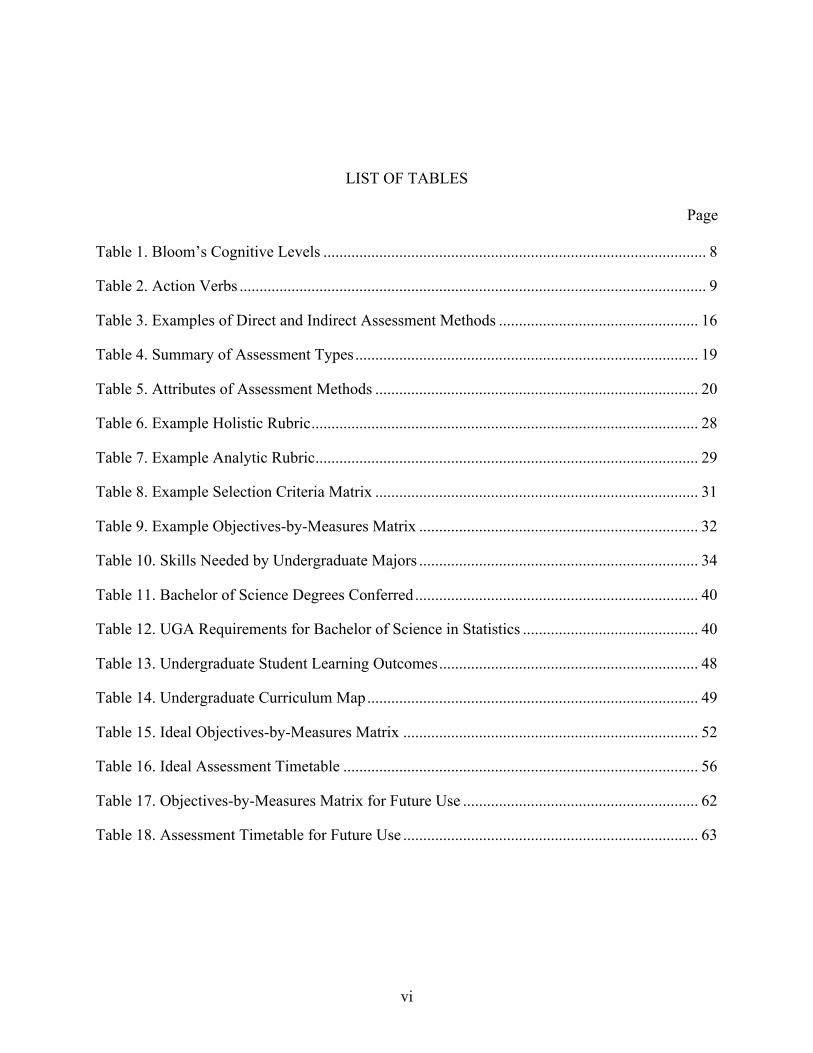
LIST OF TABLES ......................................................................................................................... vi
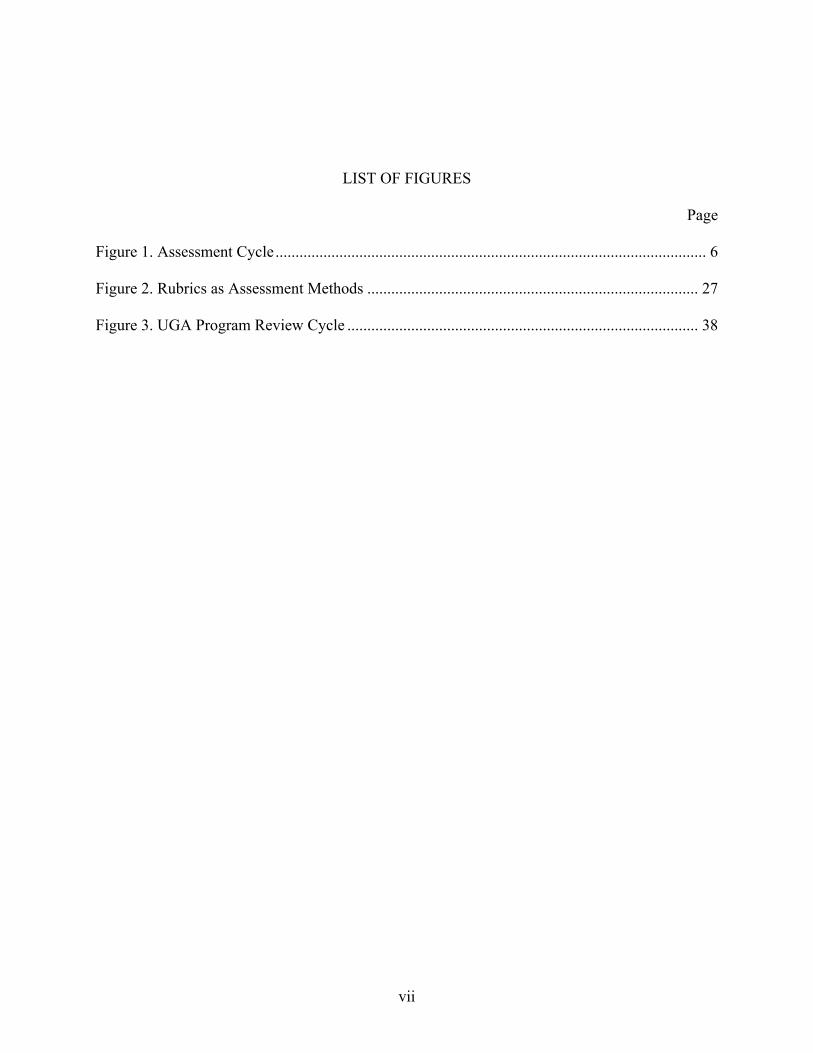
LIST OF FIGURES ...................................................................................................................... vii
CHAPTER
1 INTRODUCTION ....................................................................................................... 1
2 LITERATURE REVIEW ............................................................................................ 4
2.1 Purpose of Programmatic Assessment .............................................................. 4
2.2 Theory of Student Learning Outcomes ............................................................. 6
2.3 Theory of Curriculum Mapping ...................................................................... 10
2.4 Theory of Designing an Assessment Plan ...................................................... 12
2.5 Student Learning Outcomes in Statistics ........................................................ 33
2.6 Assessment in Statistics .................................................................................. 35
3 LOCAL SITUATION ............................................................................................... 38
3.1 UGA Assessment Process ............................................................................... 38
3.2 Our Department .............................................................................................. 39
3.3 Previous Work by Our Department ................................................................ 41
4 CURRENT PROCESS .............................................................................................. 44
5 FUTURE DIRECTIONS ........................................................................................... 50
6 REFERENCES .......................................................................................................... 58
7 APPENDIX ............................................................................................................... 62
vi
LIST OF TABLES
Page
Table 1. Bloom’s Cognitive Levels ................................................................................................ 8
Table 2. Action Verbs ..................................................................................................................... 9
Table 3. Examples of Direct and Indirect Assessment Methods .................................................. 16
Table 4. Summary of Assessment Types ...................................................................................... 19
Table 5. Attributes of Assessment Methods ................................................................................. 20
Table 6. Example Holistic Rubric ................................................................................................. 28
Table 7. Example Analytic Rubric ................................................................................................ 29
Table 8. Example Selection Criteria Matrix ................................................................................. 31
Table 9. Example Objectives-by-Measures Matrix ...................................................................... 32
Table 10. Skills Needed by Undergraduate Majors ...................................................................... 34
Table 11. Bachelor of Science Degrees Conferred ....................................................................... 40
Table 12. UGA Requirements for Bachelor of Science in Statistics ............................................ 40
Table 13. Undergraduate Student Learning Outcomes ................................................................. 48
Table 14. Undergraduate Curriculum Map ................................................................................... 49
Table 15. Ideal Objectives-by-Measures Matrix .......................................................................... 52
Table 16. Ideal Assessment Timetable ......................................................................................... 56
Table 17. Objectives-by-Measures Matrix for Future Use ........................................................... 62
Table 18. Assessment Timetable for Future Use .......................................................................... 63
vii
LIST OF FIGURES
Page
Figure 1. Assessment Cycle ............................................................................................................ 6
Figure 2. Rubrics as Assessment Methods ................................................................................... 27
Figure 3. UGA Program Review Cycle ........................................................................................ 38
1
CHAPTER 1
INTRODUCTION
Programmatic assessment is the process of collecting data to make informed decisions
and changes to education programs (Peck & Chance, 2007). This is different from typical
classroom assessment used by instructors on a regular basis to measure student knowledge in a
particular course. While program assessment is often done because it is required by
accreditation agencies, it also provides useful insight into the program as a whole (Hatfield,
2009). The process prompts conversations about the overall status of student learning and the
strengths and weakness of students (Jonson, 2006; Stassen et al., 2001). It can also be used to
determine whether students can synthesize ideas learned in individual courses to solve more
complex problems (Palomba & Banta, 1999). Programmatic assessment also helps faculty to
design their courses and focus instruction on key learning outcomes (Jonson, 2006; Stassen et al.,
2001).
Program assessment has become a requirement for all university level academic
departments under accreditation such as that provided by the Southern Association of College
and Schools (SACS). Program assessment is especially important for statistics departments
because of the relatively rapid increase in enrollment at the undergraduate level. The industry
has also seen increased demand for people trained in statistics due in part to the availability of
large data sets, or big data, and the need for analysts of such data. These changes are forcing
departments to adapt the undergraduate programs to meet industry and university demands.
Currently, “there is a wide disparity in the curriculum at various institutions and confusion on the
2
part of employers as to the skills and abilities that can be expected of a bachelor’s level
statistician” (Bryce, Gould, Notz, & Peck, 2000, p. 6). Program assessment can help to reconcile
these expectations and curriculum realities within the department. Ritter, Starbuck, and Hogg
(2001) call the Bachelor of Science degree in statistics “widely under-valued” with the “potential
for greater visibility and contribution” (p. 7). By analyzing student learning through program
assessment, departments can determine ways to improve their program and increase the value of
their graduates in the workforce.
This report will help not only statistics departments, but all departments interested in
program assessment. While most places have an existing assessment plan, all departments can
benefit from revaluating their existing documents and procedures (Hatfield, 2009). By going
through the assessment process documented in subsequent chapters, faculty can learn a great deal
about their programs. Through the discussion of student learning outcomes, faculty can
determine the expectations they have for their graduates. The process can also uncover what the
collective group of faculty members value most in their program. Programs that use a
curriculum map to match their desired outcomes to courses can learn whether or not their
outcomes are achievable within current program requirements. Their courses should form a
logical whole and allow a progression of learning through the curriculum. Departments using
this report as a guide will be introduced to a variety of assessment methods and types that can be
chosen. While there are many options for assessment methods, it is suggested that programs
choose methods based on their ability to gather valuable information and feasibility given
department resources. Programs are reminded of the importance of “closing the loop” of
assessment by synthesizing data collected to make changes to a program.
3
The literature review in Chapter 2 discusses the benefits and steps in the programmatic
assessment cycle. It also explains the theory behind student learning outcomes, curriculum
mapping, and assessment plan design. Chapter 2 ends with a discussion of student learning
outcomes in statistics and assessment in similar statistics programs. Chapter 3 describes the
local situation of the Department of Statistics at the University of Georgia (UGA). It includes
the UGA assessment process, information on the department, and previous assessment
procedures. Chapter 4 follows the department’s current process of redeveloping student learning
outcomes and selecting assessment methods. Finally, Chapter 5 concludes with the future
directions for the statistics department at UGA. An ideal assessment plan is presented as a
recommendation to maximize the data gathered on student learning across the undergraduate
program.
4
CHAPTER 2
LITERATURE REVIEW
2.1 Purpose of Programmatic Assessment
In general, the term assessment means any process of gathering and analyzing
information on topics, courses, institutions, or departments (Stassen, Doherty, & Poe, 2001;
Upcraft & Schuh, 2001). Faculty members are accustomed to thinking about classroom
assessments, like homework, projects, or exams, within their individual courses, but the process
of programmatic assessment is not typically understood by faculty members who are asked to
conduct it (Peck & Chance, 2007). While classroom assessments have their place within
program assessment, the two types of assessment differ with respect to their overall purposes.
Classroom assessments seek to evaluate students, courses, or even professors, but fail to provide
insight into the overall student learning experience. Programmatic assessment is used to
determine whether students can to combine ideas learned in individual courses into a coherent
whole (Palomba & Banta, 1999). The overall purpose of program assessment is to prompt
conversations about the status of student learning. Palomba and Banta (1999) describe
programmatic assessment as “the systematic collection, review, and use of information about
educational programs undertaken for the purpose of improving student learning and
development” (p. 4). They state that assessment is more than just collecting data; it involves
using the data to make informed decisions about and changes to educational programs. Peck
and Chance (2007) describe program assessment as the systematic process that:
5
Allows a department to articulate what they value in terms of student learning and to
consider the match between what is valued and what the program as taught actually
delivers. It is through this reconciliation of discrepancies revealed that programs evolve
and student learning improves. (p. 2)
In addition to understanding student learning, there are several potential benefits of
conducting programmatic assessment. First, it helps faculty members to design their courses and
focus instruction on the core competencies that are expected of students. Faculty members are
able to see where their course fits into the curriculum and discuss its impact on student learning.
Programmatic assessment, therefore, opens a crucial dialogue between educators regarding
possible improvements to their educational programs. The results of program assessment also
provide reliable data regarding the strengths and weaknesses of graduating students. The data
collected during programmatic assessment gives direction to faculty members on ways to
enhance the academic preparation students receive through the program. This allows faculty
members to improve their teaching methods and course procedures without having to rely as
heavily on student evaluations (Jonson, 2006; Stassen et al., 2001).
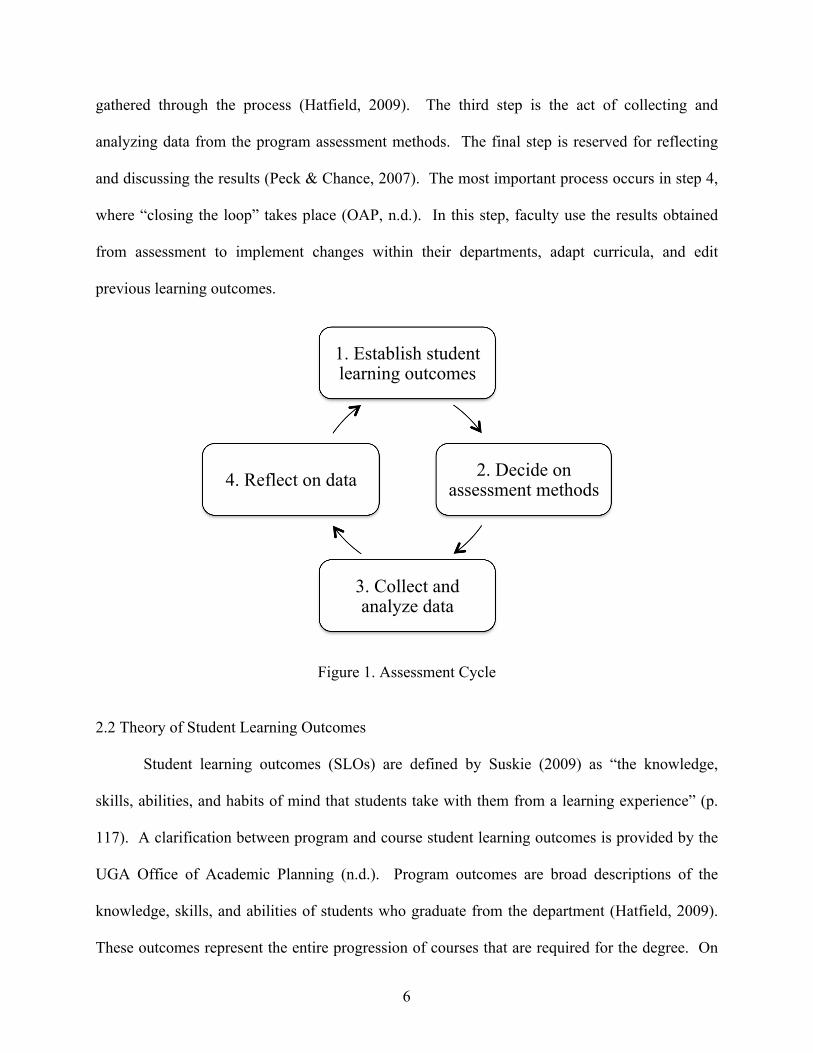
The process of programmatic assessment has four essential steps: establishing student
learning outcomes, deciding on assessment methods, collecting and analyzing the data, and
reflecting on the results. Figure 1 represents the cyclic process of assessing student learning as
described by Gordon (2013b), the UGA Office of Academic Planning (OAP) (n.d.), and Peck &
Chance (2007). The cycle begins with the establishment of the student learning outcomes in step
1. Step 2 includes the development of an assessment plan. In this step, programs should
determine where students can demonstrate effectively the learning outcomes. It is important that
learning outcomes and assessment methods are reasonably linked to maximize the information
6
gathered through the process (Hatfield, 2009). The third step is the act of collecting and
analyzing data from the program assessment methods. The final step is reserved for reflecting
and discussing the results (Peck & Chance, 2007). The most important process occurs in step 4,
where “closing the loop” takes place (OAP, n.d.). In this step, faculty use the results obtained
from assessment to implement changes within their departments, adapt curricula, and edit
previous learning outcomes.
Figure 1. Assessment Cycle
2.2 Theory of Student Learning Outcomes
Student learning outcomes (SLOs) are defined by Suskie (2009) as “the knowledge,
skills, abilities, and habits of mind that students take with them from a learning experience” (p.
117). A clarification between program and course student learning outcomes is provided by the
UGA Office of Academic Planning (n.d.). Program outcomes are broad descriptions of the
knowledge, skills, and abilities of students who graduate from the department (Hatfield, 2009).
These outcomes represent the entire progression of courses that are required for the degree. On
1. Establish student learning outcomes
2. Decide on assessment methods
3. Collect and analyze data
4. Reflect on data
7
the other hand, course outcomes are specific to a class. Often included on the course syllabus,
they describe what will be taught and tested during that semester. Course outcomes are typically
better understood by instructors and commonly assessed through in-class activities. In other
literature, the distinction is made between broader program goals and the more focused outcomes
(Lindholm, 2009; Stassen et al., 2001; and Suskie, 2009). Gordon (2013a) suggests that
departments agree on 4-6 programmatic learning outcomes, while other sources such as Stassen
et al. (2001) suggest 6-8 outcomes. Regardless of the exact number, they should be manageable
and written in accordance to the theory discussed in this section.
There are several reasons that departments should create student learning outcomes for
their programs. First, most accreditation agencies require SLOs to be included with the other
assessment materials (Goucher College, n.d.). By articulating and publishing the outcomes,
stakeholders, like accreditation agencies, students, faculty, and administrators, understand what
is important to the program. The students become aware of what is expected of them and can
better focus their energy on these items (Lindholm, 2009). Specifying the learning outcomes
also supports a “learner-centered” approach in the curriculum. “Learner-centered” refers to
instruction that focuses on what students should be able to do, rather than simply covering a long
list of topics (Lindholm, 2009). Once established, collecting data based on the SLOs can provide
information to the faculty on the strengths and weaknesses of the students, thereby improving the
effectiveness the educational programs. This insight into the student experience can improve
academic advising, encourage course revisions, and suggest program redesigns (Goucher
College, n.d.).
The foundation of educational objectives is credited to Bloom and Krathwohl’s 1956
publication of Taxonomy of Educational Objectives. They state that learning outcomes can be
8
classified into three major domains: affective, psychomotor, and cognitive. The affective domain
describes the “changes in interest, attitudes, and values, and the development of appreciations”
(Bloom & Krathwohl, 1956, p. 7). The psychomotor domain encompasses physical movements,
such as motor-skills, movement, or coordination (Clark, 1999). Finally, the cognitive domain
focuses on remembering something that one has previously learned, solving problems, or
synthesizing new material. This is the fundamental domain within statistics, since the subject is
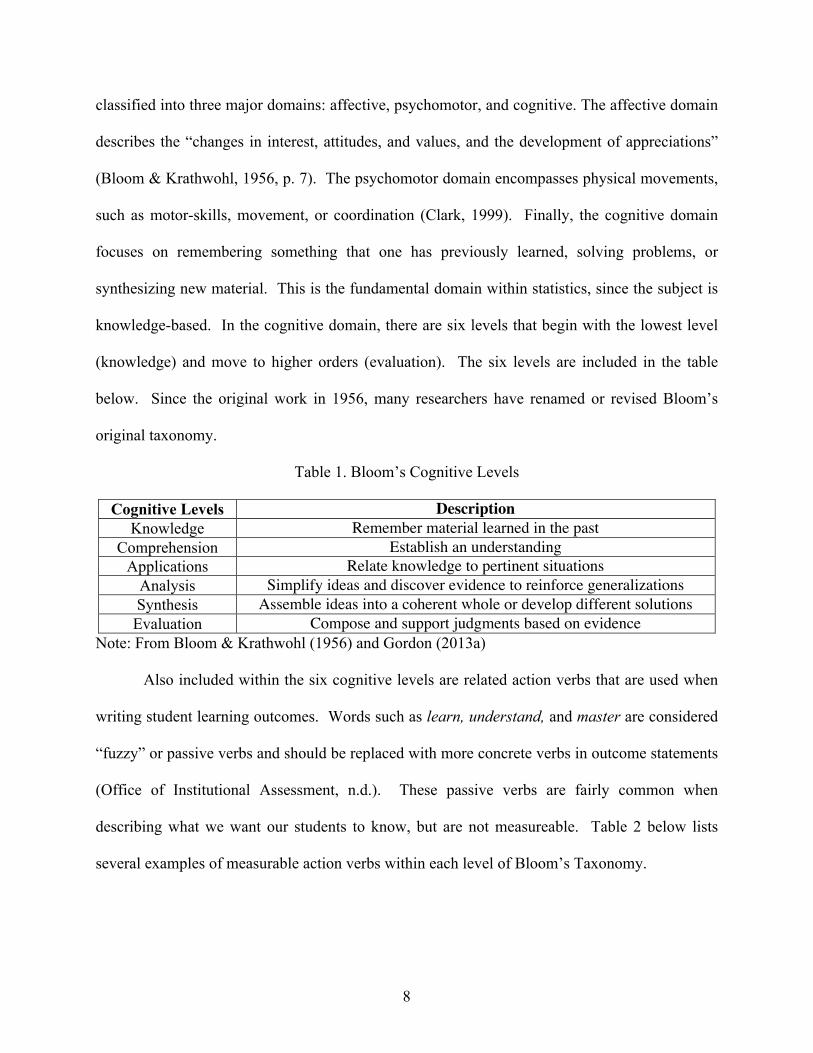
knowledge-based. In the cognitive domain, there are six levels that begin with the lowest level
(knowledge) and move to higher orders (evaluation). The six levels are included in the table
below. Since the original work in 1956, many researchers have renamed or revised Bloom’s
original taxonomy.
Table 1. Bloom’s Cognitive Levels
Cognitive Levels Description Knowledge Remember material learned in the past
Comprehension Establish an understanding Applications Relate knowledge to pertinent situations
Analysis Simplify ideas and discover evidence to reinforce generalizations Synthesis Assemble ideas into a coherent whole or develop different solutions Evaluation Compose and support judgments based on evidence
Note: From Bloom & Krathwohl (1956) and Gordon (2013a)
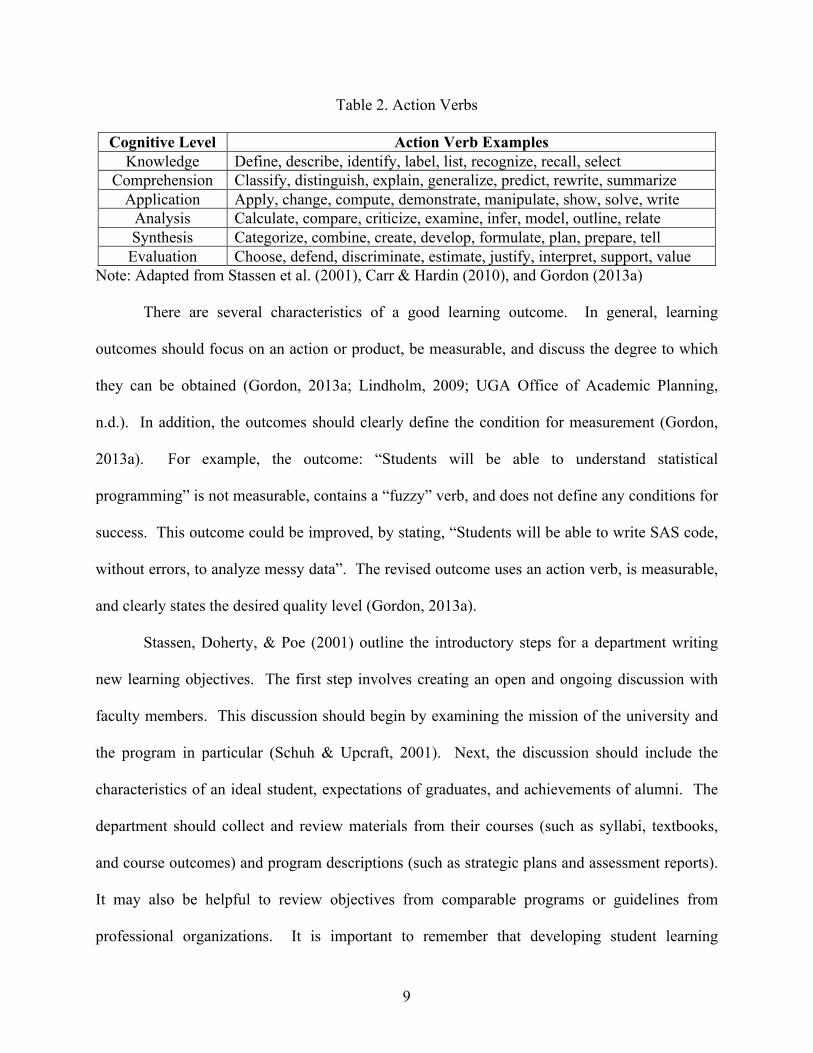
Also included within the six cognitive levels are related action verbs that are used when
writing student learning outcomes. Words such as learn, understand, and master are considered
“fuzzy” or passive verbs and should be replaced with more concrete verbs in outcome statements
(Office of Institutional Assessment, n.d.). These passive verbs are fairly common when
describing what we want our students to know, but are not measureable. Table 2 below lists
several examples of measurable action verbs within each level of Bloom’s Taxonomy.
9
Table 2. Action Verbs
Cognitive Level Action Verb Examples Knowledge Define, describe, identify, label, list, recognize, recall, select
Comprehension Classify, distinguish, explain, generalize, predict, rewrite, summarize Application Apply, change, compute, demonstrate, manipulate, show, solve, write
Analysis Calculate, compare, criticize, examine, infer, model, outline, relate Synthesis Categorize, combine, create, develop, formulate, plan, prepare, tell Evaluation Choose, defend, discriminate, estimate, justify, interpret, support, value
Note: Adapted from Stassen et al. (2001), Carr & Hardin (2010), and Gordon (2013a) There are several characteristics of a good learning outcome. In general, learning
outcomes should focus on an action or product, be measurable, and discuss the degree to which
they can be obtained (Gordon, 2013a; Lindholm, 2009; UGA Office of Academic Planning,
n.d.). In addition, the outcomes should clearly define the condition for measurement (Gordon,
2013a). For example, the outcome: “Students will be able to understand statistical
programming” is not measurable, contains a “fuzzy” verb, and does not define any conditions for
success. This outcome could be improved, by stating, “Students will be able to write SAS code,
without errors, to analyze messy data”. The revised outcome uses an action verb, is measurable,
and clearly states the desired quality level (Gordon, 2013a).
Stassen, Doherty, & Poe (2001) outline the introductory steps for a department writing
new learning objectives. The first step involves creating an open and ongoing discussion with
faculty members. This discussion should begin by examining the mission of the university and
the program in particular (Schuh & Upcraft, 2001). Next, the discussion should include the
characteristics of an ideal student, expectations of graduates, and achievements of alumni. The
department should collect and review materials from their courses (such as syllabi, textbooks,
and course outcomes) and program descriptions (such as strategic plans and assessment reports).
It may also be helpful to review objectives from comparable programs or guidelines from
professional organizations. It is important to remember that developing student learning
10
outcomes is an iterative process. Programs typically have to refine and improve outcomes once
they try to design an assessment plan (Stassen et al., 2001).
A unique method of writing outcomes is introduced in Jordan, DeGraaf, & DeGraaf
(2005) and enhanced by Carr & Hardin (2010). Their method, coined the “ABCD Method,”
leads to specific and measureable outcomes. The ‘A’ stands for audience: most commonly in
program outcomes this is the student. The ‘B’ is the behavior or the action verb that will be
performed by the audience. The ‘C’ represents the condition or circumstance under which the
behavior will take place. Finally, the ‘D’ is the degree of competence or the extent of
measurement for a student learning outcomes. In her 2013 presentation, the UGA Associate
Director of Assessment, Dr. Leslie Gordon discussed a similar approach using the abbreviations
ABCC. Very similar to the method discussed by Jordan et. al. (2005), the two Cs in the acronym
stand for condition and criteria. Acronyms have been developed at many other institutions,
including SMART at the University of Central Florida’s Office of Experiential Learning (n.d.).
SMART stands for specific, measurable, attainable, results-focused, and time-focused.
2.3 Theory of Curriculum Mapping
Curriculum mapping corresponds to the first step of the Assessment Cycle (see Figure 1)
and is a useful method for checking the alignment of learning opportunities to the courses within
a program (Suskie, 2009). A curriculum map is a matrix containing a list of courses or electives
down the rows and the program learning outcomes across the columns. It is also useful to
include program requirements (especially in graduate programs) such as theses, graduation
exams, honors presentations, and defenses (URI, 2012). Hatfield (2009) wrote that the mapping
process is often “the first time a curriculum has been systematically examined to see how the
11
individual courses function in the curriculum” (p. 3). The curriculum map serves as a general
reminder of the student learning outcomes that each course should address. This is especially
important since courses are often taught by different instructors. While course level outcomes
may vary slightly by instructor, they should not deviate so dramatically that they are no longer
mindful of the program level assignments within the curriculum map. This allows the link
created between individual courses and program level objectives to hold true regardless of who is
teaching the course (Hatfield, 2009).
Creating a curriculum map allows faculty members to see where outcomes are covered in
the program and ensures that none can be skipped. In some cases during curriculum mapping, an
“orphan outcome,” one that not addressed by any course in the progression of classes, is noticed
(Stassen et al., 2001). By visualizing outcomes and the courses offered, programs are able to
easily identify potential gaps in the curriculum and highlight the deficiencies in a program’s
graduation requirements (Suskie, 2009). This drives the modifications of existing student
learning outcomes as well as potential changes to the curriculum and assessment methods. For
example, a common “orphan outcome” is public speaking, because it is often not linked to any
course(s) during curriculum mapping. To correct this issue, programs can either eliminate the
outcome or redesign a course to integrate public speaking skills. Lastly, the curriculum map
shows the progression of student learning (Maki, 2010). Students should not be expected to
show high level learning too early (Stassen et al., 2001). Therefore, a progression of learning
needs to occur such that students have time to practice an outcome before they are assessed on it.
The curriculum map assists in designing the assessment plan, because faculty can see the best
opportunities to incorporate assessment into the program.
12
In curriculum mapping, the progression described above is generally conceptualized in
three stages. The first stage, normally called introduce, is defined as the focus on basic
knowledge, skills, and abilities that support the specific outcome. Introducing a concept
provides the building blocks for further learning later on in the sequence of courses (Cal Poly
Pomona, 2007; Stassen et al., 2001; URI, 2012). The second stage, called reinforce, develop, or
demonstrate, designates courses that strengthen student mastery of an outcome or allow for
additional opportunities to practice the outcome (Cal Poly Pomona, 2007; URI, 2012). The third
stage, called emphasize, master, or assess, allows for the complex integration of an outcome or
an opportunity for assessment (Stassen et al., 2001; URI, 2012). Various sources have discussed
the lettering of these stages within a curriculum map. The University of Rhode Island (2012)
uses I, R, and E, which stand for introduce, reinforce, and emphasize, respectively. Cal Poly
Pomona (2007) use the terms develop or demonstrate to describe the second stage, and then
master or assess for the third stage in the sequence. The statistics department at the University of
Georgia utilizes the notation published by the Mathematics and Statistics Department at Cal Poly
Pomona (2007). Therefore, this report uses introduce, develop, and assess as the three
distinctions within the curriculum map.
2.4 Theory of Designing an Assessment Plan
This section provides a roadmap to designing a program assessment plan. With respect
to the assessment cycle (see Figure 1), steps 2, 3, and 4 are discussed below. Section 2.4.1
discusses nine principles of good practice for assessing student learning and additional
assessment advice provided throughout the literature. Section 2.4.2 distinguishes between eight
key assessment terms that are useful to decide on methods. These terms include direct vs.
indirect, formative vs. summative, qualitative vs. quantitative, and add-on vs. embedded.
13
Section 2.4.3 examines many popular assessment methods that programs may want to consider
as a part of their assessment plan. Section 2.4.4 focuses on the benefits of adding rubrics to
improve existing assessment practices. Section 2.4.5 uses the knowledge of assessment terms
and methods to select the best combination items into the overall plan in a process called
triangulation. Section 2.4.6 discusses how programs should close the loop of assessment and
utilize their data to make meaningful program changes.
2.4.1 Assessment Advice
The current literature offers many pieces of advice for programs in developing effective
assessment plans. The nine principles of good practice for assessing student learning written
by the American Association for Higher Education (AAHE) are the foundation of this advice.
The first three principles focus on establishing clear student learning outcomes that are
representative of learning experiences and program purposes (AAHE, 1992). They also reiterate
the theory of student learning outcomes provided in Section 2.2. The final six principles provide
reminders for programs in assessing their student learning outcomes:
1. The assessment of student learning begins with educational values
2. Assessment is most effective when it reflects an understanding of learning as
multidimensional, integrated, and revealed in performance over time
3. Assessment works best when the program it seeks to improve have clear, explicit
stated purposes
4. Assessment requires attention to outcomes but also and equally to the experiences that
lead to those outcomes
5. Assessment works best when it is ongoing not episodic
14
6. Assessment fosters wider improvement when representatives from across the
educational community are involved
7. Assessment makes a difference when it begins with issues of use and illuminates
questions that people really care about
8. Assessment is more likely to lead to improvement when it is part of a larger set of
conditions that promote change
9. Through assessment, educators meet responsibilities to students and to the public
The sixth AAHE principle specifies involving the educational community in the
assessment process. Assessment can only be effective if it is endorsed by faculty of the program
(Lindholm, 2009). Faculty members tend to be skeptical of the process initially and believe that
the assessment trend with “blow over” (Hatfield, 2009, p. 2; Peck & Chance, 2007). Often
faculty members have so many other things to do that assessment is not high on their priority list
(Hatfield, 2009). With regard to faculty involvement in assessment, Peck and Chance (2007)
note that it “is surprising…that so many of the decisions that we make as academics are based on
personal opinion and anecdotal evidence, and that departments…are often skeptical of attempts
to measure the quality of our academic programs” (p. 2). While assessment needs “a collective
effort on the part of tenured and non-tenured faculty”, it might be best to first establish an
assessment committee (Hatfield, 2009, p. 2). This committee can direct the assessment process
(Maki, 2010), begin discussions, get department buy-in, and encourage faculty members to see
the value of assessment to student learning (Peck & Chance, 2007).
Departmental committees can get started with advice from other program’s assessment
plans and university resources (Palomba & Banta, 1999). The plans they create should be
dynamic, ongoing, systematic, manageable, and generate meaningful data (Hatfield, 2009;
15
Lindholm, 2009; Palomba & Banta, 1999; Peck & Chance, 2007). An effective plan is designed
and implemented by the faculty and is aligned with the curriculum. Successful plans utilize
multiple methods and help to distinguish between levels of achievement (Hatfield, 2009; Stassen
et al., 2001). Larger programs should also utilize use sampling to reduce the assessment burden
(Peck & Chance, 2007). Similarly, programs can focus on assessing only 1 or 2 student learning
outcomes per academic year (Gordon, 2013a). Programs deciding on assessment methods need
to include a detailed timeline with their assessment plan. This timeline contains the faculty in
charge, time frame, resources, and how feedback is used to make changes to the program
(Lindholm, 2009). The time frame should allow time for mistakes as well as ongoing reflection,
input, and improvement (Palomba & Banta, 1999; Stassen et al., 2001)
2.4.2 Assessment Types Step 2 of the program assessment cycle focuses on choosing assessment methods. Eight
different assessment types can help to distinguish these methods. The biggest distinction in
types of assessment methods is between direct and indirect. Direct assessment is defined as
“evidence of student learning [that] is tangible, visible, self-explanatory, and compelling
evidence of exactly what students have and have not learned” (Suskie, 2009, p. 20). For
example, the data collected from course assignments that are graded with rubrics, give direct
evidence of student learning.
In comparison, “indirect evidence consists of proxy signs that students are probably
learning” and the information gathered, “is less clear and less convincing than direct evidence”
(Suskie, 2009, p. 20). Indirect methods often relate to students’ perceptions of their skills, rather
than actual proof. Student surveys are a common example of indirect evidence because they are
self-imposed ratings of student knowledge. It is important to incorporate both direct and indirect
16
evidence when developing an assessment plan, because neither direct nor indirect evidence alone
tells “the whole story of student learning” (The Middle States Commission on Higher Education
[MSCHE], 2007, p. 31). Direct evidence tells explicitly what they have learned, while indirect
evidence relates to the process of learning and can provide more insight into why they are
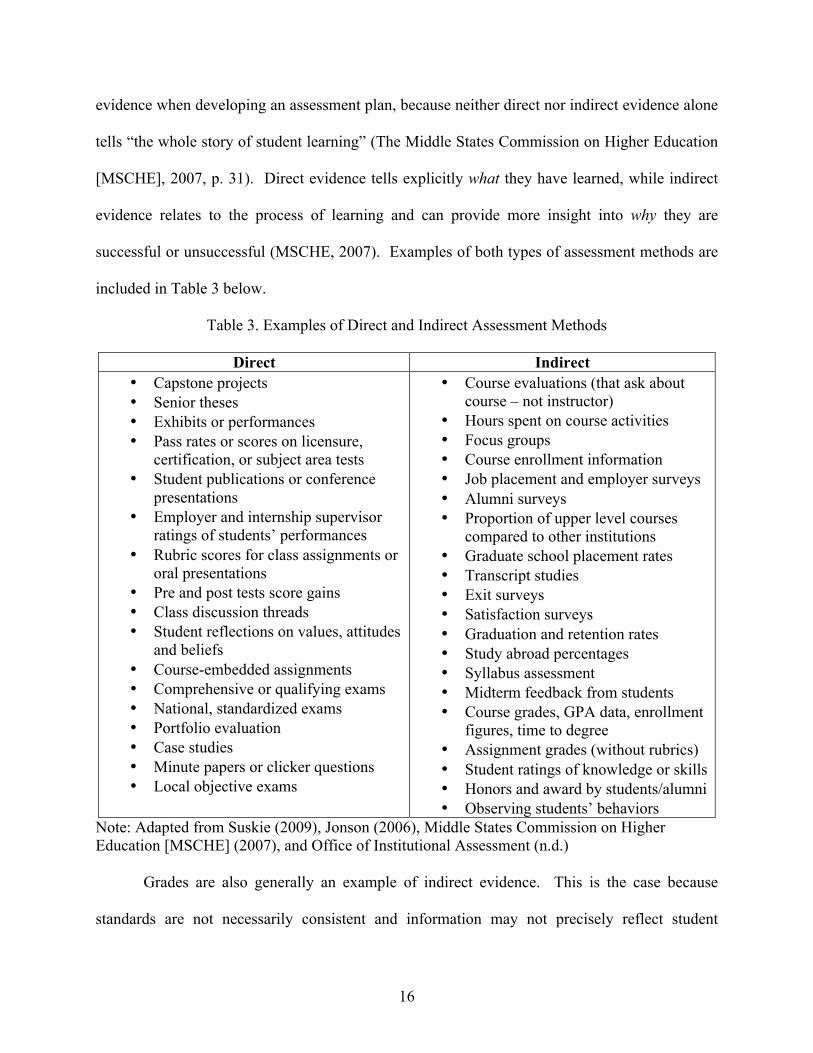
successful or unsuccessful (MSCHE, 2007). Examples of both types of assessment methods are
included in Table 3 below.
Table 3. Examples of Direct and Indirect Assessment Methods
Direct Indirect • Capstone projects • Senior theses • Exhibits or performances • Pass rates or scores on licensure,
certification, or subject area tests • Student publications or conference
presentations • Employer and internship supervisor
ratings of students’ performances • Rubric scores for class assignments or
oral presentations • Pre and post tests score gains • Class discussion threads • Student reflections on values, attitudes
and beliefs • Course-embedded assignments • Comprehensive or qualifying exams • National, standardized exams • Portfolio evaluation • Case studies • Minute papers or clicker questions • Local objective exams
• Course evaluations (that ask about course – not instructor)
• Hours spent on course activities • Focus groups • Course enrollment information • Job placement and employer surveys • Alumni surveys • Proportion of upper level courses
compared to other institutions • Graduate school placement rates • Transcript studies • Exit surveys • Satisfaction surveys • Graduation and retention rates • Study abroad percentages • Syllabus assessment • Midterm feedback from students • Course grades, GPA data, enrollment
figures, time to degree • Assignment grades (without rubrics) • Student ratings of knowledge or skills • Honors and award by students/alumni • Observing students’ behaviors
Note: Adapted from Suskie (2009), Jonson (2006), Middle States Commission on Higher Education [MSCHE] (2007), and Office of Institutional Assessment (n.d.) Grades are also generally an example of indirect evidence. This is the case because
standards are not necessarily consistent and information may not precisely reflect student
17
learning (Gordon, 2013b). Stassen et al. (2001) state that “because grades don’t tell you about
student performance on individual (or specific) learning goals or outcomes, they provide little
information on the overall success of the program in helping students attain specific and distinct
learning objectives of interest” (p. 30). Grades can only be considered an example of direct
evidence when they are generated from specific criteria and have an immediate relation to
learning goals (MSCHE, 2007). An example of this instance is when programs use rubrics to
assess student learning and assign grades. The use of rubrics in assessment is discussed in
Section 2.4.4.
Another distinction between types of assessment is whether it is summative or formative
assessment, which may also be called outcomes and processes, respectively (Gordon, 2013b;
Suskie, 2009). Summative assessment is conducted at the end of a course or is an outcome of a
program. Examples of summative assessments include final exam grades or a cumulative
portfolio. On the other hand, formative assessment is conducted in the middle of a course or
program, while students are in the process of developing mastery of the outcome. This type of
assessment allows faculty members to adapt the course immediately in concordance with student
growth (Suskie, 2009). A professor who uses the results of a first project to change the path of
the course or discuss a misunderstood topic in more detail, is completing formative assessment
(MSCHE, 2007). Some assessment methods, like projects, could be summative or formative,
depending on their location and purpose within a course. A project completed during the middle
of the semester is a formative assessment measure, while a final project would be summative.
Like direct and indirect measures, “formative and summative assessment work together to
improve learning” (MSCHE, 2007, p. 27).
18
Additionally, the literature distinguishes between embedded and add-on assessment
methods. Embedded assessments are integrated into courses: serving double duty as program
assessment items and course assignments. Embedded assignments include objective tests,
projects, or in-class performances that can provide insight into the functionality of the program
as a whole (Suskie, 2009). Incorporating embedded assignments into the classroom also helps in
getting true responses from students (Peck & Chance, 2007). Students in the research were more
serious when their responses counted toward a grade when compared to responses on an add-on
exit survey (Peck and Chance, 2007). Add-on assessments are not part of course syllabi and do
not affect a student’s grade in any specific course (Suskie, 2009). Add-on assessments may also
be included as an item that students must complete before graduation, such as a graduating
student exit survey. Some examples of add-on assessments are portfolios or focus groups
(Suskie, 2009; Gordon, 2013b).
Assessment methods and their resulting data follow two types, quantitative and
qualitative. Quantitative assessment methods produce specific responses and data that can be
analyzed with statistical methods (Suskie, 2009). The number of responses that are correct and
incorrect provide interpretable information on student knowledge (Maki, 2010). Examples of
quantitative assessment include test scores, rubrics, and ratings from surveys. Qualitative
assessment methods are more flexible and look for recurring patterns in student work (Suskie,
2009). This type of assessment incorporates a broader understanding of learning; however some
error is possible due to the interpretations of the spectator (Maki, 2010). Examples of qualitative
assessments include focus groups, notes from interviews, and other observations. Both
qualitative and quantitative methods are highly valued and should be combined in order to create
stronger assessment plans (Schuh & Upcraft, 2001).
19
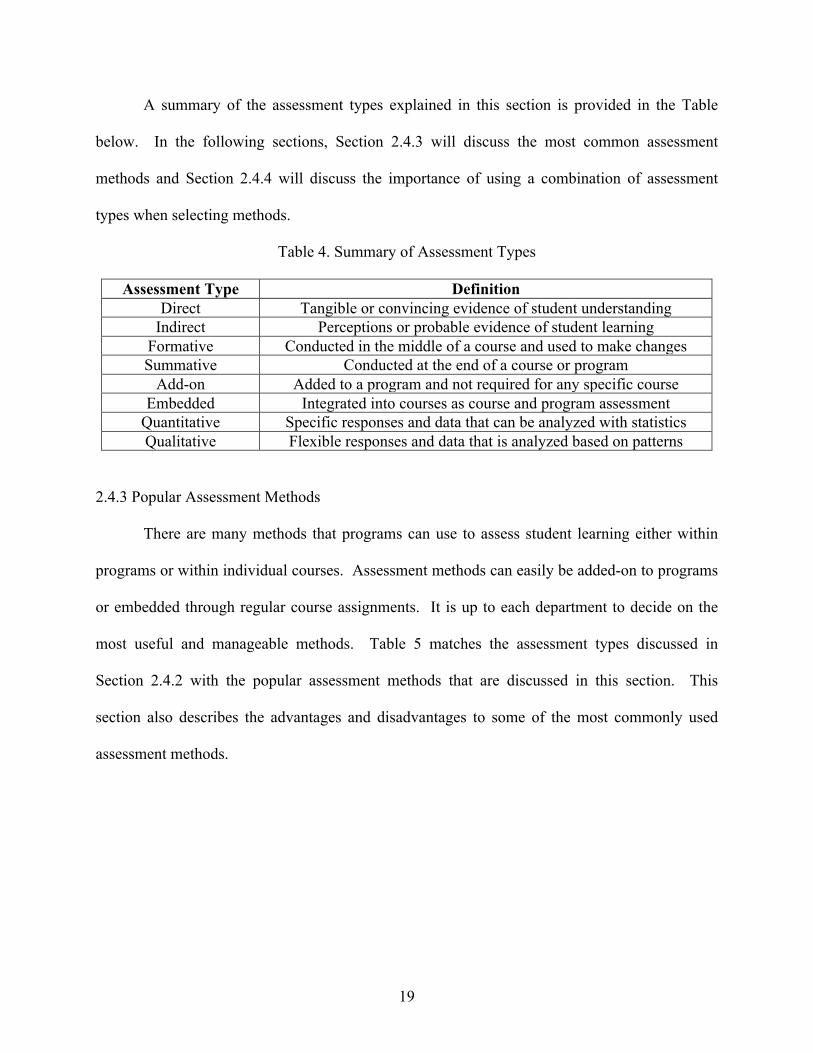
A summary of the assessment types explained in this section is provided in the Table
below. In the following sections, Section 2.4.3 will discuss the most common assessment
methods and Section 2.4.4 will discuss the importance of using a combination of assessment
types when selecting methods.
Table 4. Summary of Assessment Types
Assessment Type Definition Direct Tangible or convincing evidence of student understanding
Indirect Perceptions or probable evidence of student learning Formative Conducted in the middle of a course and used to make changes Summative Conducted at the end of a course or program
Add-on Added to a program and not required for any specific course Embedded Integrated into courses as course and program assessment
Quantitative Specific responses and data that can be analyzed with statistics Qualitative Flexible responses and data that is analyzed based on patterns
2.4.3 Popular Assessment Methods There are many methods that programs can use to assess student learning either within
programs or within individual courses. Assessment methods can easily be added-on to programs
or embedded through regular course assignments. It is up to each department to decide on the
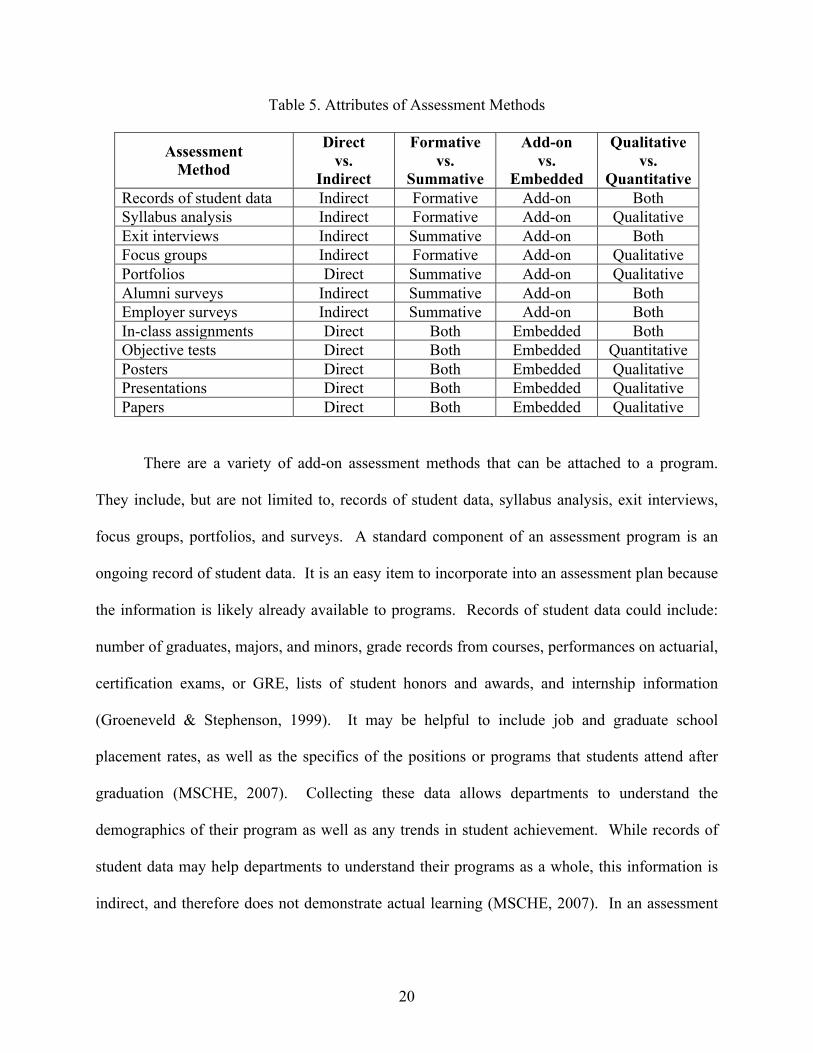
most useful and manageable methods. Table 5 matches the assessment types discussed in
Section 2.4.2 with the popular assessment methods that are discussed in this section. This
section also describes the advantages and disadvantages to some of the most commonly used
assessment methods.
20
Table 5. Attributes of Assessment Methods
Assessment Method
Direct vs.
Indirect
Formative vs.
Summative
Add-on vs.
Embedded
Qualitative vs.
Quantitative Records of student data Indirect Formative Add-on Both Syllabus analysis Indirect Formative Add-on Qualitative Exit interviews Indirect Summative Add-on Both Focus groups Indirect Formative Add-on Qualitative Portfolios Direct Summative Add-on Qualitative Alumni surveys Indirect Summative Add-on Both Employer surveys Indirect Summative Add-on Both In-class assignments Direct Both Embedded Both Objective tests Direct Both Embedded Quantitative Posters Direct Both Embedded Qualitative Presentations Direct Both Embedded Qualitative Papers Direct Both Embedded Qualitative
There are a variety of add-on assessment methods that can be attached to a program.
They include, but are not limited to, records of student data, syllabus analysis, exit interviews,
focus groups, portfolios, and surveys. A standard component of an assessment program is an
ongoing record of student data. It is an easy item to incorporate into an assessment plan because
the information is likely already available to programs. Records of student data could include:
number of graduates, majors, and minors, grade records from courses, performances on actuarial,
certification exams, or GRE, lists of student honors and awards, and internship information
(Groeneveld & Stephenson, 1999). It may be helpful to include job and graduate school
placement rates, as well as the specifics of the positions or programs that students attend after
graduation (MSCHE, 2007). Collecting these data allows departments to understand the
demographics of their program as well as any trends in student achievement. While records of
student data may help departments to understand their programs as a whole, this information is
indirect, and therefore does not demonstrate actual learning (MSCHE, 2007). In an assessment
21
plan, records of student data “can be useful to the extent that they correlate with and illuminate
direct learning assessments” (MSCHE, 2007, p. 53).
Syllabus analysis is another indirect, add-on assessment method that can be incorporated
into current departmental procedures. During syllabus analysis, faculty members review
curriculum syllabi to see if there are enough opportunities for students to practice the learning
outcomes (Suskie, 2009). This should be undertaken about every five years in order to
understand how individual faculty members are implementing the selected program learning
outcomes in their courses. Syllabus analysis is a useful process and is very similar to curriculum
mapping because it promotes coherence across the department and helps to identify possible
areas for improvement. Many programs ignore this type of assessment method because it is time
consuming and sometimes difficult to get faculty member involvement. Syllabus analysis is also
useless if students or the faculty teaching the course each year do not use the syllabus as a
learning guide (Jonson, 2006).
Another example of an add-on assessment method is exit interviews that are required
from each graduating student. They are a summative assessment method that can generate both
qualitative and quantitative data. Exit interviews ask students to respond to a set of open and
closed questions about their experiences within the program. They are inexpensive, easy to
administer, and are used to track student opinions over time. Poorly written prompts, however,
result in insufficient student responses. This leaves a lot of the success of the interview in the
hands of the interviewer (Stassen et al., 2001). With a trained interviewer, exit interviews can
provide a realistic and in-depth perspective of student experience (Jonson, 2006).
Focus groups are an extension of an exit interview. They are carefully structured
discussions that allow groups of six to ten students to discuss their knowledge and experiences.
22
Focus groups are increasing in popularity because they “provide an excellent opportunity to
listen to the voices of students, explore issues in depth, and obtain insights that might not occur
without they discussion they provide” (Palomba & Banta, 1999, p. 196-197). Focus groups
provide a wide variety of data, with immediate impact (Stassen et al., 2001). The open-ended
nature of focus groups may also bring up areas of concern that were not originally foreseen by
faculty members or other assessment methods (Jonson, 2006). MSCHE (2007) agrees, saying
that “focus groups are usually most appropriate as tools to help illuminate other assessment
results, rather than as stand-alone assessment strategies”. Like exit interviews, the success of
this assessment method is highly dependent on the moderator and the department’s ability to
gather enough participants (Stassen et al., 2001; Suskie, 2009). Focus groups are not a good
source of quantitative data; they provide qualitative data that can be time consuming to analyze
(Schuh & Upcraft, 2001; Suskie, 2009). Additionally, focus groups with current students might
be unsuccessful if students feel there will be retribution in response to a critical evaluation of the
program (Jonson, 2006).
Portfolios are another popular example of an add-on assessment method (MSCHE, 2007).
Unlike previous add-on methods, portfolios are direct assessment methods that can be
incorporated into a program. Portfolios are collections of student work that can include papers,
reports, exams, or analyses (Stassen et al., 2001). It is essential that portfolios also include
student reflections detailing the reasons for inclusion and discussion of each contributed item
(Suskie, 2009). Portfolios allow programs to see to the trends in student growth over time, as
well as students’ overall strengths and weaknesses (Jonson, 2006). They can also serve as
valuable resources for students applying to jobs or graduate school and allow students to take
greater responsibility for their work. For a program, portfolios can be difficult to store, costly,
23
time consuming, and require extra work by the faculty (Stassen et al., 2001). Taking this into
account, portfolios are best suited for programs with a smaller number of students (MSCHE,
2007; Suskie, 2009). The information contained in portfolios must be converted to meaningful
assessment data, which requires faculty resources that are demanded elsewhere (Jonson, 2006).
Surveys are another indirect, add-on assessment method that are conducted with alumni
or employers. Alumni surveys ask the program’s graduates about their current positions and any
skills that they use in their jobs on a regular basis. The patterns of commonly used skills that are
not addressed in the program, suggest ways in which a curriculum should be changed (Stassen et
al., 2001). Alumni surveys are broad in scope and are inexpensive measures of student
experiences (Stassen et al., 2001). They are sent to people who have interest in helping the
program and are knowledgeable of its strengths and weaknesses. Sending out alumni surveys
may also prompt the alumni to donate money or forward job openings within their companies.
Unfortunately, alumni surveys have notoriously low response rates and it is often very difficult
to locate students after graduation (Jonson, 2006). Additionally, programs thinking about using
surveys should be mindful of Institutional Review Board (IRB) requirements (Jonson, 2006). A
similar type of survey can be sent to employers or company recruiters. This survey can be used
to ask about desired job skills for students who will graduate from the program. Current
employers or recruiters provide unique insights (Palomba & Banta, 1999) into valued skills that
cannot be replicated with any on campus assessment method (Stassen et al., 2001).
Unfortunately obtaining a good response rate or contacting willing employers is difficult and
time consuming. Both types of surveys, alumni and employer, must be carefully constructed in
order to get useful data in return (Stassen et al., 2001).
24
It may be easier to assess student learning by incorporating assignments into classes or
capstone courses through embedded assignments. Course embedded assignments are either
regular class activities or assessment specific items that are seamlessly integrated into a course
(Jonson, 2006; Stassen et al., 2001). Embedded assignments are authentic representations of
student knowledge that are convenient and typically easy to administer (Jonson, 2006; Stassen et
al., 2001). These assessment methods include in-class assignments, objective tests, papers,
posters, or performances.
Options for conducting in-class embedded assignments include discussion board posts,
free-writing, or minute papers. These short assignments provide immediate feedback to faculty
and little intrusion into courses (Jonson, 2006). Course embedded assignments may take a lot of
time to prepare and there is little documentation on their true value to assessment (Stassen et al.,
2001). Embedded assignments of this type should be used in combination with other assessment
measures in order to provide a complete view of student understanding (Jonson, 2006). Palomba
and Banta (1999) point out that when individual teachers conduct classroom assessment, “it is a
challenge to get the results to add up to a coherent picture of what is going on in a program” (p.
176). This disconnect should encourage faculty discussion on the alignment of course and
program goals throughout the curriculum (Jonson, 2006).
Embedded assessment methods also include objective tests that are typically part of
normal course assessment. Classroom tests are a direct type of assessment and include
nationally standardized and locally developed instruments with multiple choice or true/false
questions (Palomba & Banta, 1999). Both types of tests check for basic competencies and allow
programs to compare student achievement after taking the same test (Maki, 2010). National tests
are advantageous because they allow the examination of a large group of students in a short time
25
frame (Palomba & Banta, 1999). Another advantage of national tests is that they are exposed to
reliability, validity, and other psychometric studies (Jonson, 2006; Maki, 2010). National,
standardized tests however are often not directly aligned with program learning outcomes and
typically fail to provide realistic insight into problem solving processes (Maki, 2010). This type
of test is generally used for the certification of professional skills as mandated by external
requirements. Often there are no national standardized tests that are appropriate within
individual courses (Maki, 2010). In this case, local exams are developed to better integrate
course and program level student learning outcomes. Local exams, however, may be difficult to
create and may suffer from poor quality questions (Jonson, 2006; Palomba & Banta, 1999).
Overall, national and local tests are only able to examine low-level knowledge (Jonson, 2006).
Capstone courses serve as an appropriate location for assessing student learning
outcomes in an undergraduate program (Palomba & Banta, 1999). According to the Macalester
College Catalog (2012), capstone courses are designed to “give students experience with reading
original research literature, doing original work, or presenting a performance”. This type of
course is growing in popularity and serves as a comprehensive experience for graduating seniors
(Palomba & Banta, 1999). Because capstones are typically a required course, they are the
perfect place to assess the knowledge of graduates. In contrast to objective tests, capstone
courses provide opportunities to assess student learning at a higher level (Maki, 2010). In this
type of culminating course, students are able to demonstrate synthesis and evaluation of
cognitive abilities (Bloom & Krathwohl, 1956).
Capstone courses, as well as other courses throughout the curriculum, can utilize posters,
presentations, and/or papers to assess student learning. All three methods are direct, embedded,
and can be either summative or formative. Posters, through an individual or team effort, serve as
26
a visual depiction of student work. When included in a departmental poster session, students can
practice summarizing their work to attendees. Including an award in poster sessions can also
greatly increase student motivation. Posters reduce the grading burden as compared to papers
and better integrate communication skills (Jonson, 2006). Unfortunately, posters and the groups
presenting them may be handicapped if their displays are not aesthetically pleasing (Jonson,
2006).
Oral presentations are often a difficult and fear-inducing task for many students (Jonson,
2006). Students are forced to think on their feet and practice crucial communication skills.
International students or students with language difficulties, however, are at a notable
disadvantage regardless of their underlying knowledge. Poor quality presentations are often a
waste of time, and professors find it difficult to grade fairly the performances (Jonson, 2006).
Papers are another method to track student learning and enhance critical communication skills.
Students are able to write multiple drafts of their paper and receive feedback throughout the
process. This is very useful, but labor intensive for the faculty involved (Jonson, 2006).
2.4.4 Utilizing Rubrics in Assessment
Many programs already include projects, presentations, or papers in their courses, but
adding a rubric to these items can aid in program assessment (Stassen et al., 2001). Consider, for
example, course papers, which are a qualitative and direct assessment method. While papers
certainly demonstrate individual student learning, it is difficult to use papers written by
individual students to understand the collective knowledge of the group. This makes it difficult
to determine, using the papers, whether or not the program’s student learning outcomes are being
mastered. When grades are assigned to papers, this value is quantitative and indirect. Grades are
27
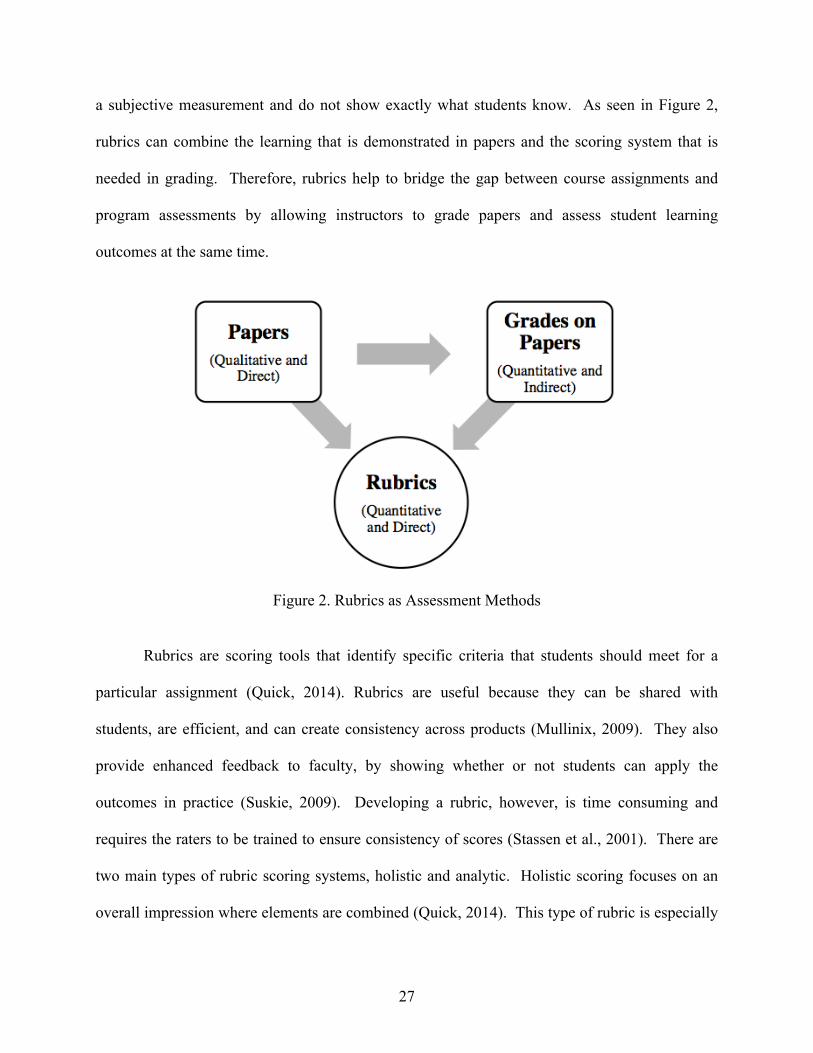
a subjective measurement and do not show exactly what students know. As seen in Figure 2,
rubrics can combine the learning that is demonstrated in papers and the scoring system that is
needed in grading. Therefore, rubrics help to bridge the gap between course assignments and
program assessments by allowing instructors to grade papers and assess student learning
outcomes at the same time.
Figure 2. Rubrics as Assessment Methods
Rubrics are scoring tools that identify specific criteria that students should meet for a
particular assignment (Quick, 2014). Rubrics are useful because they can be shared with
students, are efficient, and can create consistency across products (Mullinix, 2009). They also
provide enhanced feedback to faculty, by showing whether or not students can apply the
outcomes in practice (Suskie, 2009). Developing a rubric, however, is time consuming and
requires the raters to be trained to ensure consistency of scores (Stassen et al., 2001). There are
two main types of rubric scoring systems, holistic and analytic. Holistic scoring focuses on an
overall impression where elements are combined (Quick, 2014). This type of rubric is especially
28
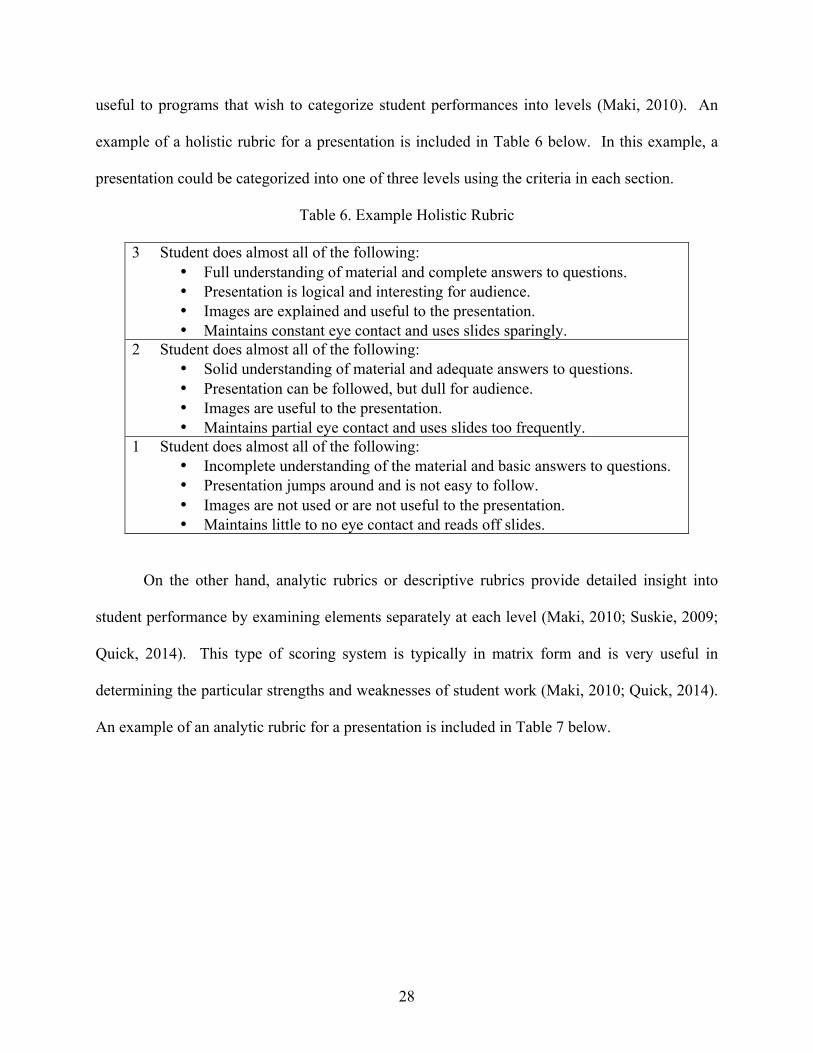
useful to programs that wish to categorize student performances into levels (Maki, 2010). An
example of a holistic rubric for a presentation is included in Table 6 below. In this example, a
presentation could be categorized into one of three levels using the criteria in each section.
Table 6. Example Holistic Rubric
3 Student does almost all of the following: • Full understanding of material and complete answers to questions. • Presentation is logical and interesting for audience. • Images are explained and useful to the presentation. • Maintains constant eye contact and uses slides sparingly.
2 Student does almost all of the following: • Solid understanding of material and adequate answers to questions. • Presentation can be followed, but dull for audience. • Images are useful to the presentation. • Maintains partial eye contact and uses slides too frequently.
1 Student does almost all of the following: • Incomplete understanding of the material and basic answers to questions. • Presentation jumps around and is not easy to follow. • Images are not used or are not useful to the presentation. • Maintains little to no eye contact and reads off slides.
On the other hand, analytic rubrics or descriptive rubrics provide detailed insight into
student performance by examining elements separately at each level (Maki, 2010; Suskie, 2009;
Quick, 2014). This type of scoring system is typically in matrix form and is very useful in
determining the particular strengths and weaknesses of student work (Maki, 2010; Quick, 2014).
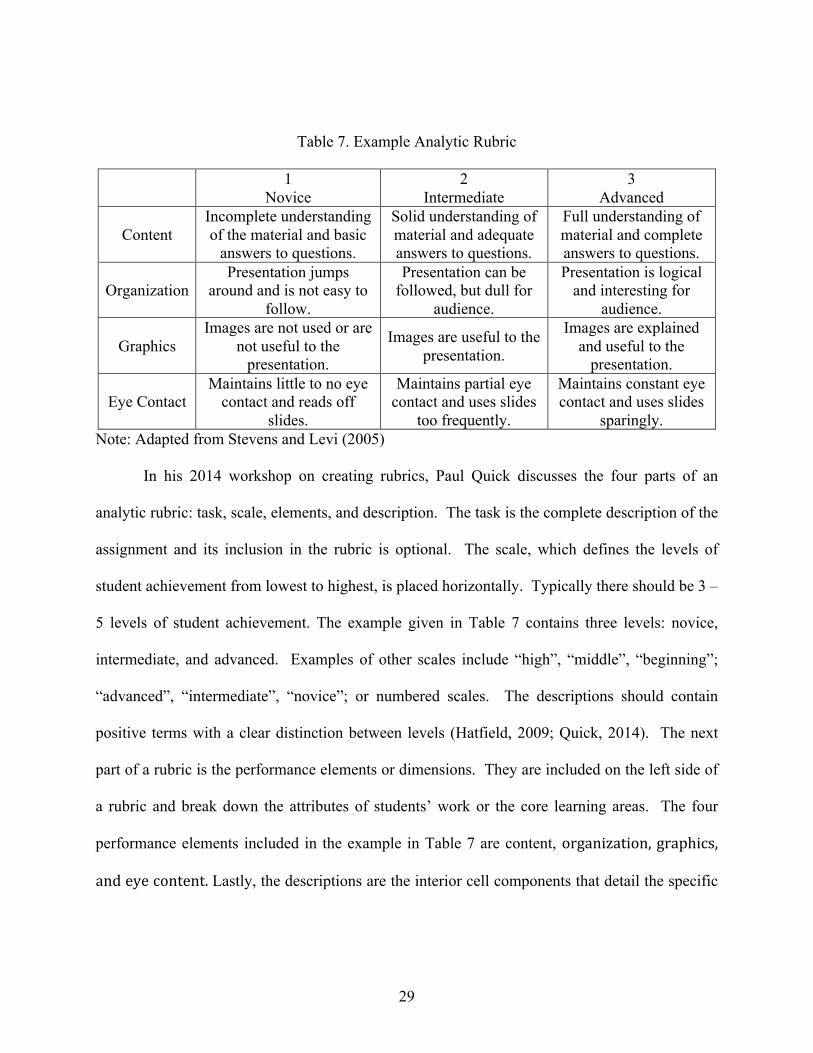
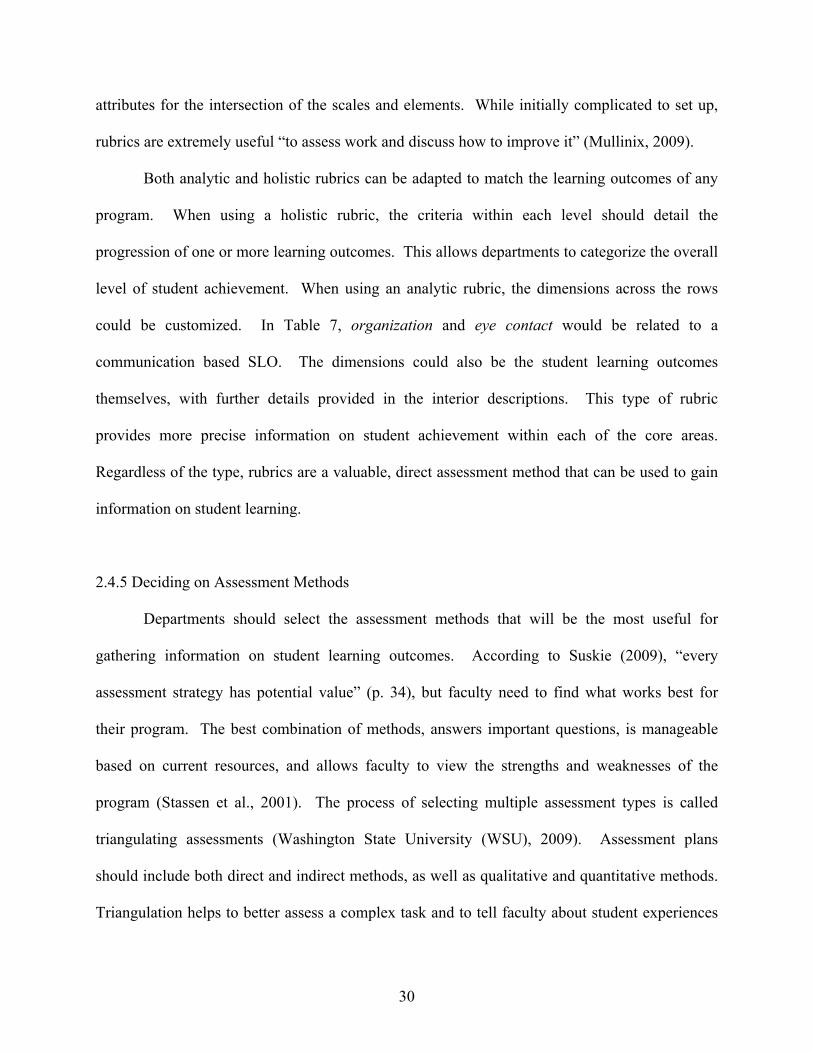
An example of an analytic rubric for a presentation is included in Table 7 below.
29
Table 7. Example Analytic Rubric
1 Novice
2 Intermediate
3 Advanced
Content Incomplete understanding of the material and basic
answers to questions.
Solid understanding of material and adequate answers to questions.
Full understanding of material and complete answers to questions.
Organization Presentation jumps
around and is not easy to follow.
Presentation can be followed, but dull for
audience.
Presentation is logical and interesting for
audience.
Graphics Images are not used or are
not useful to the presentation.
Images are useful to the presentation.
Images are explained and useful to the
presentation.
Eye Contact Maintains little to no eye
contact and reads off slides.
Maintains partial eye contact and uses slides
too frequently.
Maintains constant eye contact and uses slides
sparingly. Note: Adapted from Stevens and Levi (2005)
In his 2014 workshop on creating rubrics, Paul Quick discusses the four parts of an
analytic rubric: task, scale, elements, and description. The task is the complete description of the
assignment and its inclusion in the rubric is optional. The scale, which defines the levels of
student achievement from lowest to highest, is placed horizontally. Typically there should be 3 –
5 levels of student achievement. The example given in Table 7 contains three levels: novice,
intermediate, and advanced. Examples of other scales include “high”, “middle”, “beginning”;
“advanced”, “intermediate”, “novice”; or numbered scales. The descriptions should contain
positive terms with a clear distinction between levels (Hatfield, 2009; Quick, 2014). The next
part of a rubric is the performance elements or dimensions. They are included on the left side of
a rubric and break down the attributes of students’ work or the core learning areas. The four
performance elements included in the example in Table 7 are content, organization, graphics,
and eye content. Lastly, the descriptions are the interior cell components that detail the specific
30
attributes for the intersection of the scales and elements. While initially complicated to set up,
rubrics are extremely useful “to assess work and discuss how to improve it” (Mullinix, 2009).
Both analytic and holistic rubrics can be adapted to match the learning outcomes of any
program. When using a holistic rubric, the criteria within each level should detail the
progression of one or more learning outcomes. This allows departments to categorize the overall
level of student achievement. When using an analytic rubric, the dimensions across the rows
could be customized. In Table 7, organization and eye contact would be related to a
communication based SLO. The dimensions could also be the student learning outcomes
themselves, with further details provided in the interior descriptions. This type of rubric
provides more precise information on student achievement within each of the core areas.
Regardless of the type, rubrics are a valuable, direct assessment method that can be used to gain
information on student learning.
2.4.5 Deciding on Assessment Methods Departments should select the assessment methods that will be the most useful for
gathering information on student learning outcomes. According to Suskie (2009), “every
assessment strategy has potential value” (p. 34), but faculty need to find what works best for
their program. The best combination of methods, answers important questions, is manageable
based on current resources, and allows faculty to view the strengths and weaknesses of the
program (Stassen et al., 2001). The process of selecting multiple assessment types is called
triangulating assessments (Washington State University (WSU), 2009). Assessment plans
should include both direct and indirect methods, as well as qualitative and quantitative methods.
Triangulation helps to better assess a complex task and to tell faculty about student experiences
31
throughout the curriculum (Palomba & Banta, 1999). Using multiple methods and assessment
types is advantageous because it gives students a variety of opportunities to display what they
have learned (Maki, 2010). Within an assessment plan, ideas are reinforced when multiple
methods point to the same findings and ideas are challenged when multiple methods disagree
(Stassen et al., 2001).
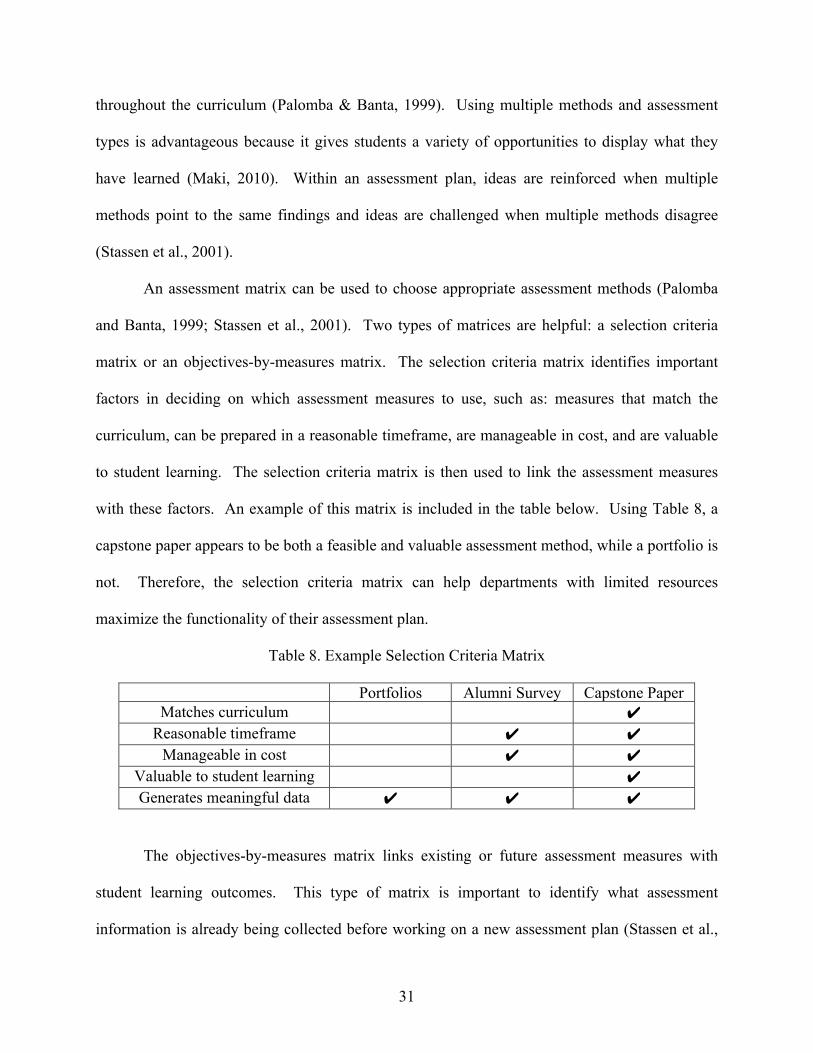
An assessment matrix can be used to choose appropriate assessment methods (Palomba
and Banta, 1999; Stassen et al., 2001). Two types of matrices are helpful: a selection criteria
matrix or an objectives-by-measures matrix. The selection criteria matrix identifies important
factors in deciding on which assessment measures to use, such as: measures that match the
curriculum, can be prepared in a reasonable timeframe, are manageable in cost, and are valuable
to student learning. The selection criteria matrix is then used to link the assessment measures
with these factors. An example of this matrix is included in the table below. Using Table 8, a
capstone paper appears to be both a feasible and valuable assessment method, while a portfolio is
not. Therefore, the selection criteria matrix can help departments with limited resources
maximize the functionality of their assessment plan.
Table 8. Example Selection Criteria Matrix
Portfolios Alumni Survey Capstone Paper Matches curriculum ✔
Reasonable timeframe ✔ ✔ Manageable in cost ✔ ✔
Valuable to student learning ✔ Generates meaningful data ✔ ✔ ✔
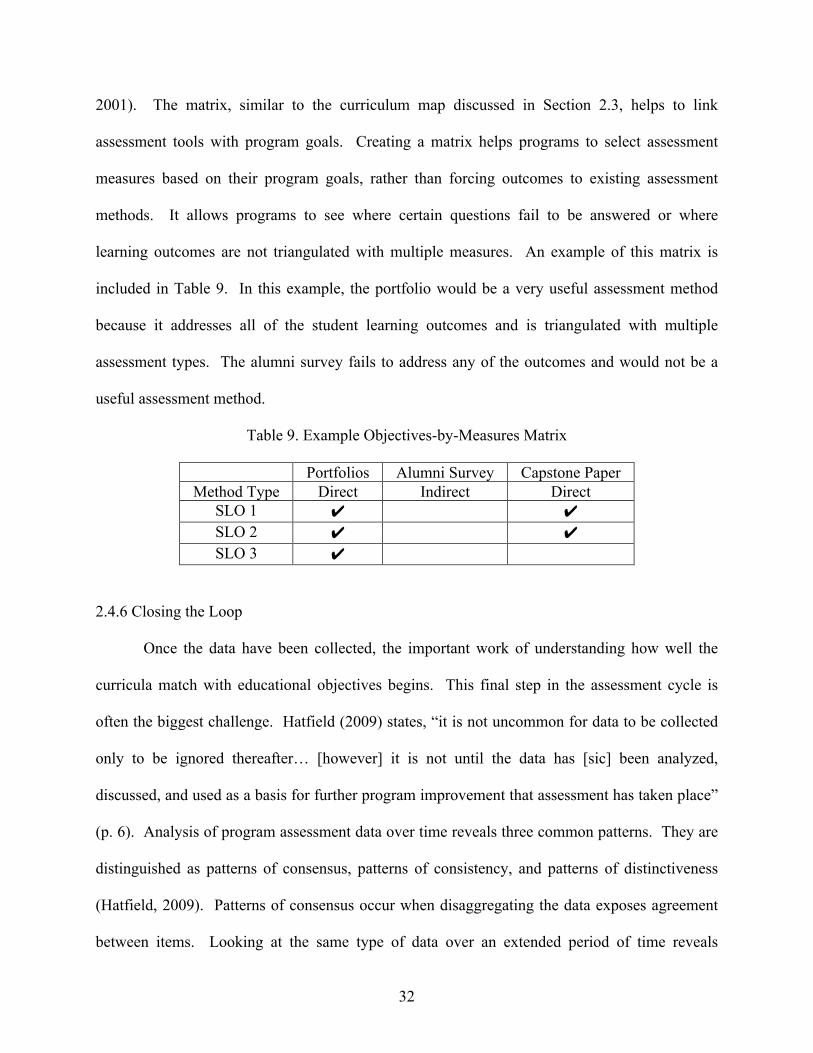
The objectives-by-measures matrix links existing or future assessment measures with
student learning outcomes. This type of matrix is important to identify what assessment
information is already being collected before working on a new assessment plan (Stassen et al.,
32
2001). The matrix, similar to the curriculum map discussed in Section 2.3, helps to link
assessment tools with program goals. Creating a matrix helps programs to select assessment
measures based on their program goals, rather than forcing outcomes to existing assessment
methods. It allows programs to see where certain questions fail to be answered or where
learning outcomes are not triangulated with multiple measures. An example of this matrix is
included in Table 9. In this example, the portfolio would be a very useful assessment method
because it addresses all of the student learning outcomes and is triangulated with multiple
assessment types. The alumni survey fails to address any of the outcomes and would not be a
useful assessment method.
Table 9. Example Objectives-by-Measures Matrix
Portfolios Alumni Survey Capstone Paper Method Type Direct Indirect Direct
SLO 1 ✔ ✔ SLO 2 ✔ ✔ SLO 3 ✔
2.4.6 Closing the Loop Once the data have been collected, the important work of understanding how well the
curricula match with educational objectives begins. This final step in the assessment cycle is
often the biggest challenge. Hatfield (2009) states, “it is not uncommon for data to be collected
only to be ignored thereafter… [however] it is not until the data has [sic] been analyzed,
discussed, and used as a basis for further program improvement that assessment has taken place”
(p. 6). Analysis of program assessment data over time reveals three common patterns. They are
distinguished as patterns of consensus, patterns of consistency, and patterns of distinctiveness
(Hatfield, 2009). Patterns of consensus occur when disaggregating the data exposes agreement
between items. Looking at the same type of data over an extended period of time reveals
33
patterns of consistency. Lastly, looking at data across various outcomes to see which outcomes
perform the best, shows patterns of distinctiveness. Upon identifying patterns, programs can
classify the trend, determine whether the achievements are acceptable, and discuss any surprises
(Hatfield, 2009). The term “closing the loop” (Gordon, 2013b; Hatfield, 2009) is an assessment
cliché that describes the changes that are encouraged by the patterns in the data. Programs
should use data to influence curricular reform when the true and desired performances are not in
concordance. Sometimes data suggest that departmental policies should be reviewed. This
could include advising methods, admissions criteria, or methods for managing students through
the curriculum. Most importantly, assessment data should encourage faculty discussion about
student learning and programs as a whole.
2.5 Student Learning Outcomes in Statistics
In 2000, the American Statistical Association (ASA) composed the Curriculum
Guidelines for Undergraduate Programs in Statistical Science. This list contains the
recommended principles, skills needed, and curriculum topics for college statistics programs. It
is interesting that the guidelines state that an “undergraduate program is not intended to train
professional statisticians” (American Statistical Association [ASA], 2000). In addition, the ASA
suggests that programs include practical experience by incorporating some type of capstone
course, internship, senior project, or consulting experience.
The guidelines established by the American Statistical Association are not strict rules, but
they serve as suggestions for undergraduate programs. The ASA’s principles state that statistics
programs should be flexible enough to fit within institutional constraints and satisfy students
with a variety of long-term goals (including employment, focuses in other fields, and graduate
school). The programs should expand upon the material learned in introductory courses, while
34
incorporating real data. The guidelines also make the distinction between statistics and
mathematics disciplines, since curricula for the former should include nonmathematical topics.
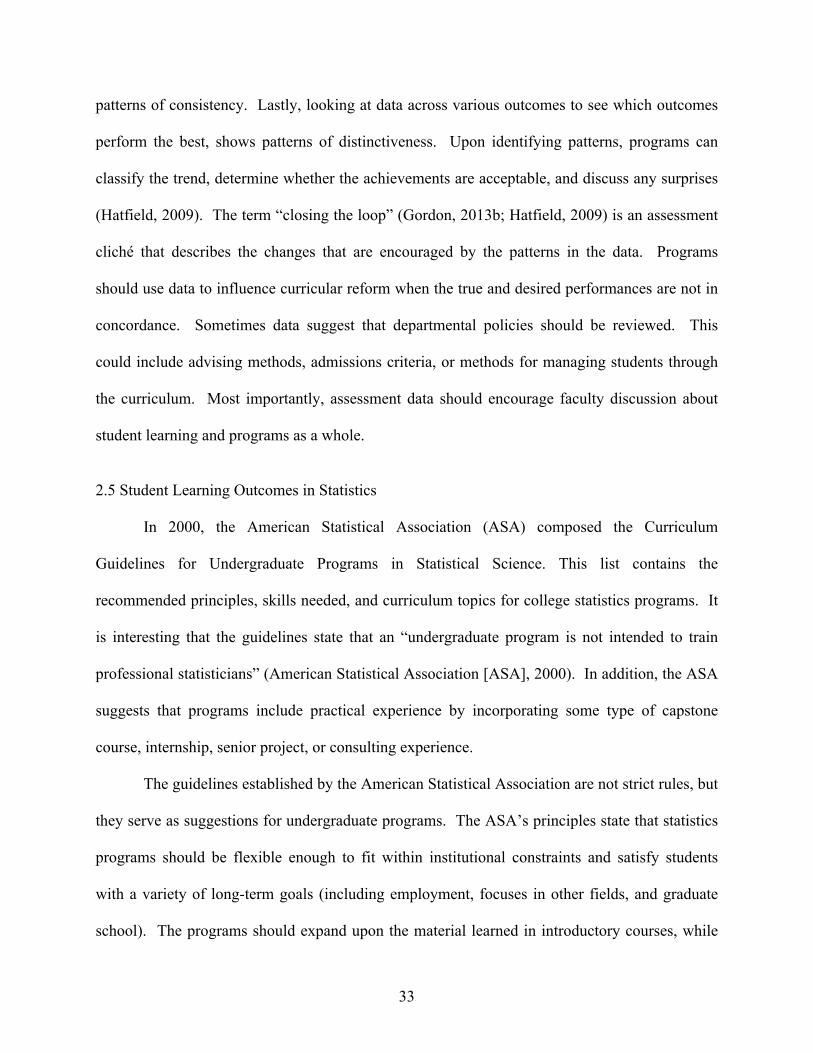
The skills suggested for a statistics curriculum are combined into five areas: statistical,
mathematical, computational, nonmathematical, and a substantive area. The skills and their
descriptions are included in Table 10 below. For those students who plan to go on to graduate
work, it is essential to include more mathematics courses in their plan of study.
Table 10. Skills Needed by Undergraduate Majors
Skills Description
Statistical Training in statistical reasoning, designing studies, exploratory analysis of data, formal inference procedures
Mathematical Probability, statistical theory, prerequisite mathematics (specifically calculus and linear algebra)
Computational Familiarity with standard statistical software packages, data management, algorithmic problem solving
Nonmathematical Write clearly, speak fluently, collaboration skills, teamwork, managing projects
Substantive Area Depth in an area of application Note: From ASA (2000)
The guidelines also set forth a list of curriculum topics for the undergraduate degree in
statistical science. The curriculum topics are consistent with the skills in Table 10, but include
additional details for the statistical component and include probability instead of a substantive
area. Curricula should include statistical topics such as point and interval estimation, hypothesis
testing, graphing data, logistic regression, categorical data, random sampling, analysis of
variance, and stratification. With respect to probability, courses should emphasize “connections
between concepts and their applications to statistics” (ASA, 2000). To include additional topics,
programs should choose electives the offering of which are feasible for their institution. If it is
helpful or possible, institutions can also tailor their programs to four industries:
35
industry/manufacturing/engineering, medical, business/management, and government (Bryce, et
al., 2000).
The 2014 President of the ASA, Dr. Nat Schenker, created a workgroup to revise the
previous guidelines established in 2000. A webinar series was also launched to stimulate
discussions about necessary changes to the guidelines. During the fall of 2013, four webinars
were conducted each focusing on one aspect relating to undergraduate statistics programs: large
programs, big data, capstone courses, and community colleges. In the first webinar,
representatives from large programs discussed their methods for teaching their students the “soft
skills” of communication and technical writing. Many colleges have increased their focus on
communication and technical writing, through either existing or additional courses (Horton,
2013). From the webinar discussions, one can anticipate that the ASA curriculum topics are
likely to remain similar to the five skill categories identified in the 2000 document. The biggest
change is expected in the computational section due to the rise of prominence of the area of big
data within the discipline of statistics. Other feedback on the ASA guidelines suggested the
incorporation of mathematical modeling, messy or inaccurate data, and/or database expertise
(Horton, 2013). The guidelines will be updated after Summer 2014, with initial
recommendations being presented at the 2014 Joint Statistical Meeting.
2.6 Assessment in Statistics
In a 2005 presentation at the Joint Statistics Meetings, Peck and Chance (2007) discussed
the programmatic assessment experience of the Statistics Department at Cal Poly San Luis
Obispo. The department began with a bulleted list of 77 content topics from the courses in their
program. Once they viewed the curriculum as a single entity, they were able to narrow down the
36
list to six main objectives. By discussing and reducing the objectives, the department was able
“to create a shared vision of program goals” (p. 3). Their second step was to collect baseline
data using an exit survey given in the capstone course. They were mainly interested in seeing if
students could chose a correct method of analysis, understand sampling variability, and explain
the meaning of a p-value. Peck and Chance describe the results as “a bit depressing” and an eye-
opening experience. They found that most students were unable to explain p-values to someone
without a statistical background. Overall, the survey showed that key aspects of their curriculum
were not being met. Students were confident of their understanding of a topic, but could not
demonstrate this knowledge. The department at Cal Poly San Luis Obispo has continued the
assessment process and is now able to review their data for trends in student learning. They
discuss the results each year at their fall department retreat.
The Statistics Department at Iowa State University discussed their assessment plan in a
1999 report by Groeneveld and Stephenson. The faculty agreed on five statements of the
knowledge, skills, and abilities that were expected of their graduates. The corresponding
assessment plan consisted of grade distributions, records of student internships and future plans,
a survey of employers, and an alumni questionnaire. When looking at the overall grade
distributions, the department found that students have the most difficulty in the theory courses.
Through the employer survey, the department learned that the students had a solid work ethic,
but were unable to apply and communicate statistics. The graduates agreed, saying they needed
more help developing their oral and written communication skills. As a result of the assessment,
the department at Iowa State updated their computer workstations, redesigned their sampling
course, and added two required communications courses.
37
The Office of Assessment at the University of Rochester (2014) outlines the assessment
plan for the Bachelor of Science Degree in Applied Mathematics. Their plan is very reasonable
for medium-sized departments to implement and uses a combination of both direct and indirect
assessment measures. To gauge student learning, the department first conducts a syllabus
analysis by matching the expectations of their courses to the program as a whole. Each year,
they select one student learning outcome to highlight for assessment. This outcome is reviewed
through course embedded assignments where students are expected to show mastery of the topic.
Every year the department gives the graduating students a senior survey and every five years an
alumni survey is conducted. These surveys record employment, graduate school rates, awards,
and scholarships. With respect to indirect measures, the department looks at the satisfaction and
self-assessment ratings from the two surveys. They also conduct a bi-annual focus group to
review the program. The data collected through the University of Rochester’s assessment plan
are reviewed annually by the department’s undergraduate committee.
The experiences of Cal Poly San Luis Obispo, Iowa State University, and the University
of Rochester provide useful insight into the practical ways to introduce assessment into
undergraduate statistics programs.
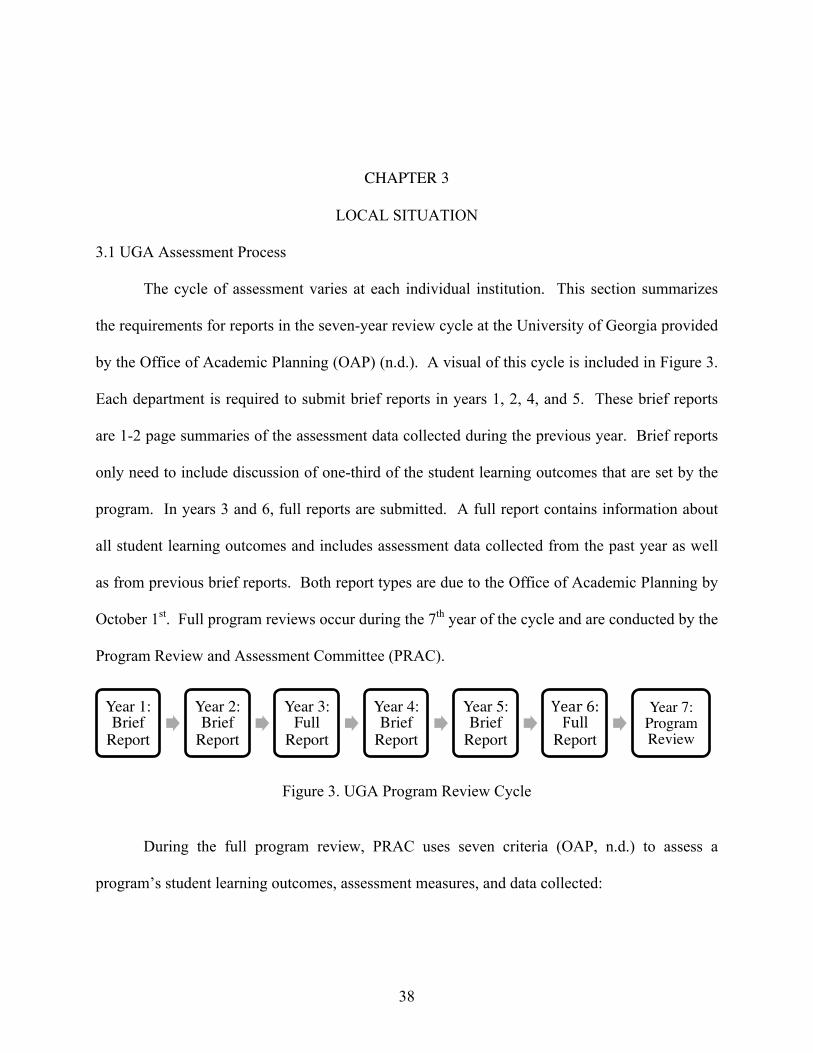
38
CHAPTER 3
LOCAL SITUATION
3.1 UGA Assessment Process
The cycle of assessment varies at each individual institution. This section summarizes
the requirements for reports in the seven-year review cycle at the University of Georgia provided
by the Office of Academic Planning (OAP) (n.d.). A visual of this cycle is included in Figure 3.
Each department is required to submit brief reports in years 1, 2, 4, and 5. These brief reports
are 1-2 page summaries of the assessment data collected during the previous year. Brief reports
only need to include discussion of one-third of the student learning outcomes that are set by the
program. In years 3 and 6, full reports are submitted. A full report contains information about
all student learning outcomes and includes assessment data collected from the past year as well
as from previous brief reports. Both report types are due to the Office of Academic Planning by
October 1st. Full program reviews occur during the 7th year of the cycle and are conducted by the
Program Review and Assessment Committee (PRAC).
Figure 3. UGA Program Review Cycle
During the full program review, PRAC uses seven criteria (OAP, n.d.) to assess a
program’s student learning outcomes, assessment measures, and data collected:
Year 1: Brief
Report
Year 2: Brief
Report
Year 3: Full
Report
Year 4: Brief
Report
Year 5: Brief
Report
Year 6: Full
Report
Year 7: Program Review
39
1. Clearly defined SLOs that are also measureable
2. Assessment measures address the degree to which students obtain SLOs
3. Assessment measures are independent of grades and teaching evaluations
4. Multiple assessment methods are used
5. Data are collected over time
6. Data result in findings relevant to program
7. Improvements are planned and implemented
3.2 Our Department
The University of Georgia (UGA) was founded in 1785 as the first state-chartered
university in the United States. UGA is located in Athens, Georgia, sixty miles northeast of
downtown Atlanta. There are a total of 35,000 students and specifically 26,000 undergraduates
(Public Affairs Division, 2013). In 1964, the Department of Statistics was formally established
and has grown dramatically over the years. As of 2012, there were 24 faculty members (18
tenure-track and 6 nontenure-track), 4 adjunct appointees, and 4 staff members (Stufken &
Taylor, 2013). A 2012 report by Franklin, the Department of Statistics Undergraduate
Coordinator at UGA, discussed the purposes of the undergraduate program. The primary
purpose is to provide students with a strong statistical background that will lead to a Bachelor of
Science degree and prepare students for a career after graduation. Additionally, the department
is responsible for teaching core classes to students across the university. These courses include
introductory statistics, business statistics, statistics for math educators, and two honors courses.
Between 1964 and 2010, the undergraduate program at UGA has awarded 493 bachelor’s
degrees (Stufken & Taylor, 2013). In addition to their statistical studies, many of the graduates
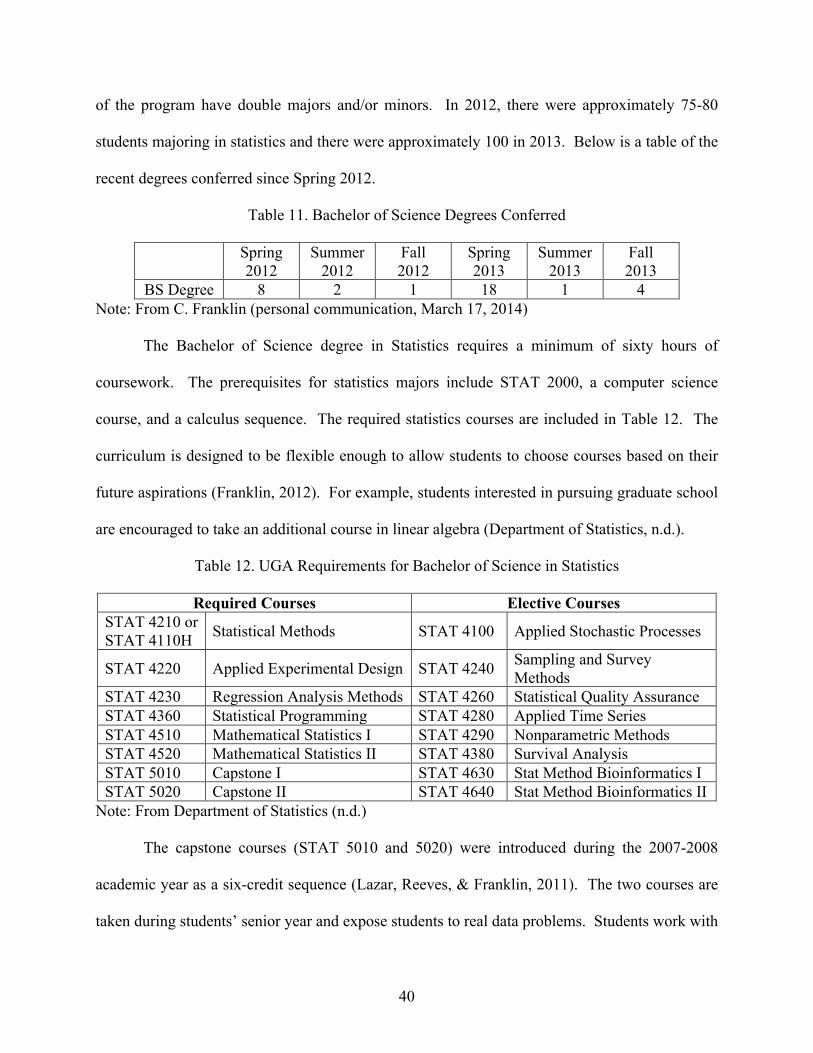
40
of the program have double majors and/or minors. In 2012, there were approximately 75-80
students majoring in statistics and there were approximately 100 in 2013. Below is a table of the
recent degrees conferred since Spring 2012.
Table 11. Bachelor of Science Degrees Conferred
Spring 2012
Summer 2012
Fall 2012
Spring 2013
Summer 2013
Fall 2013
BS Degree 8 2 1 18 1 4 Note: From C. Franklin (personal communication, March 17, 2014)
The Bachelor of Science degree in Statistics requires a minimum of sixty hours of
coursework. The prerequisites for statistics majors include STAT 2000, a computer science
course, and a calculus sequence. The required statistics courses are included in Table 12. The
curriculum is designed to be flexible enough to allow students to choose courses based on their
future aspirations (Franklin, 2012). For example, students interested in pursuing graduate school
are encouraged to take an additional course in linear algebra (Department of Statistics, n.d.).
Table 12. UGA Requirements for Bachelor of Science in Statistics
Required Courses Elective Courses STAT 4210 or STAT 4110H Statistical Methods STAT 4100 Applied Stochastic Processes
STAT 4220 Applied Experimental Design STAT 4240 Sampling and Survey Methods
STAT 4230 Regression Analysis Methods STAT 4260 Statistical Quality Assurance STAT 4360 Statistical Programming STAT 4280 Applied Time Series STAT 4510 Mathematical Statistics I STAT 4290 Nonparametric Methods STAT 4520 Mathematical Statistics II STAT 4380 Survival Analysis STAT 5010 Capstone I STAT 4630 Stat Method Bioinformatics I STAT 5020 Capstone II STAT 4640 Stat Method Bioinformatics II
Note: From Department of Statistics (n.d.)
The capstone courses (STAT 5010 and 5020) were introduced during the 2007-2008
academic year as a six-credit sequence (Lazar, Reeves, & Franklin, 2011). The two courses are
taken during students’ senior year and expose students to real data problems. Students work with
41
clients to investigate research questions, while gaining experience that could not be acquired in a
traditional classroom setting. The UGA capstone sequence has been so successful that it was
featured at the 2012 Joint Statistical Meetings as well as an ASA webinar in 2013. Over the
years, the capstone classes have established three major themes (Lazar et al., 2011, p. 183):
1) Teaching advanced/modern statistical methods to undergraduate statistics students;
2) Giving these students an intensive, year-long data analysis experience; and
3) Providing the students with an opportunity to improve their written and oral
communication skills
3.3 Previous Work by Our Department
On December 10, 2002, the faculty unanimously approved the major assessment plan of
the undergraduate statistics major. The report by Franklin (2003) states that the main goal of the
assessment plan is:
To see how well the undergraduate statistics major curriculum teaches students the
fundamental concepts of working with data and the quantitative skills needed to prepare
them for a career using statistics and/or to further their education in the field of statistics.
(p. 1)
Implemented starting in 2003, the current assessment plan had four main components.
Part 1 is an assessment based on student performances in essential courses. The instructors of
these courses compile a roster of grades, exam scores, and assignments. They also provide a
brief statement on the strengths and weaknesses of each student to the department head. The
undergraduate committee then meets with the department head to discuss any issues that have
arisen as a result of the student performance summaries. Students are considered successful with
42
grades of a C or better in their courses. Part 2 of the current assessment plan is an assessment
based on student portfolios that combine work from three to five courses. Students include data
analysis projects, essays, and power point presentations as well as an explanation of why each
item was included. Part 3 is a combination of surveys and exit interviews. The first survey is an
alumni survey that is mailed together with the annual departmental newsletter. Another survey is
sent to current students to get their feedback on the undergraduate program. Finally, the
department administers an oral exit interview to every student prior to graduation. In the exit
interview students discuss the knowledge that they gained in the program and provide feedback
on their undergraduate experiences. Part 4 of the assessment plan consists of an annual faculty
analysis of the surveys and results collected during the program assessment process.
The last full review of the Department of Statistics using this assessment plan occurred
during the 2012-2013 academic year. The 2012 report by Franklin describes the purposes,
strengths, weaknesses, and curriculum changes that were made to the undergraduate program in
the last seven years. During this time frame, the department added the capstone course,
separated the mathematical statistics courses (STAT 4510 and 4520) from the master’s level
courses, and incorporated both SAS and R into the programming course (STAT 4360).
Departmental strengths mentioned in the surveys include small class sizes in 4000 level courses,
accessible faculty, the capstone courses, and the sense of community within the department for
undergraduate students. Another strength is the growth in the number of undergraduate students
within the major and those earning a minor in mathematics. Additionally, the department has
been able to offer a diverse curriculum where students can gain mathematical, computing, and
communication skills. Current department weaknesses include lack of contact with alumni, a
deficit in student achievement of maturity in higher-level mathematics early in their academic
43
careers, and having enough seats in courses to meet the growing demand. The undergraduate
program also has difficulties balancing the differences between majors and non-majors in terms
of abilities, long-term goals, or ‘things they need to learn from the course to be successful after
graduation within courses offered to both majors and non-majors (Franklin, 2012). For
example, statistics majors should know some theory behind regression, but non-majors may just
need to be able to analyze software output. Therefore, the program has difficulties combining
these two different ‘needs’ in a single course.
The next full review for the department will occur in 2019-2020. Chapter 4 of this report
describes the development of the assessment plan that will be used for this review.
44
CHAPTER 4
CURRENT PROCESS
Upon starting this project, the author of this paper attended two UGA sponsored
workshops on writing outcomes and deciding on assessment procedures (Gordon, 2013a and
2013b). The workshops discussed the basic theory behind learning outcomes and program
assessment. The first workshop allowed department representatives to practice rewriting existing
learning outcomes and receive feedback from colleagues in other departments. The second
workshop exposed attendees to assessment types and methods that were being successfully
utilized by other programs on UGA’s campus. The information obtained during these workshops
jumpstarted the assessment process within the statistics department.
Within the Department of Statistics at UGA, a Learning Outcome Assessment (LOA)
Committee was created to discuss changes to current outcomes at the three program levels
(Bachelor, Master, and Ph.D.). The committee consists of five faculty members: the Associate
Department Head, Graduate Advisor, Graduate Director of Admissions, Undergraduate
Coordinator, and an Assistant Professor active in Statistics Education research. The goal of this
committee is to reestablish the learning outcomes and assessment plan for the Statistics
Department at UGA. As discussed in Section 2.1, the first step in program assessment is to
develop the student learning outcomes. Prior to the actions discussed in this report, the
undergraduate learning outcomes were the same as those outlined by the ASA. In the first
meeting of this committee, four broad learning areas were established and motivated by the ASA
45
Curriculum Guidelines (ASA, 2000). The department chose to focus the learning outcomes in
four core areas: theory, data analysis, computing, and communication.
The second meeting of the committee brought discussion of the objectives within the four
core areas. Individual members provided a written description of each of the core areas based on
their typical teaching focus. The committee discussed the purpose of creating the outcomes and
how they could possibly be assessed. They also began working on a curriculum map for each of
the three program levels in relation to the four core areas. A smaller breakout group met later
that month to edit the document and add further details to the curriculum map. This small group
utilized the ASA guidelines and learning outcomes from similar statistics programs as
inspiration. This group also decided it was best to build the learning objectives in cumulative
levels throughout the bachelor, masters, and Ph.D. program. The following statement is included
at the top of the objectives to explain this progression:
The first column states the ASA expectations for the element of training. The
subsequent columns elaborate on the details of that training, building in an inclusive way
from the B.S. level, to the M.S. level, to the Ph.D. level (that is, B.S. level knowledge is
also expected of M.S. students; B.S. and M.S. level knowledge are also expected of
Ph.D. students). These levels (degrees) are based on experience.
The format of student learning outcomes was discussed in Section 2.2 of this document.
The outcomes were written in such a way as to help instructors, professors, and graduate
teaching assistants match their course materials to the department’s overall plan. The learning
outcomes then went through a series of critiques and rewrites before they were presented to the
full faculty. Critiques brought about by committee members included discussions of specific
items in each learning area as well as how classes fit into the curriculum map. The outcomes
46
were also edited to change terms such as “understand” and “know” to action verbs (see Table 2).
For example, in the computing core area a statement originally read, "Students should also use
technology to visualize concepts and understand abstract ideas through simulations." The word
understand was changed to the action verb, illustrate to create a measurable student learning
outcome. Once the LOA committee was satisfied with the learning outcomes, they were
presented to the department at the January 2014 faculty meeting. Overall, the learning outcomes
were well received by the faculty and started a productive conversation. The initial skepticism
by faculty about the LOA process was greatly diminished when committee members explained
the purpose of program assessment. The main issues for faculty stemmed from the confusion
between course assessment that is commonly used by faculty, and programmatic assessment.
Members of the LOA committee explained that program assessment is meant to evaluate
programs as a whole and not individual instructors, classes, or students. Faculty members made
interesting observations on the outcomes and curriculum maps. One member said that in the past
he had focused on teaching a lot of technical material rather than working on communication
skills through papers, group work, or presentations. Other faculty agreed, saying that they could
do a better job of incorporating communications into their courses. Faculty who had additional
concerns or contributions were asked to send them to the LOA committee.
The discussion of learning outcomes and curriculum mapping led to a brief discussion of
the future of programmatic assessment in the department. Faculty members were concerned
about the university guidelines and restrictions with respect to assessment. In designing the
assessment plan, it is important that the plan be something that is manageable and informative
the department, so the university criteria will be used as loose, rather than rigid, guidelines.
Attendees of the faculty meeting also showed interest in developing rubrics for presentations and
47
papers throughout the three program levels. Rubrics can be incorporated in capstone posters,
capstone presentations, and graduate level requirements such as the qualifying exams, theses,
dissertations, and proposals. Lastly, a professor pointed out that within our courses, topics
covered and teaching methods should evolve based on the outcomes and new data received from
assessment. This is a very key item and it emphasizes that programmatic assessment is an
iterative process meant to improve student learning.
After much revision and discussion, the faculty approved the revised outcomes during the
Spring 2014 semester. The finalized learning outcomes for the undergraduate program are
included in Table 13.
The learning outcomes committee also worked to develop a curriculum map based on the
four core areas. The goal of the map was to ensure the alignment of the curriculum and
undergraduate student learning outcomes. Additional information on the purpose and uses of
curriculum maps is included in Section 2.3. The curriculum map for the undergraduate program
is included as Table 14. Several additions were made to the undergraduate curriculum map,
including additional electives, the calculus sequence, and the computer science course.
According to Table 14, the undergraduate program seems to be addressing each of the student
learning outcomes at some point in the curriculum. The communication core area, however,
could include more courses to introduce the necessary skills prior to their assessment during the
capstone sequence (5010 – 5020). The communications area is also not addressed at all in any of
the elective courses. The student learning outcomes associated with communications may need
to be investigated further during the later stages of the assessment process. Overall, the
curriculum map suggests that the capstone course will be the primary focus during assessment of
the learning outcomes.
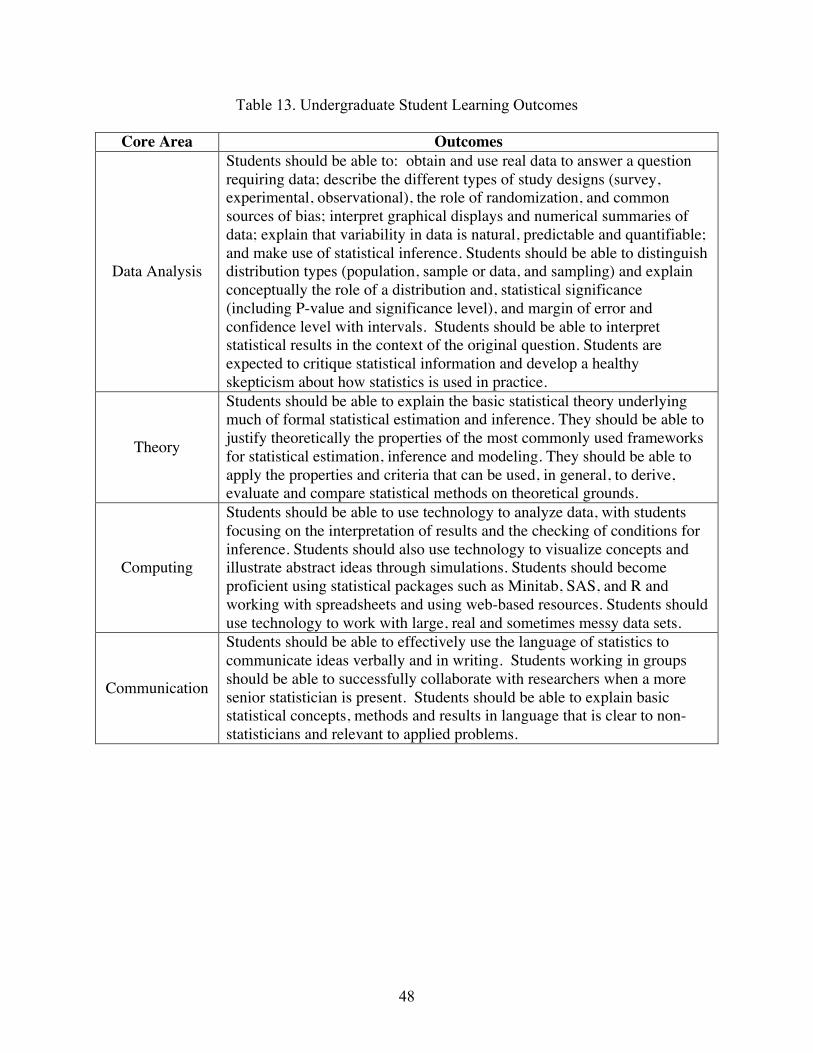
48
Table 13. Undergraduate Student Learning Outcomes
Core Area Outcomes
Data Analysis
Students should be able to: obtain and use real data to answer a question requiring data; describe the different types of study designs (survey, experimental, observational), the role of randomization, and common sources of bias; interpret graphical displays and numerical summaries of data; explain that variability in data is natural, predictable and quantifiable; and make use of statistical inference. Students should be able to distinguish distribution types (population, sample or data, and sampling) and explain conceptually the role of a distribution and, statistical significance (including P-value and significance level), and margin of error and confidence level with intervals. Students should be able to interpret statistical results in the context of the original question. Students are expected to critique statistical information and develop a healthy skepticism about how statistics is used in practice.
Theory
Students should be able to explain the basic statistical theory underlying much of formal statistical estimation and inference. They should be able to justify theoretically the properties of the most commonly used frameworks for statistical estimation, inference and modeling. They should be able to apply the properties and criteria that can be used, in general, to derive, evaluate and compare statistical methods on theoretical grounds.
Computing
Students should be able to use technology to analyze data, with students focusing on the interpretation of results and the checking of conditions for inference. Students should also use technology to visualize concepts and illustrate abstract ideas through simulations. Students should become proficient using statistical packages such as Minitab, SAS, and R and working with spreadsheets and using web-based resources. Students should use technology to work with large, real and sometimes messy data sets.
Communication
Students should be able to effectively use the language of statistics to communicate ideas verbally and in writing. Students working in groups should be able to successfully collaborate with researchers when a more senior statistician is present. Students should be able to explain basic statistical concepts, methods and results in language that is clear to non-statisticians and relevant to applied problems.
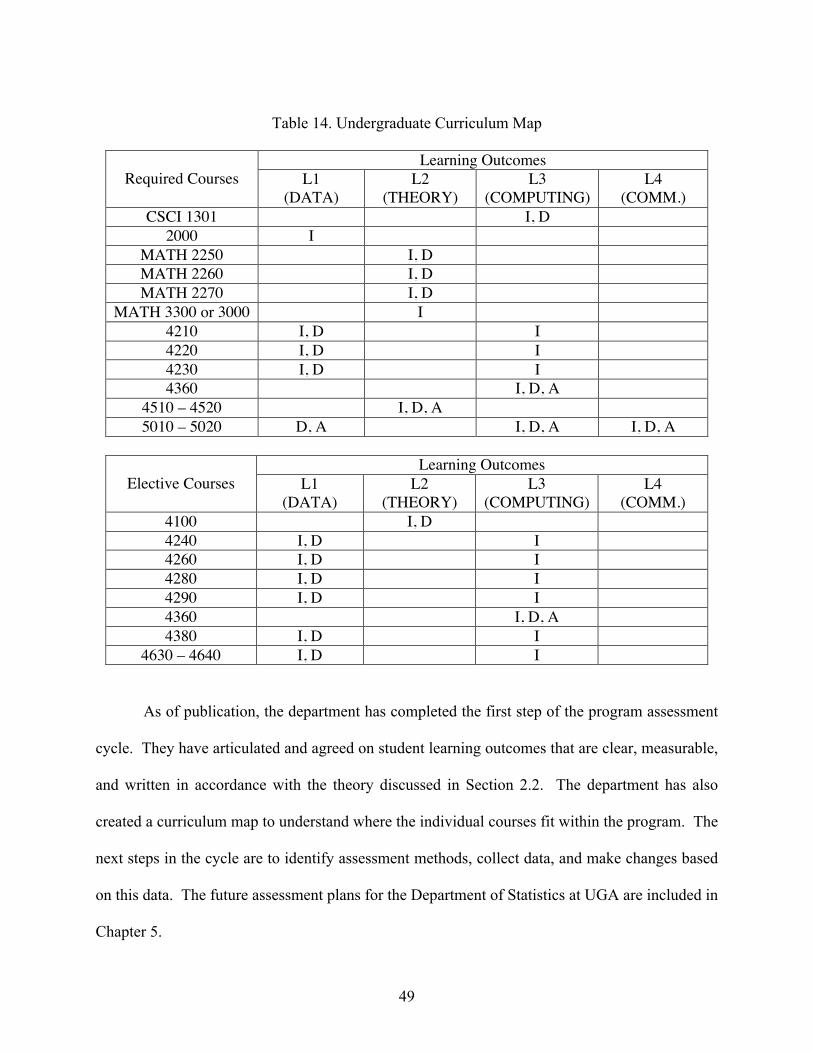
49
Table 14. Undergraduate Curriculum Map
Required Courses Learning Outcomes
L1 (DATA)
L2 (THEORY)
L3 (COMPUTING)
L4 (COMM.)
CSCI 1301 I, D 2000 I
MATH 2250 I, D MATH 2260 I, D MATH 2270 I, D
MATH 3300 or 3000 I 4210 I, D I 4220 I, D I 4230 I, D I 4360 I, D, A
4510 – 4520 I, D, A 5010 – 5020 D, A I, D, A I, D, A
Elective Courses Learning Outcomes
L1 (DATA)
L2 (THEORY)
L3 (COMPUTING)
L4 (COMM.)
4100 I, D 4240 I, D I 4260 I, D I 4280 I, D I 4290 I, D I 4360 I, D, A 4380 I, D I
4630 – 4640 I, D I
As of publication, the department has completed the first step of the program assessment
cycle. They have articulated and agreed on student learning outcomes that are clear, measurable,
and written in accordance with the theory discussed in Section 2.2. The department has also
created a curriculum map to understand where the individual courses fit within the program. The
next steps in the cycle are to identify assessment methods, collect data, and make changes based
on this data. The future assessment plans for the Department of Statistics at UGA are included in
Chapter 5.
50
CHAPTER 5
FUTURE DIRECTIONS
Programmatic assessment is a systematic process to improve student learning. It is often
confused with typical classroom assessment used to assign grades to individual students. The
data collected through program assessment focuses on groups of students as a whole and what
can be done to improve the overall, rather than individual, student experience. The cyclic
assessment process includes four key steps: establishing student learning outcomes, deciding on
assessment methods, collecting and analyzing data, and reflecting on the data.
The Department of Statistics at UGA has successfully completed the first stage of the
assessment cycle. We have agreed upon the knowledge, skills, and abilities that are expected
from the graduates of the B.S. program. The student learning outcomes are separated into four
core areas: data analysis, theory, computing, and communications. The process of creating these
outcomes has prompted conversations about the curriculum, teaching methods, and goals for our
students. The curriculum map created in Chapter 4 has allowed the committee to see possible
areas for development within the program. For the undergraduate program, the learning outcome
relating to communications provides the most room for improvement. The curriculum map will
assist in future discussions of necessary changes to the undergraduate curriculum, for example
with respect to developing communication and will assist in the creation of the assessment plan.
The next step in developing a new assessment plan is to understand how the current plan
is functioning. The current plan, discussed in Section 3.3, utilizes many indirect methods to
assess student learning. The LOA Committee should discuss the effectiveness of the current
51
assessment plan and how they wish to assess in the future. To determine where to assess
outcomes within the program, the committee can use the curriculum map discussed in Chapter 4.
They also can use a newly created objectives-by-measures matrix to decide on methods, like the
example discussed in Section 2.4.5. Methods that are valuable and feasible tools for our
department would receive a check, while those without a check are not considered to be an
effective tool for assessment. A blank objectives-by-measures matrix to be filled in by the
committee is included in Table 13 of the Appendix. Table 3 in Section 2.4.2 provides additional
assessment methods the department may want to consider in the assessment plan. The
committee should ensure that there are multiple opportunities to assess each student learning
outcome. They should also be mindful to include opportunities to triangulate the data by using
multiple assessment types, for example, both direct and indirect measures. More detail is given
about the value of triangulation in Section 2.4.5. Overall, the methods selected should be
reasonable with respect to the effort required by faculty and provide informative data upon
completion.
A completed and ‘ideal’ objectives-by-measures matrix for the undergraduate program is
included in Table 15. This matrix is intended to provide recommendations to assist the faculty
members in filling out their own matrix for the undergraduate and graduate level programs. It is
not intended as a final version, nor is its inclusion in this document intended to circumvent the
process of the committee in making decisions about how the department will assess the learning
outcomes The plan is meant to be feasible and provide the most valuable assessment data with
minimal time and effort. A full description of the advantages and disadvantages of assessment
methods is included in Section 2.4.3. The ideal assessment plan included below, uses an alumni
survey, exit interview, faculty discussion, records of student data, and a student focus group as
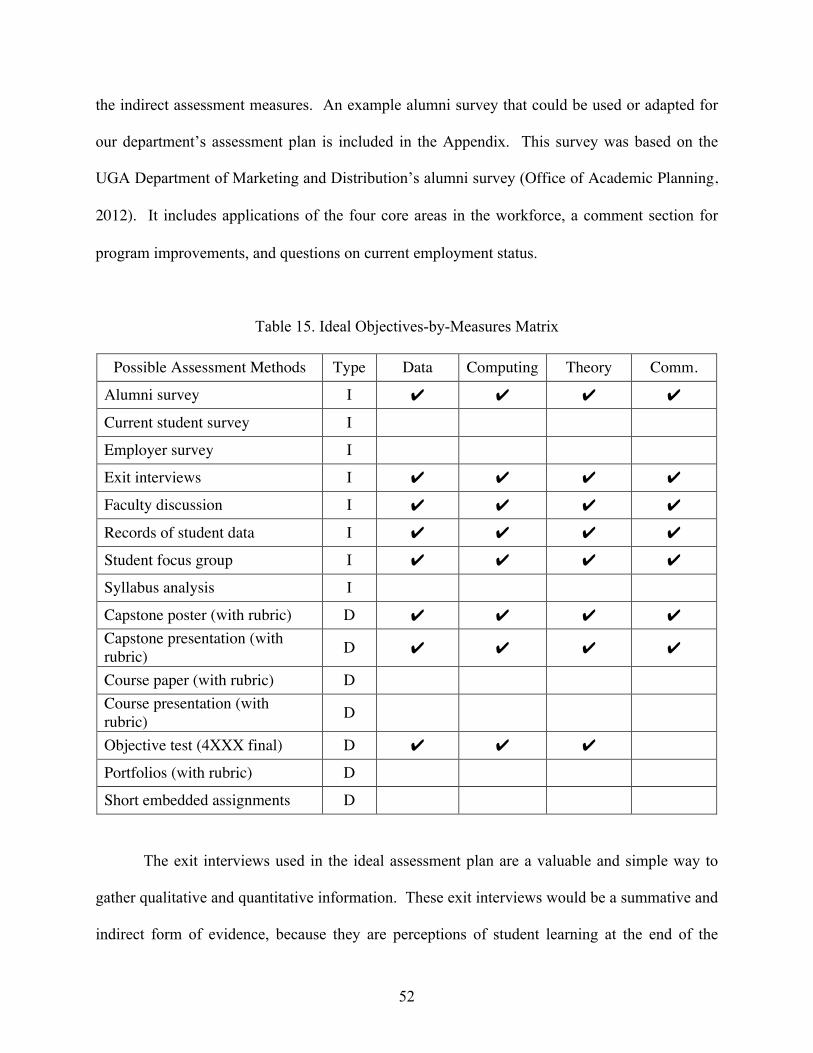
52
the indirect assessment measures. An example alumni survey that could be used or adapted for
our department’s assessment plan is included in the Appendix. This survey was based on the
UGA Department of Marketing and Distribution’s alumni survey (Office of Academic Planning,
2012). It includes applications of the four core areas in the workforce, a comment section for
program improvements, and questions on current employment status.
Table 15. Ideal Objectives-by-Measures Matrix
Possible Assessment Methods Type Data Computing Theory Comm.
Alumni survey I ✔ ✔ ✔ ✔
Current student survey I
Employer survey I
Exit interviews I ✔ ✔ ✔ ✔
Faculty discussion I ✔ ✔ ✔ ✔
Records of student data I ✔ ✔ ✔ ✔
Student focus group I ✔ ✔ ✔ ✔
Syllabus analysis I
Capstone poster (with rubric) D ✔ ✔ ✔ ✔ Capstone presentation (with rubric) D ✔ ✔ ✔ ✔
Course paper (with rubric) D Course presentation (with rubric) D
Objective test (4XXX final) D ✔ ✔ ✔
Portfolios (with rubric) D
Short embedded assignments D
The exit interviews used in the ideal assessment plan are a valuable and simple way to
gather qualitative and quantitative information. These exit interviews would be a summative and
indirect form of evidence, because they are perceptions of student learning at the end of the
53
program. An example exit interview is included in the Appendix. The interview questions are
very similar to the version used in the 2003 assessment plan, however, the working knowledge
questions (#8) are grouped based on the four core learning areas. By using the undergraduate
coordinator as the moderator of the exit interviews, unbiased data can be gathered since the
students are comfortable sharing their thoughts with her.
Records of student data, faculty discussions, and focus groups are also included in the
ideal matrix in Table 15. Records of student data would allow faculty to see any trends in
student achievement and document progress over the years. These data would be updated during
each academic year and include graduation rates, course enrollment, course grade averages, and
student honors. An example document for the record of student data is included in the
Appendix. The faculty discussion would help to synthesize the data collected and close the
assessment loop. This discussion is like a focus group of the faculty members involved in the
program. Lastly, focus groups of students could be used to gather qualitative and indirect data.
The committee should also consider providing pizza or another similar incentive for students as a
way to encourage participation in this add-on assessment method. The committee should be
careful in choosing the faculty moderator and guiding questions to maximize collected the data
using focus groups. A syllabus analysis, employer survey, or current student survey could also
easily be incorporated into this ideal plan as another indirect assessment measure.
Based on the ideal objectives-by-measures matrix (Table 15) the direct assessment
methods include objective tests in 4000 level courses and assignments graded with rubrics. The
objective tests could include finals or midterms in key 4000 level courses like Mathematical
Statistics I (STAT 4510). This would help the department to gather additional direct evidence in
courses that were marked with an ‘A’ in the undergraduate curriculum map (Table 14).
54
Instructors of these courses would be responsible for reporting student’s working knowledge in
the related core learning area to the LOA Committee.
Previous faculty discussion has suggested the idea of adding rubrics to areas within the
undergraduate program. These could be added to the capstone presentation or poster session, or
to other regular course assignments that are also used in program assessment. As discussed in
Section 2.4.4, the rubrics will serve as quantitative and direct assessment methods. The rubrics
that are incorporated into the assessment plan should follow the theory from Section 2.4.4 and
provide useful information about the program as a whole. During February 2014, a workshop by
the TA Development Office at UGA provided some helpful suggestions on writing rubrics. This
workshop provided the foundation of the rubrics that will be created for the department’s
updated assessment plan. The notes from this workshop as well as several example rubrics have
been provided to the LOA Committee to assist in creating future rubrics. Two example rubrics
for the capstone presentation and poster session are also included in the Appendix. The capstone
presentation rubric is an analytic rubric based around the four core learning areas. Faculty
members or other audience members who watch the presentations could complete this rubric for
each group. The capstone poster rubric is also focused around the core areas, but functions more
like a checklist. This rubric could be handed out and completed by the departmental poster
session attendees. Both rubrics would aid in grading the capstone assignments and
understanding student learning across the program. The example rubrics provided should serve
as guidelines for the faculty in creating their own rubrics for program assessment.
The faculty committee has also been provided with a blank timetable (Table 18 in the
Appendix) to assist in setting up the cycle of assessment. The timetable should be used after the
assessment methods have been discussed and agreed upon. The committee should also
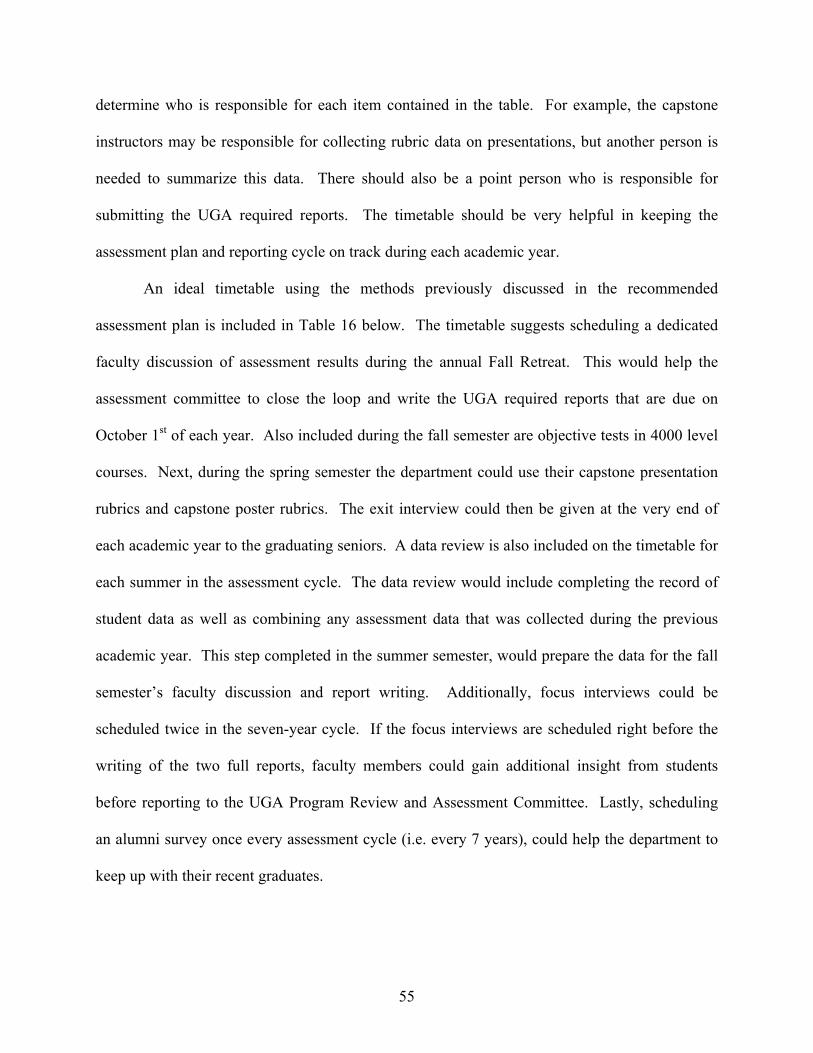
55
determine who is responsible for each item contained in the table. For example, the capstone
instructors may be responsible for collecting rubric data on presentations, but another person is
needed to summarize this data. There should also be a point person who is responsible for
submitting the UGA required reports. The timetable should be very helpful in keeping the
assessment plan and reporting cycle on track during each academic year.
An ideal timetable using the methods previously discussed in the recommended
assessment plan is included in Table 16 below. The timetable suggests scheduling a dedicated
faculty discussion of assessment results during the annual Fall Retreat. This would help the
assessment committee to close the loop and write the UGA required reports that are due on
October 1st of each year. Also included during the fall semester are objective tests in 4000 level
courses. Next, during the spring semester the department could use their capstone presentation
rubrics and capstone poster rubrics. The exit interview could then be given at the very end of
each academic year to the graduating seniors. A data review is also included on the timetable for
each summer in the assessment cycle. The data review would include completing the record of
student data as well as combining any assessment data that was collected during the previous
academic year. This step completed in the summer semester, would prepare the data for the fall
semester’s faculty discussion and report writing. Additionally, focus interviews could be
scheduled twice in the seven-year cycle. If the focus interviews are scheduled right before the
writing of the two full reports, faculty members could gain additional insight from students
before reporting to the UGA Program Review and Assessment Committee. Lastly, scheduling
an alumni survey once every assessment cycle (i.e. every 7 years), could help the department to
keep up with their recent graduates.
56
Table 16. Ideal Assessment Timetable
Fall Semester (beg.)
Fall Semester (end)
Spring Semester
(beg.)
Spring Semester
(end) Summer
YEAR 1
Faculty discussion 4510 Final Capstone
presentation rubric
Capstone poster rubric
& exit interview
Data review
Brief Report Due Oct. 1st YEAR 2
Faculty discussion
4000 level final
Capstone presentation
rubric
Capstone poster rubric
& exit interview
Data review
Brief Report Due Oct. 1st YEAR 3
Focus group & faculty discussion
None Capstone presentation
rubric
Capstone poster rubric
& exit interview
Data review
Full Report Due Oct. 1st YEAR 4
Faculty discussion 4510 Final Capstone
presentation rubric
Capstone poster rubric
& exit interview
Alumni survey & data
review Brief Report Due Oct. 1st
YEAR 5
Faculty discussion
4000 level final
Capstone presentation
rubric
Capstone poster rubric
& exit interview
Data review
Brief Report Due Oct. 1st YEAR 6
Focus group & faculty discussion
None Capstone presentation
rubric
Capstone poster rubric
& exit interview
Data review
Full Report Due Oct. 1st YEAR 7
Review and discussion
Review and discussion Review and
discussion Review and discussion
Review and discussion
Program Review
57
The most important point to remember is the final step in the assessment cycle, closing
the loop. The theory of this step was discussed previously in Section 2.4.6. After assessment
data are collected on the learning outcomes, they must be used to make changes within the
program. The decisions and adaptions made during this phase are dependent upon the data
collected during the previous step. For example, the data could suggest that students can
effectively analyze data, but are less successful at explaining their results to others. In this case,
faculty members should discuss ways in which to improve communication skills within the
program. These program changes could include course curriculum revisions, changes to the
requirements for a major, or expansions to academic advising (Office of Institutional
Assessment, n.d.). The loop of programmatic assessment is closed when programs have
discussed the results and made changes to improve student learning.
Over the next seven years, the department will implement the assessment plan that they
develop based on the UGA reporting cycle. While the assessment plan is still in development,
this paper has started many valuable conversations in the department. Faculty members are
interested in adapting their courses and finding new ways to help students master our learning
outcomes. Program coordinators and instructors are also working to add rubrics to the
curriculum. The hard work of the LOA committee will bring about many positive changes
within the department. These changes brought about by programmatic assessment will
undoubtedly improve student learning and create a stronger undergraduate statistics program at
the University of Georgia.
58
REFERENCES
American Association for Higher Education. (1996). 9 principles of good practice for assessing student learning. Retrieved from http://www.academicprograms.calpoly.edu/pdfs/assess/nine_principles_good_practice.pdf American Statistical Association. (2000). Curriculum guidelines for undergraduate programs in statistical science. Retrieved from http://www.amstat.org/education/curriculumguidelines.cfm Bloom, Benjamin S. & David R. Krathwohl. (1956). Taxonomy of educational objectives: The classification of educational goals, by a committee of college and university examiners. Handbook 1: Cognitive domain. New York: Longmans. Bryce, G. R., Gould, R., Notz, W. I., & Peck, R. L. (2000). Curriculum guidelines for bachelor of science degrees in statistical science. Curriculum Guidelines for Undergraduate Programs in Statistical Science. Retrieved from http://www.amstat.org/meetings/jsm/2000/usei/curriculum.PDF Cal Poly Pomona. (2007). Department of mathematics and statistics assessment plan. Retrieved from http://www.csupomona.edu/~math/Documents/Homepage/DepartmentAssessmentPlan.pdf Carr, J. W. & Hardin, S. (2010). The key to effective assessment: Writing measurable student learning outcomes. Recreational Sports Journal, 34, 138 – 144. Clark, D. R. (1999). The three types of learning. Bloom’s Taxonomy of Learning Domains. Retrieved from http://www.nwlink.com/~donclark/hrd/bloom.html Department of Statistics. (n.d.). Statistics major. Statistics: Franklin College. Retrieved from http://www.stat.uga.edu/statistics-major Franklin, C. (2003). Major assessment plan of the undergraduate statistics major. Unpublished manuscript. Department of Statistics, University of Georgia, Athens, GA. Franklin, C. (2012). Full review of the undergraduate statistics major. Unpublished manuscript. Department of Statistics, University of Georgia, Athens, GA. Groeneveld, R. A. & Stephenson, R. W. (1999). Outcomes assessment in the B.S. statistics program at Iowa State University. In B. Gold, S. Z. Keith, & W. A. Marion (Eds.), Assessment practices in undergraduate mathematics (pp. 49-53). USA: The Mathematical Association of America.
59
Gordon, L. (2013a). Workshop: Writing student learning outcomes [PowerPoint slides]. Retrieved from http://oap.uga.edu/uploads/assess/Outcomes_Workshop_Power_Point_-_9.20.13.pdf Gordon, L. (2013b). Workshop: Choosing assessment measures [PowerPoint slides]. Retrieved from http://oap.uga.edu/uploads/assess/Assessment_Measures_Wkshp_2013_for_webpage.pdf Goucher College. (n.d.). Purpose of student learning outcomes. Student Learning Goals and Outcomes. Retrieved from http://www.goucher.edu/academics/office-of-the-provost/student-learning-goals-and-outcomes/purpose-of-student-learning-outcomes Hatfield, S. (2009). Idea paper #45: Assessing your program-level assessment plan. The Idea Center. Retrieved from http://www.theideacenter.org/sites/default/files/IDEA_Paper_45.pdf Horton, N. J. (2013). Updating the guidelines for undergraduate programs in statistics [Webinar]. In CAUSE Teaching and Learning Webinar Series. Retrieved from https://www.causeweb.org/webinar/teaching/2013-11/ Jonson, J. (2006). Guidebook for programmatic assessment of student learning outcomes. University-wide Assessment. Retrieved from University of Nebraska Lincoln: http://www.unl.edu/svcaa/assessment/learningoutcomes_guidebook.pdf Jordan, D., DeGraaf, D., & DeGraaf, K. (2005). Programming for parks, recreation, and leisure services: A servant leadership approach. 2nd ed. State College, PA: Venture Publishing Lazar, N. A., Reeves, J., & Franklin, C. (2011). A capstone course for undergraduate statistics majors. The American Statistician, 65(3), 183-189. Lindholm, J. A. (2009). Guidelines for developing and assessing student learning outcomes for undergraduate majors. Learning Outcomes Assessment for Undergraduate Academic Programs, (1st ed.). Retrieved from University of California, Los Angeles website: http://www.wasc.ucla.edu/eer_endnotes/Learning_Outcomes_Guidelines.pdf Macalester College. (2012). The academic program. College Catalog. Retrieved from http://catalog.macalester.edu/content.php?catoid=4&navoid=619 Maki, P. (2010). Assessing for learning (2nd ed.). Sterling, VA: Stylus Publishing. Middle States Commission on Higher Education. (2007). Student learning assessment: Options and resources (2nd ed.). Retrieved from http://www.msche.org/publications/SLA_Book_0808080728085320.pdf Mullinix, B. B. (2009). Rubrics. The TLT Group. Retrieved from http://tltgroup.org/resources/Rubrics.htm
60
Office of Academic Planning. (n.d.). Student learning outcomes assessment. Retrieved from http://oap.uga.edu/assessment/sloa/ Office of Academic Planning. (2012). Department of marketing and distribution: Undergraduate major assessment plan. Retrieved from http://oap.uga.edu/assessment/plan/ Office of Assessment. (2014). Program assessment plans: Department of mathematics. Retrieved from University of Rochester: Arts, Sciences, and Engineering: http://www.rochester.edu/ college/ assessment/assets/pdf/undergraduate/LearningObjectives-MTH-v2.pdf Office of Experiential Learning. (n.d.). Writing SMART learning objectives. Retrieved from University of Central Florida: http://explearning.ucf.edu/registered-students/tips-for-success/writing-smart-learning-objectives/195 Office of Institutional Assessment. (n.d.). Assessment resources. Retrieved from Texas A&M University: http://assessment.tamu.edu/resources/resources_index.html Palomba, C. & Banta T. (1999). Assessment essentials: planning, implementing, and improving assessment in higher education. San Francisco: Jossey-Bass. Peck, R. & Chance, B. L. (2007). Assessment at the program level: Using assessment to improve undergraduate statistics programs. In L. Weldon & B. Phillips (Eds.), Proceedings of the ISI/IASE Satellite on Assessing Student Learning in Statistics. (pp. 1-6). Lisbon, Portugal. Public Affairs Division. (2013). UGA by the numbers. The University of Georgia. Retrieved from http://www.uga.edu/images/uploads/2013UGA_ByNumbers.pdf Quick, P. S. (2014). It looks like an ‘A’ but I don’t know why: How to construct and use rubrics for assessment and learning [PowerPoint slides]. Ritter, M. A., Starbuck, R. R., and Hogg, R. V. (2001). Advice from prospective employers on training BS statisticians. The American Statistician, 55, 14. Stassen, M., Doherty, K, & Poe, M. (2001). Program-based review and assessment: Tools and techniques for program improvement. Retrieved from Office of Academic Planning & Assessment, University of Massachusetts Amherst: http://www.umass.edu/oapa/oapa/ publications/online_handbooks/program_based.pdf Stevens, D. D. & Levi A. J. (2005). Introduction to rubrics. (pp. 82). Sterling, VA: Stylus. Stufken, J. & Taylor, R. L. (2013) A brief history of the department of statistics. In A. Agresti & X. Meng (Eds.), Strength in numbers: The rising of academic statistics departments in the U.S. (pp. 381-393). New York: Springer. Suskie, L. (2009). Assessing student learning: A common sense guide (2nd ed.). San Francisco: Jossey-Bass.
61
The University of Rhode Island. (2012). Designing a meaningful curriculum map: Reflecting on the level of learning expected. Student Learning, Outcomes Assessment and Accreditation. Retrieved from http://web.uri.edu/assessment/files/Understanding_IRE_2012.pdf Schuh, J. H. & Upcraft, M. L. (2001). Assessment practice in student affairs: An applications manual. San Francisco: Jossey-Bass Publishers. Washington State University. (2009). Validity, reliability, and triangulation in program assessment. Center for Teaching, Learning, and Technology. Retrieved from http://ai.vancouver.wsu.edu/~nwdcsd/wiki/images/9/9c/ Validity,_Reliability,_and_Triangulation_in_Program_Assessment_Spring09.pdf
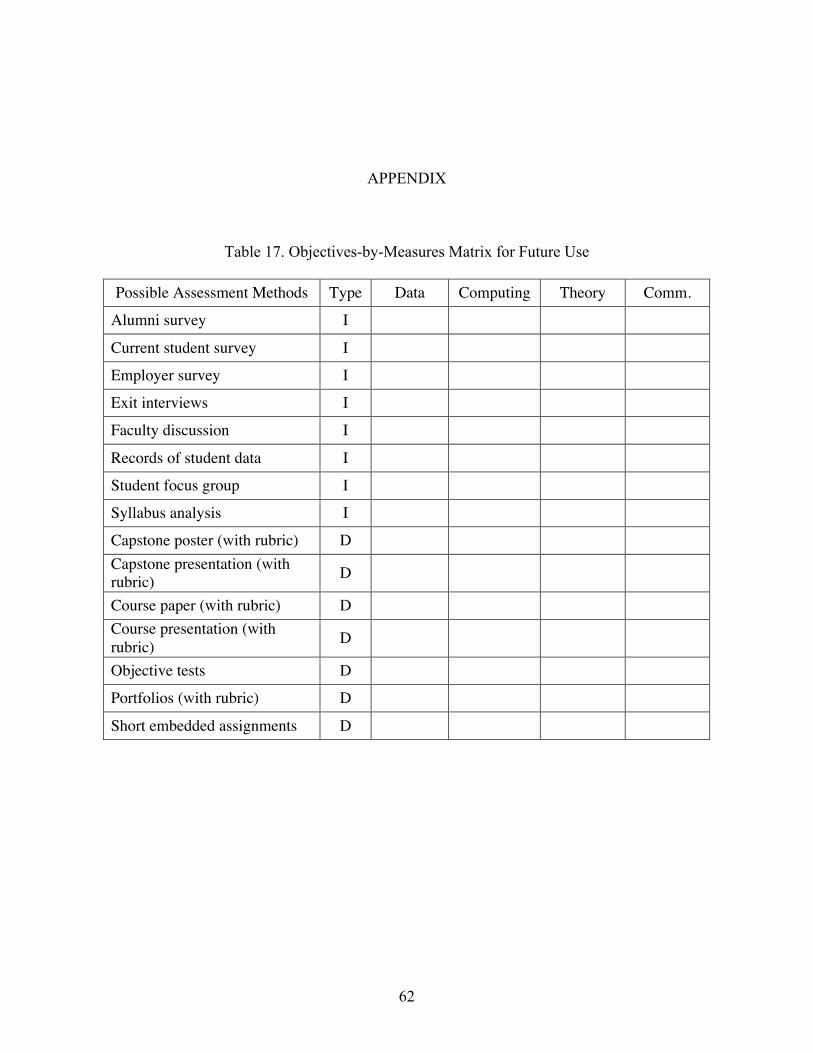
62
APPENDIX
Table 17. Objectives-by-Measures Matrix for Future Use
Possible Assessment Methods Type Data Computing Theory Comm.
Alumni survey I
Current student survey I
Employer survey I
Exit interviews I
Faculty discussion I
Records of student data I
Student focus group I
Syllabus analysis I
Capstone poster (with rubric) D Capstone presentation (with rubric) D
Course paper (with rubric) D Course presentation (with rubric) D
Objective tests D
Portfolios (with rubric) D
Short embedded assignments D
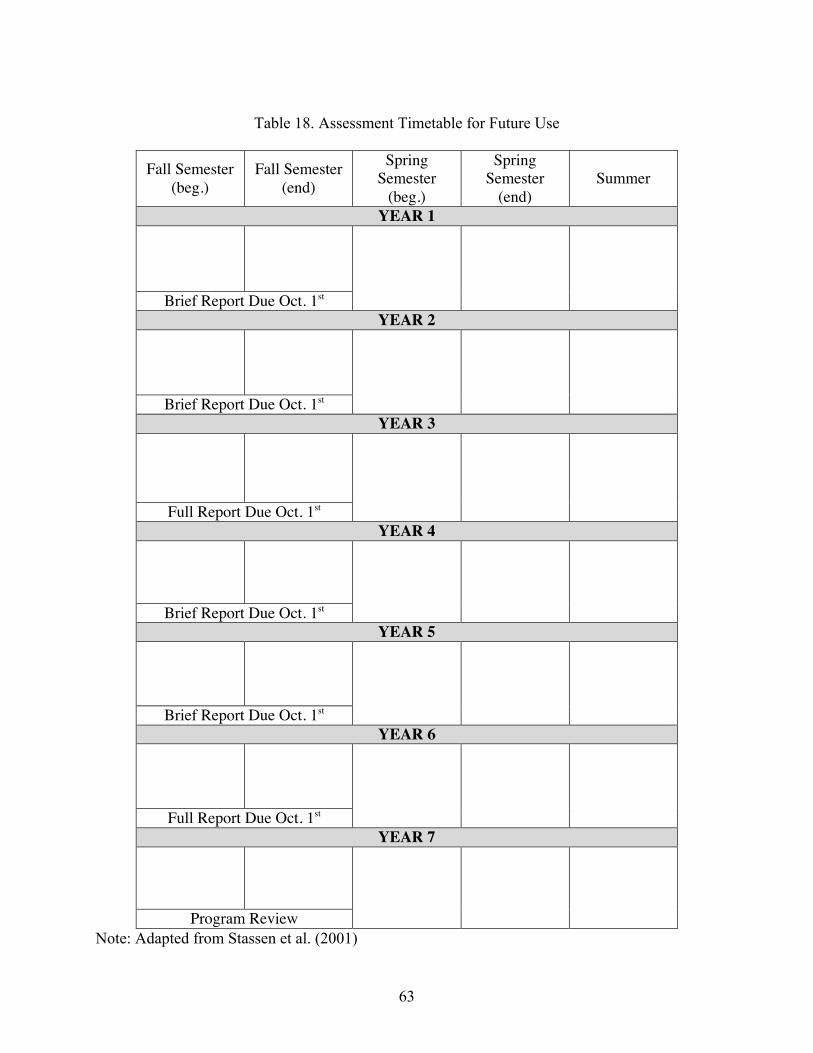
63
Table 18. Assessment Timetable for Future Use
Fall Semester (beg.)
Fall Semester (end)
Spring Semester
(beg.)
Spring Semester
(end) Summer
YEAR 1
Brief Report Due Oct. 1st YEAR 2
Brief Report Due Oct. 1st YEAR 3
Full Report Due Oct. 1st YEAR 4
Brief Report Due Oct. 1st YEAR 5
Brief Report Due Oct. 1st YEAR 6
Full Report Due Oct. 1st YEAR 7
Program Review Note: Adapted from Stassen et al. (2001)
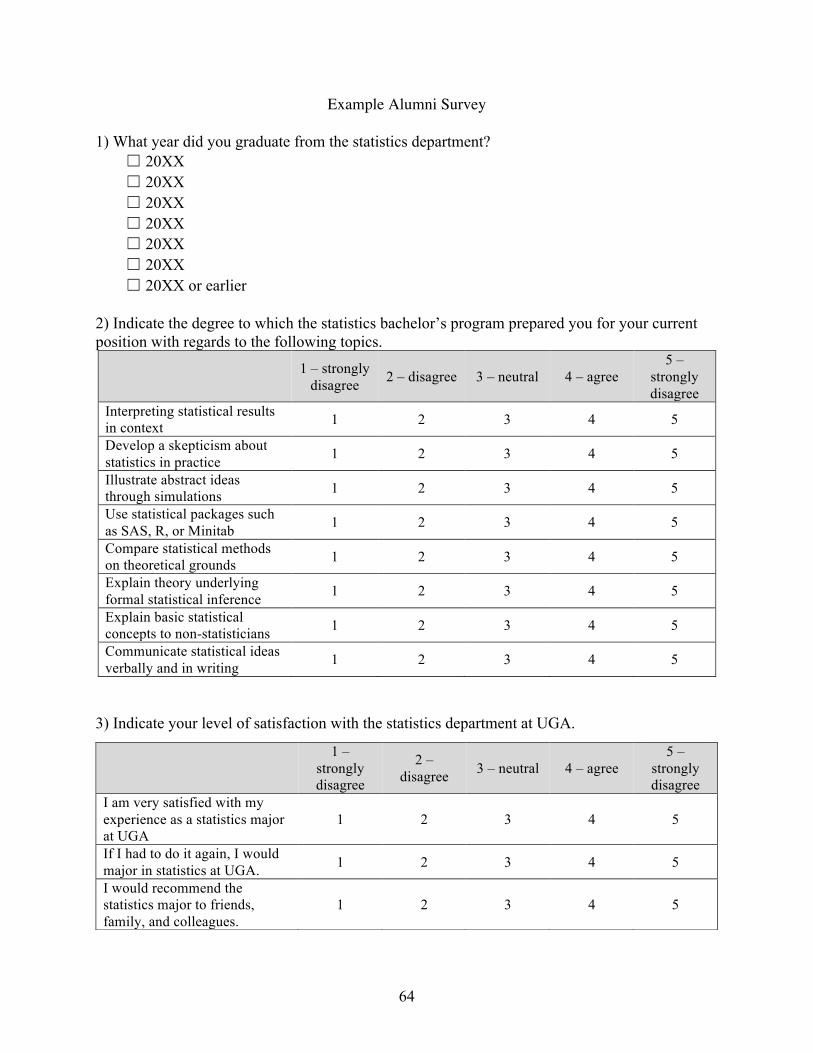
64
Example Alumni Survey
1) What year did you graduate from the statistics department? ☐ 20XX ☐ 20XX ☐ 20XX ☐ 20XX ☐ 20XX ☐ 20XX ☐ 20XX or earlier
2) Indicate the degree to which the statistics bachelor’s program prepared you for your current position with regards to the following topics.
1 – strongly disagree 2 – disagree 3 – neutral 4 – agree
5 – strongly disagree
Interpreting statistical results in context 1 2 3 4 5
Develop a skepticism about statistics in practice 1 2 3 4 5
Illustrate abstract ideas through simulations 1 2 3 4 5
Use statistical packages such as SAS, R, or Minitab 1 2 3 4 5
Compare statistical methods on theoretical grounds 1 2 3 4 5
Explain theory underlying formal statistical inference 1 2 3 4 5
Explain basic statistical concepts to non-statisticians 1 2 3 4 5
Communicate statistical ideas verbally and in writing 1 2 3 4 5
3) Indicate your level of satisfaction with the statistics department at UGA.
1 –
strongly disagree
2 – disagree 3 – neutral 4 – agree
5 – strongly disagree
I am very satisfied with my experience as a statistics major at UGA
1 2 3 4 5
If I had to do it again, I would major in statistics at UGA. 1 2 3 4 5
I would recommend the statistics major to friends, family, and colleagues.
1 2 3 4 5
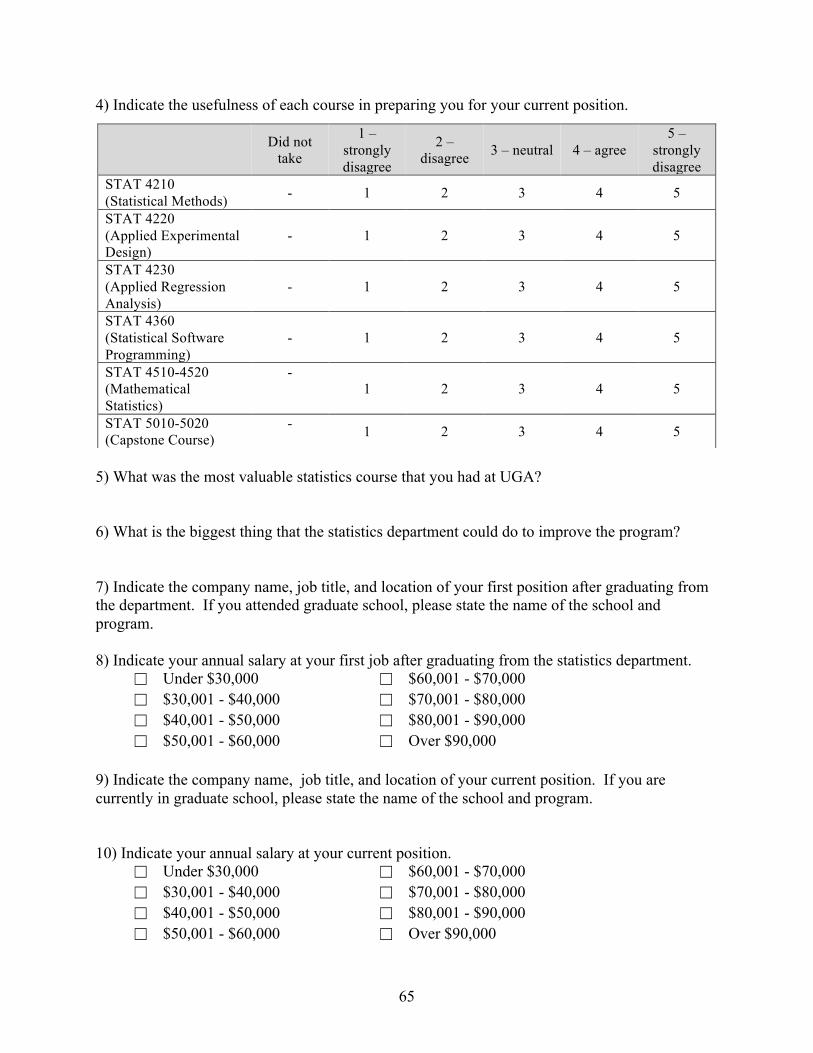
65
4) Indicate the usefulness of each course in preparing you for your current position.
5) What was the most valuable statistics course that you had at UGA? 6) What is the biggest thing that the statistics department could do to improve the program? 7) Indicate the company name, job title, and location of your first position after graduating from the department. If you attended graduate school, please state the name of the school and program. 8) Indicate your annual salary at your first job after graduating from the statistics department.
☐ Under $30,000 ☐ $60,001 - $70,000 ☐ $30,001 - $40,000 ☐ $70,001 - $80,000 ☐ $40,001 - $50,000 ☐ $80,001 - $90,000 ☐ $50,001 - $60,000 ☐ Over $90,000
9) Indicate the company name, job title, and location of your current position. If you are currently in graduate school, please state the name of the school and program. 10) Indicate your annual salary at your current position.
☐ Under $30,000 ☐ $60,001 - $70,000 ☐ $30,001 - $40,000 ☐ $70,001 - $80,000 ☐ $40,001 - $50,000 ☐ $80,001 - $90,000 ☐ $50,001 - $60,000 ☐ Over $90,000
Did not take
1 – strongly disagree
2 – disagree 3 – neutral 4 – agree
5 – strongly disagree
STAT 4210 (Statistical Methods) - 1 2 3 4 5
STAT 4220 (Applied Experimental Design)
- 1 2 3 4 5
STAT 4230 (Applied Regression Analysis)
- 1 2 3 4 5
STAT 4360 (Statistical Software Programming)
- 1 2 3 4 5
STAT 4510-4520 (Mathematical Statistics)
- 1 2 3 4 5
STAT 5010-5020 (Capstone Course)
- 1 2 3 4 5
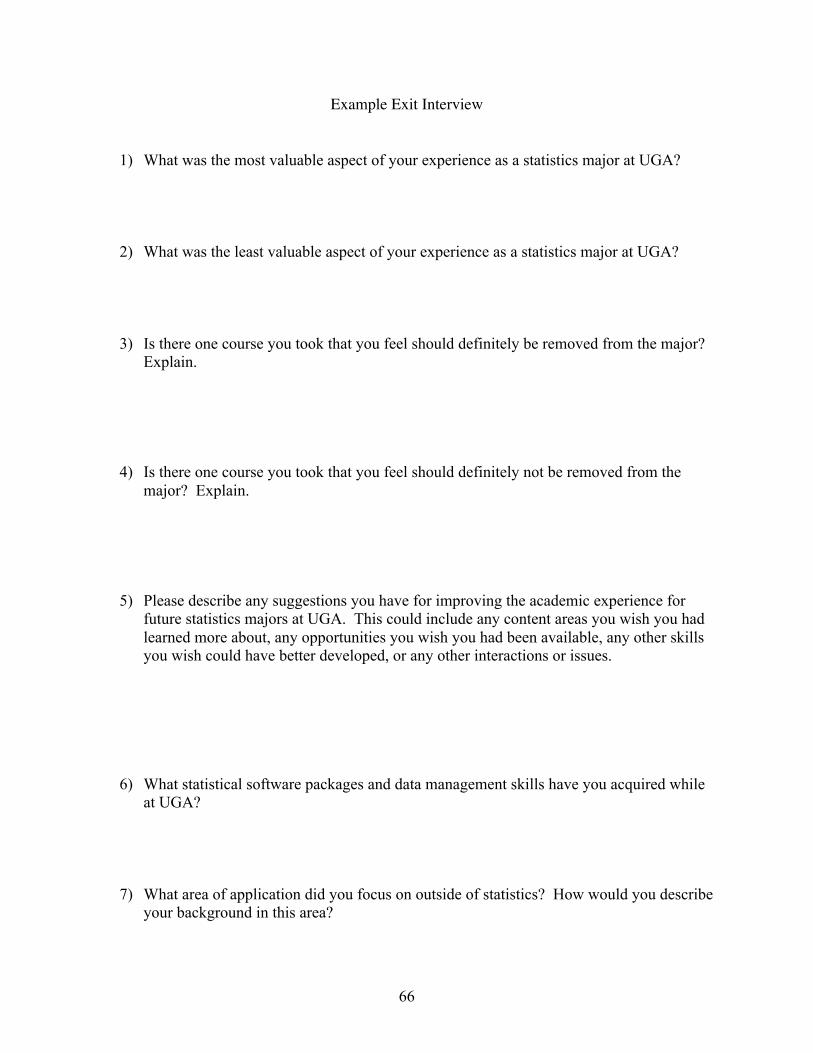
66
Example Exit Interview
1) What was the most valuable aspect of your experience as a statistics major at UGA?
2) What was the least valuable aspect of your experience as a statistics major at UGA?
3) Is there one course you took that you feel should definitely be removed from the major? Explain.
4) Is there one course you took that you feel should definitely not be removed from the major? Explain.
5) Please describe any suggestions you have for improving the academic experience for future statistics majors at UGA. This could include any content areas you wish you had learned more about, any opportunities you wish you had been available, any other skills you wish could have better developed, or any other interactions or issues.
6) What statistical software packages and data management skills have you acquired while at UGA?
7) What area of application did you focus on outside of statistics? How would you describe your background in this area?
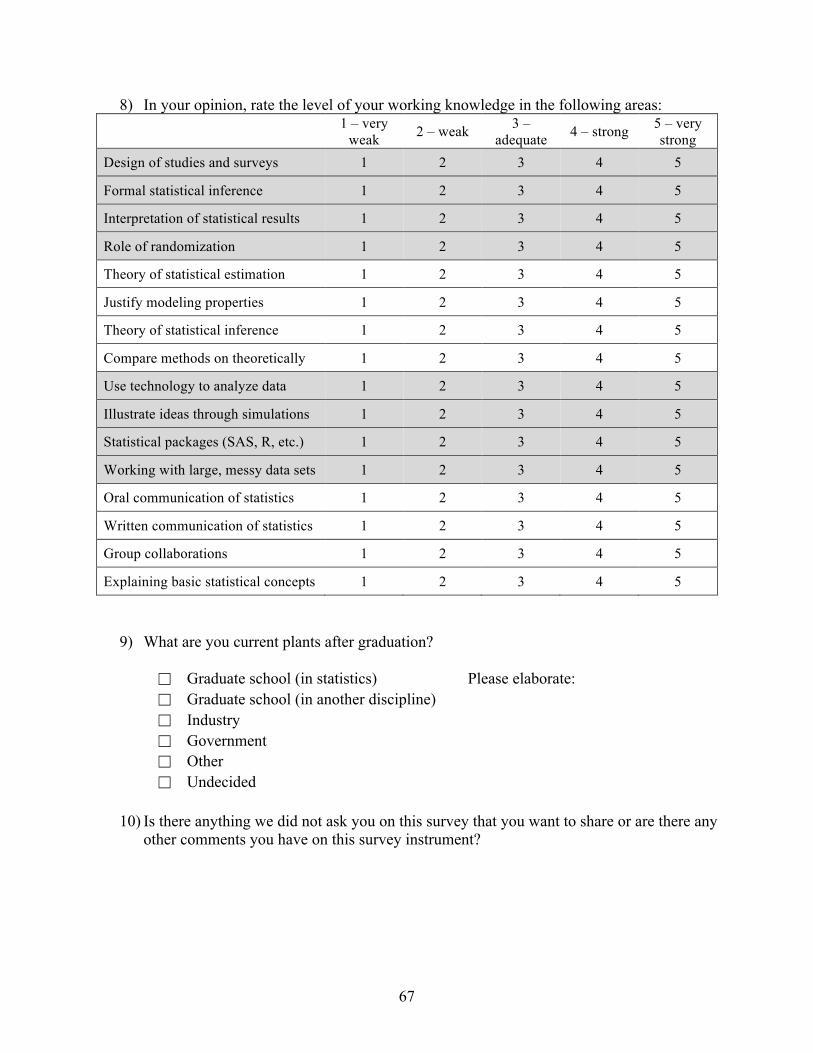
67
8) In your opinion, rate the level of your working knowledge in the following areas: 1 – very
weak 2 – weak 3 – adequate 4 – strong 5 – very
strong Design of studies and surveys 1 2 3 4 5
Formal statistical inference 1 2 3 4 5
Interpretation of statistical results 1 2 3 4 5
Role of randomization 1 2 3 4 5
Theory of statistical estimation 1 2 3 4 5
Justify modeling properties 1 2 3 4 5
Theory of statistical inference 1 2 3 4 5
Compare methods on theoretically 1 2 3 4 5
Use technology to analyze data 1 2 3 4 5
Illustrate ideas through simulations 1 2 3 4 5
Statistical packages (SAS, R, etc.) 1 2 3 4 5
Working with large, messy data sets 1 2 3 4 5
Oral communication of statistics 1 2 3 4 5
Written communication of statistics 1 2 3 4 5
Group collaborations 1 2 3 4 5
Explaining basic statistical concepts 1 2 3 4 5
9) What are you current plants after graduation?
☐ Graduate school (in statistics) Please elaborate: ☐ Graduate school (in another discipline) ☐ Industry ☐ Government ☐ Other ☐ Undecided
10) Is there anything we did not ask you on this survey that you want to share or are there any
other comments you have on this survey instrument?
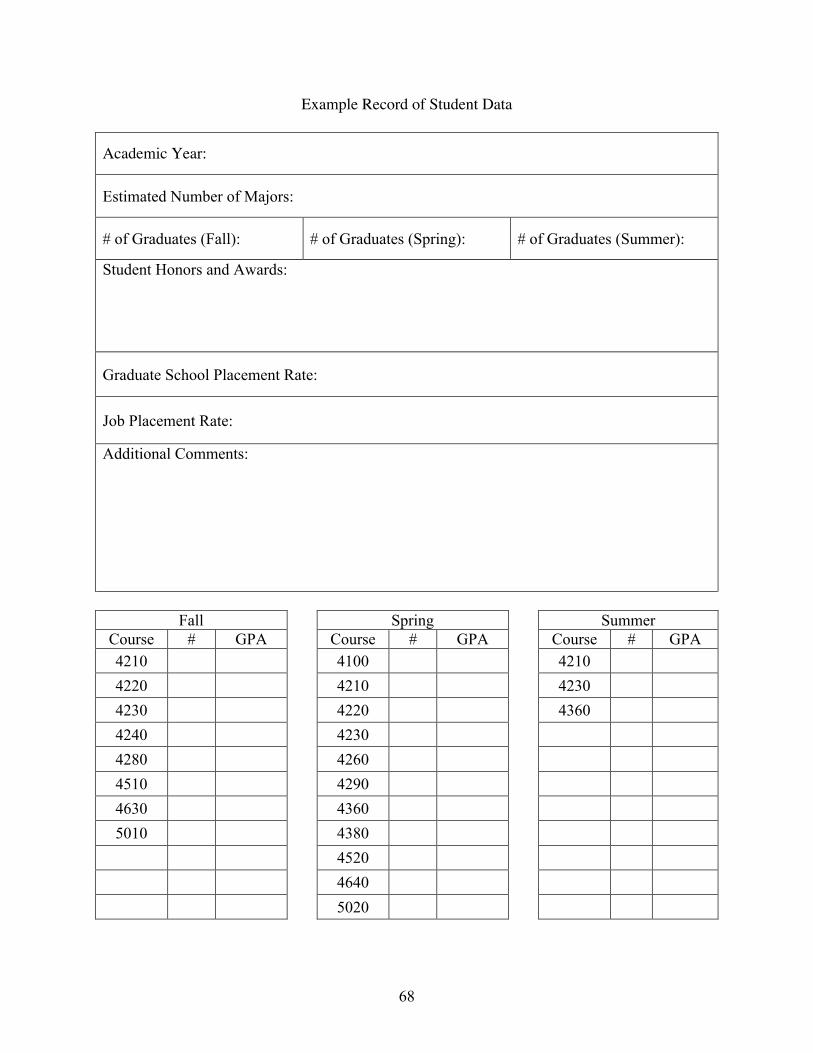
68
Example Record of Student Data
Academic Year:
Estimated Number of Majors:
# of Graduates (Fall): # of Graduates (Spring): # of Graduates (Summer):
Student Honors and Awards:
Graduate School Placement Rate:
Job Placement Rate:
Additional Comments:
Fall
Spring
Summer Course # GPA Course # GPA Course # GPA 4210 4100 4210 4220 4210 4230 4230 4220 4360 4240 4230 4280 4260 4510 4290 4630 4360 5010 4380
4520 4640 5020
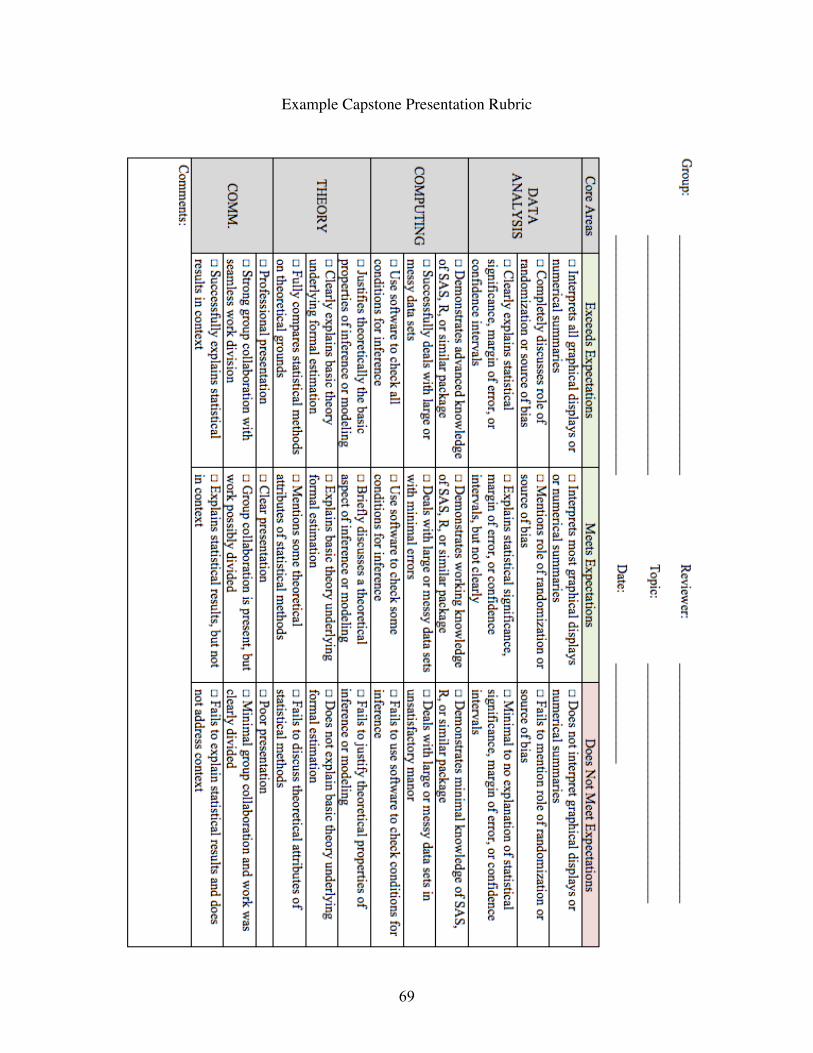
69
Example Capstone Presentation Rubric
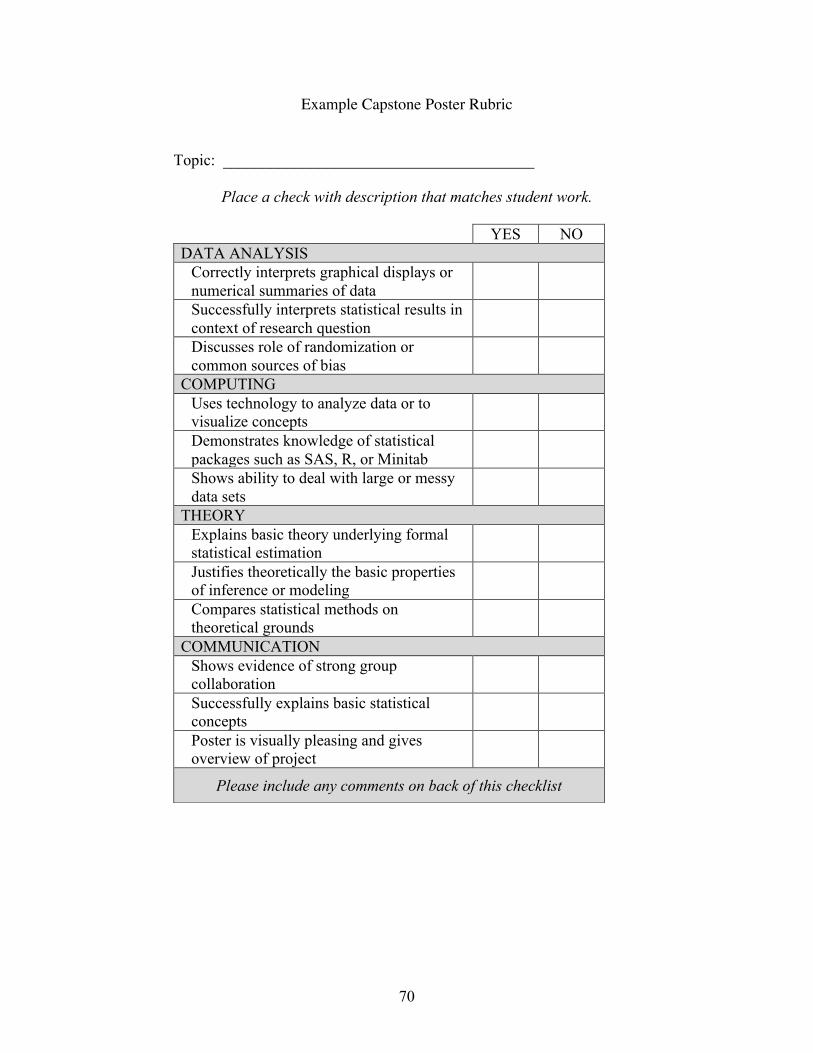
70
Example Capstone Poster Rubric
Topic: _______________________________________
Place a check with description that matches student work.
YES NO DATA ANALYSIS
Correctly interprets graphical displays or numerical summaries of data
Successfully interprets statistical results in context of research question
Discusses role of randomization or common sources of bias
COMPUTING Uses technology to analyze data or to visualize concepts
Demonstrates knowledge of statistical packages such as SAS, R, or Minitab
Shows ability to deal with large or messy data sets
THEORY Explains basic theory underlying formal statistical estimation
Justifies theoretically the basic properties of inference or modeling
Compares statistical methods on theoretical grounds
COMMUNICATION Shows evidence of strong group collaboration
Successfully explains basic statistical concepts
Poster is visually pleasing and gives overview of project
Please include any comments on back of this checklist