Embed Size (px)
Citation preview
CAMBRIDGE UNIVERSITY
REPORTERSp e c i a l No 14 Fr i day 6 May 2011 Vol cxli
pUBliSHed By aUTHoriTy pr i c e £1.70
UNDERGRADUATE ADMISSIONS STATISTICS (OCTOBER 2010)
2 CAMBRIDGE UNIVERSITY REPORTER [Special No. 14
UNDERGRADUATE ADMISSIONS STATISTICS (OCTOBER 2010)
The following tables and charts are produced annually on behalf of the Admissions Forum of the Cambridge Colleges and are intended to provide a statistical analysis of applicants to the Cambridge Colleges based on UCAS data.
The data has been prepared by the Cambridge Admissions Office, Fitzwilliam House, 32 Trumpington Street, Cambridge, CB2 1QY; telephone: 01223 333308; email: [email protected]; website: www.cam.ac.uk/admissions/undergraduate/.
CONTENTSUndergraduate admissions statistics are provided in the following categories:
1 School/college type 42 Region 73 UCAS tariff 84 Course 105 College 156 Age 177 Socio-economic category 188 Ethnicity 189 Disability 2010 The admissions process 21
NOTES FOR INFORMATION• These statistics refer to applicants making an application in October 2009, either for entry in
October 2010 or deferred entry in October 2011. Applicants holding a deferred offer from the previous admissions round are not included. Please note that the statistics also exclude 265 applicants (222 last year) through UCAS who did not submit a Supplementary Application Questionnaire (SAQ) in addition to a UCAS application.
• The term ‘Home’ now refers to applicants who have indicated in their UCAS application that they are UK nationals permanently resident in the UK. Where relevant, last year’s figures have been recalculated on this basis. For more information about the UCAS application process see www.ucas.ac.uk/students/apply/.
• Acceptance figures include only those applicants who received an unconditional firm offer of a place. It excludes those made conditional offers who were unsuccessful at confirmation.
• In many places percentages have been rounded to the nearest whole number, so values given do not always add up to 100.
Special No. 14] CAMBRIDGE UNIVERSITY REPORTER 3
SUMMARYPlease note that last year’s figures are shown in italics in brackets.
Table 1.1 Applications and acceptances by type of school/college and gender• The total number of applications is 15,966 (15,704), an increase of 2% on the previous year.• The total number of applications from the maintained sector is 6,624 (7,219), a decrease of 8%.• The total number of applications from the independent sector is 4,163 (4,277), a decrease of 3%.• The total number of acceptances is 3,394 (3,479), a decrease of 2%.• The total number of acceptances from the maintained sector is 1,609 (1,675), a decrease of 4%.• The total number of acceptances from the independent sector is 1,259 (1,318), a decrease of 4%.• The male:female ratio of accepted students is 53:47 (53:47).
Table 1.2 Home applications and acceptances by type of UK school/college and gender• For applications from Home students attending UK schools/colleges the proportions of
acceptances by school/college type are: Maintained 59.3% (58.5%) Independent 40.7% (41.5%)
Table 3.1 Applications and acceptances by UCAS tariff scores and gender• Of those accepted, 99.5% (98%) achieved the equivalent of three grade As (360 UCAS tariff
points) or better counting only their best three A Levels excluding General Studies.• Of those accepted, 89% (N/A) achieved the equivalent of A*AA (380 UCAS tariff points) or
better counting only their best three A Levels excluding General Studies.• The number of unsuccessful applicants who went on to achieve the equivalent of three grade As
(360 UCAS tariff points) or better counting only their best three A Levels excluding General Studies is 6,215 (5,817).
• The number of unsuccessful applicants who went on to achieve the equivalent of A*AA (380 UCAS tariff points) or better counting only their best three A Levels excluding General Studies is 4,288 (N/A).
Table 7.1 UK domiciled applicants and acceptances by socio-economic classification • Publication of this table has been suspended. See p. 18 for details.
Table 8.1 Home applications and acceptances by ethnic origin • The proportion of those accepted whose ethnicity is known and who declare they have an ethnic
minority background is 14.6% (13.3%). In addition, 0.9% (1.2%) of those accepted chose not to declare their ethnic origin.
Table 9.1 Applications and acceptances by disability • The proportion of those accepted who declare they have a disability is 4% (4%).
4 CAMBRIDGE UNIVERSITY REPORTER [Special No. 14
1 APPLICATIONS AND ACCEPTANCES BY SCHOOL/COLLEGE TYPE
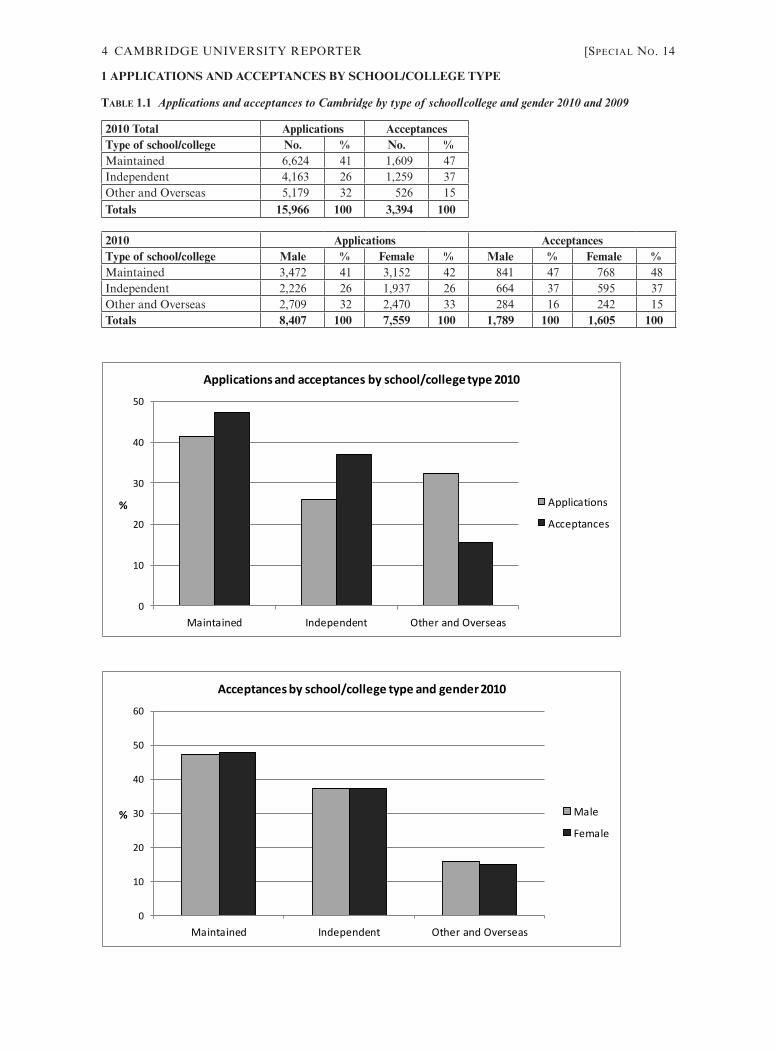
Table 1.1 Applications and acceptances to Cambridge by type of school/college and gender 2010 and 2009
2010 Total Applications AcceptancesType of school/college No. % No. %Maintained 6,624 41 1,609 47Independent 4,163 26 1,259 37Other and Overseas 5,179 32 526 15Totals 15,966 100 3,394 100
2010 Applications AcceptancesType of school/college Male % Female % Male % Female %Maintained 3,472 41 3,152 42 841 47 768 48Independent 2,226 26 1,937 26 664 37 595 37Other and Overseas 2,709 32 2,470 33 284 16 242 15Totals 8,407 100 7,559 100 1,789 100 1,605 100
0
10
20
30
40
50
Maintained Independent Other and Overseas
%
Applications and acceptances by school/college type 2010
Applications
Acceptances
0
10
20
30
40
50
60
Maintained Independent Other and Overseas
%
Acceptances by school/college type and gender 2010
Male
Female
Special No. 14] CAMBRIDGE UNIVERSITY REPORTER 5
2009 Applications AcceptancesType of school/college No. % No. %Maintained 7,219 46 1,675 48Independent 4,277 27 1,318 38Other and Overseas 4,208 27 486 14Totals 15,704 100 3,479 100
The category ‘Other and Overseas’ consists largely of applicants from schools and colleges outside the UK, but includes applicants from a variety of non-school/college institutions within the UK. FE colleges are included within the Maintained figure.
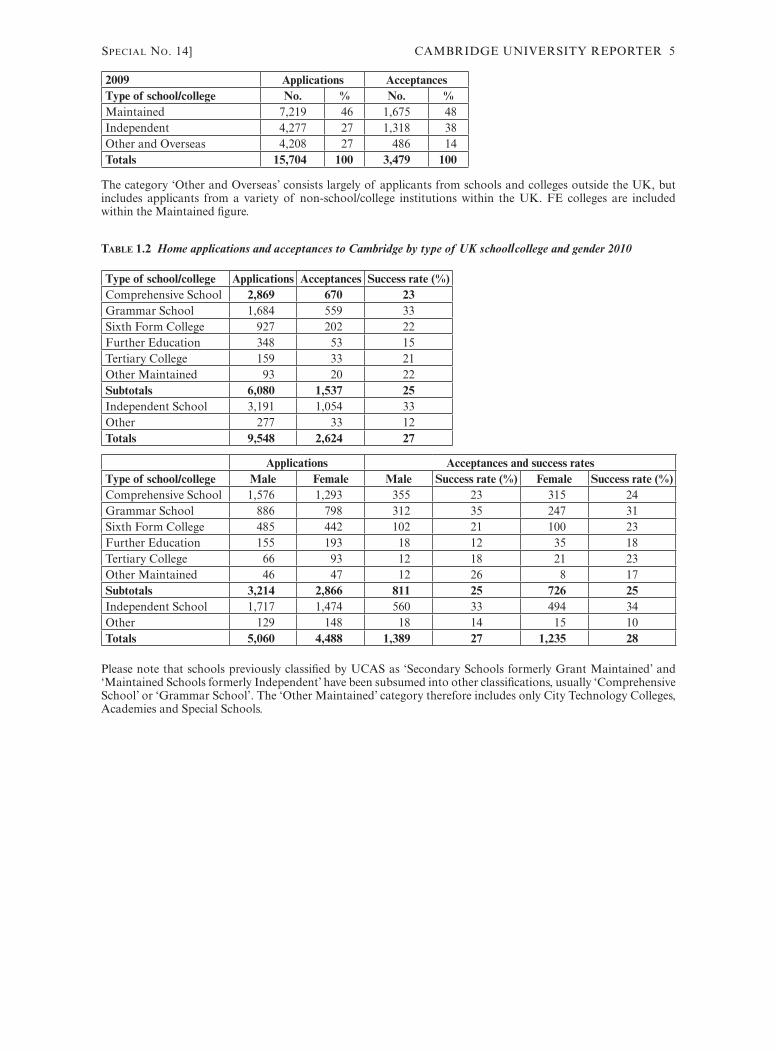
Table 1.2 Home applications and acceptances to Cambridge by type of UK school/college and gender 2010
Type of school/college Applications Acceptances Success rate (%)Comprehensive School 2,869 670 23Grammar School 1,684 559 33Sixth Form College 927 202 22Further Education 348 53 15Tertiary College 159 33 21Other Maintained 93 20 22Subtotals 6,080 1,537 25Independent School 3,191 1,054 33Other 277 33 12Totals 9,548 2,624 27
Applications Acceptances and success ratesType of school/college Male Female Male Success rate (%) Female Success rate (%)Comprehensive School 1,576 1,293 355 23 315 24Grammar School 886 798 312 35 247 31Sixth Form College 485 442 102 21 100 23Further Education 155 193 18 12 35 18Tertiary College 66 93 12 18 21 23Other Maintained 46 47 12 26 8 17Subtotals 3,214 2,866 811 25 726 25Independent School 1,717 1,474 560 33 494 34Other 129 148 18 14 15 10Totals 5,060 4,488 1,389 27 1,235 28
Please note that schools previously classified by UCAS as ‘Secondary Schools formerly Grant Maintained’ and ‘Maintained Schools formerly Independent’ have been subsumed into other classifications, usually ‘Comprehensive School’ or ‘Grammar School’. The ‘Other Maintained’ category therefore includes only City Technology Colleges, Academies and Special Schools.
6 CAMBRIDGE UNIVERSITY REPORTER [Special No. 14
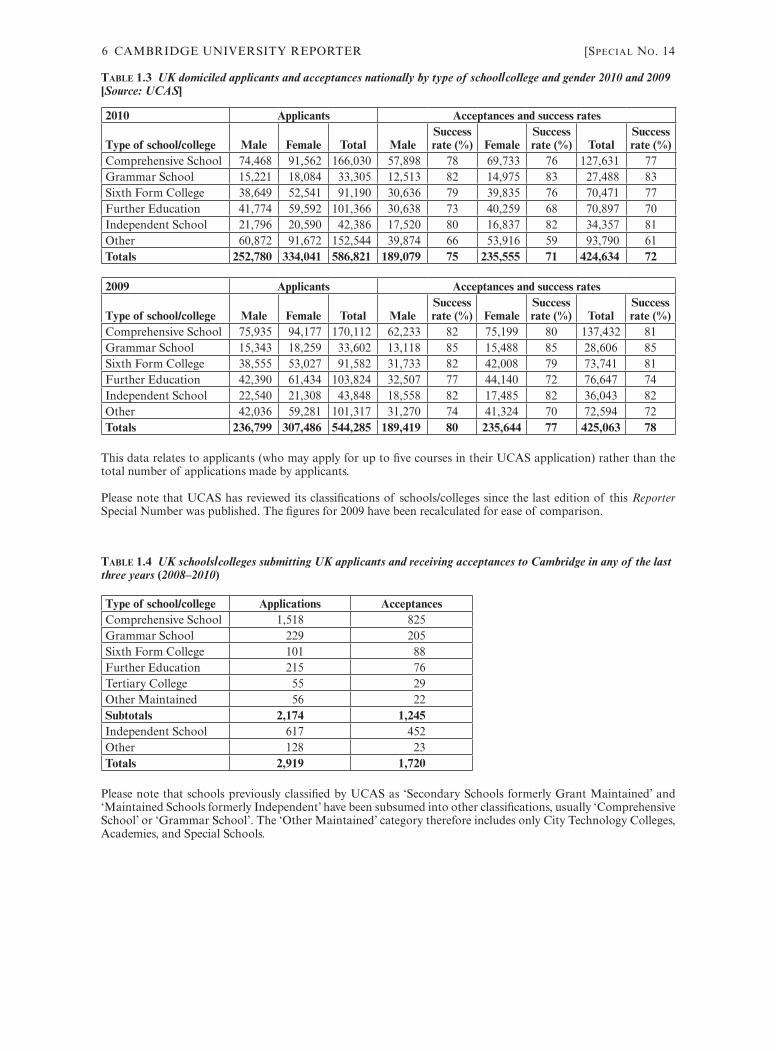
Table 1.3 UK domiciled applicants and acceptances nationally by type of school/college and gender 2010 and 2009 [Source: UCAS]
2010 Applicants Acceptances and success rates
Type of school/college Male Female Total MaleSuccess rate (%) Female
Success rate (%) Total
Success rate (%)
Comprehensive School 74,468 91,562 166,030 57,898 78 69,733 76 127,631 77Grammar School 15,221 18,084 33,305 12,513 82 14,975 83 27,488 83Sixth Form College 38,649 52,541 91,190 30,636 79 39,835 76 70,471 77Further Education 41,774 59,592 101,366 30,638 73 40,259 68 70,897 70Independent School 21,796 20,590 42,386 17,520 80 16,837 82 34,357 81Other 60,872 91,672 152,544 39,874 66 53,916 59 93,790 61Totals 252,780 334,041 586,821 189,079 75 235,555 71 424,634 72
2009 Applicants Acceptances and success rates
Type of school/college Male Female Total MaleSuccess rate (%) Female
Success rate (%) Total
Success rate (%)
Comprehensive School 75,935 94,177 170,112 62,233 82 75,199 80 137,432 81Grammar School 15,343 18,259 33,602 13,118 85 15,488 85 28,606 85Sixth Form College 38,555 53,027 91,582 31,733 82 42,008 79 73,741 81Further Education 42,390 61,434 103,824 32,507 77 44,140 72 76,647 74Independent School 22,540 21,308 43,848 18,558 82 17,485 82 36,043 82Other 42,036 59,281 101,317 31,270 74 41,324 70 72,594 72Totals 236,799 307,486 544,285 189,419 80 235,644 77 425,063 78
This data relates to applicants (who may apply for up to five courses in their UCAS application) rather than the total number of applications made by applicants.
Please note that UCAS has reviewed its classifications of schools/colleges since the last edition of this Reporter Special Number was published. The figures for 2009 have been recalculated for ease of comparison.
Table 1.4 UK schools/colleges submitting UK applicants and receiving acceptances to Cambridge in any of the last three years (2008–2010)
Type of school/college Applications AcceptancesComprehensive School 1,518 825Grammar School 229 205Sixth Form College 101 88Further Education 215 76Tertiary College 55 29Other Maintained 56 22Subtotals 2,174 1,245Independent School 617 452Other 128 23Totals 2,919 1,720
Please note that schools previously classified by UCAS as ‘Secondary Schools formerly Grant Maintained’ and ‘Maintained Schools formerly Independent’ have been subsumed into other classifications, usually ‘Comprehensive School’ or ‘Grammar School’. The ‘Other Maintained’ category therefore includes only City Technology Colleges, Academies, and Special Schools.
Special No. 14] CAMBRIDGE UNIVERSITY REPORTER 7
2 APPLICATIONS AND ACCEPTANCES BY REGION
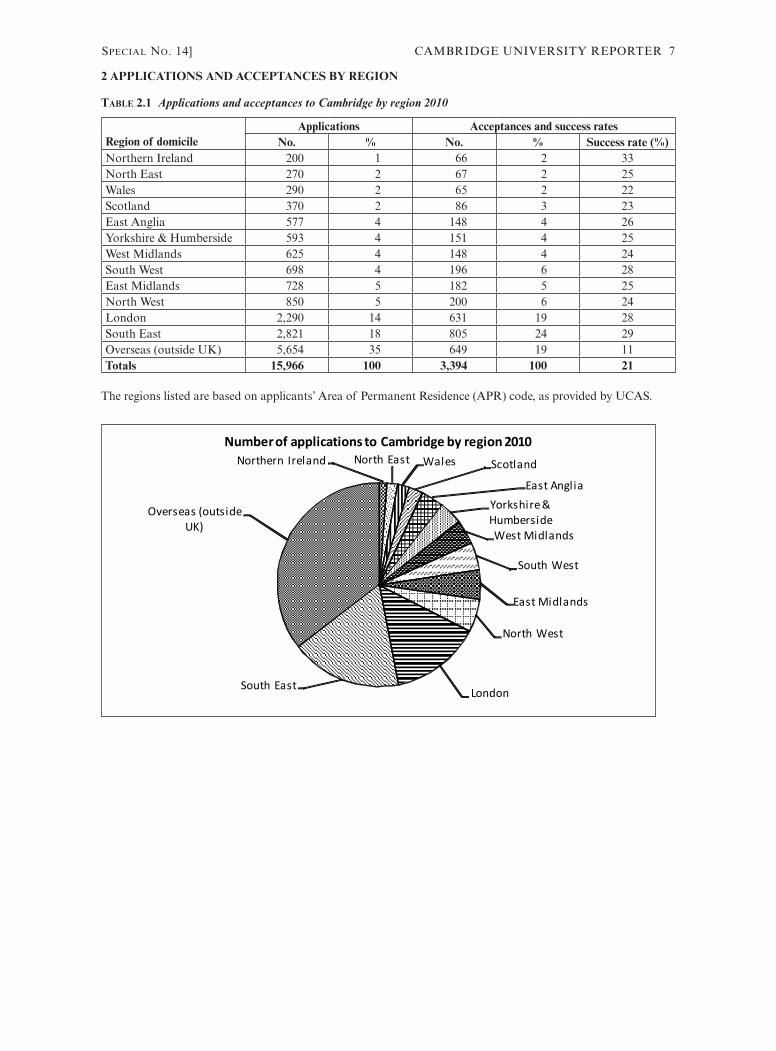
Table 2.1 Applications and acceptances to Cambridge by region 2010
Region of domicileApplications Acceptances and success rates
No. % No. % Success rate (%)Northern Ireland 200 1 66 2 33North East 270 2 67 2 25Wales 290 2 65 2 22Scotland 370 2 86 3 23East Anglia 577 4 148 4 26Yorkshire & Humberside 593 4 151 4 25West Midlands 625 4 148 4 24South West 698 4 196 6 28East Midlands 728 5 182 5 25North West 850 5 200 6 24London 2,290 14 631 19 28South East 2,821 18 805 24 29Overseas (outside UK) 5,654 35 649 19 11Totals 15,966 100 3,394 100 21
The regions listed are based on applicants’ Area of Permanent Residence (APR) code, as provided by UCAS.
7
2) APPLICATIONS AND ACCEPTANCES BY REGION
TABLE 2.1 Applications and acceptances to Cambridge by region 2010
Applications Acceptances and success rates
Region of domicile No. % No. % Success rate (%)
Northern Ireland 200 1 66 2 33
North East 270 2 67 2 25
Wales 290 2 65 2 22
Scotland 370 2 86 3 23
East Anglia 577 4 148 4 26
Yorkshire & Humberside 593 4 151 4 25
West Midlands 625 4 148 4 24
South West 698 4 196 6 28
East Midlands 728 5 182 5 25
North West 850 5 200 6 24
London 2,290 14 631 19 28
South East 2,821 18 805 24 29
Overseas (outside UK) 5,654 35 649 19 11
Totals 15,966 100 3,394 100 21
The regions listed are based on applicants’ Area of Permanent Residence (APR) code, as provided by UCAS.
!"#$%&#'()#&*+', !"#$%(-+.$ /+*&. 01"$*+',
-+.$(2'3*4+
5"#6.%4#&(7(
89:;&#.4,&
/&.$(<4,*+',.
0"9$%(/&.$
-+.$(<4,*+',.
!"#$%(/&.$
="',"'0"9$%(-+.$
>?&#.&+.(@"9$.4,&(
ABC
!"#$%&'()'*++,-.*/-(01'/('2*#$&-34%'$5'&%4-(0'6787
8 CAMBRIDGE UNIVERSITY REPORTER [Special No. 14
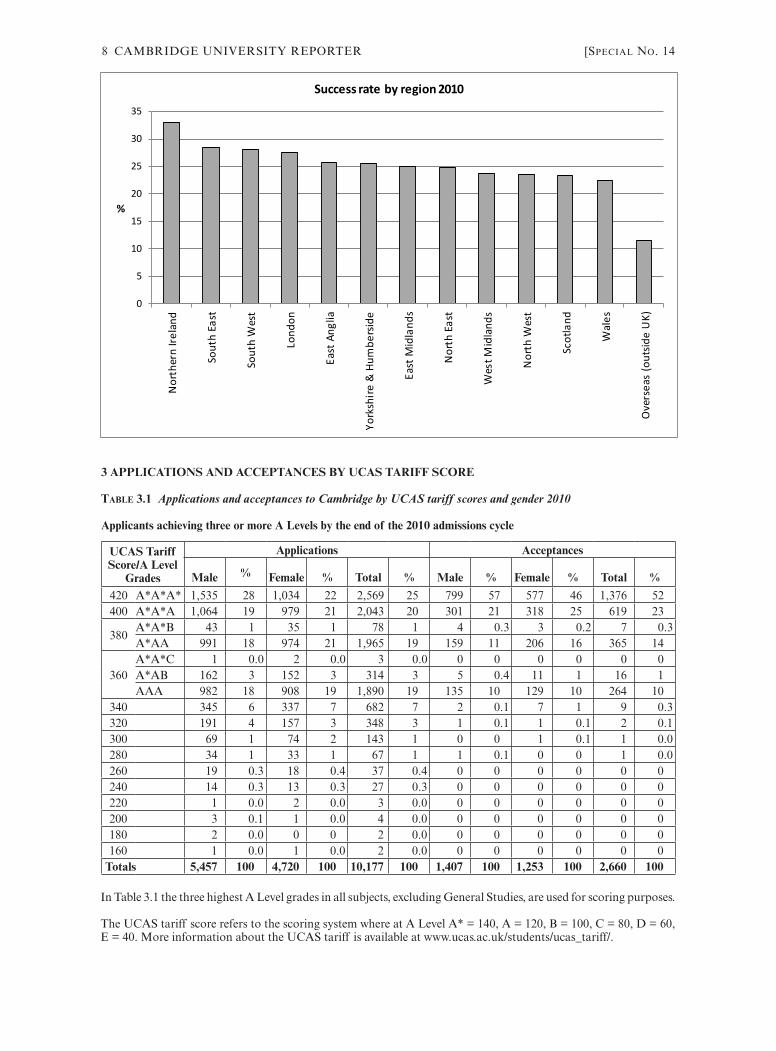
3 APPLICATIONS AND ACCEPTANCES BY UCAS TARIFF SCORE
Table 3.1 Applications and acceptances to Cambridge by UCAS tariff scores and gender 2010
Applicants achieving three or more A Levels by the end of the 2010 admissions cycle
UCAS Tariff Score/A Level
Grades
Applications Acceptances
Male % Female % Total % Male % Female % Total %
420 A*A*A* 1,535 28 1,034 22 2,569 25 799 57 577 46 1,376 52400 A*A*A 1,064 19 979 21 2,043 20 301 21 318 25 619 23
380A*A*B 43 1 35 1 78 1 4 0.3 3 0.2 7 0.3A*AA 991 18 974 21 1,965 19 159 11 206 16 365 14
360A*A*C 1 0.0 2 0.0 3 0.0 0 0 0 0 0 0A*AB 162 3 152 3 314 3 5 0.4 11 1 16 1AAA 982 18 908 19 1,890 19 135 10 129 10 264 10
340 345 6 337 7 682 7 2 0.1 7 1 9 0.3320 191 4 157 3 348 3 1 0.1 1 0.1 2 0.1300 69 1 74 2 143 1 0 0 1 0.1 1 0.0280 34 1 33 1 67 1 1 0.1 0 0 1 0.0260 19 0.3 18 0.4 37 0.4 0 0 0 0 0 0240 14 0.3 13 0.3 27 0.3 0 0 0 0 0 0220 1 0.0 2 0.0 3 0.0 0 0 0 0 0 0200 3 0.1 1 0.0 4 0.0 0 0 0 0 0 0180 2 0.0 0 0 2 0.0 0 0 0 0 0 0160 1 0.0 1 0.0 2 0.0 0 0 0 0 0 0
Totals 5,457 100 4,720 100 10,177 100 1,407 100 1,253 100 2,660 100
In Table 3.1 the three highest A Level grades in all subjects, excluding General Studies, are used for scoring purposes.
The UCAS tariff score refers to the scoring system where at A Level A* = 140, A = 120, B = 100, C = 80, D = 60, E = 40. More information about the UCAS tariff is available at www.ucas.ac.uk/students/ucas_tariff/.
0
5
10
15
20
25
30
35
Nor
ther
n Ire
land
Sout
h Ea
st
Sout
h W
est
Lond
on
East
Ang
lia
York
shire
& H
umbe
rsid
e
East
Mid
land
s
Nor
th E
ast
Wes
t Mid
land
s
Nor
th W
est
Scot
land
Wal
es
Ove
rsea
s (o
utsid
e U
K)
%
Success rate by region 2010
Special No. 14] CAMBRIDGE UNIVERSITY REPORTER 9
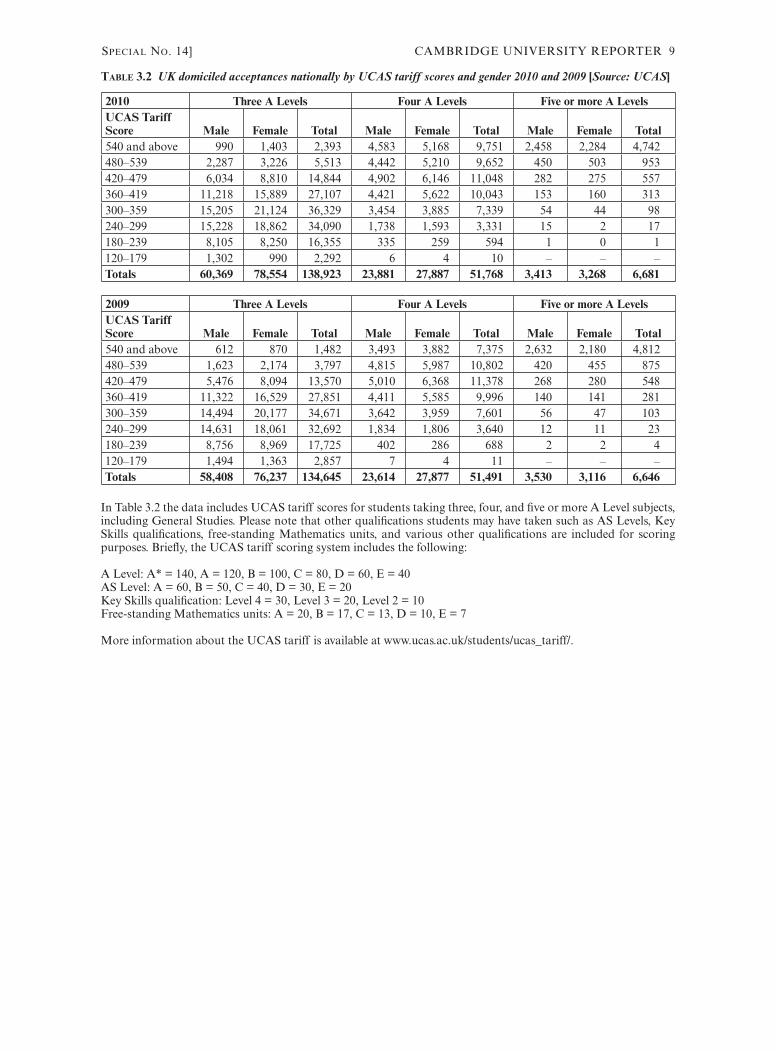
Table 3.2 UK domiciled acceptances nationally by UCAS tariff scores and gender 2010 and 2009 [Source: UCAS]
2010 Three A Levels Four A Levels Five or more A LevelsUCAS Tariff Score Male Female Total Male Female Total Male Female Total540 and above 990 1,403 2,393 4,583 5,168 9,751 2,458 2,284 4,742480–539 2,287 3,226 5,513 4,442 5,210 9,652 450 503 953420–479 6,034 8,810 14,844 4,902 6,146 11,048 282 275 557360–419 11,218 15,889 27,107 4,421 5,622 10,043 153 160 313300–359 15,205 21,124 36,329 3,454 3,885 7,339 54 44 98240–299 15,228 18,862 34,090 1,738 1,593 3,331 15 2 17180–239 8,105 8,250 16,355 335 259 594 1 0 1120–179 1,302 990 2,292 6 4 10 – – –Totals 60,369 78,554 138,923 23,881 27,887 51,768 3,413 3,268 6,681
2009 Three A Levels Four A Levels Five or more A LevelsUCAS Tariff Score Male Female Total Male Female Total Male Female Total540 and above 612 870 1,482 3,493 3,882 7,375 2,632 2,180 4,812480–539 1,623 2,174 3,797 4,815 5,987 10,802 420 455 875420–479 5,476 8,094 13,570 5,010 6,368 11,378 268 280 548360–419 11,322 16,529 27,851 4,411 5,585 9,996 140 141 281300–359 14,494 20,177 34,671 3,642 3,959 7,601 56 47 103240–299 14,631 18,061 32,692 1,834 1,806 3,640 12 11 23180–239 8,756 8,969 17,725 402 286 688 2 2 4120–179 1,494 1,363 2,857 7 4 11 – – –Totals 58,408 76,237 134,645 23,614 27,877 51,491 3,530 3,116 6,646
In Table 3.2 the data includes UCAS tariff scores for students taking three, four, and five or more A Level subjects, including General Studies. Please note that other qualifications students may have taken such as AS Levels, Key Skills qualifications, free-standing Mathematics units, and various other qualifications are included for scoring purposes. Briefly, the UCAS tariff scoring system includes the following:
A Level: A* = 140, A = 120, B = 100, C = 80, D = 60, E = 40AS Level: A = 60, B = 50, C = 40, D = 30, E = 20Key Skills qualification: Level 4 = 30, Level 3 = 20, Level 2 = 10Free-standing Mathematics units: A = 20, B = 17, C = 13, D = 10, E = 7
More information about the UCAS tariff is available at www.ucas.ac.uk/students/ucas_tariff/.
10 CAMBRIDGE UNIVERSITY REPORTER [Special No. 14
4 APPLICATIONS AND ACCEPTANCES BY COURSE
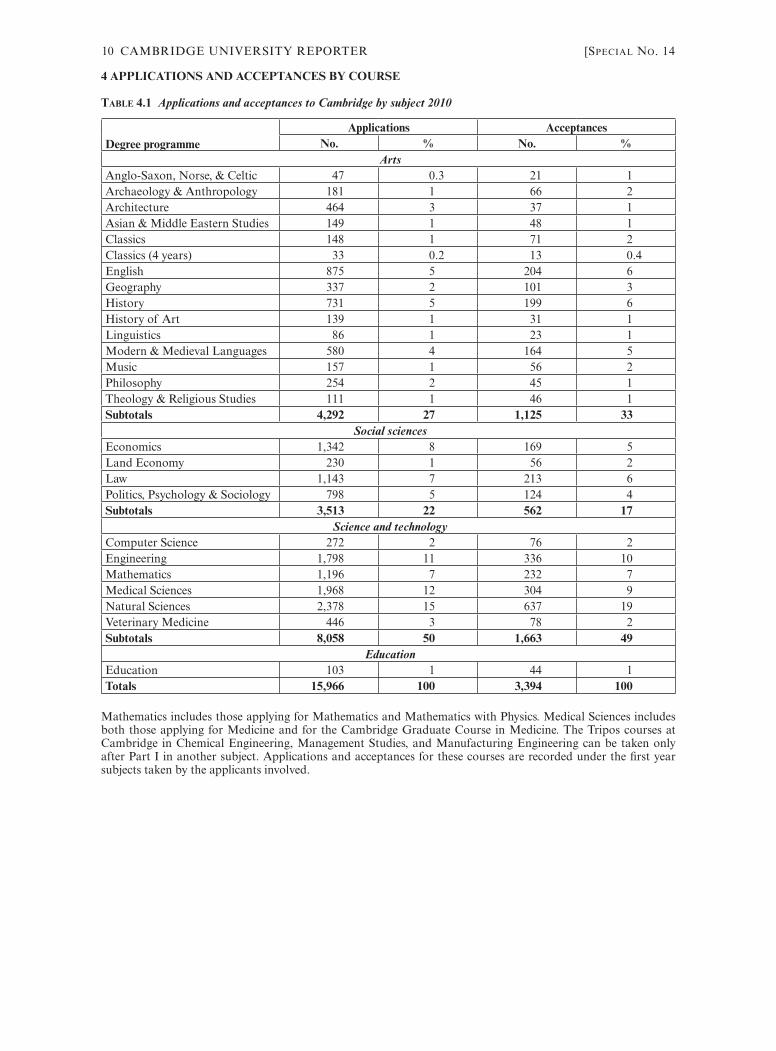
Table 4.1 Applications and acceptances to Cambridge by subject 2010
Degree programmeApplications Acceptances
No. % No. %Arts
Anglo-Saxon, Norse, & Celtic 47 0.3 21 1Archaeology & Anthropology 181 1 66 2Architecture 464 3 37 1Asian & Middle Eastern Studies 149 1 48 1Classics 148 1 71 2Classics (4 years) 33 0.2 13 0.4English 875 5 204 6Geography 337 2 101 3History 731 5 199 6History of Art 139 1 31 1Linguistics 86 1 23 1Modern & Medieval Languages 580 4 164 5Music 157 1 56 2Philosophy 254 2 45 1Theology & Religious Studies 111 1 46 1Subtotals 4,292 27 1,125 33
Social sciencesEconomics 1,342 8 169 5Land Economy 230 1 56 2Law 1,143 7 213 6Politics, Psychology & Sociology 798 5 124 4Subtotals 3,513 22 562 17
Science and technologyComputer Science 272 2 76 2Engineering 1,798 11 336 10Mathematics 1,196 7 232 7Medical Sciences 1,968 12 304 9Natural Sciences 2,378 15 637 19Veterinary Medicine 446 3 78 2Subtotals 8,058 50 1,663 49
EducationEducation 103 1 44 1Totals 15,966 100 3,394 100
Mathematics includes those applying for Mathematics and Mathematics with Physics. Medical Sciences includes both those applying for Medicine and for the Cambridge Graduate Course in Medicine. The Tripos courses at Cambridge in Chemical Engineering, Management Studies, and Manufacturing Engineering can be taken only after Part I in another subject. Applications and acceptances for these courses are recorded under the first year subjects taken by the applicants involved.
Special No. 14] CAMBRIDGE UNIVERSITY REPORTER 11
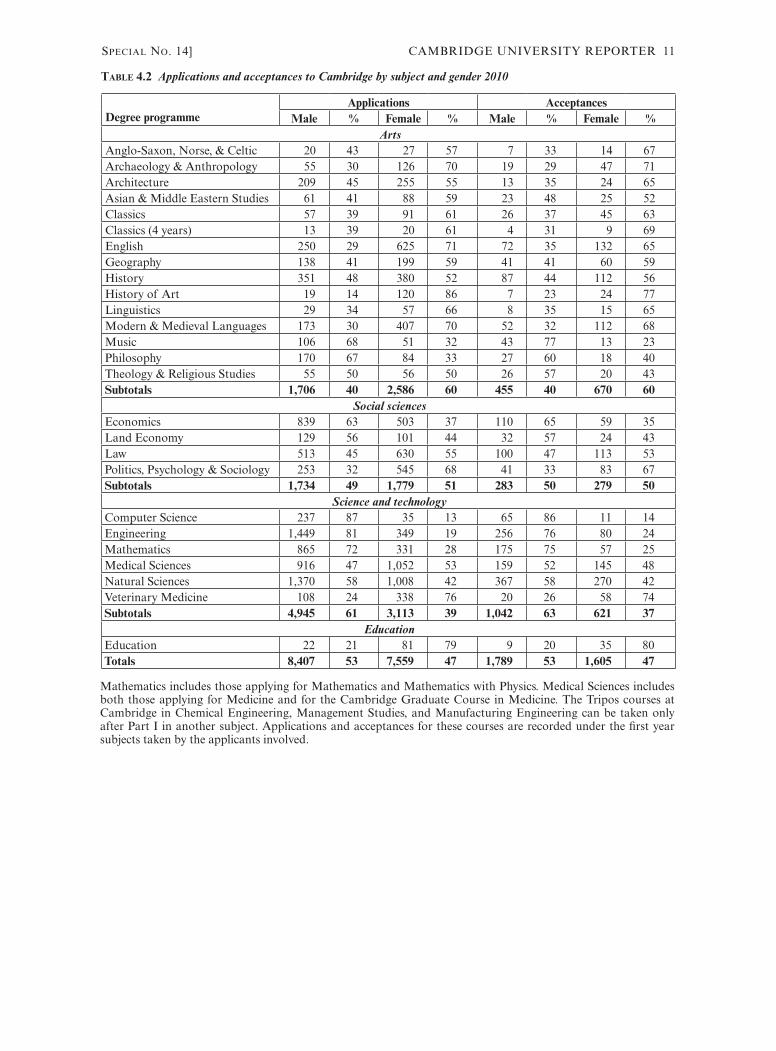
Table 4.2 Applications and acceptances to Cambridge by subject and gender 2010
Degree programmeApplications Acceptances
Male % Female % Male % Female %Arts
Anglo-Saxon, Norse, & Celtic 20 43 27 57 7 33 14 67Archaeology & Anthropology 55 30 126 70 19 29 47 71Architecture 209 45 255 55 13 35 24 65Asian & Middle Eastern Studies 61 41 88 59 23 48 25 52Classics 57 39 91 61 26 37 45 63Classics (4 years) 13 39 20 61 4 31 9 69English 250 29 625 71 72 35 132 65Geography 138 41 199 59 41 41 60 59History 351 48 380 52 87 44 112 56History of Art 19 14 120 86 7 23 24 77Linguistics 29 34 57 66 8 35 15 65Modern & Medieval Languages 173 30 407 70 52 32 112 68Music 106 68 51 32 43 77 13 23Philosophy 170 67 84 33 27 60 18 40Theology & Religious Studies 55 50 56 50 26 57 20 43Subtotals 1,706 40 2,586 60 455 40 670 60
Social sciencesEconomics 839 63 503 37 110 65 59 35Land Economy 129 56 101 44 32 57 24 43Law 513 45 630 55 100 47 113 53Politics, Psychology & Sociology 253 32 545 68 41 33 83 67Subtotals 1,734 49 1,779 51 283 50 279 50
Science and technologyComputer Science 237 87 35 13 65 86 11 14Engineering 1,449 81 349 19 256 76 80 24Mathematics 865 72 331 28 175 75 57 25Medical Sciences 916 47 1,052 53 159 52 145 48Natural Sciences 1,370 58 1,008 42 367 58 270 42Veterinary Medicine 108 24 338 76 20 26 58 74Subtotals 4,945 61 3,113 39 1,042 63 621 37
EducationEducation 22 21 81 79 9 20 35 80Totals 8,407 53 7,559 47 1,789 53 1,605 47
Mathematics includes those applying for Mathematics and Mathematics with Physics. Medical Sciences includes both those applying for Medicine and for the Cambridge Graduate Course in Medicine. The Tripos courses at Cambridge in Chemical Engineering, Management Studies, and Manufacturing Engineering can be taken only after Part I in another subject. Applications and acceptances for these courses are recorded under the first year subjects taken by the applicants involved.
12 CAMBRIDGE UNIVERSITY REPORTER [Special No. 14
12
0102030405060708090
100An
glo-
Saxo
n, N
orse
, & C
eltic
Arch
aeol
ogy
& A
nthr
opol
ogy
Arch
itect
ure
Asia
n &
Mid
dle
East
ern
Stud
ies
Clas
sics
Clas
sics (
4 ye
ars)
Com
pute
r Scie
nce
Econ
omic
sEd
ucat
ion
Engi
neer
ing
Engl
ishGe
ogra
phy
Hist
ory
Hist
ory
of A
rtLa
nd E
cono
my
Law
Ling
uist
icsM
athe
mat
ics
Med
ical
Sci
ence
sM
oder
n &
Med
ieva
l Lan
guag
esM
usic
Nat
ural
Scie
nces
Philo
soph
yPo
litics
, Psy
chol
ogy
& S
ocio
logy
Theo
logy
& R
elig
ious
Stu
dies
Vete
rinar
y M
edic
ine
%
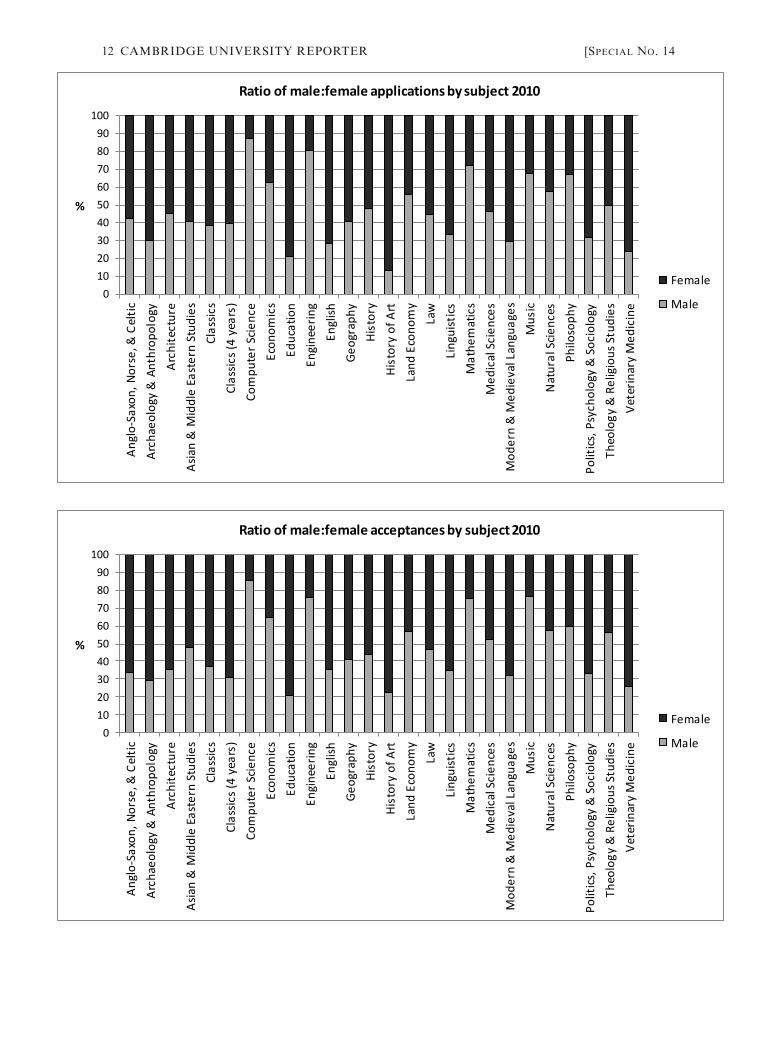
Ratio of male:female applications by subject 2010
Female
Male
0102030405060708090
100
Angl
o-Sa
xon,
Nor
se, &
Cel
ticAr
chae
olog
y &
Ant
hrop
olog
yAr
chite
ctur
eAs
ian
& M
iddl
e Ea
ster
n St
udie
sCl
assic
sCl
assic
s (4
year
s)Co
mpu
ter S
cienc
eEc
onom
ics
Educ
atio
nEn
gine
erin
gEn
glish
Geog
raph
yHi
stor
yHi
stor
y of
Art
Land
Eco
nom
yLa
wLi
ngui
stics
Mat
hem
atic
sM
edic
al S
cien
ces
Mod
ern
& M
edie
val L
angu
ages
Mus
icN
atur
al S
cienc
esPh
iloso
phy
Polit
ics, P
sych
olog
y &
Soc
iolo
gyTh
eolo
gy &
Rel
igio
us S
tudi
esVe
terin
ary
Med
icin
e%
Ratio of male:female acceptances by subject 2010
Female
Male
Special No. 14] CAMBRIDGE UNIVERSITY REPORTER 13
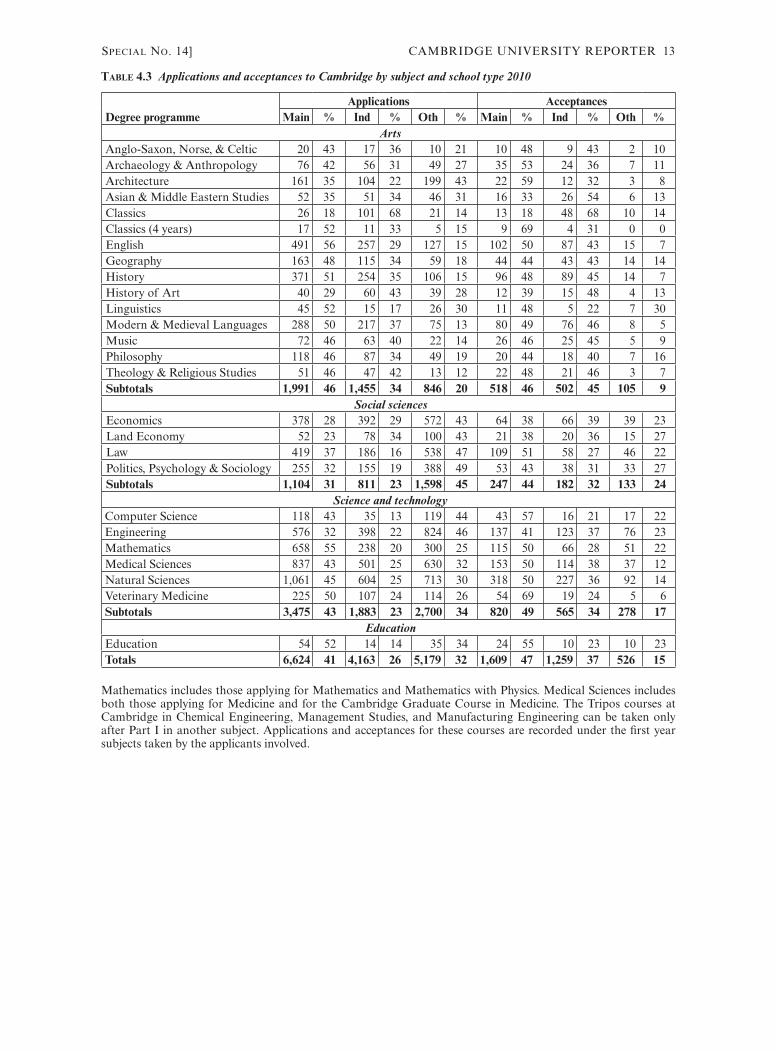
Table 4.3 Applications and acceptances to Cambridge by subject and school type 2010
Degree programmeApplications Acceptances
Main % Ind % Oth % Main % Ind % Oth %Arts
Anglo-Saxon, Norse, & Celtic 20 43 17 36 10 21 10 48 9 43 2 10Archaeology & Anthropology 76 42 56 31 49 27 35 53 24 36 7 11Architecture 161 35 104 22 199 43 22 59 12 32 3 8Asian & Middle Eastern Studies 52 35 51 34 46 31 16 33 26 54 6 13Classics 26 18 101 68 21 14 13 18 48 68 10 14Classics (4 years) 17 52 11 33 5 15 9 69 4 31 0 0English 491 56 257 29 127 15 102 50 87 43 15 7Geography 163 48 115 34 59 18 44 44 43 43 14 14History 371 51 254 35 106 15 96 48 89 45 14 7History of Art 40 29 60 43 39 28 12 39 15 48 4 13Linguistics 45 52 15 17 26 30 11 48 5 22 7 30Modern & Medieval Languages 288 50 217 37 75 13 80 49 76 46 8 5Music 72 46 63 40 22 14 26 46 25 45 5 9Philosophy 118 46 87 34 49 19 20 44 18 40 7 16Theology & Religious Studies 51 46 47 42 13 12 22 48 21 46 3 7Subtotals 1,991 46 1,455 34 846 20 518 46 502 45 105 9
Social sciencesEconomics 378 28 392 29 572 43 64 38 66 39 39 23Land Economy 52 23 78 34 100 43 21 38 20 36 15 27Law 419 37 186 16 538 47 109 51 58 27 46 22Politics, Psychology & Sociology 255 32 155 19 388 49 53 43 38 31 33 27Subtotals 1,104 31 811 23 1,598 45 247 44 182 32 133 24
Science and technologyComputer Science 118 43 35 13 119 44 43 57 16 21 17 22Engineering 576 32 398 22 824 46 137 41 123 37 76 23Mathematics 658 55 238 20 300 25 115 50 66 28 51 22Medical Sciences 837 43 501 25 630 32 153 50 114 38 37 12Natural Sciences 1,061 45 604 25 713 30 318 50 227 36 92 14Veterinary Medicine 225 50 107 24 114 26 54 69 19 24 5 6Subtotals 3,475 43 1,883 23 2,700 34 820 49 565 34 278 17
EducationEducation 54 52 14 14 35 34 24 55 10 23 10 23Totals 6,624 41 4,163 26 5,179 32 1,609 47 1,259 37 526 15
Mathematics includes those applying for Mathematics and Mathematics with Physics. Medical Sciences includes both those applying for Medicine and for the Cambridge Graduate Course in Medicine. The Tripos courses at Cambridge in Chemical Engineering, Management Studies, and Manufacturing Engineering can be taken only after Part I in another subject. Applications and acceptances for these courses are recorded under the first year subjects taken by the applicants involved.
14 CAMBRIDGE UNIVERSITY REPORTER [Special No. 14
14
0102030405060708090
100An
glo-
Saxo
n, N
orse
, & C
eltic
Arch
aeol
ogy
& A
nthr
opol
ogy
Arch
itect
ure
Asia
n &
Mid
dle
East
ern
Stud
ies
Clas
sics
Clas
sics (
4 ye
ars)
Com
pute
r Scie
nce
Econ
omic
sEd
ucat
ion
Engi
neer
ing
Engl
ishGe
ogra
phy
Hist
ory
Hist
ory
of A
rtLa
nd E
cono
my
Law
Ling
uist
icsM
athe
mat
ics
Med
ical
Sci
ence
sM
oder
n &
Med
ieva
l Lan
guag
esM
usic
Nat
ural
Scie
nces
Philo
soph
yPo
litics
, Psy
chol
ogy
& S
ocio
logy
Theo
logy
& R
elig
ious
Stu
dies
Vete
rinar
y M
edic
ine
%
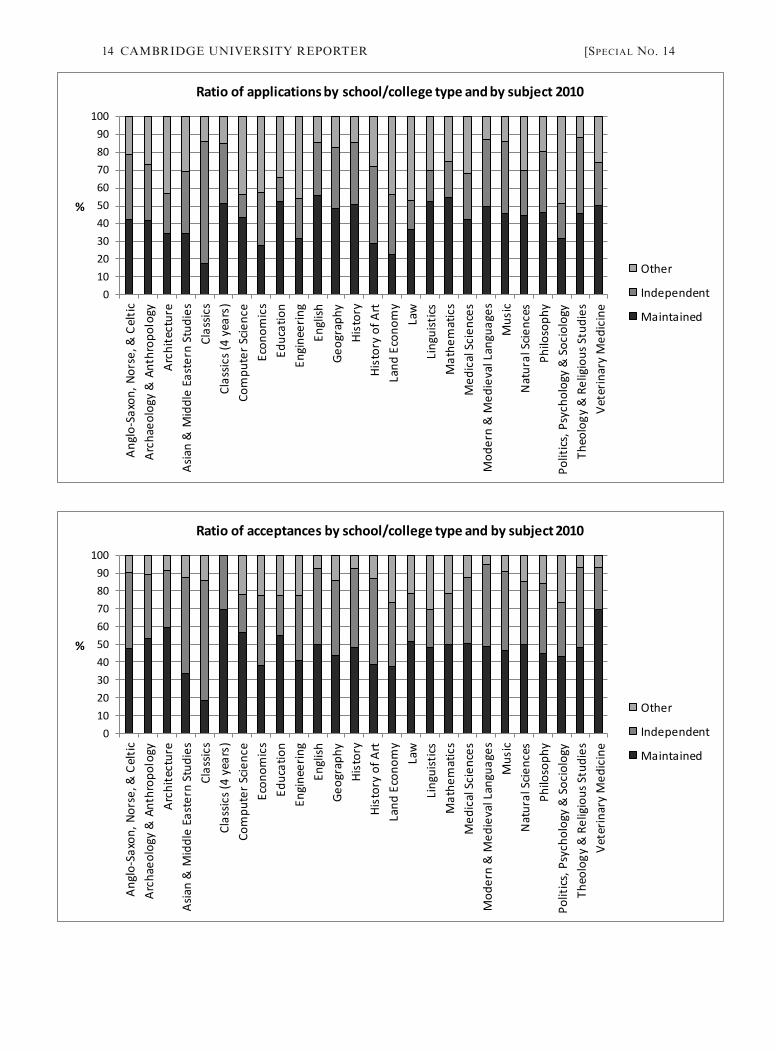
Ratio of applications by school/college type and by subject 2010
Other
Independent
Maintained
0102030405060708090
100
Angl
o-Sa
xon,
Nor
se, &
Cel
ticAr
chae
olog
y &
Ant
hrop
olog
yAr
chite
ctur
eAs
ian
& M
iddl
e Ea
ster
n St
udie
sCl
assic
sCl
assic
s (4
year
s)Co
mpu
ter S
cienc
eEc
onom
ics
Educ
atio
nEn
gine
erin
gEn
glish
Geog
raph
yHi
stor
yHi
stor
y of
Art
Land
Eco
nom
yLa
wLi
ngui
stics
Mat
hem
atic
sM
edic
al S
cien
ces
Mod
ern
& M
edie
val L
angu
ages
Mus
icN
atur
al S
cienc
esPh
iloso
phy
Polit
ics, P
sych
olog
y &
Soc
iolo
gyTh
eolo
gy &
Rel
igio
us S
tudi
esVe
terin
ary
Med
icin
e
%
Ratio of acceptances by school/college type and by subject 2010
Other
Independent
Maintained
Special No. 14] CAMBRIDGE UNIVERSITY REPORTER 15
5 APPLICATIONS AND ACCEPTANCES BY COLLEGE
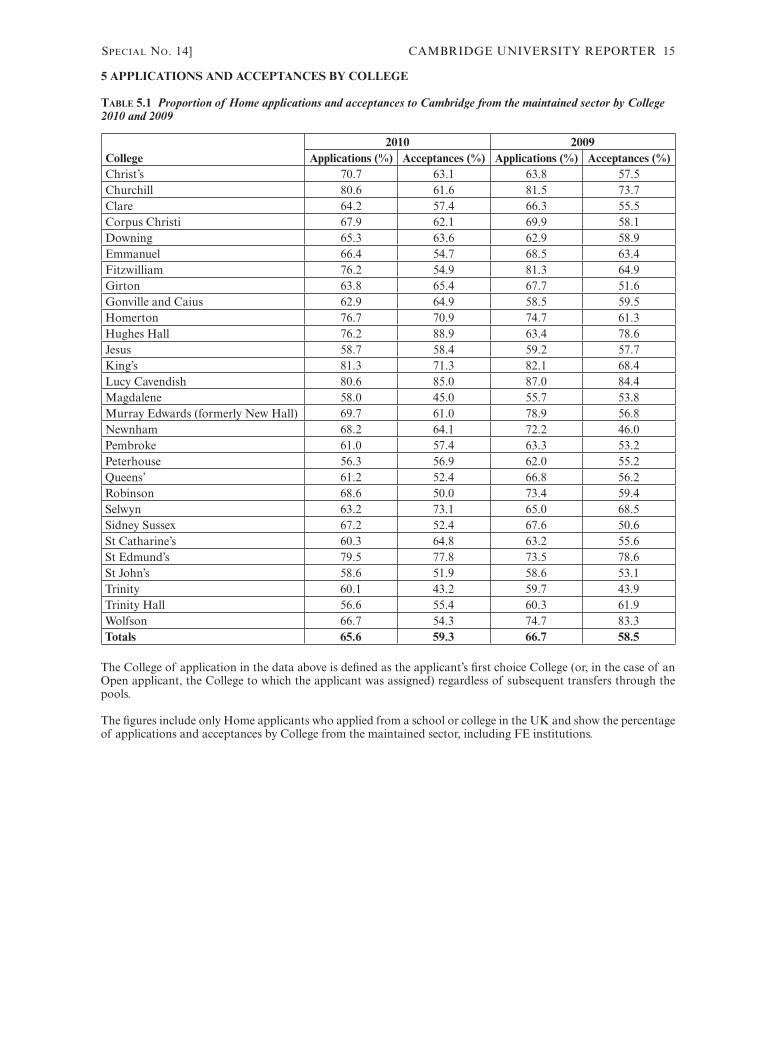
Table 5.1 Proportion of Home applications and acceptances to Cambridge from the maintained sector by College 2010 and 2009
College2010 2009
Applications (%) Acceptances (%) Applications (%) Acceptances (%)Christ’s 70.7 63.1 63.8 57.5Churchill 80.6 61.6 81.5 73.7Clare 64.2 57.4 66.3 55.5Corpus Christi 67.9 62.1 69.9 58.1Downing 65.3 63.6 62.9 58.9Emmanuel 66.4 54.7 68.5 63.4Fitzwilliam 76.2 54.9 81.3 64.9Girton 63.8 65.4 67.7 51.6Gonville and Caius 62.9 64.9 58.5 59.5Homerton 76.7 70.9 74.7 61.3Hughes Hall 76.2 88.9 63.4 78.6Jesus 58.7 58.4 59.2 57.7King’s 81.3 71.3 82.1 68.4Lucy Cavendish 80.6 85.0 87.0 84.4Magdalene 58.0 45.0 55.7 53.8Murray Edwards (formerly New Hall) 69.7 61.0 78.9 56.8Newnham 68.2 64.1 72.2 46.0Pembroke 61.0 57.4 63.3 53.2Peterhouse 56.3 56.9 62.0 55.2Queens’ 61.2 52.4 66.8 56.2Robinson 68.6 50.0 73.4 59.4Selwyn 63.2 73.1 65.0 68.5Sidney Sussex 67.2 52.4 67.6 50.6St Catharine’s 60.3 64.8 63.2 55.6St Edmund’s 79.5 77.8 73.5 78.6St John’s 58.6 51.9 58.6 53.1Trinity 60.1 43.2 59.7 43.9Trinity Hall 56.6 55.4 60.3 61.9Wolfson 66.7 54.3 74.7 83.3Totals 65.6 59.3 66.7 58.5
The College of application in the data above is defined as the applicant’s first choice College (or, in the case of an Open applicant, the College to which the applicant was assigned) regardless of subsequent transfers through the pools.
The figures include only Home applicants who applied from a school or college in the UK and show the percentage of applications and acceptances by College from the maintained sector, including FE institutions.
16 CAMBRIDGE UNIVERSITY REPORTER [Special No. 14
16
0
10
20
30
40
50
60
70
80
90
100Ch
rist's
Chur
chill
Clar
eCo
rpus
Chr
isti
Dow
ning
Emm
anue
lFi
tzw
illia
mGi
rton
Gonv
ille
and
Caiu
sHo
mer
ton
Hugh
es H
all
Jesu
sKi
ng's
Lucy
Cav
endi
shM
agda
lene
Mur
ray
Edw
ards
(for
mer
ly N
ew H
all)
New
nham
Pem
brok
ePe
terh
ouse
Que
ens'
Robi
nson
Selw
ynSi
dney
Sus
sex
St C
atha
rine'
sSt
Edm
und'
sSt
John
'sTr
inity
Trin
ity H
all
Wol
fson
%
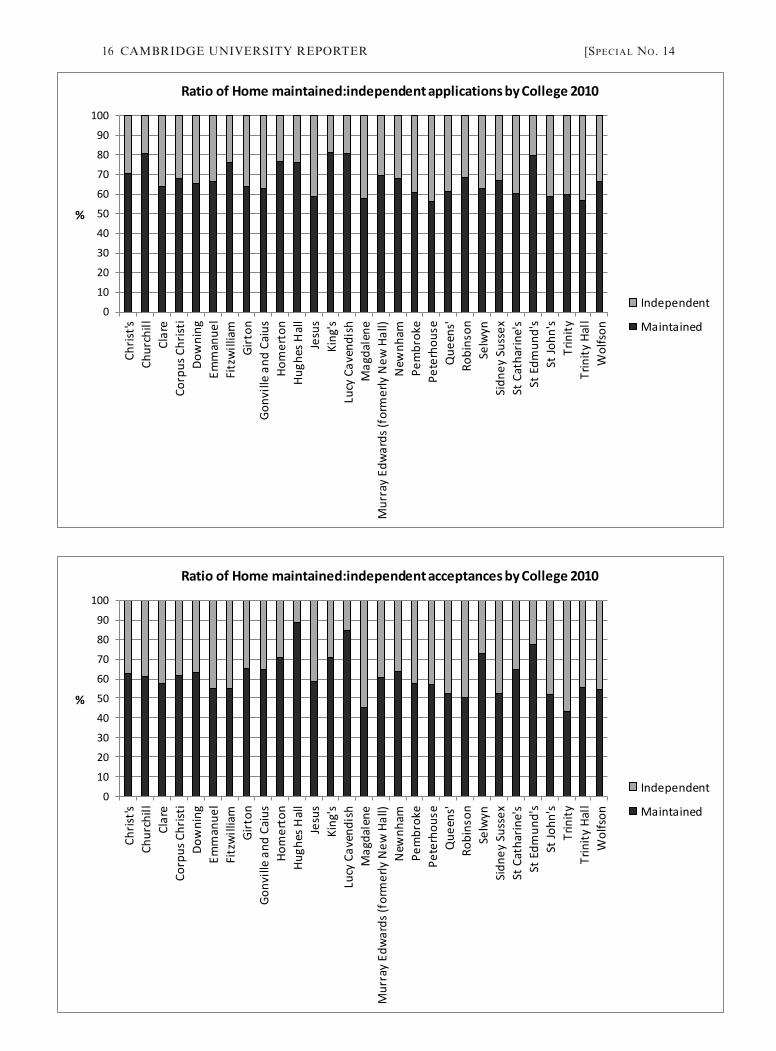
Ratio of Home maintained:independent applications by College 2010
Independent
Maintained
0
10
20
30
40
50
60
70
80
90
100
Chris
t'sCh
urch
illCl
are
Corp
us C
hrist
iDo
wni
ngEm
man
uel
Fitz
will
iam
Girt
onGo
nvill
e an
d Ca
ius
Hom
erto
nHu
ghes
Hal
lJe
sus
King
'sLu
cy C
aven
dish
Mag
dale
neM
urra
y Ed
war
ds (f
orm
erly
New
Hal
l)N
ewnh
amPe
mbr
oke
Pete
rhou
seQ
ueen
s'Ro
bins
onSe
lwyn
Sidn
ey S
usse
xSt
Cat
harin
e's
St E
dmun
d's
St Jo
hn's
Trin
ityTr
inity
Hal
lW
olfs
on
%
Ratio of Home maintained:independent acceptances by College 2010
Independent
Maintained
Special No. 14] CAMBRIDGE UNIVERSITY REPORTER 17
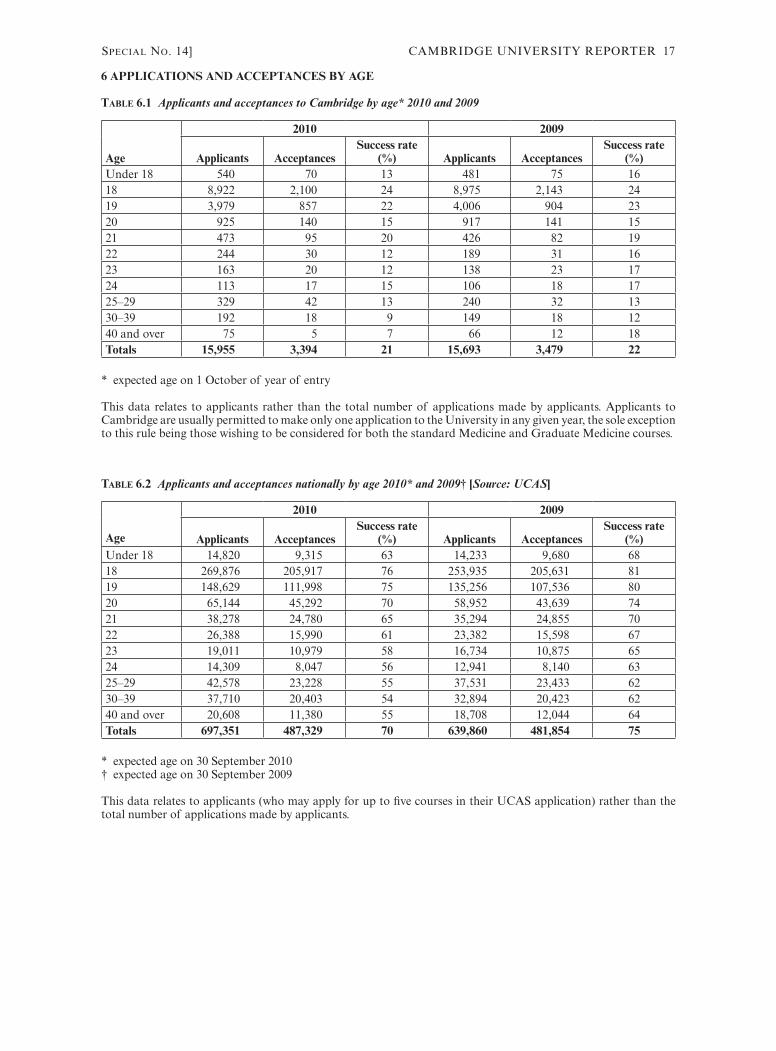
6 APPLICATIONS AND ACCEPTANCES BY AGE
Table 6.1 Applicants and acceptances to Cambridge by age* 2010 and 2009
Age
2010 2009
Applicants AcceptancesSuccess rate
(%) Applicants AcceptancesSuccess rate
(%)Under 18 540 70 13 481 75 1618 8,922 2,100 24 8,975 2,143 2419 3,979 857 22 4,006 904 2320 925 140 15 917 141 1521 473 95 20 426 82 1922 244 30 12 189 31 1623 163 20 12 138 23 1724 113 17 15 106 18 1725–29 329 42 13 240 32 1330–39 192 18 9 149 18 1240 and over 75 5 7 66 12 18Totals 15,955 3,394 21 15,693 3,479 22
* expected age on 1 October of year of entry
This data relates to applicants rather than the total number of applications made by applicants. Applicants to Cambridge are usually permitted to make only one application to the University in any given year, the sole exception to this rule being those wishing to be considered for both the standard Medicine and Graduate Medicine courses.
Table 6.2 Applicants and acceptances nationally by age 2010* and 2009† [Source: UCAS]
Age
2010 2009
Applicants AcceptancesSuccess rate
(%) Applicants AcceptancesSuccess rate
(%)Under 18 14,820 9,315 63 14,233 9,680 6818 269,876 205,917 76 253,935 205,631 8119 148,629 111,998 75 135,256 107,536 8020 65,144 45,292 70 58,952 43,639 7421 38,278 24,780 65 35,294 24,855 7022 26,388 15,990 61 23,382 15,598 6723 19,011 10,979 58 16,734 10,875 6524 14,309 8,047 56 12,941 8,140 6325–29 42,578 23,228 55 37,531 23,433 6230–39 37,710 20,403 54 32,894 20,423 6240 and over 20,608 11,380 55 18,708 12,044 64Totals 697,351 487,329 70 639,860 481,854 75
* expected age on 30 September 2010† expected age on 30 September 2009
This data relates to applicants (who may apply for up to five courses in their UCAS application) rather than the total number of applications made by applicants.
18 CAMBRIDGE UNIVERSITY REPORTER [Special No. 14
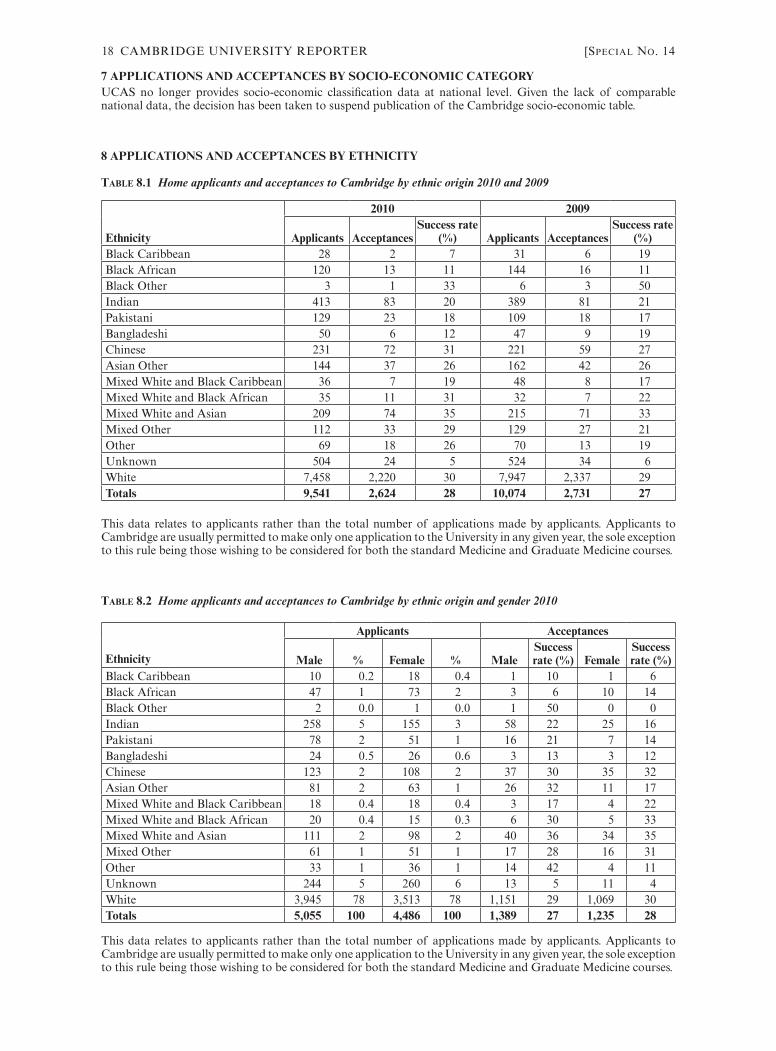
7 APPLICATIONS AND ACCEPTANCES BY SOCIO-ECONOMIC CATEGORYUCAS no longer provides socio-economic classification data at national level. Given the lack of comparable national data, the decision has been taken to suspend publication of the Cambridge socio-economic table.
8 APPLICATIONS AND ACCEPTANCES BY ETHNICITY
Table 8.1 Home applicants and acceptances to Cambridge by ethnic origin 2010 and 2009
Ethnicity
2010 2009
Applicants AcceptancesSuccess rate
(%) Applicants AcceptancesSuccess rate
(%)Black Caribbean 28 2 7 31 6 19Black African 120 13 11 144 16 11Black Other 3 1 33 6 3 50Indian 413 83 20 389 81 21Pakistani 129 23 18 109 18 17Bangladeshi 50 6 12 47 9 19Chinese 231 72 31 221 59 27Asian Other 144 37 26 162 42 26Mixed White and Black Caribbean 36 7 19 48 8 17Mixed White and Black African 35 11 31 32 7 22Mixed White and Asian 209 74 35 215 71 33Mixed Other 112 33 29 129 27 21Other 69 18 26 70 13 19Unknown 504 24 5 524 34 6White 7,458 2,220 30 7,947 2,337 29Totals 9,541 2,624 28 10,074 2,731 27
This data relates to applicants rather than the total number of applications made by applicants. Applicants to Cambridge are usually permitted to make only one application to the University in any given year, the sole exception to this rule being those wishing to be considered for both the standard Medicine and Graduate Medicine courses.
Table 8.2 Home applicants and acceptances to Cambridge by ethnic origin and gender 2010
Ethnicity
Applicants Acceptances
Male % Female % MaleSuccess rate (%) Female
Success rate (%)
Black Caribbean 10 0.2 18 0.4 1 10 1 6Black African 47 1 73 2 3 6 10 14Black Other 2 0.0 1 0.0 1 50 0 0Indian 258 5 155 3 58 22 25 16Pakistani 78 2 51 1 16 21 7 14Bangladeshi 24 0.5 26 0.6 3 13 3 12Chinese 123 2 108 2 37 30 35 32Asian Other 81 2 63 1 26 32 11 17Mixed White and Black Caribbean 18 0.4 18 0.4 3 17 4 22Mixed White and Black African 20 0.4 15 0.3 6 30 5 33Mixed White and Asian 111 2 98 2 40 36 34 35Mixed Other 61 1 51 1 17 28 16 31Other 33 1 36 1 14 42 4 11Unknown 244 5 260 6 13 5 11 4White 3,945 78 3,513 78 1,151 29 1,069 30Totals 5,055 100 4,486 100 1,389 27 1,235 28
This data relates to applicants rather than the total number of applications made by applicants. Applicants to Cambridge are usually permitted to make only one application to the University in any given year, the sole exception to this rule being those wishing to be considered for both the standard Medicine and Graduate Medicine courses.
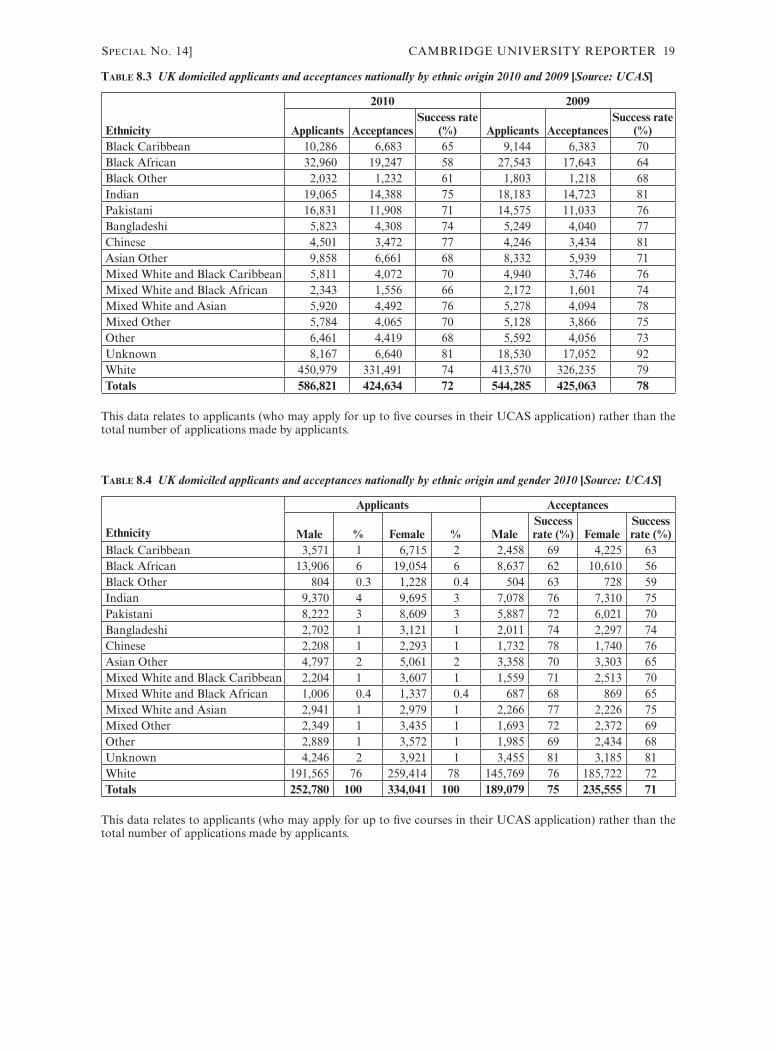
Special No. 14] CAMBRIDGE UNIVERSITY REPORTER 19
Table 8.3 UK domiciled applicants and acceptances nationally by ethnic origin 2010 and 2009 [Source: UCAS]
Ethnicity
2010 2009
Applicants AcceptancesSuccess rate
(%) Applicants AcceptancesSuccess rate
(%)Black Caribbean 10,286 6,683 65 9,144 6,383 70Black African 32,960 19,247 58 27,543 17,643 64Black Other 2,032 1,232 61 1,803 1,218 68Indian 19,065 14,388 75 18,183 14,723 81Pakistani 16,831 11,908 71 14,575 11,033 76Bangladeshi 5,823 4,308 74 5,249 4,040 77Chinese 4,501 3,472 77 4,246 3,434 81Asian Other 9,858 6,661 68 8,332 5,939 71Mixed White and Black Caribbean 5,811 4,072 70 4,940 3,746 76Mixed White and Black African 2,343 1,556 66 2,172 1,601 74Mixed White and Asian 5,920 4,492 76 5,278 4,094 78Mixed Other 5,784 4,065 70 5,128 3,866 75Other 6,461 4,419 68 5,592 4,056 73Unknown 8,167 6,640 81 18,530 17,052 92White 450,979 331,491 74 413,570 326,235 79Totals 586,821 424,634 72 544,285 425,063 78
This data relates to applicants (who may apply for up to five courses in their UCAS application) rather than the total number of applications made by applicants.
Table 8.4 UK domiciled applicants and acceptances nationally by ethnic origin and gender 2010 [Source: UCAS]
Ethnicity
Applicants Acceptances
Male % Female % MaleSuccess rate (%) Female
Success rate (%)
Black Caribbean 3,571 1 6,715 2 2,458 69 4,225 63Black African 13,906 6 19,054 6 8,637 62 10,610 56Black Other 804 0.3 1,228 0.4 504 63 728 59Indian 9,370 4 9,695 3 7,078 76 7,310 75Pakistani 8,222 3 8,609 3 5,887 72 6,021 70Bangladeshi 2,702 1 3,121 1 2,011 74 2,297 74Chinese 2,208 1 2,293 1 1,732 78 1,740 76Asian Other 4,797 2 5,061 2 3,358 70 3,303 65Mixed White and Black Caribbean 2,204 1 3,607 1 1,559 71 2,513 70Mixed White and Black African 1,006 0.4 1,337 0.4 687 68 869 65Mixed White and Asian 2,941 1 2,979 1 2,266 77 2,226 75Mixed Other 2,349 1 3,435 1 1,693 72 2,372 69Other 2,889 1 3,572 1 1,985 69 2,434 68Unknown 4,246 2 3,921 1 3,455 81 3,185 81White 191,565 76 259,414 78 145,769 76 185,722 72Totals 252,780 100 334,041 100 189,079 75 235,555 71
This data relates to applicants (who may apply for up to five courses in their UCAS application) rather than the total number of applications made by applicants.
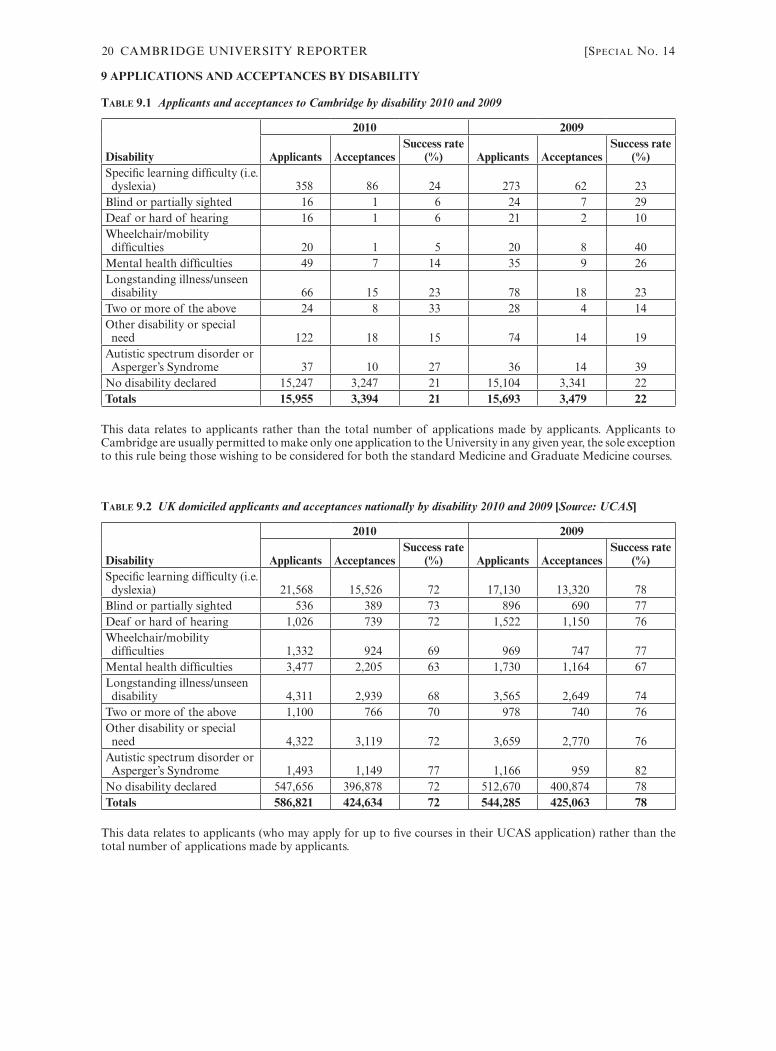
20 CAMBRIDGE UNIVERSITY REPORTER [Special No. 14
9 APPLICATIONS AND ACCEPTANCES BY DISABILITY
Table 9.1 Applicants and acceptances to Cambridge by disability 2010 and 2009
Disability
2010 2009
Applicants AcceptancesSuccess rate
(%) Applicants AcceptancesSuccess rate
(%)Specific learning difficulty (i.e. dyslexia) 358 86 24 273 62 23
Blind or partially sighted 16 1 6 24 7 29Deaf or hard of hearing 16 1 6 21 2 10Wheelchair/mobility difficulties 20 1 5 20 8 40
Mental health difficulties 49 7 14 35 9 26Longstanding illness/unseen disability 66 15 23 78 18 23
Two or more of the above 24 8 33 28 4 14Other disability or special need 122 18 15 74 14 19
Autistic spectrum disorder or Asperger’s Syndrome 37 10 27 36 14 39
No disability declared 15,247 3,247 21 15,104 3,341 22Totals 15,955 3,394 21 15,693 3,479 22
This data relates to applicants rather than the total number of applications made by applicants. Applicants to Cambridge are usually permitted to make only one application to the University in any given year, the sole exception to this rule being those wishing to be considered for both the standard Medicine and Graduate Medicine courses.
Table 9.2 UK domiciled applicants and acceptances nationally by disability 2010 and 2009 [Source: UCAS]
Disability
2010 2009
Applicants AcceptancesSuccess rate
(%) Applicants AcceptancesSuccess rate
(%)Specific learning difficulty (i.e. dyslexia) 21,568 15,526 72 17,130 13,320 78
Blind or partially sighted 536 389 73 896 690 77Deaf or hard of hearing 1,026 739 72 1,522 1,150 76Wheelchair/mobility difficulties 1,332 924 69 969 747 77
Mental health difficulties 3,477 2,205 63 1,730 1,164 67Longstanding illness/unseen disability 4,311 2,939 68 3,565 2,649 74
Two or more of the above 1,100 766 70 978 740 76Other disability or special need 4,322 3,119 72 3,659 2,770 76
Autistic spectrum disorder or Asperger’s Syndrome 1,493 1,149 77 1,166 959 82
No disability declared 547,656 396,878 72 512,670 400,874 78Totals 586,821 424,634 72 544,285 425,063 78
This data relates to applicants (who may apply for up to five courses in their UCAS application) rather than the total number of applications made by applicants.
Special No. 14] CAMBRIDGE UNIVERSITY REPORTER 21
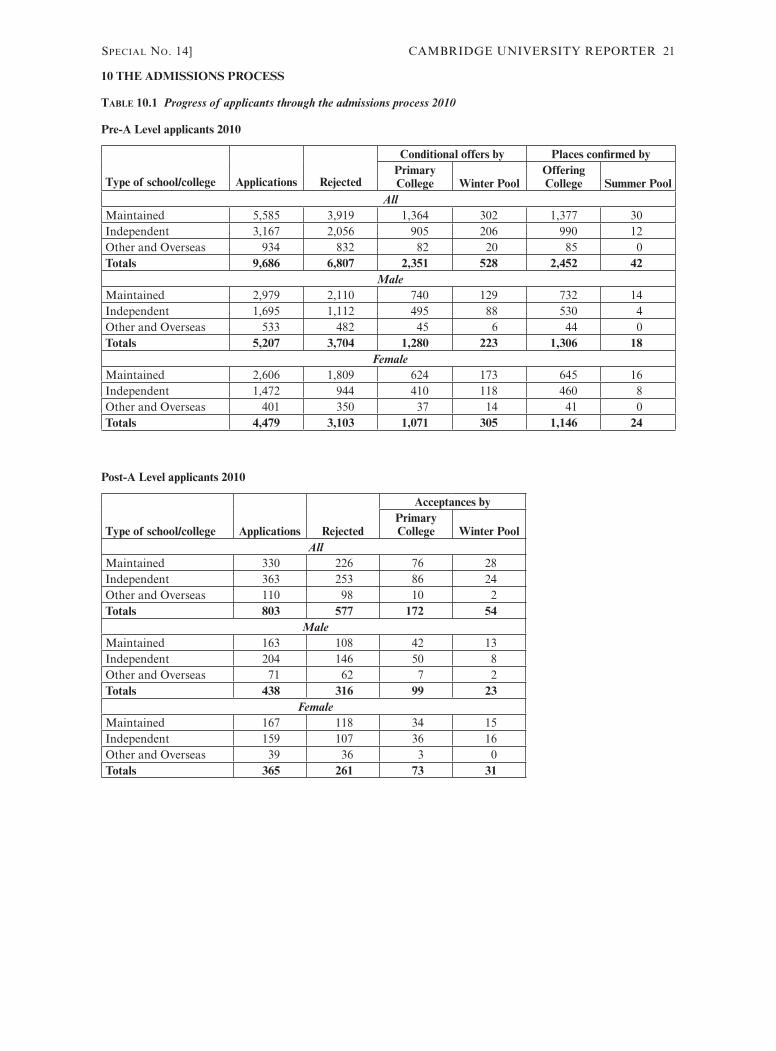
10 THE ADMISSIONS PROCESS
Table 10.1 Progress of applicants through the admissions process 2010
Pre-A Level applicants 2010
Type of school/college Applications Rejected
Conditional offers by Places confirmed byPrimary College Winter Pool
Offering College Summer Pool
AllMaintained 5,585 3,919 1,364 302 1,377 30Independent 3,167 2,056 905 206 990 12Other and Overseas 934 832 82 20 85 0Totals 9,686 6,807 2,351 528 2,452 42
MaleMaintained 2,979 2,110 740 129 732 14Independent 1,695 1,112 495 88 530 4Other and Overseas 533 482 45 6 44 0Totals 5,207 3,704 1,280 223 1,306 18
FemaleMaintained 2,606 1,809 624 173 645 16Independent 1,472 944 410 118 460 8Other and Overseas 401 350 37 14 41 0Totals 4,479 3,103 1,071 305 1,146 24
Post-A Level applicants 2010
Type of school/college Applications Rejected
Acceptances byPrimary College Winter Pool
AllMaintained 330 226 76 28Independent 363 253 86 24Other and Overseas 110 98 10 2Totals 803 577 172 54
MaleMaintained 163 108 42 13Independent 204 146 50 8Other and Overseas 71 62 7 2Totals 438 316 99 23
FemaleMaintained 167 118 34 15Independent 159 107 36 16Other and Overseas 39 36 3 0Totals 365 261 73 31
22 CAMBRIDGE UNIVERSITY REPORTER [Special No. 14
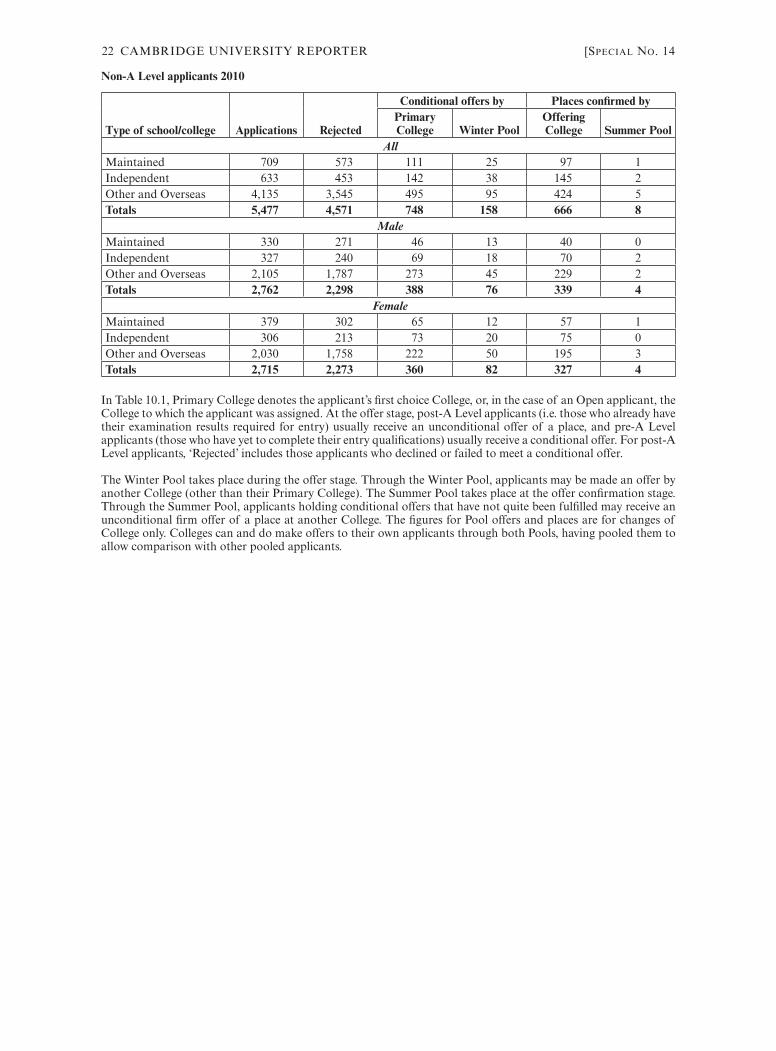
Non-A Level applicants 2010
Type of school/college Applications Rejected
Conditional offers by Places confirmed byPrimary College Winter Pool
Offering College Summer Pool
AllMaintained 709 573 111 25 97 1Independent 633 453 142 38 145 2Other and Overseas 4,135 3,545 495 95 424 5Totals 5,477 4,571 748 158 666 8
MaleMaintained 330 271 46 13 40 0Independent 327 240 69 18 70 2Other and Overseas 2,105 1,787 273 45 229 2Totals 2,762 2,298 388 76 339 4
FemaleMaintained 379 302 65 12 57 1Independent 306 213 73 20 75 0Other and Overseas 2,030 1,758 222 50 195 3Totals 2,715 2,273 360 82 327 4
In Table 10.1, Primary College denotes the applicant’s first choice College, or, in the case of an Open applicant, the College to which the applicant was assigned. At the offer stage, post-A Level applicants (i.e. those who already have their examination results required for entry) usually receive an unconditional offer of a place, and pre-A Level applicants (those who have yet to complete their entry qualifications) usually receive a conditional offer. For post-A Level applicants, ‘Rejected’ includes those applicants who declined or failed to meet a conditional offer.
The Winter Pool takes place during the offer stage. Through the Winter Pool, applicants may be made an offer by another College (other than their Primary College). The Summer Pool takes place at the offer confirmation stage. Through the Summer Pool, applicants holding conditional offers that have not quite been fulfilled may receive an unconditional firm offer of a place at another College. The figures for Pool offers and places are for changes of College only. Colleges can and do make offers to their own applicants through both Pools, having pooled them to allow comparison with other pooled applicants.

Special No. 14] CAMBRIDGE UNIVERSITY REPORTER 23
24 CAMBRIDGE UNIVERSITY REPORTER [Special No. 14
The Cambridge University Reporter appears on Wednesdays during Term. Special Numbers are also published from time to time.
EditorialNotices for publication in the Reporter should be sent to the Editor, Cambridge University Reporter, Secretariat, The Old Schools, Cambridge, CB2 1TN (tel. 01223 332305, fax 01223 332332, email [email protected]). Copy should be sent as early as possible in the week before publication; short notices will be accepted up to 4 p.m. on Thursday for publication the following Wednesday. Inclusion is subject to availability of space.
SubscriptionsDetails of termly subscription rates and charges for individual copies may be obtained from the University Press Bookshop, 1 Trinity Street, Cambridge, CB2 1SZ (tel. 01223 333333, fax 01223 332954, email [email protected]). Orders should be placed at the Bookshop.
Printed in the United Kingdom at the University Press, Cambridge and published by Cambridge University Press, The Edinburgh Building, Cambridge, CB2 8RU.
Registered at the Post Office as a newspaper.