Embed Size (px)
Citation preview
1
PROGRAMA DOCTORADO ECONOMÍA APLICADA
Tercer año de seguimiento, curso 2015-2016
DEPARTAMENTO ECONOMÍA APLICADA
PROYECTO
EL SECTOR DEL TRANSPORTE: CONSUMO ENERGÉTICO Y EMISIONES
Lidia Andrés Delgado
Emilio Padilla Rosa
DIRECTOR
2
DRIVING FACTORS OF GREENHOUSE GAS EMISSIONS IN THE EU-28
TRANSPORT SECTOR. 1990-2012.
MOTIVATION
ABSTRAT
The aim of this research is to identify the driving factors of greenhouse gas emissions in the UE-
28 transport sector and the contribution of each one of them in their change during the period
1990–2012. The analysis is based on the STIRPAT model which is broadened in order to
investigate in-depth the impact on transport sector emissions caused by changes in the whole
economy and in the activity itself. Therefore, the study takes into account population, economic
activity, transport sector activity and its structural composition (passengers and freight activities,
energy efficiency, modes of transport, and energy sources). The use of panel data econometric
techniques allows to quantify the significance of each factor on emissions, as well as the effect
on them of a change in any key factor. A better knowledge of the key driving forces is crucial for
implementing environmental policies focused on successfully reducing emissions in the transport
sector.
3
INTRODUCTION
Greenhouse gas emissions decreased by 19.7% in the EU-28 between 1990 and 2012. All
economic sectors contributed to this reduction with one exception, the transport sector. The
activity revealed a completely different behaviour as its emissions increased by 13.6% –from
785,891.1 to 893,042.9 thousand tonnes1- in the same period. Consequently, the contribution of
the activity to total emissions has increased considerably since 1990, being responsible for
19.6% in 2012. At present, the transport sector is the second most important source of
emissions after the energy sector in the EU.
The upward trend in emissions in the EU-28 transport sector is related to a 23.9% rise in its
energy consumption over the period, achieving a total of 351,967.7 thousands of tonnes of oil
equivalent in 2012, which represented 31.9% of total final energy consumption. These figures
explain the difficulty of diminishing the greenhouse gas emissions in the activity, as emissions
are the result of the volume of energy consumption and the mix of energy sources used in
transportation. Between 1990 and 2007, a scenario of growing activity, energy consumption in
the EU-28 transport sector came to reach an increase of 34.8% and its related emissions of
19.6%.
This trend in transport emissions needs to be reversed so as to satisfy the 2011 Transport White
Paper objective, which consists in reducing by 2050 the activity’s emissions in relation to 1990
by 60% (European Commission, 2011).
Profuse research has studied the role of the transport sector activity in greenhouse gas
emissions, from investigations such as Saboori et al. (2014), who examine the relationship
between emissions and energy use in the transport sector with economic growth, to
investigations more focused on the activity itself: taking it as a whole, paying attention to a
specific mode of transport, or disaggregating it by type of activity (passenger or freight). In
relation to this last research, two main methodologies are used: decomposition analysis, which is
based on the ASIF equation; and econometrics, which is based on the STIRPAT model.
Examples of studies which use decomposition analysis to investigate the emissions in transport
sector are the works of Laksmanan and Han (1997), who studied the underlying factors of the
changes in CO2 emissions in the USA transport sector during the period 1970–1991; Timilsina
and Shresta (2009), who investigated the same issue but referred to a group of selected Asian
countries for the period 1980–2005; Andreoni and Galmarini (2012), who explored the main
factors affecting the CO2 emissions of water and aviation transport activities in Europe between
1 CO2 equivalent emissions of the six gases covered by the Kyoto Protocol, European Commission (2016).
4
2001 and 2008; Sobrino and Monzon (2014), who examined the main forces influencing road
transport emissions in Spain from 1990 to 2010; Scholl et al. (1996), who analysed the changes
in CO2 emissions and energy use of passenger transport sector in nine OECD countries
between 1973 and 1992; Steenhof et al. (2006), who studied the determinants of the increasing
greenhouse gas emissions in Canadian’s freight sector between 1990 and 2003 and explored
different scenarios to year 2012; or Fan and Lei (2016), who investigated the factors influencing
transport sector of Beijing between 1995 and 2012.
Among the investigations using econometrics techniques, some examples are the works of
Zhang and Nian (2013), who analysed CO2 emissions in transport sector in China between 1995
and 2010 and paid special attention to regional differences using panel data; Xu and Lin (2015),
who examined CO2 emissions in transport sector during the period 1980-2012 using a dynamic
VAR approach; or Ratanavaraha and Jomnonkwao (2015), who forecasted the CO2 emissions
from energy use in Thailand’s transport sector and their related factors by 2030 using four
different techniques.
With the purpose of achieving a sustainable transport as described in the 2011 Transport White
Paper, the increasing trend on greenhouse gas emissions in the EU-28 transport sector in the
last years needs to be analysed in-depth in order to identify its key driving factors and the impact
of each one of them in its evolution.
In this paper, we focus on identifying the driving factors of greenhouse gas emissions in the EU-
28 transport sector over the period 1990-2012 and on quantifying the effects of a change in any
of them over such emissions using the STIRPAT model, which is based on the IPAT identity.
The IPAT identity, founded on ecological principles (York et al., 2003), states that the
environmental impact (I) is the product of population (P), affluence (A), and technology (T)
(Ehlrich and Holdren, 1971, 1972). This identity has been widely used as a basis for analysing
the effect of economic activity on the environment. However, it is an accounting equation and
does not allow hypothesis testing, additionally, it assumes that the functional relationship
between factors is proportional (York et al., 2003). Due to its limitations, it is the STIRPAT model
proposed by Dietz and Rosa (1997), a reformulation of the IPAT identity into a stochastic model,
the method used in this research. The STIRPAT method overcomes the limitations of the IPAT
identity as it allows estimation and hypothesis testing using econometric techniques. We use an
extended STIRPAT model to identify the driving factors of the activity, where besides population
and affluence, technology has been decomposed into eleven factors so as to obtain more
detailed results focused on transport activity.
This paper is, then, different from prior research as it complements the STIRPAT model by
introducing the structural composition of transport sector by taking into account passenger and
freight activities and, additionally, total energy consumption disaggregated by all modes of
5
transport, and by all sources of energy. The objective is to highlight that the effect of the activity
on its emissions relies not only on transport volume but also on its structural composition. In
order to quantify the impact of the different factors identified previously, panel data econometrics
is employed. The main purpose of the analysis is to inform the design of environmental policies
focused on diminishing environmental impacts besides promoting an efficient energy use and
energy savings in the transport sector. As Grazi and van den Bergh (2008) pointed out the
results of the environmental policies aimed at reducing emissions in transport sector depend on
in their effects in the modal split, energy efficiency, fuel type used and transport volume
(passenger-kilometres or tonnes-kilometre). Therefore, both the volume and the structural
composition of transport sector are important to explain the evolution of its emissions and to
design more accurate policies.
Moreover, this paper contributes, in particular, in providing information about the possible results
of the application of the measures suggested in the 2011 Transport White Paper in order to
achieve the objective of reducing the emissions of the transport activity.
An additional contribution of this paper is that the analysis is performed taking into account the
EU-28 as a whole and differentiating by regions (EU-15 and EU East). Besides, this paper differs
from previous researches as it focus the analysis on all greenhouse gas emissions of the
transport sector instead of only CO2 emissions.
DATA
In order to perform the analysis, annual data of the EU-28 countries have been collected from
different sources for the period 1990-2012. Data on greenhouse gas emissions in transport
sector (in Gg of CO2 equivalent) and real GDP (in constant 2005 million USD) are obtained from
UNFCCC, data on population (individuals) and energy consumption (in thousand tonnes of oil
equivalent) from EUROSTAT, and data on passenger-kilometres and tonne-kilometres (both in
gross tonne-kilometres) from the Odyssee database. So as to consider the structural
composition of the energy consumption in the EU-28 transport sector, data on energy
consumption are disaggregated by mode of transport and by source of energy (table 1).
To conduct the analysis, moreover, it is necessary to obtain data of energy intensity in transport
sector. In this research this variable is defined as energy consumption on transport sector per
unit of GDP, as the level of the activity and its evolution depend on the level and evolution of the
other economic sectors.
This research takes into account the whole transport activity, excluding international maritime
bunkers and international aviation, as they cannot be assigned to a country.
6
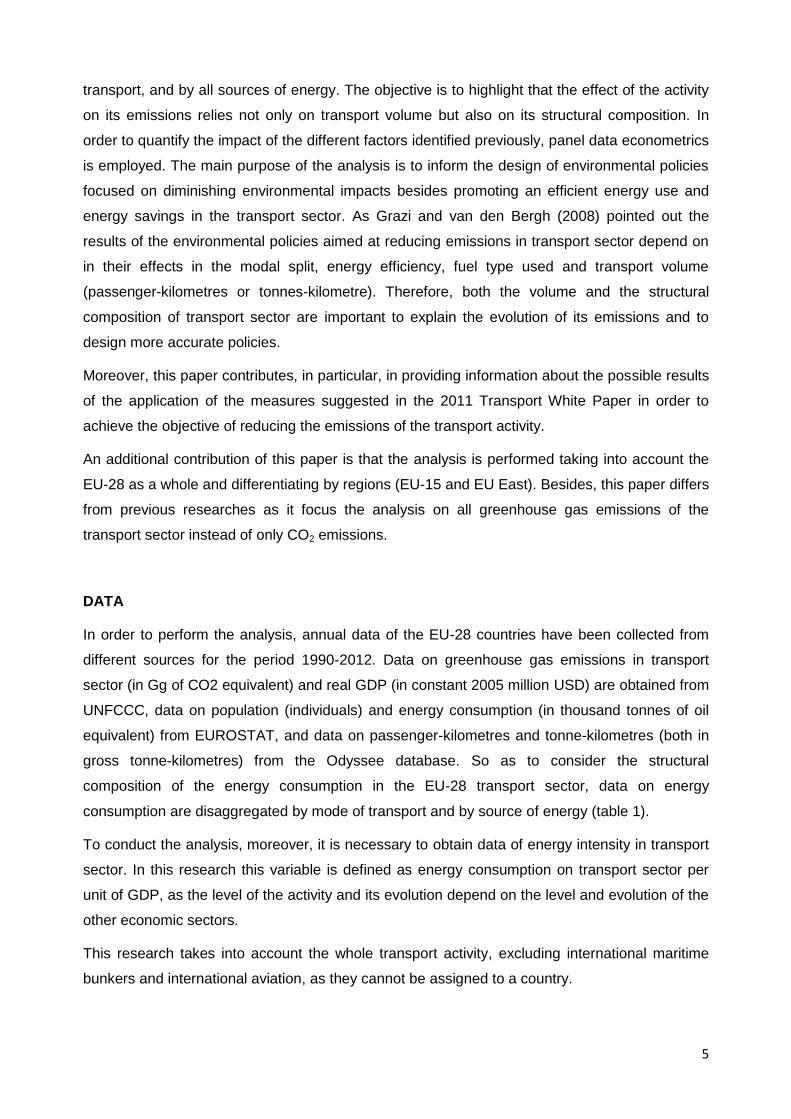
Table 1. Energy consumption by modes of transport and by energy sources in the EU-28 transport sector (thousand TOE). 1990-2012.
Energy consumption Share
1990 2012 Total change
(%) 1990 2012
Total activity 284,182.8 351,967.7 23.9% 100.0% 100.0%
Modes of transport
Aviation 29,628.4 49,137.9 65.8% 10.4% 14.0%
Navigation 6,390.4 4,906.9 -23.2% 2.2% 1.4%
Road 238,020.6 287,248.5 20.7% 83.8% 81.6%
Rail 8,278.6 7,009.3 -15.3% 2.9% 2.0%
Pipelines 194.7 1,484.5 662.5% 0.1% 0.4%
Other 1,669.9 2,180.8 30.6% 0.6% 0.6%
Source of energy
Solid fuels 213.5 9.7 -95.5% 0.1% 0.0%
Petroleum products 278,156.9 329,156.5 18.3% 97.9% 93.5%
Gas 337.7 2,832.4 738.7% 0.1% 0.8%
Renewable energies 18.8 14,466.3 76,848.4% 0.0% 4.1%
Electrical energy 5,455.7 5,503.1 0.9% 1.9% 1.6%
Source: Prepared by the author with data from EUROSTAT (2016)
The statistical description of the variables used in the analysis are shown in table 2.
Table 2. Statistical description of the variables
Variable Mean Std. Dev. Min Max
-------------------------------------------------------------------
GHG 32317.85 46330.45 349.4967 187062.1
Population 1.75e+07 2.21e+07 352430 8.25e+07
Per capita GDP .0231114 .0160943 .0023458 .0884178
Energy intensity .0404269 .0184087 .0184933 .1024503
PKM 217.8131 299.0942 4.4 1103.53
TKM 89.34148 119.752 .83 637.31
% Road .8256987 .0758432 .5255048 .9733585
% Rail .0307442 .0279337 0 .164859
% Aviation .1163119 .0862229 0 .4750266
% Navigation .0152930 .0210313 0 .1459083
% Pipelines .0076593 .0286657 0 .2717684
% Oil products .9738079 .022704 .8863409 1
% Electricity .0174560 .0164623 0 .0996536
% Renewable energies .0085311 .0151462 0 .0851297
% Coal .0002043 .0013428 0 .0236173
-------------------------------------------------------------------
7
METHODOLOGY
The STIRPAT model for transport sector
With the aim of identifying the driving factors of greenhouse gas emissions in the EU-28
transport sector and quantifying its impacts on them, an extended version of the STIRPAT model
is used.
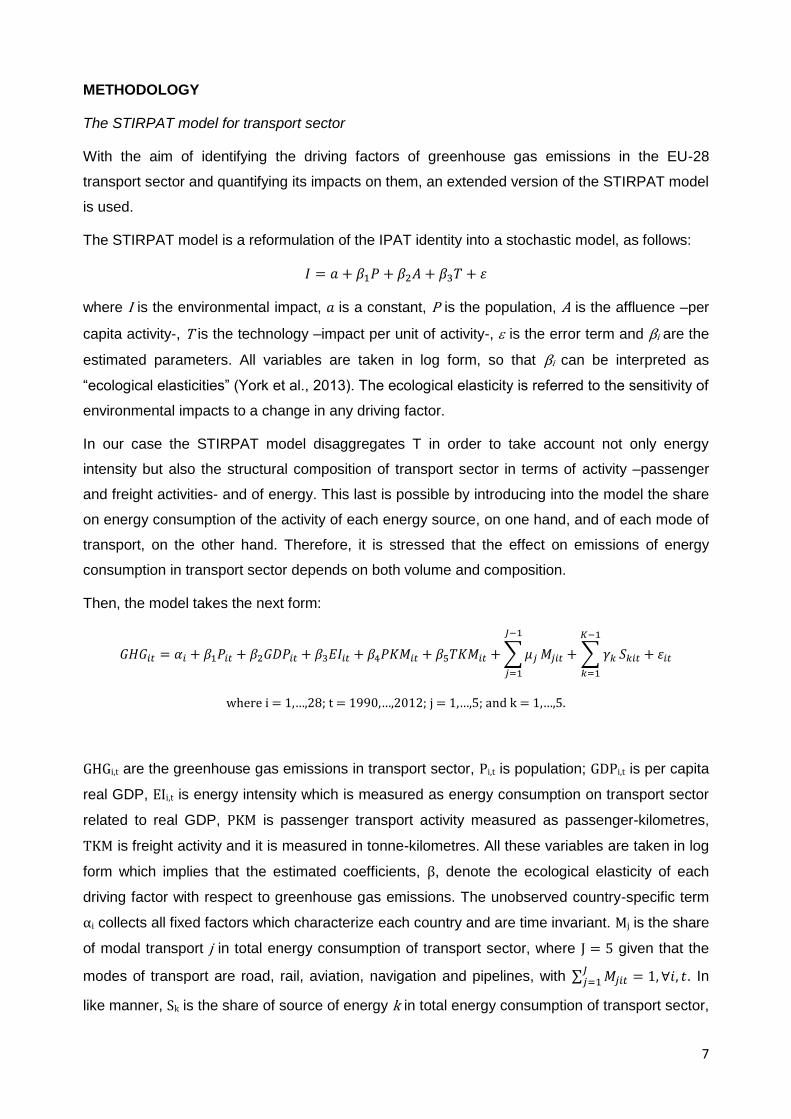
The STIRPAT model is a reformulation of the IPAT identity into a stochastic model, as follows:
where I is the environmental impact, is a constant, P is the population, A is the affluence –per
capita activity-, T is the technology –impact per unit of activity-, is the error term and βi are the
estimated parameters. All variables are taken in log form, so that βi can be interpreted as
“ecological elasticities” (York et al., 2013). The ecological elasticity is referred to the sensitivity of
environmental impacts to a change in any driving factor.
In our case the STIRPAT model disaggregates T in order to take account not only energy
intensity but also the structural composition of transport sector in terms of activity –passenger
and freight activities- and of energy. This last is possible by introducing into the model the share
on energy consumption of the activity of each energy source, on one hand, and of each mode of
transport, on the other hand. Therefore, it is stressed that the effect on emissions of energy
consumption in transport sector depends on both volume and composition.
Then, the model takes the next form:
where i 1,…,28; t 1990,…,2012; j 1,…,5; and k 1,…,5.
GHGi,t are the greenhouse gas emissions in transport sector, Pi,t is population; GDPi,t is per capita
real GDP, EIi,t is energy intensity which is measured as energy consumption on transport sector
related to real GDP, PKM is passenger transport activity measured as passenger-kilometres,
TKM is freight activity and it is measured in tonne-kilometres. All these variables are taken in log
form which implies that the estimated coefficients, β, denote the ecological elasticity of each
driving factor with respect to greenhouse gas emissions. The unobserved country-specific term
αi collects all fixed factors which characterize each country and are time invariant. Mj is the share
of modal transport j in total energy consumption of transport sector, where J = 5 given that the
modes of transport are road, rail, aviation, navigation and pipelines, with 1, , . In
like manner, Sk is the share of source of energy k in total energy consumption of transport sector,
8
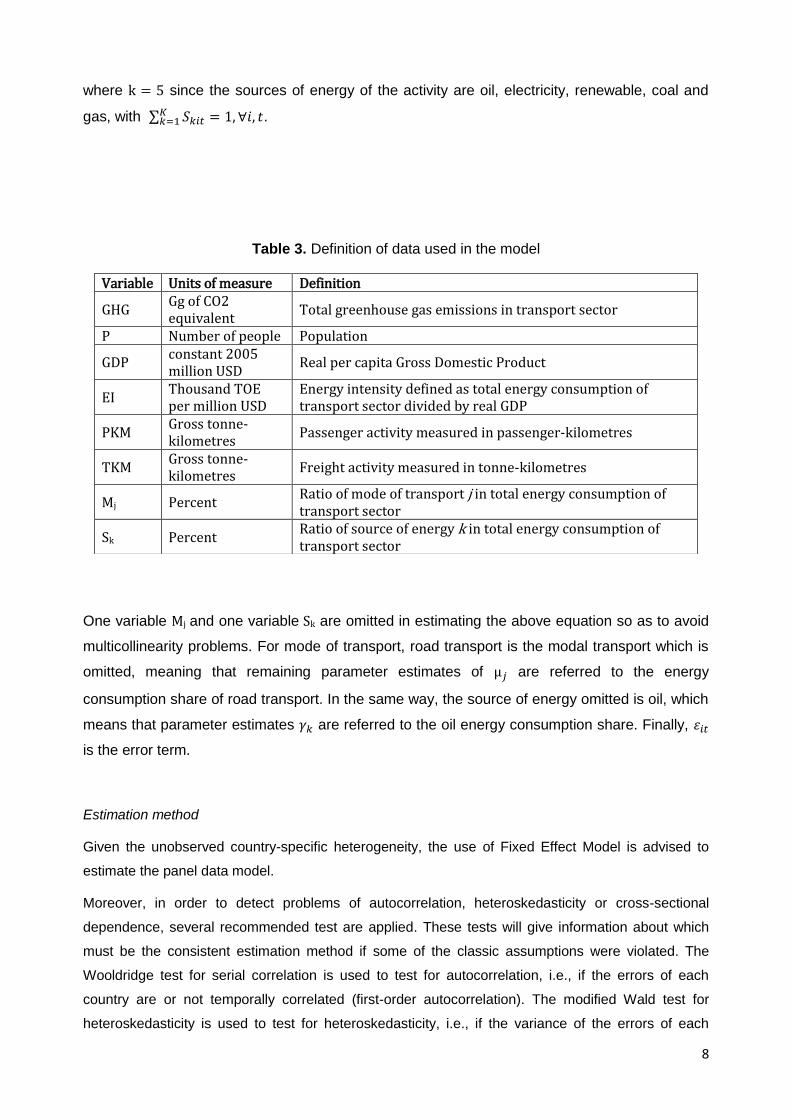
where k = 5 since the sources of energy of the activity are oil, electricity, renewable, coal and
gas, with 1, , .
Table 3. Definition of data used in the model
One variable Mj and one variable Sk are omitted in estimating the above equation so as to avoid
multicollinearity problems. For mode of transport, road transport is the modal transport which is
omitted, meaning that remaining parameter estimates of are referred to the energy
consumption share of road transport. In the same way, the source of energy omitted is oil, which
means that parameter estimates are referred to the oil energy consumption share. Finally,
is the error term.
Estimation method
Given the unobserved country-specific heterogeneity, the use of Fixed Effect Model is advised to
estimate the panel data model.
Moreover, in order to detect problems of autocorrelation, heteroskedasticity or cross-sectional
dependence, several recommended test are applied. These tests will give information about which
must be the consistent estimation method if some of the classic assumptions were violated. The
Wooldridge test for serial correlation is used to test for autocorrelation, i.e., if the errors of each
country are or not temporally correlated (first-order autocorrelation). The modified Wald test for
heteroskedasticity is used to test for heteroskedasticity, i.e., if the variance of the errors of each
Variable Units of measure Definition
GHG Gg of CO2 equivalent
Total greenhouse gas emissions in transport sector
P Number of people Population
GDP constant 2005 million USD
Real per capita Gross Domestic Product
EI Thousand TOE per million USD
Energy intensity defined as total energy consumption of transport sector divided by real GDP
PKM Gross tonne-kilometres
Passenger activity measured in passenger-kilometres
TKM Gross tonne-kilometres
Freight activity measured in tonne-kilometres
Mj Percent Ratio of mode of transport j in total energy consumption of transport sector
Sk Percent Ratio of source of energy k in total energy consumption of transport sector
9
country is or not constant. And the Pesaran CD test is used to test for contemporaneous correlation,
i.e., if the residuals are or not correlated across countries.
In order to solve the detected problems and due to the characteristics of our panel data, where N
> T, the Panel Corrected Standard Errors Model (PCSE) is used to estimate the above equation.
The PCSE model can be applied to models with problems of heteroskedasticity and/or
contemporaneous correlation, with or not autocorrelation.
The analysis is performed considering the EU-28 as a whole and differentiating by regions. The
regions, which are the EU-15 and the EU-East, have been defined considering its economic
development level and its geographic position. These groupings allows to enrich the analysis.
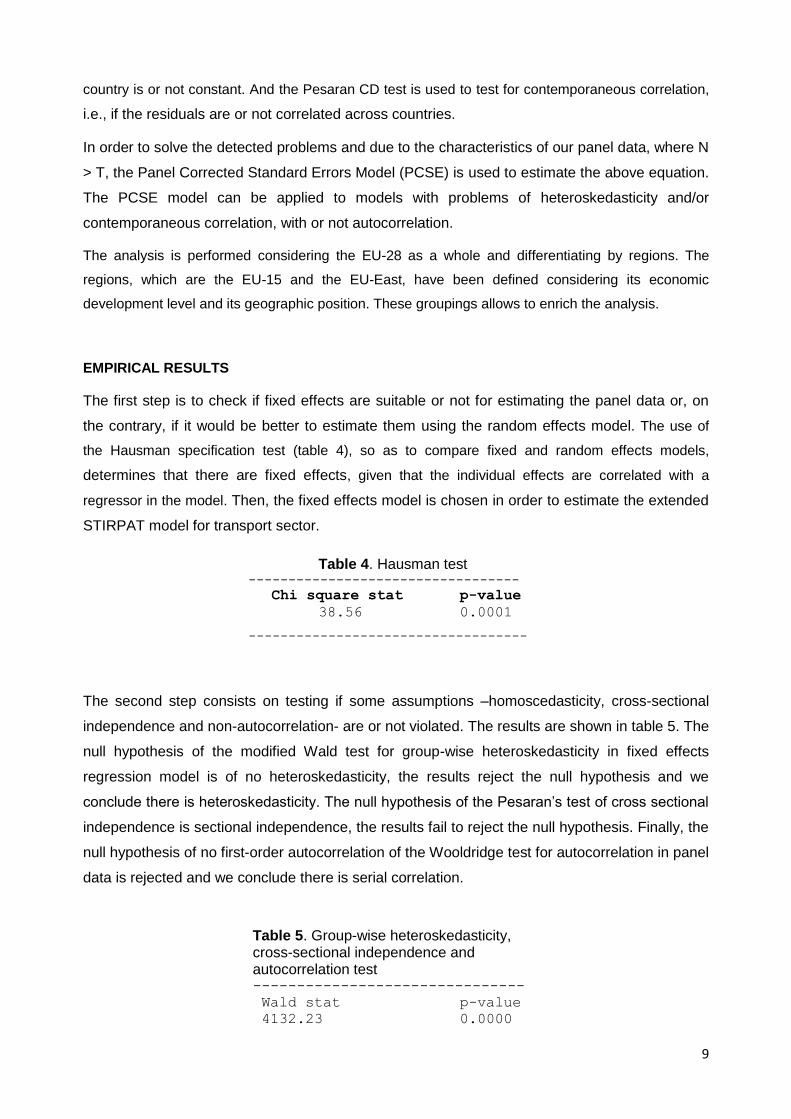
EMPIRICAL RESULTS
The first step is to check if fixed effects are suitable or not for estimating the panel data or, on
the contrary, if it would be better to estimate them using the random effects model. The use of
the Hausman specification test (table 4), so as to compare fixed and random effects models,
determines that there are fixed effects, given that the individual effects are correlated with a
regressor in the model. Then, the fixed effects model is chosen in order to estimate the extended
STIRPAT model for transport sector.
Table 4. Hausman test ----------------------------------
Chi square stat p-value
38.56 0.0001
-----------------------------------
The second step consists on testing if some assumptions –homoscedasticity, cross-sectional
independence and non-autocorrelation- are or not violated. The results are shown in table 5. The
null hypothesis of the modified Wald test for group-wise heteroskedasticity in fixed effects
regression model is of no heteroskedasticity, the results reject the null hypothesis and we
conclude there is heteroskedasticity. The null hypothesis of the Pesaran’s test of cross sectional
independence is sectional independence, the results fail to reject the null hypothesis. Finally, the
null hypothesis of no first-order autocorrelation of the Wooldridge test for autocorrelation in panel
data is rejected and we conclude there is serial correlation.
Table 5. Group-wise heteroskedasticity, cross-sectional independence and autocorrelation test -------------------------------
Wald stat p-value
4132.23 0.0000
10
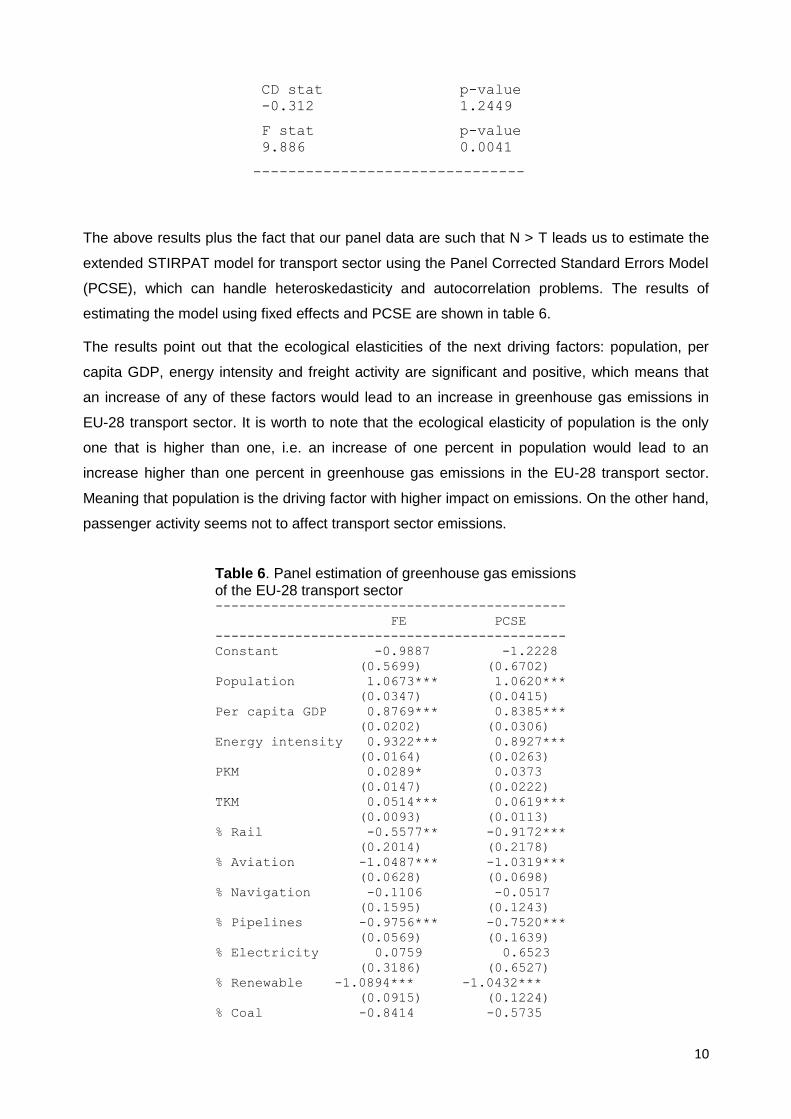
CD stat p-value
-0.312 1.2449
F stat p-value
9.886 0.0041
-------------------------------
The above results plus the fact that our panel data are such that N > T leads us to estimate the
extended STIRPAT model for transport sector using the Panel Corrected Standard Errors Model
(PCSE), which can handle heteroskedasticity and autocorrelation problems. The results of
estimating the model using fixed effects and PCSE are shown in table 6.
The results point out that the ecological elasticities of the next driving factors: population, per
capita GDP, energy intensity and freight activity are significant and positive, which means that
an increase of any of these factors would lead to an increase in greenhouse gas emissions in
EU-28 transport sector. It is worth to note that the ecological elasticity of population is the only
one that is higher than one, i.e. an increase of one percent in population would lead to an
increase higher than one percent in greenhouse gas emissions in the EU-28 transport sector.
Meaning that population is the driving factor with higher impact on emissions. On the other hand,
passenger activity seems not to affect transport sector emissions.
Table 6. Panel estimation of greenhouse gas emissions of the EU-28 transport sector --------------------------------------------
FE PCSE
--------------------------------------------
Constant -0.9887 -1.2228
(0.5699) (0.6702)
Population 1.0673*** 1.0620***
(0.0347) (0.0415)
Per capita GDP 0.8769*** 0.8385***
(0.0202) (0.0306)
Energy intensity 0.9322*** 0.8927***
(0.0164) (0.0263)
PKM 0.0289* 0.0373
(0.0147) (0.0222)
TKM 0.0514*** 0.0619***
(0.0093) (0.0113)
% Rail -0.5577** -0.9172***
(0.2014) (0.2178)
% Aviation -1.0487*** -1.0319***
(0.0628) (0.0698)
% Navigation -0.1106 -0.0517
(0.1595) (0.1243)
% Pipelines -0.9756*** -0.7520***
(0.0569) (0.1639)
% Electricity 0.0759 0.6523
(0.3186) (0.6527)
% Renewable -1.0894*** -1.0432***
(0.0915) (0.1224)
% Coal -0.8414 -0.5735
11
(0.9069) (0.8810)
Fixed effects Yes Yes
Year No No
R2 0.9801 0.9997 N 523 523
Groups 27 27
--------------------------------------------
Note: Standard errors in parentheses
* p<0.05, ** p<0.01, *** p<0.001
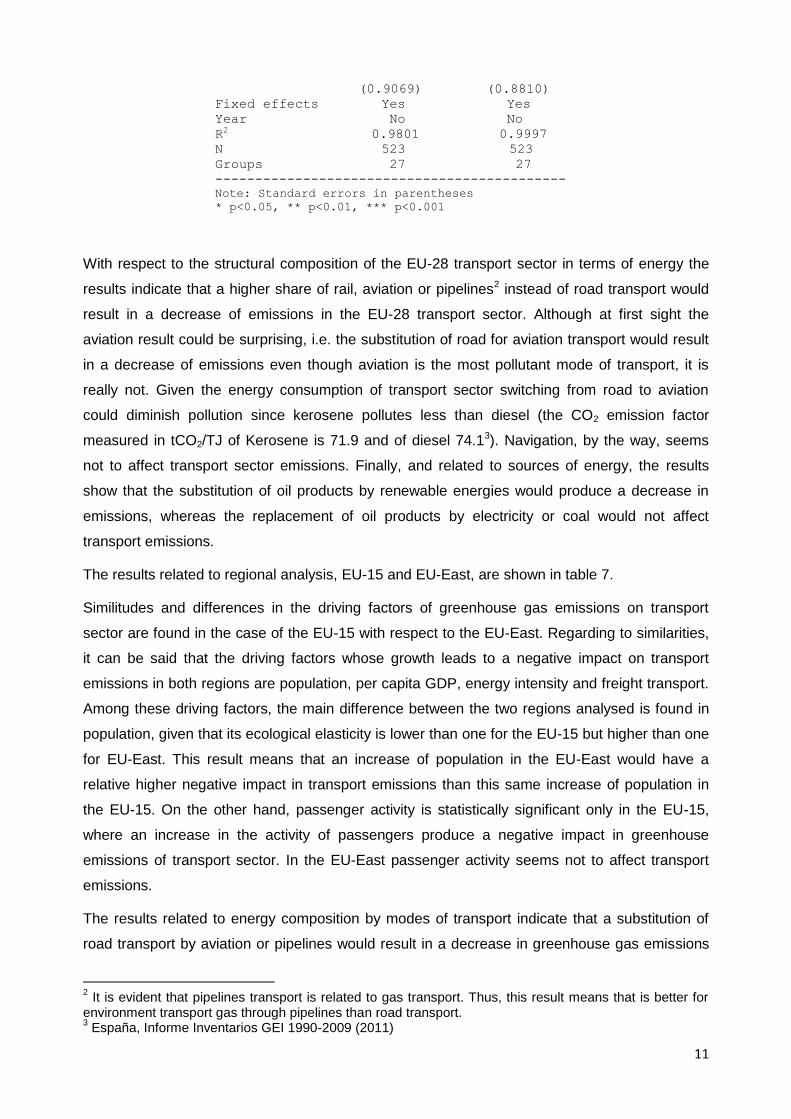
With respect to the structural composition of the EU-28 transport sector in terms of energy the
results indicate that a higher share of rail, aviation or pipelines2 instead of road transport would
result in a decrease of emissions in the EU-28 transport sector. Although at first sight the
aviation result could be surprising, i.e. the substitution of road for aviation transport would result
in a decrease of emissions even though aviation is the most pollutant mode of transport, it is
really not. Given the energy consumption of transport sector switching from road to aviation
could diminish pollution since kerosene pollutes less than diesel (the CO2 emission factor
measured in tCO2/TJ of Kerosene is 71.9 and of diesel 74.13). Navigation, by the way, seems
not to affect transport sector emissions. Finally, and related to sources of energy, the results
show that the substitution of oil products by renewable energies would produce a decrease in
emissions, whereas the replacement of oil products by electricity or coal would not affect
transport emissions.
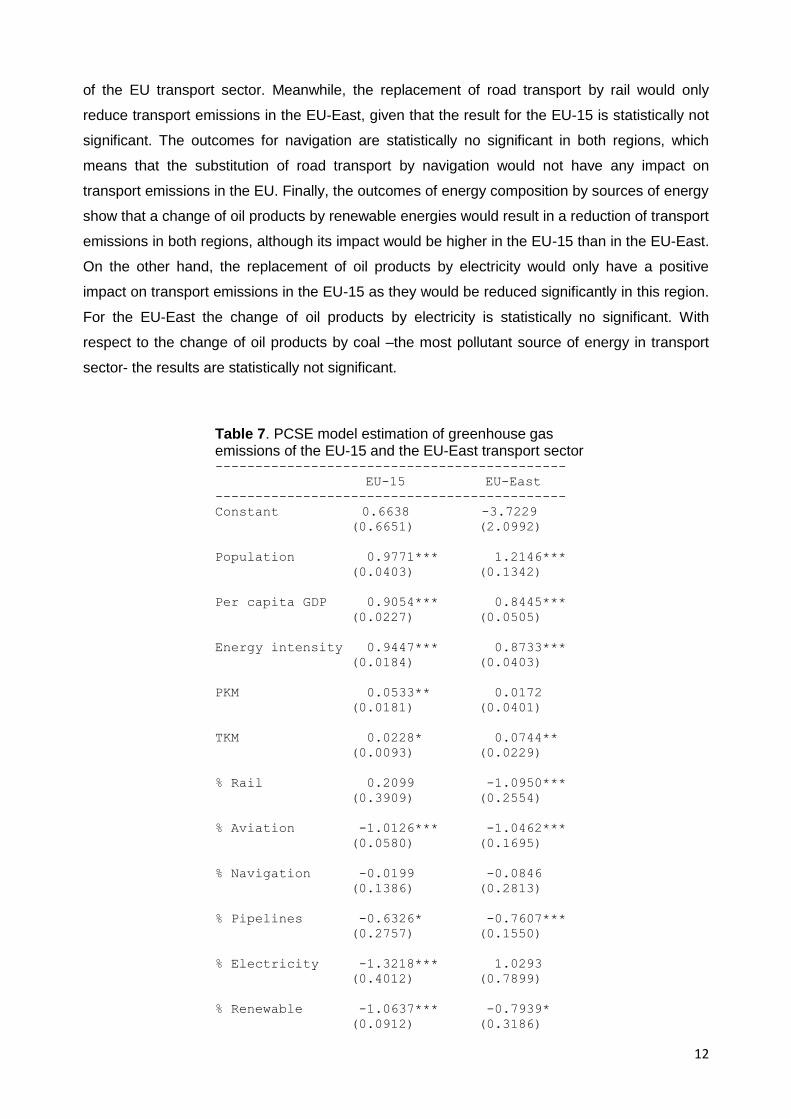
The results related to regional analysis, EU-15 and EU-East, are shown in table 7.
Similitudes and differences in the driving factors of greenhouse gas emissions on transport
sector are found in the case of the EU-15 with respect to the EU-East. Regarding to similarities,
it can be said that the driving factors whose growth leads to a negative impact on transport
emissions in both regions are population, per capita GDP, energy intensity and freight transport.
Among these driving factors, the main difference between the two regions analysed is found in
population, given that its ecological elasticity is lower than one for the EU-15 but higher than one
for EU-East. This result means that an increase of population in the EU-East would have a
relative higher negative impact in transport emissions than this same increase of population in
the EU-15. On the other hand, passenger activity is statistically significant only in the EU-15,
where an increase in the activity of passengers produce a negative impact in greenhouse
emissions of transport sector. In the EU-East passenger activity seems not to affect transport
emissions.
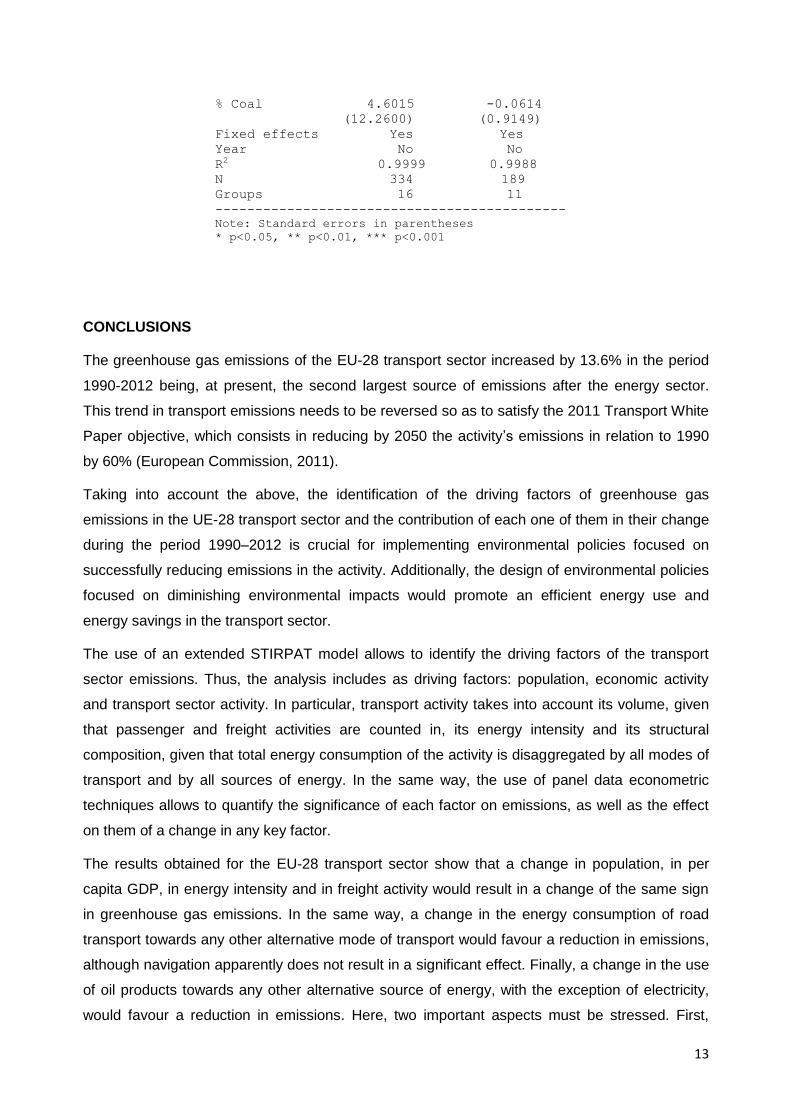
The results related to energy composition by modes of transport indicate that a substitution of
road transport by aviation or pipelines would result in a decrease in greenhouse gas emissions
2 It is evident that pipelines transport is related to gas transport. Thus, this result means that is better for
environment transport gas through pipelines than road transport. 3 España, Informe Inventarios GEI 1990-2009 (2011)
12
of the EU transport sector. Meanwhile, the replacement of road transport by rail would only
reduce transport emissions in the EU-East, given that the result for the EU-15 is statistically not
significant. The outcomes for navigation are statistically no significant in both regions, which
means that the substitution of road transport by navigation would not have any impact on
transport emissions in the EU. Finally, the outcomes of energy composition by sources of energy
show that a change of oil products by renewable energies would result in a reduction of transport
emissions in both regions, although its impact would be higher in the EU-15 than in the EU-East.
On the other hand, the replacement of oil products by electricity would only have a positive
impact on transport emissions in the EU-15 as they would be reduced significantly in this region.
For the EU-East the change of oil products by electricity is statistically no significant. With
respect to the change of oil products by coal –the most pollutant source of energy in transport
sector- the results are statistically not significant.
Table 7. PCSE model estimation of greenhouse gas emissions of the EU-15 and the EU-East transport sector --------------------------------------------
EU-15 EU-East
--------------------------------------------
Constant 0.6638 -3.7229 (0.6651) (2.0992)
Population 0.9771*** 1.2146***
(0.0403) (0.1342)
Per capita GDP 0.9054*** 0.8445***
(0.0227) (0.0505)
Energy intensity 0.9447*** 0.8733***
(0.0184) (0.0403)
PKM 0.0533** 0.0172
(0.0181) (0.0401)
TKM 0.0228* 0.0744**
(0.0093) (0.0229)
% Rail 0.2099 -1.0950***
(0.3909) (0.2554)
% Aviation -1.0126*** -1.0462***
(0.0580) (0.1695)
% Navigation -0.0199 -0.0846
(0.1386) (0.2813)
% Pipelines -0.6326* -0.7607***
(0.2757) (0.1550)
% Electricity -1.3218*** 1.0293
(0.4012) (0.7899)
% Renewable -1.0637*** -0.7939*
(0.0912) (0.3186)
13
% Coal 4.6015 -0.0614
(12.2600) (0.9149)
Fixed effects Yes Yes
Year No No
R2 0.9999 0.9988 N 334 189
Groups 16 11
--------------------------------------------
Note: Standard errors in parentheses
* p<0.05, ** p<0.01, *** p<0.001
CONCLUSIONS
The greenhouse gas emissions of the EU-28 transport sector increased by 13.6% in the period
1990-2012 being, at present, the second largest source of emissions after the energy sector.
This trend in transport emissions needs to be reversed so as to satisfy the 2011 Transport White
Paper objective, which consists in reducing by 2050 the activity’s emissions in relation to 1990
by 60% (European Commission, 2011).
Taking into account the above, the identification of the driving factors of greenhouse gas
emissions in the UE-28 transport sector and the contribution of each one of them in their change
during the period 1990–2012 is crucial for implementing environmental policies focused on
successfully reducing emissions in the activity. Additionally, the design of environmental policies
focused on diminishing environmental impacts would promote an efficient energy use and
energy savings in the transport sector.
The use of an extended STIRPAT model allows to identify the driving factors of the transport
sector emissions. Thus, the analysis includes as driving factors: population, economic activity
and transport sector activity. In particular, transport activity takes into account its volume, given
that passenger and freight activities are counted in, its energy intensity and its structural
composition, given that total energy consumption of the activity is disaggregated by all modes of
transport and by all sources of energy. In the same way, the use of panel data econometric
techniques allows to quantify the significance of each factor on emissions, as well as the effect
on them of a change in any key factor.
The results obtained for the EU-28 transport sector show that a change in population, in per
capita GDP, in energy intensity and in freight activity would result in a change of the same sign
in greenhouse gas emissions. In the same way, a change in the energy consumption of road
transport towards any other alternative mode of transport would favour a reduction in emissions,
although navigation apparently does not result in a significant effect. Finally, a change in the use
of oil products towards any other alternative source of energy, with the exception of electricity,
would favour a reduction in emissions. Here, two important aspects must be stressed. First,
14
although the substitution of oil products by electricity does not have the expected result, it is
worth to note that it is not statistically significant. Second, the replacement of oil products by coal
–the most pollutant source of energy in transport sector- it is not statistically significant either.
The results by regions show that a change in population, per capita GDP, energy intensity and
freight activity would produce a change of the same sign in greenhouse gas emissions
independently of the region analysed. Likewise, the substitution of road transport by aviation
and/or pipelines would lead to a decrease in emissions independently of the region investigated.
It is important to emphasise that the surprising result related to aviation- the most pollutant mode
of transport- it is not, because, given the energy consumption of transport sector switching from
road to aviation could diminish pollution since kerosene pollutes less than diesel. Finally, the
replacement of oil products by renewable energies would mean a reduction of transport
emissions independently of the region studied.
The factors showing different results in greenhouse gas emissions depending on region are
related to passenger activity and shares of rail and electricity in total energy consumption on
transport sector. Passenger activity is a driving factor but only in the EU-15, so that a change in
the activity would produce a change of the same sign on transport emissions. In the same way,
the replacement of oil products by electricity would reduce transport emissions but only in the
EU-15 region. And, finally, the substitution of road transport by rail would result in a decrease of
transport emissions but only in the UE-East region.
The results obtained in this research can give information about the measures suggested in the
2011 Transport White Paper in order to achieve the objective of reducing the emissions of the
transport activity. These measures consist on an increasing use of rail or waterbone at expense
of road in medium distance intercity journeys, the use of sustainable low carbon fuels in aviation
and the elimination of traditional fuel cars in cities (European Commission, 2011). Given the
results obtained in this research it is expected that an increase in the use of rail at the expense
of road transport will contribute to a reduction in the environmental pollution. In the same way, it
is expected that an increase in the use of low carbon fuels in aviation and the reduction of
traditional fuel cars will produce a positive impact in the environment. However, it seems that the
impact on environment of an increase in the use of navigation at the expense of road transport
apparently will not result in a significant effect.
REFERENCES
Andreoni, V. and Galmarini, S. (2012) European CO2 emissions trends: A decomposition
analysis for water and aviation transport sectors. Energy, 45, 1, pp. 595-602.
15
Dietz, T. and Rosa, E.A. (1997) Effects on population and affluence on CO2 emissions. PNAS,
Proceedings of the National Academy of Sciences, vol.94, 1, pp. 175-179
Ehlrich, P. and Holdren, J. (1971) Impact of population growth. Science, 171, pp. 1212–1217
Ehlrich, P. and Holdren, J. (1972) A bulletin dialogue on the ‘Closing Circle’. Critique: one
dimensional ecology. Bull. At. Sci., 28 (5) (1972), pp. 16–27
European Commission (2011) WHITE PAPER Roadmap to a Single European Transport
Area – Towards a competitive and resource efficient transport System /*
COM/2011/0144 final */
http://ec.europa.eu/transport/themes/strategies/2011_white_paper_en.htm
European Commission. Eurostat (2014) Luxemburg: Office for Official Publications of the
European Communities. Retrieved: June 25, 2014 < http://epp.eurostat.ec.europa.eu >
Fan, F. and Lei, Y. (2016) Decomposition analysis of energy-related carbon emissions from the
transportation sector in Beijing. Transportation Research Part D: Transport and Environment,
vol. 42, pp. 135-145
Grazi, F. and van den Bergh, J. C.J. M. (2008) “Spatial organization, transport, and climate
change: Comparing instruments of spatial planning and policy”. Ecological Economics, vol.
67, issue 4, pp.630-639
Lakshmanan, T.R. and Han, X. (1997) Factors underlying transportation CO2 emissions in the
USA: a decomposition analysis. Transportation Research Part D, vol. 2, 1, pp1-15
Ratanavaraha, V. and Jomnonkwao, S. (2015) Trends in Thailand CO2 emissions in the
transportation sector and Policy Mitigation. Transport Policy, vol. 41, pp. 136-146
Saboori, B., Sapri, M. and bin Baba M. (2014) Economic growth, energy consumption and CO2
emissions in OECD’s transport sector: A fully modified bi-directional relationship approach.
Energy, vol. 66, pp.150-161
School, L., Schipper, L.J. and Kiang, N. (1996) CO2 emissions from passenger transport: A
comparison of international trends from 1973 to 1992. Energy Policy, vol. 24, 1, pp. 17-30
Sobrino, N. and Monzon, A. (2014) The impact of the economic crisis and policy actions on GHG
emissions from road transport in Spain. Energy Policy, vol. 74, pp. 486-498.
Steenhoff, P., Woudsma, C. and Sparling, E. (2006) Greenhouse gas emissions and the surface
transport of freight in Canada. Transportation Research Part D, vol. 11, pp. 369-376
16
Timilsina, G.R. and Shrestha, A. (2009) Transport sector CO2 emissions growth in Asia:
Underlying factors and policy options. Energy Policy, vol. 37, pp. 4523-4539
Xu, B. and Lin, B. (2015) Carbon dioxide emissions reduction in China’s transport sector: A
dynamic VAR (vector autoregression) approach. Energy, vol. 83, pp. 486-495
York, R., Rosa, E.A. and Dietz, T. (2003) STIRPAT, IPAT and ImPACT: analytic tools for
unpacking the driving forces of environmental impacts. Ecological Economics, vol. 46, pp
351-365
Zhang, C. and Nian, J. (2013) Panel estimation for transport CO2 emissions and its affecting
factors: A regional analysis in China. Energy Policy, vol. 63, pp. 918-926


![· Cuadernos anallsi§ ic del]enguaj Rudolf Carnap Universidad Nacional Autónoma de México Instituto de Investigaciones Filosóficas Programa de Maestría y Doctorado](https://img.pdfslide.us/doc/110x75/5babf7cf09d3f2f4158c9f32/-cuadernos-anallsi-ic-delenguaj-rudolf-carnap-universidad-nacional-autonoma.jpg)