Embed Size (px)
Citation preview

Prognostics of Aircraft Bleed Valves Using
a SVM Classification Algorithm
Renato de Pádua MoreiraCairo L. Nascimento Jr.
Instituto Tecnológico de AeronáuticaInstituto Tecnológico de AeronáuticaSão José dos Campos - BrazilSão José dos Campos - Brazil
2
Summary
Objectives SVM The Method Case Study Implementation Conclusions
3
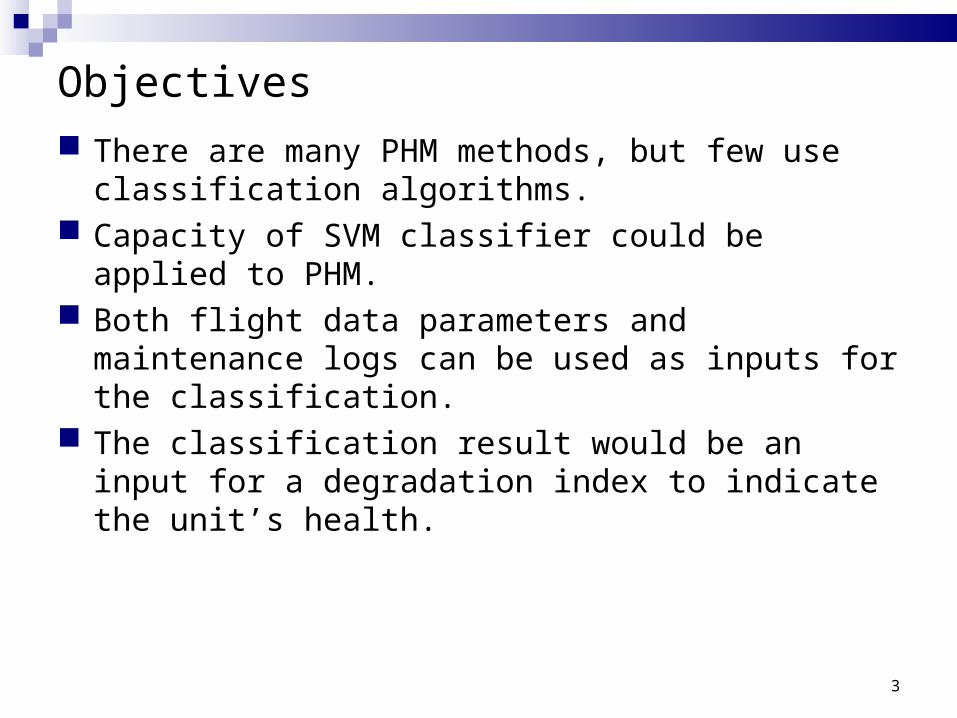
Objectives
There are many PHM methods, but few use classification algorithms.
Capacity of SVM classifier could be applied to PHM. Both flight data parameters and maintenance logs can
be used as inputs for the classification. The classification result would be an input for a
degradation index to indicate the unit’s health.
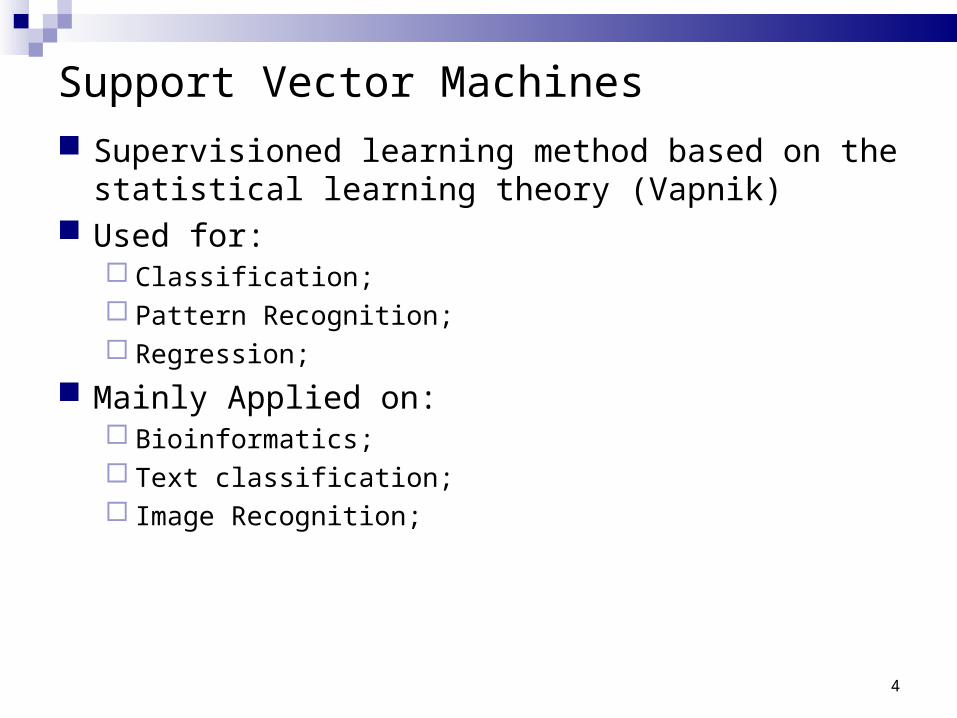
Support Vector Machines
Supervisioned learning method based on the statistical learning theory (Vapnik)
Used for: Classification; Pattern Recognition; Regression;
Mainly Applied on: Bioinformatics; Text classification; Image Recognition;
4
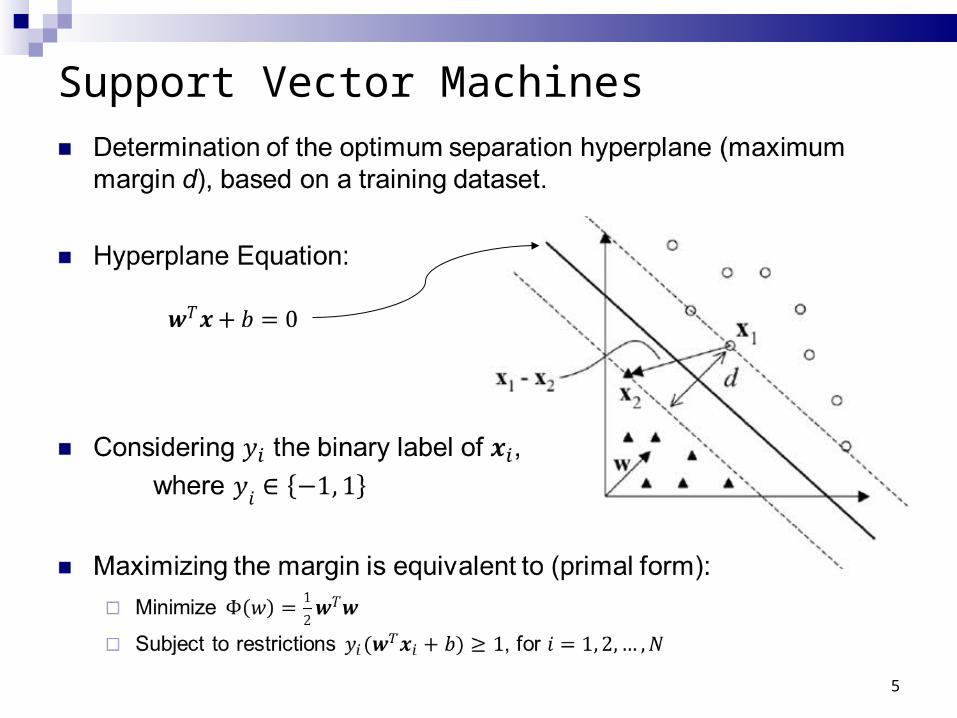
Support Vector Machines
5
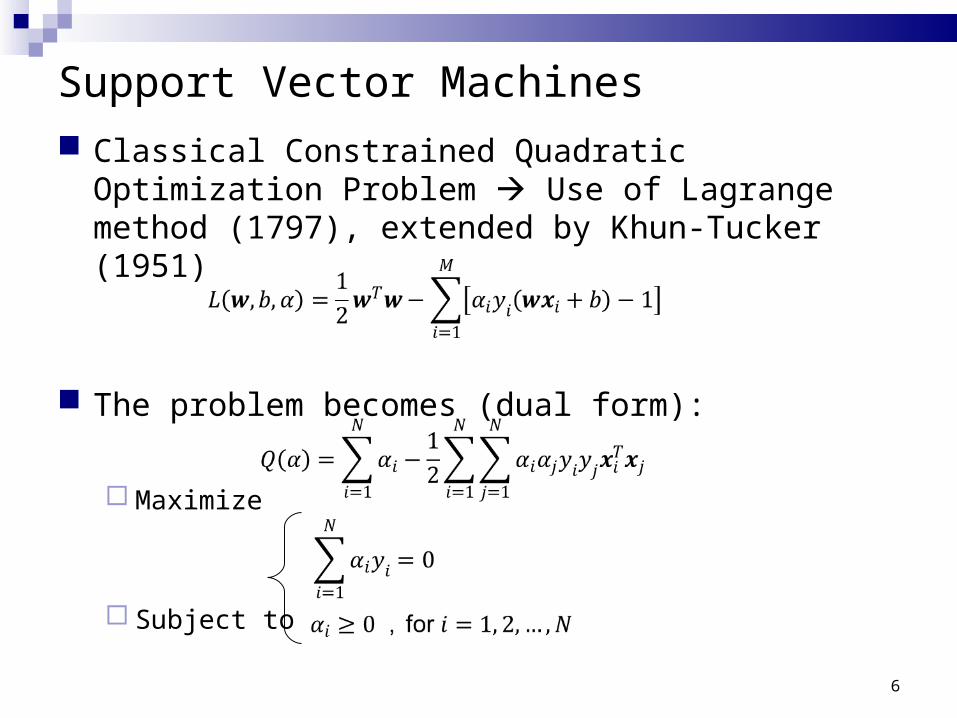
Support Vector Machines
Classical Constrained Quadratic Optimization Problem Use of Lagrange method (1797), extended by Khun-Tucker (1951)
The problem becomes (dual form):
Maximize
Subject to
6

Non-linearly separable universe
Mapping in the Feature Space
Use of Kernel Functions:
Support Vector Machines
7
K(x,xi) = φT(x) φ (xi)
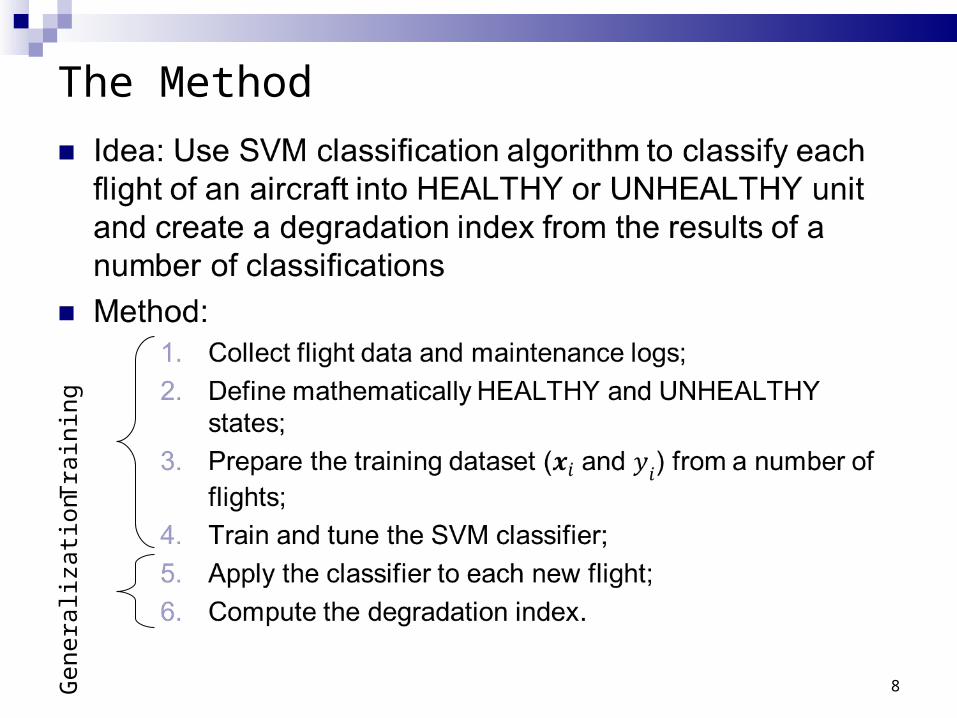
The Method
8
Tra
inin
gG
ener
aliz
atio
n

The Method
1. Training the Classifier 2. Generalizing for new flights
9
Extraction of Characteristics and
date/time for each flight
Extraction of significant maintenance actions
SVM TrainingAnd
Tuning
{(xi,yi)}
Preparation of Training Datasetwith the adopted definition of
HEALTHY and UNHEALTHY
SVM Structure
Flight Data Maintenance Logs
Calculation of Degradation Index
New Maintenance
Logs
SVMClassification
Extraction of Characteristics and date/
time for each flight
gi
di
SVM Structure
NewFlight Data
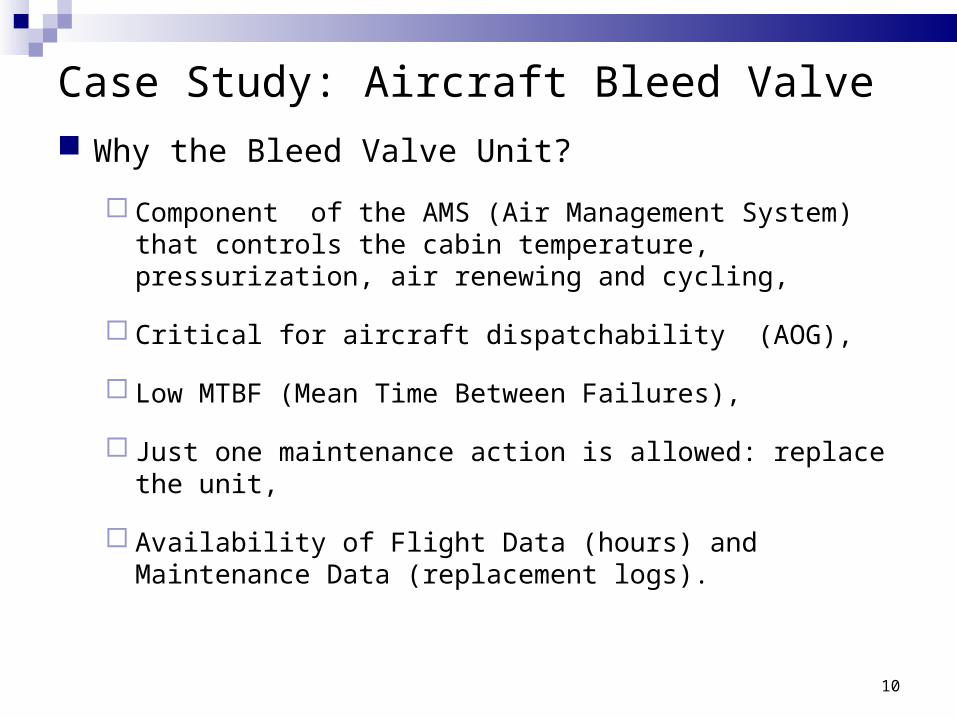
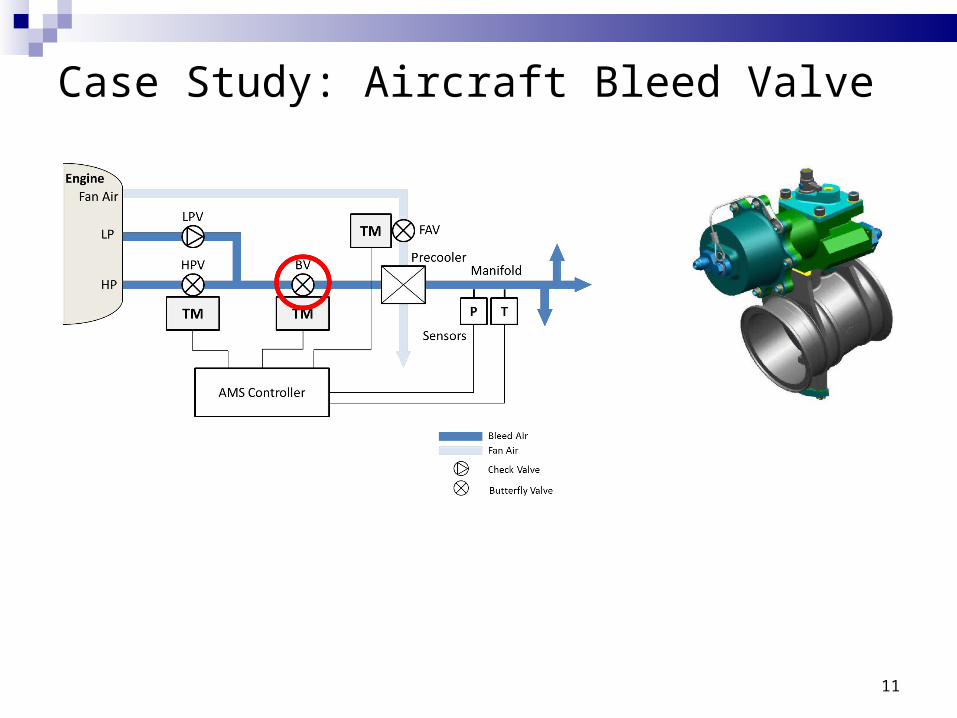
Case Study: Aircraft Bleed Valve
Why the Bleed Valve Unit?
Component of the AMS (Air Management System) that controls the cabin temperature, pressurization, air renewing and cycling,
Critical for aircraft dispatchability (AOG),
Low MTBF (Mean Time Between Failures),
Just one maintenance action is allowed: replace the unit,
Availability of Flight Data (hours) and Maintenance Data (replacement logs).
10
Case Study: Aircraft Bleed Valve
11

Implementation
1. Collection of data: Flight data: Manif. Press., Manif. Temp., N2 (high pressure
compressor speed) Maintenance Logs: Left Bleed Valve Replacements (date/time)
12
0 1000 2000 3000 4000 5000 6000 7000 80000
1
2
3
4x 10
4
Alti
tud
e
0 1000 2000 3000 4000 5000 6000 7000 80000
25
50
75
100
N2
0 1000 2000 3000 4000 5000 6000 7000 80000
20
40
60
80
Ma
nif.
Pre
ssu
re
Flight Time (seconds)0 1000 2000 3000 4000 5000 6000 7000 8000
50
100
150
200
250
Ma
nif.
Te
mp
era
ture
Flight i Windowing the flightAt least 20 minutes of stable cruise
Extraction of 8 CharacteristicsTime Domain: mean, standard
deviation, skewness, kurtosis, median
Freq. Domain: RMS power, peak and power over a 0.002 Hz
No. of inputs = 3 x 8 = 24
Implementation
13
0 0.1 0.2 0.3 0.4 0.5 0.6 0.70
0.05
0.1
0.15
0.2
0.25
0.3
0.35
0.4
0.45
0.5
x1
x2
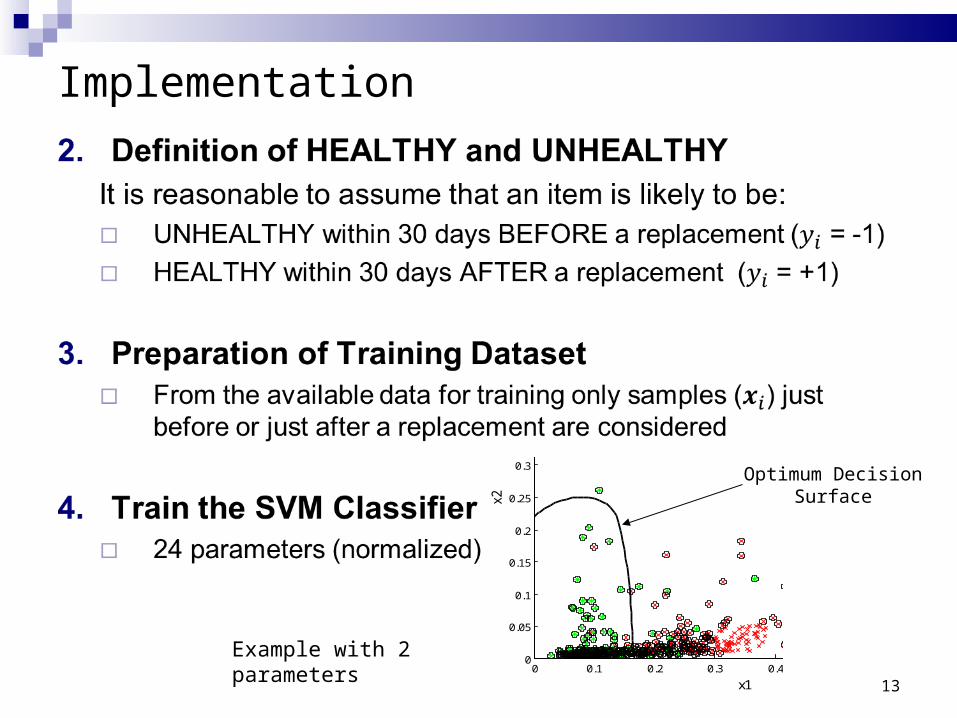
UNHEALTHY
HEALTHYSupport Vectors
Optimum Decision Surface
Example with 2 parameters
Implementation
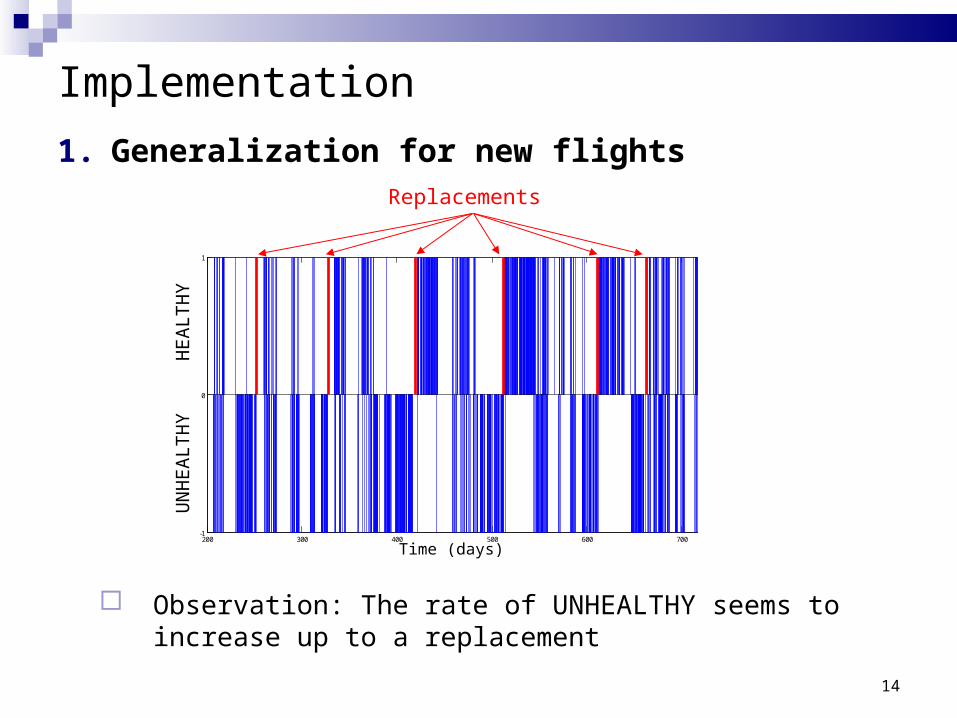
1. Generalization for new flights
Observation: The rate of UNHEALTHY seems to increase up to a replacement
14
200 300 400 500 600 700 800-1
0
1
Cla
ssifi
catio
n
ReplacementsH
EA
LTH
YU
NH
EA
LTH
Y
Time (days)
Implementation
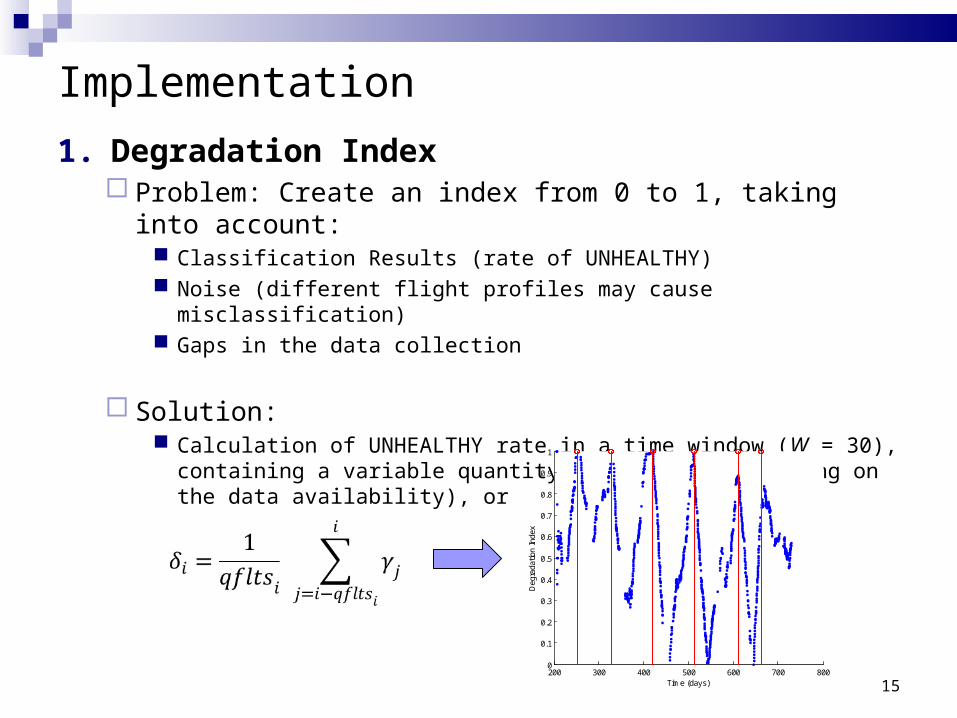
1. Degradation Index Problem: Create an index from 0 to 1, taking into account:
Classification Results (rate of UNHEALTHY) Noise (different flight profiles may cause misclassification) Gaps in the data collection
Solution: Calculation of UNHEALTHY rate in a time window (W = 30), containing a
variable quantity of flights (depending on the data availability), or
15200 300 400 500 600 700 8000
0.1
0.2
0.3
0.4
0.5
0.6
0.7
0.8
0.9
1
Time (days)
Deg
rada
tion
Inde
x
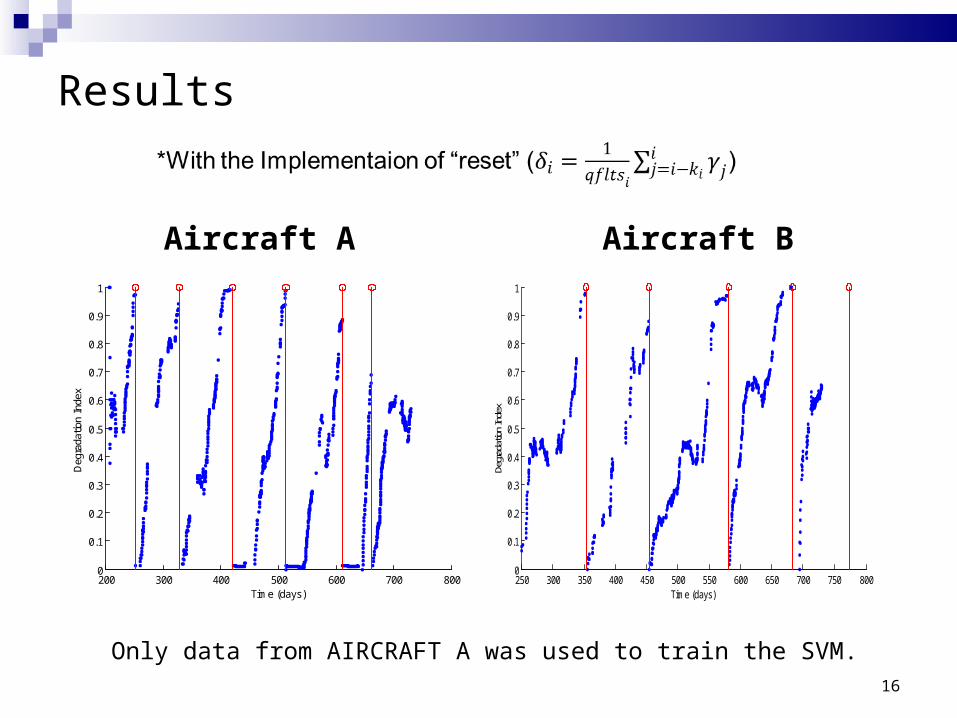
Results
Aircraft A Aircraft B
16
200 300 400 500 600 700 8000
0.1
0.2
0.3
0.4
0.5
0.6
0.7
0.8
0.9
1
Time (days)
Deg
rada
tion
Inde
x
250 300 350 400 450 500 550 600 650 700 750 8000
0.1
0.2
0.3
0.4
0.5
0.6
0.7
0.8
0.9
1
Time (days)
Degr
adat
ion
Inde
x
Only data from AIRCRAFT A was used to train the SVM.
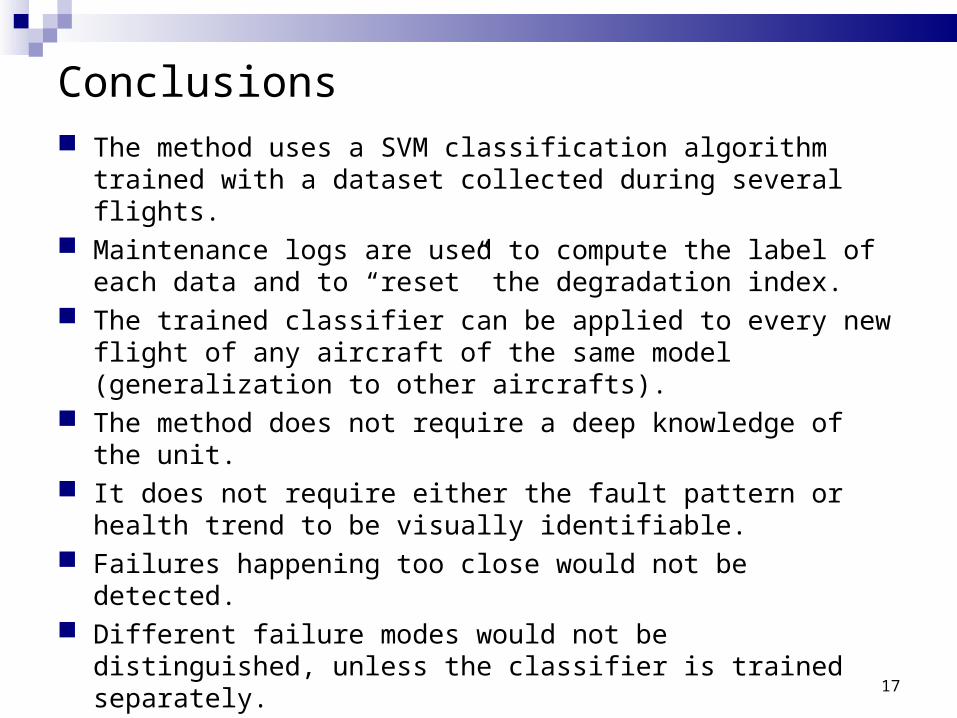
Conclusions The method uses a SVM classification algorithm trained with a
dataset collected during several flights. Maintenance logs are used to compute the label of each data and to
“reset” the degradation index. The trained classifier can be applied to every new flight of any
aircraft of the same model (generalization to other aircrafts). The method does not require a deep knowledge of the unit. It does not require either the fault pattern or health trend to be
visually identifiable. Failures happening too close would not be detected. Different failure modes would not be distinguished, unless the
classifier is trained separately.
17


![NASA Prognostics[1]](https://img.pdfslide.us/doc/110x75/547f2aaab4af9fa5158b5833/nasa-prognostics1.jpg)