Embed Size (px)
Citation preview

Dissertations and Theses
4-2018
Profitability and Financial Performance Indicators in U.S. Airports Profitability and Financial Performance Indicators in U.S. Airports
- A Preliminary Investigation - A Preliminary Investigation
Abbas Shaban
Follow this and additional works at: https://commons.erau.edu/edt
Part of the Management and Operations Commons
Scholarly Commons Citation Scholarly Commons Citation Shaban, Abbas, "Profitability and Financial Performance Indicators in U.S. Airports - A Preliminary Investigation" (2018). Dissertations and Theses. 387. https://commons.erau.edu/edt/387
This Thesis - Open Access is brought to you for free and open access by Scholarly Commons. It has been accepted for inclusion in Dissertations and Theses by an authorized administrator of Scholarly Commons. For more information, please contact [email protected].

Profitability and Financial Performance Indicators in U.S. airports – A Preliminary
Investigation
by
Abbas Shaban
A Thesis Submitted to the College of Business Department of Economics, Finance, and
Information System (EFIS) in Partial Fulfillment of the Requirements for the Degree of
Master of Science in Aviation Finance
Embry-Riddle Aeronautical University
Daytona Beach, Florida
April 2018
iii
ABSTRACT
Profitability and Financial Performance Indicators in U.S. airports – A Preliminary Investigation
A Thesis
Presented to the
Faculty of the College of Business,
Embry-Riddle Aeronautical University
In partial fulfillment of
The requirements for the degree of
Master of Science in Aviation Finance
by
Abbas Shaban
April – 2018
Airport profitability is fundamental for all airports around the world. To this effect, this study
examines factors affecting airport profitability such as the number of passengers, the number of landings
and take-offs, cargo (lbs), airport debt, the size of the airport, and the terminal utilization. Most of the
large and medium hub airports in the U.S are considered in this study, and regression analysis is used to
analyze the data.
The results of this study show that factors examined are statistically significant when measuring
airport profitability, which in turns could suggest that airports with high values in most of these variables
will have higher profitability.

iv
FOREWARD This thesis was written in partial fulfillment of the requirements for the completion of the
Master of Science in Aviation Finance. My motivation was to research the current status of
airports. I firmly believe that I have achieved my personal goals when writing on profitability and
financial performance indicators of U.S. airports.
I would like to thank the following people without whom this thesis would not have been
possible. First, I would like to thank the College of Business at Embry-Riddle Aeronautical
University, for offering me with this opportunity to write this thesis. Second, I would like to thank
Dr. Bert Zarb for his expertise, advice, and endless support throughout this process, which have
helped me to improve my work and be more critical about my thesis. Many thanks to other
professors whose expertise helped me with the thesis.
Finally, I would like to thank the people outside of my university milieu. I would like to
thank my family and friends, for offering support when I needed it. Without all these wonderful
people, I would never have been able to succeed.

v
TABLE OF CONTENTS
ABSTRACT ..................................................................................................................................... iii
FOREWARD ................................................................................................................................... iv
1. INTRODUCTION ........................................................................................................................... 1
1.1 BACKGROUND: ...........................................................................................................1
1.2 RESEARCH SIGNIFICANCE: ......................................................................................1
1.3 RESEARCH OBJECTIVE: ...........................................................................................2
1.4 RESEARCH LAYOUT: .................................................................................................2
2. LITERATURE REVIEW............................................................................................................... 5
2.1 RECENT DEVELOPMENTS IN U.S. AIRPORTS: .......................................................5
2.2 AN OVERVIEW OF AIRPORT PROFITABILITY: .....................................................7
2.3 AIRPORT OPERATING INCOME:..............................................................................9
2.4 AIRPORT’S REVENUE: ...............................................................................................9
2.5 AIRPORTS OPERATING EXPENSES ....................................................................... 11
2.6 AIRCRAFT LANDINGS AND TAKE OFFS: .............................................................. 13
2.7 AIRPORT PASSENGERS: .......................................................................................... 18
2.8 AIRPORT CARGO:..................................................................................................... 21
2.9 AIRPORT DEBT SERVICE RATIO: .......................................................................... 24
2.10 AIRPORT SIZE: .......................................................................................................... 25
2.11 FLIGHT DELAY: ........................................................................................................ 25

vi
3. METHODOLOGY ....................................................................................................................... 28
3.1 DESCRIPTION OF WORK: ........................................................................................ 28
3.2 MODEL: ...................................................................................................................... 28
3.3 VARIABLES AND IDENTIFICATIONS: ................................................................... 29
3.4 SAMPLE SELECTION: .............................................................................................. 30
3.5 DATA COLLECTION: ................................................................................................ 30
4. RESULTS AND DISCUSSION ................................................................................................... 33
4.1 DESCRIPTIVE STATISTICS ...................................................................................... 33
4.2 REGRESSION RESULTS – MODEL SUMMARY...................................................... 34
4.3 REGRESSION RESULTS – ANOVA ................................................................................ 35
4.4 REGRESSION RESULTS – COEFFICIENTS .................................................................. 35
5. CONCLUSION, RECOMMENDATIONS, AND THE LIMITATIONS: ............................... 38
References .............................................................................................................................................. 41
Appendix 1: The data used in this research: ...................................................................................... 45

vii
LIST OF FIGURES
Figure 1:Types of Airports in U.S. ............................................................................................................ 7
Figure 2: Airport Revenues ...................................................................................................................... 11
Figure 3: Operating Revenues &Expenses for U.S. large & Medium Hub Airports. (2001 - 2013). 13
Figure 4:The Average number of L& T for large & medium hub airports.(2009 - 2015) ................ 17
Figure 5: The Average number of Passengers for large & medium hub airports. (2009 - 2015) ..... 20
Figure 6: The Average amount of cargo for large & medium hub airports. (2009 - 2015) ............... 23

viii
LIST OF TABLES
Table 1: A Priori Hypotheses of the Model ............................................................................................ 28
Table 2: Pearson Correlation ................................................................................................................... 31
Table 3: Descriptive Statistics .................................................................................................................. 33
Table 4: Regression Results – Model Summary ..................................................................................... 34
Table 5: Regression Results - ANOVA ................................................................................................... 35
Table 6: Regression Results - Coefficients .............................................................................................. 35
Table 7: A Priori Hypotheses of the Model & Final Results ................................................................. 38

ix
This page was left intentionally blank

Profitability and Financial Performance Indicators in U.S. airports – A Preliminary Investigation Introduction | 1
1. INTRODUCTION
1.1 BACKGROUND:
The commercial air transportation industry has been one of the fastest growing sectors of the
world’s economy. (Milan, 2013). All industries around the globe seek to increase their revenue
with the aim of maximizing profits. In pursuing profitability, airports managers should focus on
improving passengers’ satisfaction. Eboli and Mazzulla (2009) state that an improvement of the
transport infrastructures and services without a doubt leads to economic development. The aviation
industry worldwide has experienced tough times in the aftermath of the global financial crisis. It
is known that airports are continuously seeking to generate more revenue by exploring alternate,
non-traditional forms of income. With progress comes the need for larger and innovative facilities
which can be achieved through an airport’s ability to utilize the available sources of funds to
enhance the airport’s service, obtain capital assets, and extend the life of fixed assets.
Aachievement of revenue efficiency may also be pertinent to warrant the success of the airports
and to support their competitiveness to attract more airlines. Hence, revenue inefficiencies could
also have a strong influence on the financial viability of small airports.
1.2 RESEARCH SIGNIFICANCE:
This study focuses on large and medium hub airports in the United States (U.S.), which
experience significant tourist and business passenger traffic. Air transportation plays a crucial role
in encouraging people to visit the U.S. and is essentail to stimulate the economy . Thus, this will
enhance the economy. According to the Federal Aviation Administration (FAA, 2015), foreign
passengers coming to the U.S. have been increasing dramatically. Therefore, airports need to be
prepared for how to deal with this increasing statistic and how to make the most out of it.
Profitability and Financial Performance Indicators in U.S. airports – A Preliminary Investigation Introduction | 2
1.3 RESEARCH OBJECTIVE:
The objective of this research is to address the factors that affect the profitability of the airports
in United States (U.S.), as well as to investigate the parameters that maximize their revenue and
facilitate airports’ management.
1.4 RESEARCH LAYOUT:
This thesis is organized as follows:
Chapter One - Introduction: a brief description of the importance of this research in
financial and airports' management.
Chapter Two - Literature Review: This chapter provides a complete review of previous
studies conducted in the area of airports management. The results of these previous
investigations will be identified and directly related to this research.
Chapter Three – Research Methodology: a detailed illustration of the theoretical and
statistical approaches adopted in this thesis will be presented in this chapter.
Chapter Four – Results and Discussion: the results obtained from the statistical analyses
will be discussed.
Chapter Five – Conclusions and Recommendations: the main findings derived from this
study will be presented, as well as several recommendations will be suggested for further
research.

Profitability and Financial Performance Indicators in U.S. airports – A Preliminary Investigation Introduction | 3
This page was left intentionally blank
Profitability and Financial Performance Indicators in U.S. airports – A Preliminary Investigation Literature Review | 5
2. LITERATURE REVIEW
2.1 RECENT DEVELOPMENTS IN U.S. AIRPORTS:
The U.S. has the most extensive and well-developed aviation system in the world. It started
building airports in the early 20th century. This was a new revolution; aviation and airports had
grown together into multi-billion dollar industries. Airports do far more than provide a place for
aircraft to land and take off. The first airports were built on grass fields in the middle of farms.
Farms provided significant points for landing areas because farmers had reliable information about
the weather, and it was practical for airplanes to take off and land. The importance of air
transportation became critically significant after the end of World War II. This was especially
important during the rebuilding of Europe where roads and railways were destroyed during that
war.
During the 1920s, the U.S. Post Office established a transcontinental service, which
necessitated the building of airports to service airmail carriers. In 1926, the development of the
first viable passenger aircraft, the Ford Tri-Motor, and significant federal legislation was enacted
in support of commercial aviation. In 1927 Charles A. Lindbergh made his famous non-stop solo
flight across the Atlantic. These accomplishments promoted aviation in America more than any
other single event, and ignited throughout the country a building spree of permanent land facilities
for flights (Eggebeen, 2007).
In those early days, airlines received subsidies to carry mail. They did not want to carry
passengers because if they did so, they would have had to provide additional services, such as
food, bathrooms, and safety measures. Sending mail was much easier because all airlines had to
do was to fly the mail to its destination. After World War II, Congress formalized legislation
considering the first formal continuous federal airport funding programs with the signing of
Profitability and Financial Performance Indicators in U.S. airports – A Preliminary Investigation Literature Review | 6
Federal Airport Act of 1946. The Act formally recognized the public use of airports in the U.S. as
a comprehensive system of airports, administrated by the Civil Aeronautics Administration. (Seth
& Alexander, 2011).
By the 1950s, the U.S. had the most active airport system in the world and airlines began to fly
internationally from Miami International Airport (MIA), Idlewild International Airport, which is
today called, John F. Kennedy International Airport (JFK), and Newark Liberty International
Airport (EWR). In the late 1950s, airports began to build longer runways and taxiways to
accommodate larger aircraft and took steps to reduce noise pollution in the cities in which they
were located. In those days, airports faced lots of problems regarding taxiing large aircraft to the
gates without causing crashes. At that time, the U.S. government began building airports in the
primary states, such as Dallas/Fort Worth International Airport (DFW) in Texas in 1962. The
expansions of airports as the main component of air transport system are influenced by direct
external forces such as globalization, privatization, and deregulation, and indirect external forces
such as socio-economic forces and political actions. (Janic, 2008).
By the 21st century, the U.S. was home to a group of the most important airports in the world
such as Hartsfield-Jackson Atlanta International Airport (ATL), JFK International Airport, O’Hare
International Airport. (ORD), and others. These airports generated billions of dollars and continued
to play a fundamental role in the U.S. economy. According to the Federal Aviation Administration
(FAA, 1992), the economic impact on the local region should represent the economic activities
that would not have occurred in the absence of the airport. Airports are generating two types of
effects for the U.S. economy; they make a direct impact, such as airport employment and local
production of goods and services for use at the airport, and an indirect effect, such as the services
provided by the travel agencies, hotels, restaurants, and others. Young & Wells (2014) state that
Profitability and Financial Performance Indicators in U.S. airports – A Preliminary Investigation Literature Review | 7
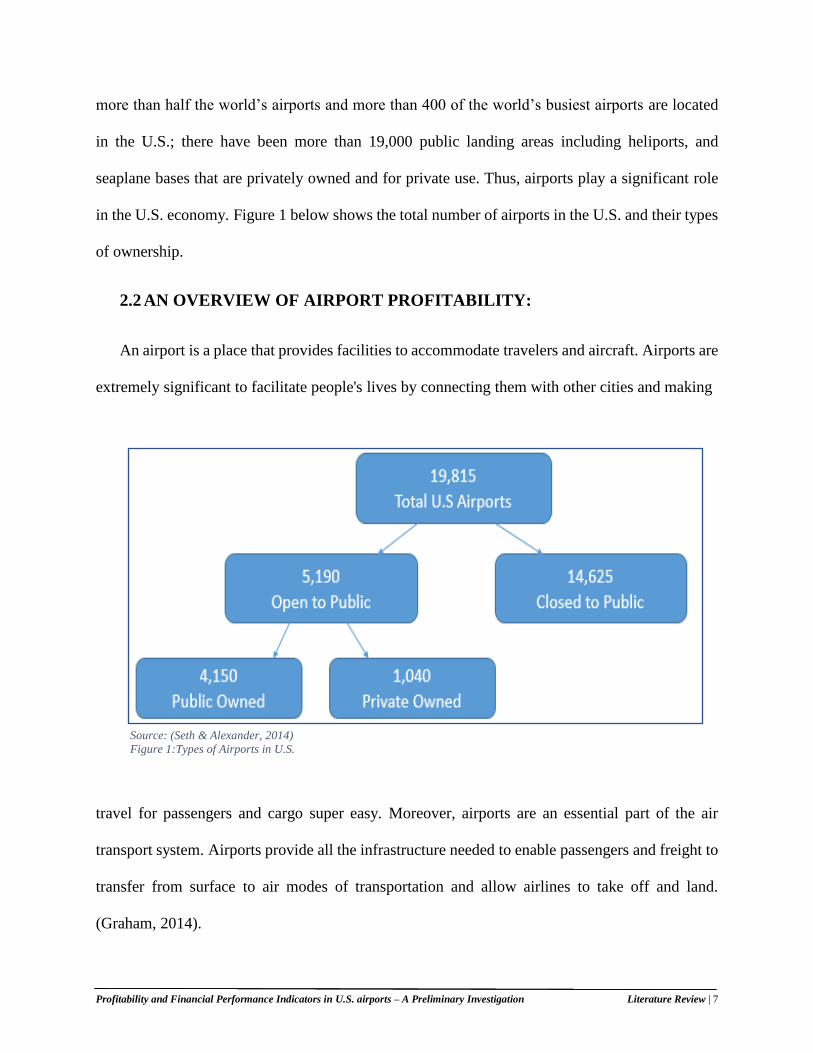
more than half the world’s airports and more than 400 of the world’s busiest airports are located
in the U.S.; there have been more than 19,000 public landing areas including heliports, and
seaplane bases that are privately owned and for private use. Thus, airports play a significant role
in the U.S. economy. Figure 1 below shows the total number of airports in the U.S. and their types
of ownership.
2.2 AN OVERVIEW OF AIRPORT PROFITABILITY:
An airport is a place that provides facilities to accommodate travelers and aircraft. Airports are
extremely significant to facilitate people's lives by connecting them with other cities and making
travel for passengers and cargo super easy. Moreover, airports are an essential part of the air
transport system. Airports provide all the infrastructure needed to enable passengers and freight to
transfer from surface to air modes of transportation and allow airlines to take off and land.
(Graham, 2014).
Source: (Seth & Alexander, 2014)
Figure 1:Types of Airports in U.S.

Profitability and Financial Performance Indicators in U.S. airports – A Preliminary Investigation Literature Review | 8
When aviation was in its infancy, the aviator first constructed the aircraft and then began to
search for a suitable airfield (Kazda & Caves. 2015). Airports are successful, in part, by their
ability to effectively be the location where travelers and cargo travel to and from other airports
(Seth & Alexander, 2011). Airports and airlines are complementary to each other. Passengers and
cargo come to airports to use the facility provided by airlines. Airports offer several services that
facilitate the traveling process for passengers, their luggage, and cargo. In order for any airport to
be profitable, the airport’s management must communicate with airlines in such a way as to attract
them serving their airport. Most commercial airports in the U.S. enter into an agreement that
determines the rights and obligations of airlines. The existence of this cooperative agreement is
thereby crucial not only for airports, especially within a privatization regime that requires them to
be more financially self-sufficient, but also for airlines given the market pressure toward
liberalization and competition (Sarswati, 2014).
There have been several factors affecting airport profitability. Airports’ management should
consider those factors in a significant way to maximize profit and ensure passenger satisfaction.
This thesis will explain the factors affecting airport profitability and how the airport’s management
plays a crucial role in developing strategies and continuously monitoring their performance. For
example, factors that affect profitability could be the number of passengers, the size of the airport,
the number of airlines serving the airport, geographical location of the airport, the amount of the
cargo landed at the airport, debt service ratio, and others. The profitability of an airport can be
measured by its operating income at the end of the fiscal year.

Profitability and Financial Performance Indicators in U.S. airports – A Preliminary Investigation Literature Review | 9
2.3 AIRPORT OPERATING INCOME:
The term “Net Operating Income” is a very common measure in the business world. (Badia et
al. 2007). This metric measures what an enterprise has left over from the provision of its core
business purposes. Net Operating Income is measured by subtracting all operating expenses from
revenues. Net operating income is also known as earnings before interest and tax. (EBIT). Zarb
(2014) states that the operating income is the profit of a company which it recognizes mainly from
its core business operations, and it is calculated as the difference between the revenues of a
company and its operating expenses. Thus, airports, like any other industry in the world, seek profit
and aim to maximize their operating income.
2.4 AIRPORT’S REVENUE:
Airports in the U.S. generate two types of revenue: aeronautical revenue and non-aeronautical
revenue
2.4.1 AERONAUTICAL REVENUE:
This includes the revenue that is directly associated with aviation activity, such as landing fees,
terminals’ and hangers’ rents, and fuel sales and taxes. Airports in the U.S. generate this type of
revenue by agreeing with airlines that wish to serve a particular airport. These airlines use the
facilities provided by the airport, such as the terminal facilities. The amount of money an airline
pays for the airport is determined based on the space the airlines utilize in the terminal. Airlines
utilize those terminal areas for the ticket center, flight information center, and the baggage claim
center. The terminal area provides the facilities, procedures, and processes to efficiently move
passengers and crew on and off commercial and general aviation aircraft. (Young & Wells, 2011).
Airports also generate this type of revenue from aircraft landing fees, which is the amount of
money that an airline must pay to the airport for each aircraft landing; this amount is determined
based on the aircraft weight and exclusive contracts between airlines and the airports. This part of
the revenue will be explained in detail through this thesis. According to Airport Council

Profitability and Financial Performance Indicators in U.S. airports – A Preliminary Investigation Literature Review | 10
International (ACI, 2013-1), the aeronautical side of the airport business is made up of fees paid
for the traditional core airport-related activities, such as the provision of the runways, aircraft
stands, facilitation and security areas and the associated staff to undertake such activities.
2.4.2 NON-AERONAUTICAL REVENUE:
In recent years, non-aeronautical revenue has become more significant for airports. Non-
aeronautical revenue is collected from sources that are entirely different from the sources of the
aeronautical revenue. Today, airports have dramatically increased their dependence on non-
aeronautical revenues, which on average, account for half of all revenues with this share being
highly heterogeneous across regions and airports. (Fasone et al. 2016). Airports are showing more
success at earning income from shopping malls, car parks, boutiques and other similar activities
within the airport premises than from aeronautical revenue. Abeyratne (2001), states that non-
aeronautical revenues, as this income is called, has risen from 30 percent of the total airport
revenue in the late eighties to 52 percent today. A successful non-aeronautical business can allow
airports to generate higher profits, meaning that they will be a more attractive place for investment,
and may result in a better credit rating for the airport that subsequently enables them to achieve a
lower cost of borrowing. (Halpern & Echevarne, 2013). Non-aeronautical revenues critically
determine the financial viability of an airport, as these revenue sources tend to generate higher
profit margins in comparison with aeronautical activities. (ACI, 2013-2). Airports are generating
non-aeronautical revenue from various resources, such as the concessions, which is the amount of
income collected from rents of the restaurants, and gift shops. These rents can be determined as a
percentage of the profit or a fixed amount of money. Most major airports around the world generate
anywhere between 45 percent and 80 percent of their total revenues from the non-aviation services,
a significant part of which is the revenue from “concession services.” (Xiaowen & Anming, 2010).
Furthermore, the other source of non-aeronautical revenue is the income collected from airport

Profitability and Financial Performance Indicators in U.S. airports – A Preliminary Investigation Literature Review | 11
parking lots; the car rental operation; land rent, which is the rent received from hotels and other
uses; and advertising, which is placed on the walls and buses in the airports. Airports can also
create revenue from non-operating sources, such as the grants that federal and state governments
provide for the airport’s capital infrastructure, and the investment in some types of bonds. (ACI,
2013-2). Figure 2 below states the types of airport revenues.
2.5 AIRPORTS OPERATING EXPENSES
This part considers the amount of money an airport’s management would spend on facilities
to generate operating revenue. The airport’s management aims to assure the profitability and
efficiency by providing services that airlines and passengers need. Whereas runways are one of
the leading sources that generate the most aeronautical revenue in airports from the charging
Source: ACI – 2013-2 Figure 2: Airport Revenues
Profitability and Financial Performance Indicators in U.S. airports – A Preliminary Investigation Literature Review | 12
aircraft landings and takeoffs, but the airport’s management is constantly checking runways
periodically and maintaining them to ensure safety for the aircraft landings and takeoffs.
All air transportation start and end at runways, which implies increasingly high demand for
runway slots (landing or departure) during peak periods at congested airports as demand for air
transportation increases. Physical expansion of airport facilities (including runways) is one
possible solution to current congested systems. However, the expansion is seriously confronted by
limited geographical space, zoning and noise restrictions, as well as the expense of building new
runways. (Jeddi, 2008).
Furthermore, airports incur expenses on parking areas, and terminals since when earning non-
aeronautical revenues. For instance, an airport’s management must pay the salaries for the
employees to ensure that the terminals and other facilities are running smoothly, and they must
also pay the bills for the utilities used in those areas.
The airport’s management does consider maintaining and fixing all the vehicles used in the
taxiways that assist passengers and cargo and play a fundamental role in generating the airport’s
operating revenue. According to the FAA (FAA, 2009), the operating expenses of most major U.S.
airports are growing in the same line with operating revenue; this implies that it’s almost
impossible to generate more revenue from operations without incurring some expenses on the
various areas of the airports. Numerous operating costs can be categorized into maintenance cost,
which is the expenditures required for the upkeep of the facilities. Maintenance must be provided
to the landing area (runway, taxiway, apron, lightning equipment), terminal area (buildings,
utilities, baggage handling, ground), hangers, cargo terminals, and other airport facilities. The
operating cost which includes the administration and staffing services and some of those are
escapable when the demand in the airport is weak. (Ashford et al. 2011). The airports across all
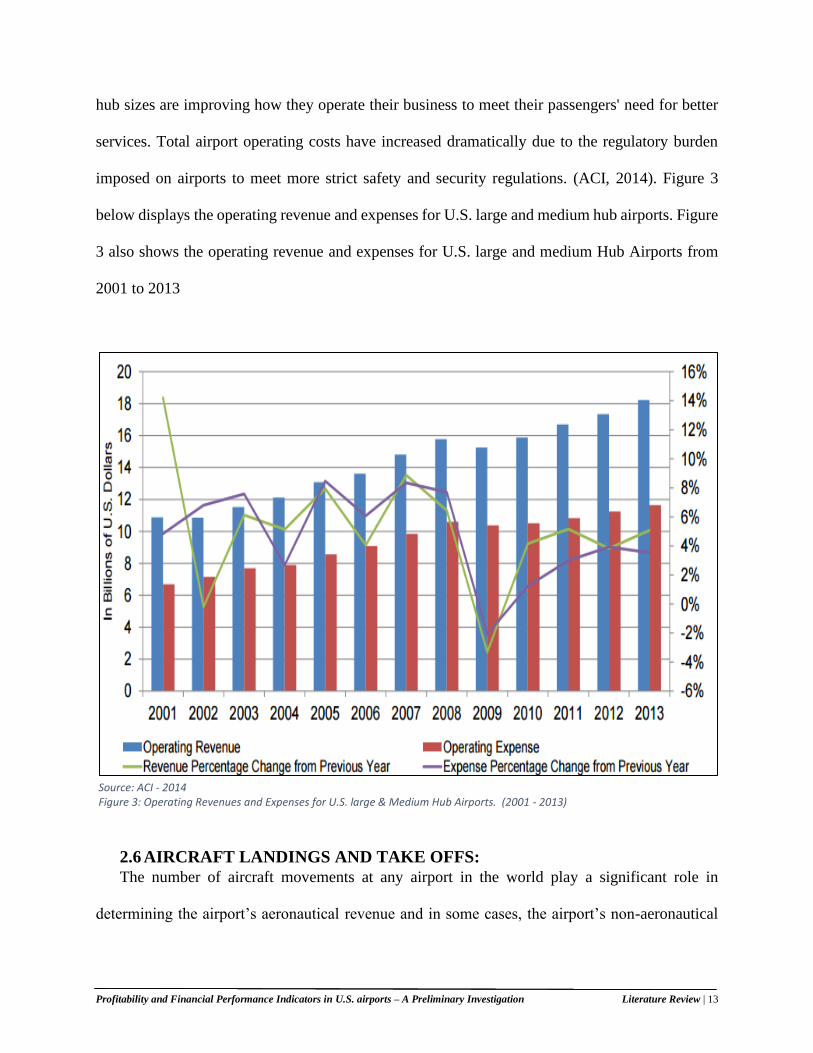
Profitability and Financial Performance Indicators in U.S. airports – A Preliminary Investigation Literature Review | 13
hub sizes are improving how they operate their business to meet their passengers' need for better
services. Total airport operating costs have increased dramatically due to the regulatory burden
imposed on airports to meet more strict safety and security regulations. (ACI, 2014). Figure 3
below displays the operating revenue and expenses for U.S. large and medium hub airports. Figure
3 also shows the operating revenue and expenses for U.S. large and medium Hub Airports from
2001 to 2013
2.6 AIRCRAFT LANDINGS AND TAKE OFFS:
The number of aircraft movements at any airport in the world play a significant role in
determining the airport’s aeronautical revenue and in some cases, the airport’s non-aeronautical
Source: ACI - 2014 Figure 3: Operating Revenues and Expenses for U.S. large & Medium Hub Airports. (2001 - 2013)

Profitability and Financial Performance Indicators in U.S. airports – A Preliminary Investigation Literature Review | 14
revenue. It is already known in most American airports that there are lots of factors affecting the
number of landings and taking offs such as the number of runways, the number of taxiways, the
number of ramps, the unique vehicles used at the taxiways, and the airlines-airports agreements.
The ground time for the aircraft waiting in the taxiway affects the annual number of landings
and take-offs. The airports are mostly either hub airports or focus cities for airlines. According to
the Bureau of Transportation Statistics (BTS), for 2007, the top three airports with longest waiting
times for takeoff in 2007 were from the New York area, and LaGuardia airport (LGA) was ranked
at number three with average taxi-out times of 29 minutes. (Perng et al. 2010).
Additionally, most of the American airports have become increasingly congested in recent
years. This congestion would affect the number of landing and taking-off significantly. One of the
most valuable solutions that airport managements should take into consideration to avoid
congestion is by expanding the area of the airport or by using the airport’s resources more
efficiently. Whitaker. (2013) suggests that to help manage bottlenecks, airlines operating at four
U.S. airports – Washington’s Reagan National and three major New York City-area airports- must
obtain operating authorizations, called slots, from FAA to take-off and land.
Landing and taking-off fees are determined by several factors, but the key one is the
airlines-airports agreements. Those agreements are known as the “residual agreement” and the
“compensatory agreement” between the airlines and the airports and set out the terms and the
conditions for the airlines to use the airport’s facilities. Each agreement has its characteristics and
features. Airports can have one or both at the same time based on various criteria.
First, under the “residual agreement”, airlines should provide the revenue required to cover
the airport’s cost and the debt service payment; the non-aeronautical revenue is collected by

Profitability and Financial Performance Indicators in U.S. airports – A Preliminary Investigation Literature Review | 15
airlines not the airport’s operators. In a residual agreement, both of the revenues (non-aeronautical
and aeronautical) are considered when setting aeronautical charges; this enables airlines to
guarantee an airport's solvency by agreeing to pay any residual operating costs’ that are not
covered by non-aeronautical revenues, (Richardson, 2014). In addition, this agreement contains
the “majority in interest” which gives the airlines the power of making decisions upon the airport’s
improvement capital. Air carriers that are a signatory to a residual cost use agreement often
exercise a substantial measure of control over airport investment decisions and related pricing
policy. These powers are embodied in the “majority in interest” (MIT) agreement which is a much
more common feature of airport use agreements at residual cost airports. (Seth & Alexander,
2014).
Second, under the compensatory agreement, airlines are responsible for the expenses for
the area they use. Airports using this agreement have the opportunity to generate more revenue.
However, generating additional revenue under a compensatory agreement could increase the risk
of airports not meeting their debt service payments. Also, the airport’s management under this
agreement has the incentive to focus on non-aeronautical revenue because their ability to manage
those revenues without the control of the airlines. Non-signatory airlines pay rates that are 20
percent higher compared to signatory airlines. Non-signatory airlines do not control any portion of
net airport revenues. The airport charges a premium to offset the fact that non-signatory airlines
are not committing themselves to a lease for a specified term. (Sabel, 2004)
Also, there are some airports in the U.S. using a hybrid agreement which contains elements of both
the residual and the compensatory agreements. Such airports include ATL Airport, Boston Logan
International Airport (BOS), JFK Airport, Seattle-Tacoma International Airport (SEA), and
several other airports in the United States. According to the Federal Aviation Administration
Profitability and Financial Performance Indicators in U.S. airports – A Preliminary Investigation Literature Review | 16
(FAA, 2009), airports’ operators frequently adopt rate-setting classifications that gather elements
of both residual and compensatory agreements. Such approaches may charge airlines’ operators
for the use of aeronautical facilities with aeronautical users assuming additional responsibility for
airport costs in return for a sharing of non-aeronautical revenues that offset aeronautical costs.
Figure 4 shows the average number of landings and takeoffs for the large and medium hub airports
from 2009 to 2015.

Profitability and Financial Performance Indicators in U.S. airports – A Preliminary Investigation Literature Review | 17
Source: WWW.FAA.GOV Figure 4: The Average number of landings & takeoffs for large & medium hub airports. (2009 - 2015)
Profitability and Financial Performance Indicators in U.S. airports – A Preliminary Investigation Literature Review | 18
2.7 AIRPORT PASSENGERS:
Passengers at any airport are one of the several important factors that drive an airport’s
operating income since the majority of airports’ aeronautical and non-aeronautical revenues are
generated from passengers. The increasing competition between airlines pushes airlines’ operators
to think hard and provide more services and lower price tickets to attract passengers (time and
price sensitive) to fly with them. Thus, this will dramatically create more opportunities for airports
where airlines are serving in to generate more aeronautical and non-aeronautical revenues from
the airlines they serve. Airports generate cash by charging passengers specific amount of money.
This amount of cash varies between airports based on particular rules and generally included with
ticket prices. Halpen and Graham (2013) state that passengers are clearly of crucial importance to
airports, not only because they consume the product airlines provide, but also because they are
direct customers for commercial airport facilities.
Perng et al., (2010) argue that female travelers have different buying patterns and tend to spend
more time and money on shopping. Regarding gender, females spend much more on confectionery,
fragrances, and books, while male shoppers prefer to spend their funds on electronic and
photographic products. Also, most business people are influenced by their colleagues and are
unlikely to show extravagance when accompanied by their calleagues. (Perng et al. 2010).
Passengers can be categorized based on the connection, and the sensitivity for the time and the
price. For connection, there are origin passengers who are traveling from their cities to another
point. Those passengers are essential to the airport operators because they are going to use all the
facilities provided by the airport such as the car parking area and the shops and restaurants in the
terminals. On the other hand, there are passengers with connecting flights either with the same
carrier or at times, with a different carrier than that on their first-leg of the itinerary. Those
Profitability and Financial Performance Indicators in U.S. airports – A Preliminary Investigation Literature Review | 19
passengers are also crucial since the airports are generating cash from their deplaning. Dender
(2007) shows that concession revenues per departing passenger are lower at hubs, probably
because of a high share of connecting passengers, who do not consume rental car and parking
services.
In addition, passengers can be categorized based on their price or time sensitivity regardless if
they are origin or connecting passengers. Airports should therefore pay more attention to time-
sensitive passengers since these passengers do not care about what it costs the airport to provide
these services but instead are concerned about the quality of the service provided. For example,
time-sensitive passengers can easily change the airport from where they are flying if they feel that
they are spending more time than they should. Thus, losing that kind of passengers would affect
the airport revenue stream negatively. Figure 5 below shows the average number of passengers
for large and medium hub airports from 2009 to 2015.

Profitability and Financial Performance Indicators in U.S. airports – A Preliminary Investigation Literature Review | 20
Source: WWW.FAA.GOV Figure 5: The Average number of Passengers for large & medium hub airports. (2009 - 2015)
Profitability and Financial Performance Indicators in U.S. airports – A Preliminary Investigation Literature Review | 21
2.8 AIRPORT CARGO:
In the U.S, it was quickly realized that carrying cargo, as opposed to carrying passengers, was
crucial in shortening the distance between suppliers and consumers. Cargo deals with a large
demand for things that can be delivered in a very fast, reliable, and well-organized way. Cunha et
al, (2017) state that air freight (which includes the transportation by air cargo and mail) is
competitive mainly for long distances and relatively light, high-value for time-sensitive cargo.
The revenue that airports generate from cargo has been increasing dramatically in past years
especially after most industries realized that air cargo is a safe and fast way to ship their products
to consumers. Morrell (2011) shows that revenues may vary depending on the country of origin
and destination and whether the cargo is carried on passenger or freighter services. Today, air
cargo is making an enormous positive difference in the economy, especially in industrial cities.
The air cargo market, which is seen as a lead indicator for trade volume and gross domestic product
(GDP), is also an important indicator of the state of the global economy. (Shen & Chou, 2013).
Furthermore, airports that are seeking more revenue from the cargo side should provide some
specific services and amenities to attract airlines to do their cargo work in the airport. For example,
airports should provide the required size of hangers to facilitate the process of delivering the cargo
to its destination. Gardiner et al, (2005) show that the vital issue for cargo operators is what market
to serve in and what location (airport) to choose. There are plenty of factors affecting this decision
such as, the area provided for cargo, airport congestion, charging rate, as well as a number of other
factors. Other things being equal, airports with significant cargo services today would continue to
be successful in attracting new operators.
Profitability and Financial Performance Indicators in U.S. airports – A Preliminary Investigation Literature Review | 22
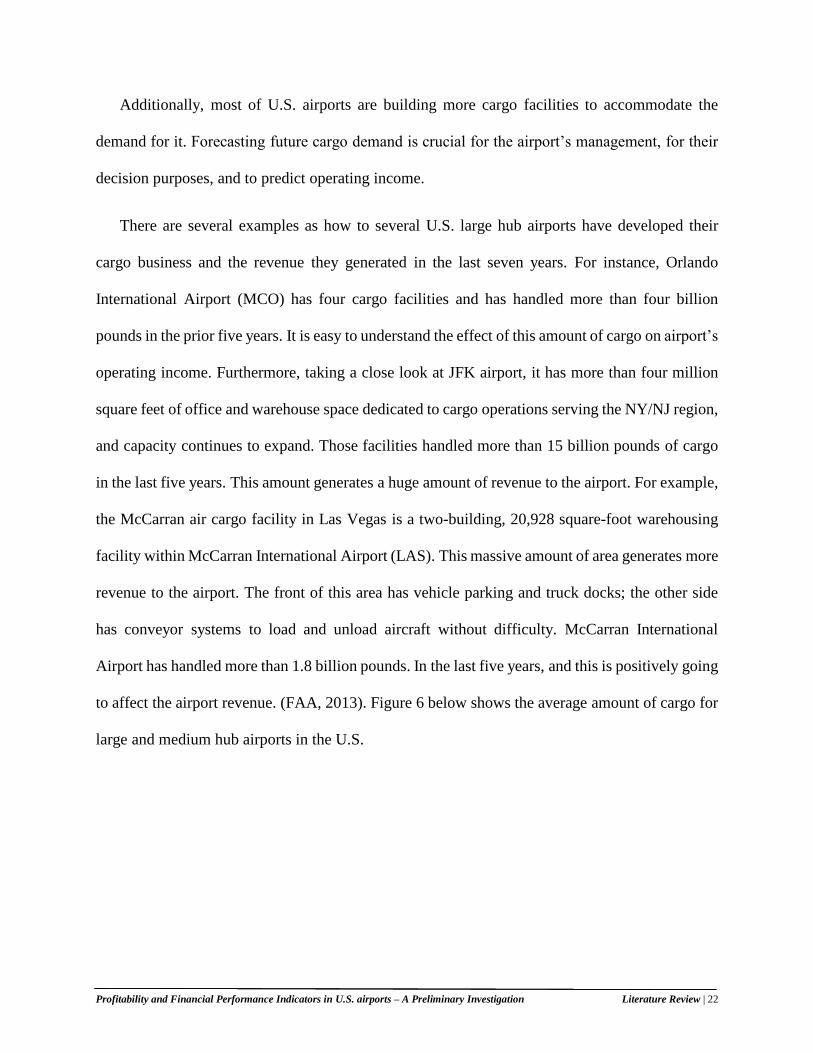
Additionally, most of U.S. airports are building more cargo facilities to accommodate the
demand for it. Forecasting future cargo demand is crucial for the airport’s management, for their
decision purposes, and to predict operating income.
There are several examples as how to several U.S. large hub airports have developed their
cargo business and the revenue they generated in the last seven years. For instance, Orlando
International Airport (MCO) has four cargo facilities and has handled more than four billion
pounds in the prior five years. It is easy to understand the effect of this amount of cargo on airport’s
operating income. Furthermore, taking a close look at JFK airport, it has more than four million
square feet of office and warehouse space dedicated to cargo operations serving the NY/NJ region,
and capacity continues to expand. Those facilities handled more than 15 billion pounds of cargo
in the last five years. This amount generates a huge amount of revenue to the airport. For example,
the McCarran air cargo facility in Las Vegas is a two-building, 20,928 square-foot warehousing
facility within McCarran International Airport (LAS). This massive amount of area generates more
revenue to the airport. The front of this area has vehicle parking and truck docks; the other side
has conveyor systems to load and unload aircraft without difficulty. McCarran International
Airport has handled more than 1.8 billion pounds. In the last five years, and this is positively going
to affect the airport revenue. (FAA, 2013). Figure 6 below shows the average amount of cargo for
large and medium hub airports in the U.S.

Profitability and Financial Performance Indicators in U.S. airports – A Preliminary Investigation Literature Review | 23
Source: WWW.FAA.GOV Figure 6: The Average amount of cargo for large & medium hub airports. (2009 - 2015)

Profitability and Financial Performance Indicators in U.S. airports – A Preliminary Investigation Literature Review | 24
2.9 AIRPORT DEBT SERVICE RATIO:
The debt service ratio measures the ability of a firm to pay its current obligations from
operating income. This ratio is one of the most essential ratios showing the firm’s ability to
generate revenue to cover its debt issues. The higher this is, the easier for the firm get a loan since
most loan providers rely on this ratio to assessing the firms requesting a loan. Additionally, the
debt service ratio can be measured by dividing the net operating income by the total debt service.
Grady (2010) states that the business debt service coverage ratio ( DSCR) is one of the critical
ratios to calculate and analyze a borrower’s ability to repay debt. Also, the debt service ratio is the
ability of a company to repay its debt which compares reported earnings to the amount of scheduled
after tax-interest and principal payments to determine whether there is enough income available to
cover the payments. (Bragg, 2012).
Most of U.S. commercial airports use this ratio to show the power and ability of management
to cover its obligations. The massive amount of infrastructure needed in any airport requires a
massive amount of money to get it done. For example, airports can get grants from the local, state,
and the federal government. Airports may also issue bonds to the general public. In such cases, the
parties involved look closely at the debt service ratio to assess an airport’s ability to pay its
obligations on time. According to the Federal Aviation Administration, an airport’s operator
should focus on the required payments and discuss the factors that might affect the airport’s ability
to make future payments.
Profitability and Financial Performance Indicators in U.S. airports – A Preliminary Investigation Literature Review | 25
2.10 AIRPORT SIZE:
The size of the airport has a measurable impact on financial performance. Commercial service
airports are classified by hub size. Airports with a minimum of 1.0 percent of the total national
enplanements are considered to be large hub airports while airports with at least 0.25 percent of
the total national enplanements are known as medium hub airports. small hub airports are airports
that accommodate between 0.05 percent to 0.25 percent of total country’s enplanements, and
airports below this ratio are defined as non-hub airports. Research on the relationship between
airport size and profitability appears to be limited. It is recognized that larger airports have an
advantage over smaller ones as larger airports could take advantage of economies of scales. Hence,
spending less and extracting more value (Chin & Teik. 2014). In order for airports to achieve
economies of scale, airport managers must reduce average expense, while total expenditures must
be covered by the airports’ outputs such as passengers, cargo, and others. At a given airport, this
can solely be accomplished with vital traffic throughput. Therefore, smaller airports that
accommodate less than one million passengers annually tend to have negative margins when taking
into consideration capital cost and taxes. (ICAO, 2015). Large airports have access to vital
financial resources while smaller airports have restricted financial resources. It's hard for them to
cover operating excesses, and they seem to be much more reliant on several grant programs to
fund capital plans. (EPA, 2012).
2.11 FLIGHT DELAY: When a flight takes off or lands later than 15 minutes from its scheduled departure or arrival
time, it is considered to be a delayed flight. There are several reasons behind a flight delay; one is
when actual arrival flights outnumber expected scheduled arrival flights. The other cause could be
attributed to the availability of scheduled gates. Additionally, a higher demand than expected,
Profitability and Financial Performance Indicators in U.S. airports – A Preliminary Investigation Literature Review | 26
planned capacity could also result in flight delays. (Wang et al. 2010). Flights are disrupted because
of a number of controllable (mechanical) and uncontrollable (weather) factors. Even though flight
delays affect the passengers negatively, a flight delay is costly for airlines as well. For airlines,
additional costs associated with flight delays, are primarily for the crew, fuel, and others. A recent
comprehensive study on flight delay projected that flight delay cost airlines $8.3 billion in 2007
(Peterson et al. 2013). However, delays are beneficial for airports since they generate more
revenue. For travelers, the additional time of air travel due to flight delays results in lost
opportunities for business and leisure activities. For example, when a flight is delayed, passengers
will spend more money on vending machines, restaurants, shopping, and others. On the other hand,
when the flight is delayed for a very long time, airlines are legally responsible for accommodating
passengers, airline’s crew in the airport’s hotel or other hotels in the vicinity. Hence, airports
generate more revenue when flights are delayed. The other issue that must be taken into
consideration is that airports’ management should focus on keeping the flight delay rate as low as
possible even though the airport will be generating more revenue passengers will seek other
transportation alternatives. Thus, the airport will lose passengers in the long run. Airport’s
management should pay the most attention to the passengers’ satisfaction as they are the primary
source of the airport’s aeronautical and non-aeronautical revenue.

Profitability and Financial Performance Indicators in U.S. airports – A Preliminary Investigation Literature Review | 27
This page was left intentionally blank
Profitability and Financial Performance Indicators in U.S. airports – A Preliminary Investigation Methodology | 28
3. METHODOLOGY
This section presents the research methodology used in this thesis. The purpose of this thesis
is to examine whether the variables chosen in this research affect airport profitability. A model
was created and regression analysis was used to analyze the data. First, data for the model is
organized, then, descriptive statistics are displayed, and then the results are discussed and
explained in detail. A correlation table will assist in showing the strength of the relationship
between variables.
3.1 DESCRIPTION OF WORK:
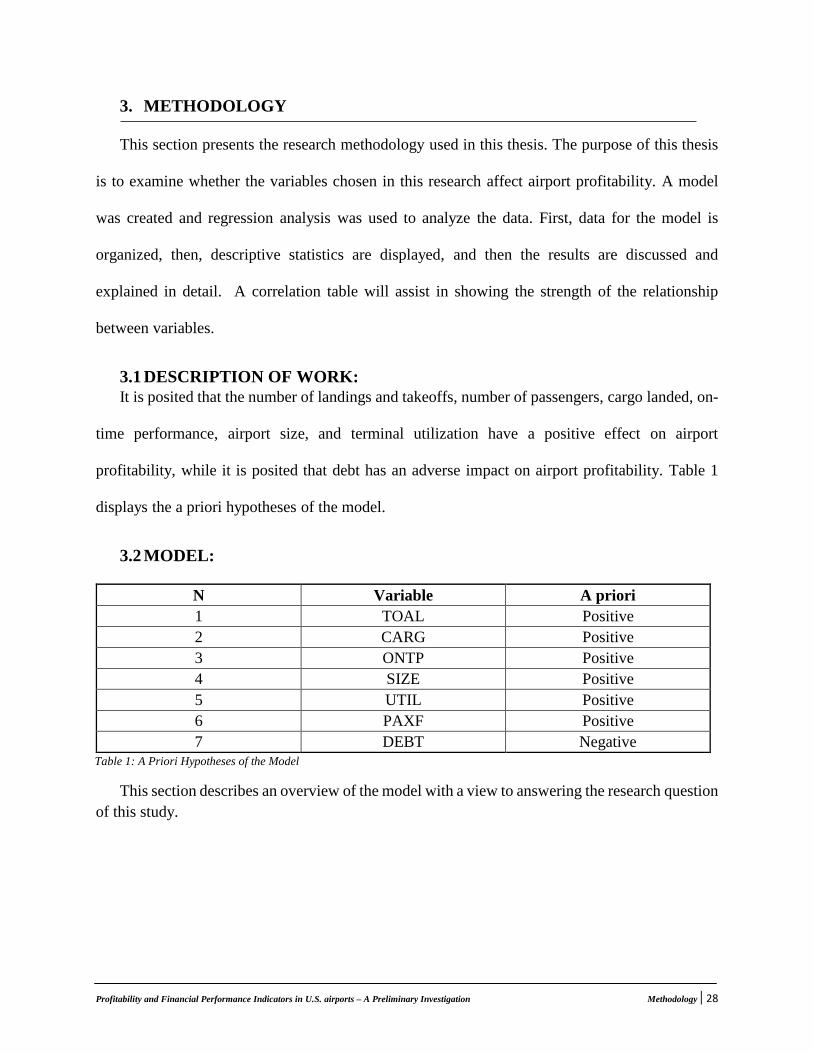
It is posited that the number of landings and takeoffs, number of passengers, cargo landed, on-
time performance, airport size, and terminal utilization have a positive effect on airport
profitability, while it is posited that debt has an adverse impact on airport profitability. Table 1
displays the a priori hypotheses of the model.
3.2 MODEL:
This section describes an overview of the model with a view to answering the research question
of this study.
Table 1: A Priori Hypotheses of the Model
N Variable A priori
1 TOAL Positive
2 CARG Positive
3 ONTP Positive
4 SIZE Positive
5 UTIL Positive
6 PAXF Positive
7 DEBT Negative

Profitability and Financial Performance Indicators in U.S. airports – A Preliminary Investigation Methodology | 29
Thus, in considering the performance for a given airport in a given year, the model can be
expressed as follows:
PERFij = f (TOAL ij, CARG ij, ONTP ij, SIZE ij, UTIL ij, PAXF ij, DEBT ij).
Where:
PERF ij = Profitability of airport performance calculated as a return on sales for airport i at year j
TOAL ij = Number of landings and takeoffs at an airport i in year j
CARG ij = Cargo landed in lbs in at an airport i in year j
ONTP ij = On-time performance at an airport i in year j
SIZE ij = The size of an airport i in year j
UTIL ij = Terminal utilization at an airport i in year j
PAXF ij = Number of passengers per a flight at an airport i in year j
DEBT ij = Annual debt for an airport i in year j.
3.3 VARIABLES AND IDENTIFICATIONS:
In the period under consideration (2009 to 2015), it is expected that the airport’s return on sales
is affected positively by the increase in the landing and takeoffs which implies that more flights
coming to or going out of a given airport will increase airport profitability, also taking into
account that international flights have more impact on the return on sales compared to domestic
flights. Moreover, the number of enplanements and on-time performance play a pivotal role in
affecting the airport’s return on sales. This appears to be logical since passengers at any airport
are the providers of the aeronautical and non-aeronautical revenues, and those main types of
revenues directly affect the airport’s return on sales. Furthermore, more shipments to any given
airport will affect the airport’s return on revenue (sales). The other two important factors are

Profitability and Financial Performance Indicators in U.S. airports – A Preliminary Investigation Methodology | 30
airport size and terminal utilization which affect the performance of the airport significantly.
Finally, debt is one of the most significant factors that affect any airport. It is a tricky factor since
increasing the debt will lower the operating income, but from another perspective, it can be said
that more debt means more budget dollars that helps to increase the operating income.
3.4 SAMPLE SELECTION:
The sample selected for this study was taken from a list of large and medium-sized airports
that are registered as hub airports by the FAA, and for which data were available. This resulted in
a sample of 47 airports which covers more than 80% of total large and medium hub airports within
the U.S.
3.5 DATA COLLECTION:
I obtained the data to this study from several airports’ related sources. These sources included
the FAA official website, the Bureau of the Transportation Statistics official website, airports’
annual reports, and data provided by the College of Business at Embry Riddle Aeronautical
University. The data gathered covered the period from 2009 to 2015.

Profitability and Financial Performance Indicators in U.S. airports – A Preliminary Investigation Methodology | 31
Table 2: Pearson Correlation
Profitability and Financial Performance Indicators in U.S. airports – A Preliminary Investigation Methodology | 32
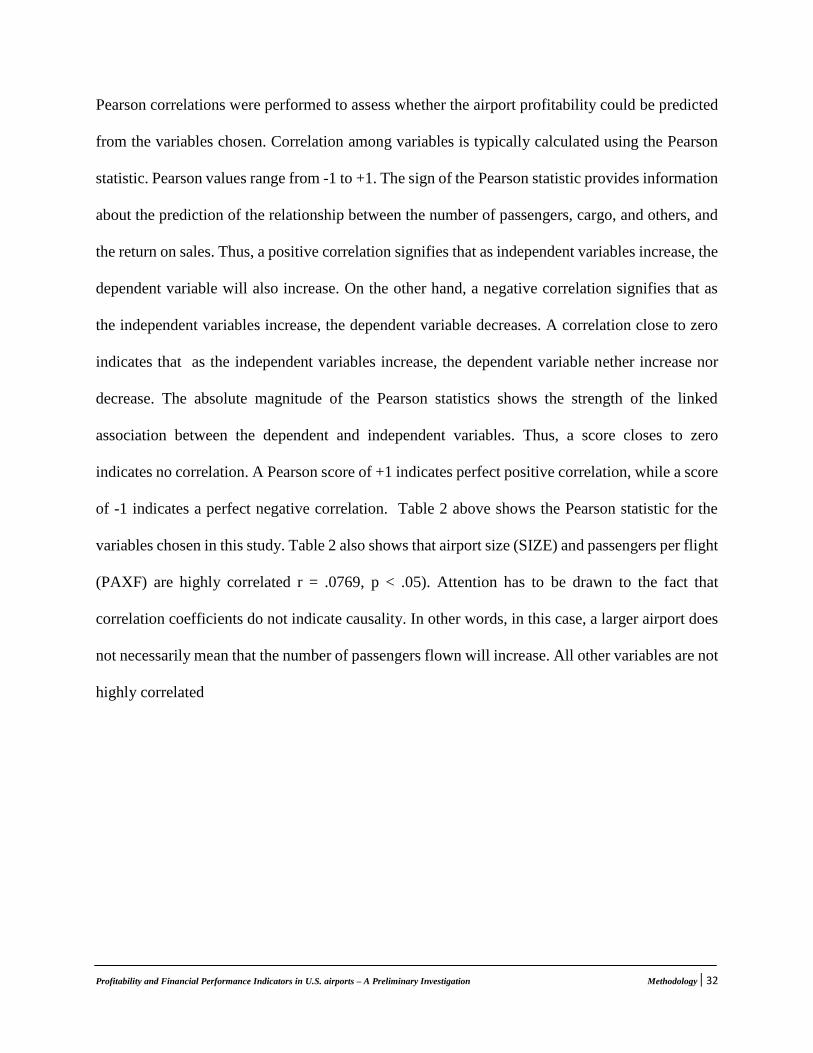
Pearson correlations were performed to assess whether the airport profitability could be predicted
from the variables chosen. Correlation among variables is typically calculated using the Pearson
statistic. Pearson values range from -1 to +1. The sign of the Pearson statistic provides information
about the prediction of the relationship between the number of passengers, cargo, and others, and
the return on sales. Thus, a positive correlation signifies that as independent variables increase, the
dependent variable will also increase. On the other hand, a negative correlation signifies that as
the independent variables increase, the dependent variable decreases. A correlation close to zero
indicates that as the independent variables increase, the dependent variable nether increase nor
decrease. The absolute magnitude of the Pearson statistics shows the strength of the linked
association between the dependent and independent variables. Thus, a score closes to zero
indicates no correlation. A Pearson score of +1 indicates perfect positive correlation, while a score
of -1 indicates a perfect negative correlation. Table 2 above shows the Pearson statistic for the
variables chosen in this study. Table 2 also shows that airport size (SIZE) and passengers per flight
(PAXF) are highly correlated r = .0769, p < .05). Attention has to be drawn to the fact that
correlation coefficients do not indicate causality. In other words, in this case, a larger airport does
not necessarily mean that the number of passengers flown will increase. All other variables are not
highly correlated

Profitability and Financial Performance Indicators in U.S. airports – A Preliminary Investigation Methodology | 33
This page was left intentionally blank

Profitability and Financial Performance Indicators in U.S. airports – A Preliminary Investigation Results and Discussion | 33
4. RESULTS AND DISCUSSION
Ordinary Least Squares (OLS), which assumes a linear relationship between the dependent and
independent variables, was used to perform a regression analysis.
4.1 DESCRIPTIVE STATISTICS
Table 3 shows the mean, the standard deviation, and the number of observations of the
variables chosen in this study.
Mean Standard Deviation N
PERF 0.38 0.10 329
TOAL 12.49 0.60 329
CARG 19.38 5.18 329
ONTP 0.80 0.04 329
UTIL 4.46 0.39 329
PAXF 67.99 23.59 329
DEBT -1581095285 2128317219 329
Table 3: Descriptive Statistics
Table 4 shows that the variables in the equation explain a proportion of the variation in airport
performance with an R squared (R2) (coefficient of determination) of 10.2 percent. The Durbin-
Watson statistic of .751 indicates that there is possible auto-correction among the variables, as it
falls outside the 1.5 to 2.5 range for no correlation to exist.

Profitability and Financial Performance Indicators in U.S. airports – A Preliminary Investigation Results and Discussion | 34
4.2 REGRESSION RESULTS – MODEL SUMMARY
The R2 measures whether the independent variables explain the variability in airport
performance, and count for variations in the dependent variable. The coefficient of determination,
R2 in this case shows that the independent variables taken together explain the variability in airport
performance. The adjusted R2 is a modified version of the R2 adjusted for the number of predictors
in the model. One could understand that if more variables are taken into account, more variance
could be explained. Therefore, to be able to have comparable R2, the adjusted R2 is used. R2 could
have values between 0 and 1, in which 0 in this case means that 0 percent of the variation of airport
performance is explained by the independent and control variables. When R2 is 1, this means that
100 percent of the variation of airport performance is explained by the independent and control
variables. Therefore, the higher the R2, the better the regression equation fits the sample data.
Furthermore, Table 5 demonstrates that the regression model is highly statistically significant
with an F-value of 5.203, with the hypothesis that all coefficients are jointly rejected at the five
percent significant level. The F – value is used to test the hypothesis that all the independent
variables taken together explain a significant proportion of the variation in the dependent variable
(airport performance). Since the F – value is significant (.000 < .05) at the five percent significance
level, the null hypothesis can be rejected, and the conclusion can be made that the independent
variables taken together are useful in explaining airport performance. Using the unstandardized
coefficients presented in Table 6, the resulting model is as follows:
R2 ADJ R2 STD. ERROR OF THE
ESTIMATION
F
CHANGE
SIG.F
CHANGE
DURBIN-
WATSON
0.102 0.082 0.0981 5.203 0.000 0.751
Table 4: Regression Results – Model Summary
Profitability and Financial Performance Indicators in U.S. airports – A Preliminary Investigation Results and Discussion | 35
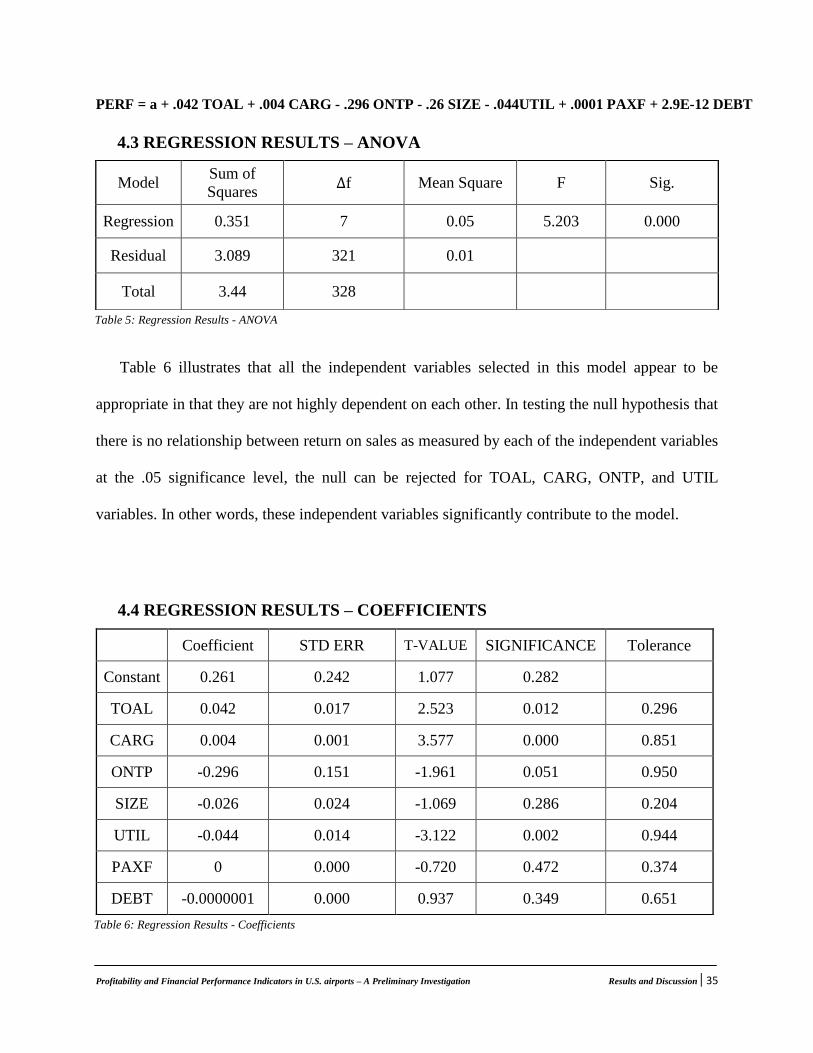
PERF = a + .042 TOAL + .004 CARG - .296 ONTP - .26 SIZE - .044UTIL + .0001 PAXF + 2.9E-12 DEBT
4.3 REGRESSION RESULTS – ANOVA
Table 6 illustrates that all the independent variables selected in this model appear to be
appropriate in that they are not highly dependent on each other. In testing the null hypothesis that
there is no relationship between return on sales as measured by each of the independent variables
at the .05 significance level, the null can be rejected for TOAL, CARG, ONTP, and UTIL
variables. In other words, these independent variables significantly contribute to the model.
4.4 REGRESSION RESULTS – COEFFICIENTS
Model Sum of
Squares Δf Mean Square F Sig.
Regression 0.351 7 0.05 5.203 0.000
Residual 3.089 321 0.01
Total 3.44 328
Table 5: Regression Results - ANOVA
Table 6: Regression Results - Coefficients
Coefficient STD ERR T-VALUE SIGNIFICANCE Tolerance
Constant 0.261 0.242 1.077 0.282
TOAL 0.042 0.017 2.523 0.012 0.296
CARG 0.004 0.001 3.577 0.000 0.851
ONTP -0.296 0.151 -1.961 0.051 0.950
SIZE -0.026 0.024 -1.069 0.286 0.204
UTIL -0.044 0.014 -3.122 0.002 0.944
PAXF 0 0.000 -0.720 0.472 0.374
DEBT -0.0000001 0.000 0.937 0.349 0.651

Profitability and Financial Performance Indicators in U.S. airports – A Preliminary Investigation Results and Discussion | 36
It was hypothesized that the on-time performance, size, and terminal utilization have a significant
and positive relationship with airport performance. The results show that these coefficients resulted
in a significant but negative relationship with airport profitability. This appears to be counter
intuitive as it would appear that the better the on-time performance, the better the airport
profitability. Similarly, it would appear that the larger the size of the airport, the higher the airport
profitability. Additionally, it was argued that the higher the airport utilization, the higher the airport
profitability. The remaining variables resulted in the expected sign and importance.

Profitability and Financial Performance Indicators in U.S. airports – A Preliminary Investigation Results and Discussion | 37
This page left intentionally blank
Profitability and Financial Performance Indicators in U.S. airports – A Preliminary Investigation Conclusion | 38
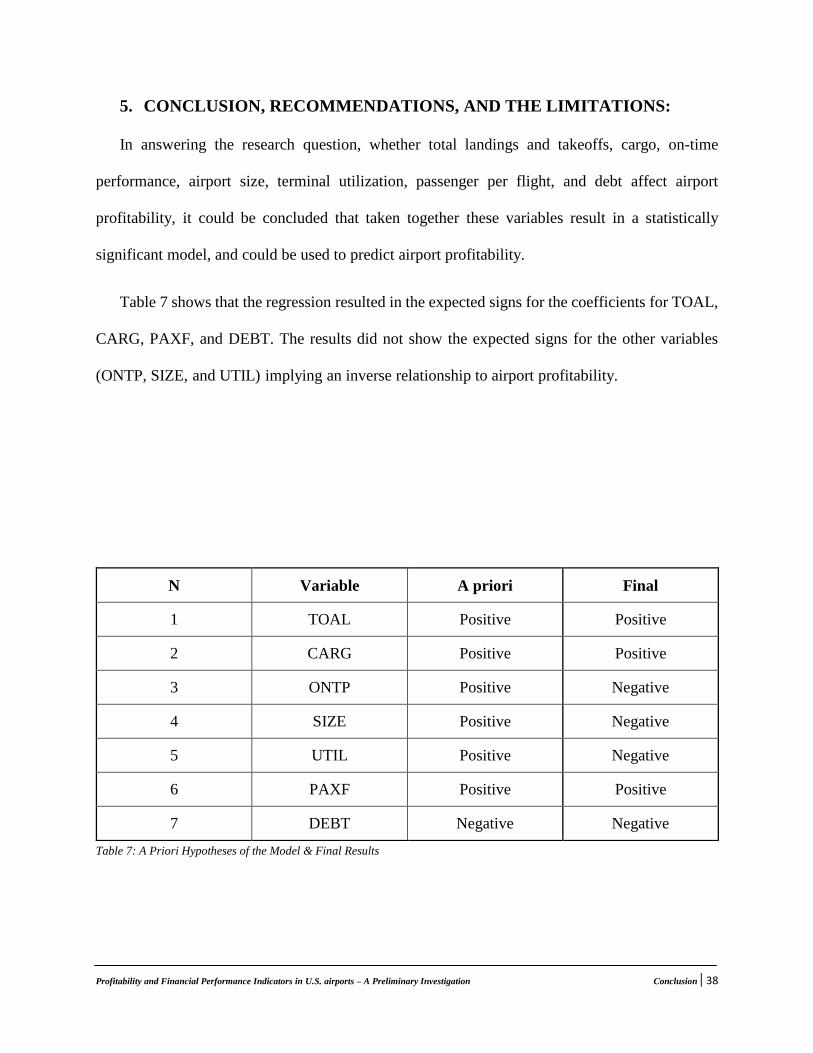
5. CONCLUSION, RECOMMENDATIONS, AND THE LIMITATIONS:
In answering the research question, whether total landings and takeoffs, cargo, on-time
performance, airport size, terminal utilization, passenger per flight, and debt affect airport
profitability, it could be concluded that taken together these variables result in a statistically
significant model, and could be used to predict airport profitability.
Table 7 shows that the regression resulted in the expected signs for the coefficients for TOAL,
CARG, PAXF, and DEBT. The results did not show the expected signs for the other variables
(ONTP, SIZE, and UTIL) implying an inverse relationship to airport profitability.
N Variable A priori Final
1 TOAL Positive Positive
2 CARG Positive Positive
3 ONTP Positive Negative
4 SIZE Positive Negative
5 UTIL Positive Negative
6 PAXF Positive Positive
7 DEBT Negative Negative
Table 7: A Priori Hypotheses of the Model & Final Results

Profitability and Financial Performance Indicators in U.S. airports – A Preliminary Investigation Conclusion | 39
The results show that there is a significant and positive relationship between total landings and
takeoffs, cargo, passenger per flight, debt and airport profitability. Furthermore, there is a
significant but negative relationship between on-time performance, airport size, terminal
utilization and airport profitability. These hypotheses were tested using a regression model to
measures airport profitability, and therefore the null hypothesis can be rejected. From the results
of the regression model, it could be seen that SIZE, PAXF, and DEBT were not statistically
significant in predicting airport performance.
The limitations of this study include, but are not limited to, the availability of data, the time
period covered and the selection of the variables. Some of the data used was not available for all
airports. Expanding the time-period covered could also shed light on many shocks that affect
airport profitability for period like the 2008 – 2009 recession. This thesis is subjective and it is
quite possible that the inclusion of an omitted variable would yield different results. Therefore, the
recommendation for further research will be to see whether having access to more airports’ data
will enhance the results of this research.

Profitability and Financial Performance Indicators in U.S. airports – A Preliminary Investigation Conclusion | 40
This page was left intentionally blank

Profitability and Financial Performance Indicators in U.S. airports – A Preliminary Investigation References | 41
References
ACI. (2013-1). Airport Business. Retrieved July 5, 2017, from
Http://www.aci.aero/Media/aci/file/Position%20Briefs/position%20brief_AIRPORT%20BU
SINESS.[PDF].
ACI. (2013-2). Non-aeronautical-revenue. Retrieved July 5, 2017 from Http://www.aci-
na.org/sites/default/files/non-aeronautical_revenue-september2013. [PDF]. (2013-2).
Abeyratne, R. I. (2001). Revenue and investment management of privatized airports and air
navigation services—a regulatory perspective. Journal of Air Transport Management,7(4), 217-
230. doi:10.1016/s0969-6997(01)00008-4
Ashford, N., Mumayiz, S. A., & Wright, P. H. (2011). Airport engineering: planning, design, and
development of 21st century airports. Hoboken: John Wiley & Sons.
Bragg, S. M. (2012). Business ratios and formulas: a comprehensive guide. Hoboken, NJ: Wiley.
Badia, M., Melumad, N. D., & Nissim, D. (2007). Operating Profit Variation Analysis:
Implications for Future Earnings and Equity Values*. SSRN Electronic Journal.
doi:10.2139/ssrn.1266261
Cunha, D. A., Macário, R., & Reis, V. (2017). Keeping cargo security costs down: A risk-based
approach to air cargo airport security in small and medium airports. Journal of Air Transport
Management,61, 115-122. doi:10.1016/j.jairtraman.2017.01.003
Chin, A., & Teik, D. (2014). AIRPORT REVENUE MANAGEMENT: DOES AIRPORT SIZE
MATTER? Academy of World Business, Marketing and Management Development,6.
Dender, K. V. (2007). Determinants of fares and operating revenues at US airports. Journal of
Urban Economics,62(2), 317-336. doi:10.1016/j.jue.2006.09.001
Eboli, L., & Mazzulla, G. (2009). An ordinal logistic regression model for analyzing airport
passenger satisfaction. EuroMed Journal of Business,4(1), 40-57.
doi:10.1108/14502190910956684.
Eggebeen, J. (2007). Airport age: architecture and modernity in America.
EPA. (2012). Economic Analysis for Final Effluent Limitation Guidelines and Standards for the
Airport Deicing Category. U.S Environment Protection Agency. Retrieved May 25, 2017.
FAA. (2015). Terminal Area Forecast – Modernized Platform (TAF-M). Retrieved July 5,
2017, from https://www.faa.gov/data_research/aviation/media/taf_tech_model.pdf.

Profitability and Financial Performance Indicators in U.S. airports – A Preliminary Investigation References | 42
FAA. (1992). Estimating the Regional Economic Significance of Airports. Retrieved July 5, 2017,
from http://www.dtic.mil/dtic/tr/fulltext/u2/a257658.pdf.
FAA. (2009). Airport Rates and Charges. Retrieved July 5, 2017 from Https://www.faa
.gov/airports/resources/publications/orders/compliance_5190_6/media/5190_6b_chap18
Fasone, V., Kofler, L., & Scuderi, R. (2016). Business performance of airports: Non-aviation
revenues and their determinants. Journal of Air Transport Management,53, 35-45.
doi:10.1016/j.jairtraman.2015.12.012.
FAA. (2013). Air Cargo Activity Report. Retrieved May 15, 2016 from Http://www.faa.gov
/airports/resources/publications/federal_register_notices/media/pfc_72fr28837.
Graham, A. (2014). Managing airports: an international perspective. London: Routledge.
Gardiner, J., Ison, S., & Humphreys, I. (2005). Factors influencing cargo airlines’ choice of the
airport: An international survey. Journal of Air Transport Management,11(6), 393-399.
doi:10.1016/j.jairtraman.2005.05.004
G., & T., J. (2010, April 1). Two Views Are Better Than One: A Case Study Compares Two
Methods for Calculating and Analyzing Debt Service Coverage Ratios. The RMA Journal.
Halpern, N., Graham, A., & Echevarne, R. (2013). Airport marketing. London: Routledge.
ICAO. (2015). State of Airport Economics. Retrieved May 25, 2017, from
https://www.icao.int/sustainability/Airport_Economics/State%20of%20Airport%20Eco
ICAO. (2014). Non-Aeronautical-Revenue. Retrieved July 5, 2017 from Http://www.aci-
na.org/sites/ aeronautical /non-aeronautical_revenue.
Janic, M. (2008). The Future Development of Airports: A Multidimensional
Examination.Transportation Planning and Technology,31(1), 113-134.
doi:10.1080/03081060701835803
Jeddi, B. (2008). A Statistical Separation Standard and Risk-Throughput Modeling of the Aircraft
Landing Process (Unpublished doctoral dissertation). George Mason University.
Kazda, A., & Caves, R. E. (2015). Airport design and operation. Bingley: Emerald.
Morrell, P. S. (2011). Moving boxes by air: the economics of international air cargo. Aldershot:
Ashgate Publ.
Milan. (2013). Airport analysis, planning, and design: demand, capacity and congestion. Place
of publication not identified: Nova Science.

Profitability and Financial Performance Indicators in U.S. airports – A Preliminary Investigation References | 43
Perng, S., Chow, C., & Liao, W. (2010). Analysis of shopping preference and satisfaction with
airport retailing products. Journal of Air Transport Management,16(5), 279-283.
doi:10.1016/j.jairtraman.2010.02.002
Peterson, E. B., Neels, K., Barcz, N., & Graham, T. (2013). The Economic Cost of Airline Flight
Delay. Journal of Transport Economics and Policy,47(1), 107-121.
Richardson, C., Budd, L., & Pitfield, D. (2014). The impact of airline lease agreements on the
financial performance of US hub airports. Journal of Air Transport Management,40, 1-15.
doi:10.1016/j.jairtraman.2014.04.004
Saraswati, B., & Hanaoka, S. (2014). Airport–airline cooperation under commercial revenue
sharing agreements: A network approach. Transportation Research Part E: Logistics and
Transportation Review,70, 17-33. doi:10.1016/j.tre.2014.06.013.
Shen, C., & Chou, C. (2013). A time series analysis of the dynamic competition between major
cargo airports. Transportation Planning and Technology,36(7), 567-580.
doi:10.1080/03081060.2013.845430
Sabel, J. (2004). Airline-Airport Facilities Agreements: An Overview. Journal of Air Law and
Commerce,69, 770-792. Retrieved March 19, 2017.
Whitaker, O. M. (2013). Slot-Controlled Airports: Congestion, Capacity, and Competition Issues.
Nova Science Incorporated.
Wang, J., Shortle, J., Wang, J., & Sherry, L. (2009). Analysis of Gate-waiting Delays at Major US
Airports. 9th AIAA Aviation Technology, Integration, and Operations Conference (ATIO).
doi:10.2514/6.2009-7085
Xiaowen. F & Anming .Z, . (2010). Effects of Airport Concession Revenue Sharing on Airline
Competition and Social Welfare. Journal of Transport Economics and Policy, 119-138.
Young, S. B., & Wells, A. (2011). Airport planning and management. New York: McGraw-
Hill.
Young, S. B., & Wells, A. (2014). Airport planning and management. New York: McGraw-Hill.
Zarb. (2014). Valuation of airline companies: A Function of Earnings or Cash? International
Journal of Business, Accounting, and Finance.

Profitability and Financial Performance Indicators in U.S. airports – A Preliminary Investigation References | 44
This page was left intentionally blank

Profitability and Financial Performance Indicators in U.S. airports – A Preliminary Investigation Appendix 1 | 45
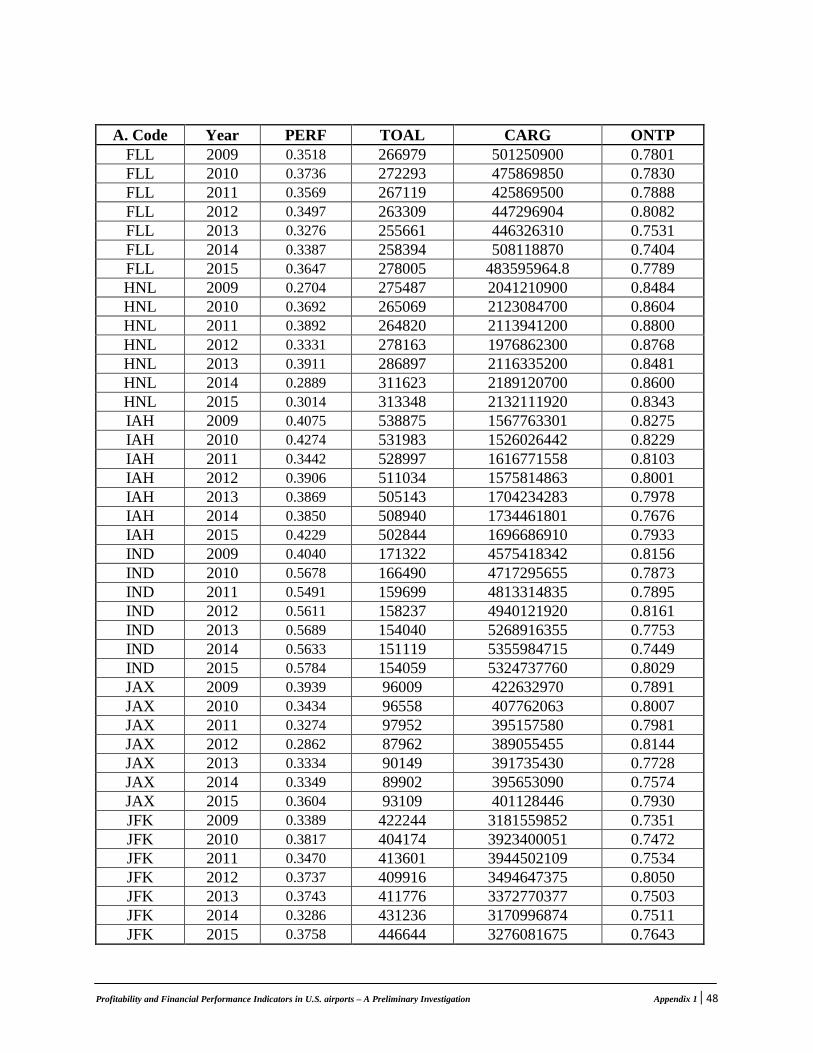
Appendix 1: The data used in this research:
A. Code Year PERF TOAL CARG ONTP
DFW 2009 0.2728 638782 2872971976 0.7900
DFW 2010 0.2828 652258 3031597346 0.7779
DFW 2011 0.2631 646803 3064264844 0.8143
DFW 2012 0.2761 650124 3087615175 0.8490
DFW 2013 0.2518 678059 3062528160 0.8286
DFW 2014 0.3026 679820 3140733270 0.8229
DFW 2015 0.2922 681261 3114468629 0.8280
IAD 2009 0.4245 365585 429940540 0.8080
IAD 2010 0.3969 371801 450313574 0.8108
IAD 2011 0.4727 361697 446608904 0.7861
IAD 2012 0.4330 338386 465711225 0.7915
IAD 2013 0.4938 334452 477671020 0.7750
IAD 2014 0.5083 314512 479925622 0.7564
IAD 2015 0.5150 294807 476631822.2 0.8046
LAX 2009 0.2302 544833 3768864700 0.8268
LAX 2010 0.1963 575835 3954810091 0.8167
LAX 2011 0.2988 603912 4043122100 0.7958
LAX 2012 0.3058 605480 4204996790 0.8112
LAX 2013 0.3223 614917 4199375809 0.7963
LAX 2014 0.3690 636706 4297359912 0.7714
LAX 2015 0.3846 654501 4259290467 0.7723
ABQ 2009 0.6119 158529 579793842 0.8349
ABQ 2010 0.5302 156616 598981698 0.8098
ABQ 2011 0.5159 154140 593136032 0.8108
ABQ 2012 0.4870 147724 568151446 0.8321
ABQ 2013 0.5009 136915 567236072 0.7626
ABQ 2014 0.4823 130069 569465958 0.7292
ABQ 2015 0.4560 124184 579138962 0.7896
ANC 2009 0.3821 256632 15524360013 0.7723
ANC 2010 0.5168 274778 19463543790 0.8168
ANC 2011 0.4599 273303 17774071223 0.8222
ANC 2012 0.3952 270997 16522948234 0.8369
ANC 2013 0.4042 264390 15982410652 0.8189
ANC 2014 0.4496 277011 15867941046 0.8389
ANC 2015 0.4856 278684 17139250601 0.8167
ATL 2009 0.5416 970258 2555242350 0.7260
ATL 2010 0.4756 950119 2628040410 0.7875
ATL 2011 0.5046 923991 2655614700 0.8028
ATL 2012 0.4451 930098 2027932736 0.8474
ATL 2013 0.5319 911074 2187228002 0.8085
ATL 2014 0.4766 868359 2262892910 0.8247
ATL 2015 0.4442 882497 2200767894 0.8444
Appendix 1: The data

Profitability and Financial Performance Indicators in U.S. airports – A Preliminary Investigation Appendix 1 | 46
se in this research:
A. Code Year PERF TOAL CARG ONTP
AUS 2009 0.3022 174514 398927244 0.8050
AUS 2010 0.2694 176914 398073978 0.8044
AUS 2011 0.2947 176331 416029448 0.8036
AUS 2012 0.2791 172248 420478700 0.8045
AUS 2013 0.3230 176647 442476680 0.7659
AUS 2014 0.2973 182468 438339730 0.7610
AUS 2015 0.3316 191193 498446900 0.7815
BNA 2009 0.3822 174058 355766290 0.8102
BNA 2010 0.2942 174235 243700794 0.7960
BNA 2011 0.3056 174750 261516890 0.8028
BNA 2012 0.1862 173222 233138746 0.8231
BNA 2013 0.2974 176426 296237996 0.7707
BNA 2014 0.3438 176284 298160483 0.7439
BNA 2015 0.3738 184421 313285771 0.8048
BOS 2009 0.3979 361379 835954035 0.7645
BOS 2010 0.4084 368851 817235460 0.7633
BOS 2011 0.4068 372697 806845332 0.7365
BOS 2012 0.4249 359633 780913850 0.8090
BOS 2013 0.4176 366485 866698830 0.7829
BOS 2014 0.4137 368307 910283225 0.7761
BOS 2015 0.4734 378013 875692471 0.7703
BUF 2009 0.4552 131617 249522780 0.7905
BUF 2010 0.4176 130843 278700319 0.7715
BUF 2011 0.5171 130252 292277342 0.7778
BUF 2012 0.5375 124168 293481759 0.7983
BUF 2013 0.4836 125160 291327803 0.7547
BUF 2014 0.4998 116247 294675727 0.7514
BUF 2015 0.5088 115601 299562419 0.7906
BWI 2009 0.4548 268016 469422716 0.8246
BWI 2010 0.1588 276457 471224991 0.7975
BWI 2011 0.2540 276203 484628795 0.8166
BWI 2012 0.2816 268006 488944549 0.8155
BWI 2013 0.2849 259773 493739798 0.7943
BWI 2014 0.1732 245121 487553717 0.7739
BWI 2015 0.2227 246460 489069099.6 0.8073
CLE 2009 0.3027 200272 373652671 0.8344
CLE 2010 0.3468 194005 380855675 0.8093
CLE 2011 0.3660 188296 369077012 0.7858
CLE 2012 0.4153 180962 356619999 0.8043
CLE 2013 0.4122 181340 362282830 0.7649
CLE 2014 0.4552 130762 370335804 0.7421
CLE 2015 0.4176 117773 393392936 0.7957

Profitability and Financial Performance Indicators in U.S. airports – A Preliminary Investigation Appendix 1 | 47
Appendix 1: The data used in this research:
A. Code Year PERF TOAL CARG ONTP
CLT 2009 0.5171 509464 391159184 0.8005
CLT 2010 0.5375 529107 404452776 0.8093
CLT 2011 0.4836 539842 397863057 0.7935
CLT 2012 0.4998 552515 349852877 0.8620
CLT 2013 0.5088 557955 353447052 0.8065
CLT 2014 0.4548 545294 360077450 0.8137
CLT 2015 0.4565 543944 356706455.8 0.8337
CMH 2009 0.3629 146439 0 0.8022
CMH 2010 0.3047 136086 0 0.7754
CMH 2011 0.2782 135377 0 0.7801
CMH 2012 0.2808 129450 0 0.8064
CMH 2013 0.2890 128187 0 0.7582
CMH 2014 0.2852 124119 0 0.7134
CMH 2015 0.3178 125727 0 0.7900
DAL 2009 0.2976 172962 0 0.8421
DAL 2010 0.3540 168544 0 0.8029
DAL 2011 0.3050 179198 0 0.8100
DAL 2012 0.2012 177608 0 0.8466
DAL 2013 0.2833 177417 0 0.7861
DAL 2014 0.0630 182949 0 0.7508
DAL 2015 0.3653 216099 0 0.8069
DEN 2009 0.3277 611888 1248170052 0.8077
DEN 2010 0.3185 635458 1237718352 0.8363
DEN 2011 0.3482 634684 1209106208 0.8215
DEN 2012 0.3786 618257 1204617700 0.8322
DEN 2013 0.3472 586860 1259729786 0.7681
DEN 2014 0.4187 575161 1314752910 0.7648
DEN 2015 0.3647 547648 1281721243 0.7980
DTW 2009 0.3613 432589 584958610 0.8186
DTW 2010 0.3011 452616 552232440 0.7779
DTW 2011 0.3104 443028 602804150 0.8143
DTW 2012 0.3605 427814 666139040 0.8490
DTW 2013 0.3155 425732 682197220 0.8286
DTW 2014 0.3161 392635 674728030 0.8229
DTW 2015 0.3254 379376 674504070 0.8280
EWR 2009 0.4461 415206 2928640538 0.6575
EWR 2010 0.4440 408821 2978995667 0.7189
EWR 2011 0.4649 417149 3049215532 0.6672
EWR 2012 0.4666 421175 2854009886 0.6944
EWR 2013 0.4535 419850 2533226761 0.7036
EWR 2014 0.4394 402281 2499283148 0.7024
EWR 2015 0.4769 416947 2577017218 0.7542
Profitability and Financial Performance Indicators in U.S. airports – A Preliminary Investigation Appendix 1 | 48
Appendix 1: The data used in this research:
A. Code Year PERF TOAL CARG ONTP
FLL 2009 0.3518 266979 501250900 0.7801
FLL 2010 0.3736 272293 475869850 0.7830
FLL 2011 0.3569 267119 425869500 0.7888
FLL 2012 0.3497 263309 447296904 0.8082
FLL 2013 0.3276 255661 446326310 0.7531
FLL 2014 0.3387 258394 508118870 0.7404
FLL 2015 0.3647 278005 483595964.8 0.7789
HNL 2009 0.2704 275487 2041210900 0.8484
HNL 2010 0.3692 265069 2123084700 0.8604
HNL 2011 0.3892 264820 2113941200 0.8800
HNL 2012 0.3331 278163 1976862300 0.8768
HNL 2013 0.3911 286897 2116335200 0.8481
HNL 2014 0.2889 311623 2189120700 0.8600
HNL 2015 0.3014 313348 2132111920 0.8343
IAH 2009 0.4075 538875 1567763301 0.8275
IAH 2010 0.4274 531983 1526026442 0.8229
IAH 2011 0.3442 528997 1616771558 0.8103
IAH 2012 0.3906 511034 1575814863 0.8001
IAH 2013 0.3869 505143 1704234283 0.7978
IAH 2014 0.3850 508940 1734461801 0.7676
IAH 2015 0.4229 502844 1696686910 0.7933
IND 2009 0.4040 171322 4575418342 0.8156
IND 2010 0.5678 166490 4717295655 0.7873
IND 2011 0.5491 159699 4813314835 0.7895
IND 2012 0.5611 158237 4940121920 0.8161
IND 2013 0.5689 154040 5268916355 0.7753
IND 2014 0.5633 151119 5355984715 0.7449
IND 2015 0.5784 154059 5324737760 0.8029
JAX 2009 0.3939 96009 422632970 0.7891
JAX 2010 0.3434 96558 407762063 0.8007
JAX 2011 0.3274 97952 395157580 0.7981
JAX 2012 0.2862 87962 389055455 0.8144
JAX 2013 0.3334 90149 391735430 0.7728
JAX 2014 0.3349 89902 395653090 0.7574
JAX 2015 0.3604 93109 401128446 0.7930
JFK 2009 0.3389 422244 3181559852 0.7351
JFK 2010 0.3817 404174 3923400051 0.7472
JFK 2011 0.3470 413601 3944502109 0.7534
JFK 2012 0.3737 409916 3494647375 0.8050
JFK 2013 0.3743 411776 3372770377 0.7503
JFK 2014 0.3286 431236 3170996874 0.7511
JFK 2015 0.3758 446644 3276081675 0.7643

Profitability and Financial Performance Indicators in U.S. airports – A Preliminary Investigation Appendix 1 | 49
Appendix 1: The data used in this research:
A. Code Year PERF TOAL CARG ONTP
LAS 2009 0.3520 511063 400011324 0.8292
LAS 2010 0.3554 505604 353579818 0.8259
LAS 2011 0.4280 531538 347384144 0.8261
LAS 2012 0.3470 528004 370201060 0.8446
LAS 2013 0.5202 520386 383879000 0.8040
LAS 2014 0.5291 522067 392745700 0.7783
LAS 2015 0.5404 524878 386463432 0.8130
MCO 2009 0.4347 306321 782467887 0.8089
MCO 2010 0.4458 314763 796032605 0.8081
MCO 2011 0.4404 317028 805685900 0.8061
MCO 2012 0.4363 308844 725505195 0.8258
MCO 2013 0.4474 298552 698556765 0.7936
MCO 2014 0.4553 297369 756120798 0.7675
MCO 2015 0.4443 314616 738484870.8 0.7918
MEM 2009 0.5415 339007 18928729202 0.8205
MEM 2010 0.5155 336017 19544635833 0.8175
MEM 2011 0.5157 311791 20303149106 0.8207
MEM 2012 0.5097 271321 20983699672 0.8622
MEM 2013 0.4909 234278 21891425638 0.8106
MEM 2014 0.5180 219853 22774592279 0.7345
MEM 2015 0.4706 219171 22679195919 0.7927
MIA 2009 0.3278 351417 6352786009 0.7576
MIA 2010 0.3466 376208 6905291871 0.7798
MIA 2011 0.3989 394572 6634448852 0.7976
MIA 2012 0.4890 391195 7147983325 0.8051
MIA 2013 0.4968 399140 6847177300 0.8197
MIA 2014 0.4882 402663 7192790882 0.8098
MIA 2015 0.4638 412915 7114706654 0.7884
MKE 2009 0.2103 169693 374141030 0.8083
MKE 2010 0.2328 192084 495159556 0.7902
MKE 2011 0.2246 173052 490424335 0.8068
MKE 2012 0.2295 133498 443125815 0.8354
MKE 2013 0.2153 119540 485371020 0.7714
MKE 2014 0.2765 113286 510090425 0.7318
MKE 2015 0.2058 111509 552959277 0.8075
MSP 2009 0.4876 432604 948064510 0.7894
MSP 2010 0.4638 435583 1024128613 0.7859
MSP 2011 0.4712 435076 968650986 0.8275
MSP 2012 0.4745 424928 875841084 0.8722
MSP 2013 0.4667 431573 732663072 0.8318
MSP 2014 0.4630 411760 972664080 0.8139
MSP 2015 0.5490 404374 905299279.2 0.8275

Profitability and Financial Performance Indicators in U.S. airports – A Preliminary Investigation Appendix 1 | 50
Appendix 1: The data used in this research:
A. Code Year PERF TOAL CARG ONTP
MSY 2009 0.2805 117075 349076170 0.8062
MSY 2010 0.2814 120221 345072218 0.8006
MSY 2011 0.3089 123140 322031610 0.8140
MSY 2012 0.3732 121303 302322482 0.8140
MSY 2013 0.3523 127753 295001650 0.7901
MSY 2014 0.4487 126167 296971410 0.7703
MSY 2015 0.4335 130132 310548264 0.8125
ORD 2009 0.3526 827899 3499701350 0.7924
ORD 2010 0.4156 882617 4895940100 0.7797
ORD 2011 0.3655 878798 4368420500 0.7548
ORD 2012 0.3346 878108 4555097891 0.7963
ORD 2013 0.4111 883287 6864249348 0.7352
ORD 2014 0.4139 881933 7541411779 0.6763
ORD 2015 0.0468 875136 6808716515 0.7695
PBI 2009 0.3191 138370 0 0.7626
PBI 2010 0.3062 141387 0 0.7685
PBI 2011 0.3679 143194 0 0.7779
PBI 2012 0.3822 136159 0 0.7951
PBI 2013 0.3936 135587 0 0.7520
PBI 2014 0.4054 139712 0 0.7324
PBI 2015 0.3405 144797 0 0.7622
PDX 2009 0.4484 226726 1089318211 0.8297
PDX 2010 0.4874 223068 1062285290 0.8373
PDX 2011 0.4765 219197 1134697344 0.8297
PDX 2012 0.4694 216195 1161531992 0.8459
PDX 2013 0.4755 209909 1137027109 0.8197
PDX 2014 0.4522 216253 1126448683 0.7961
PDX 2015 0.5184 218021 1135581030 0.8388
PHL 2009 0.2110 472668 2263373275 0.7462
PHL 2010 0.2857 460779 1987519867 0.7807
PHL 2011 0.2995 448129 1949469667 0.7616
PHL 2012 0.2483 443236 1883576381 0.8105
PHL 2013 0.2608 432884 1884230897 0.7596
PHL 2014 0.2244 419253 1927756545 0.7616
PHL 2015 0.2439 411368 1910215383 0.7813
PHX 2009 0.3299 457207 1220692246 0.8393
PHX 2010 0.3265 449351 1213458732 0.8511
PHX 2011 0.3383 461989 1239062238 0.8491
PHX 2012 0.4204 450204 1300826546 0.8649
PHX 2013 0.2893 436184 1375903366 0.8379
PHX 2014 0.3230 430461 1436921968 0.8077
PHX 2015 0.3285 440411 1397499163 0.8267
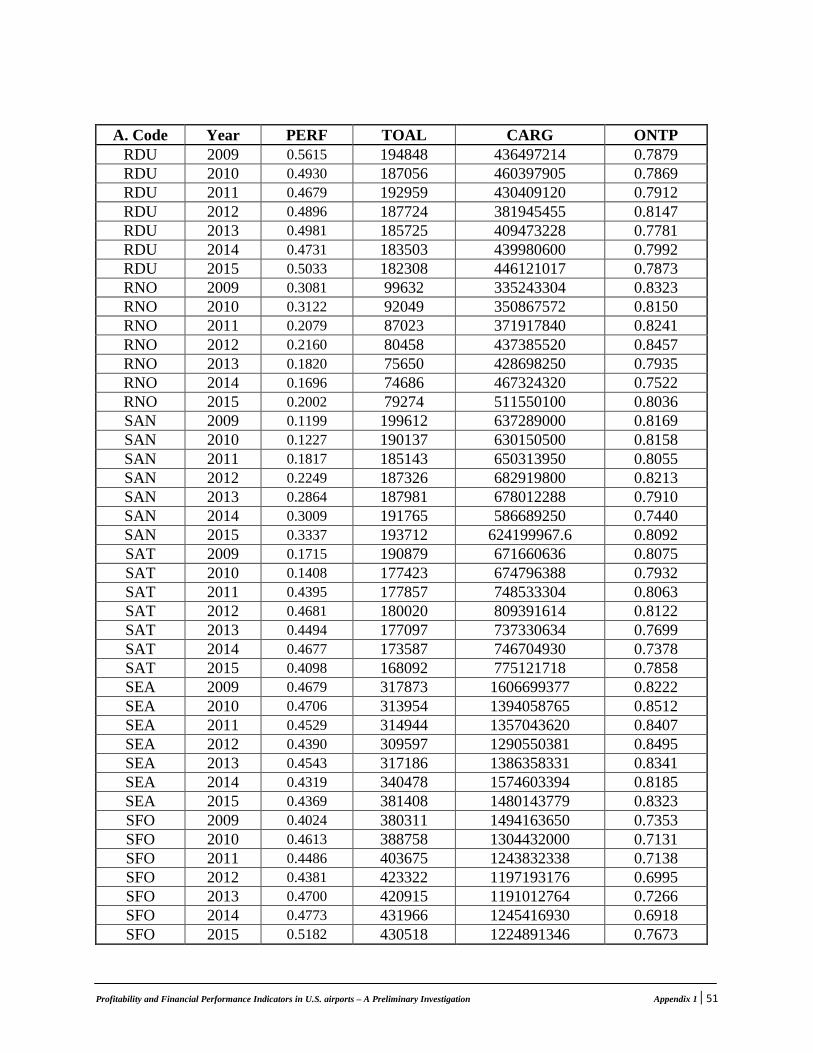
Profitability and Financial Performance Indicators in U.S. airports – A Preliminary Investigation Appendix 1 | 51
Appendix 1: The data used in this research:
A. Code Year PERF TOAL CARG ONTP
RDU 2009 0.5615 194848 436497214 0.7879
RDU 2010 0.4930 187056 460397905 0.7869
RDU 2011 0.4679 192959 430409120 0.7912
RDU 2012 0.4896 187724 381945455 0.8147
RDU 2013 0.4981 185725 409473228 0.7781
RDU 2014 0.4731 183503 439980600 0.7992
RDU 2015 0.5033 182308 446121017 0.7873
RNO 2009 0.3081 99632 335243304 0.8323
RNO 2010 0.3122 92049 350867572 0.8150
RNO 2011 0.2079 87023 371917840 0.8241
RNO 2012 0.2160 80458 437385520 0.8457
RNO 2013 0.1820 75650 428698250 0.7935
RNO 2014 0.1696 74686 467324320 0.7522
RNO 2015 0.2002 79274 511550100 0.8036
SAN 2009 0.1199 199612 637289000 0.8169
SAN 2010 0.1227 190137 630150500 0.8158
SAN 2011 0.1817 185143 650313950 0.8055
SAN 2012 0.2249 187326 682919800 0.8213
SAN 2013 0.2864 187981 678012288 0.7910
SAN 2014 0.3009 191765 586689250 0.7440
SAN 2015 0.3337 193712 624199967.6 0.8092
SAT 2009 0.1715 190879 671660636 0.8075
SAT 2010 0.1408 177423 674796388 0.7932
SAT 2011 0.4395 177857 748533304 0.8063
SAT 2012 0.4681 180020 809391614 0.8122
SAT 2013 0.4494 177097 737330634 0.7699
SAT 2014 0.4677 173587 746704930 0.7378
SAT 2015 0.4098 168092 775121718 0.7858
SEA 2009 0.4679 317873 1606699377 0.8222
SEA 2010 0.4706 313954 1394058765 0.8512
SEA 2011 0.4529 314944 1357043620 0.8407
SEA 2012 0.4390 309597 1290550381 0.8495
SEA 2013 0.4543 317186 1386358331 0.8341
SEA 2014 0.4319 340478 1574603394 0.8185
SEA 2015 0.4369 381408 1480143779 0.8323
SFO 2009 0.4024 380311 1494163650 0.7353
SFO 2010 0.4613 388758 1304432000 0.7131
SFO 2011 0.4486 403675 1243832338 0.7138
SFO 2012 0.4381 423322 1197193176 0.6995
SFO 2013 0.4700 420915 1191012764 0.7266
SFO 2014 0.4773 431966 1245416930 0.6918
SFO 2015 0.5182 430518 1224891346 0.7673

Profitability and Financial Performance Indicators in U.S. airports – A Preliminary Investigation Appendix 1 | 52
Appendix 1: The data used in this research:
A. Code Year PERF TOAL CARG ONTP
SJC 2009 0.1318 158489 372125502 0.8404
SJC 2010 0.1529 138300 311053456 0.8197
SJC 2011 0.2998 137184 302463179 0.8303
SJC 2012 0.4304 134947 256343848 0.8601
SJC 2013 0.4912 138854 245152668 0.8116
SJC 2014 0.4928 142211 244687656 0.7768
SJC 2015 0.5096 148669 244737142 0.8163
SLC 2009 0.2553 372680 898534081 0.8510
SLC 2010 0.2557 365579 848125292 0.8268
SLC 2011 0.2581 358964 856301628 0.8336
SLC 2012 0.2846 328966 876163077 0.8855
SLC 2013 0.2973 330396 934455550 0.8504
SLC 2014 0.3101 325479 962293488 0.8557
SLC 2015 0.4238 311767 939499818.2 0.8691
SMF 2009 0.2866 130920 275226170 0.8285
SMF 2010 0.3572 123014 270440150 0.8012
SMF 2011 0.2928 117550 278496500 0.8146
SMF 2012 0.3340 115829 287776900 0.8367
SMF 2013 0.4095 108990 291228750 0.8075
SMF 2014 0.4628 108080 287806700 0.7615
SMF 2015 0.4973 108037 285329550 0.8056
TPA 2009 0.5377 200621 318581850 0.8130
TPA 2010 0.4226 195705 317256930 0.8096
TPA 2011 0.4338 191315 314706228 0.8162
TPA 2012 0.4482 188295 311542418 0.8282
TPA 2013 0.4445 186557 374054404 0.7875
TPA 2014 0.4380 184038 395335682 0.7678
TPA 2015 0.4449 189887 374320773.6 0.8027
TUS 2009 0.3244 178632 162668750 0.8188
TUS 2010 0.4106 164859 150584844 0.8138
TUS 2011 0.4114 154360 149719444 0.7981
TUS 2012 0.4121 145111 159532800 0.8227
TUS 2013 0.3428 139933 159362254 0.7885
TUS 2014 0.3342 137897 154876980 0.7391
TUS 2015 0.3253 143435 159073280 0.7940

Profitability and Financial Performance Indicators in U.S. airports – A Preliminary Investigation Appendix 1 | 53
Appendix 1: The data used in this research:
A. Code Year SIZE UTIL PAXF DEBT
DFW 2009 1 104.4621983 83.48383016 -3,779,660,000
DFW 2010 1 105.3381727 83.0979643 -3,759,220,000
DFW 2011 1 102.5988758 85.09038455 -4,005,220,000
DFW 2012 1 103.9153592 86.20787419 -4,561,875,000
DFW 2013 1 108.1181115 85.65074131 -5,963,945,000
DFW 2014 1 113.3444118 90.62565679 -6,316,090,000
DFW 2015 1 117.2224727 87.76356374 -6,232,745,000
IAD 2009 1 93.70155043 60.90019011 -3,528,252,434
IAD 2010 1 95.83390047 60.65869107 -3,607,647,700
IAD 2011 1 93.06761202 61.06980705 -3,868,051,680
IAD 2012 1 75.82755232 63.92827126 -3,805,897,899
IAD 2013 1 61.59491625 63.21381245 -3,694,137,235
IAD 2014 1 60.74911237 66.23561581 -3,679,617,230
IAD 2015 1 60.66365498 71.41628659 -3,706,953,632
LAX 2009 1 129.0035726 100.7277349 -1,131,383,551
LAX 2010 1 131.9706548 100.2292497 -2,668,301,000
LAX 2011 1 135.1255951 101.1032634 -3,667,375,000
LAX 2012 1 123.9382438 103.4758142 -3,669,574,000
LAX 2013 1 125.7963337 105.4642887 -3,752,096,000
LAX 2014 1 132.991788 107.7866299 -3,924,810,000
LAX 2015 1 139.4008334 101.8759336 -4,157,083,000
ABQ 2009 0 107.6348355 36.35672968 -191,326,000
ABQ 2010 0 103.9857379 36.11917046 -165,783,000
ABQ 2011 0 100.0466076 35.9210458 -136,356,412
ABQ 2012 0 108.5102252 35.61471393 -117,978,333
ABQ 2013 0 90.72173585 36.19447102 -98,091,667
ABQ 2014 0 86.39607477 36.19900207 -94,870,417
ABQ 2015 0 83.22521617 37.42644785 -54,418,750
ANC 2009 0 103.9857379 17.78941052 -582,892,516
ANC 2010 0 45.84743296 17.70381908 -562,006,156
ANC 2011 0 47.72527792 17.2335247 -593,596,935
ANC 2012 0 47.17748995 16.60326129 -579,579,484
ANC 2013 0 41.42724212 17.58788154 -565,028,824
ANC 2014 0 43.03095483 17.19661674 -513,684,513
ANC 2015 0 44.84982699 18.12729113 -497,155,400
ATL 2009 1 164.5812281 87.15386629 -2,381,145,000
ATL 2010 1 163.1314235 90.78985895 -2,382,692,000
ATL 2011 1 167.7605184 96.13539742 -3,171,480,000
ATL 2012 1 151.1914345 98.48194061 -3,195,266,000
ATL 2013 1 149.4777512 99.46153002 -3,167,584,000
ATL 2014 1 152.2441934 107.3387228 -3,102,242,000
ATL 2015 1 156.2811168 104.6667146 -2,978,917,000

Profitability and Financial Performance Indicators in U.S. airports – A Preliminary Investigation Appendix 1 | 54
Appendix 1: The data used in this research:
A. Code Year SIZE UTIL PAXF DEBT
AUS 2009 0 129.9891349 46.15217117 -336,470,587
AUS 2010 0 137.493405 47.49353923 -337,111,480
AUS 2011 0 138.6993358 50.32196267 -323,237,881
AUS 2012 0 143.2836154 53.48395337 -281,041,491
AUS 2013 0 151.6081765 55.48873176 -326,208,159
AUS 2014 0 161.7719911 57.21531447 -310,576,368
AUS 2015 0 177.7640202 60.64617428 -538,361,072
BNA 2009 0 117.0089394 50.39446621 -216,260,391
BNA 2010 0 117.6314518 50.87986914 -290,775,000
BNA 2011 0 111.7748537 53.48265522 -258,787,000
BNA 2012 0 115.5898415 55.38675226 -231,111,708
BNA 2013 0 119.4324146 57.25900944 -206,503,268
BNA 2014 0 126.1914268 61.2302648 -177,941,116
BNA 2015 0 133.1625854 61.97998059 -148,094,233
BOS 2009 1 95.12449159 69.54912709 -1,590,870,000
BOS 2010 1 100.0976447 73.53546012 -1,502,695,000
BOS 2011 1 106.3533024 76.09790259 -1,716,770,000
BOS 2012 1 109.331266 79.49045277 -1,657,935,000
BOS 2013 1 109.7805778 80.8226967 -1,677,705,000
BOS 2014 1 114.6998997 84.20997157 -1,663,270,000
BOS 2015 1 120.6828417 80.02532294 -259,273,947
BUF 2009 0 133.1625854 40.38181998 -182,756,617
BUF 2010 0 95.12449159 39.78765391 -185,925,307
BUF 2011 0 100.0976447 39.65539109 -175,989,493
BUF 2012 0 106.3533024 41.76003479 -165,586,295
BUF 2013 0 121.054713 41.0289869 -155,039,664
BUF 2014 0 760.1965606 40.83492907 -144,140,233
BUF 2015 0 725.1674195 40.42233199 -132,419,976
BWI 2009 1 110.5522127 77.15173721 -627,850,000
BWI 2010 1 119.4952554 78.48333014 -598,815,000
BWI 2011 1 120.0374613 80.13902094 -567,920,000
BWI 2012 1 120.4749041 83.47905644 -576,410,000
BWI 2013 1 91.87753301 85.7112248 -685,050,000
BWI 2014 1 118.676145 89.9327271 -640,800,000
BWI 2015 1 121.054713 89.89008358 -646,275,000
CLE 2009 0 111.8484528 46.97939802 -838,924,146
CLE 2010 0 105.4606511 47.32967707 -824,865,753
CLE 2011 0 101.1563248 46.74590007 -874,539,458
CLE 2012 0 98.98985771 48.04258353 -856,702,115
CLE 2013 0 99.99656935 48.2568435 -815,524,999
CLE 2014 0 84.02491251 56.38205289 -815,524,999
CLE 2015 0 89.19753868 66.51646812 -782,369,999

Profitability and Financial Performance Indicators in U.S. airports – A Preliminary Investigation Appendix 1 | 55
Appendix 1: The data used in this research:
A. Code Year SIZE UTIL PAXF DEBT
CLT 2009 1 250.9050246 67.38602139 -677,971,000
CLT 2010 1 252.9882783 70.41744297 -771,330,000
CLT 2011 1 278.4368158 70.47445364 -748,489,000
CLT 2012 1 266.2436372 72.51863207 -917,858,000
CLT 2013 1 237.4989416 76.51728544 -902,743,000
CLT 2014 1 258.057796 78.99490917 -879,493,000
CLT 2015 1 259.0224307 77.9444884 -737,782,000
CMH 2009 0 76.27219811 42.29085148 -119,674,774
CMH 2010 0 80.93460258 46.23491028 -94,705,000
CMH 2011 0 80.60648047 46.30593084 -90,690,000
CMH 2012 0 76.27219811 47.82657397 -101,485,000
CMH 2013 0 75.19529444 47.80238246 -104,458,248
CMH 2014 0 76.47203227 50.20183856 -119,225,774
CMH 2015 0 81.36570817 52.69347077 -110,726,893
DAL 2009 0 103.496102 42.50483921 -26,108,750
DAL 2010 0 98.2466705 44.89518464 -28,433,750
DAL 2011 0 95.71806052 43.00143975 -20,223,000
DAL 2012 0 97.17930586 43.94653394 -468,499,000
DAL 2013 0 99.02185103 45.35956532 -15,985,904
DAL 2014 0 103.496102 49.43826968 -452,612,176
DAL 2015 0 161.9635316 65.1641146 -574,547,000
DEN 2009 1 98.1123332 78.49040674 -4,169,346,555
DEN 2010 1 102.1349371 79.44494207 -4,006,974,297
DEN 2011 1 103.3568186 80.88276686 -3,799,335,245
DEN 2012 1 100.8566456 83.45992362 -3,929,985,787
DEN 2013 1 98.97628119 86.89256381 -4,447,198,738
DEN 2014 1 100.9179823 90.41152303 -4,302,445,672
DEN 2015 1 101.9184406 94.43912805 -4,071,742,061
DTW 2009 1 109.0659868 70.32727138 -2,180,829,376
DTW 2010 1 110.5826918 69.12654436 -2,113,089,070
DTW 2011 1 107.3522368 70.95201658 -2,027,545,438
DTW 2012 1 107.1016579 72.92832399 -2,181,711,693
DTW 2013 1 106.7629258 73.67791474 -2,098,574,851
DTW 2014 1 107.7909019 80.359321 -2,180,541,170
DTW 2015 1 109.3446374 82.8847634 -273,292,201
EWR 2009 1 100.730562 80.24662938 0
EWR 2010 1 96.83245757 81.07095281 0
EWR 2011 1 98.7090048 80.61432246 0
EWR 2012 1 99.44450205 80.99242833 0
EWR 2013 1 102.3081823 83.58464213 0
EWR 2014 1 103.2253572 88.36313423 0
EWR 2015 1 109.275747 84.3490554 0

Profitability and Financial Performance Indicators in U.S. airports – A Preliminary Investigation Appendix 1 | 56
Appendix 1: The data used in this research:
A. Code Year SIZE UTIL PAXF DEBT
FLL 2009 1 147.8176838 76.84587926 -771,131,000
FLL 2010 1 154.4226843 79.54526925 -735,604,390
FLL 2011 1 164.8231403 84.84956892 -685,445,039
FLL 2012 1 159.8944348 86.93286595 -1,203,525,000
FLL 2013 1 147.7888837 90.26124438 -1,181,220,000
FLL 2014 1 165.290599 93.12801381 -1,568,955,000
FLL 2015 1 180.9002513 85.00397187 -1,526,375,000
HNL 2009 1 52.15186356 63.44683415 -721,684,606
HNL 2010 1 52.94091324 65.94567452 -1,187,356,232
HNL 2011 1 49.34810526 65.62721094 -1,162,376,679
HNL 2012 1 50.48423301 66.33411345 -1,170,339,611
HNL 2013 1 53.60325616 65.99577549 -1,151,790,657
HNL 2014 1 53.98602986 60.7336429 -1,313,736,401
HNL 2015 1 53.89742412 60.10166716 -1,420,816,570
IAH 2009 1 102.4436424 71.59448481 -18,081,706,212
IAH 2010 1 103.9791276 73.41825209 -1,965,029,098
IAH 2011 1 99.29385347 72.99345743 -1,912,425,931
IAH 2012 1 99.05061629 74.51167633 -1,882,614,781
IAH 2013 1 83.28045573 75.03950367 -1,834,449,567
IAH 2014 1 84.89751929 77.6990883 -1,825,460,398
IAH 2015 1 88.72333764 77.40619437 -1,894,947,834
IND 2009 0 66.96673065 43.57331808 -1,439,605,512
IND 2010 0 67.51115855 44.79185537 -1,337,990,958
IND 2011 0 67.08437982 45.96642434 -1,297,984,680
IND 2012 0 63.63023393 45.32975221 -1,210,824,662
IND 2013 0 62.82564314 45.89736432 -1,142,210,328
IND 2014 0 64.13363353 47.72276153 -1,080,189,160
IND 2015 0 69.38561587 50.49451184 -1,021,056,134
JAX 2009 0 91.21821931 57.84959743 -218,885,000
JAX 2010 0 89.51918925 57.07904058 -209,880,000
JAX 2011 0 87.87095995 55.13953773 -200,480,000
JAX 2012 0 77.24515747 58.63948068 -183,860,000
JAX 2013 0 75.22931456 56.5523744 -157,035,000
JAX 2014 0 76.04706928 57.60045383 -150,645,000
JAX 2015 0 79.33842164 58.35038503 -92,403,000
JFK 2009 1 88.17306657 107.5694243 -947,912,000
JFK 2010 1 86.54756932 113.4860085 -1,688,430,000
JFK 2011 1 88.84561236 114.4331469 -1,643,462,000
JFK 2012 1 91.3167257 119.6390529 -1,596,029,000
JFK 2013 1 93.43389336 121.6018321 -1,545,471
JFK 2014 1 97.61862564 121.7195596 -1,491,938,000
JFK 2015 1 104.3210298 114.8942988 -1,435,938,953

Profitability and Financial Performance Indicators in U.S. airports – A Preliminary Investigation Appendix 1 | 57
Appendix 1: The data used in this research:
A. Code Year SIZE UTIL PAXF DEBT
LAS 2009 1 134.5318019 76.10001898 -3,123,165,000
LAS 2010 1 129.3199809 75.14472987 -4,806,645,000
LAS 2011 1 124.6002231 74.7740218 -4,705,855,000
LAS 2012 1 121.4625136 75.60416588 -4,514,590,000
LAS 2013 1 120.9861219 76.65916839 -4,473,605,000
LAS 2014 1 122.6459137 78.99464245 -4,374,835,000
LAS 2015 1 127.0610305 77.55445951 -4,287,115,000
MCO 2009 1 55.63553441 106.887977 -1,225,336,000
MCO 2010 1 56.72897937 108.128916 -1,318,503,000
MCO 2011 1 57.19949729 108.8258135 -1,238,129,000
MCO 2012 1 57.0697546 111.120352 -1,151,425,000
MCO 2013 1 56.09594358 113.1094349 -1,118,023,000
MCO 2014 1 56.53495171 116.2098807 -1,022,850,000
MCO 2015 1 60.73866252 109.1867864 -1,010,470,000
MEM 2009 0 102.4149673 29.81762029 -111,504,000
MEM 2010 0 104.9347498 29.34931864 -65,992,000
MEM 2011 0 99.31782138 27.866186 -490,350,000
MEM 2012 0 81.40388042 24.76526329 -477,775,000
MEM 2013 0 57.78219008 19.64335533 -451,259,000
MEM 2014 0 40.6882535 16.37701555 -422,474,000
MEM 2015 0 37.11289062 17.09821099 -353,927,000
MIA 2009 1 70.12161144 92.12854244 -5,189,004,000
MIA 2010 1 41.89448014 90.46938927 -6,365,488,430
MIA 2011 1 42.11491317 92.97242582 -6,298,185,000
MIA 2012 1 44.33751571 97.07428776 -6,231,644,000
MIA 2013 1 45.00971862 97.30966077 -6,157,470,000
MIA 2014 1 45.6386769 96.71346014 -6,091,656,000
MIA 2015 1 48.04573827 93.7936137 -6,082,900,000
MKE 2009 0 137.9611458 45.05244176 -187,854,159
MKE 2010 0 170.9787674 49.56342017 -205,068,973
MKE 2011 0 165.3204167 53.99505351 -196,567,006
MKE 2012 0 128.3487847 55.58710992 -187,898,373
MKE 2013 0 111.0613021 53.7863644 -226,182,586
MKE 2014 0 111.4102257 56.9992232 -213,778,867
MKE 2015 0 110.7925868 57.93069618 -202,920,000
MSP 2009 1 108.9806903 71.89580309 -1,736,724,000
MSP 2010 1 109.8790473 71.22631967 -1,784,005,000
MSP 2011 1 110.8127608 73.07069569 -1,529,957,000
MSP 2012 1 102.9237251 75.04272724 -1,529,883,000
MSP 2013 1 106.039771 75.44881167 -1,489,995,000
MSP 2014 1 110.6246135 82.43966388 -1,347,870,000
MSP 2015 1 115.1995923 82.24341525 -1,304,180,000

Profitability and Financial Performance Indicators in U.S. airports – A Preliminary Investigation Appendix 1 | 58
Appendix 1: The data used in this research:
A. Code Year SIZE UTIL PAXF DEBT
MSY 2009 0 82.77482754 66.91003203 -340,384,354
MSY 2010 0 87.19592045 68.02287454 -374,368,794
MSY 2011 0 86.96672824 69.11500731 -367,256,434
MSY 2012 0 87.07469455 70.79171991 -360,480,631
MSY 2013 0 92.87944932 71.64667757 -350,773,259
MSY 2014 0 98.91419808 77.20828743 -362,953,618
MSY 2015 0 108.1968349 81.91238127 -978,158,698
ORD 2009 1 126.6765783 75.21625706 -5,934,803,965
ORD 2010 1 131.8469095 72.90100009 -6,618,221,098
ORD 2011 1 131.3883599 72.5816422 -7,499,268,000
ORD 2012 1 126.3311407 73.27525771 -7,329,196,370
ORD 2013 1 144.9052336 73.17629491 -7,889,260,724
ORD 2014 1 151.9190414 76.74829267 -7,706,504,523
ORD 2015 1 163.3214199 75.8830207 -7,840,664,039
PBI 2009 0 116.4211932 43.42091494 -146,855,000
PBI 2010 0 112.7303656 41.84848678 -140,501,846
PBI 2011 0 110.395879 40.1854547 -132,456,835
PBI 2012 0 105.980356 41.07490507 -122,292,688
PBI 2013 0 94.09228786 41.95840309 -111,195,723
PBI 2014 0 96.50467884 41.8896301 -99,542,540
PBI 2015 0 102.1645379 43.00629157 -87,034,357
PDX 2009 1 91.31442556 56.72149643 -674,636,020
PDX 2010 1 90.56549646 59.01543027 -648,861,998
PDX 2011 1 92.19942062 62.12207284 -685,235,507
PDX 2012 1 95.43791532 66.07571868 -685,742,616
PDX 2013 1 101.0576814 71.00794154 -649,278,764
PDX 2014 1 106.7638298 72.86613365 -618,780,580
PDX 2015 1 110.695557 70.14278991 -673,384,192
PHL 2009 1 136.6973939 63.48202544 -1,271,210,000
PHL 2010 1 105.3657335 64.89555297 -1,232,700,000
PHL 2011 1 103.443272 66.42364141 -1,440,930,000
PHL 2012 1 100.9699941 65.83101102 -1,366,920,000
PHL 2013 1 96.92118119 68.04568891 -1,355,055,000
PHL 2014 1 96.95078042 70.5652148 -1,295,965,000
PHL 2015 1 97.33886796 71.65778476 -1,361,515,000
PHX 2009 1 116.3358827 81.18706407 -1,140,349,439
PHX 2010 1 115.0574351 84.15323878 -1,218,020,663
PHX 2011 1 118.6651078 85.50119592 -1,734,881,544
PHX 2012 1 120.7002821 86.89780633 -1,708,966,118
PHX 2013 1 120.0257107 89.52693817 -1,741,924,410
PHX 2014 1 121.557386 94.52594776 -1,523,990,000
PHX 2015 1 127.8985433 90.93376868 -1,499,660,000

Profitability and Financial Performance Indicators in U.S. airports – A Preliminary Investigation Appendix 1 | 59
Appendix 1: The data used in this research:
A. Code Year SIZE UTIL PAXF DEBT
RDU 2009 0 149.406731 45.52906881 -734,285
RDU 2010 0 112.2306381 47.74758361 -719,140,000
RDU 2011 0 79.8995518 46.25343208 -713,200,000
RDU 2012 0 78.70686023 47.84016961 -696,410,000
RDU 2013 0 79.27829512 48.26508009 -679,005,000
RDU 2014 0 78.57107197 50.94051868 -660,905,000
RDU 2015 0 82.67967602 54.35565088 -642,015,000
RNO 2009 0 114.0384902 36.71145817 -52,533,163
RNO 2010 0 93.77266819 40.35867853 -40,104,750
RNO 2011 0 89.89669634 41.85217701 -46,023,459
RNO 2012 0 84.22875432 41.8934848 -39,222,555
RNO 2013 0 80.05669728 44.20161269 -44,819,814
RNO 2014 0 75.48514456 43.15593284 -40,995,042
RNO 2015 0 75.03175423 42.1292227 -32,785,430
SAN 2009 1 221.9973736 84.70286356 -131,658,000
SAN 2010 1 219.9661292 88.67825831 -208,714,000
SAN 2011 1 218.8212456 91.45020876 -660,342,456
SAN 2012 1 223.0482122 92.7433565 -654,181,983
SAN 2013 1 208.1281401 94.46456823 -17,078,380,188
SAN 2014 1 214.5471422 97.33947279 -1,372,781,591
SAN 2015 1 229.4276058 94.08781903 -1,356,489,291
SAT 2009 0 132.9464104 39.7312224 -360,380,000
SAT 2010 0 135.3209163 44.14670026 -379,025,000
SAT 2011 0 133.0517909 44.89341437 -406,300,000
SAT 2012 0 135.4184084 44.84640595 -379,665,000
SAT 2013 0 133.9941053 45.23932082 -361,550,000
SAT 2014 0 135.3287916 46.62625657 -342,885,000
SAT 2015 0 136.2618611 48.68088904 -488,880,000
SEA 2009 1 107.7231887 96.09556018 -2,715,539,043
SEA 2010 1 108.8464333 98.14331399 -3,198,409,113
SEA 2011 1 113.2268781 101.4254979 -2,647,167,668
SEA 2012 1 110.9110627 104.1426306 -2,540,050,451
SEA 2013 1 115.0351851 105.2397962 -2,447,172,674
SEA 2014 1 123.3760683 105.0762751 -2,352,940,601
SEA 2015 1 139.1799726 90.69097449 -2,518,431,343
SFO 2009 1 87.78682411 97.12003071 -3,984,910,000
SFO 2010 1 89.54576074 99.59410739 -4,375,550,000
SFO 2011 1 88.58323404 99.36987923 -4,240,690,000
SFO 2012 1 85.75717458 100.5581378 -4,062,265,000
SFO 2013 1 89.83000767 103.1306843 -3,698,442,000
SFO 2014 1 93.28868787 105.4285893 -4,453,425,000
SFO 2015 1 97.67543803 103.4114355 -4,536,390,000

Profitability and Financial Performance Indicators in U.S. airports – A Preliminary Investigation Appendix 1 | 60
Appendix 1: The data used in this research:
A. Code Year SIZE UTIL PAXF DEBT
SJC 2009 0 170.0881536 51.78698837 -1,373,196,000
SJC 2010 0 93.12932419 58.65751265 -1,455,338,000
SJC 2011 0 93.86905495 59.8904537 -1,435,949,000
SJC 2012 0 93.91597664 60.4334146 -1,468,332,000
SJC 2013 0 90.60543428 62.16369712 -1,452,335,000
SJC 2014 0 96.60737741 64.98798265 -142,583,900
SJC 2015 0 102.2793343 64.87539433 -1,375,052,000
SLC 2009 1 195.3686045 53.14919502 0
SLC 2010 1 205.2090103 54.21806504 0
SLC 2011 1 193.1377421 54.05420042 0
SLC 2012 1 188.1129804 58.24212837 0
SLC 2013 1 187.0393396 58.5240015 0
SLC 2014 1 192.2606429 62.30242197 0
SLC 2015 1 202.6109885 63.72076968 0
SMF 2009 0 94.62193017 68.14237702 -559,630,572
SMF 2010 0 91.33470684 71.93130863 -1,026,535,309
SMF 2011 0 89.87304507 74.36656742 -1,139,939,316
SMF 2012 0 102.1892677 75.24711428 -1,121,481,336
SMF 2013 0 100.9263386 78.08321864 -1,099,795,640
SMF 2014 0 99.95498535 81.13649149 -1,068,708,463
SMF 2015 0 105.9625073 87.27989485 -1,041,278,088
TPA 2009 1 93.06253408 82.37715892 -817,260,000
TPA 2010 1 90.54695645 83.15803889 -777,560,000
TPA 2011 1 88.87061896 85.45272456 -733,143,335
TPA 2012 1 89.19961397 87.29373589 -700,923,335
TPA 2013 1 89.67185012 88.63513028 -659,372,535
TPA 2014 1 91.66564524 92.71521099 -590,067,927
TPA 2015 1 97.61832348 88.64413467 -1,219,658,527
TUS 2009 0 75.74417774 20.10316181 -98,360,000
TUS 2010 0 88.32637996 22.37339787 -88,025,000
TUS 2011 0 84.66745249 23.05881057 -71,770,000
TUS 2012 0 82.63230461 23.57710994 -65,240,000
TUS 2013 0 75.74417774 22.43833835 -58,385,000
TUS 2014 0 74.81821213 23.16579766 -55,930,000
TUS 2015 0 74.01502596 21.60216126 -53,345,000