Embed Size (px)
Citation preview
United States Department of Agriculture
Indicators of the U.S. Biobased Economy
Jay S. Golden, Robert Handfield, Janire Pascual-Gonzalez, Ben Agsten, Taylor Brennan, Lina Khan and Emily True
Office of the Chief Economist March 2018
2
March 2018
EXECUTIVE SUMMARY The biobased economy is playing an increasingly important role in the American economy. Through innovations in renewable energies and the emergence of a new generation of biobased products, the sectors that drive the biobased economy are providing job creation and economic growth. To further understand and analyze trends in the biobased economy, this report compares 2011 and 2016 report data.
Bioenergy
• Ethanol production in the United States surpassed 14.7 billion gallons in 2015. This compares to just 175 million in 1980.
• The number of ethanol plants in the United States continues to see modest growth, increasing to 199 plants in 2016 with 3 new facilities under construction. This accounts for over 270,000 American jobs.
• Biodiesel production reached 1.26 billion gallons in 2015 as compared to 343 million gallons in 2010.
• During the period of 2005 to 2012, soybean used for biodiesel increased from 0.67 billion pounds to 4.1 billion pounds.
• Wood pellets manufactured primarily in the Southeastern United States have become an important component of the bioenergy sector. Driven by commitments by countries outside of the United States to meet greenhouse gas reduction goals in the electricity-generating sector, the United States has established itself as the largest exporter of wood pellets. The United States exported over 4.6 billion kilograms (kg) of wood pellets, which is the global leader by almost 3.0 billion kg over the second-largest exporter.
Renewable Chemicals and Biobased Products
• The BioPreferred program catalogs a product as a biobased product if it derives from plants and other renewable agriculture, marine, and forestry materials, and does not include fuels, food, or animal feed.
• The number of renewable chemicals and biobased products that are USDA “certified” as BioPreferred has rapidly increased from 1,800 in 2014 to 2,900 in 2016.
• It is estimated that the overall number of biobased products in the United States marketplace was greater than 40,000 in 2014, up from 17,000 in 2008.
• The number of jobs contributed to the United States economy by the United States biobased products industry in 2014 was 4.22 million.
• The value-added contribution to the United States economy from the United States biobased products industry in 2014 was $393 billion.
Government Advisory Council
• Harry Baumes, Ph.D., Council Advisory Chair. Director, Office of Energy Policy and New Uses. United States Department of Agriculture, Office of the Chief Economist.
• Marie Wheat, Industry Economist, BioPreferred Program. United States Department of Agriculture.
• Rafael, Nieves, Allegheny Science & Technology.
3
March 2018
• David Simpson, Director of Ecosystem Studies, United States Environmental Protection Agency.
• Mohan Gupta, Ph.D., Assistant Chief Scientist at Federal Aviation Administration.
• Kristen Johnson, Sustainability Technology Manager, Bioenergy Technologies Office, United States Department of Energy.
This project was supported through a cooperative agreement (58-0111-16-019) issued by the Office of the Chief Economist of the United States Department of Agriculture.
HOW TO CITE THIS REPORT Golden, J.S., Handfield, R., Pascual-Gonzalez, J., Agsten, B., Brennan, T., Khan, L., and E. True. Indicators of the U.S. Biobased Economy, U.S. Department of Agriculture, Office of Energy Policy and New Uses, Office of the Chief Economist, 2018.
ABOUT THE AUTHORS Jay S. Golden, Ph.D.
Since June of 2017, Golden has been a professor of engineering with a secondary appointment in Supply Chain at East Carolina University (ECU), where he also serves as the Vice Chancellor of Research, Economic Development and Engagement. Prior to joining ECU, Golden served as faculty
chair of the Business and Environment Program and Director of the Duke Center for Sustainability and Commerce at Duke University. His research covers sustainable systems and production consumption systems of Earth resources using systems and lifecycle modeling. Golden received his Ph.D. in engineering from the University of Cambridge and his master's degree in Environmental Engineering and Sustainable Development from a joint program of the Massachusetts Institute of Technology and the University of Cambridge. He also holds a Professional Mastery of Project Management Certificate from Stanford University, an MLE in Higher Education from Harvard, and has a B.A. degree in Management. He can be reached at [email protected] Robert Handfield, Ph.D.
Robert Handfield is the Bank of America University Distinguished Professor of Supply Chain Management at North Carolina State University and Director of the Supply Chain Resource Cooperative. He also serves as Faculty Lead for the Manufacturing Analytics Group within the International Institute of
Analytics, and he is on the Faculty for the Operations Research Curriculum at N.C. State University. Handfield is the Consulting Editor of the Journal of Operations
Management, one of the leading supply chain management journals in the field, and he has written several books on supply chain management. In 2013, he led a global study on Global Logistics Trends and Strategies for BVL International and wrote a report entitled “Future Buy: The Future of Procurement,” which was published by Klynveld Peat Marwick Goerdeler (KPMG).

4
March 2018
Janire Pascual-Gonzalez, Ph.D. Janire Pascual-Gonzalez received her chemical engineering degree and her master’s degree in chemical engineering and processes in 2011 from the Universitat Rovira i Virgili (URV) of Tarragona (Spain). In 2015, she received her Ph.D. in Chemical, Environmental and Processes Engineering at
Universitat Rovira i Virgili (URV) of Tarragona (Spain). Since September of 2017, Janire Pascual-Gonzalez is a postdoctoral scholar in the Division of Research, Economic Development and Engagement at East Carolina University (ECU). Her research focuses on the development of systematic methods to assess and optimize consumption production systems from a sustainable perspective. She can be reached at [email protected] Graduate Student Research Team Ben Agsten, Taylor Brennan, Lina Khan, and Emily True are all graduate students at Duke University, Durham, North Carolina.
5
March 2018
CONTENTS
EXECUTIVE SUMMARY .............................................................................................................. 2
HOW TO CITE THIS REPORT ..................................................................................................... 3
ABOUT THE AUTHORS ............................................................................................................... 3
CONTENTS .................................................................................................................................. 5
GLOSSARY OF TERMS ............................................................................................................... 6
AGRICULTURAL INDICATORS ................................................................................................... 7
Inputs ......................................................................................................................................... 8
Consumption ........................................................................................................................... 13
Economics ............................................................................................................................... 15
References .............................................................................................................................. 16
BIOENERGY INDICATORS ....................................................................................................... 18
Ethanol .................................................................................................................................... 19
Biodiesel .................................................................................................................................. 27
Wood Pellets ........................................................................................................................... 34
Waste-to-Energy ..................................................................................................................... 38
Biogas ..................................................................................................................................... 44
RENEWABLE CHEMICALS AND BIOBASED PRODUCTS ...................................................... 49
Summary ................................................................................................................................. 50
Economics and Investment ..................................................................................................... 52
Bioplastics ............................................................................................................................... 54
Renewable Chemicals ............................................................................................................. 57
Forest Products, Apparel, and Textiles ................................................................................... 59
POLICY ....................................................................................................................................... 62
Federal .................................................................................................................................... 63
State ........................................................................................................................................ 68
International ............................................................................................................................. 71
Business to Business .............................................................................................................. 72
6
March 2018
GLOSSARY OF TERMS DDG: Distillers Dried Grains: The product obtained after the removal of ethyl
alcohol by distillation from the yeast fermentation of a grain or grain mixture. Biogenic MSW: Biogenic municipal solid waste. This is waste from plant or animal products,
which is used to produce energy at waste-to-energy plants and landfills. Ethanol: Ethyl alcohol is used in alcoholic beverages and as an automotive fuel. It is
derived from starches such as corn and sugar cane. RFS: Renewable Fuel Standard. The Renewable Fuel Standard (RFS) program
was created under the Energy Policy Act of 2005 (EPAct), which amended the Clean Air Act (CAA). The Energy Independence and Security Act of 2007 (EISA) further amended the CAA by expanding the RFS program. EPA implements the program in consultation with the United States Department of Agriculture and the United States Department of Energy.
The RFS program is a national policy that requires a certain volume of renewable fuel to replace or reduce the quantity of petroleum-based transportation fuel, heating oil, or jet fuel. The four renewable fuel categories under the RFS are: • Biomass-based diesel • Cellulosic biofuel • Advanced biofuel • Total renewable fuel
WTE: Waste-to-Energy. This is a form of producing energy from biomass such as
paper, cardboard, food waste, grass clippings, leaves, wood, as well as some non-biomass materials. These materials are burned at WTE plants, which capture the heat from the burning process to produce steam, which is used to generate electricity or heat to buildings.
7
March 2018
AGRICULTURAL INDICATORS
8
March 2018
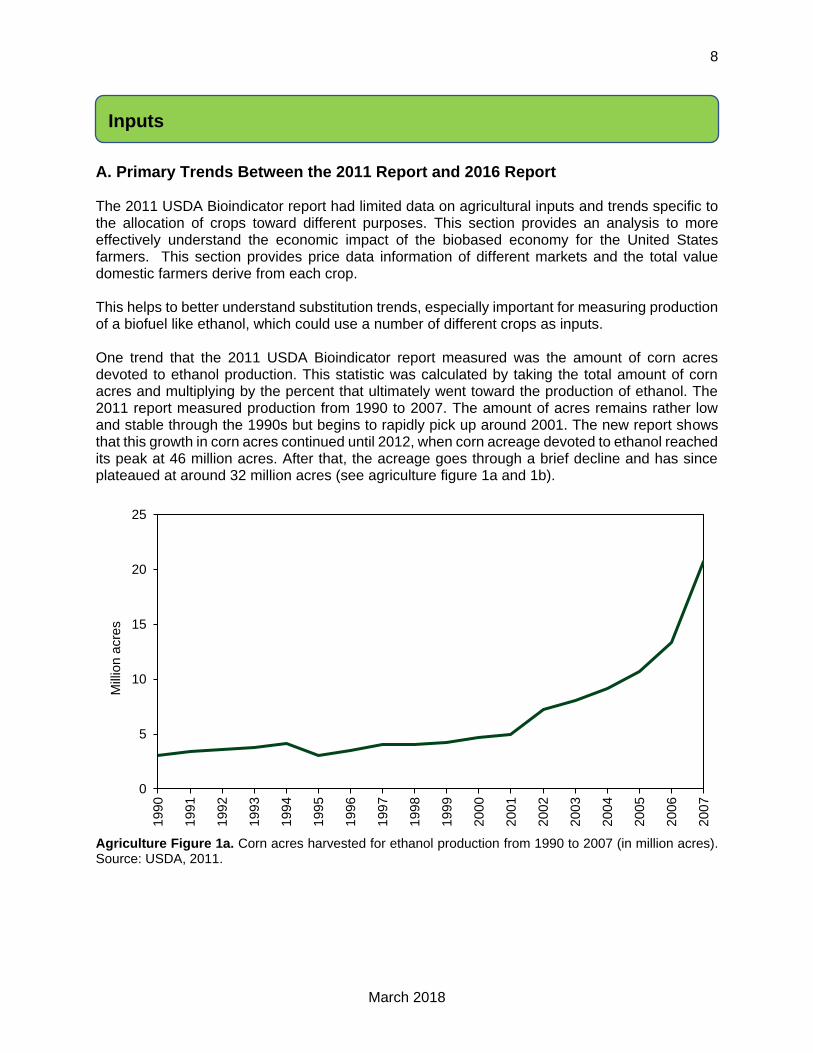
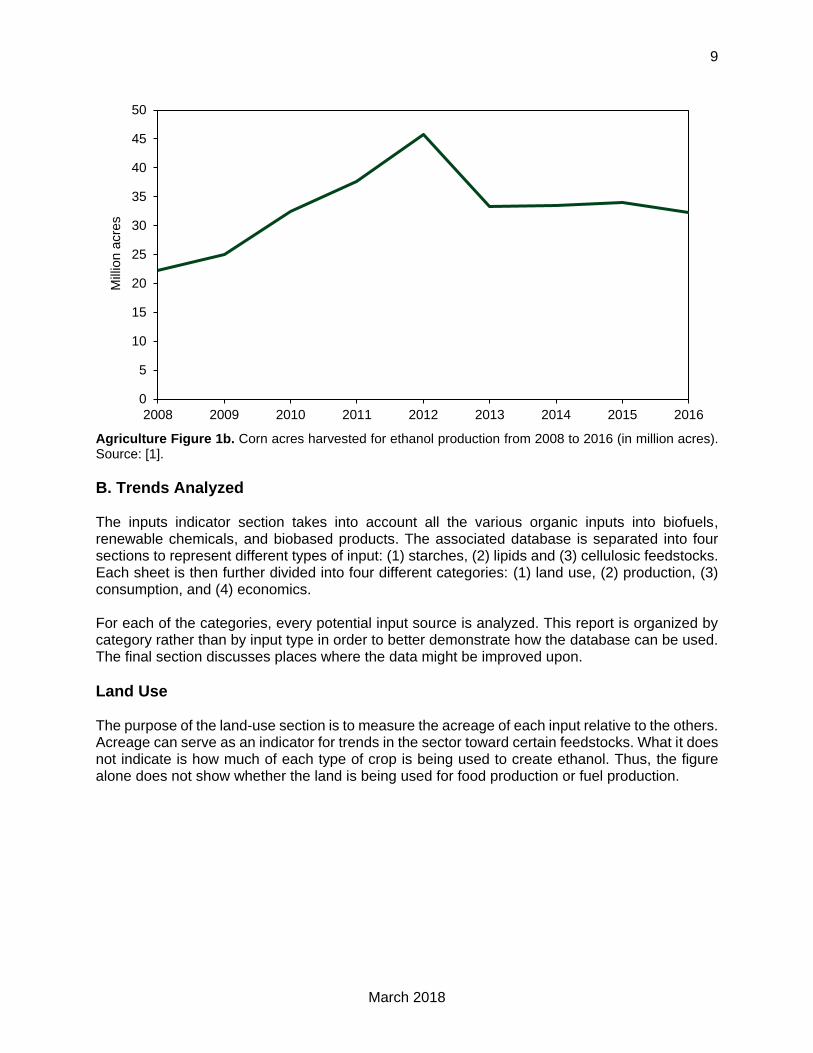
A. Primary Trends Between the 2011 Report and 2016 Report The 2011 USDA Bioindicator report had limited data on agricultural inputs and trends specific to the allocation of crops toward different purposes. This section provides an analysis to more effectively understand the economic impact of the biobased economy for the United States farmers. This section provides price data information of different markets and the total value domestic farmers derive from each crop. This helps to better understand substitution trends, especially important for measuring production of a biofuel like ethanol, which could use a number of different crops as inputs. One trend that the 2011 USDA Bioindicator report measured was the amount of corn acres devoted to ethanol production. This statistic was calculated by taking the total amount of corn acres and multiplying by the percent that ultimately went toward the production of ethanol. The 2011 report measured production from 1990 to 2007. The amount of acres remains rather low and stable through the 1990s but begins to rapidly pick up around 2001. The new report shows that this growth in corn acres continued until 2012, when corn acreage devoted to ethanol reached its peak at 46 million acres. After that, the acreage goes through a brief decline and has since plateaued at around 32 million acres (see agriculture figure 1a and 1b).
Agriculture Figure 1a. Corn acres harvested for ethanol production from 1990 to 2007 (in million acres). Source: USDA, 2011.
0
5
10
15
20
25
199
0
199
1
199
2
199
3
199
4
199
5
199
6
199
7
199
8
199
9
200
0
200
1
200
2
200
3
200
4
200
5
200
6
200
7
Mill
ion
acre
sInputs
9
March 2018
Agriculture Figure 1b. Corn acres harvested for ethanol production from 2008 to 2016 (in million acres). Source: [1].
B. Trends Analyzed The inputs indicator section takes into account all the various organic inputs into biofuels, renewable chemicals, and biobased products. The associated database is separated into four sections to represent different types of input: (1) starches, (2) lipids and (3) cellulosic feedstocks. Each sheet is then further divided into four different categories: (1) land use, (2) production, (3) consumption, and (4) economics. For each of the categories, every potential input source is analyzed. This report is organized by category rather than by input type in order to better demonstrate how the database can be used. The final section discusses places where the data might be improved upon.
Land Use The purpose of the land-use section is to measure the acreage of each input relative to the others. Acreage can serve as an indicator for trends in the sector toward certain feedstocks. What it does not indicate is how much of each type of crop is being used to create ethanol. Thus, the figure alone does not show whether the land is being used for food production or fuel production.
0
5
10
15
20
25
30
35
40
45
50
2008 2009 2010 2011 2012 2013 2014 2015 2016
Mill
ion
acre
s
10
March 2018
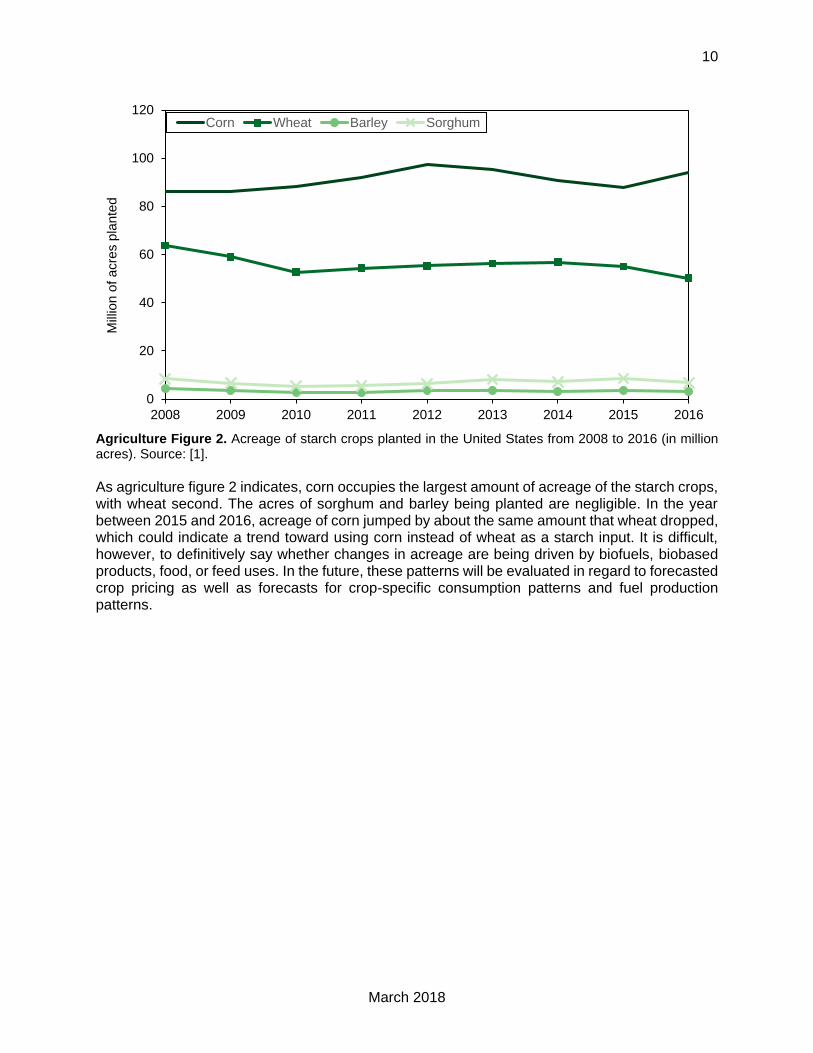
Agriculture Figure 2. Acreage of starch crops planted in the United States from 2008 to 2016 (in million acres). Source: [1].
As agriculture figure 2 indicates, corn occupies the largest amount of acreage of the starch crops, with wheat second. The acres of sorghum and barley being planted are negligible. In the year between 2015 and 2016, acreage of corn jumped by about the same amount that wheat dropped, which could indicate a trend toward using corn instead of wheat as a starch input. It is difficult, however, to definitively say whether changes in acreage are being driven by biofuels, biobased products, food, or feed uses. In the future, these patterns will be evaluated in regard to forecasted crop pricing as well as forecasts for crop-specific consumption patterns and fuel production patterns.
0
20
40
60
80
100
120
2008 2009 2010 2011 2012 2013 2014 2015 2016
Mill
ion
of a
cre
s p
lan
ted
Corn Wheat Barley Sorghum
11
March 2018
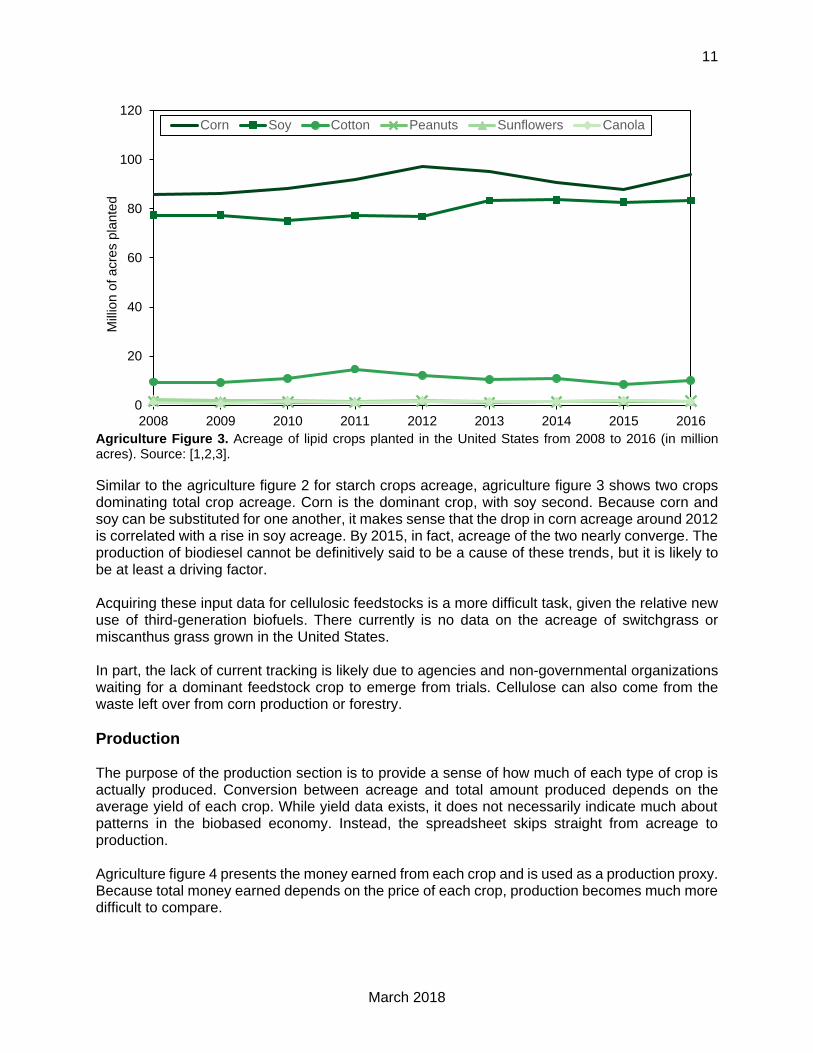
Agriculture Figure 3. Acreage of lipid crops planted in the United States from 2008 to 2016 (in million acres). Source: [1,2,3].
Similar to the agriculture figure 2 for starch crops acreage, agriculture figure 3 shows two crops dominating total crop acreage. Corn is the dominant crop, with soy second. Because corn and soy can be substituted for one another, it makes sense that the drop in corn acreage around 2012 is correlated with a rise in soy acreage. By 2015, in fact, acreage of the two nearly converge. The production of biodiesel cannot be definitively said to be a cause of these trends, but it is likely to be at least a driving factor. Acquiring these input data for cellulosic feedstocks is a more difficult task, given the relative new use of third-generation biofuels. There currently is no data on the acreage of switchgrass or miscanthus grass grown in the United States. In part, the lack of current tracking is likely due to agencies and non-governmental organizations waiting for a dominant feedstock crop to emerge from trials. Cellulose can also come from the waste left over from corn production or forestry.
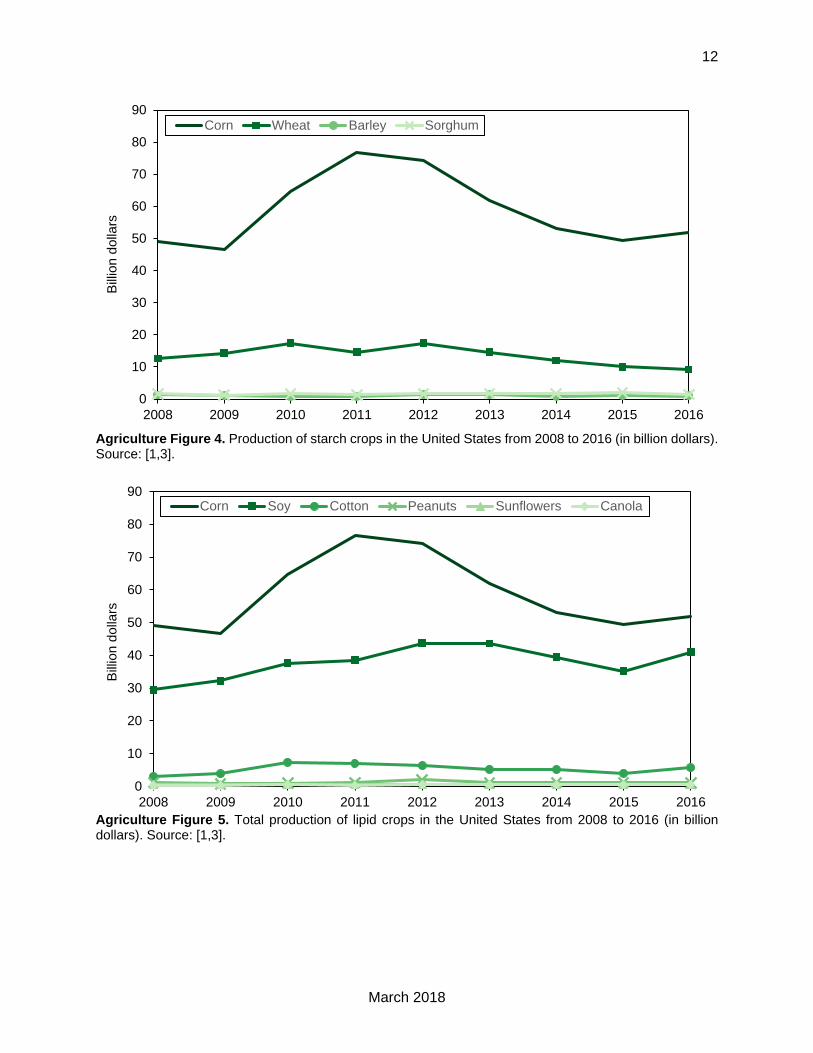
Production The purpose of the production section is to provide a sense of how much of each type of crop is actually produced. Conversion between acreage and total amount produced depends on the average yield of each crop. While yield data exists, it does not necessarily indicate much about patterns in the biobased economy. Instead, the spreadsheet skips straight from acreage to production. Agriculture figure 4 presents the money earned from each crop and is used as a production proxy. Because total money earned depends on the price of each crop, production becomes much more difficult to compare.
0
20
40
60
80
100
120
2008 2009 2010 2011 2012 2013 2014 2015 2016
Mill
ion
of a
cre
s p
lan
ted
Corn Soy Cotton Peanuts Sunflowers Canola
12
March 2018
Agriculture Figure 4. Production of starch crops in the United States from 2008 to 2016 (in billion dollars). Source: [1,3].
Agriculture Figure 5. Total production of lipid crops in the United States from 2008 to 2016 (in billion dollars). Source: [1,3].
0
10
20
30
40
50
60
70
80
90
2008 2009 2010 2011 2012 2013 2014 2015 2016
Bill
ion
do
llars
Corn Wheat Barley Sorghum
0
10
20
30
40
50
60
70
80
90
2008 2009 2010 2011 2012 2013 2014 2015 2016
Bill
ion
do
llars
Corn Soy Cotton Peanuts Sunflowers Canola
13
March 2018
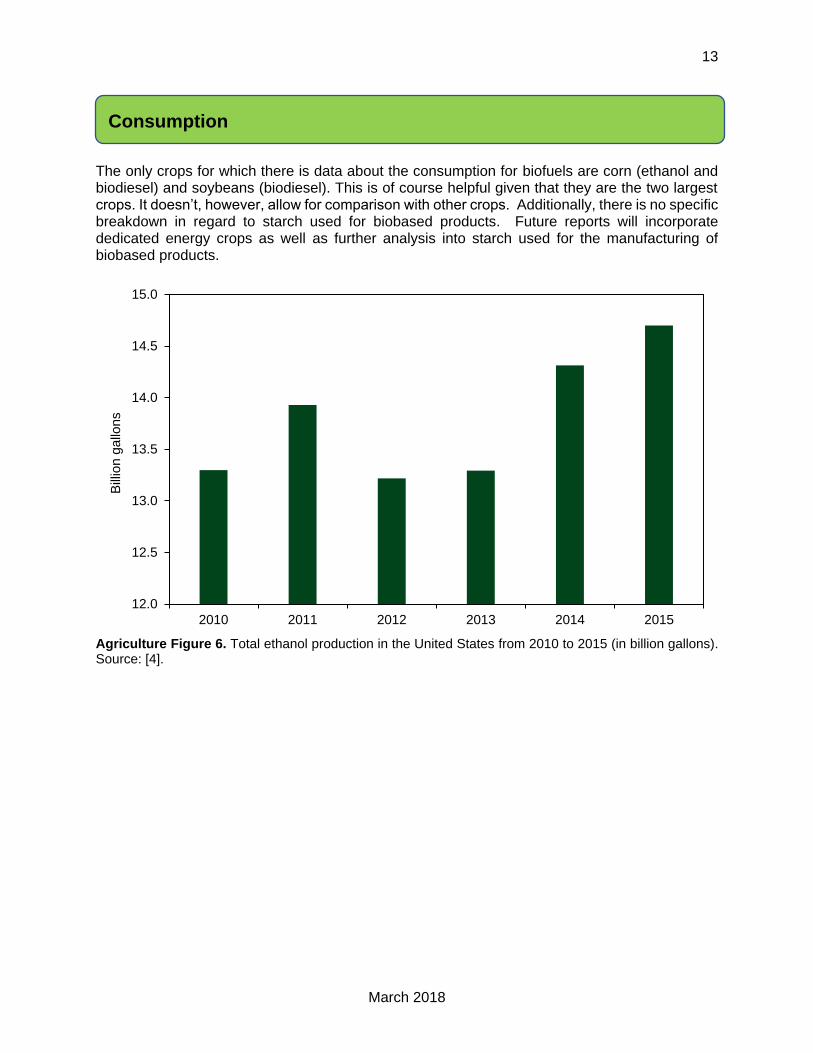
The only crops for which there is data about the consumption for biofuels are corn (ethanol and biodiesel) and soybeans (biodiesel). This is of course helpful given that they are the two largest crops. It doesn’t, however, allow for comparison with other crops. Additionally, there is no specific breakdown in regard to starch used for biobased products. Future reports will incorporate dedicated energy crops as well as further analysis into starch used for the manufacturing of biobased products.
Agriculture Figure 6. Total ethanol production in the United States from 2010 to 2015 (in billion gallons). Source: [4].
12.0
12.5
13.0
13.5
14.0
14.5
15.0
2010 2011 2012 2013 2014 2015
Bill
ion
ga
llon
sConsumption
14
March 2018
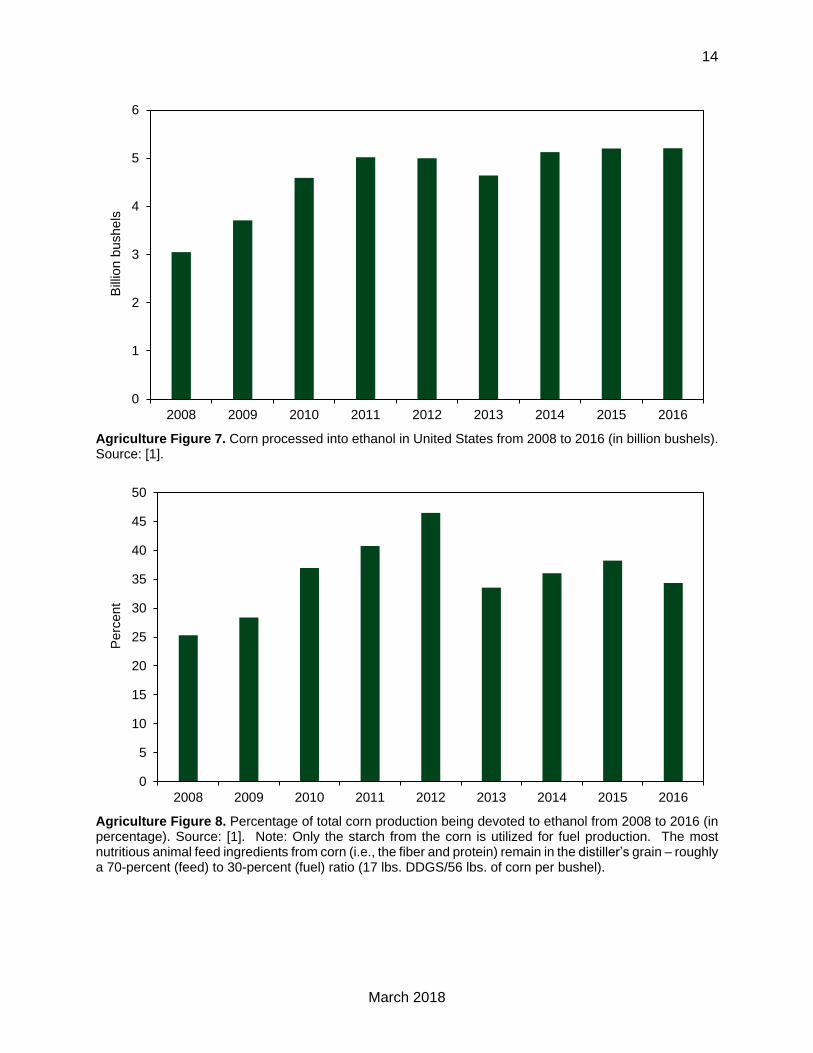
Agriculture Figure 7. Corn processed into ethanol in United States from 2008 to 2016 (in billion bushels). Source: [1].
Agriculture Figure 8. Percentage of total corn production being devoted to ethanol from 2008 to 2016 (in percentage). Source: [1]. Note: Only the starch from the corn is utilized for fuel production. The most nutritious animal feed ingredients from corn (i.e., the fiber and protein) remain in the distiller’s grain – roughly a 70-percent (feed) to 30-percent (fuel) ratio (17 lbs. DDGS/56 lbs. of corn per bushel).
0
1
2
3
4
5
6
2008 2009 2010 2011 2012 2013 2014 2015 2016
Bill
ion
bu
sh
els
0
5
10
15
20
25
30
35
40
45
50
2008 2009 2010 2011 2012 2013 2014 2015 2016
Pe
rce
nt
15
March 2018
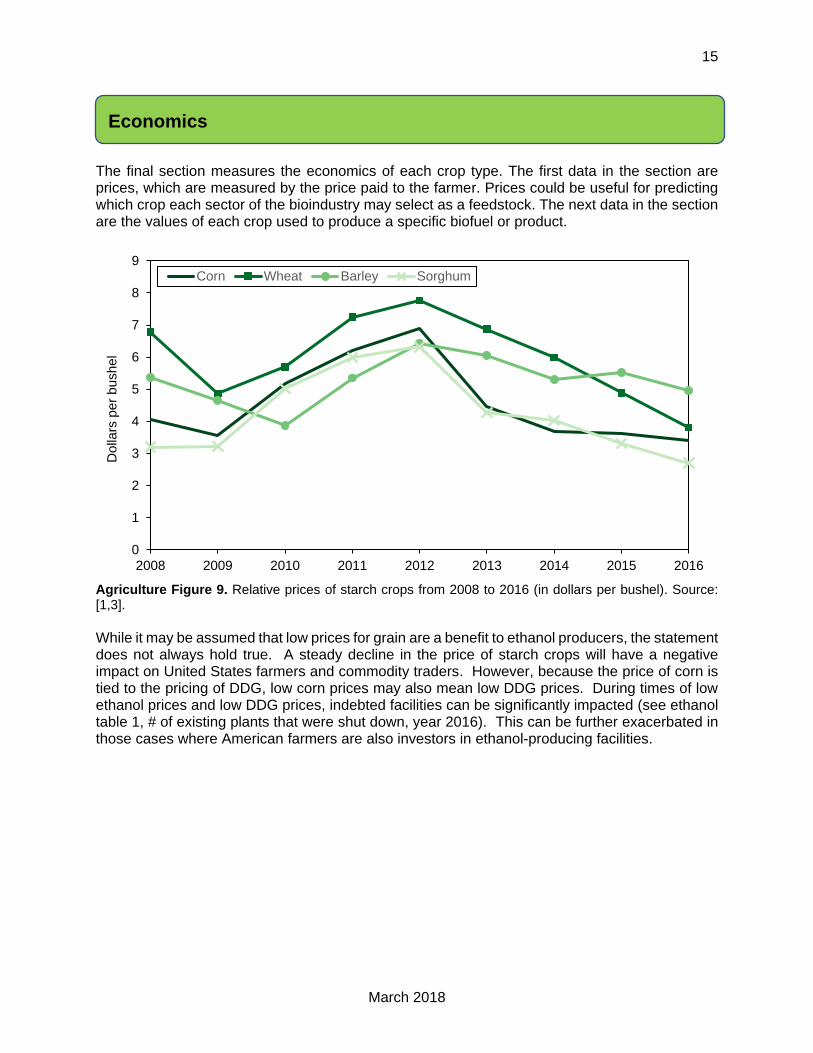
The final section measures the economics of each crop type. The first data in the section are prices, which are measured by the price paid to the farmer. Prices could be useful for predicting which crop each sector of the bioindustry may select as a feedstock. The next data in the section are the values of each crop used to produce a specific biofuel or product.
Agriculture Figure 9. Relative prices of starch crops from 2008 to 2016 (in dollars per bushel). Source: [1,3].
While it may be assumed that low prices for grain are a benefit to ethanol producers, the statement does not always hold true. A steady decline in the price of starch crops will have a negative impact on United States farmers and commodity traders. However, because the price of corn is tied to the pricing of DDG, low corn prices may also mean low DDG prices. During times of low ethanol prices and low DDG prices, indebted facilities can be significantly impacted (see ethanol table 1, # of existing plants that were shut down, year 2016). This can be further exacerbated in those cases where American farmers are also investors in ethanol-producing facilities.
0
1
2
3
4
5
6
7
8
9
2008 2009 2010 2011 2012 2013 2014 2015 2016
Do
llars
pe
r b
ush
el
Corn Wheat Barley Sorghum
Economics
16
March 2018
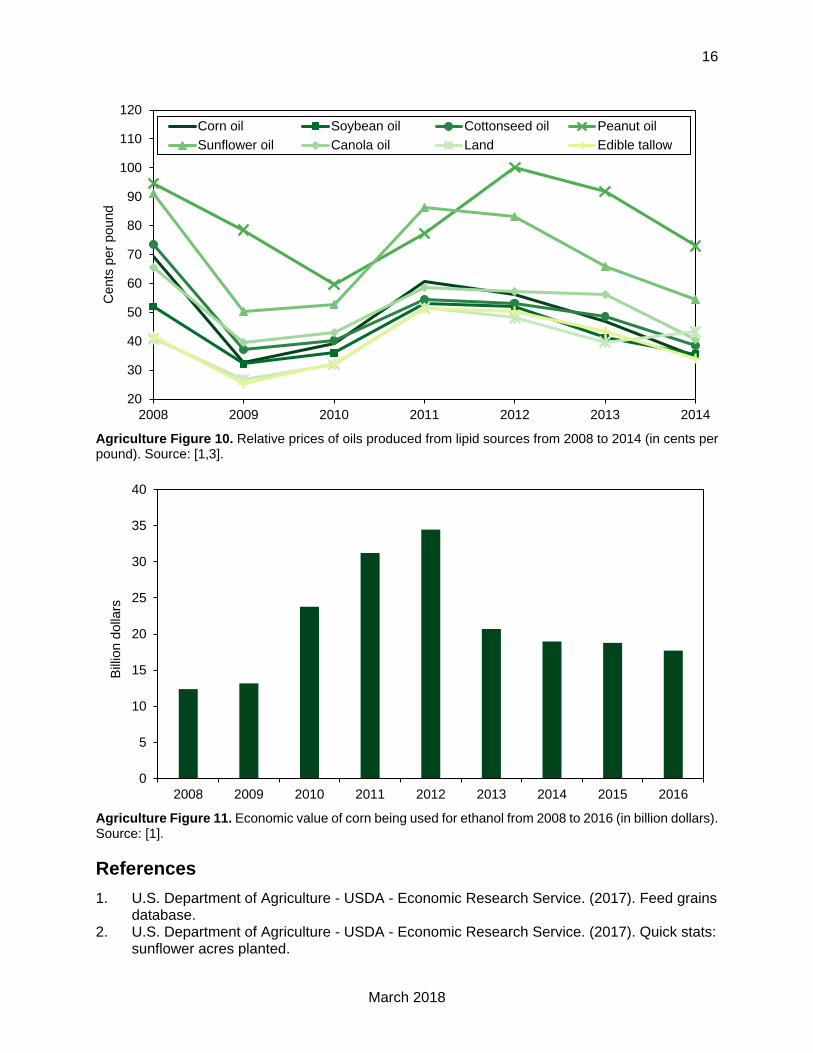
Agriculture Figure 10. Relative prices of oils produced from lipid sources from 2008 to 2014 (in cents per pound). Source: [1,3].
Agriculture Figure 11. Economic value of corn being used for ethanol from 2008 to 2016 (in billion dollars). Source: [1].
References
1. U.S. Department of Agriculture - USDA - Economic Research Service. (2017). Feed grains database.
2. U.S. Department of Agriculture - USDA - Economic Research Service. (2017). Quick stats: sunflower acres planted.
20
30
40
50
60
70
80
90
100
110
120
2008 2009 2010 2011 2012 2013 2014
Ce
nts
pe
r p
ou
nd
Corn oil Soybean oil Cottonseed oil Peanut oil
Sunflower oil Canola oil Land Edible tallow
0
5
10
15
20
25
30
35
40
2008 2009 2010 2011 2012 2013 2014 2015 2016
Bill
ion
do
llars
17
March 2018
3. U.S. Department of Agriculture - USDA - Economic Research Service. (2017). Oil crops table.
4. U.S. Energy Information Administration - EIA - Supply and disposition: fuel ethanol (2017).
18
March 2018
BIOENERGY INDICATORS
19
March 2018
A. Primary Trends Between the 2011 Report and 2016 Report
Physical The report in 2011 provides a wide overview of the ethanol industry’s current state within the United States, primarily focusing on the years 2005–2008. The 2011 report provides a physical map that shows the locations of existing ethanol plants as of 2008. The 2016 report focuses on the growth of the physical structure of the ethanol industry by providing data on the number of States with ethanol plants, the total number of existing ethanol plants, and the number of plants under construction from years 2010 to 2016.
Production The 2011 report provides information on the amount of ethanol produced in the United States from 1980 to 2008. Additionally, the 2011 report provides information on the amount of ethanol produced from corn from 1990 to 2008. The 2016 report provides data not only on how much ethanol is produced in the United States and produced from corn, but it also provides information on the amount of ethanol imported, exported, and the total ethanol consumed within the transportation and non-transportation sector.
Economics The 2011 report provides information on price trends per gallon of ethanol from 2005 to 2008. The 2016 report not only contains the price per gallon of ethanol from 2010 to 2016, but also provides data on how many direct and indirect jobs were created from the ethanol industry. Additionally, the 2016 report provides information on the ethanol industry’s influence on Gross Domestic Product (GDP), household average income of individuals working in the space, and tax revenue generated from the industry.
B. Trends Analyzed
Physical
PHYSICAL 2010 2011 2012 2013 2014 2015 2016
# of ethanol plants in the United States - 193 194 193 192 198 199
# of new ethanol plants that went on line - - - - - 6 9
# of existing plants that were put on standby - - - - 2 2 2
# of existing plants that were closed-shut down - - - - 2 4 9
# of States that have an ethanol production facility - - 29 29 28 29 29
# of existing plants under construction - - - - 7 3 3
Ethanol Table 1. The Physical Infrastructure of first-generation ethanol industry facilities in the United States from 2010 to 2016. Source: [1-6].
Ethanol
20
March 2018
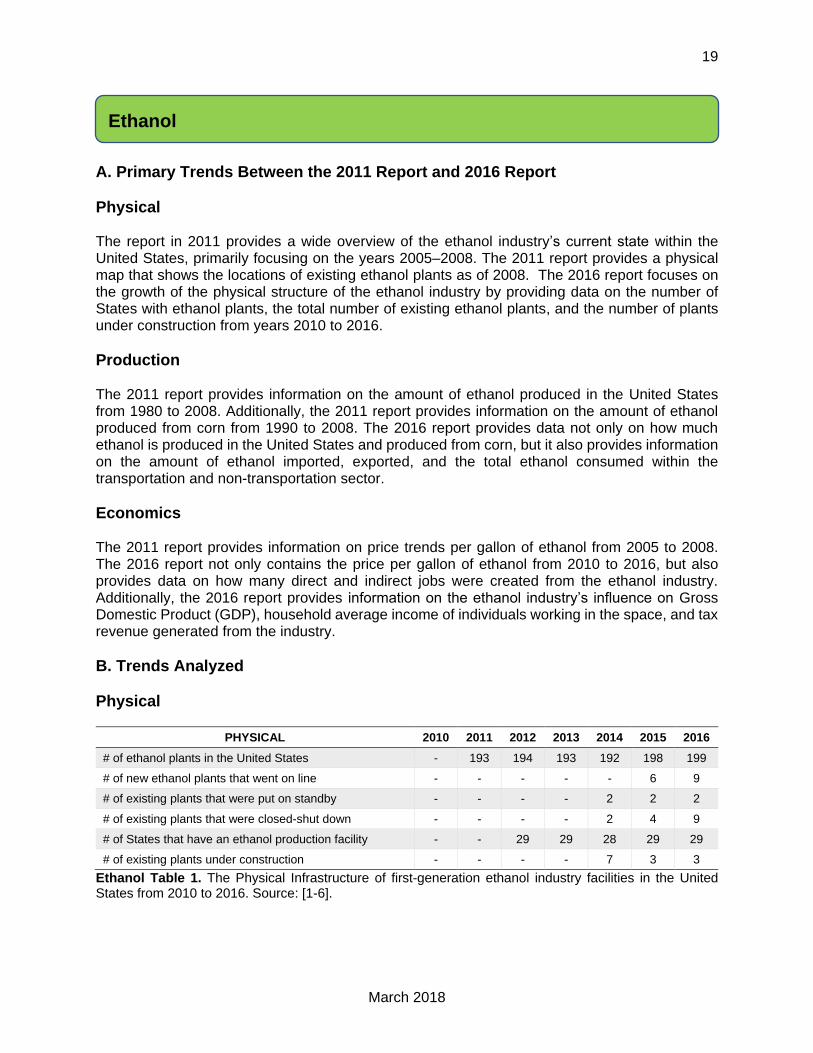
Production
Ethanol Figure 1. Total ethanol production in the United States from 2010 to 2015 (in billion gallons). Source: [7].
Ethanol Figure 2. Total ethanol production versus total ethanol consumption in the United States from 2010 to 2015 (in billion gallons). Source: [7-9].
12.0
12.5
13.0
13.5
14.0
14.5
15.0
2010 2011 2012 2013 2014 2015
Bill
ion
ga
llon
s
11.5
12.0
12.5
13.0
13.5
14.0
14.5
15.0
2010 2011 2012 2013 2014 2015
Bill
ion
ga
llon
s
Total ethanol production in the U.S. Total ethanol consumption in the U.S.
21
March 2018
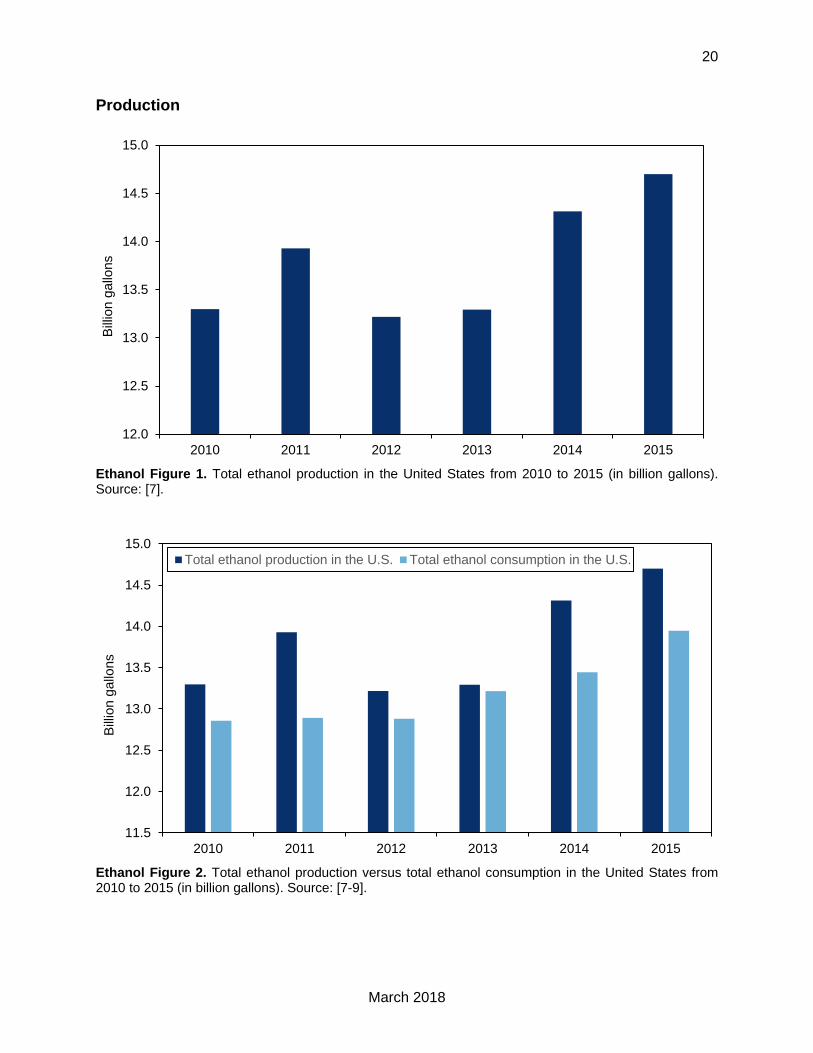
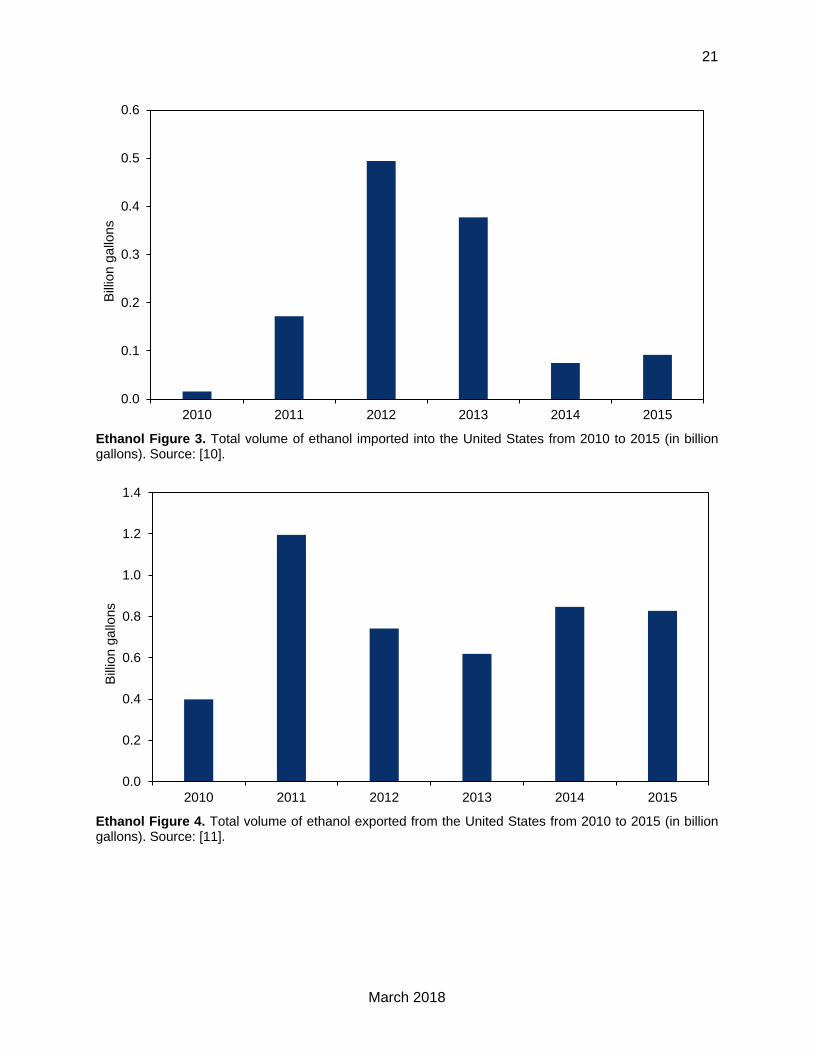
Ethanol Figure 3. Total volume of ethanol imported into the United States from 2010 to 2015 (in billion gallons). Source: [10].
Ethanol Figure 4. Total volume of ethanol exported from the United States from 2010 to 2015 (in billion gallons). Source: [11].
0.0
0.1
0.2
0.3
0.4
0.5
0.6
2010 2011 2012 2013 2014 2015
Bill
ion
ga
llon
s
0.0
0.2
0.4
0.6
0.8
1.0
1.2
1.4
2010 2011 2012 2013 2014 2015
Bill
ion
ga
llon
s
22
March 2018
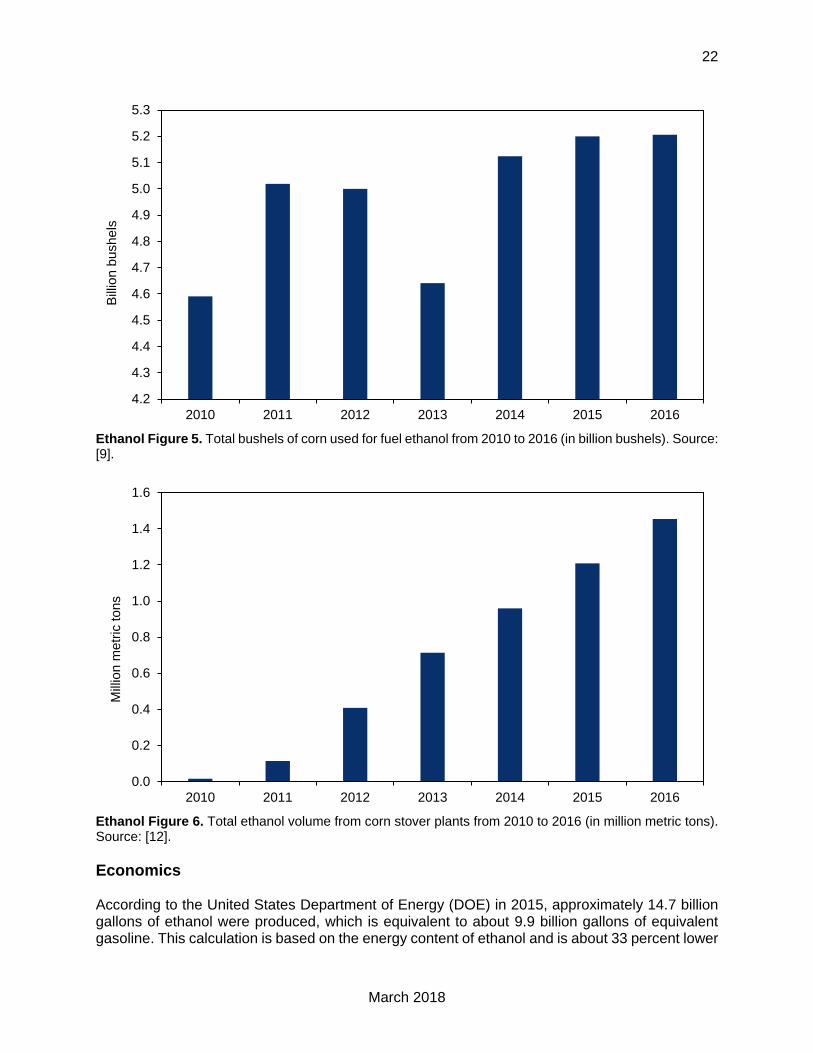
Ethanol Figure 5. Total bushels of corn used for fuel ethanol from 2010 to 2016 (in billion bushels). Source: [9].
Ethanol Figure 6. Total ethanol volume from corn stover plants from 2010 to 2016 (in million metric tons). Source: [12].
Economics According to the United States Department of Energy (DOE) in 2015, approximately 14.7 billion gallons of ethanol were produced, which is equivalent to about 9.9 billion gallons of equivalent gasoline. This calculation is based on the energy content of ethanol and is about 33 percent lower
4.2
4.3
4.4
4.5
4.6
4.7
4.8
4.9
5.0
5.1
5.2
5.3
2010 2011 2012 2013 2014 2015 2016
Bill
ion
bu
sh
els
0.0
0.2
0.4
0.6
0.8
1.0
1.2
1.4
1.6
2010 2011 2012 2013 2014 2015 2016
Mill
ion
me
tric
to
ns
23
March 2018
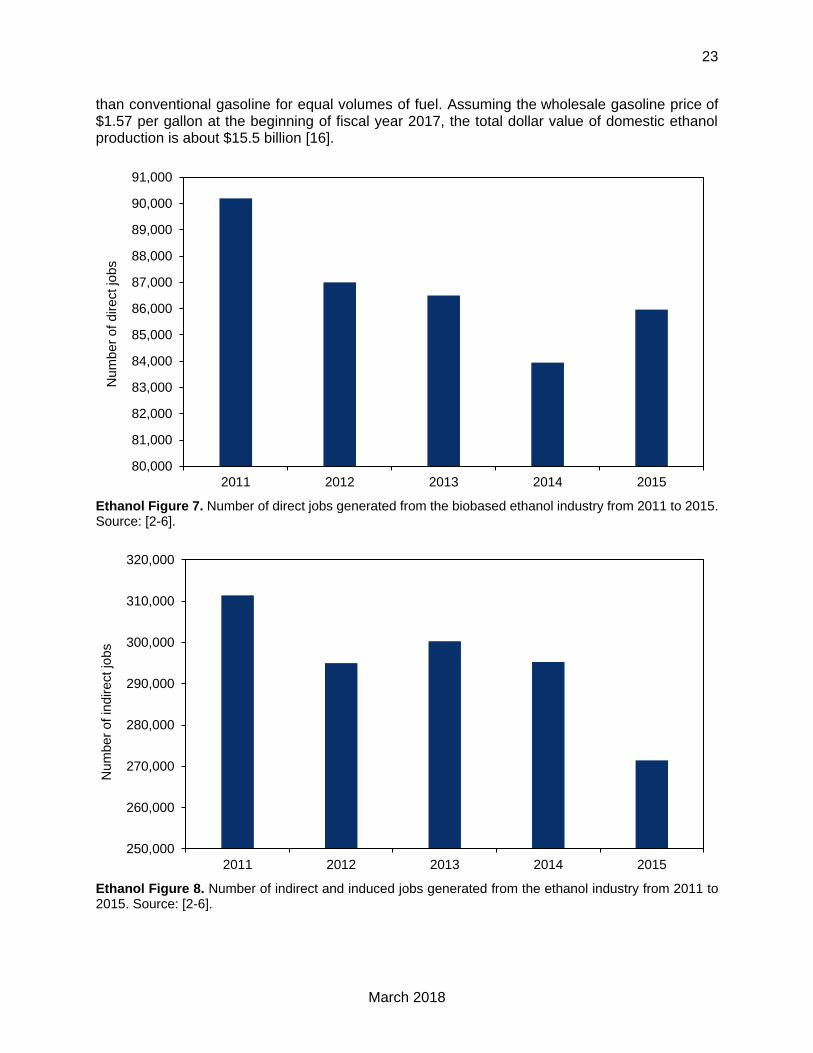
than conventional gasoline for equal volumes of fuel. Assuming the wholesale gasoline price of $1.57 per gallon at the beginning of fiscal year 2017, the total dollar value of domestic ethanol production is about $15.5 billion [16].
Ethanol Figure 7. Number of direct jobs generated from the biobased ethanol industry from 2011 to 2015. Source: [2-6].
Ethanol Figure 8. Number of indirect and induced jobs generated from the ethanol industry from 2011 to 2015. Source: [2-6].
80,000
81,000
82,000
83,000
84,000
85,000
86,000
87,000
88,000
89,000
90,000
91,000
2011 2012 2013 2014 2015
Nu
mb
er
of d
ire
ct jo
bs
250,000
260,000
270,000
280,000
290,000
300,000
310,000
320,000
2011 2012 2013 2014 2015
Nu
mb
er
of in
dir
ect jo
bs
24
March 2018
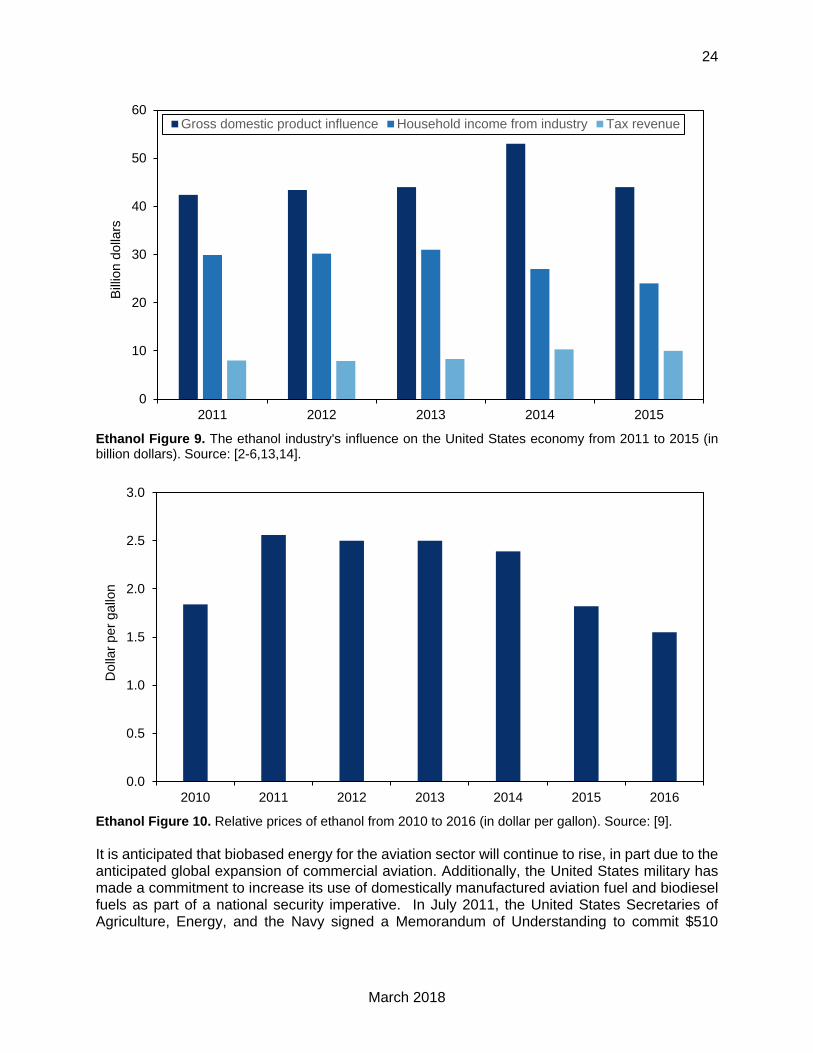
Ethanol Figure 9. The ethanol industry's influence on the United States economy from 2011 to 2015 (in billion dollars). Source: [2-6,13,14].
Ethanol Figure 10. Relative prices of ethanol from 2010 to 2016 (in dollar per gallon). Source: [9].
It is anticipated that biobased energy for the aviation sector will continue to rise, in part due to the anticipated global expansion of commercial aviation. Additionally, the United States military has made a commitment to increase its use of domestically manufactured aviation fuel and biodiesel fuels as part of a national security imperative. In July 2011, the United States Secretaries of Agriculture, Energy, and the Navy signed a Memorandum of Understanding to commit $510
0
10
20
30
40
50
60
2011 2012 2013 2014 2015
Bill
ion
do
llars
Gross domestic product influence Household income from industry Tax revenue
0.0
0.5
1.0
1.5
2.0
2.5
3.0
2010 2011 2012 2013 2014 2015 2016
Do
llar
pe
r g
allo
n
25
March 2018
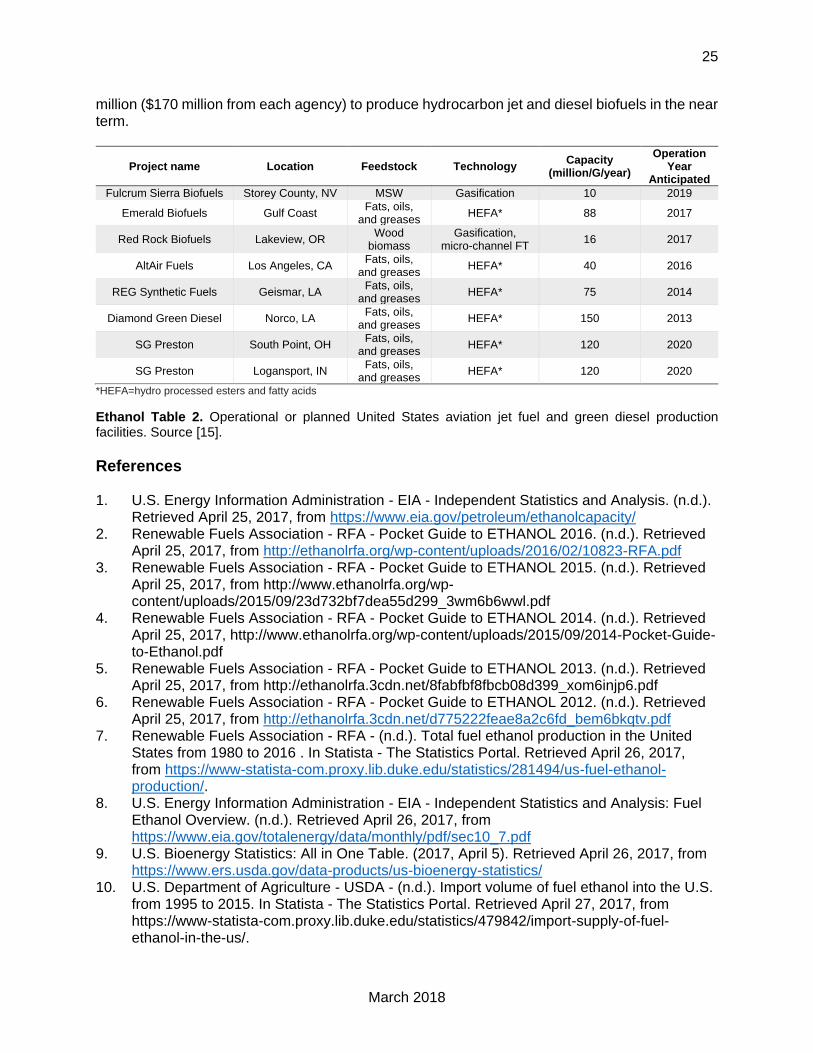
million ($170 million from each agency) to produce hydrocarbon jet and diesel biofuels in the near term.
Project name Location Feedstock Technology Capacity
(million/G/year)
Operation Year
Anticipated
Fulcrum Sierra Biofuels Storey County, NV MSW Gasification 10 2019
Emerald Biofuels Gulf Coast Fats, oils,
and greases HEFA* 88 2017
Red Rock Biofuels Lakeview, OR Wood
biomass Gasification,
micro-channel FT 16 2017
AltAir Fuels Los Angeles, CA Fats, oils,
and greases HEFA* 40 2016
REG Synthetic Fuels Geismar, LA Fats, oils,
and greases HEFA* 75 2014
Diamond Green Diesel Norco, LA Fats, oils,
and greases HEFA* 150 2013
SG Preston South Point, OH Fats, oils,
and greases HEFA* 120 2020
SG Preston Logansport, IN Fats, oils,
and greases HEFA* 120 2020
*HEFA=hydro processed esters and fatty acids
Ethanol Table 2. Operational or planned United States aviation jet fuel and green diesel production facilities. Source [15].
References 1. U.S. Energy Information Administration - EIA - Independent Statistics and Analysis. (n.d.).
Retrieved April 25, 2017, from https://www.eia.gov/petroleum/ethanolcapacity/ 2. Renewable Fuels Association - RFA - Pocket Guide to ETHANOL 2016. (n.d.). Retrieved
April 25, 2017, from http://ethanolrfa.org/wp-content/uploads/2016/02/10823-RFA.pdf 3. Renewable Fuels Association - RFA - Pocket Guide to ETHANOL 2015. (n.d.). Retrieved
April 25, 2017, from http://www.ethanolrfa.org/wp-content/uploads/2015/09/23d732bf7dea55d299_3wm6b6wwl.pdf
4. Renewable Fuels Association - RFA - Pocket Guide to ETHANOL 2014. (n.d.). Retrieved April 25, 2017, http://www.ethanolrfa.org/wp-content/uploads/2015/09/2014-Pocket-Guide-to-Ethanol.pdf
5. Renewable Fuels Association - RFA - Pocket Guide to ETHANOL 2013. (n.d.). Retrieved April 25, 2017, from http://ethanolrfa.3cdn.net/8fabfbf8fbcb08d399_xom6injp6.pdf
6. Renewable Fuels Association - RFA - Pocket Guide to ETHANOL 2012. (n.d.). Retrieved April 25, 2017, from http://ethanolrfa.3cdn.net/d775222feae8a2c6fd_bem6bkqtv.pdf
7. Renewable Fuels Association - RFA - (n.d.). Total fuel ethanol production in the United States from 1980 to 2016 . In Statista - The Statistics Portal. Retrieved April 26, 2017, from https://www-statista-com.proxy.lib.duke.edu/statistics/281494/us-fuel-ethanol-production/.
8. U.S. Energy Information Administration - EIA - Independent Statistics and Analysis: Fuel Ethanol Overview. (n.d.). Retrieved April 26, 2017, from https://www.eia.gov/totalenergy/data/monthly/pdf/sec10_7.pdf
9. U.S. Bioenergy Statistics: All in One Table. (2017, April 5). Retrieved April 26, 2017, from https://www.ers.usda.gov/data-products/us-bioenergy-statistics/
10. U.S. Department of Agriculture - USDA - (n.d.). Import volume of fuel ethanol into the U.S. from 1995 to 2015. In Statista - The Statistics Portal. Retrieved April 27, 2017, from https://www-statista-com.proxy.lib.duke.edu/statistics/479842/import-supply-of-fuel-ethanol-in-the-us/.
26
March 2018
11. U.S. Department of Agriculture - USDA - (n.d.). Total export volume of fuel ethanol from the U.S. between 2008 and 2015. In Statista - The Statistics Portal. Retrieved April 26, 2017, from https://www-statista-com.proxy.lib.duke.edu/statistics/479861/exports-of-fuel-ethanol-from-the-us/.
12. Food and Agriculture Policy Research Institute. (n.d.). Corn stover for ethanol production in the U.S. from 2010 to 2025. In Statista - The Statistics Portal. Retrieved April 27, 2017, from https://www-statista-com.proxy.lib.duke.edu/statistics/202141/corn-stover-for-us-ethanol-production-from-2010/.
13. Renewable Fuels Association - RFA - releases report, annual industry outlook during NEC. (n.d.). Retrieved April 26, 2017, from http://www.ethanolproducer.com/articles/9550/
14. National Corn Growers Association. (n.d.). Ethanol Facts. Retrieved April 26, 2017, from http://ncga.com/uploads/useruploads/ethanol_facts_printable_mar_2012.pdf
15. U.S. Department of Energy - DOE - Alternative Aviation Fuels: Overview of Challenges, Opportunities and Next Steps (2017). Accessed from: https://energy.gov/sites/prod/files/2017/03/f34/alternative_aviation_fuels_report.pdf
16. U.S. Department of Energy - DOE - Frequently Asked Questions: Bioenergy (2017). Retrieved from: https://energy.gov/eere/bioenergy/bioenergy-frequently-asked-questions
27
March 2018
A. Primary Trends Between the 2011 Report and 2016 Report
Physical The report in 2011 provides a wide overview of the state of the biodiesel industry within the United States, primarily focusing on the years 2001 to 2007. The 2011 provides a physical map that shows the locations of existing biodiesel plants as of 2008. The 2016 report focuses on the growth of the physical structure of the biodiesel industry by providing data on the number of States that have biodiesel plants, the number of existing biodiesel plants, and the number of plants under construction from years 2010 to 2016.
Production The 2011 report provides information on the amount of biodiesel produced in the United States from 2001 to 2007. Additionally, the 2011 report supplies information on the capacity utilization of biodiesel production from 2001 to 2007. The 2016 report provides data not only on how much biodiesel is produced in the United States, but also provides information on the amount of biodiesel imported and exported, total biodiesel consumption, and total consumption within the transportation sector. Information on the growth of biodiesel stations from 2010 to 2016 is also included. According to the Energy Information Administration (EIA) [4], in the United States, approximately 70 percent of biodiesel production is located in the Midwest. Further, the United States Department of Energy estimates that 1.3 billion gallons of biodiesel were produced in 2015. Given that the energy content of biodiesel is about 7 percent lower than that of petroleum-derived diesel fuel, this is equivalent to about 1.2 billion gallons of petroleum-derived diesel. Assuming the wholesale diesel price of $1.59 at the beginning of fiscal year 2017, the total value of our domestic biodiesel production is estimated to be about $1.9 billion.
Economics The 2011 report provides information on the operating cost margins for biodiesel in 2007 and 2008. The 2016 report not only contains the price per gallon of biodiesel from 2010 to 2016, but it also provides data on how many direct jobs were created from the biodiesel industry. Additionally, the 2016 report provides information on the biodiesel’s influence on GDP and the household average income from biodiesel’s industry.
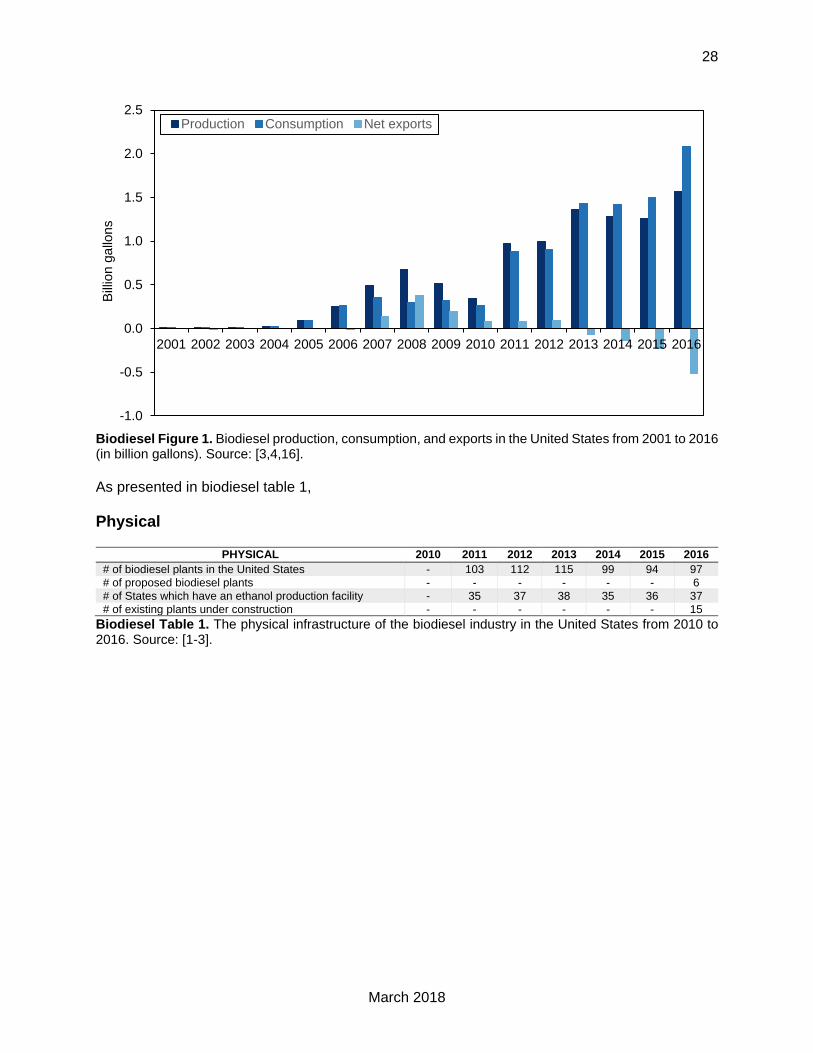
B. Trends Analyzed Biodiesel figure 1 below provides an overview of the United States biodiesel market in regard to domestic consumption, domestic production, and trade exports during the period from 2001 to 2016. The information is provided by the United States Energy Information Agency, updated on August 19, 2017 [16]. Net exports achieved a pinnacle in 2008 as a result of favorable biodiesel tax credits in the European Union, which were subsequently phased out. The Renewable Fuel Standard (RFS) helped to propel both production and consumption of biodiesel.
Biodiesel
28
March 2018
Biodiesel Figure 1. Biodiesel production, consumption, and exports in the United States from 2001 to 2016 (in billion gallons). Source: [3,4,16].
As presented in biodiesel table 1,
Physical
PHYSICAL 2010 2011 2012 2013 2014 2015 2016
# of biodiesel plants in the United States - 103 112 115 99 94 97
# of proposed biodiesel plants - - - - - - 6
# of States which have an ethanol production facility - 35 37 38 35 36 37
# of existing plants under construction - - - - - - 15
Biodiesel Table 1. The physical infrastructure of the biodiesel industry in the United States from 2010 to 2016. Source: [1-3].
-1.0
-0.5
0.0
0.5
1.0
1.5
2.0
2.5
2001 2002 2003 2004 2005 2006 2007 2008 2009 2010 2011 2012 2013 2014 2015 2016
Bill
ion
ga
llon
s
Production Consumption Net exports
29
March 2018
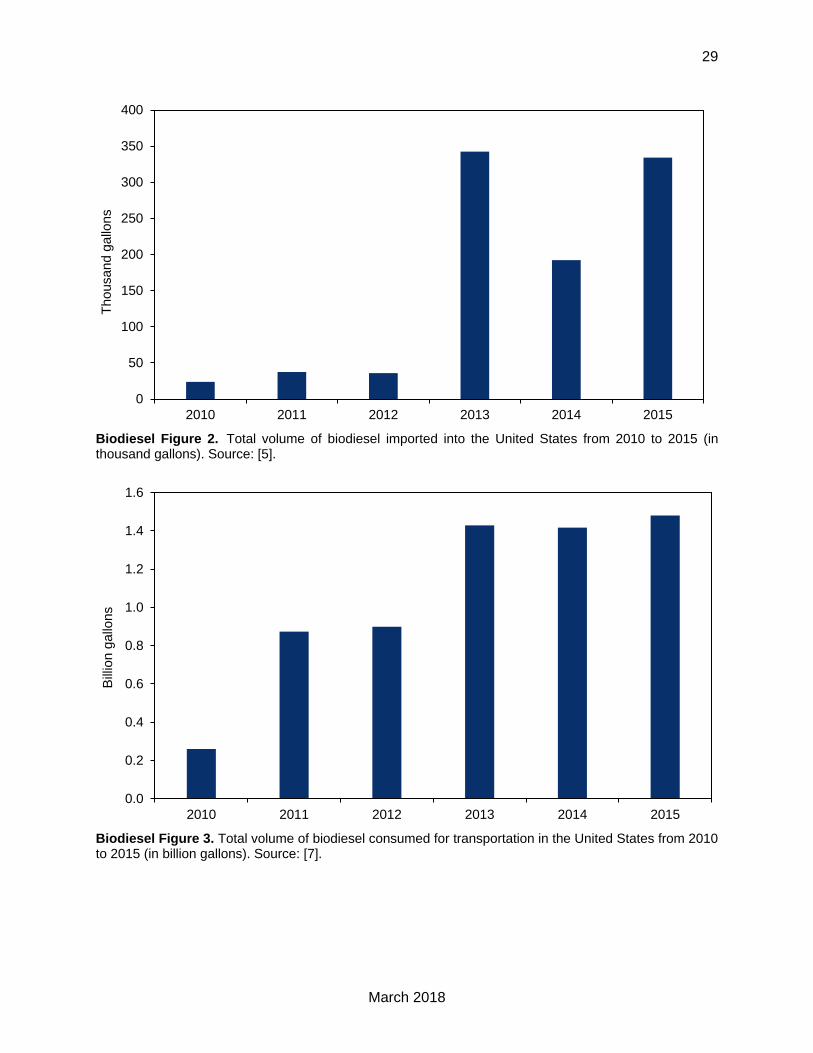
Biodiesel Figure 2. Total volume of biodiesel imported into the United States from 2010 to 2015 (in thousand gallons). Source: [5].
Biodiesel Figure 3. Total volume of biodiesel consumed for transportation in the United States from 2010 to 2015 (in billion gallons). Source: [7].
0
50
100
150
200
250
300
350
400
2010 2011 2012 2013 2014 2015
Th
ou
sa
nd
ga
llon
s
0.0
0.2
0.4
0.6
0.8
1.0
1.2
1.4
1.6
2010 2011 2012 2013 2014 2015
Bill
ion
ga
llon
s
30
March 2018
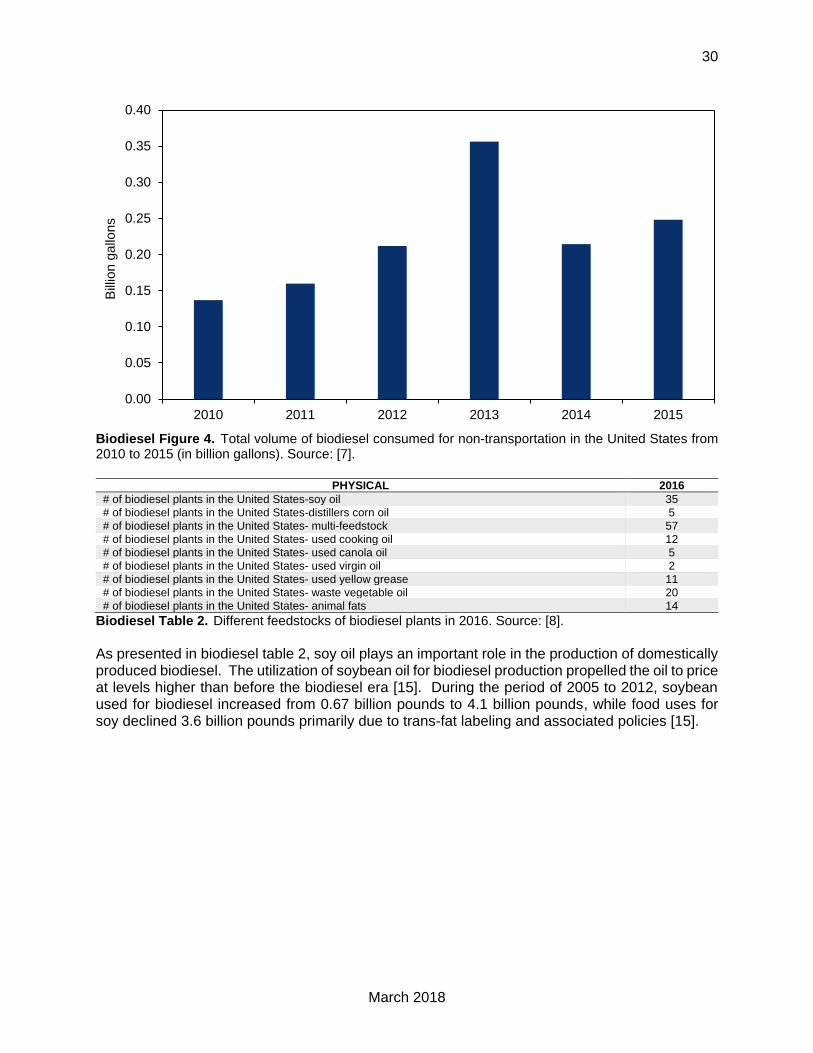
Biodiesel Figure 4. Total volume of biodiesel consumed for non-transportation in the United States from 2010 to 2015 (in billion gallons). Source: [7].
PHYSICAL 2016
# of biodiesel plants in the United States-soy oil 35
# of biodiesel plants in the United States-distillers corn oil 5
# of biodiesel plants in the United States- multi-feedstock 57
# of biodiesel plants in the United States- used cooking oil 12
# of biodiesel plants in the United States- used canola oil 5
# of biodiesel plants in the United States- used virgin oil 2
# of biodiesel plants in the United States- used yellow grease 11
# of biodiesel plants in the United States- waste vegetable oil 20
# of biodiesel plants in the United States- animal fats 14
Biodiesel Table 2. Different feedstocks of biodiesel plants in 2016. Source: [8].
As presented in biodiesel table 2, soy oil plays an important role in the production of domestically produced biodiesel. The utilization of soybean oil for biodiesel production propelled the oil to price at levels higher than before the biodiesel era [15]. During the period of 2005 to 2012, soybean used for biodiesel increased from 0.67 billion pounds to 4.1 billion pounds, while food uses for soy declined 3.6 billion pounds primarily due to trans-fat labeling and associated policies [15].
0.00
0.05
0.10
0.15
0.20
0.25
0.30
0.35
0.40
2010 2011 2012 2013 2014 2015
Bill
ion
ga
llon
s
31
March 2018
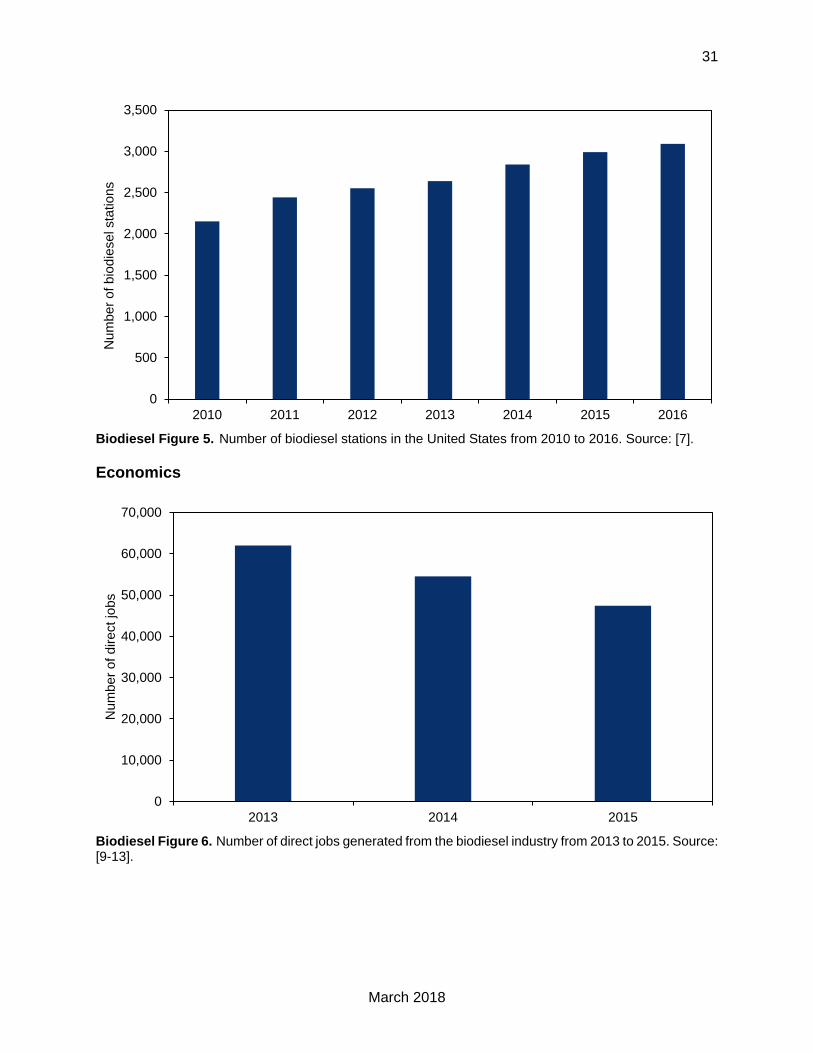
Biodiesel Figure 5. Number of biodiesel stations in the United States from 2010 to 2016. Source: [7].
Economics
Biodiesel Figure 6. Number of direct jobs generated from the biodiesel industry from 2013 to 2015. Source: [9-13].
0
500
1,000
1,500
2,000
2,500
3,000
3,500
2010 2011 2012 2013 2014 2015 2016
Nu
mb
er
of b
iod
iese
l sta
tio
ns
0
10,000
20,000
30,000
40,000
50,000
60,000
70,000
2013 2014 2015
Nu
mb
er
of d
ire
ct jo
bs
32
March 2018
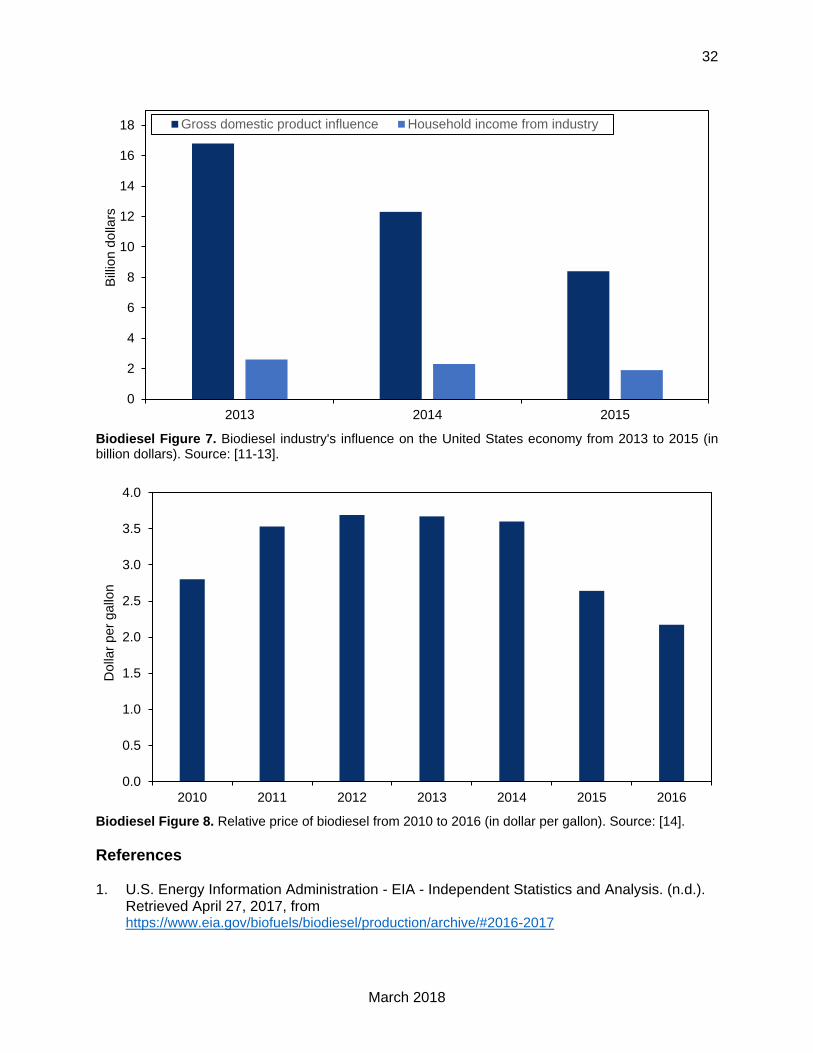
Biodiesel Figure 7. Biodiesel industry's influence on the United States economy from 2013 to 2015 (in billion dollars). Source: [11-13].
Biodiesel Figure 8. Relative price of biodiesel from 2010 to 2016 (in dollar per gallon). Source: [14].
References 1. U.S. Energy Information Administration - EIA - Independent Statistics and Analysis. (n.d.).
Retrieved April 27, 2017, from https://www.eia.gov/biofuels/biodiesel/production/archive/#2016-2017
0
2
4
6
8
10
12
14
16
18
2013 2014 2015
Bill
ion
do
llars
Gross domestic product influence Household income from industry
0.0
0.5
1.0
1.5
2.0
2.5
3.0
3.5
4.0
2010 2011 2012 2013 2014 2015 2016
Do
llar
pe
r g
allo
n
33
March 2018
2. USA Plants. (n.d.). Retrieved April 27, 2017, from http://www.biodieselmagazine.com/plants/listplants/USA/proposed/
3. USA Plants. (n.d.). Retrieved April 27, 2017, from http://www.biodieselmagazine.com/plants/listplants/USA/construction/
4. U.S. Energy Information Administration - EIA. (n.d.). Biodiesel production in the U.S. from 2001 to 2015. In Statista - The Statistics Portal. Retrieved April 27, 2017, from https://www-
statista-com.proxy.lib.duke.edu/statistics/509875/production-volume-of-biodiesel-in-the-us/. 5. U.S. Department of Agriculture - USDA - (n.d.). Total import volume of biodiesel into the
U.S. from 2001 to 2015. In Statista - The Statistics Portal. Retrieved April 27, 2017, from https://www-statista-com.proxy.lib.duke.edu/statistics/479868/import-supply-of-biodiesel-in-the-
us/. 6. U.S. Energy Information Administration - EIA - (n.d.). Biodiesel export volume from the U.S.
from 2001 to 2015. In Statista - The Statistics Portal. Retrieved April 27, 2017, from https://www-statista-com.proxy.lib.duke.edu/statistics/509823/export-supply-of-biodiesel-in-the-
us/. 7. U.S. Bioenergy Statistics: All in One Table. (2017, April 5). Retrieved April 26, 2017, from
https://www.ers.usda.gov/data-products/us-bioenergy-statistics/ 8. USA Plants. (n.d.). Retrieved April 27, 2017, from
http://www.biodieselmagazine.com/plants/listplants/USA/existing/ 9. Dorsey, Inc. Piccirilli. "Fact Sheet: Jobs in Renewable Energy and Energy Efficiency
(2014)." EESI - Environmental and Energy Study Institute. N.p., n.d. Web. 27 Apr. 2017. 10. Dorsey, I. P. (n.d.). Fact Sheet: Jobs in Renewable Energy and Energy Efficiency (2017).
Retrieved April 27, 2017, from http://www.eesi.org/papers/view/fact-sheet-jobs-in-renewable-energy-and-energy-efficiency-2017
11. The Economic Impact of the Biodiesel Industry on the U.S. ... (n.d.). Retrieved April 27, 2017, from http://biodiesel.org/docs/default-source/policy--federal/lmc-study-for-nbb_economic-impact-of-biodiesel_june-2016-final.pdf?sfvrsn=4
12. The Economic Impact of the Biodiesel Industry on the U.S. ... (n.d.). Retrieved April 27, 2017, from http://biodiesel.org/reports/20131113_GEN-431.pdf
13. The National Renewable Energy Laboratory. (n.d). 2015 Bioenergy Market Report. (n.d.). Retrieved April 27, 2017, from http://www.nrel.gov/docs/fy17osti/66995.pdf
14. Fuel Prices. (n.d.). Retrieved April 27, 2017, from http://www.afdc.energy.gov/fuels/prices.html
15. Impact of the U.S. Biodiesel industry on the U.S. Soybean Complex (2012). Informa economics. Retrieved August 17, 2017. Retrieved from: http://biodiesel.org/reports/20121201_GEN-430.pdf
16. U.S. Department of Energy - DOE - Energy Information Agency. August 19, 2017. Retrieved on August 19, 2017. Retrieved from https://www.afdc.energy.gov/data/10325
17. U.S. Department of Energy - DOE - Frequently asked Questions: Bioenergy (2017). Retrieved from: https://energy.gov/eere/bioenergy/bioenergy-frequently-asked-questions
34
March 2018
A. Primary Trends Between the 2011 Report and 2016 Report
Physical The report in 2011 provides a wide overview of wood being used as an indicator of the biobased economy focusing on years 2002-2007. The 2016 report focuses on the growth of the physical structure of the wood pellet industry by providing data on the number of States that have wood pellet plants and the number of plants under construction from years in 2016.
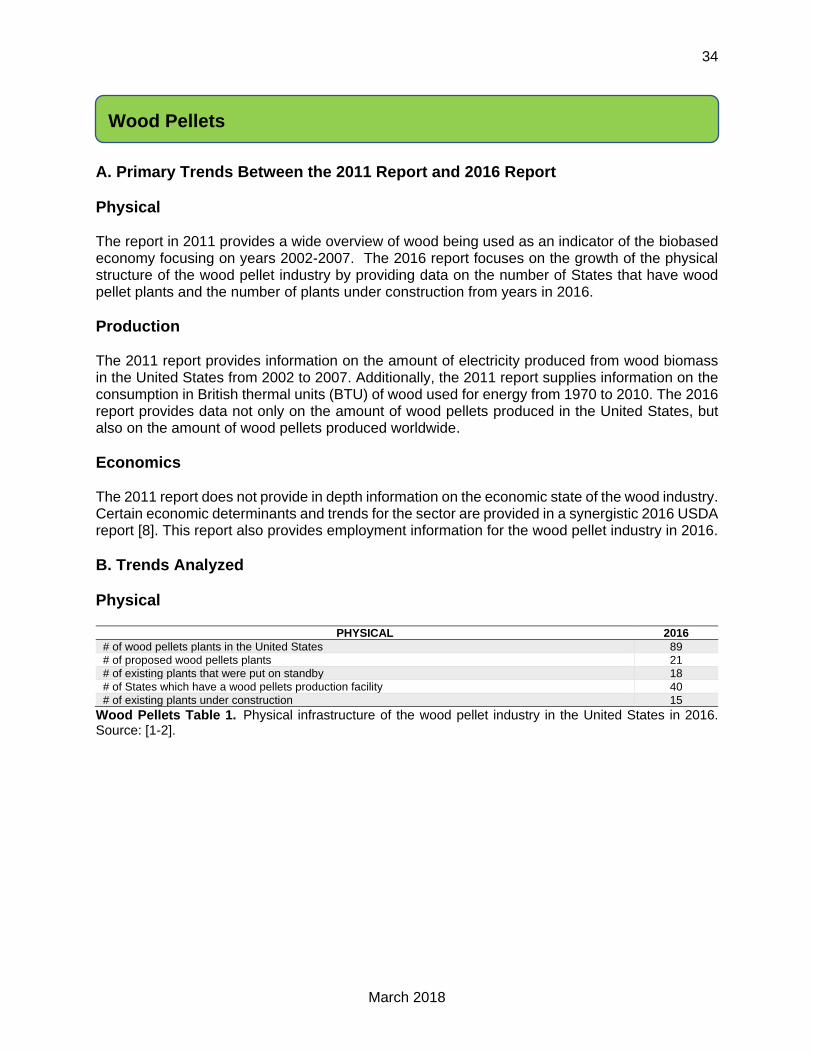
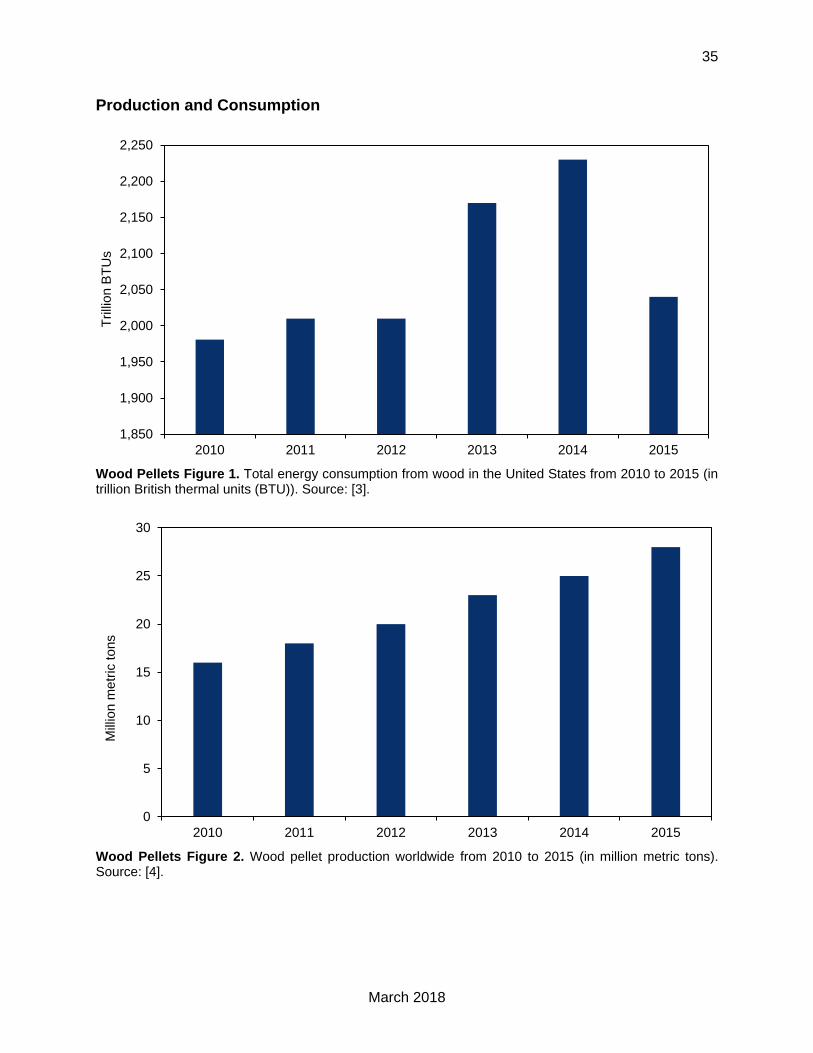
Production The 2011 report provides information on the amount of electricity produced from wood biomass in the United States from 2002 to 2007. Additionally, the 2011 report supplies information on the consumption in British thermal units (BTU) of wood used for energy from 1970 to 2010. The 2016 report provides data not only on the amount of wood pellets produced in the United States, but also on the amount of wood pellets produced worldwide.
Economics The 2011 report does not provide in depth information on the economic state of the wood industry. Certain economic determinants and trends for the sector are provided in a synergistic 2016 USDA report [8]. This report also provides employment information for the wood pellet industry in 2016.
B. Trends Analyzed
Physical
PHYSICAL 2016
# of wood pellets plants in the United States 89
# of proposed wood pellets plants 21
# of existing plants that were put on standby 18
# of States which have a wood pellets production facility 40
# of existing plants under construction 15
Wood Pellets Table 1. Physical infrastructure of the wood pellet industry in the United States in 2016. Source: [1-2].
Wood Pellets
35
March 2018
Production and Consumption
Wood Pellets Figure 1. Total energy consumption from wood in the United States from 2010 to 2015 (in trillion British thermal units (BTU)). Source: [3].
Wood Pellets Figure 2. Wood pellet production worldwide from 2010 to 2015 (in million metric tons). Source: [4].
1,850
1,900
1,950
2,000
2,050
2,100
2,150
2,200
2,250
2010 2011 2012 2013 2014 2015
Trilli
on
BT
Us
0
5
10
15
20
25
30
2010 2011 2012 2013 2014 2015
Mill
ion
me
tric
to
ns
36
March 2018
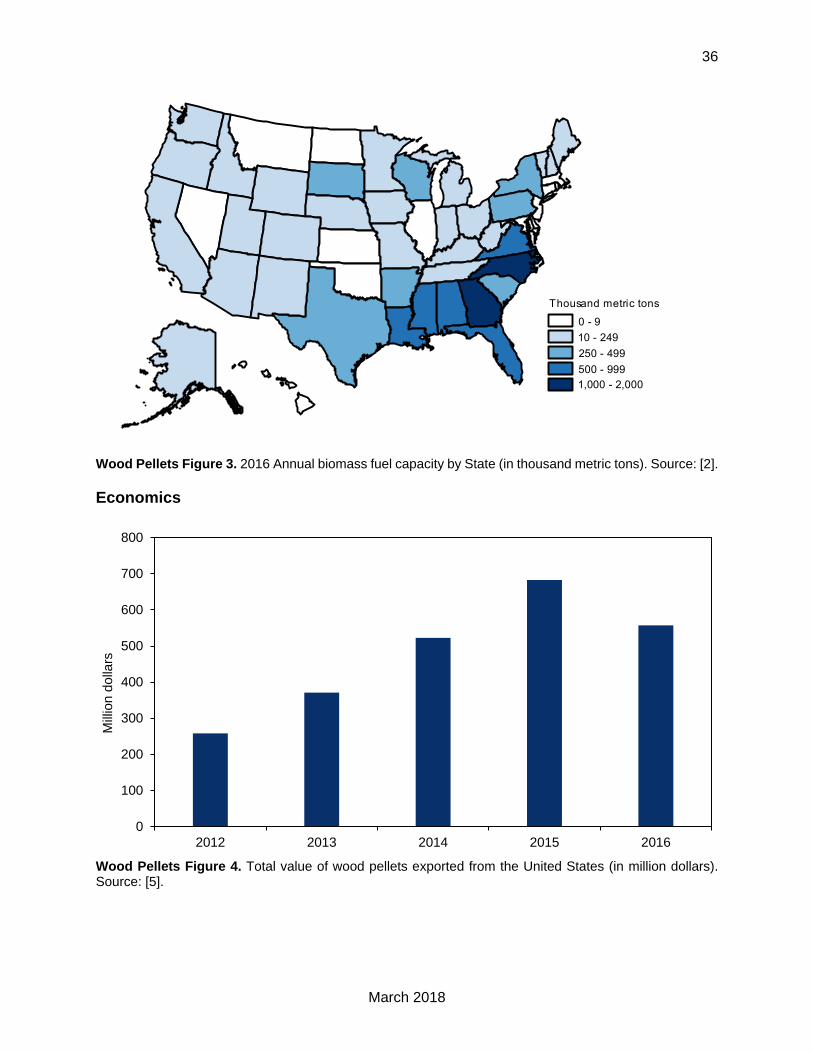
Wood Pellets Figure 3. 2016 Annual biomass fuel capacity by State (in thousand metric tons). Source: [2].
Economics
Wood Pellets Figure 4. Total value of wood pellets exported from the United States (in million dollars). Source: [5].
, ,
housand metric tons
0
100
200
300
400
500
600
700
800
2012 2013 2014 2015 2016
Mill
ion
do
llars
37
March 2018
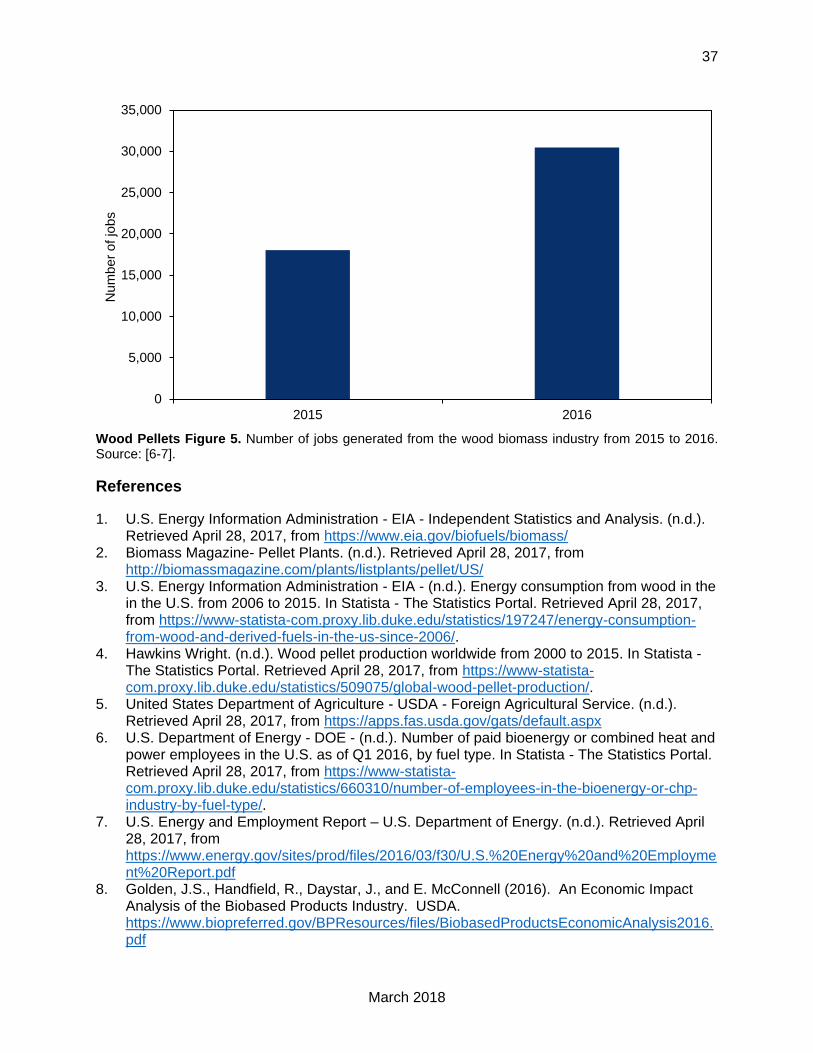
Wood Pellets Figure 5. Number of jobs generated from the wood biomass industry from 2015 to 2016. Source: [6-7].
References
1. U.S. Energy Information Administration - EIA - Independent Statistics and Analysis. (n.d.). Retrieved April 28, 2017, from https://www.eia.gov/biofuels/biomass/
2. Biomass Magazine- Pellet Plants. (n.d.). Retrieved April 28, 2017, from http://biomassmagazine.com/plants/listplants/pellet/US/
3. U.S. Energy Information Administration - EIA - (n.d.). Energy consumption from wood in the in the U.S. from 2006 to 2015. In Statista - The Statistics Portal. Retrieved April 28, 2017, from https://www-statista-com.proxy.lib.duke.edu/statistics/197247/energy-consumption-from-wood-and-derived-fuels-in-the-us-since-2006/.
4. Hawkins Wright. (n.d.). Wood pellet production worldwide from 2000 to 2015. In Statista - The Statistics Portal. Retrieved April 28, 2017, from https://www-statista-com.proxy.lib.duke.edu/statistics/509075/global-wood-pellet-production/.
5. United States Department of Agriculture - USDA - Foreign Agricultural Service. (n.d.). Retrieved April 28, 2017, from https://apps.fas.usda.gov/gats/default.aspx
6. U.S. Department of Energy - DOE - (n.d.). Number of paid bioenergy or combined heat and power employees in the U.S. as of Q1 2016, by fuel type. In Statista - The Statistics Portal. Retrieved April 28, 2017, from https://www-statista-com.proxy.lib.duke.edu/statistics/660310/number-of-employees-in-the-bioenergy-or-chp-industry-by-fuel-type/.
7. U.S. Energy and Employment Report – U.S. Department of Energy. (n.d.). Retrieved April 28, 2017, from https://www.energy.gov/sites/prod/files/2016/03/f30/U.S.%20Energy%20and%20Employment%20Report.pdf
8. Golden, J.S., Handfield, R., Daystar, J., and E. McConnell (2016). An Economic Impact Analysis of the Biobased Products Industry. USDA. https://www.biopreferred.gov/BPResources/files/BiobasedProductsEconomicAnalysis2016.pdf
0
5,000
10,000
15,000
20,000
25,000
30,000
35,000
2015 2016
Nu
mb
er
of jo
bs
38
March 2018
A. Primary Trends Between the 2011 Report and 2016 Report
Physical The report in 2011 provides a brief overview of waste-to-energy being used as an indicator of the biobased economy. The 2016 report focuses on the growth of the physical structure of waste-to-energy facilities by providing data on the number of States that have waste-to-energy plants and the number of plants under construction.
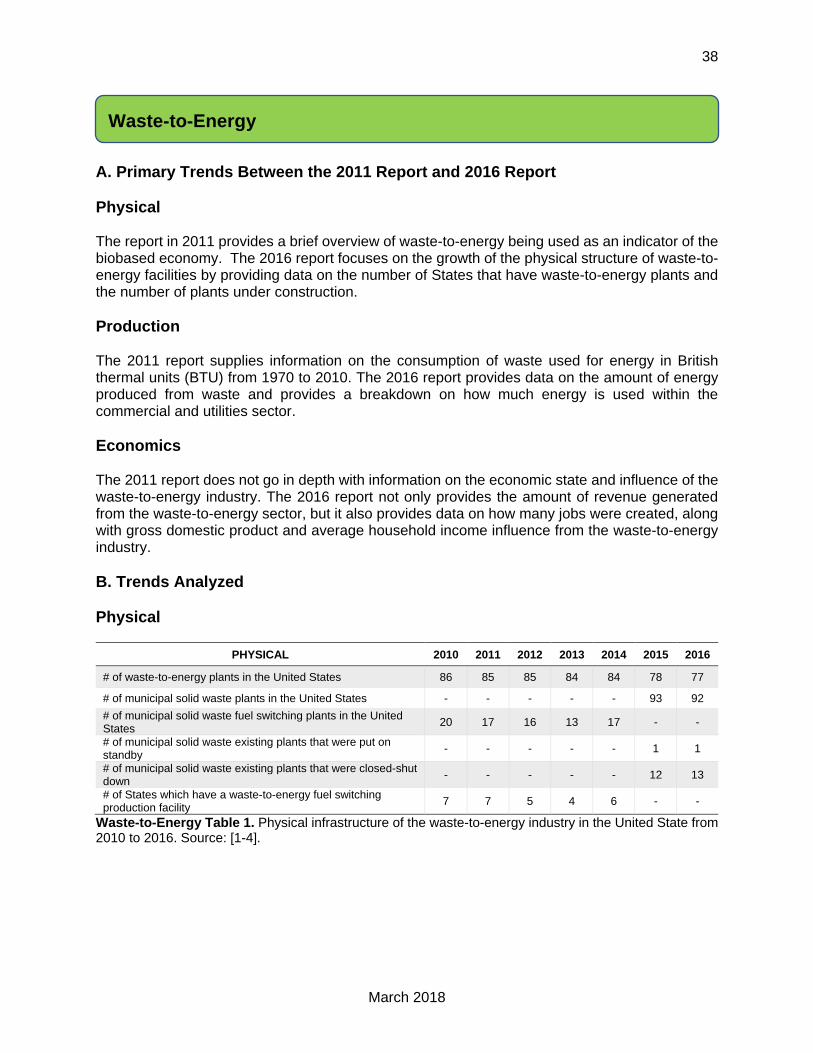
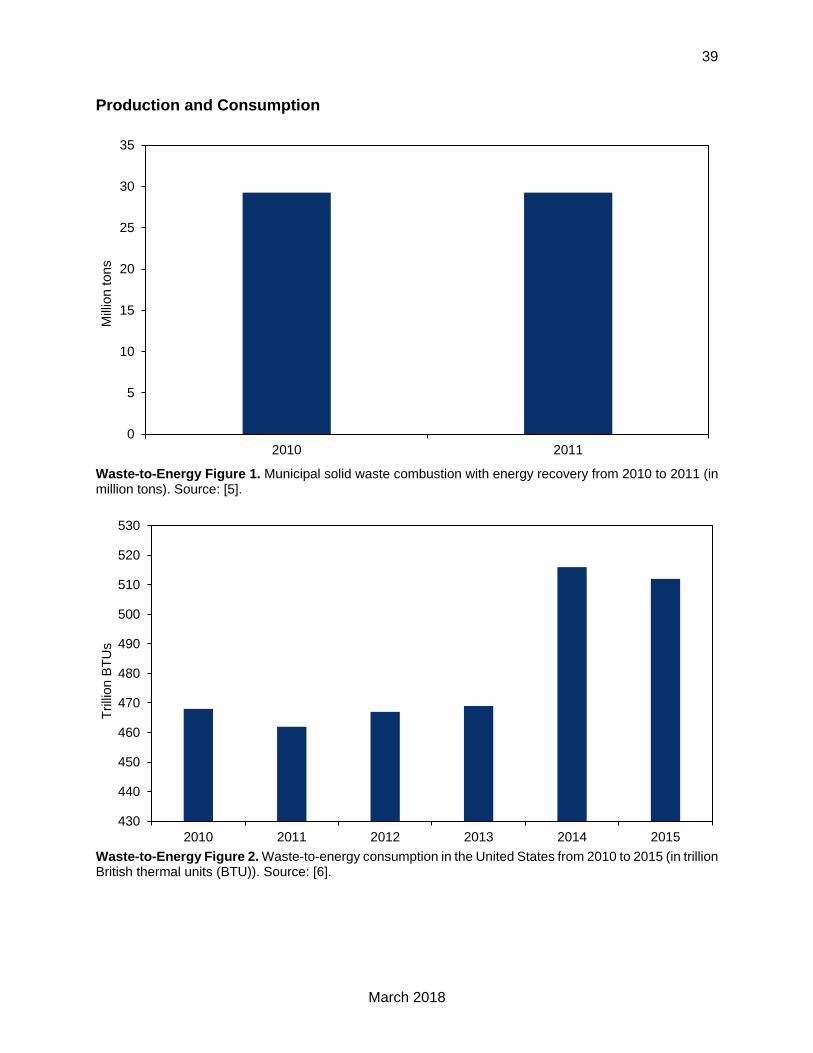
Production The 2011 report supplies information on the consumption of waste used for energy in British thermal units (BTU) from 1970 to 2010. The 2016 report provides data on the amount of energy produced from waste and provides a breakdown on how much energy is used within the commercial and utilities sector.
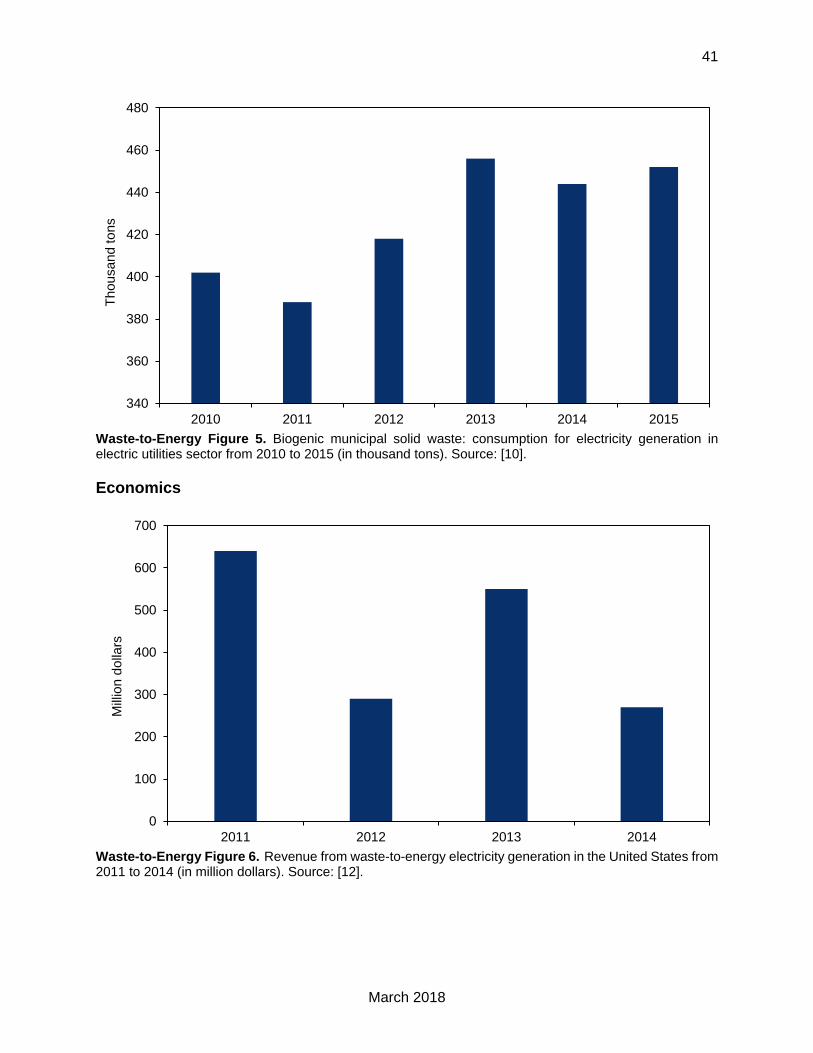
Economics The 2011 report does not go in depth with information on the economic state and influence of the waste-to-energy industry. The 2016 report not only provides the amount of revenue generated from the waste-to-energy sector, but it also provides data on how many jobs were created, along with gross domestic product and average household income influence from the waste-to-energy industry.
B. Trends Analyzed
Physical
PHYSICAL 2010 2011 2012 2013 2014 2015 2016
# of waste-to-energy plants in the United States 86 85 85 84 84 78 77
# of municipal solid waste plants in the United States - - - - - 93 92
# of municipal solid waste fuel switching plants in the United States
20 17 16 13 17 - -
# of municipal solid waste existing plants that were put on standby
- - - - - 1 1
# of municipal solid waste existing plants that were closed-shut down
- - - - - 12 13
# of States which have a waste-to-energy fuel switching production facility
7 7 5 4 6 - -
Waste-to-Energy Table 1. Physical infrastructure of the waste-to-energy industry in the United State from 2010 to 2016. Source: [1-4].
Waste-to-Energy
39
March 2018
Production and Consumption
Waste-to-Energy Figure 1. Municipal solid waste combustion with energy recovery from 2010 to 2011 (in million tons). Source: [5].
Waste-to-Energy Figure 2. Waste-to-energy consumption in the United States from 2010 to 2015 (in trillion British thermal units (BTU)). Source: [6].
0
5
10
15
20
25
30
35
2010 2011
Mill
ion
to
ns
430
440
450
460
470
480
490
500
510
520
530
2010 2011 2012 2013 2014 2015
Trilli
on
BT
Us
40
March 2018
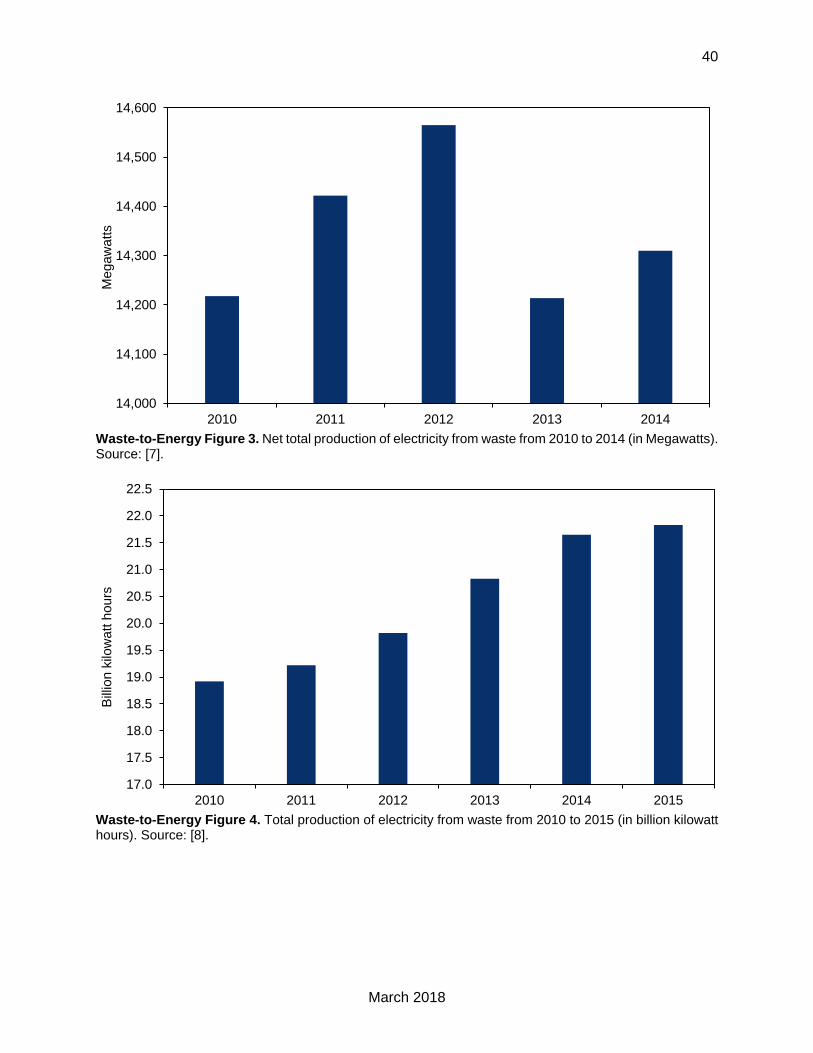
Waste-to-Energy Figure 3. Net total production of electricity from waste from 2010 to 2014 (in Megawatts). Source: [7].
Waste-to-Energy Figure 4. Total production of electricity from waste from 2010 to 2015 (in billion kilowatt hours). Source: [8].
14,000
14,100
14,200
14,300
14,400
14,500
14,600
2010 2011 2012 2013 2014
Me
ga
wa
tts
17.0
17.5
18.0
18.5
19.0
19.5
20.0
20.5
21.0
21.5
22.0
22.5
2010 2011 2012 2013 2014 2015
Bill
ion
kilo
wa
tt h
ou
rs
41
March 2018
Waste-to-Energy Figure 5. Biogenic municipal solid waste: consumption for electricity generation in electric utilities sector from 2010 to 2015 (in thousand tons). Source: [10].
Economics
Waste-to-Energy Figure 6. Revenue from waste-to-energy electricity generation in the United States from 2011 to 2014 (in million dollars). Source: [12].
340
360
380
400
420
440
460
480
2010 2011 2012 2013 2014 2015
Th
ou
sa
nd
to
ns
0
100
200
300
400
500
600
700
2011 2012 2013 2014
Mill
ion
do
llars
42
March 2018
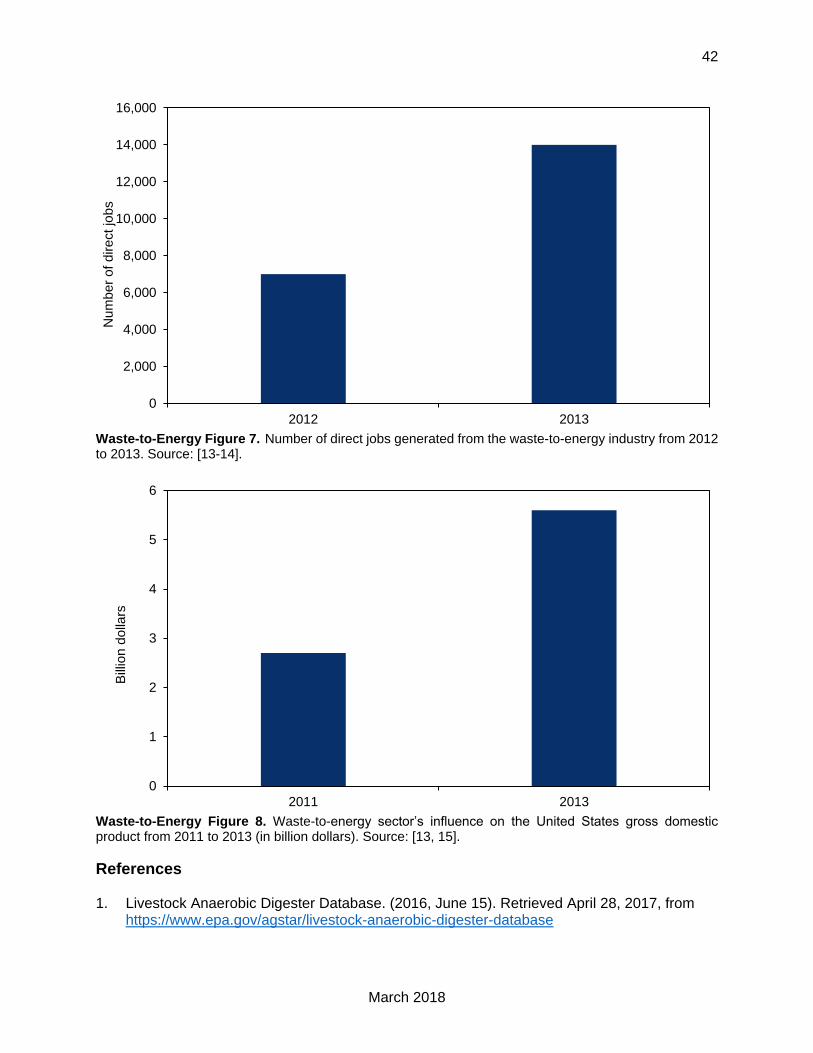
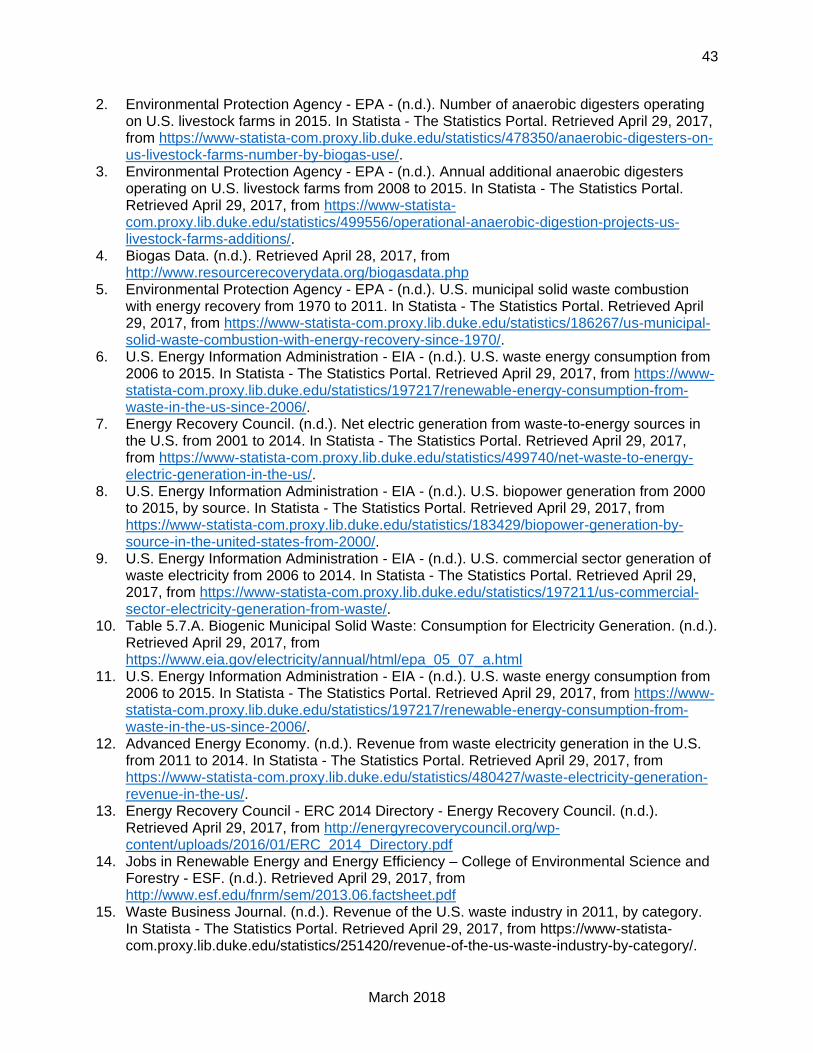
Waste-to-Energy Figure 7. Number of direct jobs generated from the waste-to-energy industry from 2012 to 2013. Source: [13-14].
Waste-to-Energy Figure 8. Waste-to-energy sector’s influence on the United States gross domestic product from 2011 to 2013 (in billion dollars). Source: [13, 15].
References 1. Livestock Anaerobic Digester Database. (2016, June 15). Retrieved April 28, 2017, from
https://www.epa.gov/agstar/livestock-anaerobic-digester-database
0
2,000
4,000
6,000
8,000
10,000
12,000
14,000
16,000
2012 2013
Nu
mb
er
of d
ire
ct jo
bs
0
1
2
3
4
5
6
2011 2013
Bill
ion
do
llars
43
March 2018
2. Environmental Protection Agency - EPA - (n.d.). Number of anaerobic digesters operating on U.S. livestock farms in 2015. In Statista - The Statistics Portal. Retrieved April 29, 2017, from https://www-statista-com.proxy.lib.duke.edu/statistics/478350/anaerobic-digesters-on-us-livestock-farms-number-by-biogas-use/.
3. Environmental Protection Agency - EPA - (n.d.). Annual additional anaerobic digesters operating on U.S. livestock farms from 2008 to 2015. In Statista - The Statistics Portal. Retrieved April 29, 2017, from https://www-statista-com.proxy.lib.duke.edu/statistics/499556/operational-anaerobic-digestion-projects-us-livestock-farms-additions/.
4. Biogas Data. (n.d.). Retrieved April 28, 2017, from http://www.resourcerecoverydata.org/biogasdata.php
5. Environmental Protection Agency - EPA - (n.d.). U.S. municipal solid waste combustion with energy recovery from 1970 to 2011. In Statista - The Statistics Portal. Retrieved April 29, 2017, from https://www-statista-com.proxy.lib.duke.edu/statistics/186267/us-municipal-solid-waste-combustion-with-energy-recovery-since-1970/.
6. U.S. Energy Information Administration - EIA - (n.d.). U.S. waste energy consumption from 2006 to 2015. In Statista - The Statistics Portal. Retrieved April 29, 2017, from https://www-statista-com.proxy.lib.duke.edu/statistics/197217/renewable-energy-consumption-from-waste-in-the-us-since-2006/.
7. Energy Recovery Council. (n.d.). Net electric generation from waste-to-energy sources in the U.S. from 2001 to 2014. In Statista - The Statistics Portal. Retrieved April 29, 2017, from https://www-statista-com.proxy.lib.duke.edu/statistics/499740/net-waste-to-energy-electric-generation-in-the-us/.
8. U.S. Energy Information Administration - EIA - (n.d.). U.S. biopower generation from 2000 to 2015, by source. In Statista - The Statistics Portal. Retrieved April 29, 2017, from https://www-statista-com.proxy.lib.duke.edu/statistics/183429/biopower-generation-by-source-in-the-united-states-from-2000/.
9. U.S. Energy Information Administration - EIA - (n.d.). U.S. commercial sector generation of waste electricity from 2006 to 2014. In Statista - The Statistics Portal. Retrieved April 29, 2017, from https://www-statista-com.proxy.lib.duke.edu/statistics/197211/us-commercial-sector-electricity-generation-from-waste/.
10. Table 5.7.A. Biogenic Municipal Solid Waste: Consumption for Electricity Generation. (n.d.). Retrieved April 29, 2017, from https://www.eia.gov/electricity/annual/html/epa_05_07_a.html
11. U.S. Energy Information Administration - EIA - (n.d.). U.S. waste energy consumption from 2006 to 2015. In Statista - The Statistics Portal. Retrieved April 29, 2017, from https://www-statista-com.proxy.lib.duke.edu/statistics/197217/renewable-energy-consumption-from-waste-in-the-us-since-2006/.
12. Advanced Energy Economy. (n.d.). Revenue from waste electricity generation in the U.S. from 2011 to 2014. In Statista - The Statistics Portal. Retrieved April 29, 2017, from https://www-statista-com.proxy.lib.duke.edu/statistics/480427/waste-electricity-generation-revenue-in-the-us/.
13. Energy Recovery Council - ERC 2014 Directory - Energy Recovery Council. (n.d.). Retrieved April 29, 2017, from http://energyrecoverycouncil.org/wp-content/uploads/2016/01/ERC_2014_Directory.pdf
14. Jobs in Renewable Energy and Energy Efficiency – College of Environmental Science and Forestry - ESF. (n.d.). Retrieved April 29, 2017, from http://www.esf.edu/fnrm/sem/2013.06.factsheet.pdf
15. Waste Business Journal. (n.d.). Revenue of the U.S. waste industry in 2011, by category. In Statista - The Statistics Portal. Retrieved April 29, 2017, from https://www-statista-com.proxy.lib.duke.edu/statistics/251420/revenue-of-the-us-waste-industry-by-category/.
44
March 2018
A. Primary Trends Between the 2011 Report and 2016 Report
Physical The report in 2011 does not provide information on the current state of the biogas industry in the United States. The 2016 report focuses on the growth of the physical structure of anaerobic digesters and other biogas facilities by providing data on the number of States that have installed plants, the number of plants under construction, and plants that have been shut down from 2010 to 2016.
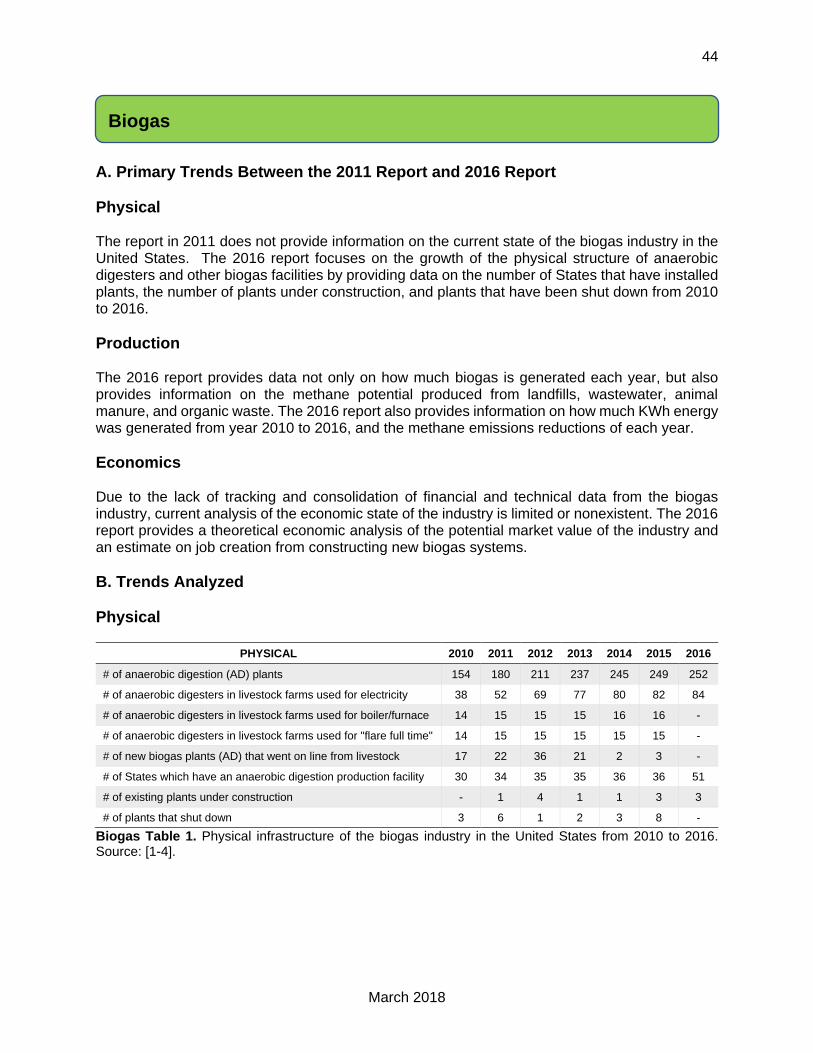
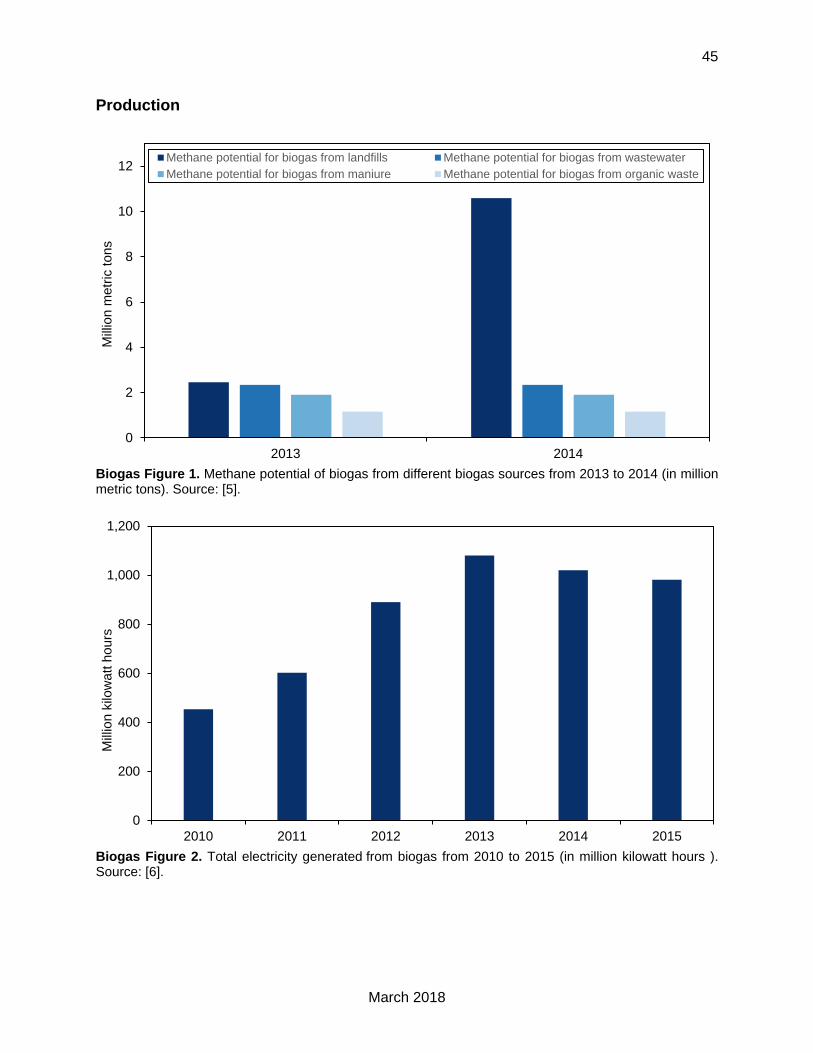
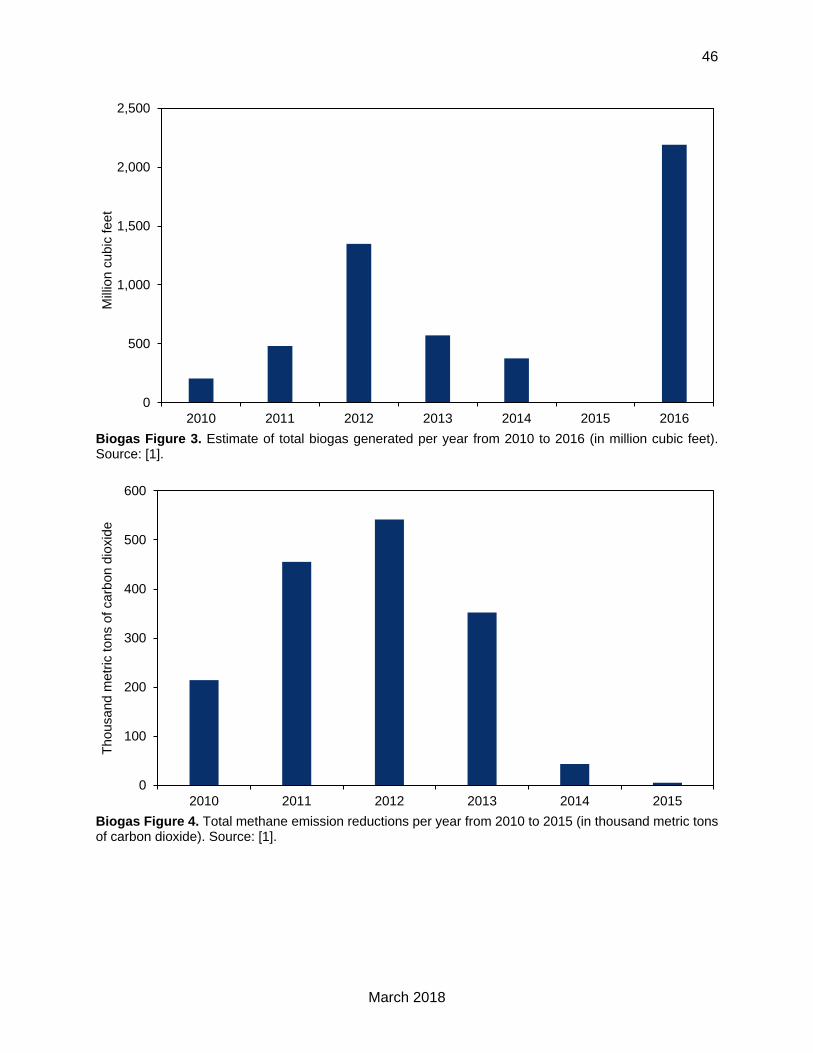
Production The 2016 report provides data not only on how much biogas is generated each year, but also provides information on the methane potential produced from landfills, wastewater, animal manure, and organic waste. The 2016 report also provides information on how much KWh energy was generated from year 2010 to 2016, and the methane emissions reductions of each year.
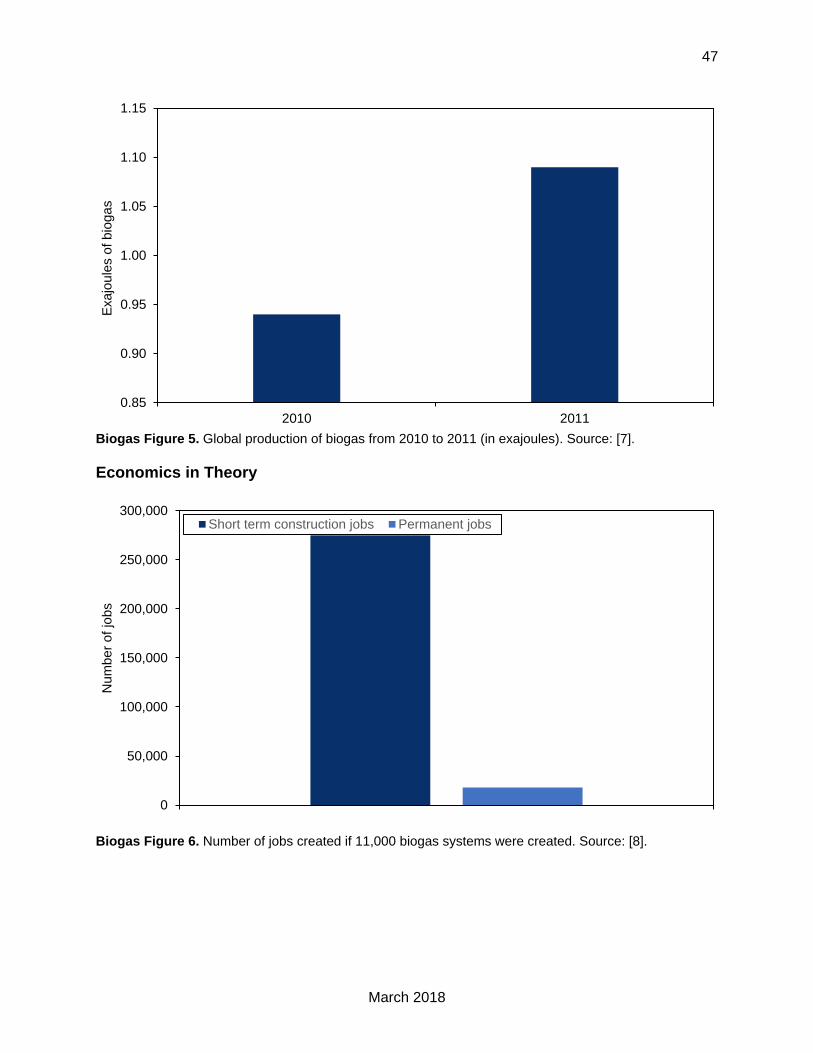
Economics Due to the lack of tracking and consolidation of financial and technical data from the biogas industry, current analysis of the economic state of the industry is limited or nonexistent. The 2016 report provides a theoretical economic analysis of the potential market value of the industry and an estimate on job creation from constructing new biogas systems.
B. Trends Analyzed
Physical
PHYSICAL 2010 2011 2012 2013 2014 2015 2016
# of anaerobic digestion (AD) plants 154 180 211 237 245 249 252
# of anaerobic digesters in livestock farms used for electricity 38 52 69 77 80 82 84
# of anaerobic digesters in livestock farms used for boiler/furnace 14 15 15 15 16 16 -
# of anaerobic digesters in livestock farms used for "flare full time" 14 15 15 15 15 15 -
# of new biogas plants (AD) that went on line from livestock 17 22 36 21 2 3 -
# of States which have an anaerobic digestion production facility 30 34 35 35 36 36 51
# of existing plants under construction - 1 4 1 1 3 3
# of plants that shut down 3 6 1 2 3 8 -
Biogas Table 1. Physical infrastructure of the biogas industry in the United States from 2010 to 2016. Source: [1-4].
Biogas
45
March 2018
Production
Biogas Figure 1. Methane potential of biogas from different biogas sources from 2013 to 2014 (in million metric tons). Source: [5].
Biogas Figure 2. Total electricity generated from biogas from 2010 to 2015 (in million kilowatt hours ). Source: [6].
0
2
4
6
8
10
12
2013 2014
Mill
ion
me
tric
to
ns
Methane potential for biogas from landfills Methane potential for biogas from wastewater
Methane potential for biogas from maniure Methane potential for biogas from organic waste
0
200
400
600
800
1,000
1,200
2010 2011 2012 2013 2014 2015
Mill
ion
kilo
wa
tt h
ou
rs
46
March 2018
Biogas Figure 3. Estimate of total biogas generated per year from 2010 to 2016 (in million cubic feet). Source: [1].
Biogas Figure 4. Total methane emission reductions per year from 2010 to 2015 (in thousand metric tons of carbon dioxide). Source: [1].
0
500
1,000
1,500
2,000
2,500
2010 2011 2012 2013 2014 2015 2016
Mill
ion
cu
bic
fe
et
0
100
200
300
400
500
600
2010 2011 2012 2013 2014 2015
Th
ou
sa
nd
me
tric
to
ns o
f ca
rbo
n d
ioxid
e
47
March 2018
Biogas Figure 5. Global production of biogas from 2010 to 2011 (in exajoules). Source: [7].
Economics in Theory
Biogas Figure 6. Number of jobs created if 11,000 biogas systems were created. Source: [8].
0.85
0.90
0.95
1.00
1.05
1.10
1.15
2010 2011
Exa
jou
les o
f b
iog
as
0
50,000
100,000
150,000
200,000
250,000
300,000
Nu
mb
er
of jo
bs
Short term construction jobs Permanent jobs
48
March 2018
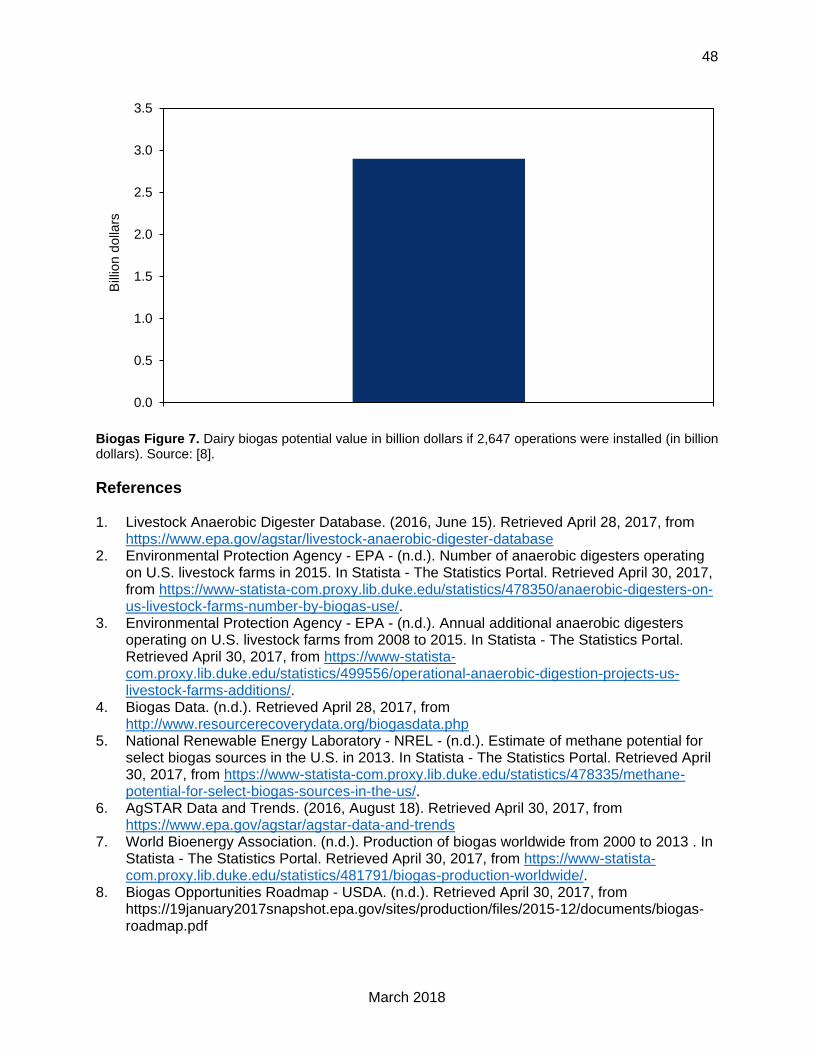
Biogas Figure 7. Dairy biogas potential value in billion dollars if 2,647 operations were installed (in billion dollars). Source: [8].
References 1. Livestock Anaerobic Digester Database. (2016, June 15). Retrieved April 28, 2017, from
https://www.epa.gov/agstar/livestock-anaerobic-digester-database 2. Environmental Protection Agency - EPA - (n.d.). Number of anaerobic digesters operating
on U.S. livestock farms in 2015. In Statista - The Statistics Portal. Retrieved April 30, 2017, from https://www-statista-com.proxy.lib.duke.edu/statistics/478350/anaerobic-digesters-on-us-livestock-farms-number-by-biogas-use/.
3. Environmental Protection Agency - EPA - (n.d.). Annual additional anaerobic digesters operating on U.S. livestock farms from 2008 to 2015. In Statista - The Statistics Portal. Retrieved April 30, 2017, from https://www-statista-com.proxy.lib.duke.edu/statistics/499556/operational-anaerobic-digestion-projects-us-livestock-farms-additions/.
4. Biogas Data. (n.d.). Retrieved April 28, 2017, from http://www.resourcerecoverydata.org/biogasdata.php
5. National Renewable Energy Laboratory - NREL - (n.d.). Estimate of methane potential for select biogas sources in the U.S. in 2013. In Statista - The Statistics Portal. Retrieved April 30, 2017, from https://www-statista-com.proxy.lib.duke.edu/statistics/478335/methane-potential-for-select-biogas-sources-in-the-us/.
6. AgSTAR Data and Trends. (2016, August 18). Retrieved April 30, 2017, from https://www.epa.gov/agstar/agstar-data-and-trends
7. World Bioenergy Association. (n.d.). Production of biogas worldwide from 2000 to 2013 . In Statista - The Statistics Portal. Retrieved April 30, 2017, from https://www-statista-com.proxy.lib.duke.edu/statistics/481791/biogas-production-worldwide/.
8. Biogas Opportunities Roadmap - USDA. (n.d.). Retrieved April 30, 2017, from https://19january2017snapshot.epa.gov/sites/production/files/2015-12/documents/biogas-roadmap.pdf
0.0
0.5
1.0
1.5
2.0
2.5
3.0
3.5B
illio
n d
olla
rs
49
March 2018
RENEWABLE CHEMICALS AND BIOBASED PRODUCTS
50
March 2018
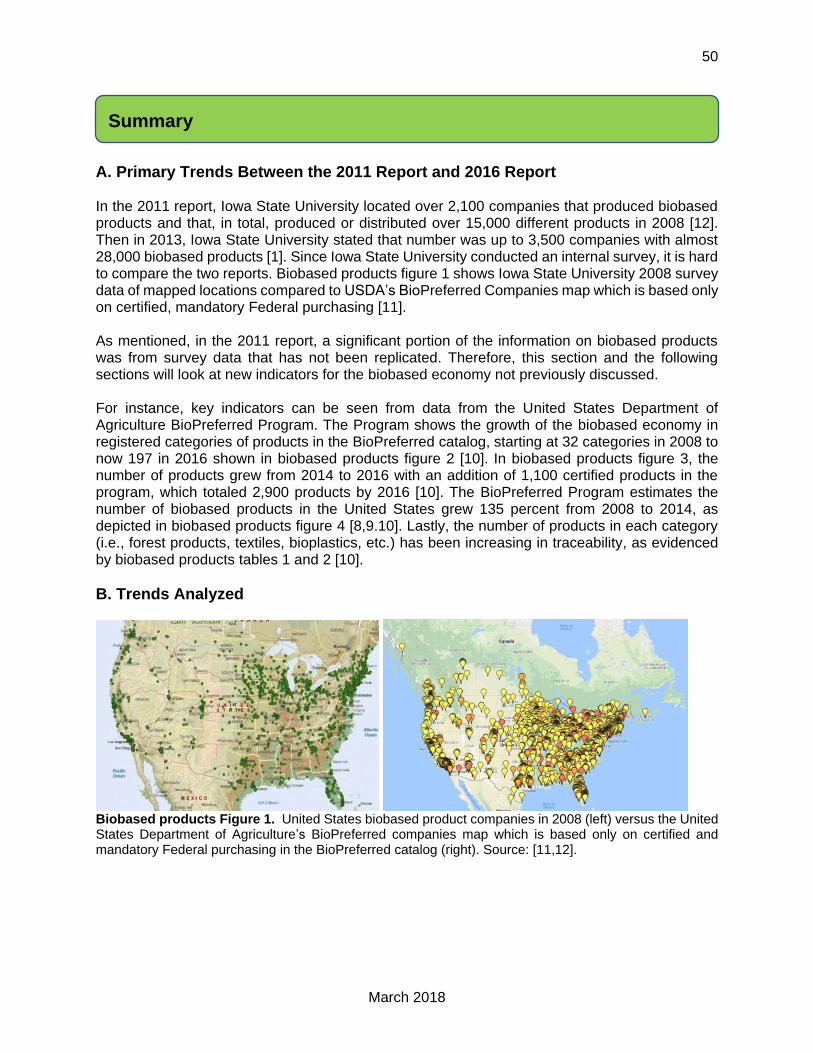
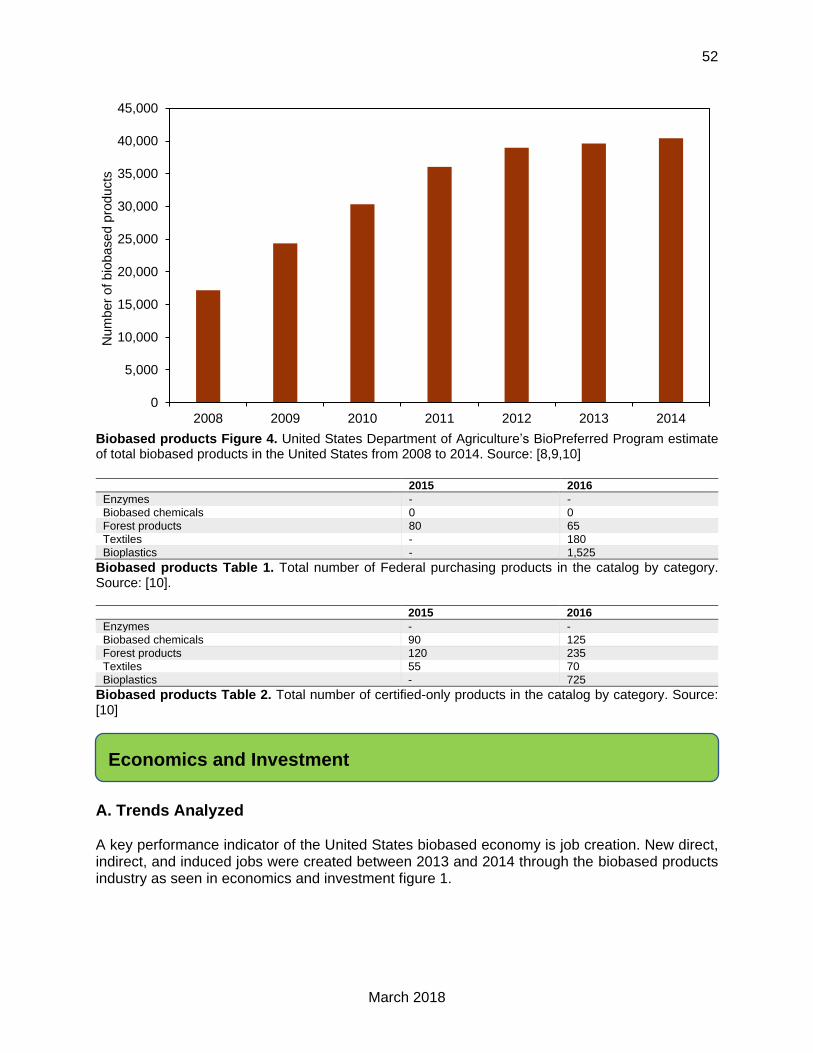
A. Primary Trends Between the 2011 Report and 2016 Report In the 2011 report, Iowa State University located over 2,100 companies that produced biobased products and that, in total, produced or distributed over 15,000 different products in 2008 [12]. Then in 2013, Iowa State University stated that number was up to 3,500 companies with almost 28,000 biobased products [1]. Since Iowa State University conducted an internal survey, it is hard to compare the two reports. Biobased products figure 1 shows Iowa State University 2008 survey data of mapped locations compared to USDA’s BioPreferred Companies map which is based only on certified, mandatory Federal purchasing [11]. As mentioned, in the 2011 report, a significant portion of the information on biobased products was from survey data that has not been replicated. Therefore, this section and the following sections will look at new indicators for the biobased economy not previously discussed. For instance, key indicators can be seen from data from the United States Department of Agriculture BioPreferred Program. The Program shows the growth of the biobased economy in registered categories of products in the BioPreferred catalog, starting at 32 categories in 2008 to now 197 in 2016 shown in biobased products figure 2 [10]. In biobased products figure 3, the number of products grew from 2014 to 2016 with an addition of 1,100 certified products in the program, which totaled 2,900 products by 2016 [10]. The BioPreferred Program estimates the number of biobased products in the United States grew 135 percent from 2008 to 2014, as depicted in biobased products figure 4 [8,9.10]. Lastly, the number of products in each category (i.e., forest products, textiles, bioplastics, etc.) has been increasing in traceability, as evidenced by biobased products tables 1 and 2 [10].
B. Trends Analyzed
Biobased products Figure 1. United States biobased product companies in 2008 (left) versus the United States Department of Agriculture’s BioPreferred companies map which is based only on certified and mandatory Federal purchasing in the BioPreferred catalog (right). Source: [11,12].
Summary

51
March 2018
Biobased products Figure 2. Number of categories for mandatory Federal Purchasing (FP), voluntary labeling categories, and a summed total from 2008 to 2016. Source: [10].
Biobased products Figure 3. Total number of certified products in the United States Department of Agriculture’s BioPreferred Program from 2014 to 2016. Source: [10]
0
50
100
150
200
250
2008 2009 2010 2011 2012 2013 2014 2015 2016
Nu
mb
er
of ca
teg
orie
s
Designed categories Certification-only categories Total categories
0
500
1,000
1,500
2,000
2,500
3,000
3,500
2014 2015 2016
Nu
mb
er
of ce
rtifie
d p
rod
ucts
52
March 2018
Biobased products Figure 4. United States Department of Agriculture’s BioPreferred Program estimate of total biobased products in the United States from 2008 to 2014. Source: [8,9,10]
2015 2016
Enzymes - -
Biobased chemicals 0 0
Forest products 80 65
Textiles - 180
Bioplastics - 1,525
Biobased products Table 1. Total number of Federal purchasing products in the catalog by category. Source: [10].
2015 2016
Enzymes - -
Biobased chemicals 90 125
Forest products 120 235
Textiles 55 70
Bioplastics - 725
Biobased products Table 2. Total number of certified-only products in the catalog by category. Source: [10]
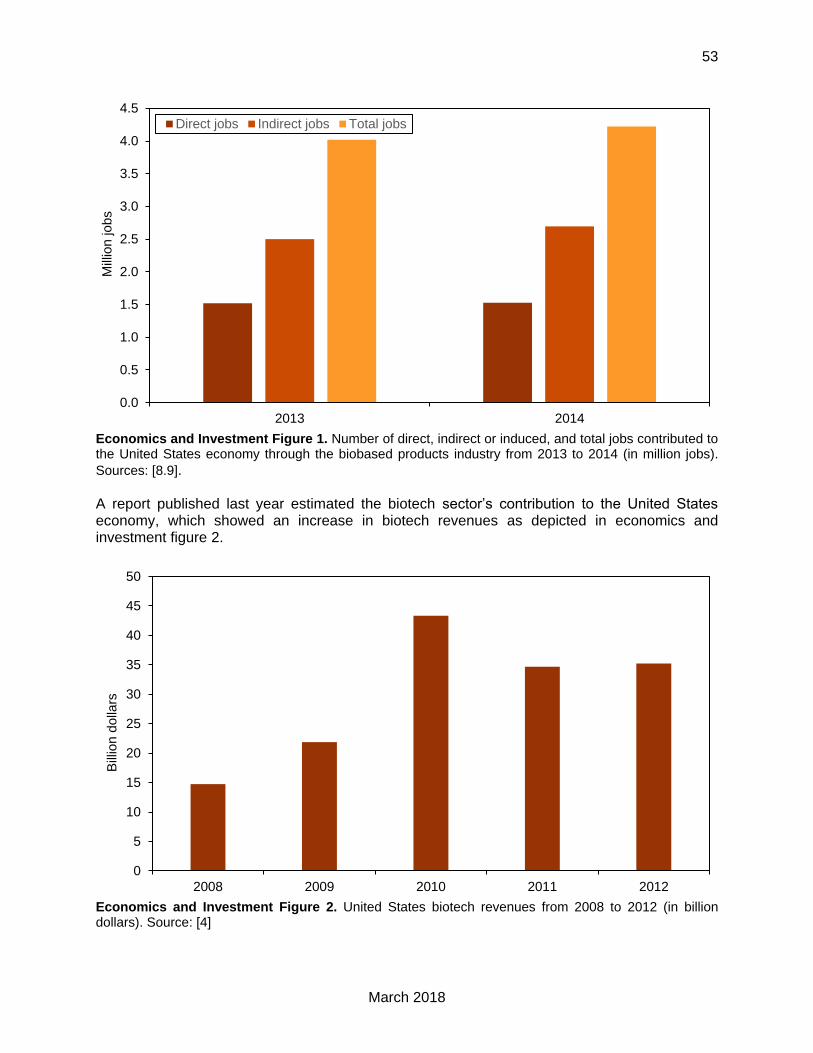
A. Trends Analyzed A key performance indicator of the United States biobased economy is job creation. New direct, indirect, and induced jobs were created between 2013 and 2014 through the biobased products industry as seen in economics and investment figure 1.
0
5,000
10,000
15,000
20,000
25,000
30,000
35,000
40,000
45,000
2008 2009 2010 2011 2012 2013 2014
Nu
mb
er
of b
iob
ase
d p
rod
ucts
Economics and Investment
53
March 2018
Economics and Investment Figure 1. Number of direct, indirect or induced, and total jobs contributed to the United States economy through the biobased products industry from 2013 to 2014 (in million jobs).
Sources: [8.9]. A report published last year estimated the biotech sector’s contribution to the United States economy, which showed an increase in biotech revenues as depicted in economics and investment figure 2.
Economics and Investment Figure 2. United States biotech revenues from 2008 to 2012 (in billion dollars). Source: [4]
0.0
0.5
1.0
1.5
2.0
2.5
3.0
3.5
4.0
4.5
2013 2014
Mill
ion
jo
bs
Direct jobs Indirect jobs Total jobs
0
5
10
15
20
25
30
35
40
45
50
2008 2009 2010 2011 2012
Bill
ion
do
llars
54
March 2018
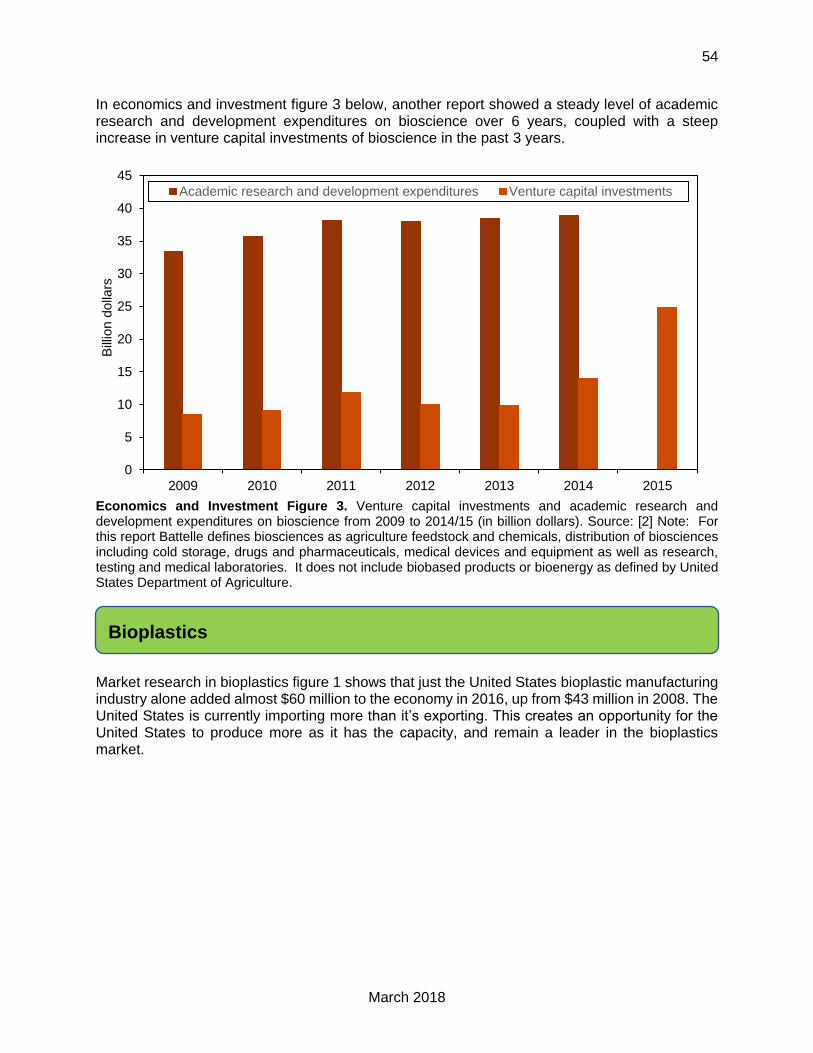
In economics and investment figure 3 below, another report showed a steady level of academic research and development expenditures on bioscience over 6 years, coupled with a steep increase in venture capital investments of bioscience in the past 3 years.
Economics and Investment Figure 3. Venture capital investments and academic research and development expenditures on bioscience from 2009 to 2014/15 (in billion dollars). Source: [2] Note: For this report Battelle defines biosciences as agriculture feedstock and chemicals, distribution of biosciences including cold storage, drugs and pharmaceuticals, medical devices and equipment as well as research, testing and medical laboratories. It does not include biobased products or bioenergy as defined by United States Department of Agriculture.
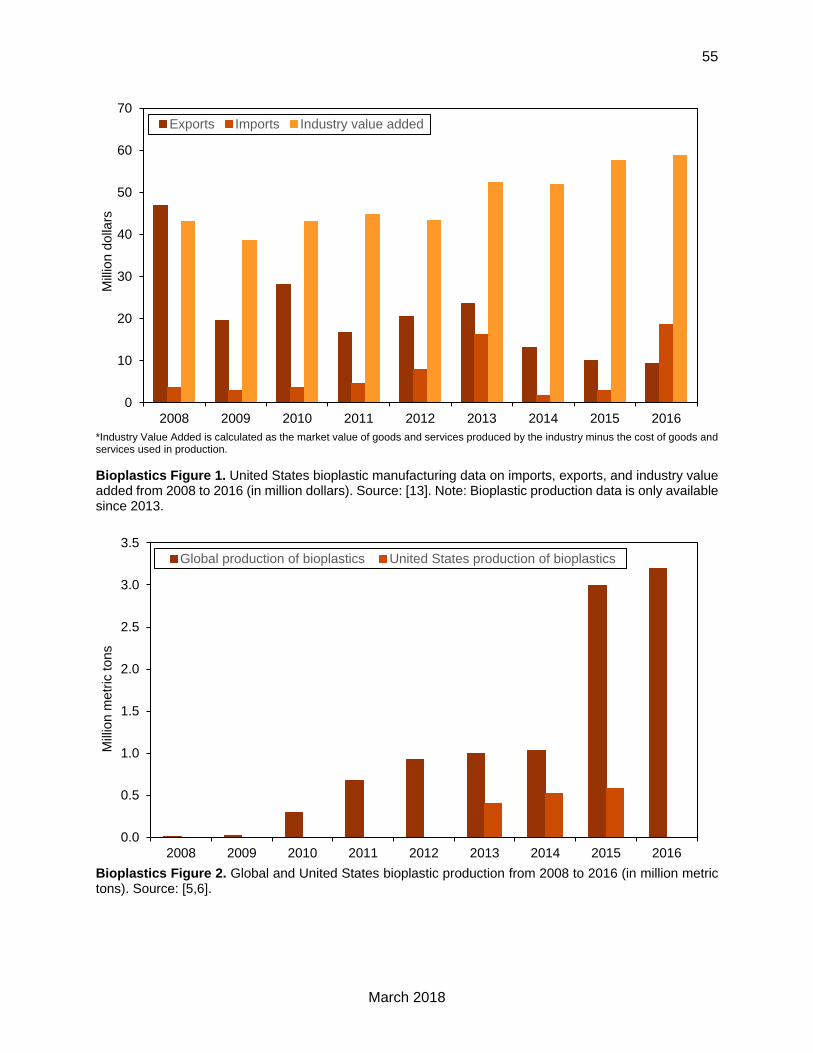
Market research in bioplastics figure 1 shows that just the United States bioplastic manufacturing industry alone added almost $60 million to the economy in 2016, up from $43 million in 2008. The United States is currently importing more than it’s exporting. his creates an opportunity for the United States to produce more as it has the capacity, and remain a leader in the bioplastics market.
0
5
10
15
20
25
30
35
40
45
2009 2010 2011 2012 2013 2014 2015
Bill
ion
do
llars
Academic research and development expenditures Venture capital investments
Bioplastics
55
March 2018
*Industry Value Added is calculated as the market value of goods and services produced by the industry minus the cost of goods and services used in production.
Bioplastics Figure 1. United States bioplastic manufacturing data on imports, exports, and industry value added from 2008 to 2016 (in million dollars). Source: [13]. Note: Bioplastic production data is only available since 2013.
Bioplastics Figure 2. Global and United States bioplastic production from 2008 to 2016 (in million metric tons). Source: [5,6].
0
10
20
30
40
50
60
70
2008 2009 2010 2011 2012 2013 2014 2015 2016
Mill
ion
do
llars
Exports Imports Industry value added
0.0
0.5
1.0
1.5
2.0
2.5
3.0
3.5
2008 2009 2010 2011 2012 2013 2014 2015 2016
Mill
ion
me
tric
to
ns
Global production of bioplastics United States production of bioplastics
56
March 2018
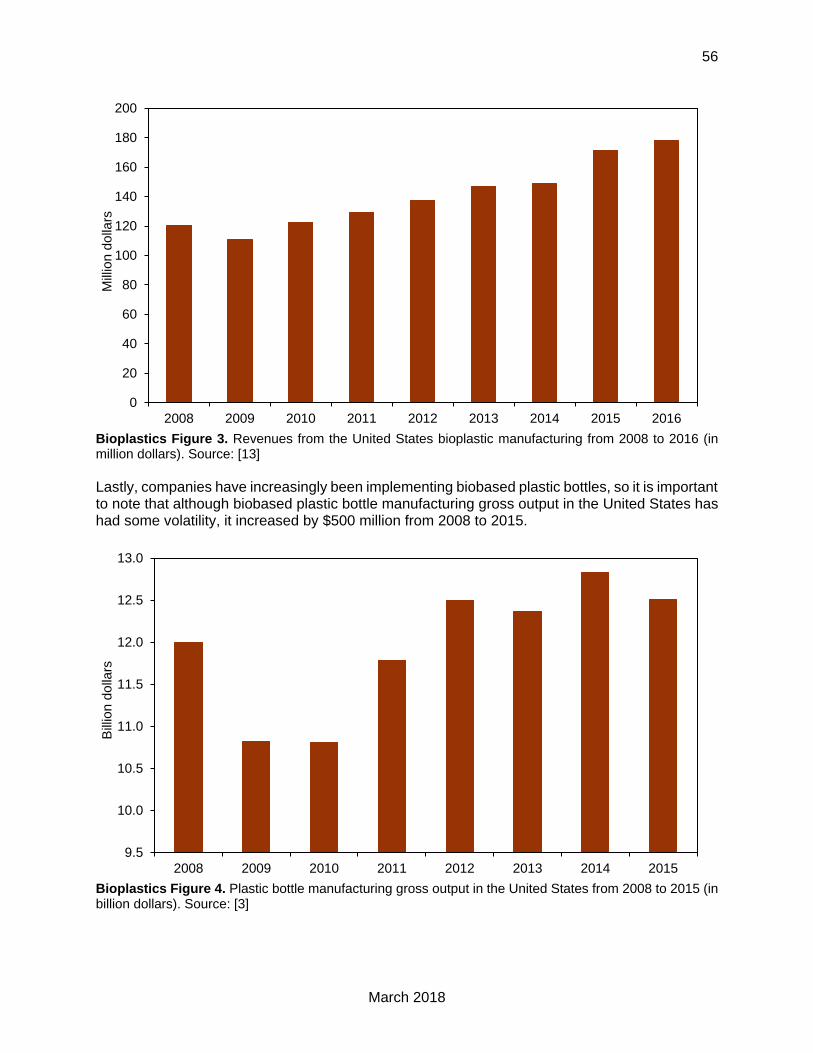
Bioplastics Figure 3. Revenues from the United States bioplastic manufacturing from 2008 to 2016 (in million dollars). Source: [13]
Lastly, companies have increasingly been implementing biobased plastic bottles, so it is important to note that although biobased plastic bottle manufacturing gross output in the United States has had some volatility, it increased by $500 million from 2008 to 2015.
Bioplastics Figure 4. Plastic bottle manufacturing gross output in the United States from 2008 to 2015 (in billion dollars). Source: [3]
0
20
40
60
80
100
120
140
160
180
200
2008 2009 2010 2011 2012 2013 2014 2015 2016
Mill
ion
do
llars
9.5
10.0
10.5
11.0
11.5
12.0
12.5
13.0
2008 2009 2010 2011 2012 2013 2014 2015
Bill
ion
do
llars
57
March 2018
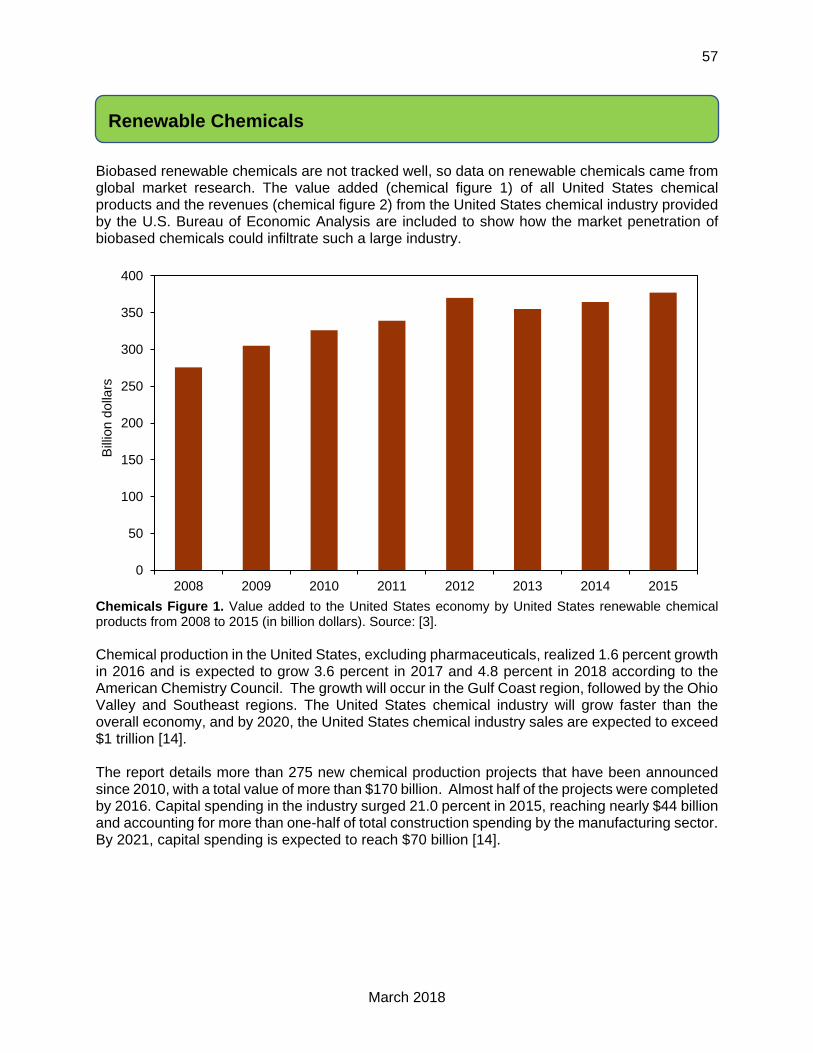
Biobased renewable chemicals are not tracked well, so data on renewable chemicals came from global market research. The value added (chemical figure 1) of all United States chemical products and the revenues (chemical figure 2) from the United States chemical industry provided by the U.S. Bureau of Economic Analysis are included to show how the market penetration of biobased chemicals could infiltrate such a large industry.
Chemicals Figure 1. Value added to the United States economy by United States renewable chemical products from 2008 to 2015 (in billion dollars). Source: [3].
Chemical production in the United States, excluding pharmaceuticals, realized 1.6 percent growth in 2016 and is expected to grow 3.6 percent in 2017 and 4.8 percent in 2018 according to the American Chemistry Council. The growth will occur in the Gulf Coast region, followed by the Ohio Valley and Southeast regions. The United States chemical industry will grow faster than the overall economy, and by 2020, the United States chemical industry sales are expected to exceed $1 trillion [14]. The report details more than 275 new chemical production projects that have been announced since 2010, with a total value of more than $170 billion. Almost half of the projects were completed by 2016. Capital spending in the industry surged 21.0 percent in 2015, reaching nearly $44 billion and accounting for more than one-half of total construction spending by the manufacturing sector. By 2021, capital spending is expected to reach $70 billion [14].
0
50
100
150
200
250
300
350
400
2008 2009 2010 2011 2012 2013 2014 2015
Bill
ion
do
llars
Renewable Chemicals
58
March 2018
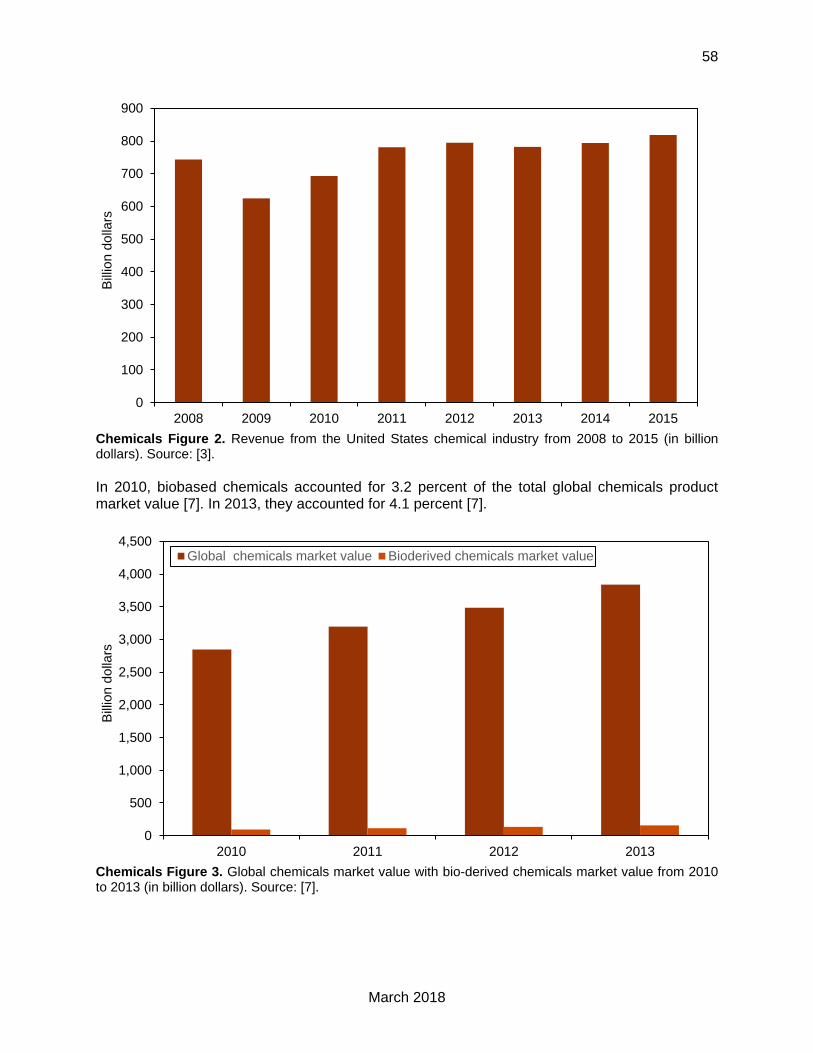
Chemicals Figure 2. Revenue from the United States chemical industry from 2008 to 2015 (in billion dollars). Source: [3].
In 2010, biobased chemicals accounted for 3.2 percent of the total global chemicals product market value [7]. In 2013, they accounted for 4.1 percent [7].
Chemicals Figure 3. Global chemicals market value with bio-derived chemicals market value from 2010 to 2013 (in billion dollars). Source: [7].
0
100
200
300
400
500
600
700
800
900
2008 2009 2010 2011 2012 2013 2014 2015
Bill
ion
do
llars
0
500
1,000
1,500
2,000
2,500
3,000
3,500
4,000
4,500
2010 2011 2012 2013
Bill
ion
do
llars
Global chemicals market value Bioderived chemicals market value
59
March 2018
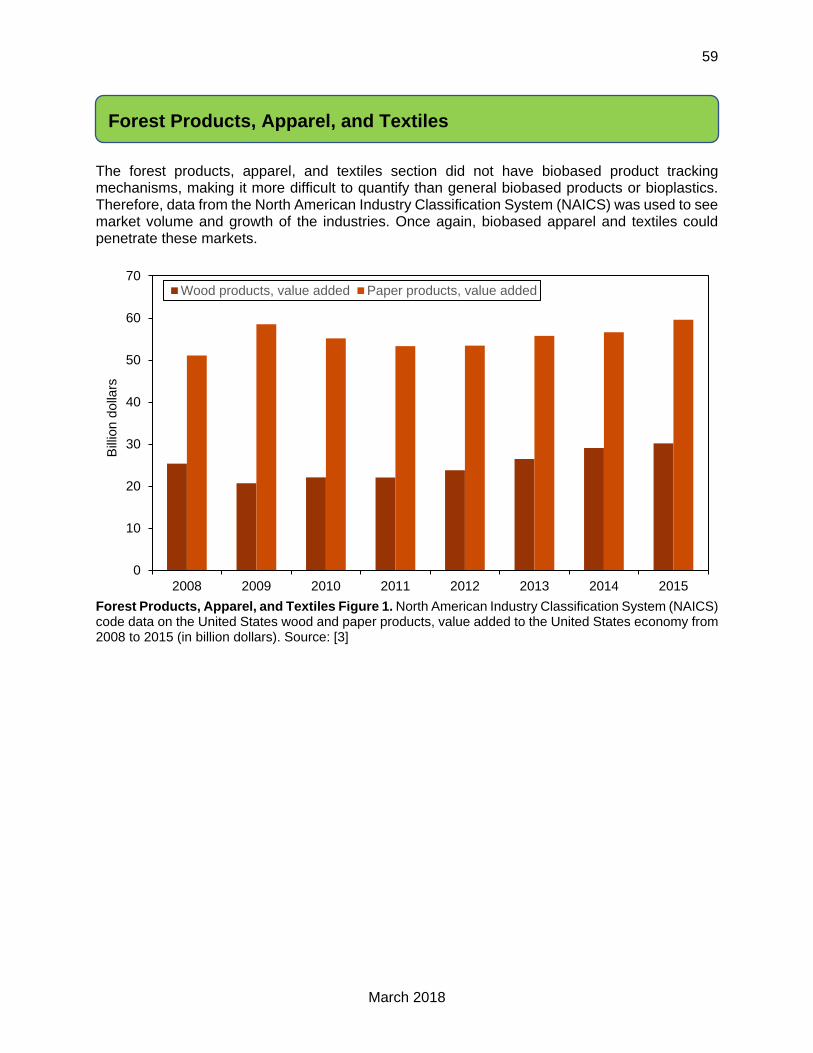
The forest products, apparel, and textiles section did not have biobased product tracking mechanisms, making it more difficult to quantify than general biobased products or bioplastics. Therefore, data from the North American Industry Classification System (NAICS) was used to see market volume and growth of the industries. Once again, biobased apparel and textiles could penetrate these markets.
Forest Products, Apparel, and Textiles Figure 1. North American Industry Classification System (NAICS) code data on the United States wood and paper products, value added to the United States economy from 2008 to 2015 (in billion dollars). Source: [3]
0
10
20
30
40
50
60
70
2008 2009 2010 2011 2012 2013 2014 2015
Bill
ion
do
llars
Wood products, value added Paper products, value added
Forest Products, Apparel, and Textiles
60
March 2018
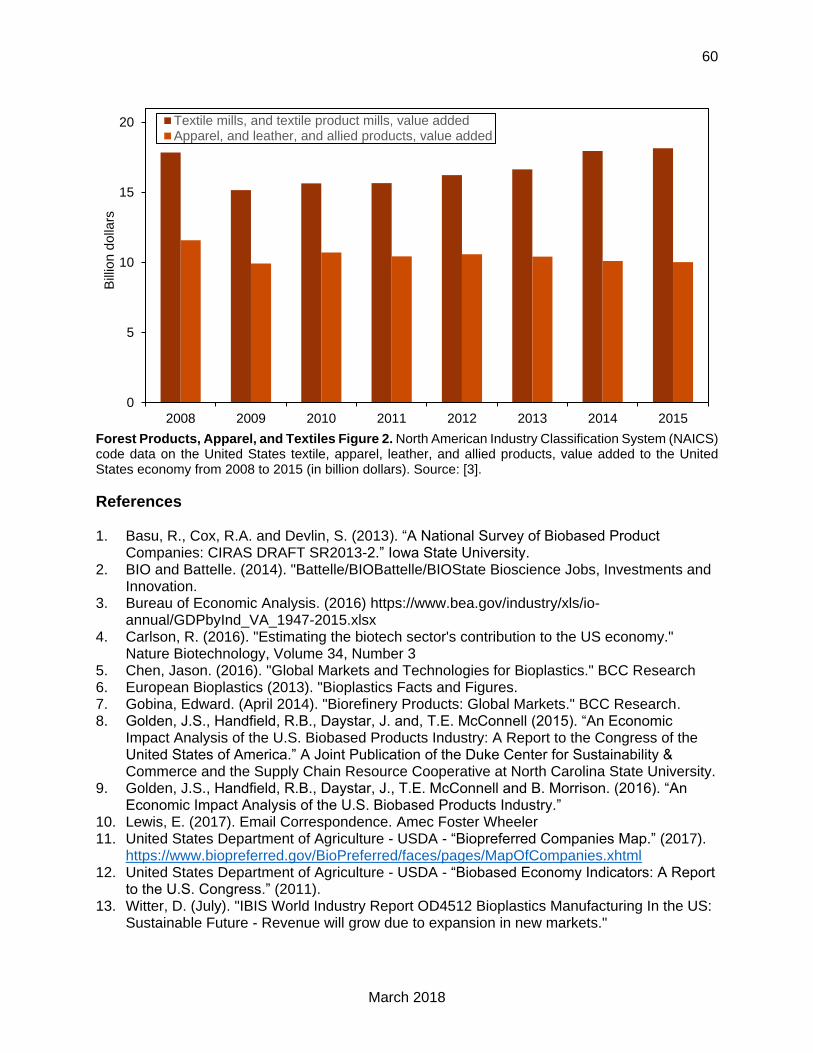
Forest Products, Apparel, and Textiles Figure 2. North American Industry Classification System (NAICS) code data on the United States textile, apparel, leather, and allied products, value added to the United States economy from 2008 to 2015 (in billion dollars). Source: [3].
References 1. Basu, R., Cox, R.A. and Devlin, S. (2013). “A National Survey of Biobased Product
Companies: CIRAS DRAFT SR2013- .” Iowa State University. 2. BIO and Battelle. (2014). "Battelle/BIOBattelle/BIOState Bioscience Jobs, Investments and
Innovation. 3. Bureau of Economic Analysis. (2016) https://www.bea.gov/industry/xls/io-
annual/GDPbyInd_VA_1947-2015.xlsx 4. Carlson, R. (2016). "Estimating the biotech sector's contribution to the US economy."
Nature Biotechnology, Volume 34, Number 3 5. Chen, Jason. (2016). "Global Markets and Technologies for Bioplastics." BCC Research 6. European Bioplastics (2013). "Bioplastics Facts and Figures. 7. Gobina, Edward. (April 2014). "Biorefinery Products: Global Markets." BCC Research. 8. Golden, J.S., Handfield, R.B., Daystar, J. and, .E. McConnell ( ). “An Economic
Impact Analysis of the U.S. Biobased Products Industry: A Report to the Congress of the United States of America.” A Joint Publication of the Duke Center for Sustainability & Commerce and the Supply Chain Resource Cooperative at North Carolina State University.
9. Golden, J.S., Handfield, R.B., Daystar, J., .E. McConnell and B. Morrison. ( 6). “An Economic Impact Analysis of the U.S. Biobased Products Industry.”
10. Lewis, E. (2017). Email Correspondence. Amec Foster Wheeler 11. United States Department of Agriculture - USDA - “Biopreferred Companies Map.” (2017).
https://www.biopreferred.gov/BioPreferred/faces/pages/MapOfCompanies.xhtml 12. United States Department of Agriculture - USDA - “Biobased Economy Indicators: A Report
to the U.S. Congress.” (2011). 13. Witter, D. (July). "IBIS World Industry Report OD4512 Bioplastics Manufacturing In the US:
Sustainable Future - Revenue will grow due to expansion in new markets."
0
5
10
15
20
2008 2009 2010 2011 2012 2013 2014 2015
Bill
ion
do
llars
Textile mills, and textile product mills, value addedApparel, and leather, and allied products, value added
61
March 2018
14. American Chemistry Society (2016). Year-End 2016 Chemical Industry Situation andOutlook.https://www.americanchemistry.com/Media/PressReleasesTranscripts/RelatedPDF/US-Chemical-Industry-Continues-to-Outpace-Industrial-Output.pdf

62
March 2018
POLICY
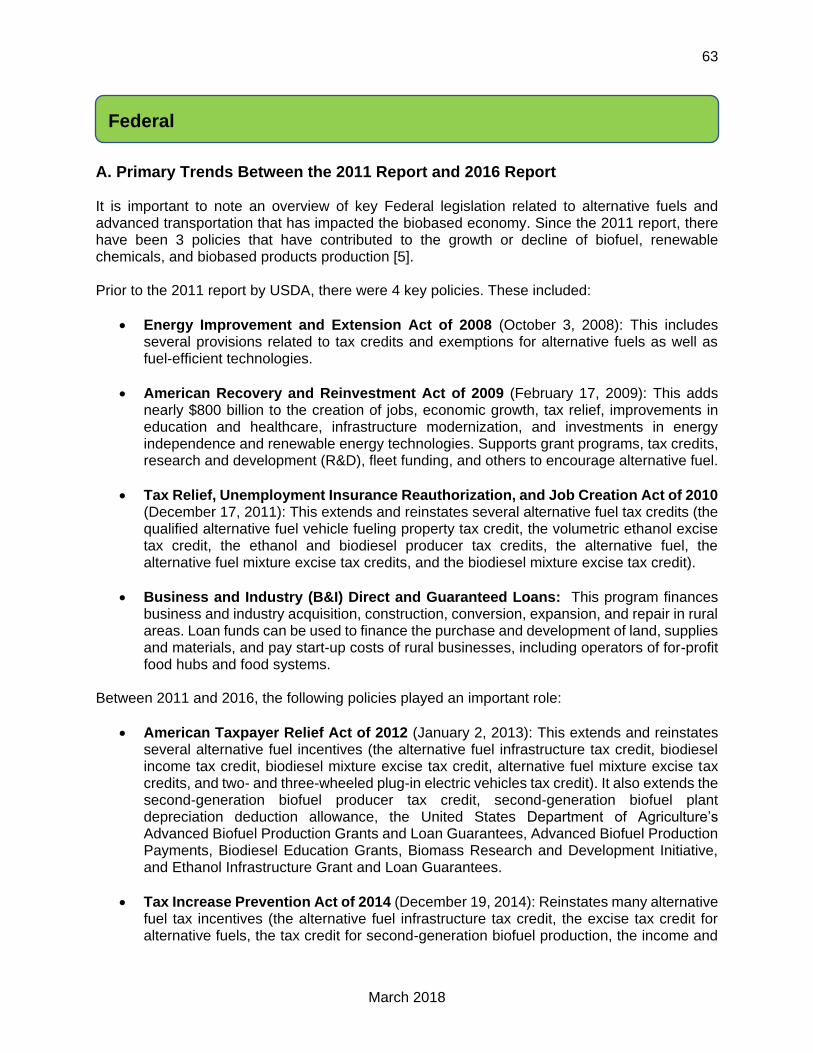
63
March 2018
A. Primary Trends Between the 2011 Report and 2016 Report It is important to note an overview of key Federal legislation related to alternative fuels and advanced transportation that has impacted the biobased economy. Since the 2011 report, there have been 3 policies that have contributed to the growth or decline of biofuel, renewable chemicals, and biobased products production [5]. Prior to the 2011 report by USDA, there were 4 key policies. These included:
• Energy Improvement and Extension Act of 2008 (October 3, 2008): This includes several provisions related to tax credits and exemptions for alternative fuels as well as fuel-efficient technologies.
• American Recovery and Reinvestment Act of 2009 (February 17, 2009): This adds nearly $800 billion to the creation of jobs, economic growth, tax relief, improvements in education and healthcare, infrastructure modernization, and investments in energy independence and renewable energy technologies. Supports grant programs, tax credits, research and development (R&D), fleet funding, and others to encourage alternative fuel.
• Tax Relief, Unemployment Insurance Reauthorization, and Job Creation Act of 2010 (December 17, 2011): This extends and reinstates several alternative fuel tax credits (the qualified alternative fuel vehicle fueling property tax credit, the volumetric ethanol excise tax credit, the ethanol and biodiesel producer tax credits, the alternative fuel, the alternative fuel mixture excise tax credits, and the biodiesel mixture excise tax credit).
• Business and Industry (B&I) Direct and Guaranteed Loans: This program finances business and industry acquisition, construction, conversion, expansion, and repair in rural areas. Loan funds can be used to finance the purchase and development of land, supplies and materials, and pay start-up costs of rural businesses, including operators of for-profit food hubs and food systems.
Between 2011 and 2016, the following policies played an important role:
• American Taxpayer Relief Act of 2012 (January 2, 2013): This extends and reinstates several alternative fuel incentives (the alternative fuel infrastructure tax credit, biodiesel income tax credit, biodiesel mixture excise tax credit, alternative fuel mixture excise tax credits, and two- and three-wheeled plug-in electric vehicles tax credit). It also extends the second-generation biofuel producer tax credit, second-generation biofuel plant depreciation deduction allowance, the United States Department of Agriculture’s Advanced Biofuel Production Grants and Loan Guarantees, Advanced Biofuel Production Payments, Biodiesel Education Grants, Biomass Research and Development Initiative, and Ethanol Infrastructure Grant and Loan Guarantees.
• Tax Increase Prevention Act of 2014 (December 19, 2014): Reinstates many alternative fuel tax incentives (the alternative fuel infrastructure tax credit, the excise tax credit for alternative fuels, the tax credit for second-generation biofuel production, the income and
Federal
64
March 2018
excise tax credit for biodiesel and renewable diesel fuel mixtures, and the special depreciation allowance for second-generation biofuel plant property).
• Consolidated Appropriations Act of 2016 (December 18, 2015): Reinstates and extends many alternative fuel tax incentives (alternative fuel infrastructure tax credit, the excise tax credit for alternative fuels and alternative fuel mixtures, the tax credit for second-generation biofuel production, the income and excise tax credit for biodiesel and renewable diesel fuel mixtures, fuel cell motor vehicle tax credit, the special depreciation allowance for second-generation biofuel plant property, and the two- or three-wheeled plug-in electric drive motor vehicles tax credit).
• Biofuels Tax Extender Policy: The tax package retroactively extends the $1-per-gallon blenders tax credit for biodiesel and renewable diesel for 2 years, from Jan. 1, 2015 through Dec. 31, 2016. Extends the second-generation biofuel production credit which allows facilities producing cellulosic biofuels to claim a $1.01-per-gallon production tax credit. The tax extenders package also benefits biomass power with an extension of the Section 45 production tax credit (PTC).
There are many other policies that have been enacted and have influenced the biobased economy, particularly influencing the production and consumption of biofuels. Over the last several years, there has been an at-large increase in the production and consumption of biofuels in the United States. In 2015, the imports of biodiesel increased by 61 percent, Argentina being the principal source. Argentina has become the main source of biodiesel since, in 2015, the United States Environmental Protection Agency approved a Renewable Fuel Standards (RFS) pathway for Argentina’s biodiesel volumes that stablished a streamlined process for producers to generate Renewable Identification Number credits [6]. Interest in the bioprefered products has increased in the United States. he USDA’s BioPreferred Program was expanded as part of the Agricultural Act of 2014 and is having a larger impact on influencing purchasing requirements and labeling initiatives. Similarly, the U.S. Department of Defense and the U.S. Department of Energy have had a significant impact on the continued growth of renewable aviation fuels. This is driven, in part, out of national security concerns.
B. Trends Analyzed
Biofuel Federal biofuel policies have been steadily increasing over the last few decades with the development of legislation and implementation of programs to assist the growth of the biofuel industry. The policy development began in 1970 with the Clean Air Act introducing initiatives to reduce pollutants. In direct relation to the energy field, the Energy Policy and Conservation Act of 1975 introduced the Corporate Average Fuel Economy (CAFE) standards. This began the demand for transparency of fuel economy information to the consumers. With the Alternative Motor Fuels Act, the CAFE credits were created [13]. The CAFE standards tend to fluctuate with the price and availability of oil. The use of the CAFE standards was reduced with the cheap oil prices throughout the 1980s and the 1990s. In 2008, when there was an oil shock, a newfound interest in the CAFE standards and a change in fuel economy outlooks occurred [9].
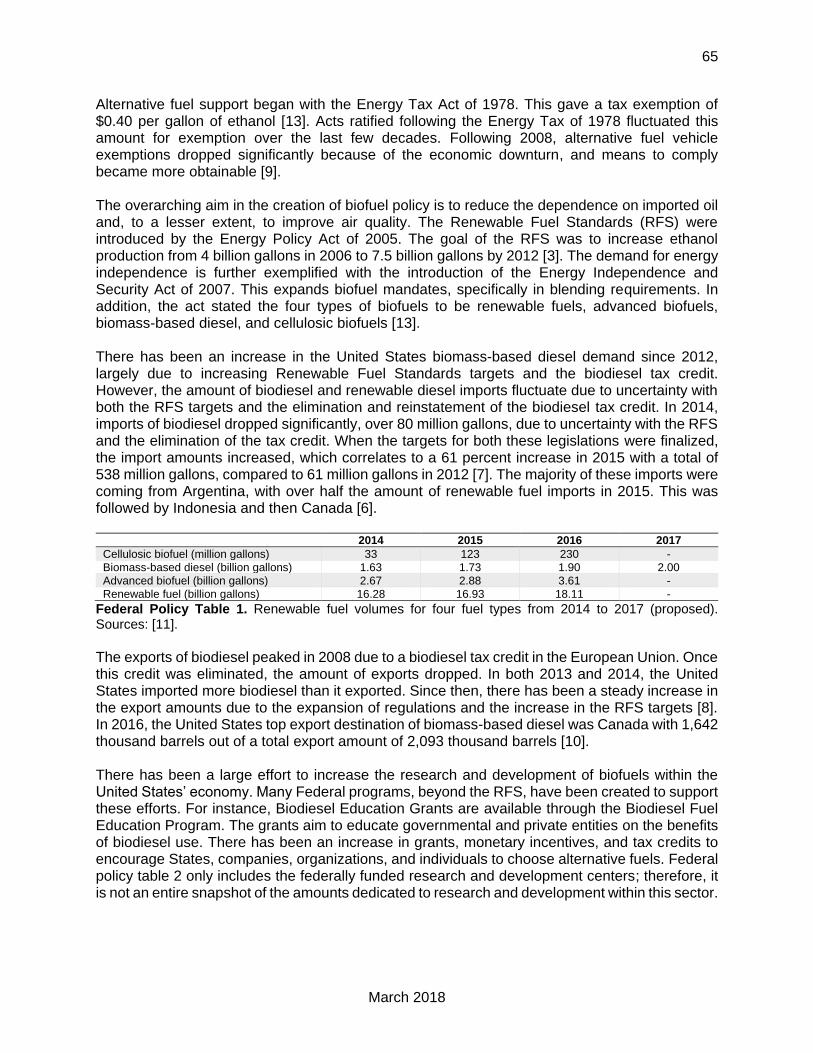
65
March 2018
Alternative fuel support began with the Energy Tax Act of 1978. This gave a tax exemption of $0.40 per gallon of ethanol [13]. Acts ratified following the Energy Tax of 1978 fluctuated this amount for exemption over the last few decades. Following 2008, alternative fuel vehicle exemptions dropped significantly because of the economic downturn, and means to comply became more obtainable [9]. The overarching aim in the creation of biofuel policy is to reduce the dependence on imported oil and, to a lesser extent, to improve air quality. The Renewable Fuel Standards (RFS) were introduced by the Energy Policy Act of 2005. The goal of the RFS was to increase ethanol production from 4 billion gallons in 2006 to 7.5 billion gallons by 2012 [3]. The demand for energy independence is further exemplified with the introduction of the Energy Independence and Security Act of 2007. This expands biofuel mandates, specifically in blending requirements. In addition, the act stated the four types of biofuels to be renewable fuels, advanced biofuels, biomass-based diesel, and cellulosic biofuels [13]. There has been an increase in the United States biomass-based diesel demand since 2012, largely due to increasing Renewable Fuel Standards targets and the biodiesel tax credit. However, the amount of biodiesel and renewable diesel imports fluctuate due to uncertainty with both the RFS targets and the elimination and reinstatement of the biodiesel tax credit. In 2014, imports of biodiesel dropped significantly, over 80 million gallons, due to uncertainty with the RFS and the elimination of the tax credit. When the targets for both these legislations were finalized, the import amounts increased, which correlates to a 61 percent increase in 2015 with a total of 538 million gallons, compared to 61 million gallons in 2012 [7]. The majority of these imports were coming from Argentina, with over half the amount of renewable fuel imports in 2015. This was followed by Indonesia and then Canada [6].
2014 2015 2016 2017
Cellulosic biofuel (million gallons) 33 123 230 -
Biomass-based diesel (billion gallons) 1.63 1.73 1.90 2.00
Advanced biofuel (billion gallons) 2.67 2.88 3.61 -
Renewable fuel (billion gallons) 16.28 16.93 18.11 -
Federal Policy Table 1. Renewable fuel volumes for four fuel types from 2014 to 2017 (proposed). Sources: [11].
The exports of biodiesel peaked in 2008 due to a biodiesel tax credit in the European Union. Once this credit was eliminated, the amount of exports dropped. In both 2013 and 2014, the United States imported more biodiesel than it exported. Since then, there has been a steady increase in the export amounts due to the expansion of regulations and the increase in the RFS targets [8]. In 2016, the United States top export destination of biomass-based diesel was Canada with 1,642 thousand barrels out of a total export amount of 2,093 thousand barrels [10]. There has been a large effort to increase the research and development of biofuels within the United States’ economy. Many Federal programs, beyond the RFS, have been created to support these efforts. For instance, Biodiesel Education Grants are available through the Biodiesel Fuel Education Program. The grants aim to educate governmental and private entities on the benefits of biodiesel use. There has been an increase in grants, monetary incentives, and tax credits to encourage States, companies, organizations, and individuals to choose alternative fuels. Federal policy table 2 only includes the federally funded research and development centers; therefore, it is not an entire snapshot of the amounts dedicated to research and development within this sector.
66
March 2018
Federal Policy Figure 1. Voluntary label. Source: [4].
Year Expenditures
2006 13,218,947
2007 13,824,987
2008 15,616,390
2009 16,390,111
2010 18,880,609
2011 18,671,245
2012 18,280,943
2013 17,667,184
2014 17,718,556
2015 18,458,257
Federal Policy Table 2. Total R&D expenditures at federally funded research and development centers from 2006 to 2015 (in thousand dollars). Source: [1].
There is concern that many of the Federal biofuel policies are nonbinding [2]. By depending mainly on incentives to drive suppliers to switch to alternative fuel production, it is more difficult to quantitatively project trends. Beyond the legislation, the overall market plays a role in the biofuel production. The use of biofuels is expected to reduce greenhouse gas emissions, but more research is needed in order to contribute to future biofuel policy [13].
Biobased products A focus on the bioproduct industry has been a relatively recent trend, and therefore not as many policies support the production of biobased products. A number of influential executive orders and programs have emphasized the development of biobased products within the United States economy. Created by the 2002 Farm Bill and reauthorized by the Agricultural Act of 2014, the USDA BioPreferred Program aims to increase the purchasing of biobased products within the United States. This program is made up of two parts: a mandatory purchasing requirement for Federal agencies and a voluntary labeling initiative for the biobased products within the economy. The BioPreferred Program increases economic development and creates new jobs within new fields. Biobased products are products with materials “derived from plants and other renewable agricultural, marine, and forestry materials and provide an alternative to conventional petroleum derived products” [4]. Programs such as the BioPreferred Program have largely advanced the biobased products industry, as have recent executive orders. President Barack Obama signed Executive Order 36 3 “Planning for Federal Sustainability in the Next Decade” in 2015. Based on 2008 levels, the Government’s greenhouse gas emissions should be reduced by 40 percent in the next decade. Part of this order is the increase in Government spending on biobased products. In 2015, the Renewable Chemical Act was introduced by Senator Stabenow of Michigan. The bill
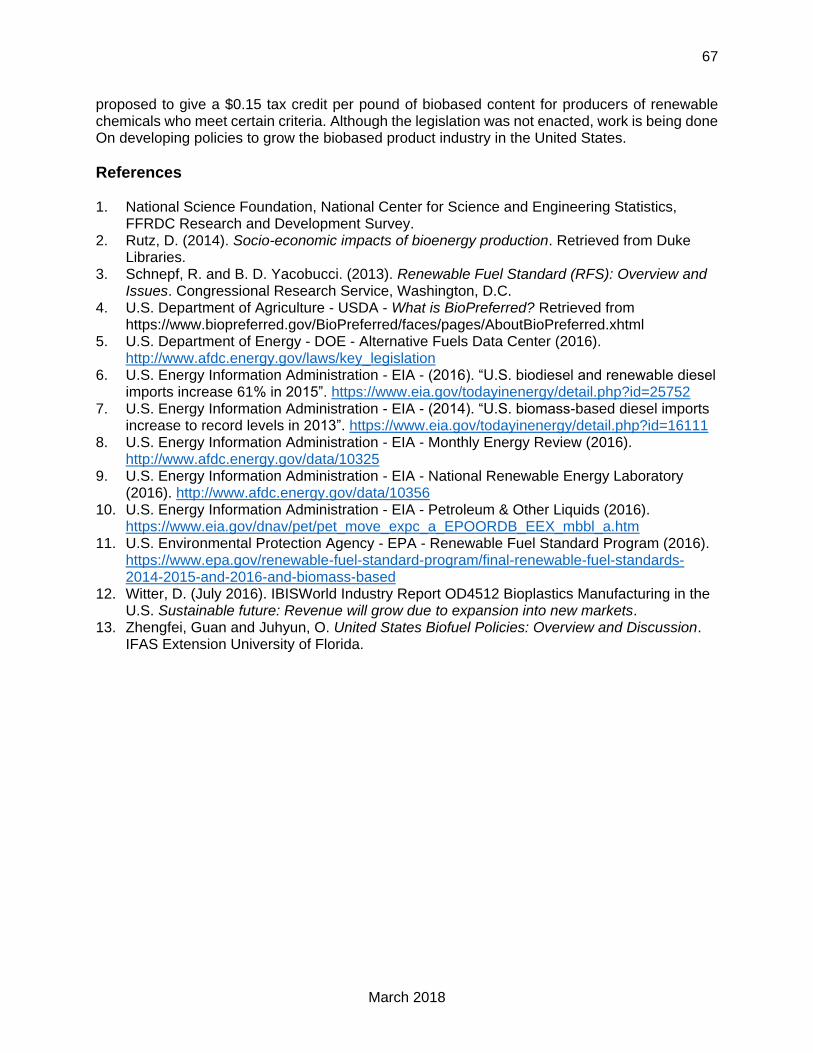
67
March 2018
proposed to give a $0.15 tax credit per pound of biobased content for producers of renewable chemicals who meet certain criteria. Although the legislation was not enacted, work is being done On developing policies to grow the biobased product industry in the United States.
References 1. National Science Foundation, National Center for Science and Engineering Statistics,
FFRDC Research and Development Survey. 2. Rutz, D. (2014). Socio-economic impacts of bioenergy production. Retrieved from Duke
Libraries. 3. Schnepf, R. and B. D. Yacobucci. (2013). Renewable Fuel Standard (RFS): Overview and
Issues. Congressional Research Service, Washington, D.C. 4. U.S. Department of Agriculture - USDA - What is BioPreferred? Retrieved from
https://www.biopreferred.gov/BioPreferred/faces/pages/AboutBioPreferred.xhtml 5. U.S. Department of Energy - DOE - Alternative Fuels Data Center (2016).
http://www.afdc.energy.gov/laws/key_legislation 6. U.S. Energy Information Administration - EIA - ( 6). “U.S. biodiesel and renewable diesel
imports increase 61% in ”. https://www.eia.gov/todayinenergy/detail.php?id=25752 7. U.S. Energy Information Administration - EIA - ( ). “U.S. biomass-based diesel imports
increase to record levels in 2 3”. https://www.eia.gov/todayinenergy/detail.php?id=16111 8. U.S. Energy Information Administration - EIA - Monthly Energy Review (2016).
http://www.afdc.energy.gov/data/10325 9. U.S. Energy Information Administration - EIA - National Renewable Energy Laboratory
(2016). http://www.afdc.energy.gov/data/10356 10. U.S. Energy Information Administration - EIA - Petroleum & Other Liquids (2016).
https://www.eia.gov/dnav/pet/pet_move_expc_a_EPOORDB_EEX_mbbl_a.htm 11. U.S. Environmental Protection Agency - EPA - Renewable Fuel Standard Program (2016).
https://www.epa.gov/renewable-fuel-standard-program/final-renewable-fuel-standards-2014-2015-and-2016-and-biomass-based
12. Witter, D. (July 2016). IBISWorld Industry Report OD4512 Bioplastics Manufacturing in the U.S. Sustainable future: Revenue will grow due to expansion into new markets.
13. Zhengfei, Guan and Juhyun, O. United States Biofuel Policies: Overview and Discussion. IFAS Extension University of Florida.
68
March 2018
A. Primary Trends Between 2011 Report and 2016 Report In the 2008, there were 106 biofuel tax incentive and rebate programs in 40 States. This has grown to 190 biofuel tax incentive and rebate programs in 45 different States [1]. In addition, a total of 10 Stateshad mandates or standards for the use of ethanol or biodiesel after the 2008 legislative season (Hawaii, Washington, Oregon, New Mexico, Louisiana, Florida, Montana, Minnesota, Iowa, and Missouri). Currently, there are 16 Stateswith mandates or standards (addition of California, Maine, Massachusetts, New Jersey, Pennsylvania, and Wisconsin) [1]. While this is not a large increase, the biobased economy is expanding largely at the Statelevel. The 2011 Report does not include renewable chemical and biobased products policies. There has been a recent trend of Statepolitical action to include production of renewable chemical and biobased products. Examples of policy actions have been included in the following section.
B. Trends Analyzed
Biofuel A large amount of policy comes from the Statelevel for the biofuel industry. Many Stateshave similar policies, such as an “Alternative Fuel School Bus Incentive” or an “Alternative Fuel Definition.”Although the Federal Government has created definitions to abide by within the biofuel sector, many Stateshave created policies that define the terms by their own words. This would include an “biodiesel” definition. Depending on the State’s policy, this definition could include a certain type of blend or not. States also tend to provide alternative fuel incentives, tax credits, or exemptions. It appears many Statepolicies revolve around vehicle use and alternative fuels, rather than focusing on agricultural incentives. Loan guarantee programs also seem to be common policies throughout the States [1, 2]. As seen in State policy table 1, there is a large range of state biofuel policies. States, such as Alaska, have very few policies. However, other States, like California, are attempting to transition their economy and cut down on their emissions through the implementation of policy. A breakdown of each Statesamount of policies can be found in State policy table 1 as well. The number of policies per Stateis growing each year; however, many credits or programs are running out of funding within the next few years. This leaves the responsibility to the Stateto keep expanding the biofuel industry. There is a worry that Statelegislatures will not put as much emphasis on the importance of the biofuel industry. However, California does exemplify a Statethat has placed emphasis on renewable chemicals with the passage of California's Low Carbon Fuel Standard (LCFS) Program which requires a reduction in the carbon intensity of transportation fuels that are sold, supplied, or offered for sale in the Stateby a minimum of 10 percent by 2020. The California Air Resources Board (ARB) regulations require transportation fuel producers and importers to meet specified average carbon intensity requirements for fuel. In the regulations, carbon intensity reductions are based on reformulated gasoline mixed with 10 percent corn-derived ethanol and low-sulfur diesel fuel.
State
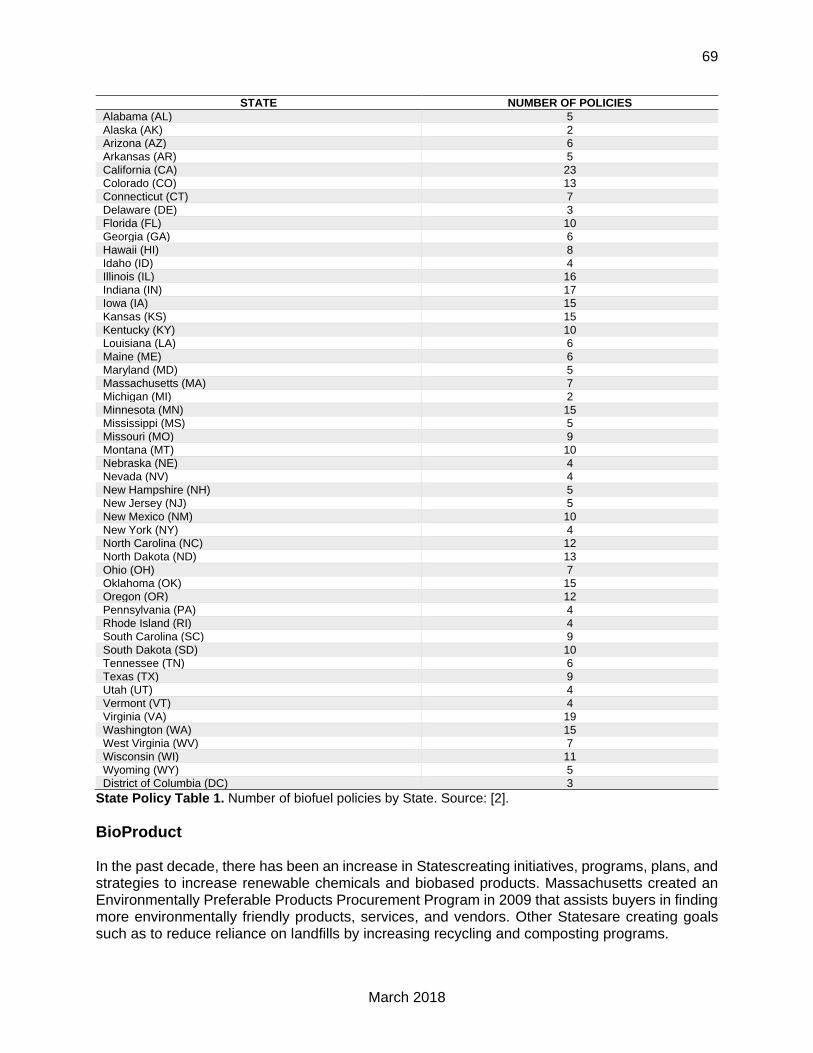
69
March 2018
STATE NUMBER OF POLICIES
Alabama (AL) 5
Alaska (AK) 2
Arizona (AZ) 6
Arkansas (AR) 5
California (CA) 23
Colorado (CO) 13
Connecticut (CT) 7
Delaware (DE) 3
Florida (FL) 10
Georgia (GA) 6
Hawaii (HI) 8
Idaho (ID) 4
Illinois (IL) 16
Indiana (IN) 17
Iowa (IA) 15
Kansas (KS) 15
Kentucky (KY) 10
Louisiana (LA) 6
Maine (ME) 6
Maryland (MD) 5
Massachusetts (MA) 7
Michigan (MI) 2
Minnesota (MN) 15
Mississippi (MS) 5
Missouri (MO) 9
Montana (MT) 10
Nebraska (NE) 4
Nevada (NV) 4
New Hampshire (NH) 5
New Jersey (NJ) 5
New Mexico (NM) 10
New York (NY) 4
North Carolina (NC) 12
North Dakota (ND) 13
Ohio (OH) 7
Oklahoma (OK) 15
Oregon (OR) 12
Pennsylvania (PA) 4
Rhode Island (RI) 4
South Carolina (SC) 9
South Dakota (SD) 10
Tennessee (TN) 6
Texas (TX) 9
Utah (UT) 4
Vermont (VT) 4
Virginia (VA) 19
Washington (WA) 15
West Virginia (WV) 7
Wisconsin (WI) 11
Wyoming (WY) 5
District of Columbia (DC) 3
State Policy Table 1. Number of biofuel policies by State. Source: [2].
BioProduct In the past decade, there has been an increase in Statescreating initiatives, programs, plans, and strategies to increase renewable chemicals and biobased products. Massachusetts created an Environmentally Preferable Products Procurement Program in 2009 that assists buyers in finding more environmentally friendly products, services, and vendors. Other Statesare creating goals such as to reduce reliance on landfills by increasing recycling and composting programs.

70
March 2018
The Stateof Ohio through S.B. 131 of the 128th General Assembly requires the Department of Administrative Services (DAS) to establish a biobased product preference procurement program that is to apply to all purchases made by Stateagencies. Recently, Maryland tried to pass HB 1330. This would require child care center and homes to use green product cleaning supplies. The bill had 50 percent progression, but then died in committee. Similar bioproduct-based legislation is being proposed in Statelegislatures across the country. Like the Federal policy, there is still a large lack in bioproduct policy at the Statelevel. However, Statesare making more of an effort to introduce new policy than the Federal Government. For this reason, the biobased products industry will most likely be affected more by Stateregulations and programs in the future.
References 1. U.S. Department of Energy - DOE - Alternative Fuels Data Center (2016).
http://www.afdc.energy.gov/laws/matrix 2. U.S. Department of Energy - DOE - National Renewable Energy Laboratory (2017).
http://www.nrel.gov
71
March 2018
A. Primary Trends Between 2011 Report and 2016 Report The 2011 Report does not include policies at an international level, but does cite the United States International Trade Commission within multiple sections. There was no mention of international agreements or other country actions to support the United States biobased economy. It is necessary to note that there are many agreements and actions taking place beyond the United States that are not included here. This report includes some examples as to how the United States biobased economy is likely influenced by other countries’ policies. Moving forward, the United States will be pressured into increasing its own policies to compete with the global market.
B. Trends Analyzed There have been numerous international agreements that aim to create policy for the biobased economy. “Everything But Arms” provides lesser developed countries with duty-free and quota-free access to ethanol exports. The World Trade Organization has created agreements that focus on the imports and exports of biomaterials between countries [3]. The European Union began the Environmental Action Programs in 1973. Since then, there have been six programs that work towards creating a mutual interdependence between economic development, prosperity and the protection of the environment. These six programs that have been introduced every 5 years develop aims and approaches on how to tackle sustainable development. Throughout this process, coinciding legislation has occurred as well. The Amsterdam Treaty of 1997 launched the initiative for environmental policy integration. Several directives, policies, and standards have been introduced (European Chemicals Policies, 2003 Emission Trading Directive, etc.) to further integrate [1]. Many of the legislative actions of the EU and rest of the word, specifically tax incentives, influence the biofuel imports and exports of the United States. As previously mentioned, the spike in biofuel exports in 2008 was mainly due to a tax incentive created by the European Union. In addition, other countries are trying to increase their biofuel and bioproduct economy. Nigeria is planning on spending $50 billion USD for local biofuel production to further secure its agricultural and energy sectors [2].
References 1. European Commission, EU Environment Action Programme to 2020 (2016).
http://ec.europa.eu/environment/action-programme/ 2. Financial Nigeria (2017). http://www.financialnigeria.com/nigeria-to-set-up-50-billion-biofuel-
equity-fund-sustainable-photovideo-details-703.html 3. World Trade Organization (2017). https://www.wto.org
International
72
March 2018
A. Primary Trends Between 2011 Report and 2016 Report The 2011 Report strongly recommends the collaboration of government with businesses and inter-business partnerships throughout the entire report instead of dedicating a section to private-sector action. There is an emphasis of the need for increased policies and development of business strategies to help economic action within the biobased economy. The biobased products section of the 2011 Report included a survey on companies that produced biobased products. There seems to be a lack of comprehensive data that includes company actions in both biobased products and biofuel industries. The 2016 Report does not include a similar survey, but it is assumed that there has been an increase in business-to-business (B-2-B) action within both the biobased products and biofuel sectors. Since the 2011 Report, there has been an increase in business action within the biobased economy. Many businesses are creating coalitions in order to get ahead of the Federal and State legislation. Businesses are often attempting to identify the leading indicators to predict the future of the industry. Similar to what is recommended within the 2011 Report, there should be an increase in collaboration between government agencies and the private sector to create industry measurement standards and more accurate estimates of data. A survey of the private sector should be conducted to accurately represent the data and identify the need of policies at both Federal and State level. This would help with guidance and planning of the industry going forward. Examples of industry coalitions and actions are included below. However, there is a need for more governmental-private sector partnership action for proper policies to be implemented.
B. Trends Analyzed Many corporations are creating their own internal and external policies that increase the demand for renewable chemicals and biobased products. Examples include B-2-B coalitions which have been created to drive sustainability in the supply chain as well as to communicate to institutional customers and individual consumers the sustainability of the product. The Sustainable Apparel Coalition was created as an alliance between large players within the apparel industry to account for one another’s practices through the creation of the Higg Index [1,2]. The Higg Index is a set of self-assessment tools to measure a company’s environmental, social, and labor impacts and which incentivizes the utilization of renewable chemicals and biobased products. Other tools have been created to analyze a company’s impact. Life Cycle Assessment (LCA) evaluates a product’s environmental impact through all stages of its life. Certification processes have become common for businesses to obtain for their entire business or for a specific product. For instance, the product of tea may become Fair Trade Certified after following social, environmental, and economic standards [4]. A company may become a certified B Corporation if the entire company meets the standards of working conditions, environment, community empowerment and transparency [3]. These and many other certifications translate to the consumer the transparency and positive impact that the business is attempting to promote.
Business to Business
73
March 2018
References
1. The Sustainable Apparel Coalition. http://apparelcoalition.org2. The Higg Index. http://apparelcoalition.org/the-higg-index/3. B Corporations. https://www.bcorporation.net/what-are-b-corps4. Fair Trade. http://fairtradeusa.org
74
March 2018
Non-Discrimination Statement In accordance with Federal civil rights law and U.S. Department of Agriculture (USDA) civil rights regulations and policies, the USDA, its Agencies, offices, and employees, and institutions participating in or administering USDA programs are prohibited from discriminating based on race, color, national origin, religion, sex, gender identity (including gender expression), sexual orientation, disability, age, marital status, family/parental status, income derived from a public assistance program, political beliefs, or reprisal or retaliation for prior civil rights activity, in any program or activity conducted or funded by USDA (not all bases apply to all programs). Remedies and complaint filing deadlines vary by program or incident. Persons with disabilities who require alternative means of communication for program information (e.g., Braille, large print, audiotape, American Sign Language, etc.) should contact the responsible Agency or USDA's TARGET Center at (202) 720-2600 (voice and TTY) or contact USDA through the Federal Relay Service at (800) 877-8339. Additionally, program information may be made available in languages other than English. To file a program discrimination complaint, complete the USDA Program Discrimination Complaint Form, AD-3027, found online at How to File a Program Discrimination Complaint and at any USDA office or write a letter addressed to USDA and provide in the letter all of the information requested in the form. To request a copy of the complaint form, call (866) 632-9992. Submit your completed form or letter to USDA by: (1) mail: U.S. Department of Agriculture, Office of the Assistant Secretary for Civil Rights, 1400 Independence Avenue, SW, Washington, D.C. 20250-9410; (2) fax: (202) 690-7442; or (3) email: [email protected]. USDA is an equal opportunity provider, employer, and lender.