Embed Size (px)
Citation preview

Profit Sharing and Workplace Productivity:Does Teamwork Play a Role?
Tony FangStephen Jarislowsky Chair
Memorial University, University of Toronto, and IZA
Rick LongEdwards School of Business, University of Saskatchewan
“Health, Wealth, and Happiness in Canada”
CRDCN 2016 National Conference
Saskatoon, October 31 - November 1, 2016

Professor Richard J. Long(November 11, 1950 – May 15, 2016)

Professor Richard J. Long(November 11, 1950 – May 15, 2016)

Professor Richard J. Long(November 11, 1950 – May 15, 2016)

Agenda
• Background
• Rationale and Purpose
• Research Overview and Hypotheses
• Sample and Measures
• Results
• Discussion
• Conclusions

Background
• Widening Income inequality across the Globe: China,
Canada, United States
• Not only an economic problem hindering long-term
economic growth, but also a social one: occupying movement
in the US, labor disputes and social unrest in China
• Need mechanisms to mitigate the problem
• Public policies: income redistribution, progressive taxation,
minimum wages etc.
• Enterprise policies and programs: Profit-sharing, Gain-
sharing, Employee Stock Ownership Plan (ESOP), Stock
Options etc. open to ordinary employees, not just the senior
executives
Pay at top related to incentive pay via capital income.
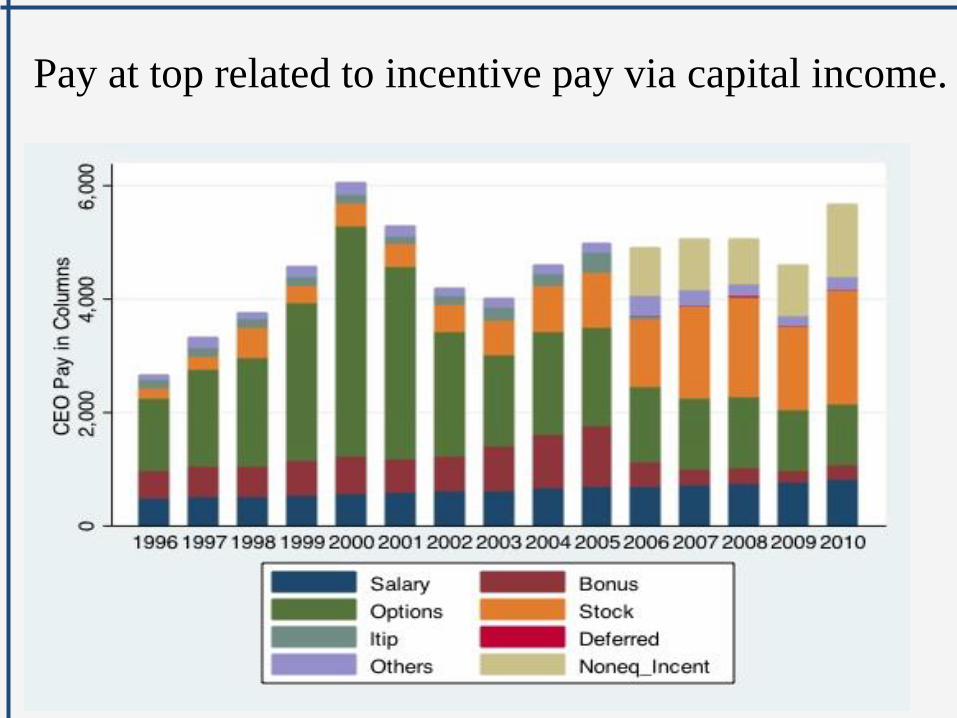
Switching to the profit-sharing modelmakes the most sense…
• Switching to the profit-sharing model
makes the most sense. In tough times,
when profits are down and reductions
in labor costs save jobs, profit sharing
stabilizes labor costs. By the same
token, when the economy turns around,
such an arrangement guarantees that Richard B. Freeman
workers will share in the prosperity. Harvard & NBER

ESOPs and Profit sharing plans…
Organizational Performance Plans
Pros:
• Varies depending on plan
but generally similar
to profit sharing and
employee stock plans
Profit Sharing
Pros:
1) Employee motivation
2) Reduces supervisor costs
3) Risk mitigation
4) Reduce need for layoffs
Summary: Formal “Bonus”
program based on firm
profitability. Derivatives include
current and deferred profit
sharing.
Primary Cons:
1) Free riding
2) Poor line of sight
3) Negative link
between unionization &
profit sharing
Other Org Plan
Summary: Catch all category
of programs linked to variable
pay including:
• RSUs
• Phantom equity
• LTIPs
• Capital efficiency plans
Employee Stock Plans
Summary: Employees acquire
shares in the firm – perhaps
purchase or granted
Primary Cons:
1) Administration costs
2) Unhealthy behaviour
3) Market perception
implications
4) False expectations
5) Problematic in non-
growth firms
Pros:
1) Ownership mentality
2) Fosters long term
commitment
3) Risk mitigation
4) Mechanics in place
Primary Cons:
• Same as above

How to Calculate the Profit-sharing Bonus?
• Profit sharing (commonly referred to as “Bonus”) plans
are generally of two similar elks:
Additive
Company
performance +Divisional
performance+
Personal
performance =Total
Payout
Multiplicative
or
Company
performance +Divisional
performance *Personal
performance =Total
Payout

An example of an additive plan… Additive
Company
performance +Divisional
performance+
Personal
performance =Total
Payout
Potential
Results
50
112.5%2550
100%2525+
+
+
+ 37.5
Annual Salary Target Bonus Total Payout
$100,000 10%* *
Achievement
112.5% $11,250
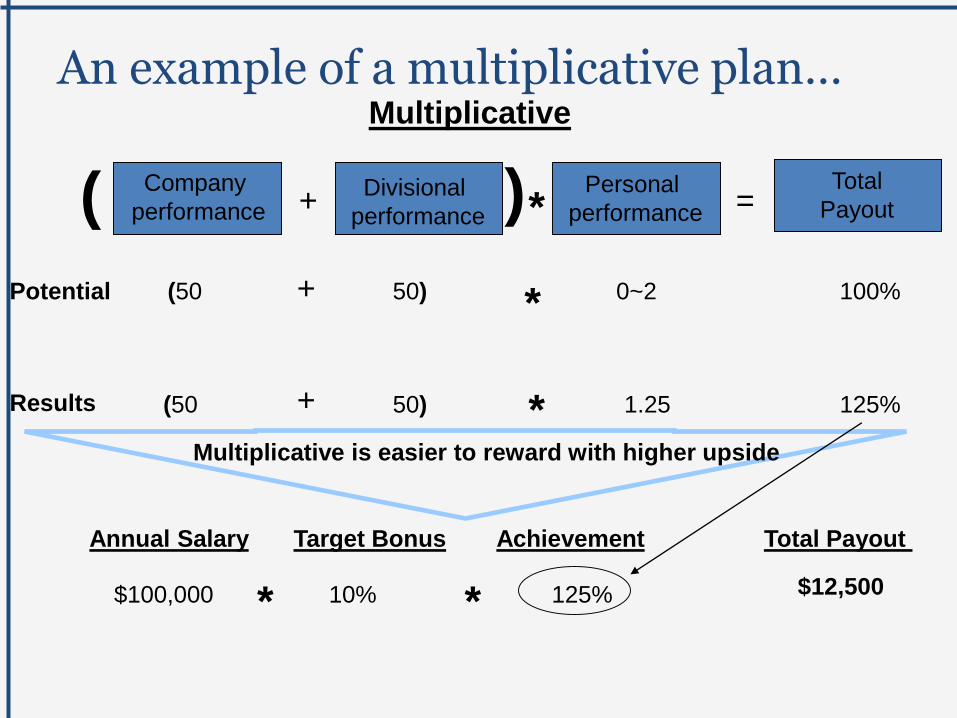
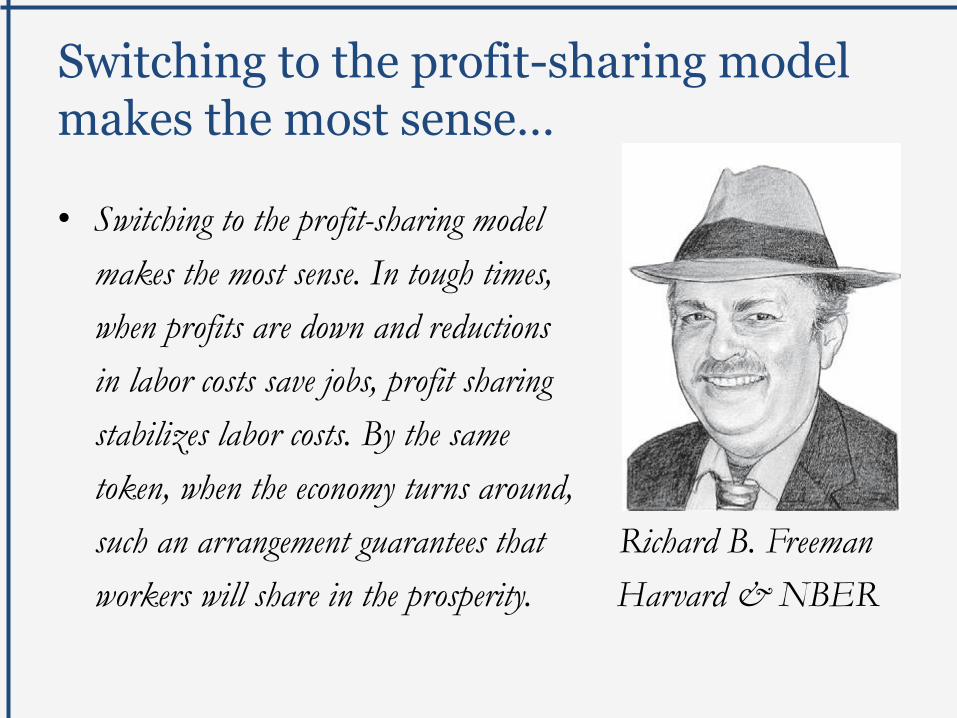
An example of a multiplicative plan… Multiplicative
Company
performance +Divisional
performance *Personal
performance =Total
Payout
Potential
Results
(50
125%50)(50
100%0~250)+
+
*
*
( )
1.25
Annual Salary Target Bonus Total Payout
$100,000 10%* *
Achievement
125% $12,500
Multiplicative is easier to reward with higher upside
Rationale and Purpose of Research
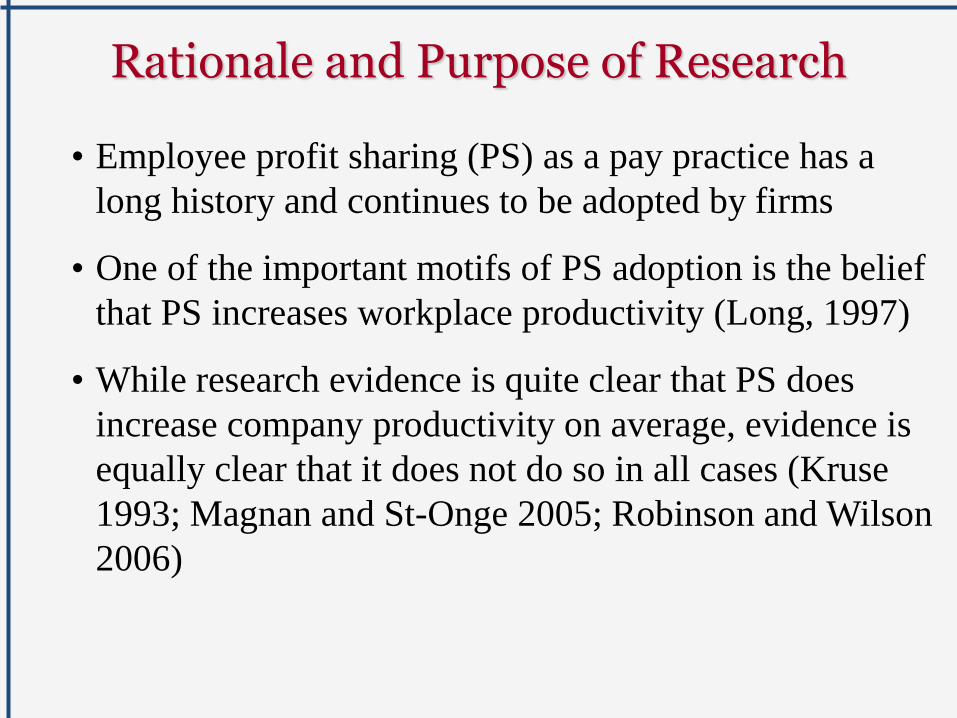
• Employee profit sharing (PS) as a pay practice has a
long history and continues to be adopted by firms
• One of the important motifs of PS adoption is the belief
that PS increases workplace productivity (Long, 1997)
• While research evidence is quite clear that PS does
increase company productivity on average, evidence is
equally clear that it does not do so in all cases (Kruse
1993; Magnan and St-Onge 2005; Robinson and Wilson
2006)
Rationale and Purpose of Research
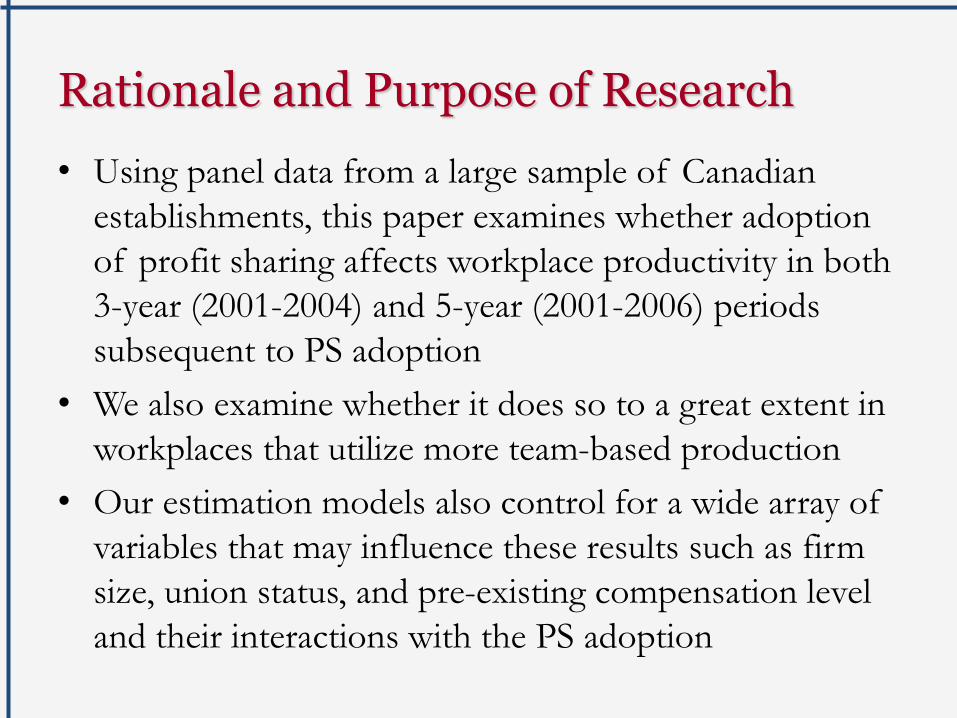
• Using panel data from a large sample of Canadian
establishments, this paper examines whether adoption
of profit sharing affects workplace productivity in both
3-year (2001-2004) and 5-year (2001-2006) periods
subsequent to PS adoption
• We also examine whether it does so to a great extent in
workplaces that utilize more team-based production
• Our estimation models also control for a wide array of
variables that may influence these results such as firm
size, union status, and pre-existing compensation level
and their interactions with the PS adoption

Research Overview
• PS is thought to affect firm productivity by serving as a
mechanism for aligning the interests of workers with the
firm, which can bring a number of benefits to the firm, such
as increased employee motivation, enhanced cooperation
between employees and management, increased self and
mutual monitoring of worker behaviour, and positive
workgroup norms.
• However, some scholars argued that its effectiveness in
motivating workers may be limited by the free rider or 1/N
problem (Olson 1971; Heywood and Jirjahn, 2009): the
larger the organization, the less clear is the “line of sight”
b/w individual performance and PS awards

Research Overview
• Given this, larger firms are expected to avoid using PS because
of the 1/N problem. Yes virtually no studies find either no
links or positive links b/w firm size and presence of PS,
casting doubt on the free-riding hypothesis
• While fixed costs in PS adoption might explain these results,
Adams (2002, 2006) suggests an alternative explanation. He
argues that the higher the degree of worker interdependence in
the production process, the greater the value of the common
goals created by PS, and the extent of this interdependency
may grow with firm size.

Research Overview
• As such, an increase in firm size may have two opposing
incentives effects (1/N problem and shirking;
interdependency and higher cost of shirking)
• Arguably, teamwork may encourage anti-shirking
behaviour in a variety of ways. First, shirking behaviour is
more apparent in a team context. Second, in an
interdependent context, shirking has the potential to
impede the productivity of co-workers (multiplier effects).
Third, this may cause teams to develop group norms to
discourage shirking. Fourth, workers in a team context
have potential incentive to support an intervention by
members to deter shirking behaviours.

Sample
• Drawn from the WES 1999, 2001, 2004, and 2006
workplace data sets, with response rates of 95.2%, 85.9%,
81.7%, and 74.9% respectively.
• The panel was constructed by taking the 1999 WES and
eliminating all workplaces with less than 10 employees,
not-for-profit workplaces, those reporting profit sharing in
1999, those adopted PS 2002-2003, and those workplaces
that are not included in the 2001 and 2004 surveys
(resulting in 1,690 workplaces) and 1,540 establishments
for the 2001-2006 panel.

Variable MeasuresWorkplace Productivity Growth
• We measured workplace productivity growth for the 3-
year panel by dividing the gross workplace revenues
reported in 2001 and 2004 by the number of full-time
equivalent employees in each year, and then dividing the
2004 revenue per employee by the 2001 revenue per
employee.
• We used the same procedure for calculating productivity
growth for the five-year panel, except that the
comparisons were between revenue per employee in
2006 and revenue per employee in 2001.

Variable MeasuresProfit Sharing Plan Adoption
• Based on whether the compensation system at the
workplace included a “profit sharing plan adoption”
(No = “0”, Yes = “1”) in 2001
• Of the 1,717 establishments, 247 workplaces (14.4% of
the panel) adopted profit sharing between 1999 and
2001.

Variable MeasuresWork Teams
• Respondents were asked to indicate whether the
workplace utilized, for their non-managerial
employees, on a formal basis, “Self-directed Work
Groups.”
• These were described as “Semi-autonomous work
groups or mini-enterprise work groups that have a high
level of responsibility for a wide range of
decisions/issues.”
• Responses were coded as either “1” (yes) or “0” (no).
Other Contextual Variables
• Company size
• Union status
• Pre-existing employee compensation level

Variable MeasuresControl Variables
• Thirteen dummy variables are created, representing all
of the sectors in the survey, with the exception of
retailing, which serves as the omitted (comparison)
variable.
• A further set of controls is used to control for the
possible effect of performance pay other than profit
sharing. We control for the presence of individual
incentives, merit pay, gain sharing, and employee stock
plans.
• These controls are used in all multivariate analysis.

Robustness Check
• There is a potential endogeneity issue between PS adoption
and productivity changes
• To formally address the issue, we have adopted Heckman
two-stage selection model
• To do so, we applied 2SLS estimation techniques where we
used profit sharing adoption rate at the detailed industry
level (14) in the first year (1999) as our main Instrument
Variable (IV), which is positive and highly significant in
predicting profit sharing adoption at workplace level in
2001 (we have published a paper for this first-stage
estimation of profit sharing adoptions in IJHRM, 2014).

Robustness Check
• We then plugged the estimated profit sharing probability
into the second-stage regression (the effects of profit
sharing adoption on workplace productivity growth) and we
found positive and significant main effects, as well as the
interaction effects between profit sharing and team
production on workplace productivity growth.
• we find that this procedure confirms our original findings
of a significant interaction between profit sharing adoption
and teamwork on productivity growth, and in fact
strengthens them.

Results
Table 1 shows summary statistics for the sample
Table 2 shows first-stage multiple regression results
Table 3 shows results of second-stage multiple
regression
Figure 1 shows the interaction graph
Table 4 shows results of second-stage multiple
regression with interaction between PS adoption and
work team
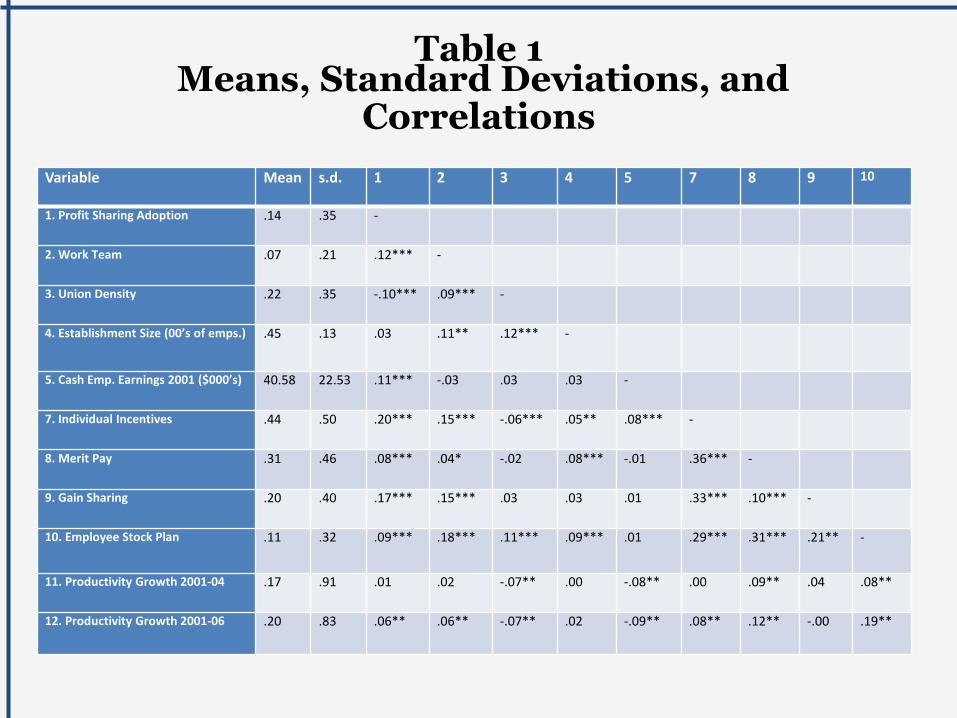
Table 1Means, Standard Deviations, and
Correlations
Variable Mean s.d. 1 2 3 4 5 7 8 9 10
1. Profit Sharing Adoption .14 .35 -
2. Work Team .07 .21 .12*** -
3. Union Density .22 .35 -.10*** .09*** -
4. Establishment Size (00’s of emps.) .45 .13 .03 .11** .12*** -
5. Cash Emp. Earnings 2001 ($000’s) 40.58 22.53 .11*** -.03 .03 .03 -
7. Individual Incentives .44 .50 .20*** .15*** -.06*** .05** .08*** -
8. Merit Pay .31 .46 .08*** .04* -.02 .08*** -.01 .36*** -
9. Gain Sharing .20 .40 .17*** .15*** .03 .03 .01 .33*** .10*** -
10. Employee Stock Plan .11 .32 .09*** .18*** .11*** .09*** .01 .29*** .31*** .21***-
11. Productivity Growth 2001-04 .17 .91 .01 .02 -.07** .00 -.08** .00 .09** .04 .08**
12. Productivity Growth 2001-06 .20 .83 .06** .06** -.07** .02 -.09** .08** .12** -.00 .19**

Table 2First Stage Estimation of PS Adoption Probability
2001-2004 2001-2006
Establishment ContextIndustry PS penetration rate 0.021**(0.009) 0.020**(0.010)
Prior profitability 0.000 (0.000) -0.000 (0.000)
Prior employee Earnings ($000’s) 0.042 (0.039) 0.056 (0.038)
Industry Controls Establishment characteristics
Establishment Size (00’s) 0.0001 (0.0002) 0.0001 (0.0002)Prior employment growth 0.0382 (0.0505) -0.004 (0.041)Union Density -0.125 *** (0.046) -0.113** (0.048)Participation Index 0.046*** (0.015) 0.047*** (0.015)Training Intensity 0.0001 (0.0001) 0.0001 (0.0001)
Business Strategy Innovator Strategy 0.020 (0.022) 0.027 (0.022)Cost Strategy 0.014 (0.026) 0.006 (0.025)
Cases 1652 1505R2 .148*** 0.154***
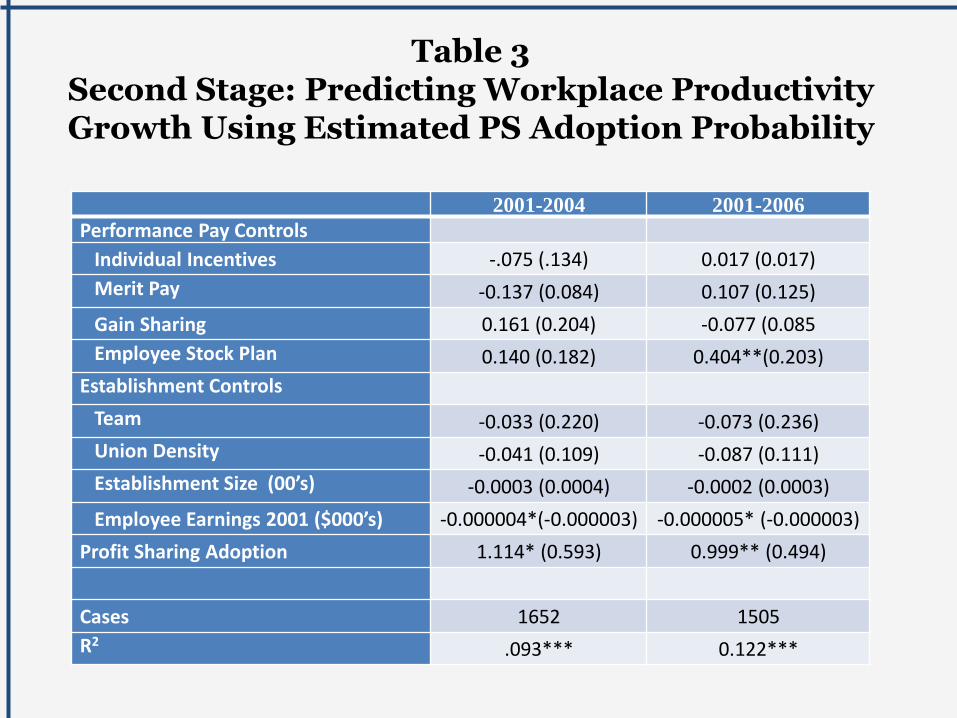
Table 3Second Stage: Predicting Workplace Productivity Growth Using Estimated PS Adoption Probability
2001-2004 2001-2006
Performance Pay Controls
Individual Incentives -.075 (.134) 0.017 (0.017)
Merit Pay -0.137 (0.084) 0.107 (0.125)
Gain Sharing 0.161 (0.204) -0.077 (0.085
Employee Stock Plan 0.140 (0.182) 0.404**(0.203)
Establishment Controls
Team -0.033 (0.220) -0.073 (0.236)
Union Density -0.041 (0.109) -0.087 (0.111)
Establishment Size (00’s) -0.0003 (0.0004) -0.0002 (0.0003)
Employee Earnings 2001 ($000’s) -0.000004*(-0.000003) -0.000005* (-0.000003)
Profit Sharing Adoption 1.114* (0.593) 0.999** (0.494)
Cases 1652 1505
R2 .093*** 0.122***

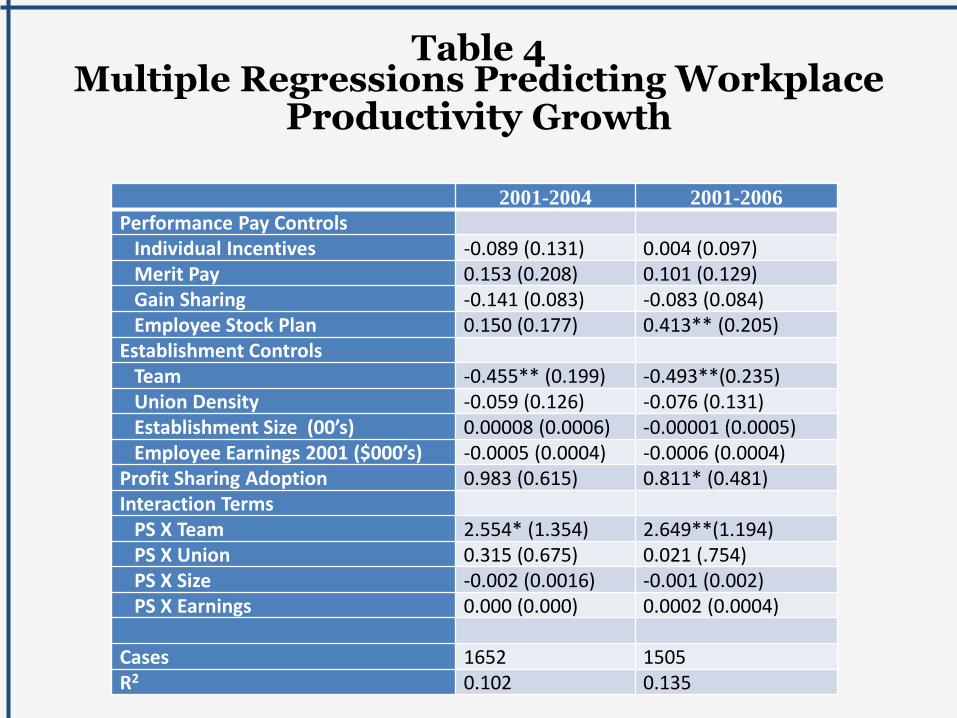
Table 4Multiple Regressions Predicting Workplace
Productivity Growth
2001-2004 2001-2006
Performance Pay ControlsIndividual Incentives -0.089 (0.131) 0.004 (0.097)Merit Pay 0.153 (0.208) 0.101 (0.129)Gain Sharing -0.141 (0.083) -0.083 (0.084)Employee Stock Plan 0.150 (0.177) 0.413** (0.205)
Establishment ControlsTeam -0.455** (0.199) -0.493**(0.235)Union Density -0.059 (0.126) -0.076 (0.131)Establishment Size (00’s) 0.00008 (0.0006) -0.00001 (0.0005)Employee Earnings 2001 ($000’s) -0.0005 (0.0004) -0.0006 (0.0004)
Profit Sharing Adoption 0.983 (0.615) 0.811* (0.481)Interaction Terms
PS X Team 2.554* (1.354) 2.649**(1.194)PS X Union 0.315 (0.675) 0.021 (.754)PS X Size -0.002 (0.0016) -0.001 (0.002)PS X Earnings 0.000 (0.000) 0.0002 (0.0004)
Cases 1652 1505R2 0.102 0.135

Discussion and Conclusions• Overall our results suggest that use of team plays an
important role in the success of PS- at least in terms of
productivity
• Establishments with teamwork that adopted PS showed
a substantial and highly significant increase in
workplace productivity over both 3-yr and 5-yr period
• Those without teamwork that adopted PS showed no
significant improvement in productivity
• Findings are in line with the notion that work teams
help to mitigate potential shirking in PS firms
Discussion and Conclusions
• Findings are also in line with the arguments that work
teams serve as an effective mechanism to translate the
purported motivational benefits of PS into tangible
productivity gains
• There is no evidence of “freeriding”: no significant
interaction effect of PS adoption and workplace size
on productivity growth
• This suggests that either shirking is not a problem for
PS firms or the use of teams alleviate the size effects
for PS adopters: indeed establishments with teams
were significantly larger, and more likely to adopt PS
that those without teams

Discussion and Conclusions
• But we don’t know the specific drivers of productivity
increases: either teams provide a better context for
containing shirking behaviour (“working harder”) or
teams provide a context for more cooperative and more
innovative work behaviours (“working smarter”), or
some of each.
• The negative interaction b/w adoption of PS and union
density on productivity growth (5-yr) suggests unions
may constrain anti-shirking behaviour-and possibly
also constrain increase in productive behaviours. This
is consistent with the fact that firms with high union
density are much less likely to adopt PS

Discussion and Conclusions
• There is no sig. interaction b/w PS and employee
earnings: high earnings derive no particular
productivity advantage from PS adoption- either PS
has no utility from high human capital
• Nevertheless, PS adoption is beneficial to
establishment such as allowing firm to maintain high
employee earnings while gaining a greater degree of
pay flexibility

Discussion and Conclusions
• One rather intriguing finding is that establishments
with teams but didn’t adopt PS showed a substantial
decrease in productivity
• Those firms without teams that did not adopt PS
experiences no significant change in productivity
• Finding is consistent with the argument that team-
based work needs to be combined with some type of
organizational performance pay to ensure that teams
are working towards organizational goals (Lawler,
1992) and the sig. positive interaction b/w PS
adoption and teamwork is in line with the argument

Thank you!
Questions?

Variable MeasuresPre-existing Employee Compensation Level
Pre-existing employee compensation level is constructed
by dividing total gross payroll or total gross payroll by
number of employees at workplace in year 2001
Variable MeasuresCompany Size and Union Density
• Company size is measured as the total number of
employees at the business location
• Union density is calculated as the proportion of workers
covered by a collective bargaining agreement