Embed Size (px)
Citation preview
DI
SC
US
SI
ON
P
AP
ER
S
ER
IE
S
Forschungsinstitut zur Zukunft der ArbeitInstitute for the Study of Labor
Profit Sharing and Workplace Productivity:Does Teamwork Play a Role?
IZA DP No. 7869
December 2013
Richard J. LongTony Fang
Profit Sharing and Workplace Productivity:
Does Teamwork Play a Role?
Richard J. Long University of Saskatchewan
Tony Fang
Monash University, University of Toronto and IZA
Discussion Paper No. 7869 December 2013
IZA
P.O. Box 7240 53072 Bonn
Germany
Phone: +49-228-3894-0 Fax: +49-228-3894-180
E-mail: [email protected]
Any opinions expressed here are those of the author(s) and not those of IZA. Research published in this series may include views on policy, but the institute itself takes no institutional policy positions. The IZA research network is committed to the IZA Guiding Principles of Research Integrity. The Institute for the Study of Labor (IZA) in Bonn is a local and virtual international research center and a place of communication between science, politics and business. IZA is an independent nonprofit organization supported by Deutsche Post Foundation. The center is associated with the University of Bonn and offers a stimulating research environment through its international network, workshops and conferences, data service, project support, research visits and doctoral program. IZA engages in (i) original and internationally competitive research in all fields of labor economics, (ii) development of policy concepts, and (iii) dissemination of research results and concepts to the interested public. IZA Discussion Papers often represent preliminary work and are circulated to encourage discussion. Citation of such a paper should account for its provisional character. A revised version may be available directly from the author.
IZA Discussion Paper No. 7869 December 2013
ABSTRACT
Profit Sharing and Workplace Productivity: Does Teamwork Play a Role?*
The conditions under which profit sharing affects workplace productivity have never been fully understood. Using panel data, this paper examines whether there is any link between adoption of an employee profit sharing plan and subsequent productivity growth in Canadian establishments, and whether this relationship is affected by various contextual factors, particularly use of work teams. In so doing, we use both three and five-year panels. Overall, we find a significant link between adoption of a profit sharing program and subsequent productivity growth in both panels, but only among establishments that utilize employee work teams. JEL Classification: J33, J24, J54 Keywords: profit sharing plans, workplace productivity, teamwork, firm-worker linked survey, Canada Corresponding author: Tony Fang Monash University Department of Management PO Box 197 Caulfield Vic 3145 Australia E-mail: [email protected]
* Financial supports from J. Robert Beyster Faculty Fellowship at Rutgers University, Social Sciences and Humanities Research Council of Canada, National Natural Science funds of China (NSFC, Number: 71203143) are gratefully acknowledged. We thank the participants the Mid-year Fellows Workshop in honor of Louis O. Kelso, Rutgers University, New Jersey, January 13-15, 2013, the WEAI Conference, Tokyo, March 14-17, 2013, and the University of Toronto Centre for Industrial Relations & Human Resources research seminar on October 28, 2013 for their helpful comments.
2
1. Introduction
Employee profit sharing is a pay practice that has a long history (Coates 1991), and one
that many firms continue to adopt (Andrews, Bellmann, Schank, and Upward 2010; Kalmi
Pendleton and Poutsma 2005, 2012; Kato and Morishima 2003; Long and Shields 2005; Parent
2002). Although there may be numerous motives for adopting profit sharing, an important one
is the belief that profit sharing increases company productivity (Long 1997). However, while
the research evidence is quite clear that employee profit sharing does increase company
productivity on average (Weitzman and Kruse 1990; Blasi, Freeman, Mackin and Kruse 2010),
the evidence is equally clear that it does not do so in all cases (Kruse 1993; Magnan and St-
Onge 2005; Robinson and Wilson 2006). Therefore, a key issue is to identify the conditions
under which this relationship holds, but such conditions have never been empirically resolved
(Bayo-Moriones and Larraza-Kintana 2009). A variable that has frequently been proposed as
one such condition is team-based production (Heywood and Jirjahn 2009; Jones, Kalmi and
Kauhanen 2010). However, whether team-based production does indeed play a role a role in
conditioning the effects of employee profit sharing on company productivity has received very
little empirical attention, with very few exceptions (i.e. Jones, Kalmi and Kauhanen 2010),
although there have been a number of empirical studies suggesting that work teams and
financial incentives (not necessarily profit sharing) are complementary practices (i.e. Boning,
Ichniowski, and Shaw 2007; Ichniowski, Shaw, and Prennushi 1997; MacDuffie 1995).
Using panel data from a large sample of Canadian establishments, this paper examines
whether adoption of profit sharing affects workplace productivity in the period subsequent to
adoption of profit sharing, relative to workplaces that do not adopt profit sharing, and whether it
does so to a greater extent in workplaces that utilize more team-based production. Our research
3
contributes to knowledge by utilizing a before-and-after within-firm analysis of panel data to
assess the effects of profit sharing adoption on an objective measure of productivity within a
carefully constructed sample of Canadian establishments, while controlling for a wide array of
variables that may affect these results. Importantly, because the effects of profit sharing
adoption may take considerable time to materialize, we examine both the three-year and the
five-year periods subsequent to profit sharing adoption. In so doing, we also examine whether
three other firm-level variables may influence the relationship between profit sharing and
workplace productivity—firm size, union status, and pre-existing employee compensation level.
The next section highlights the hypothesis that teamwork can enhance the productivity
effects of profit sharing, but also discusses the three other possible contextual variables
mentioned above. The third section describes our research design, data set, variable measures,
and analytical approach. The fourth section presents our results, while the fifth section discusses
our results, recaps both strengths and limitations of this study, and draws conclusions.
2. Theoretical and Empirical Background
Team-Based Production and Profit Sharing
Profit sharing is thought to affect firm productivity in three main ways—by making
wages more flexible to financial conditions of the firm through substituting profit sharing
payments for fixed wages (Weitzman and Kruse 1990); by attracting, developing, and retaining
a higher quality of human capital (Azfar and Danninger 2001; Green and Heywood 2011; Kruse,
Freeman, and Blasi 2010); and by serving as an incentive mechanism for aligning the interests
of workers with the firm (Blasi, Freeman, Mackin, and Kruse 2010). Such alignment may
prompt a number of beneficial worker behaviors, such as increased employee motivation and
effort, enhanced cooperation between employees and with management, increased self and
4
mutual monitoring of worker behavior, positive workgroup norms, and development of more
efficient work methods (Kruse 1993)—in other words, profit sharing may cause workers to both
“work harder” and “work smarter”.
However, while profit sharing may help align the interests of workers with those of
shareholders, some scholars have argued that its effectiveness in motivating workers may be
limited by the “free rider” or “1/N problem” (Olson 1971; Jensen and Meckling 1976; Alchian
and Demsetz 1972). With all else being equal, the proportion of any profit increase produced by
given worker’s extra effort that the worker will receive—and therefore his or her incentive to
provide extra effort—decreases with the number of workers participating in the profit-sharing
scheme (N). Put another way, the larger the organization, the less clear is the “line of sight”
between individual employee performance and the rewards the individual receives through
profit sharing, and the more obscured the “line of sight” the less the impact on individual
motivation (Lawler 1992).
Given this, it has been anticipated that larger firms would avoid using profit sharing
because of the 1/N problem. Yet virtually all studies find either no significant association
between firm size and presence of profit sharing (e.g., Wagar and Long 1995, for Canada;
Drago and Heywood 1995, for Australia; FitzRoy and Kraft 1986, and Heywood and Jirjahn
2002, for Germany; Cheadle 1989, and Kruse 1996, for the U.S.; Pendleton 1997, for Britain) or
a positive link (e.g., Gregg and Machin 1988, for Britain; Jones and Pliskin 1997, and Adams
2002, for Canada; FitzRoy and Kraft 1995, for Germany; Amisano and Del Boca 2004, for
Italy), casting doubt on the free-riding hypothesis as applied to profit-sharing plans.
While fixed costs in the adoption of profit sharing—whereby a larger employer has
more employees over whom to spread the fixed costs of establishing and administering profit
5
sharing—might explain these results, Adams (2002, 2006) suggests an alternative explanation.
He argues that the higher the degree of worker interdependence in the production process, the
greater the value of the common goals created by profit sharing, and that the extent of
production interdependency may grow with firm size. Interdependent worker production
implies that shirking by an individual worker decreases not only his/her own productivity but
also the productivity of other workers (Alchian and Demsetz 1972). This increases the cost of
shirking as it implies a more drastic decline in total production and therefore in individual
employee profit-sharing earnings.
Thus, it is possible that an increase in firm size has two opposing incentive effects
(Heywood and Jirjahn 2009). On the one hand, the 1/N problem gets more severe, reducing each
worker’s incentive to exert effort. This would be anticipated because larger firms are likely to
have profit-sharing schemes covering more workers. On the other hand, larger firms may have
greater production interdependencies, increasing the cost of shirking. These offsetting
influences could make the role of firm size ambiguous and help explain the usual failure to
confirm that profit sharing is less common in larger firms. Thus, the extent to which a free
riding or 1/N problem exists in large firms will depend on the presence of team production in
the workplace. Use of team production would serve to internalize the costs of shirking for
workers (at least to some extent), rather than being an externality for them, and workers would
be more prone to punish free riding. Consistent with this argument, Heywood and Jirjahn (2009)
found that among German establishments using team production there was no relationship
between establishment size and presence of profit sharing, but found a significant negative
relationship between size and presence of profit sharing among establishments that did not use
team based production.
6
Recently, Freeman, Kruse and Blasi (2010) conducted an analysis of shirking in the
workplace, using two major US data bases. They first note that shirking is not a problem
confined to workplaces that have what they term “shared capitalist” (i.e. profit sharing,
employee stock plans) arrangements in place, but is also common in other workplaces. They
note that a key argument against the 1/N problem made by advocates of shared capitalism is that
workers in such arrangements may engage in “mutual monitoring” under which workers will
intervene with workers who are perceived to be putting forth insufficient job effort. They
further note that, where workers have no financial interest in the outcome, the “costs of
intervening” with the shirker will almost inevitably outweigh any individual benefit to the
intervener. In line with this, their empirical results indicate that “workers are most likely to take
action against shirkers in workplaces where employees are paid by some form of ‘shared
capitalism’… and where they participate in decisions or work in team settings” (Freeman, Kruse,
and Blasi 2010: 79).
Working in a team setting may encourage anti-shirking behaviour in a variety of ways.
First, shirking behavior is more apparent in a team context, compared to a context where
employees perform their work in isolation from one another. Second, in an interdependent
context, shirking behavior has the potential to impede the productivity of other workers, or to
make their jobs harder, thus multiplying (in the eyes of workers) the detrimental effects of
shirking. Third, these factors may cause teams to develop group norms that discourage shirking.
Fourth, workers in a team context have an incentive to support an intervention by one of their
members to deter shirking behavior, and potential interveners are far more likely to take anti-
shirking action if they feel supported by the work group in so doing. Therefore, the main
hypothesis in our study is the following:
7
H1: There will be a positive interaction between profit sharing adoption and
presence of work teams on workplace productivity.
Of course, in putting forward this hypothesis, we recognize that work teams may
enhance the productivity effects of profit sharing in ways other than simply through
constraining shirking behavior (part of the “working harder” path to increased worker
productivity). For example, increased productivity may occur through increased worker
cooperation, and increased helping behavior in the form of informal training and coaching (part
of the “working smarter” path to increased worker productivity). Research has shown that profit
sharing appears to increase both formal worker training (Gielen 2011) and informal training and
coaching by co-workers (Green and Heywood 2011). A team context may encourage a profit
sharing employer to provide more formal training, because there is more opportunity in a team
context for this training to affect performance, due to the interdependence of teamwork. A team
context in a profit sharing firm may allow co-workers more opportunity to provide informal
training and coaching to fellow team members than where team style production is not used.
Finally we note that, even if there is a positive interaction, it doesn’t necessarily mean
that use of teams is a necessary condition for profit sharing to improve workplace productivity.
It could simply mean that, even without teamwork, profit sharing adoption improves
productivity, but when profit sharing is adopted by a firm that uses teamwork, the results are
even more positive. Therefore, it is important to also investigate the specific nature of any
interaction between profit sharing adoption and teamwork, and we will do so.
Other Possible Contextual Variables
Besides the question of whether team-based production affects the relationship between
profit sharing and workplace productivity, we also examine several other conditions that may
8
influence this relationship. Specifically, does establishment size, union status, or the pre-
existing compensation level of employees condition the relationship between employee profit
sharing and employee productivity growth subsequent to adoption of profit sharing?
As discussed earlier, a factor that may influence the relationship between employee
profit sharing and workplace productivity is company size. For example, in his review of
evidence from medical and legal partnerships, Prendergast (1999) found that profit sharing
becomes increasingly irrelevant in motivating workers as the size of the partnership increases. If,
due to the 1/N problem, large firms do benefit less from profit sharing (and the empirical
evidence is inconclusive on this point) then we should see a negative interaction between
workplace size and productivity growth subsequent to adoption of employee profit sharing.
Another factor that may be relevant is union status. In general, unions are opposed to
profit sharing, because it adds a dimension of instability and uncertainty to employee pay,
because it is seen as subject to manipulation by management, and because it is seen as a
mechanism to undermine the union, by creating greater employee identification with
management (Katz and Meltz 1991). While the empirical evidence is mixed, the bulk of the
evidence does point to a negative relationship between unionization and presence of profit
sharing, including studies in Canada (Long 1989; Ng and Maki 1994; Wagar and Long 1995;
Jones and Pliskin 1997), the United States (Cheadle 1989; Cooke 1994; Kim 1998; Kruse 1993,
1996), Britain (Poole 1989), and Germany (Heywood, Hubler, and Jirjahn 1998). However,
other studies for Canada (Long 1992), Australia (Drago and Heywood 1995), and Finland
(Jones, Kalmi, Kato, and Makinen 2012) show no association, while two studies show positive
relationships, one in Britain (Gregg and Machin 1988) and the other in Brazil (Zylberstajn
2002). A recent study of 13 European countries found that centralized collective bargaining was
9
negatively associated with presence of profit sharing in countries where centralized bargaining
was predominant (Kalmi, Pendleton, and Poutsma 2012) but showed no association in countries
where centralized bargaining was not predominant.
Nonetheless, many unionized establishments do have profit sharing plans that include
union members. In such establishments, unions may have a deleterious effect on the functioning
of profit sharing in several ways. For example, they may continue to advocate the traditional
adversarial relationship between employees and management, and discourage members from
being what they might see as “overly-cooperative” with management and from making labor-
saving suggestions, which the union might see as a threat to the employment of its members. In
addition, in the interests of member solidarity, unions may discourage members from
undertaking anti-shirking behavior, arguing that supervision of the workforce is properly the
sole province of management. Overall, to the extent that this argument holds sway, we would
expect to find a negative interaction between adoption of profit sharing and union status in
predicting workplace productivity growth over time.
Finally, another factor that may condition the relationship between profit sharing and
company productivity is the relative value of the human capital employed within the firm, as
proxied by whether the firm compensates its employees above the market average for its
industry. Presumably, firms pay above-market wages (“efficiency wages”) in order to attract
and retain a higher quality of human capital. Hart and Hubler (1991) point out that under rent-
sharing theory, workers with relatively high levels of wage compensation are more likely to be
included in profit sharing (because these employees presumably can play a greater role in
creating additional “rents” than other employees) as Long and Fang (2014) found in their
Canadian sample. If profit sharing allows establishments to continue to offer above-market
10
compensation to their employees (as found by Long and Fang, 2012) and thus retain a higher
quality of human capital, employee profit sharing may serve as a mechanism to help extract
maximum value from this investment in human capital. Overall, to this extent that this “human
capital argument” holds sway, we would expect a positive interaction between adoption of
profit sharing and high wages in predicting workplace productivity growth over time.
3. Methodology
Data and Research Design
In conducting this research, we utilize a longitudinal panel of data, based on the
Workplace and Employee Surveys (WES) conducted by Statistics Canada from 1999 (the first
year in which the WES was conducted) to 2006 (the last year in which the WES was conducted).
These surveys are designed to be representative of the total population of “workplaces” in
Canada, but exclude business locations in the sparsely populated Yukon, Nunavut and
Northwest Territories, as well as those in agriculture, fishing, road, bridge and highway
maintenance, government services and religious organizations. The WES then follows the same
workplaces over time, although replacement is made in every third year for workplaces that
drop out of the survey. As utilized by Statistics Canada, a “workplace” is a business unit located
at a single geographic location, and is analogous to the term “establishment” as frequently used
in survey research. In this paper, we will generally use the more commonly understood term
“establishment” to denote the unit of analysis. Our sample is limited to for-profit organizations
only.
The sample frame for the WES was generated from the Statistics Canada Business
Register, which is a list of all businesses in Canada, updated monthly. Prior to sample selection,
the business locations on the frame were stratified by industry, region, and size (based on
11
estimated employment), and the sample was then selected using a Neyman allocation (Statistics
Canada, 2004). The response rates for our selected years (1999, 2001, 2004, and 2006) of
workplace surveys are stated by Statistics Canada as 95.2%, 85.9%, 81.7%, and 74.9%
respectively, with most of the “non-responders” comprising owner-operators with no paid
employees (Statistics Canada 2006). Given the breadth and sensitivity of the information
collected, these are rather remarkable response rates, no doubt facilitated by the facts that
cooperation with Statistics Canada is obligatory and that extensive legal protections ensure
confidentiality of responses.i
Data were collected through computer-aided telephone interviews with senior
management officials at each workplace, conducted by trained interviewers based in Statistics
Canada’s regional offices. Each workplace was first sent a copy of the survey, with instructions
to regard the survey as “as a working tool to inform you ahead of time of the questions being
asked and to help you in preparing your answers.” As the survey is lengthy, and includes many
questions requiring reference to company records, the intent was to allow respondents time to
locate this information before being interviewed. The instructions emphasized that the survey
forms were not to be returned by mail, but that the information was to be provided directly to
the interviewer. The intent here was to provide the opportunity for the interviewer to clarify
questions and answers, and then to follow up if necessary.
After each survey, before any data were made available for research purposes, Statistics
Canada spent more than two years conducting various procedures to ensure a clean data set.
During data collection, the computer-aided interview format provided various checks to reduce
the possibility of input errors or incorrectly recorded values. Following data collection,
extended input editing was applied, followed by extensive data analysis and ratio editing to
12
determine outlying observations based on robust outlier detection programs (Statistics Canada
2004).
We constructed two panels of longitudinal data—one based on a three-year period
subsequent to profit sharing adoption, and the second based on a five-year period subsequent to
profit sharing adoption. The three-year panel was constructed by first taking the 1999 WES
sample and eliminating all workplaces with less than ten employees, those that are not for-profit
enterprises, those that reported having profit sharing in 1999, and those that were not also
included in the 2001 and 2004 surveys. We also eliminated workplaces that adopted profit
sharing during the period after 2001, so we would know that all adoptions occurred during the
1999-2001 window. We used a similar method to create our five-year panel, this time using the
2001-2006 period. This resulted in 1,690 workplaces in our three-year panel, and 1,540 in our
five-year panel. We based our independent variable (“Profit Sharing Adoption”) on whether the
workplace reported having employee profit sharing in the 2001 survey, with “1” indicating that
the workplace had adopted profit sharing, and “0” indicating the workplace continued to not
have employee profit sharing.
The rationale for this approach is that we wished to identify recent adopters of profit
sharing (i.e. those that adopted between the 1999 and 2001 surveys), and then follow the growth
of workplace productivity during the three-year period 2001-2004 and during the five-year
period 2001-2006. This gives us pre-existing data for both the workplaces that did and those
that did not adopt profit sharing, and we can compare productivity growth in the two groups,
while incorporating a large array of control variables (as measured in 2001). In choosing an
appropriate time period to assess the effects of implementation, we wanted to allow enough
time for the possible effects to materialize, but not so much time that too many exogenous
13
events would occur. We note that, when assessing the effects of human resource practices on
organizational outcomes, Osterman (2000) chose a five-year period, and this seemed reasonable
to us as our outer limit.
The average workplace size (number of employees) is 45, and 31.9 percent of
workplaces are unionized. The average union density is 22.3 percent. The distribution of
workplaces by industry is: resources (1.4%), labor-intensive tertiary manufacturing (5.8%),
primary product manufacturing (3.1%), secondary product manufacturing (5.8%), capital
intensive tertiary manufacturing (6.3%), construction (6.1%), transportation/wholesaling
(14.3%), communication/utilities (3.3%), retailing/consumer services (21.9%),
finance/insurance (7.5%), real estate (1.6%), business services (15.2%), education and health
services (5.3%), and information/cultural services (2.4%).
Variable Measures
An establishment was deemed to have adopted employee profit sharing if respondents to
the 2001 WES responded “yes” to the following question:
“Does your compensation system include … [a] profit sharing plan? Profit-
sharing plan is any plan in which employees receive a share of the profits from
the workplace.”
Any plans that applied only to managers were not deemed to be “employee profit sharing
plans,” and these cases were eliminated from the panel. All remaining cases were designated
“0” (no profit sharing adoption) or “1” (profit sharing adoption). Of the 1,717 establishments
that did not have employee profit sharing in 1999, 247 (14.4%) had adopted it by 2001.ii
We measured workplace productivity growth for the three-year panel by calculating the
percentage change of productivity between 2001 and 2004, which is measured by dividing the
14
gross workplace revenues reported in 2001 and 2004 by the number of full-time equivalent
employees in each year, and then dividing this number by the 2001 revenue per employee. If the
resulting quotient is positive, this represents a productivity increase during the three-year period;
if the quotient is negative, this represents a productivity decrease during the three-year period.
We used the same procedure for calculating productivity growth for the five-year panel, except
that the comparisons were between revenue per employee in 2006 and revenue per employee in
2001. We note that these comparisons over time are based on “within firm” comparisons, with
productivity in each workplace compared to productivity in that same workplace either three or
five years later.
We assessed whether or not the workplace used work teams in the following manner.
Respondents were asked to indicate whether the workplace utilized, for their nonmanagerial
employees, on a formal basis, “Self-directed Work Groups.” These were described as “Semi-
autonomous work groups or mini-enterprise work groups that have a high level of responsibility
for a wide range of decisions/issues.” Responses were coded as either “1” (yes) or “0” (no). We
recognize that it may have been preferable to have some measure that assessed the extent to
which work teams permeated a given workplace, but these data were not available. Thus, a
workplace would be counted as having team-based work even if it had only one such group,
possibly covering only a small proportion of the employees at that workplace.
However, we note that that this issue is ameliorated to some extent because our unit of
analysis is not the firm, but the workplace, which represents operations at single location. For a
large, multiple workplace, firm, this essentially means that we are assessing the existence of
teamwork at each location rather than for the firm as a whole, where one work team in one far-
flung unit would have been enough to classify a firm as using work teams. Use of the workplace
15
also makes the average size of our unit of analysis quite small (an average of 45 employees at
each workplace), so that the use of even one work team may well comprise a significant
proportion of the workforce at that workplace. Nonetheless, we recognize that a more fine-
grained measure would make it easier to detect effects that truly exist, which leaves us in danger
of making a type 2 error—not detecting effects when they truly exist.
To control for industry sector, thirteen dummy variables are created, representing all of
the sectors discussed earlier in this section, with the exception of retailing, which serves as the
omitted (comparison) variable for analytical purposes. A further set of controls is used to
control for the possible effect of performance pay other than profit sharing. For example,
individual incentives have long been positively associated with productivity (Lazear 2000;
Mitchell, Lewin, and Lawler 1990; Parent 2002), and recent Canadian research has shown that
the presence of numerous types of performance pay is positively associated with presence of
profit sharing (Long 2002). Therefore, we use dummy variables to control for the presence of
individual incentives, merit pay, gain sharing, and employee stock plans. We also control for
union density (the proportion of total employees at a given establishment covered by a
collective bargaining agreement) and establishment size (the total number of full-time
equivalent employees at a given establishment). All of these variables are based on how they
stood at 2001, by which time all the establishments in our sample which were to adopt profit
sharing had done so.
These controls are included in all multivariate analysis. Data analysis was carried out
using OLS multiple regressioniii, with each workplace weighted to represent its proportion in
the general population. Statistics Canada strongly encourages the use of establishment weights
so that any results are broadly representative of the Canadian population of establishments.
16
Because larger establishments tend to be over-represented in our sample, the effect of weighting
is to apply higher weights to smaller establishments. We did try the analysis using unweighted
data, and found somewhat stronger effects, but we adopted the more conservative approach
recommended by Statistics Canada for this paper.
Besides testing for main effects, we conducted a second set of estimations testing for
interaction effects of profit-sharing adoption with team-based production, firm size, union status,
and pre-existing compensation level, as they stood in 2001. Interaction terms were constructed
by multiplying profit sharing adoption by the team variable, profit sharing adoption by
establishment size, profit sharing by union density, and profit sharing adoption by 2001
employee earnings. All continuous variables contained in the interaction terms were mean-
centered before inclusion in the regression equations (Cohen et al. 2002).
4. Results
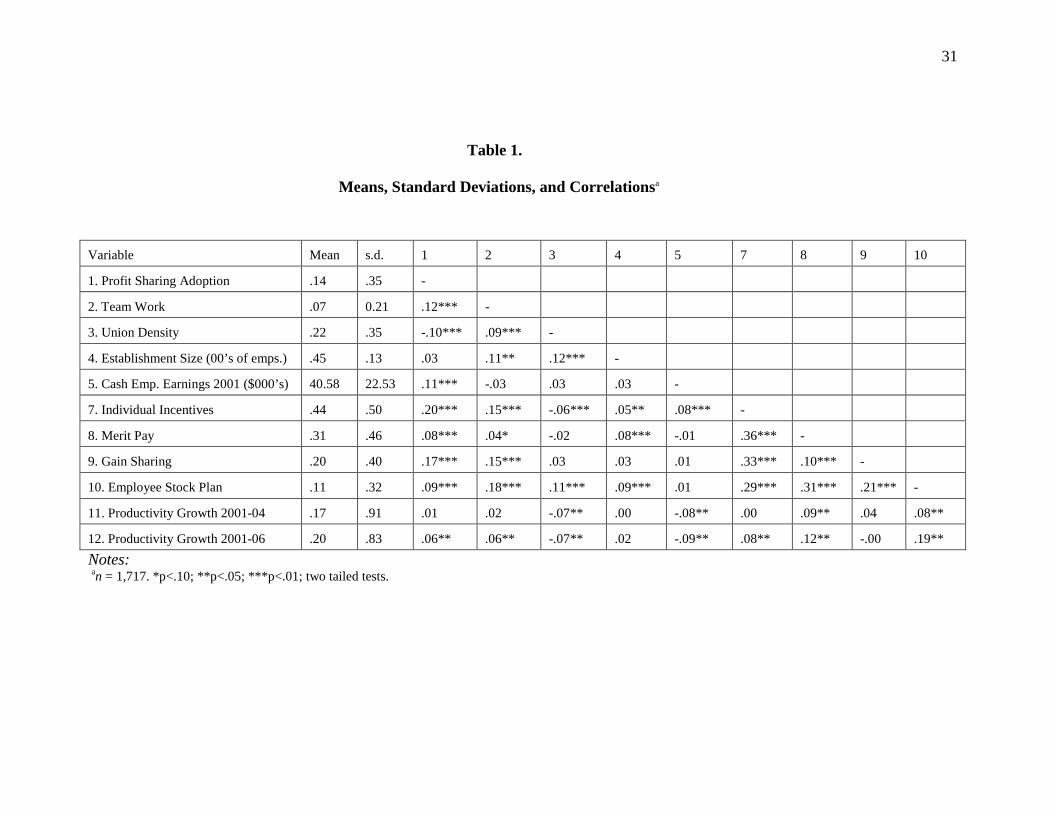
Table 1 shows the means, standard deviations, and bivariate correlations for each sample
panel. As can be seen, numerous variables are significantly related to profit sharing adoption.
Profit sharing adopters are more likely to have all four types of performance pay plans—merit
pay, individual incentives, gain sharing, and employee stock plans—prior to profit sharing
adoption than establishments that did not adopt profit sharing. Larger establishments and
establishments that offer higher wages are significantly more likely to adopt profit sharing,
while establishments with higher union coverage are significantly less likely to adopt profit
sharing. This confirms the importance of controlling for these variables in our multiple
regression analyses.
17
---------------------------------------------------------
Insert Table 1 about here
---------------------------------------------------------
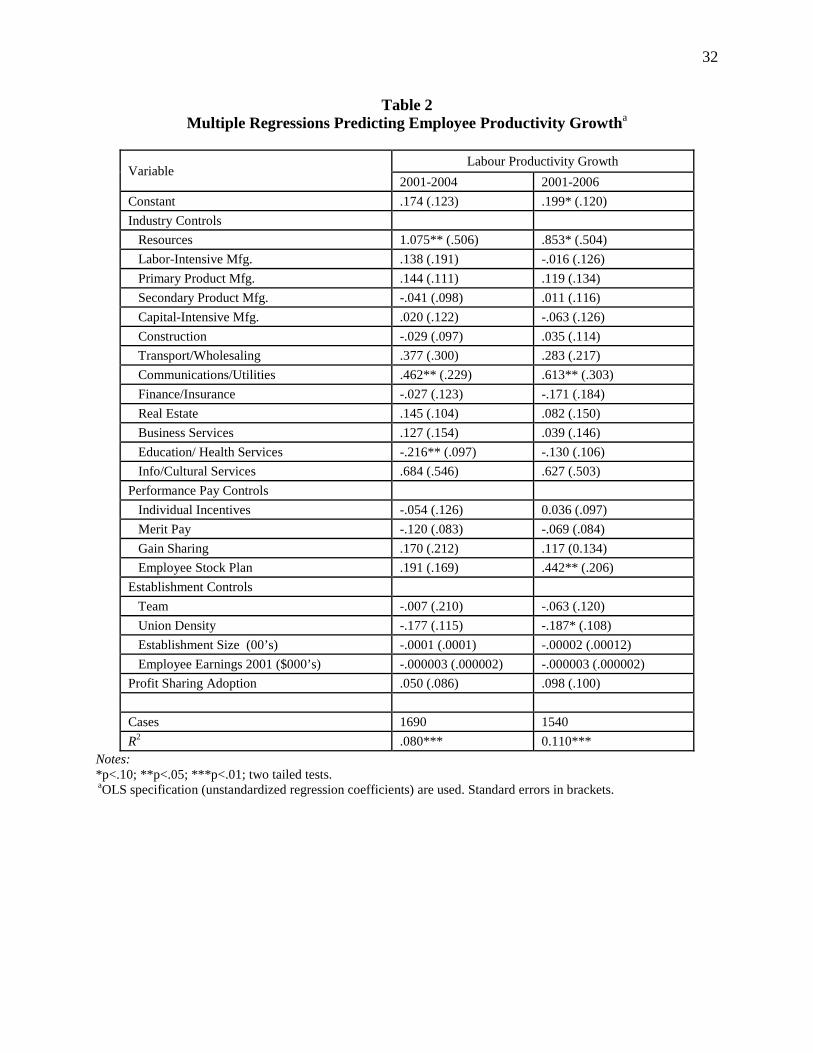
Table 2 presents the multiple regression equations, for both panels, showing the main
effects of the independent variables. As the table shows, adoption of profit sharing shows no
significant relationship to subsequent productivity growth, in either the three-year or the five-
year panels.
---------------------------------------------------------
Insert Table 2 about here
---------------------------------------------------------
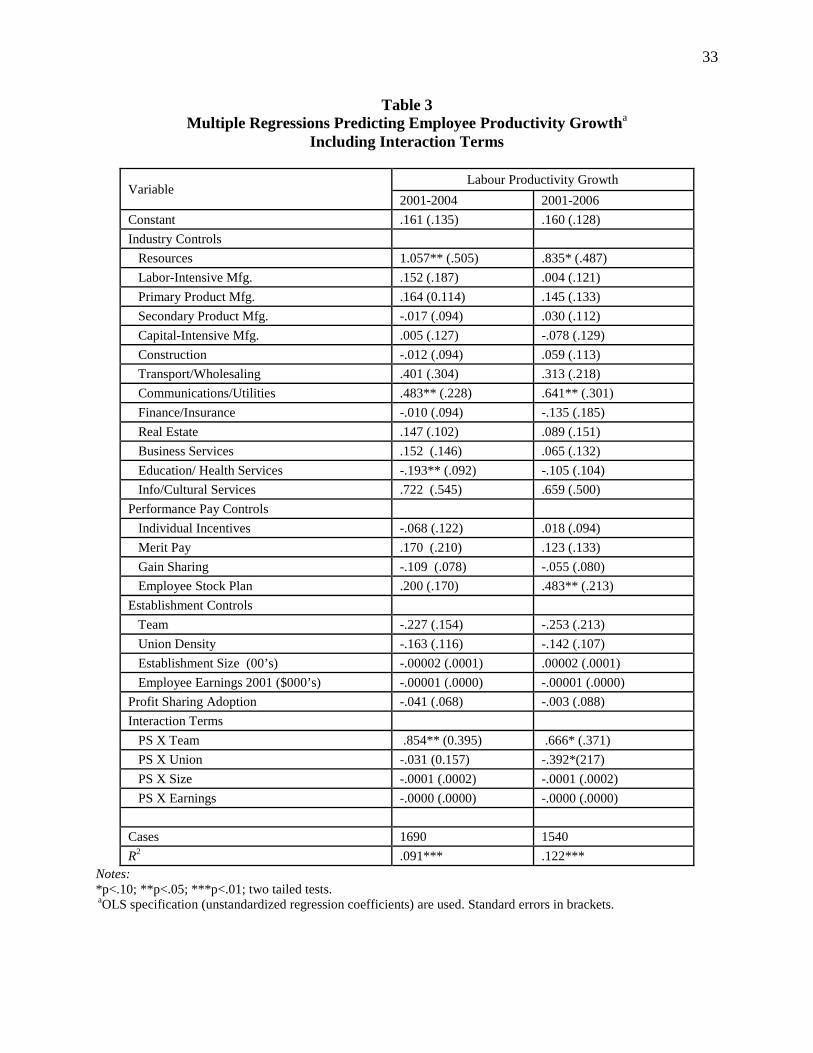
Table 3 presents the multiple regression equations, for both panels, including the
interaction terms. As can be seen, in both panels there is a significant positive interaction
between adoption of profit sharing and presence of teamwork in influencing productivity
growth, thus supporting our main hypothesis. Regarding the other possible interactions (with
size, union density, and employee earnings), no significant interactions were found in the three-
year panel. However, one significant interaction was found in the five-year panel—a negative
interaction between adoption of profit sharing and union density on productivity growth. Thus,
over the longer term, establishments with higher union density benefited less (or not at all) from
adoption of profit sharing than did other establishments.
---------------------------------------------------------
Insert Table 3 About Here
--------------------------------------------------------
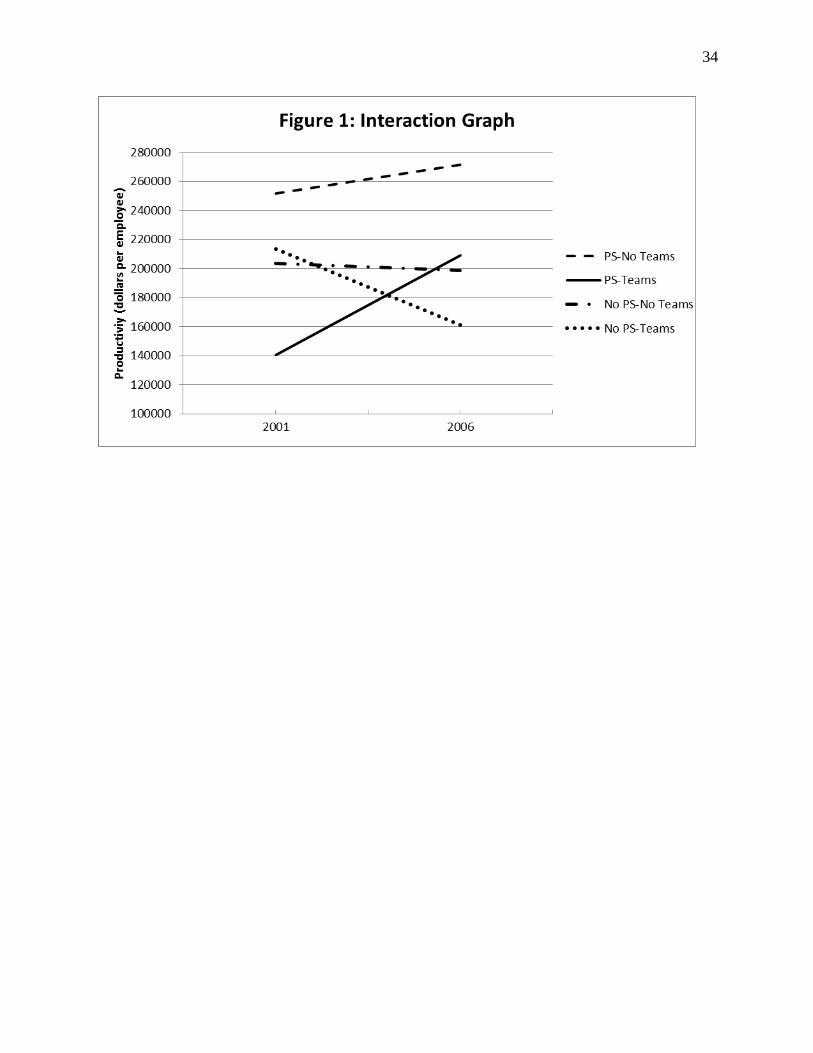
In order to better understand the nature of the interaction between profit sharing and
18
teamwork, we constructed an interaction graph (using the five-year span), depicted in Figure 1.
The graph shows that establishments with teamwork which adopted profit sharing showed a
dramatic increase in productivity (which was highly statistically significant), averaging
approximately 48.6% over the five-year period, while establishments without teamwork that
adopted profit sharing showed a modest (and statistically insignificant) five-year average
productivity increase of 7.8%. In contrast, establishments that did not adopt profit sharing
actually showed a productivity decline over the five-year period. Establishments without
teamwork that did not adopt profit sharing showed a slight (and non-significant) productivity
decline averaging 2.3%, while establishments with teamwork that did not adopt profit sharing
showed a substantial (and statistically significant) average productivity decline of 24.6%.
---------------------------------------------------------
Insert Figure 1 About Here
--------------------------------------------------------
5. Discussion and Conclusions
Overall, our results suggest that use of team-based production plays an important role in
the success of employee profit sharing—at least in terms of labor productivity. Establishments
with teamwork that adopted profit sharing showed a substantial and highly significant increase
in workplace productivity over both the three-year and five-year periods subsequent to adoption,
while those establishments without teamwork that adopted profit sharing showed no significant
growth in productivity over either period. These findings are in line with the notion that work
teams help to mitigate potential shirking behavior in profit sharing firms (Freeman, Kruse, and
Blasi 2010), and are also in line with the argument that work teams serve as an effective
mechanism to translate the purported motivational and other benefits of profit sharing into
19
tangible productivity gains (Heywood and Jirjahn 2009).
Another finding—supporting findings of Freeman, Kruse and Blasi (2010) that suggest
that the “shirking” problem (as rooted in the 1/N issue) can be overcome—is the lack of any
significant interaction between adoption of profit sharing and workplace size on productivity
growth. If shirking is a problem, and if it is exacerbated by a greater workplace size, then we
would expect to see a significant negative interaction between profit sharing adoption and
workplace size on productivity growth. That no such interaction was found suggests either that
shirking is either not a problematic issue for profit sharing firms, or that use of work teams
helps ameliorate the size issue for profit sharing adopters, as Heywood and Jirjahn (2009) argue.
Indeed, as is shown in Table 1, establishments with work teams were significantly larger than
those without work teams, and were also significantly more likely to adopt profit sharing than
establishments without work teams, as Heywood and Jirjahn (2009) also found.
In discussing our findings, we should note that we don’t know the specific drivers of the
productivity increases we have observed in profit sharing adopters that utilize work teams. As
discussed earlier, it may be that teams provide a better context for restraining shirking behavior
(thus resulting in employees “working harder”), or it may be that teams provide a context for
more cooperative and more innovative work behavior (thus resulting in employees “working
smarter”). It could be some of each.
Our finding of a negative interaction between adoption of profit sharing and union
density on productivity growth (in the five-year panel) suggests that the union may constrain
anti-shirking worker behavior—and possibly also constrain increases in productive worker
behaviors—that might otherwise flow from adoption of profit sharing. One can easily infer that
unions may take a dim view of members intervening to take anti-shirking action against fellow
20
union members. Interestingly, our finding that suggests profit sharing will be of little or no
benefit to establishments with high union density is consistent with the reality that firms with
high union density are significantly less likely to adopt employee profit sharing, as Table 1
shows, and as is common in the empirical literature.
Our finding of no significant interaction between profit sharing and employee earnings
suggests that workplaces with high employee earnings derive no particular productivity
advantage from adopting profit sharing. Profit sharing either does not seem to have any
particular utility in extracting additional productivity from employees possessing high human
capital, or such workers are able to appropriate in their earnings any productivity gains that
ensue from profit sharing adoption (“rent sharing”). However, it may be that profit sharing is
beneficial to establishments with costly human capital in ways that don’t affect worker
productivity growth, but are nonetheless beneficial to the establishment, such as allowing the
firm to maintain high employee earnings while gaining a greater degree of pay flexibility.
Finally, one rather intriguing finding is that establishments with teams but which did not
adopt profit sharing showed a substantial decrease in productivity over the study period, in
sharp contrast to the substantial increase shown by those team-based establishments that did
adopt profit sharing, and also in contrast to those firms without teams that did not adopt profit
sharing, who experienced no significant change in productivity over the study period. This
finding is consistent with the argument that team-based work needs to be combined with some
type of group or organizational performance pay in order to ensure that teams are working
towards organizational goals (Lawler 1992), and the significant positive interaction between
profit sharing adoption and teamwork is in line with this argument. However, we note that—
unlike in the case of profit sharing adoption—where we can infer causality—we cannot
21
conclude that teamwork reduced productivity during the study period, since the study was not
designed to have a before-and-after research design for the teamwork variable.
As with all empirical studies, our study has both strengths and limitations. Strengths
include use of a data set that embodies a large-scale sample, a very high response rate, and is
carefully designed to be representative of Canadian for-profit establishments. Use of the
workplace level of analysis allows for more precise measurement of the study variables than the
corporate-wide measures that are often used in this kind of research. A key strength is that the
data base allows for longitudinal analysis, enabling us to utilize a before-and-after within-firm
design to assess productivity change over a substantial period subsequent to profit sharing
adoption, while also controlling for many variables that may affect our hypothesized results. Of
course, this is not to say that we have controlled for all possible relevant variables.
A potential problem for all types of survey research is the reliability of the data collected.
Gerhart, Wright, McMahan, and Snell (2000) have found reliability to be a major concern for
survey data when it is collected from a single respondent, as is the case for the WES. However,
this single respondent issue may not pose as much of a concern for the WES as for other
surveys. First, the format of the WES is designed to enhance reliability of responses, through
allowing for preparation by respondents but interviews for actual data collection. This
procedure enables clarification of both questions and answers. In so doing, trained Statistics
Canada interviewers are used, who have no vested interest in the particular outcomes of any
studies based on the survey information.
Second, Gerhart, Wright, McMahan, and Snell (2000) note that establishment-level
surveys are likely more reliable in studying HR practices than corporate-level surveys, because
the units of analysis are smaller, managers are more familiar with HR practices because they are
22
responsible for implementing them, and HR practices are more homogenous, and Gerhart,
Wright, and McMahan (2000) do indeed find higher reliability at the plant than at the company
level. Further research by Wright and his colleagues (2001) concluded that single-respondent
surveys should use a single business or single location as its unit of analysis, as is true for the
WES. As a result of its careful design and data collection procedures, the WES data base has
been seen as an appropriate vehicle for research on human resource practices (Mohr and Zoghi
2008; Zatzick and Iverson 2006).
Finally, all empirical studies are bounded by their temporal, national, and institutional
contexts. The period under study here was characterized by good economic conditions in 1999-
2000, an economic meltdown in 2001, and gradually improving economic conditions after that
until the end of our study period. The study took place in Canada, which is deemed a “liberal
market economy” rather than a “coordinated market economy” (Kalmi and Kauhanen 2008),
and where cash-based profit sharing plans are the norm, rather than deferred profit sharing plans,
which are the norm in various other countries, most notably the United States. Any of these
factors may have influenced our results. Further studies in other countries—using a longitudinal
design that allows causal inference—would be necessary to assess the extent to which our
findings extend beyond the Canadian context.
23
References
Alchian, A.A. and Demsetz, H. (1972). ‘Production, information costs, and economic
organization’. American Economic Review, 62(5): 777-795.
Adams, C.P. (2002). ‘Does size really matter? Empirical evidence on group incentives.’
Working Paper No. 252, Federal Trade Commission, Washington, DC.
Adams, C.P. (2006). ‘Optimal team incentives with CES production.’ Economics Letters, 92:
143–148.
Amisano, G., and Del Boca, A. (2004). ‘Profit related pay in Italy: A microeconometric
analysis’. International Journal of Manpower, 25(5): 463-478.
Andrews, M., Bellmann, L., Schank, T., and Upward, R. (2010). ‘The impact of financial
compensation on workers’ compensation’. Zeitschrift fur Arbeitsmarkt Forschun—
Journal of Labor Market Research, 43(1): 72-89.
Azfar, O. and Danninger, S. (2001). ‘Profit Sharing, employment stability, and wage growth’.
Industrial and Labor Relations Review, 54: 619-630.
Bayo-Moriones, A. and Larraza-Kintana, M. (2009). ‘Profit sharing plans and affective
commitment: Does the context matter?’ Human Resource Management, 48(2): 207-226.
Blasi, J.R., Freeman, R.B., Mackin, C., and Kruse, D.L. (2010). ‘Creating a Bigger Pie? The
Effects of Employee Ownership, Profit Sharing, and Stock Options on Workplace
Performance’. In Shared Capitalism at Work: Employee Ownership, Profit and Gain
Sharing, and Broad-Based Stock Options, edited by D.L. Kruse, R.B. Freeman, and J.R.
Blasi, pp. 139-166. Chicago: University of Chicago Press.
Boning, B., Ichniowski, C., and Shaw, K. (2007). ‘Opportunity counts: Teams and the
effectiveness of production incentives.’ Journal of Labor Economics, 25(4): 613-650.
24
Cheadle, A. (1989). ‘Explaining patterns of profit-sharing activity’. Industrial Relations, 28(3):
387–400.
Coates, E.M. (1991). ‘Profit sharing today: Plans and provisions’. Monthly Labor Review,
114(4): 19–25.
Cohen, J., Cohen, P., West, S.G, and Aiken, L.S. (2002). Applied Multiple
Regression/Correlation Analysis for the Behavioral Sciences, Third Edition.
Philadelphia: Lawrence Erlbaum.
Cooke, W.N. (1994). ‘Employee participation programs, group-based incentives, and company
performance: A union-nonunion comparison’. Industrial and Labor Relations Review,
47(4): 594–609.
Drago, R. and Heywood, J.S. (1995). ‘The choice of payment schemes—Australian
establishment data’. Industrial Relations, 34(4): 507–531.
Fitzroy, F. and Kraft, K. (1986). ‘Profitability and profit sharing’. Journal of Industrial
Economics, 35(2): 113–130.
Fitzroy, F. and Kraft, K. (1995). ‘On the choice of incentives in firms’. Journal of Economic
Behavior and Organization, 26(1): 145-160.
Freeman, R.B., Kruse, D.L., and Blasi, J.B. (2010). ‘Worker responses to shirking under shared
capitalism’. In Shared Capitalism at Work: Employee Ownership, Profit and Gain
Sharing, and Broad-Based Stock Options, edited by D.L. Kruse, R.B. Freeman, and J.R.
Blasi, pp. 77-104. Chicago: University of Chicago Press.
Gerhart, B., Wright, P.M, and McMahan, G.C. (2000). ‘Measurement error in research on the
human resources and firm performance relationship: Further evidence and analysis’.
Personnel Psychology, 53(4): 855–872.
25
Gerhart, B., Wright, P.M., McMahan, G.C., and Snell, S.A. (2000). ‘Measurement error in
research on the human resources and firm performance relationship: How much error is
there and how does it influence effect size estimates?’ Personnel Psychology, 53: 803–
834.
Gielen, A.C. (2011). ‘Profit sharing for increased training investments’. British Journal of
Industrial Relations, 49(4): 643-665.
Green, C.P. and Heywood, J.S. (2011). ‘Profit sharing, separation, and training’. British Journal
of Industrial Relations, 49(4): 623-642.
Gregg, P.A. and Machin, S.J. (1988). ‘Unions and incidence of performance linked pay schemes
in Britain’. International Journal of Industrial Organization, 6(1): 91–107.
Hart R. A., and O. Hubler. 1991. ‘Are profit shares and wages substitute or complementary
forms of compensation?’ Kyklos, 44(2): 221–231.
Heywood, J.S., Hubler, O., and Jirjahn, U. (1998). ‘Variable payment schemes and industrial
relations: Evidence from Germany’. Kyklos, 51(2): 237–257.
Heywood, J.S. and Jirjahn, U. (2002). ‘Payment schemes and gender in Germany’. Industrial
and Labor Relations Review, 56(1): 44-64.
Heywood, J.S. and Jirjahn U. (2009). ‘Profit sharing and firm size: The role of team production’.
Journal of Economic Behavior and Organization, 71(2): 246-256.
Ichniowski, C., Shaw, K., and Prennushi, G. (1997). ‘The effects of human resource
management practices on productivity: A study of steel finishing lines’. American
Economic Review, 87(3): 291-313.
Jensen, M. and Meckling, W. (1976). ‘Theory of the firm: Managerial behavior, agency costs,
and ownership structure’. Financial Economics, 3: 305–360.
26
Jones, D.C., Kalmi, P., and Kauhanen, A. (2010). ‘Teams, incentive Pay, and productive
efficiency: Evidence from a food-processing plant’. Industrial and Labor Relations
Review, 63(4): 606-626.
Jones, D.C., Kalmi, P., Kato, T., and Makinen, M. (2012). ‘Financial participation in Finland:
Incidence and determinants’. The International Journal of Human Resource
Management, 23(8): 1570-1589.
Jones, D.C., and Pliskin, J. (1997). ‘Determinants of the incidence of group incentives:
Evidence from Canada’. Canadian Journal of Economics, 30(4B): 1027–1045.
Kalmi, Panu, and Antti Kauhanen. 2008. “Workplace Innovations and Employee Outcomes:
Evidence from Finland.” Industrial Relations, Vol. 47, No. 3, pp. 430-459.
Kalmi, P., Pendleton, A., and Poutsma, E. (2005). ‘Financial participation and performance in
Europe’. Human Resource Management Journal, 15(4): 54-67.
Kalmi, P., Pendleton, A., and Poutsma, E. (2012). ‘Bargaining regimes, variable pay and
financial participation: Some survey evidence on pay determination’. The International
Journal of Human Resource Management, 23(8): 1643-1659.
Katz, H.C. and Meltz, N.M. (1991). "Profit sharing and auto workers earnings—The United
States vs Canada." Relations Industrielles/Industrial Relations, 46(3): 515–530.
Kato, T. and Morishima, M. (2003). ‘The nature, scope and effects of profit sharing in Japan:
Evidence from new survey data’. The International Journal of Human Resource
Management, 14(6): 942-955.
Kim, S. (1998). ‘Does profit sharing increase firm profits?’ Journal of Labor Research, 19(2):
351–370.
27
Kruse, D.L. (1993). Profit Sharing: Does It Make a Difference? Kalamazoo, MI: W.E. Upjohn
Institute.
Kruse, D.L. (1996). ‘Why do firms adopt profit-sharing and employee ownership plans?’ British
Journal of Industrial Relations, 34: 515–538.
Kruse, D.L., Freeman, R.B., and Blasi, J.R. (2010). ‘Do workers gain by sharing: Employee
outcomes under employee ownership, profit sharing, and broad-based stock options?’ In
D.L. Kruse, R.B. Freeman, and J.R. Blasi (eds.), Shared Capitalism at Work: Employee
Ownership, Profit and Gain Sharing, and Broad-Based Stock Options. Chicago:
University of Chicago Press, pp. 257-290.
Lawler, E.E. (1992). The Ultimate Advantage: Creating the High-Involvement Organization.
San Francisco: Jossey Bass.
Lazear, E.P. (2000). ‘Performance pay and productivity’. American Economic Review, 90:
1346–1361.
Long, R.J. (1989). ‘Patterns of workplace innovation in Canada’. Relations
Industrielles/Industrial Relations, 44(4): 805–826.
Long, R.J. (1992). ‘The incidence and nature of employee profit sharing and stock ownership
in Canada’. Relations Industrielles/Industrial Relations, 47(3): 463–488.
Long, R.J. (1997). ‘Motives for profit sharing: A study of Canadian chief executive officers’.
Relations Industrielles/Industrial Relations, 52(4) : 712–733.
Long, R.J. (2002). ‘Performance pay in Canada’. In M. Brown and J. S. Heywood (eds.) Paying
for Performance: An International Comparison. Armonk, NY: M. E. Sharpe, pp. 52–89.
Long, R.J. and Fang, T. (2012). ‘Do employees profit from profit sharing? Evidence from
Canadian panel data’. Industrial and Labor Relations Review, 65(4): 899-927.
28
Long, R.J. and Fang, T. (2014). ‘Do strategic factors affect adoption of profit sharing?
Longitudinal evidence from Canada’. International Journal of Human Resource
Management, forthcoming.
Long, R.J. and Shields, J.L. (2005). ‘Performance pay in Canadian and Australian Firms: A
comparative study’. The International Journal of Human Resource Management, 16(10):
1783–1811.
Magnan, M. and St-Onge, S. (2005). ‘The impact of profit sharing on the performance of
financial services firms’. Journal of Management Studies, 42(4): 761–791.
MacDuffie, J.P. (1995). ‘Human-resource bundles and manufacturing performance—
organizational logic and flexible production systems in the world auto industry’.
Industrial and Labor Relations Review, 48(2): 197–221.
Mitchell, D.J.B., Lewin, D., and Lawler, E.E. (1990). ‘Alternative pay systems, firm
performance, and productivity’. In A. S. Blinder (ed.) Paying for Productivity: A Look at
the Evidence. Washington, DC: The Brookings Institution, pp. 15–94.
Mohr, R.D. and Zoghi, C. (2008). ‘High-involvement work design and job
satisfaction’. Industrial and Labor Relations Review, 61(3): 275-296.
Ng, I. and Maki, D. (1994). ‘Trade-union influence on human resource management practices’.
Industrial Relations, 33(1): 121–135.
Olson, M. (1971). The Logic of Collective Action. Cambridge: Harvard University Press.
Osterman, P. (2000). ‘Work reorganization in an era of restructuring: Trends in diffusion and
effects on employee welfare’. Industrial and Labor Relations Review, 53(2): 179-196.
29
Parent, D. (2002). ‘Performance pay in the United States: Its eterminants and effects’. In M.
Brown and J.S. Heywood (eds.) Paying for Performance: An International Comparison.
Armonk, NY: M. E. Sharpe, pp. 17–51.
Pendleton, A. (1997). ‘Characteristics of workplaces with financial participation: Evidence from
the Workplace Industrial Relations Survey’. Industrial Relations Journal, 28(2): 103-
119.
Poole, M. (1989). The origins of economic democracy: Profit-sharing and employee-
shareholding schemes. London: Routledge.
Prendergast, C. (1999). ‘The provision of incentives in firms’. Journal of Economic Literature,
37(1): 7-63.
Robinson, A.M. and Wilson, N. (2006). ‘Employee financial participation and productivity: An
empirical reappraisal’. British Journal of Industrial Relations, 44(1): 31–50.
Statistics Canada. (2004). Workplace and Employee Survey Compendium: 2001. Ottawa:
Statistics Canada.
Statistics Canada. (2006). Guide to the Analysis of the Workplace and Employee Survey: 2003.
Ottawa: Statistics Canada.
Wagar, T.H. and Long, R.J. (1995). ‘Profit sharing in Canada: Incidence and predictors,’
Proceedings of the Administrative Sciences Association of Canada (Human Resources
Division), 16: 97–105.
Weitzman, M.L. and Kruse, D.L. (1990). ‘Profit sharing and productivity.” In Alan S. Blinder
(ed.) Paying for Productivity: A Look at the Evidence. Washington, DC: The Brookings
Institution, pp. 95-142.
30
Wright, P.M., Gardner, T.M, Moynihan, L.M, Park, H.J., Gerhart, B., and Delery, J.E. (2001).
‘Measurement error in research on human resources and firm performance: Additional
data and suggestions for future research’. Personnel Psychology, 54(4): 875–901.
Zatzick, C.D. and Iverson, R.D. (2006). ‘High involvement management and workforce
reduction: Competitive advantage or disadvantage?’ Academy of Management Journal,
49(5): 999–1015.
Zylberstajn, H. (2002). ‘The Brazilian case: Performance pay as workers’ right’. In M. Brown
and J.S. Heywood (eds.), Paying for Performance: An International Comparison.
Armonk, NY: M. E. Sharpe, pp. 236-260.
31
Table 1.
Means, Standard Deviations, and Correlationsa
Notes: an = 1,717. *p<.10; **p<.05; ***p<.01; two tailed tests.
Variable Mean s.d. 1 2 3 4 5 7 8 9 10
1. Profit Sharing Adoption .14 .35 -
2. Team Work .07 0.21 .12*** -
3. Union Density .22 .35 -.10*** .09*** -
4. Establishment Size (00’s of emps.) .45 .13 .03 .11** .12*** -
5. Cash Emp. Earnings 2001 ($000’s) 40.58 22.53 .11*** -.03 .03 .03 -
7. Individual Incentives .44 .50 .20*** .15*** -.06*** .05** .08*** -
8. Merit Pay .31 .46 .08*** .04* -.02 .08*** -.01 .36*** -
9. Gain Sharing .20 .40 .17*** .15*** .03 .03 .01 .33*** .10*** -
10. Employee Stock Plan .11 .32 .09*** .18*** .11*** .09*** .01 .29*** .31*** .21*** -
11. Productivity Growth 2001-04 .17 .91 .01 .02 -.07** .00 -.08** .00 .09** .04 .08**
12. Productivity Growth 2001-06 .20 .83 .06** .06** -.07** .02 -.09** .08** .12** -.00 .19**
32
Table 2 Multiple Regressions Predicting Employee Productivity Growtha
Notes: *p<.10; **p<.05; ***p<.01; two tailed tests.
aOLS specification (unstandardized regression coefficients) are used. Standard errors in brackets.
Variable Labour Productivity Growth
2001-2004 2001-2006 Constant .174 (.123) .199* (.120) Industry Controls Resources 1.075** (.506) .853* (.504) Labor-Intensive Mfg. .138 (.191) -.016 (.126) Primary Product Mfg. .144 (.111) .119 (.134) Secondary Product Mfg. -.041 (.098) .011 (.116) Capital-Intensive Mfg. .020 (.122) -.063 (.126) Construction -.029 (.097) .035 (.114) Transport/Wholesaling .377 (.300) .283 (.217) Communications/Utilities .462** (.229) .613** (.303) Finance/Insurance -.027 (.123) -.171 (.184) Real Estate .145 (.104) .082 (.150) Business Services .127 (.154) .039 (.146) Education/ Health Services -.216** (.097) -.130 (.106) Info/Cultural Services .684 (.546) .627 (.503) Performance Pay Controls Individual Incentives -.054 (.126) 0.036 (.097) Merit Pay -.120 (.083) -.069 (.084) Gain Sharing .170 (.212) .117 (0.134) Employee Stock Plan .191 (.169) .442** (.206) Establishment Controls Team -.007 (.210) -.063 (.120) Union Density -.177 (.115) -.187* (.108) Establishment Size (00’s) -.0001 (.0001) -.00002 (.00012) Employee Earnings 2001 ($000’s) -.000003 (.000002) -.000003 (.000002) Profit Sharing Adoption .050 (.086) .098 (.100) Cases 1690 1540 R2 .080*** 0.110***
33
Table 3 Multiple Regressions Predicting Employee Productivity Growtha
Including Interaction Terms
Notes: *p<.10; **p<.05; ***p<.01; two tailed tests.
aOLS specification (unstandardized regression coefficients) are used. Standard errors in brackets.
Variable Labour Productivity Growth
2001-2004 2001-2006 Constant .161 (.135) .160 (.128) Industry Controls Resources 1.057** (.505) .835* (.487) Labor-Intensive Mfg. .152 (.187) .004 (.121) Primary Product Mfg. .164 (0.114) .145 (.133) Secondary Product Mfg. -.017 (.094) .030 (.112) Capital-Intensive Mfg. .005 (.127) -.078 (.129) Construction -.012 (.094) .059 (.113) Transport/Wholesaling .401 (.304) .313 (.218) Communications/Utilities .483** (.228) .641** (.301) Finance/Insurance -.010 (.094) -.135 (.185) Real Estate .147 (.102) .089 (.151) Business Services .152 (.146) .065 (.132) Education/ Health Services -.193** (.092) -.105 (.104) Info/Cultural Services .722 (.545) .659 (.500) Performance Pay Controls Individual Incentives -.068 (.122) .018 (.094) Merit Pay .170 (.210) .123 (.133) Gain Sharing -.109 (.078) -.055 (.080) Employee Stock Plan .200 (.170) .483** (.213) Establishment Controls Team -.227 (.154) -.253 (.213) Union Density -.163 (.116) -.142 (.107) Establishment Size (00’s) -.00002 (.0001) .00002 (.0001) Employee Earnings 2001 ($000’s) -.00001 (.0000) -.00001 (.0000) Profit Sharing Adoption -.041 (.068) -.003 (.088) Interaction Terms PS X Team .854** (0.395) .666* (.371) PS X Union -.031 (0.157) -.392*(217) PS X Size -.0001 (.0002) -.0001 (.0002) PS X Earnings -.0000 (.0000) -.0000 (.0000) Cases 1690 1540 R2 .091*** .122***
34
35
Endnotes 1 It can be observed that the response rate was dropping during the survey period, but we don’t consider this problematic, since most surveys would be delighted to report a 75% response rate. By 2006 many of the workplaces would have been asked to respond to the same survey for seven consecutive years, so it is likely that some survey fatigue was setting in. 2 One potential concern with measurement of the independent variable, profit sharing adoption, is that the different surveys may be answered by different people over time, who might construe profit sharing differently—with some respondents failing to report profit sharing when it does exist, and others reporting it when it doesn’t truly exist. While this concern is always present in panel data, we feel that the definition of profit sharing in the survey is quite clear, and since data were collected through telephone interviews, it was possible for the respondent to clarify the meaning of profit sharing. We also eliminated cases where profit sharing was reported in 2001, but seemed to disappear in subsequent surveys. So, a firm was counted as having profit sharing only if it reported profit sharing in 2001, 2004, and 2006. We also eliminated firms that did not report profit sharing in 2001, but did report it in one of the subsequent surveys. The main reason for eliminating these cases is that we wanted to a have a “clean” sample of establishments that either did or did not have profit sharing for the entire period 2001-2006, but this policy may also have served to reduce response inconsistency. 3 We considered using a fixed effects model for our regression analysis, but because of our research design and relatively short panels of data that we use, we believe that OLS may be the more appropriate estimator. We believe that use of a fixed effects model under short data panels could generate imprecise estimates for our large number of establishment dummy variables, which could, in turn, affect the precision of our other coefficient estimates.