Embed Size (px)
Citation preview
INTRODUCTION Population aging has emerged as a major demographic trend worldwide due to improved health and longevity.
Research Paper This global aging phenomenon will have a major impact on health-care systems worldwide due to increased morbidity and greater needs for hospitalization/institu-
www.impactaging.com AGING, January 2014, Vol. 6, No 1
Serum profiling of healthy aging identifies phospho‐ and sphingolipid species as markers of human longevity Ivan Montoliu1, Max Scherer2, Fiona Beguelin2, Laeticia DaSilva2, Daniela Mari3,4, Stefano Salvioli5,6 ,François‐Pierre J. Martin2, Miriam Capri5,6, Laura Bucci5,6,Rita Ostan5,6,Paolo Garagnani5,6, Daniela Monti7, Elena Biagi8, Patrizia Brigidi8, Martin Kussmann2,9,10, Serge Rezzi2, Claudio Franceschi5,6, and Sebastiano Collino2 1NESTEC SA, Nestlé Research Center, Vers‐chez‐les‐Blanc, CH‐1000 Lausanne 26, Switzerland; 2Nestlé Institute of Health Sciences SA, Campus EPFL, Molecular Biomarkers Core, Quartier de l'innovation, CH‐1015 Lausanne, Switzerland; 3Department of Medical Sciences, University of Milan, Milan, Italy; 4Geriatric Unit IRCCS Ca' Grande Foundation Maggiore Policlinico Hospital, Milan, Italy; 5Department of Experimental, Diagnostic and Specialty Medicine Experimental Pathology, University of Bologna, Via S. Giacomo 12, 40126 Bologna, Italy; 6Interdepartmental Centre “L. Galvani” CIG, University of Bologna, Piazza di Porta S. Donato 1, 40126 Bologna, Italy; 7Department of Clinical, Experimental and Biomedical Sciences, University of Florence, Viale Morgagni 50, 50134 Florence, Italy; 8Department of Pharmaceutical Sciences, University of Bologna, Via Belmeloro 6, 40126 Bologna, Italy; 9Faculty of Life Sciences, Ecole Polytechnique Fédérale Lausanne (EPFL), Lausanne, Switzerland; 10Faculty of Science, Interdisciplinary NanoScience Center (iNANO), Aarhus University, Aarhus, Denmark; Key words: Healthy Aging, metabolomics, lipidomics, biomarkers, inflammageing Received: 12/5/13; Accepted: 1/19/14; Published: 1/21/14 Correspondence to: Sebastiano Collino, PhD; E‐mail: [email protected] Copyright: © Montoliu et al. This is an open‐access article distributed under the terms of the Creative Commons Attribution License, which permits unrestricted use, distribution, and reproduction in any medium, provided the original author and source are credited Abstract: As centenarians well represent the model of healthy aging, there are many important implications in revealing theunderlying molecular mechanisms behind such successful aging. By combining NMR metabonomics and shot‐gun lipidomics inserum we analyzed metabolome and lipidome composition of a group of centenarians with respect to elderly individuals.Specifically, NMR metabonomics profiling of serum revealed that centenarians are characterized by a metabolic phenotypedistinct from that of elderly subjects, in particular regarding amino acids and lipid species. Shot‐ gun lipidomics approachdisplays unique changes in lipids biosynthesis in centenarians, with 41 differently abundant lipid species with respect toelderly subjects. These findings reveal phospho/sphingolipids as putative markers and biological modulators of healthy aging,in humans. Considering the particular actions of these metabolites, these data are suggestive of a better counteractiveantioxidant capacity and a well‐developed membrane lipid remodelling process in the healthy aging phenotype.
www.impactaging.com 9 AGING, January 2014, Vol. 6 No.1
tionalization. As the life expectancy of population increases worldwide, there is an increasing awareness of the importance of “healthy aging” and “quality of life”. Aging is a very complex process since several alterations of biochemical processes occur during the entire course of life, affecting all levels, from organs to cells. Indeed, aging appears to be characterized by chronic, low-grade systemic inflammation, a condition indicated as inflammaging [1-2], that is believed to contribute to the onset and progression of the major age-related diseases, also including frailty [3-5] and for the most of deaths in elderly. However, this process is not completely understood. In particular, centenarians display signs of inflammaging but at the same time seem to be spared from its deleterious consequences. It is hypothesized that this apparent paradox is explained by the fact that they possess a complex and peculiar balancing between pro-inflammatory and anti-inflammatory factors, resulting in a slower, more limited and balanced development of inflammaging, in comparison with old subjects, who are characterized by either faster or inadequately counteracted inflammatory responses [6]. A large amount of data indicates that inflammation is strictly connected to oxidative stress. Both inflammation and oxidative stress can deeply affect a number of metabolic processes and therefore is to be expected that many differences exist on metabolome of centenarians that can be helpful in shedding light on the mechanisms of successful aging. Systems-level omics technologies are emerging as a valuable approach to comprehensively investigate changes in metabolic regulations, and then linking these to the phenotypic outcome [7-9]. Metabolomics, the quantitative profile of endogenous and exogenous small molecules present in biological systems, had successfully been applied to study the modulation of the aging processes following nutritional interventions, including caloric restriction in mouse [10], dogs [11], and non-human primates [12]. In order to better elucidate molecular mechanisms that involve the disruption of lipid metabolic pathways, the field of lipidomics is also being rapidly emerging. Lipidomics can be achieved by a comprehensive measurement of the lipidome, i.e. the complete set of biological lipids, from a single analysis in a non-targeted profiling way (shotgun approach) [13]. An investigation on specific lipids associated with familial longevity in females was explored in the plasma lipidome by comparing lipid species in offspring of nonagenarian vs. elderly controls from the Leiden Longevity Study [14], starting from the assumption that a heritable component of the lipidome profile typical of longevity should exist. In fact, this study identified in women but not in men nineteen lipid species that resulted significantly different in nonagenarian offspring and age-matched controls, with
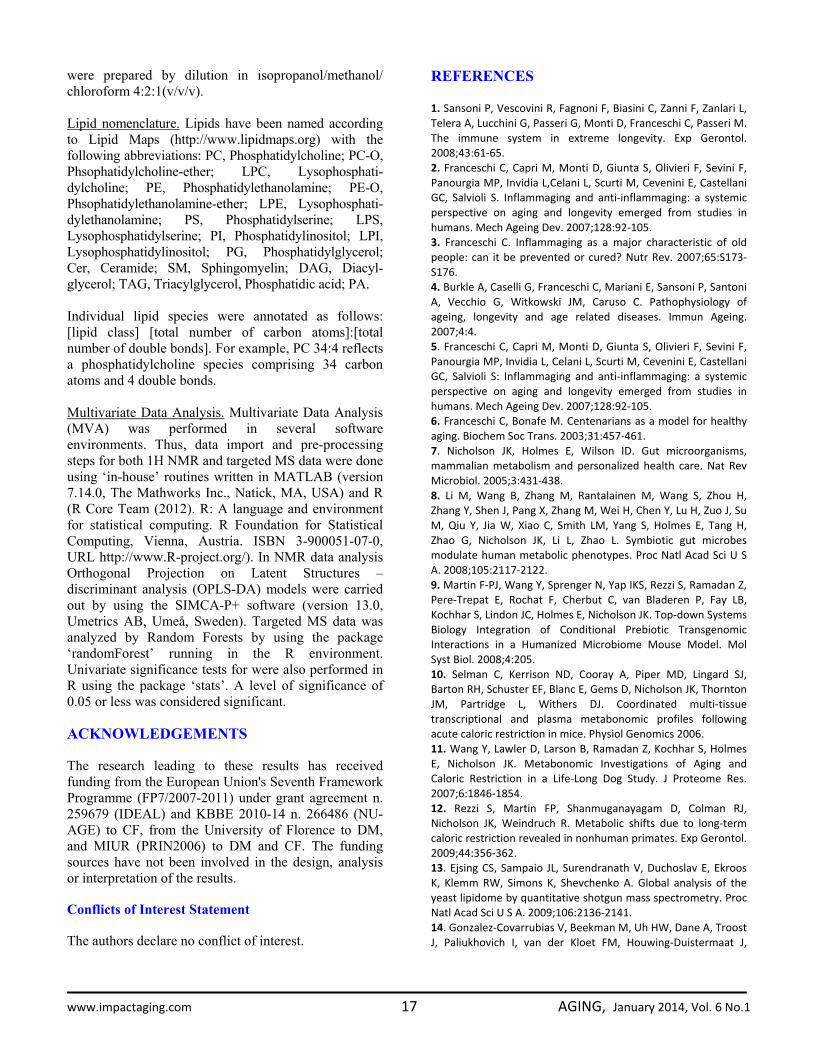
ether phosphocholines and sphingomyeline species identified as putative longevity markers. Nevertheless in this study there are no data on subjects who reached extreme longevity, such as centenarians (mean age of the subjects was around 60 years), and the possibility exists that the differences observed were due to an altered health status, as an association of some of these markers with hypertension and Type 2 Diabetes was reported. We originally exploited a different experimental model that included centenarians, a recognized model of successful aging [1,2,15], as well as old people and younger controls to unveil the metabolic phenotype of aging and longevity, and we observed that centenarians possess a unique metabolic phenotype characterized by differential eicosanoids network and higher concentrations of bacterial metabolism by-products [15]. In the present study, we went further by investigating metabolomics, and specific lipidomics changes in blood serum of centenarian’ subjects, to identify candidate metabolic signatures of healthy aging. Centenarians were on average aged 101 years, ±2, while the group of elderly individuals was on average aged 70 years±6. All subjects were recruited in Northern Italy. RESULTS Serum 1H-NMR profiles display amino acids and lipid metabolism as metabolic signatures of longevity For NMR metabolomics we focused on analysis of CPMG spectral data rather than standard 1D 1H-NMR spectroscopic data, in order to characterize the differences in signals from low molecular weight metabolites that may be overlapped by broad signals from proteins and lipoproteins. 600 MHz 1H-NMR Carr−Purcell−Meiboom−Gill sequence (CPMG) metabolic profiling of serum samples was performed on 98 centenarians and 196 elderly (Table 1) to specifically reveal low molecular weight metabolites. To explore age- induced changes and metabolic differences among the two age groups and minimize any effects of non-relevant metabolite variability, supervised chemometric analysis of the serum NMR profiling was applied on the full resolution NMR data set. Orthogonal Projection on Latent Structures – Discriminant Analysis (OPLS-DA) was carried out on unit variance scaled data. As previously published [15] the discriminant model between centenarians and elderly group provided a validation error of the classifier (expressed as area under the ROC curve, AuROC) of 0.99 by using a 15.4% of the spectral variance (R2X) (Table S1). A clear separation was achieved between the 1H-NMR
www.impactaging.com 10 AGING, January 2014, Vol. 6 No.1
spectra of the elderly and from centenarians (Figure S1A-S1B), indicating that long-lived subjects are characterized by a separate metabolic phenotype. To determine the metabolic signatures associated to the differences between age groups, loadings of the first predictive component of the OPLS-DA model were used, color coded according to the correlation coefficient of the variable [16] (Fig. S1). Here, the colors projected onto the coefficient plot indicate the correlation of the intensities of the peaks from the metabolites discriminating centenarians from the corresponding elderly. Accordingly, the serum discriminant model display in centenarians relatively
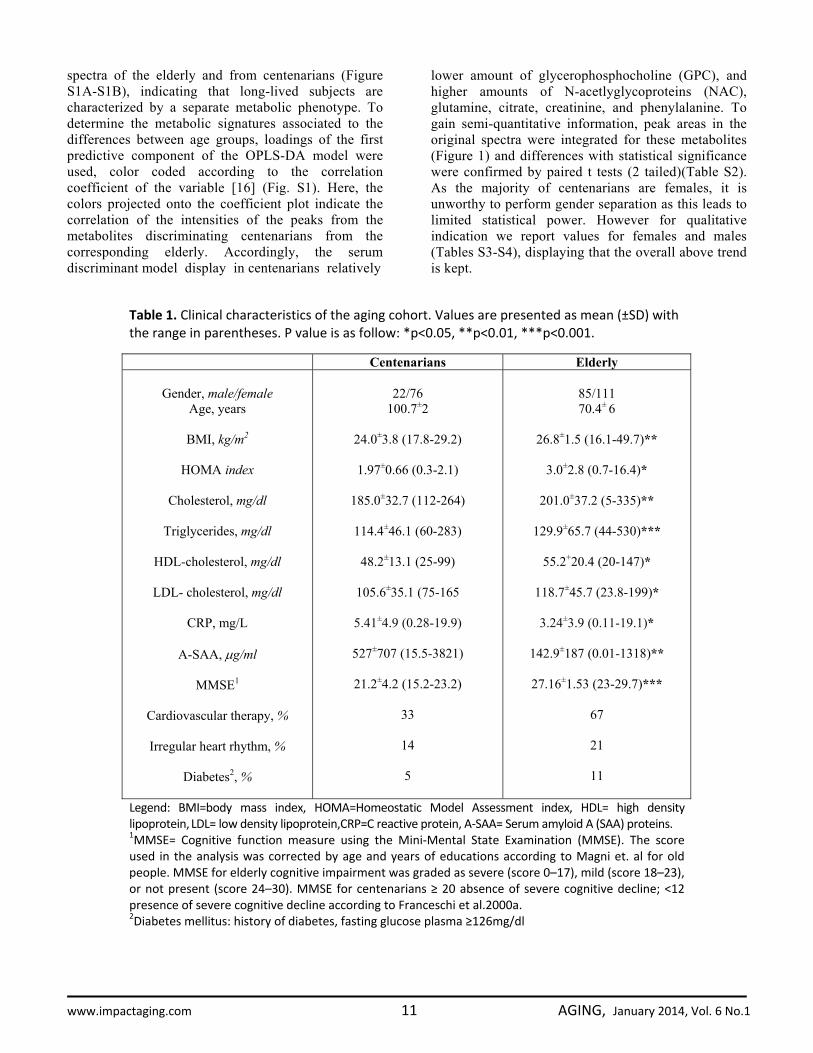
lower amount of glycerophosphocholine (GPC), and higher amounts of N-acetlyglycoproteins (NAC), glutamine, citrate, creatinine, and phenylalanine. To gain semi-quantitative information, peak areas in the original spectra were integrated for these metabolites (Figure 1) and differences with statistical significance were confirmed by paired t tests (2 tailed)(Table S2). As the majority of centenarians are females, it is unworthy to perform gender separation as this leads to limited statistical power. However for qualitative indication we report values for females and males (Tables S3-S4), displaying that the overall above trend is kept.
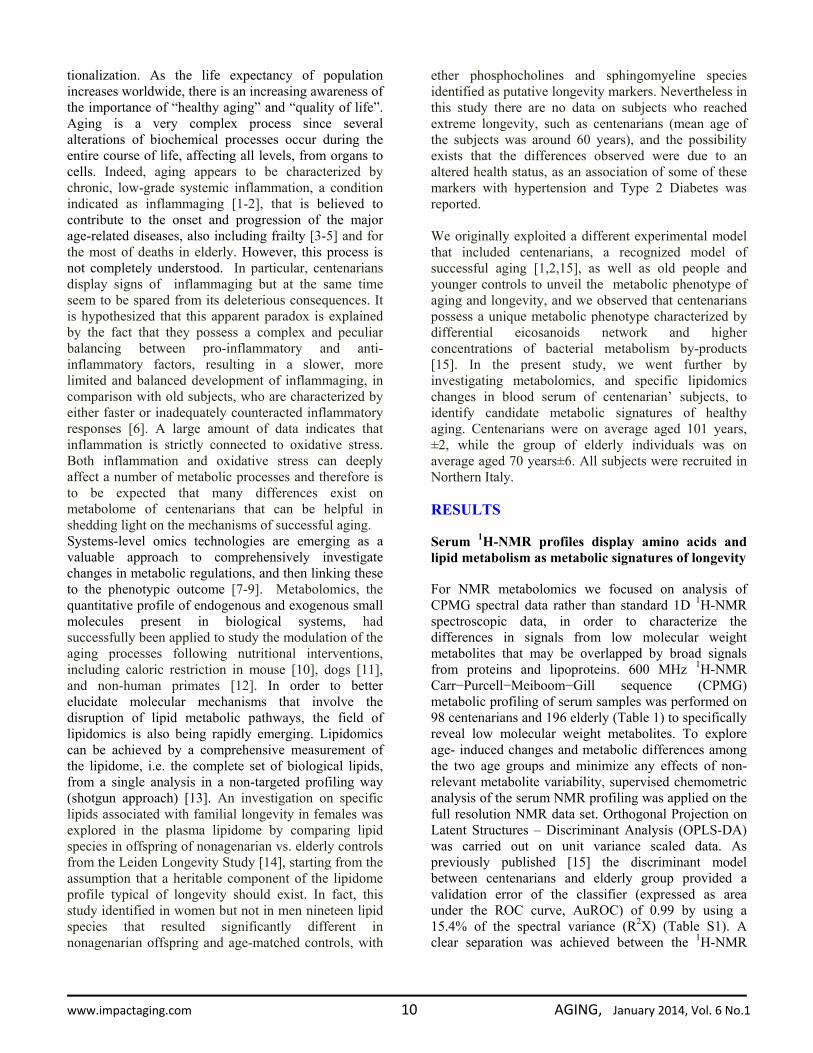
Table 1. Clinical characteristics of the aging cohort. Values are presented as mean (±SD) with the range in parentheses. P value is as follow: *p<0.05, **p<0.01, ***p<0.001.
Centenarians Elderly
Gender, male/female Age, years
BMI, kg/m2
HOMA index
Cholesterol, mg/dl
Triglycerides, mg/dl
HDL-cholesterol, mg/dl
LDL- cholesterol, mg/dl
CRP, mg/L
A-SAA, μg/ml
MMSE1
Cardiovascular therapy, %
Irregular heart rhythm, %
Diabetes2, %
22/76
100.7±2
24.0±3.8 (17.8-29.2)
1.97±0.66 (0.3-2.1)
185.0±32.7 (112-264)
114.4±46.1 (60-283)
48.2±13.1 (25-99)
105.6±35.1 (75-165
5.41±4.9 (0.28-19.9)
527±707 (15.5-3821)
21.2±4.2 (15.2-23.2)
33
14
5
85/111 70.4± 6
26.8±1.5 (16.1-49.7)**
3.0±2.8 (0.7-16.4)*
201.0±37.2 (5-335)**
129.9±65.7 (44-530)***
55.2+20.4 (20-147)*
118.7±45.7 (23.8-199)*
3.24±3.9 (0.11-19.1)*
142.9±187 (0.01-1318)**
27.16±1.53 (23-29.7)***
67
21
11
Legend: BMI=body mass index, HOMA=Homeostatic Model Assessment index, HDL= high density lipoprotein, LDL= low density lipoprotein,CRP=C reactive protein, A‐SAA= Serum amyloid A (SAA) proteins. 1MMSE= Cognitive function measure using the Mini‐Mental State Examination (MMSE). The score used in the analysis was corrected by age and years of educations according to Magni et. al for old people. MMSE for elderly cognitive impairment was graded as severe (score 0–17), mild (score 18–23), or not present (score 24–30). MMSE for centenarians ≥ 20 absence of severe cognitive decline; <12 presence of severe cognitive decline according to Franceschi et al.2000a. 2Diabetes mellitus: history of diabetes, fasting glucose plasma ≥126mg/dl
www.impactaging.com 11 AGING, January 2014, Vol. 6 No.1
Shot-gun lipidomics identify markers of longevity in serum A MS/MS shot gun lipidomics approach was applied on serum samples from 15 centenarians and 37 elderly. Multivariate data analysis was performed using Random Forests (RF™) [15] on quantitative data from thirteen different lipid classes: triacylglycerol TG (n=30), sphin-
gomyelin SM (n=25), lysophosphatidylcholine LPC (n=7), phosphatidylcholine PC (n=34), ether phosphatidylcholine PC-O (n=19), ceramides Cer (n=6), phosphatidylethanolamine PE (n=14), phosphati-dylethanolamine based ether PE-O (n=9), lyso-phosphatidylethanolamine LPE (n=3), phosphati-dylinositol PI (n=7), phosphatidic acid PA (n=1), diacylglycerol DAG (n=19). Using the variable
Figure 1.Bar plots representing differences in serum markers of longevity as per 1H‐NMR.All significantly regulated metabolites and statistical changes are listed in Table S2.
www.impactaging.com 12 AGING, January 2014, Vol. 6 No.1
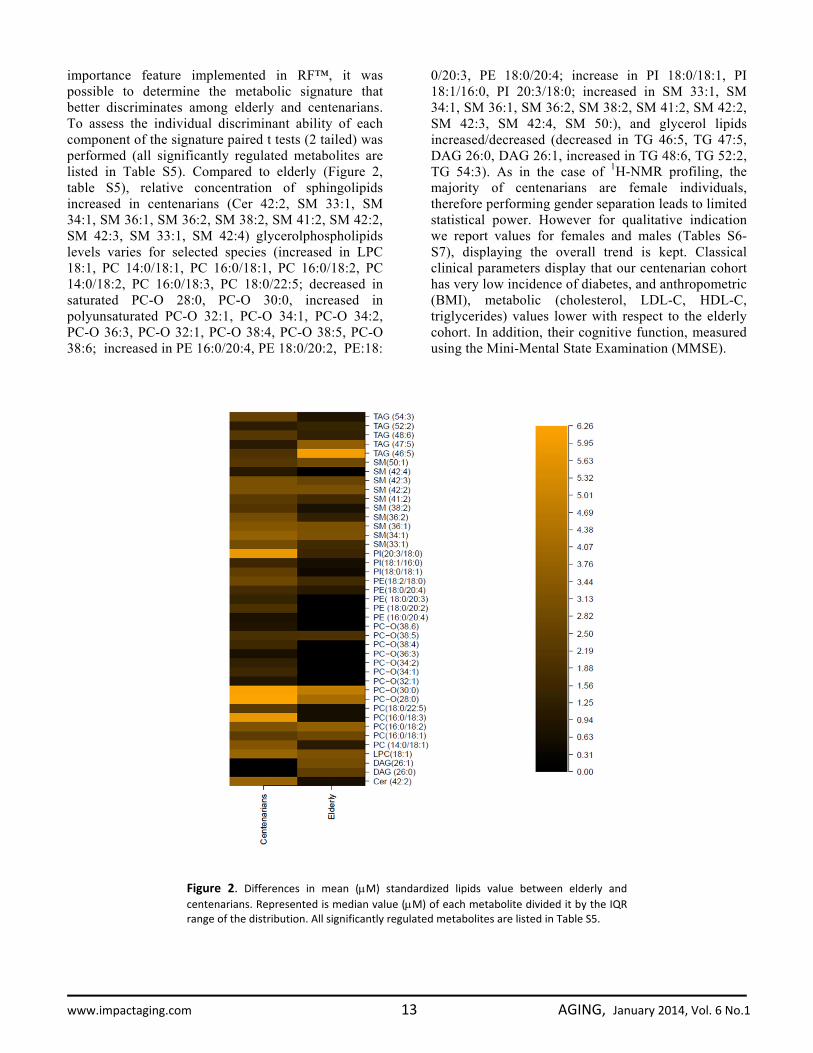
importance feature implemented in RF™, it was possible to determine the metabolic signature that better discriminates among elderly and centenarians. To assess the individual discriminant ability of each component of the signature paired t tests (2 tailed) was performed (all significantly regulated metabolites are listed in Table S5). Compared to elderly (Figure 2, table S5), relative concentration of sphingolipids increased in centenarians (Cer 42:2, SM 33:1, SM 34:1, SM 36:1, SM 36:2, SM 38:2, SM 41:2, SM 42:2, SM 42:3, SM 33:1, SM 42:4) glycerolphospholipids levels varies for selected species (increased in LPC 18:1, PC 14:0/18:1, PC 16:0/18:1, PC 16:0/18:2, PC 14:0/18:2, PC 16:0/18:3, PC 18:0/22:5; decreased in saturated PC-O 28:0, PC-O 30:0, increased in polyunsaturated PC-O 32:1, PC-O 34:1, PC-O 34:2, PC-O 36:3, PC-O 32:1, PC-O 38:4, PC-O 38:5, PC-O 38:6; increased in PE 16:0/20:4, PE 18:0/20:2, PE:18:
0/20:3, PE 18:0/20:4; increase in PI 18:0/18:1, PI 18:1/16:0, PI 20:3/18:0; increased in SM 33:1, SM 34:1, SM 36:1, SM 36:2, SM 38:2, SM 41:2, SM 42:2, SM 42:3, SM 42:4, SM 50:), and glycerol lipids increased/decreased (decreased in TG 46:5, TG 47:5, DAG 26:0, DAG 26:1, increased in TG 48:6, TG 52:2, TG 54:3). As in the case of 1H-NMR profiling, the majority of centenarians are female individuals, therefore performing gender separation leads to limited statistical power. However for qualitative indication we report values for females and males (Tables S6-S7), displaying the overall trend is kept. Classical clinical parameters display that our centenarian cohort has very low incidence of diabetes, and anthropometric (BMI), metabolic (cholesterol, LDL-C, HDL-C, triglycerides) values lower with respect to the elderly cohort. In addition, their cognitive function, measured using the Mini-Mental State Examination (MMSE).
Figure 2. Differences in mean (μM) standardized lipids value between elderly andcentenarians. Represented is median value (μM) of each metabolite divided it by the IQRrange of the distribution. All significantly regulated metabolites are listed in Table S5.
www.impactaging.com 13 AGING, January 2014, Vol. 6 No.1
DISCUSSION In the present study we have expanded our previous investigation on metabolic signatures of longevity by integrating a system biology approach in serum on a representative North Italian cohort of aged subjects, compromising elderly and centenarians. Data on centenarians in particular are of interest, as they are considered the best example of successful aging having reached the very extremes of the human lifespan. It is worth noting that the metabolic signatures described in this paper reflect mostly female individuals, as male centenarians are much more rare than female ones, and in particular in the north of Italy the male/female ratio is about 1:7 [17]. Therefore, our findings will be compared and further validated in much bigger cohorts to provide future predictive utility. Metabolomics data display changes in amino acid metabolism with higher phenylalanine (Phe) concentrations in longevity. Phe is converted to tyrosine by the catalysis of phenylalanine hydroxylase [18]. It exhibits anti-inflammatory properties and it is often use to treat arthritis and Parkinson's disease [19]. We also noted an increase in glutamine in centenarians, which directly crosses the blood-brain barrier. This amino acid operates as a nitrogen shuttle, taking up excess ammonia and forming urea, therefore reducing toxic build up in the brain and improving brain functions [20-23]. Studies have also demonstrated that glutamine may play an important role on NF-κB signal transduction pathways, contributing to the attenuation of local inflammation [24]. The tricarboxylic acid (TCA) intermediate citrate, which may also play a role in amino acid and fatty acid metabolism, is also elevated in centenarians, relative to elderly. Interestingly, elevated plasma citrate levels inhibit phospho-fructokinase, a regulatory enzyme in glycolysis, and glycolytic inhibitors such as 2-deoxyglucose have been put forward as viable dietary restriction (DR) mimetics [25]. Previous data on centenarians displayed high circulating levels of proinflammatory molecules [26]. Our NMR data display increase concentration of N-acetyl resonance of glycoproteins (NAC) [27], which are predominantly synthesized in liver parenchymal cells in response to cytokines [28]. Not surprisingly, serum creatinine concentration increased steadily with age [29], which is mainly produced by the metabolism of creatine in the muscle. Our metabolomics data also demonstrated decreased levels of the membrane metabolites glycerophosphorylcholine (GPC), in centenarians. Changes in GPC in longevity are of particular importance as senescent cells showed an increased concentration of this metabolite [30]. Elevated plasma levels of phospholipids and TMA were
shown to be both risk factors for cardiovascular disease in humans [31;32]. Choline is also involved in synthesizing sphingomyelin and phosphatidylcholine, which are precursors for diacylglycerols and ceramides. In order to better assess changes in lipid metabolism we deployed a shot-gun lipidomics approach. We observed that centenarians display an overall increase in SM, which are important cellular messengers, with their low level associated to neurodegenerative diseases [33], atherosclerosis [34], and cardiovascular disease [35]. Among the ten SM whose levels are higher in centenarians, three species are of particular interest; SM 41:2, SM 36:2, SM 34:1. These have previously been suggested to represent lipidomic signatures of familial longevity in females [14]. SM can be converted to ceramides by the enzymatic activities of sphingo-myelinases (SMases). It was suggested that SMases activity increase with age [36], therefore increasing ceramide contents, with their accumulation negatively effecting pro-inflammatory pathologies [37;38]. In atherogenesis, for example, ceramide accumulation is linked to aggregation of LDL, increased ROS, and promotion of foam cell formations [39]. Our data reflect that among the six measured ceramide only one (Cer 42:2) increases. An imbalance between the production of oxidants and protective antioxidant systems in favour of an excessive accumulation of reactive oxygen species (ROS) may cause cellular oxidative damage to nucleic acids and proteins in cells of several systems including the endocrine [40] and the immune [41]. Better antioxidant capacity/handling is confirmed by overall increase in centenarians of plasmalogen (PC-O) species, able to prevent oxidation of lipoproteins and cardioprotective [42]. Our study confirms increase of two ether phospholipids, PC-O 36:6 and PC-O 34:1, whose concentration was found to change in familial longevity [14], and one ether PC-O 32:1, previously determined in different elderly individuals, as metabolic marker of healthy aging [15]. Interestingly, conservation of membrane composition/integrity is also confirmed by the joined increase in phosphatidylcholine (PC), major components of cell membranes and phosphate-dylethanolamine (PE), a key modulator of inflammatory reaction in centenarians. Previously it was demonstrated that PC/PE ratio (i.e., increase of PC/decrease of PE and vice versa) is a critical modulator of membrane integrity [43]. Changes in the phospholipids distribution influence membrane protein function, modifying the permeability of solutes across the membrane [44] through changes in the fluidity of the bi-layer. Measurement of the fatty acid composition of human erythrocyte membrane lipids has shown that centenarians have a reduced susceptibility to peroxidative membrane damage, while higher membrane fluidity compared with all the other age
www.impactaging.com 14 AGING, January 2014, Vol. 6 No.1
groups [45]. In particular, the increase in PE is interesting as it was previously postulated that highly polyunsaturated PE can carry pro-inflammatory molecules such as the arachidonic acid lipid network [46]. Another phospholipid, phosphatidylinositol (PI), possesses immunoregulatory capacities [47]. Here we detect an increase in three PI species (PI 18:0/18:1, PI 18:1/16:0, PI 20:3/18:0) in centenarians. In animal tissues, phosphatidylinositol is the primary source of the arachidonic acid required for biosynthesis of eicosanoids, including prostaglandins, via the action of the enzyme phospholipase A2. We have previously displayed that centenarians possess a unique balanced of anti- and pro-inflammatory eicosanoids, therefore we believed that an increase in PE and PI mirrors these findings, displaying that centenarians possess an unique and effective modulation of the arachidonic acid metabolic cascade to counteract their inflammatory status. Longevity is also characterized by decrease concentration of long chain triglycerides (TG 46:5, TG 47:5) and increase concentrations of very long TG chain with a high carbon number (TG 48:6, TG 52:2, TG 54:3). While usually highly unsaturated TG are target to peroxidation and the overall triglycerides family are seen as an adverse risk factor, recent investigations points to specific TG linked to adverse events where lipids of higher carbon number and double bond content were associated with decreased risk [48]. It is clear that these specific lipids in longevity remain to be determined as our centenarians present an overall net balance among increase/decrease TG species compared to elderly individuals. Lastly, we also noted that concentration of diacylglycerols decreases (DAG 26:0, DAG 26:1). DAG can result from the phosphatidic acid pathway, which represents the lipogenesis route in the synthesis of TAG and phospholipids. However intracellular DAGs can also be derived from TAG hydrolysis of lipid droplets, mediated by adipose triglyceride lipase (ATGL), and activation of phospholipase C, which will release DAGs from membrane lipids. Recent evidence support the hypothesis that increases in intracellular diacylglycerol content, due to an imbalance between fatty acid delivery and intracellular fatty acid oxidation and storage, leads to activation of new protein kinase C (PKC) isoforms that in turn inhibit insulin action in liver and skeletal muscle [49]. Although we tried to minimize the dietary influence by controlling time of sampling, it cannot be completely rejected, that some of the metabolism of some nutrient constituents and medications (as it is common for elderly) can affect the blood composition of our putative
markers. Yet, our elderly and centenarian cohort represents a population from a restricted geographic area of Northern Italy and as such can be considered relatively homogeneous regarding lifestyle, dietary habits, and drug intake. In conclusion, in this work we identified, by 1H-NMR metabonomics and shot-gun lipidomics, important metabolic signature in serum of healthy aging in a representative longevity cohort. It is important to denote that this work additionally complement previous investigations on longevity studies, yet specifically studying people who reached extreme longevity (centenarians). The represented changes reflect that longevity is marked by better antioxidant capacity and a well-developed membrane lipid remodelling process able to maintain cell integrity. Moreover, in the light of very recent data indicating glycerophosphocholine as a circulating marker related to cell senescence [30], our data are suggestive of the fact that centenarians are characterised by lower levels of cell senescence with respect to old subjects. As a whole, these data support the hypothesis that from a metabolic point of view centenarians are younger than their chronological age. Future work will be required to more precisely assess the predictive role of our markers in additional cohorts and to determine the effect of nutrition and genetic determinants in shaping healthy aging. METHODS Subjects and study groups. A total of 294 subjects belonging to two age groups were enrolled from four Italian cities (Bologna, Milan, Florence, Parma)(Table 1). The group of centenarians consisted of 98 subjects (mean age 100.7± 2.1 yrs) born in Italy between the years 1900 and 1908. The elderly group includes 196 subjects (mean age 70 ± 6 yrs). The study protocol was approved by the Ethical Committee of Sant’Orsola-Malpighi University Hospital (Bologna, Italy). 1H-NMR profiling was applied on 98 centenarians (average age 100.7, 22 males and 76 females) and 196 elderly (average age 70.4, 85 males and 111 females). Lipidomics was performed on 15 centenarians (average age 100.0, 3 males and 12 females) and 37 elderly (average age 69.7, 16 males and 21 females). Overnight fasting blood samples were obtained in the morning (between 7 and 8 a.m.). Serum was obtained after clotting and centrifugation at 760 g for 20 min at 4°C, and immediately frozen and stored at −80 °C. After obtaining written informed consent, a standard questionnaire was administered by trained physicians and nursing staff to collect demographic and lifestyle data, anthropometric measurements, functional, cognitive and health status, clinical anamnesis. Current
www.impactaging.com 15 AGING, January 2014, Vol. 6 No.1
use of medications follows procedure previously reported [15] protocol. Clinical chemistry. Overnight fasting blood samples were obtained early in the morning. Serum total and HDL cholesterol, triglycerides, CRP, insulin resistance (HOMA-IR) were determined using standard hematology methods. Sample preparation for 1H NMR Spectroscopy. 40 μl serum samples were mixed with 20 μl D2O containing a buffer solution (KH2PO4, final concentration of 0.2 M). After centrifugation, samples were transferred into 1.7 mm diameter NMR tubes by using a syringe. Metabolic profiles were measured on a Bruker Avance III 600 MHz spectrometer at 300 K (Bruker Biospin, Rheinstetten, Germany). A standard Carr-Purcell-Meiboom-Gill (CPMG) spin-echo sequence with water suppression [50] spectra was acquired for each sample measured using a spin-echo loop time (2nτ) of 19.2 ms and a relaxation delay D1 of 2.5 s. For each spectrum 64 FIDs were collected into 98k data points using a spectral width of 30 ppm corresponding to an acquisition time of 2.7 s. Acquired 1H NMR spectra were processed using the Topspin software package (version 2.1; Bruker Biospin, Rheinstetten, Germany) and were referenced to the glucose at δ = 5.23. The peak assignment to specific metabolites was achieved using an internal library of compounds and the literature [51;52] and confirmed by standard two-dimensional NMR spectroscopy (JRES, TOCSY, HSQC, HMBC) on selected samples. For statistical analysis all NMR spectra were converted into 12 K data points over the range of δ 0.4-10.0 and imported into the MATLAB software (version 7.14.0 (R2012a; The MathWorks Inc., Natick, MA) excluding the water residue (water δ=4.67-4.97). The spectra were normalized to the total sum of all intensities within the specified range. Automated sample preparation for shot-gun lipidomics. A 96 samples high throughput, fully automated liquid/liquid extraction method utilizing a Hamilton Microlabstar robot (Hamilton, Bonaduz, Switzerland) was developed in house for lipidomics extraction with minor modifications from previous methods [53]. Briefly, 5µL of serum was used for delipidation. Lipid extraction was perfomed with 700 µL MTBE/MeOH (10/3) containing an internal standard mixture of 5µM TAG 44:1, 0.5µM DAG 24:0, 5µM PC 28:0, 1µM LPC 14:0, 1µM PE 28:0, 0.5µM LPE 14:0, 1µM PS 28:0, 0.5µM LPS 17:1, 1µM PI 32:0, 0.5µM LPI 17:1, 0.5µM PA 28:0, 0.5µM LPA 14:0, 1µM PG 28:0, 0.5µM LPG 14:0, 2µM SM 35:1, 1µM Cer 32:1. Samples were vortexed at 4°C for 1 hour, followed by the addition of 150µL water to induce phase separation. After
centrifugation for 10 min at 5,000g, 500µL of the upper organic phase was transferred into a 96-deepwell-plate (Eppendorf, Hamburg, Germany), sealed with aluminum foil and stored at -20°C until analysis. Prior to MS analysis 10µL of total lipid extract were finally diluted with 90µL of MS running buffer (isopropanol/methanol/chloroform 4:2:1 (v/v/v) containing 7.5mM ammonium acetate). Identification and Quantification of lipid species in plasma. A shotgun lipidomics approach was developed in house based on previously published work [54]. Analysis was carried out on an LTQ Orbitrap Velos MS (Thermo Fisher Scientfic, Reinach, Switzerland) system coupled to a Nanomate nanoinfusion ion source (Advion Bioscience Ltd, Harlow, Essex, UK). For each sample extract, two consecutive injections were realized for negative and positive ionization mode, respectively. Centroided high collisional dissociation (HCD) negative MS/MS were acquired in DDA mode. Each DDA cycle consisted of one MS survey spectra acquired at the target resolution Rm/z400 of 100,000, followed by the acquisition of 20 HCD FT MS/MS spectra at the resolution Rm/z400 of 30,000. One DDA experiment was completed in 25 min. Precursor ions were subjected to MS/MS if their m/z matched the masses of a pre-compiled inclusion list with the accuracy of 5 ppm. For mass accuracy, we used the lock mass option, where each spectrum has been individually corrected for potential mass drifts. In positive ionization mode MS spectra were acquired at the target resolution Rm/z400 of 100,000, no further MS/MS experiments were performed. The lock mass option was enabled using LPA 17:0 (m/z 424.492; negative mode) and d18:1/17:0 Cer (m/z 551.528; positive mode) as reference peaks. Lipid species were identified by LipidXplorer following the available protocol [55]. Data were then exported and further processed by an in-house developed software tool. The routine merged the data sets and generated Excel-output-files containing the normalized values (Internal standard to analyte ratio) and absolute concentrations by comparing the abundances of precursor ions of analyte and internal standard spiked prior to extraction. Chemicals and lipid standards. Ethanol, chloroform and iso-Propanol (HPLC grade) were purchased from Biosolve (Valkenswaard, the Netherlands). Methanol, water and Ammoniumacetate were obtained from Merck (Darmstadt, Germany). Synthetic lipid standards were purchased from Avanti Polar Lipids with purities higher than 99 %. Stock-solutions of individual lipid compounds were prepared in methanol and stored at -20°C. Working solutions of the desired concentration
www.impactaging.com 16 AGING, January 2014, Vol. 6 No.1
were prepared by dilution in isopropanol/methanol/ chloroform 4:2:1(v/v/v). Lipid nomenclature. Lipids have been named according to Lipid Maps (http://www.lipidmaps.org) with the following abbreviations: PC, Phosphatidylcholine; PC-O, Phsophatidylcholine-ether; LPC, Lysophosphati-dylcholine; PE, Phosphatidylethanolamine; PE-O, Phsophatidylethanolamine-ether; LPE, Lysophosphati-dylethanolamine; PS, Phosphatidylserine; LPS, Lysophosphatidylserine; PI, Phosphatidylinositol; LPI, Lysophosphatidylinositol; PG, Phosphatidylglycerol; Cer, Ceramide; SM, Sphingomyelin; DAG, Diacyl-glycerol; TAG, Triacylglycerol, Phosphatidic acid; PA. Individual lipid species were annotated as follows: [lipid class] [total number of carbon atoms]:[total number of double bonds]. For example, PC 34:4 reflects a phosphatidylcholine species comprising 34 carbon atoms and 4 double bonds. Multivariate Data Analysis. Multivariate Data Analysis (MVA) was performed in several software environments. Thus, data import and pre-processing steps for both 1H NMR and targeted MS data were done using ‘in-house’ routines written in MATLAB (version 7.14.0, The Mathworks Inc., Natick, MA, USA) and R (R Core Team (2012). R: A language and environment for statistical computing. R Foundation for Statistical Computing, Vienna, Austria. ISBN 3-900051-07-0, URL http://www.R-project.org/). In NMR data analysis Orthogonal Projection on Latent Structures – discriminant analysis (OPLS-DA) models were carried out by using the SIMCA-P+ software (version 13.0, Umetrics AB, Umeå, Sweden). Targeted MS data was analyzed by Random Forests by using the package ‘randomForest’ running in the R environment. Univariate significance tests for were also performed in R using the package ‘stats’. A level of significance of 0.05 or less was considered significant. ACKNOWLEDGEMENTS The research leading to these results has received funding from the European Union's Seventh Framework Programme (FP7/2007-2011) under grant agreement n. 259679 (IDEAL) and KBBE 2010-14 n. 266486 (NU-AGE) to CF, from the University of Florence to DM, and MIUR (PRIN2006) to DM and CF. The funding sources have not been involved in the design, analysis or interpretation of the results. Conflicts of Interest Statement The authors declare no conflict of interest.
REFERENCES 1. Sansoni P, Vescovini R, Fagnoni F, Biasini C, Zanni F, Zanlari L, Telera A, Lucchini G, Passeri G, Monti D, Franceschi C, Passeri M. The immune system in extreme longevity. Exp Gerontol. 2008;43:61‐65. 2. Franceschi C, Capri M, Monti D, Giunta S, Olivieri F, Sevini F, Panourgia MP, Invidia L,Celani L, Scurti M, Cevenini E, Castellani GC, Salvioli S. Inflammaging and anti‐inflammaging: a systemic perspective on aging and longevity emerged from studies in humans. Mech Ageing Dev. 2007;128:92‐105. 3. Franceschi C. Inflammaging as a major characteristic of old people: can it be prevented or cured? Nutr Rev. 2007;65:S173‐S176. 4. Burkle A, Caselli G, Franceschi C, Mariani E, Sansoni P, Santoni A, Vecchio G, Witkowski JM, Caruso C. Pathophysiology of ageing, longevity and age related diseases. Immun Ageing. 2007;4:4. 5. Franceschi C, Capri M, Monti D, Giunta S, Olivieri F, Sevini F, Panourgia MP, Invidia L, Celani L, Scurti M, Cevenini E, Castellani GC, Salvioli S: Inflammaging and anti‐inflammaging: a systemic perspective on aging and longevity emerged from studies in humans. Mech Ageing Dev. 2007;128:92‐105. 6. Franceschi C, Bonafe M. Centenarians as a model for healthy aging. Biochem Soc Trans. 2003;31:457‐461. 7. Nicholson JK, Holmes E, Wilson ID. Gut microorganisms, mammalian metabolism and personalized health care. Nat Rev Microbiol. 2005;3:431‐438. 8. Li M, Wang B, Zhang M, Rantalainen M, Wang S, Zhou H, Zhang Y, Shen J, Pang X, Zhang M, Wei H, Chen Y, Lu H, Zuo J, Su M, Qiu Y, Jia W, Xiao C, Smith LM, Yang S, Holmes E, Tang H, Zhao G, Nicholson JK, Li L, Zhao L. Symbiotic gut microbes modulate human metabolic phenotypes. Proc Natl Acad Sci U S A. 2008;105:2117‐2122. 9. Martin F‐PJ, Wang Y, Sprenger N, Yap IKS, Rezzi S, Ramadan Z, Pere‐Trepat E, Rochat F, Cherbut C, van Bladeren P, Fay LB, Kochhar S, Lindon JC, Holmes E, Nicholson JK. Top‐down Systems Biology Integration of Conditional Prebiotic Transgenomic Interactions in a Humanized Microbiome Mouse Model. Mol Syst Biol. 2008;4:205. 10. Selman C, Kerrison ND, Cooray A, Piper MD, Lingard SJ, Barton RH, Schuster EF, Blanc E, Gems D, Nicholson JK, Thornton JM, Partridge L, Withers DJ. Coordinated multi‐tissue transcriptional and plasma metabonomic profiles following acute caloric restriction in mice. Physiol Genomics 2006. 11. Wang Y, Lawler D, Larson B, Ramadan Z, Kochhar S, Holmes E, Nicholson JK. Metabonomic Investigations of Aging and Caloric Restriction in a Life‐Long Dog Study. J Proteome Res. 2007;6:1846‐1854. 12. Rezzi S, Martin FP, Shanmuganayagam D, Colman RJ, Nicholson JK, Weindruch R. Metabolic shifts due to long‐term caloric restriction revealed in nonhuman primates. Exp Gerontol. 2009;44:356‐362. 13. Ejsing CS, Sampaio JL, Surendranath V, Duchoslav E, Ekroos K, Klemm RW, Simons K, Shevchenko A. Global analysis of the yeast lipidome by quantitative shotgun mass spectrometry. Proc Natl Acad Sci U S A. 2009;106:2136‐2141. 14. Gonzalez‐Covarrubias V, Beekman M, Uh HW, Dane A, Troost J, Paliukhovich I, van der Kloet FM, Houwing‐Duistermaat J,
www.impactaging.com 17 AGING, January 2014, Vol. 6 No.1
Vreeken RJ, Hankemeier T, Slagboom EP.Lipidomics of familial longevity. Aging Cell. 2013;12:426‐434. 15. Collino S, Montoliu I, Martin FP, Scherer M, Mari D, Salvioli S, Bucci L, Ostan R, Monti D, Biagi E, Brigidi P, Franceschi C, Rezzi S. Metabolic signatures of extreme longevity in northern italian centenarians reveal a complex remodeling of lipids, amino acids, and gut microbiota metabolism. PLoS One. 2013;8:e56564. 16. Cloarec O, Dumas ME, Craig A, Barton RH, Trygg J, Hudson J, Blancher C, Gauguier D, Lindon JC, Holmes E, Nicholson J. Statistical total correlation spectroscopy: an exploratory approach for latent biomarker identification from metabolic 1H NMR data sets. Anal Chem. 2005;77:1282‐1289. 17. Passarino G, Calignano C, Vallone A, Franceschi C, Jeune B, Robine JM, Yashin AI, Cavalli Sforza LL, De BG. Male/female ratio in centenarians: a possible role played by population genetic structure. Exp Gerontol. 2002;37:1283‐1289. 18. Dejong CH, van de Poll MC, Soeters PB, Jalan R, Olde Damink SW. Aromatic amino acid metabolism during liver failure. J Nutr. 2007;137:1579S‐1585S. 19. Dillon EL, Sheffield‐Moore M, Paddon‐Jones D, Gilkison C, Sanford AP, Casperson SL, Jiang J, Chinkes DL, Urban RJ. Amino acid supplementation increases lean body mass, basal muscle protein synthesis, and insulin‐like growth factor‐I expression in older women. J Clin Endocrinol Metab. 2009;94:1630‐1637. 20. Chen J, Herrup K. Glutamine acts as a neuroprotectant against DNA damage, beta‐amyloid and H2O2‐induced stress. PLoS One. 2012;7:e33177. 21. Folstein MF, Folstein SE, McHugh PR. "Mini‐mental state". A practical method for grading the cognitive state of patients for the clinician. J Psychiatr Res. 1975;12:189‐198. 22. Magni E, Binetti G, Bianchetti A, Rozzini R, Trabucchi M. Mini‐Mental State Examination: a normative study in Italian elderly population. Eur J Neurol. 1996;3:198‐202. 23. Franceschi C, Motta L, Valensin S, Rapisarda R, Franzone A, Berardelli M, Motta M, Monti D, Bonafe M, Ferrucci L, Deiana L, Pes GM, Carru C, Desole MS, Barbi C, Sartoni G, Gemelli C, Lescai F, Olivieri F, Marchegiani F, Cardelli M, Cavallone L, Gueresi P, Cossarizza A, Troiano L, Pini G, Sansoni P, Passeri G, Lisa R, Spazzafumo L, Amadio L, Giunta S, Stecconi R, Morresi R, Viticchi C, Mattace R, De BG, Baggio G. Do men and women follow different trajectories to reach extreme longevity? Italian Multicenter Study on Centenarians (IMUSCE). Aging (Milano). 2000;12:77‐84. 24. Hubert‐Buron A, Leblond J, Jacquot A, Ducrotte P, Dechelotte P, Coeffier M. Glutaminepretreatment reduces IL‐8 production in human intestinal epithelial cells by limiting IkappaBalpha ubiquitination. J Nutr .2006;136:1461‐1465. 25. Ingram DK, Roth GS. Glycolytic inhibition as a strategy for developing calorie restriction mimetics. Exp Gerontol. 2011;46:148‐154. 26. Salvioli S, Monti D, Lanzarini C, Conte M, Pirazzini C, Bacalini MG, Garagnani P, Giuliani C, Fontanesi E, Ostan R, Bucci L, Sevini F, Yani SL, Barbieri A, Lomartire L, Borelli V, Vianello D, Bellavista E, Martucci M, Cevenini E, Pini E, Scurti M, Biondi F, Santoro A, Capri M, Franceschi C. Immune system, cell senescence, aging and longevity‐‐inflamm‐aging reappraised. Curr Pharm Des. 2013;19:1675‐1679. 27. Grootveld M, Claxson AW, Chander CL, Haycock P, Blake DR, Hawkes GE. High resolution proton NMR investigations of rat blood plasma. Assignment of resonances for the molecularly
mobile carbohydrate side‐chains of 'acute‐phase' glycoproteins. FEBS Lett. 1993;322:266‐276. 28. Baumann H, Jahreis GP, Gaines KC. Synthesis and regulation of acute phase plasma proteins in primary cultures of mouse hepatocytes. J Cell Biol. 1983;97:866‐876. 29. Wyss M, Kaddurah‐Daouk R. Creatine and creatinine metabolism. Physiol Rev. 2000;80:1107‐1213. 30. Gey C, Seeger K. Metabolic changes during cellular senescence investigated by proton NMR‐spectroscopy. Mech Ageing Dev. 2013;134:130‐138. 31. Tang WH, Wang Z, Levison BS, Koeth RA, Britt EB, Fu X, Wu Y, Hazen SL. Intestinal microbial metabolism of phosphatidylcholine and cardiovascular risk. N Engl J Med. 2013;368:1575‐1584. 32. Bennett BJ, de Aguiar Vallim TQ, Wang Z, Shih DM, Meng Y, Gregory J, Allayee H, Lee R, Graham M, Crooke R, Edwards PA, Hazen SL, Lusis AJ. Trimethylamine‐N‐oxide, a metabolite associated with atherosclerosis, exhibits complex genetic and dietary regulation. Cell Metab. 2013;17:49‐60. 33. Piccinini M, Scandroglio F, Prioni S, Buccinna B, Loberto N, Aureli M, Chigorno V, Lupino E, DeMarco G, Lomartire A, Rinaudo MT, Sonnino S, Prinetti A. Deregulated sphingolipid metabolism and membrane organization in neurodegenerative disorders. Mol Neurobiol. 2010;41:314‐340. 34. Nelson JC, Jiang XC, Tabas I, Tall A, Shea S. Plasma sphingomyelin and subclinical atherosclerosis: findings from the multi‐ethnic study of atherosclerosis. Am J Epidemiol. 2006;163:903‐912. 35. Holland WL, Summers SA. Sphingolipids, insulin resistance, and metabolic disease: new insights from in vivo manipulation of sphingolipid metabolism. Endocr Rev. 2008;29:381‐402. 36. Smith AR, Visioli F, Frei B, Hagen TM. Age‐related changes in endothelial nitric oxide synthase phosphorylation and nitric oxide dependent vasodilation: evidence for a novel mechanism involving sphingomyelinase and ceramide‐activated phosphatase 2A. Aging Cell. 2006;5:391‐400. 37. Schmitz G, Grandl M. Role of redox regulation and lipid rafts in macrophages during Ox‐LDL‐mediated foam cell formation. Antioxid Redox Signal. 2007;9:1499‐1518. 38. Grandl M, Bared SM, Liebisch G, Werner T, Barlage S, Schmitz G. E‐LDL and Ox‐LDL differentially regulate ceramide and cholesterol raft microdomains in human Macrophages. Cytometry A. 2006;69:189‐191. 39. Bismuth J, Lin P, Yao Q, Chen C. Ceramide: a common pathway for atherosclerosis? Atherosclerosis. 2008;196:497‐504. 40. Vitale G, Salvioli S, Franceschi C. Oxidative stress and the ageing endocrine system. Nat Rev Endocrinol. 2013;9:228‐240. 41. Salvioli S, Monti D, Lanzarini C, Conte M, Pirazzini C, Bacalini MG, Garagnani P, Giuliani C, Fontanesi E, Ostan R, Bucci L, Sevini F, Yani SL, Barbieri A, Lomartire L, Borelli V, Vianello D, Bellavista E, Martucci M, Cevenini E, Pini E, Scurti M, Biondi F, Santoro A, Capri M, Franceschi C. Immune system, cell senescence, aging and longevity‐‐inflamm‐aging reappraised. Curr Pharm Des. 2013;19:1675‐1679. 42. Wiesner P, Leidl K, Boettcher A, Schmitz G, Liebisch G. Lipid profiling of FPLC‐separated lipoprotein fractions by electrospray ionization tandem mass spectrometry. J Lipid Res. 2009;50:574‐585. 43. Li Z, Agellon LB, Allen TM, Umeda M, Jewell L, Mason A, Vance DE. The ratio of phosphatidylcholine to
www.impactaging.com 18 AGING, January 2014, Vol. 6 No.1
phosphatidylethanolamine influences membrane integrity and steatohepatitis. Cell Metab. 2006;3:321‐331. 44. Farooqui AA, Ong WY, Horrocks LA. Biochemical aspects of neurodegeneration in human brain: involvement of neural membrane phospholipids and phospholipases A2. Neurochem Res. 2004;29:1961‐1977. 45. Rabini RA, Moretti N, Staffolani R, Salvolini E, Nanetti L, Franceschi C, Mazzanti L. Reduced susceptibility to peroxidation of erythrocyte plasma membranes from centenarians. Exp Gerontol. 2002;37:657‐663. 46. Maskrey BH, Bermudez‐Fajardo A, Morgan AH, Stewart‐Jones E, Dioszeghy V, Taylor GW, Baker PR, Coles B, Coffey MJ, Kuhn H, O'Donnell VB. Activated platelets and monocytes generate four hydroxyphosphatidylethanolamines via lipoxygenase. J Biol Chem. 2007;282:20151‐20163. 47. van Dieren JM, Simons‐Oosterhuis Y, Raatgeep HC, Lindenbergh‐Kortleve DJ, Lambers ME, van der Woude CJ, Kuipers EJ, Snoek GT, Potman R, Hammad H, Lambrecht BN, Samsom JN, Nieuwenhuis EE. Anti‐inflammatory actions of phosphatidylinositol. Eur J Immunol. 2011;41:1047‐1057. 48. Rhee EP, Cheng S, Larson MG, Walford GA, Lewis GD, McCabe E, Yang E, Farrell L, Fox CS, O'Donnell CJ, Carr SA, Vasan RS, Florez JC, Clish CB, Wang TJ, Gerszten RE. Lipid profiling identifies a triacylglycerol signature of insulin resistance and improves diabetes prediction in humans. J Clin Invest. 2011;121:1402‐1411. 49. Erion DM, Shulman GI: Diacylglycerol‐mediated insulin resistance. Nat Med. 2010;16:400‐402. 50. Rezzi S, Ramadan Z, Martin FP, Fay LB, Van BP, Lindon JC, Nicholson JK, Kochhar S. Human metabolic phenotypes link directly to specific dietary preferences in healthyindividuals. J Proteome Res. 2007;6:4469‐4477. 51. Siddiqui N, Sim J, Silwood CJ, Toms H, Iles RA, Grootveld M. Multicomponent analysis of encapsulated marine oil supplements using high‐resolution 1H and 13C NMR techniques. J Lipid Res. 2003;44:2406‐2427. 52. Oostendorp M, Engelke UF, Willemsen MA, Wevers RA. Diagnosing inborn errors of lipid metabolism with proton nuclear magnetic resonance spectroscopy. Clin Chem. 2006;52:1395‐1405. 53. Matyash V, Liebisch G, Kurzchalia TV, Shevchenko A, Schwudke D. Lipid extraction by methyl‐tert‐butyl ether for high‐throughput lipidomics. J Lipid Res. 2008;49:1137‐1146. 54. Schuhmann K, Herzog R, Schwudke D, Metelmann‐Strupat W, Bornstein SR, Shevchenko A. Bottom‐up shotgun lipidomics by higher energy collisional dissociation on LTQ Orbitrap mass spectrometers. Anal Chem. 2011;83:5480‐5487. 55. Herzog R, Schwudke D, Schuhmann K, Sampaio JL, Bornstein SR, Schroeder M, Shevchenko A. A novel informatics concept for high‐throughput shotgun lipidomics based on the molecular fragmentation query language. Genome Biol. 2011;12:R8.
www.impactaging.com 19 AGING, January 2014, Vol. 6 No.1
SUPPLEMENTARY FIGURES AND TABLES
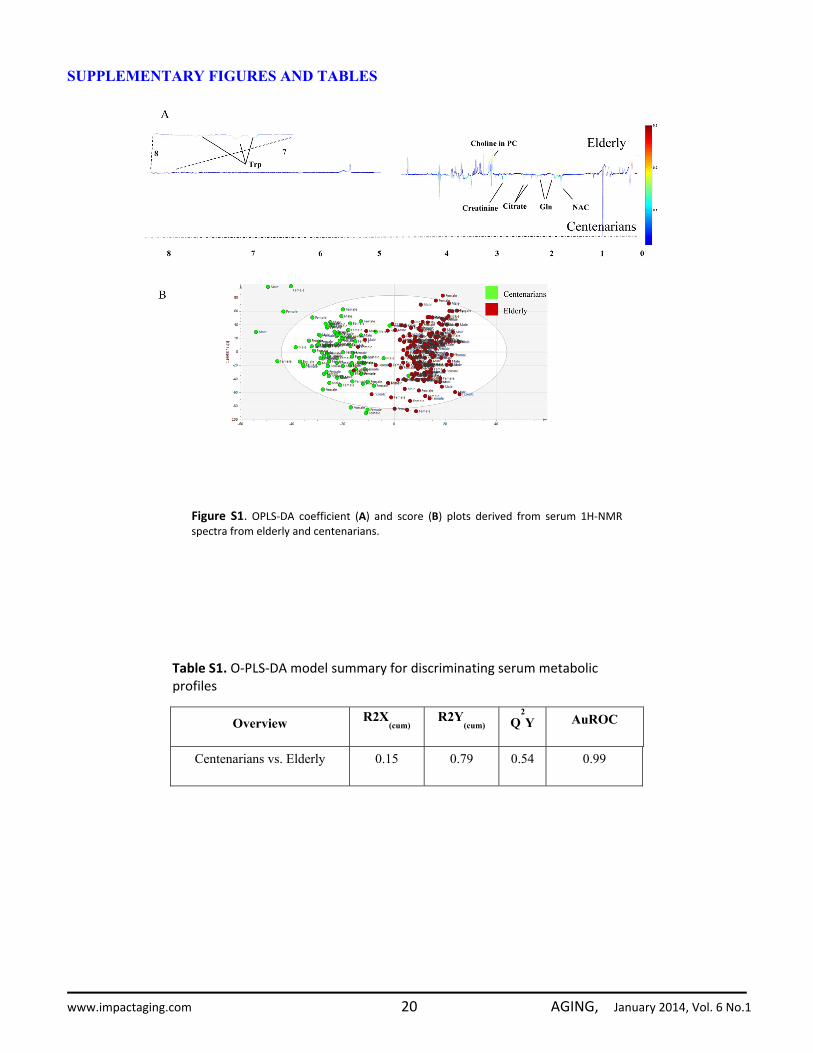
Figure S1. OPLS‐DA coefficient (A) and score (B) plots derived from serum 1H‐NMRspectra from elderly and centenarians.
Table S1. O‐PLS‐DA model summary for discriminating serum metabolic profiles
Overview R2X(cum)
R2Y(cum)
Q2Y AuROC
Centenarians vs. Elderly 0.15 0.79 0.54 0.99
www.impactaging.com 20 AGING, January 2014, Vol. 6 No.1
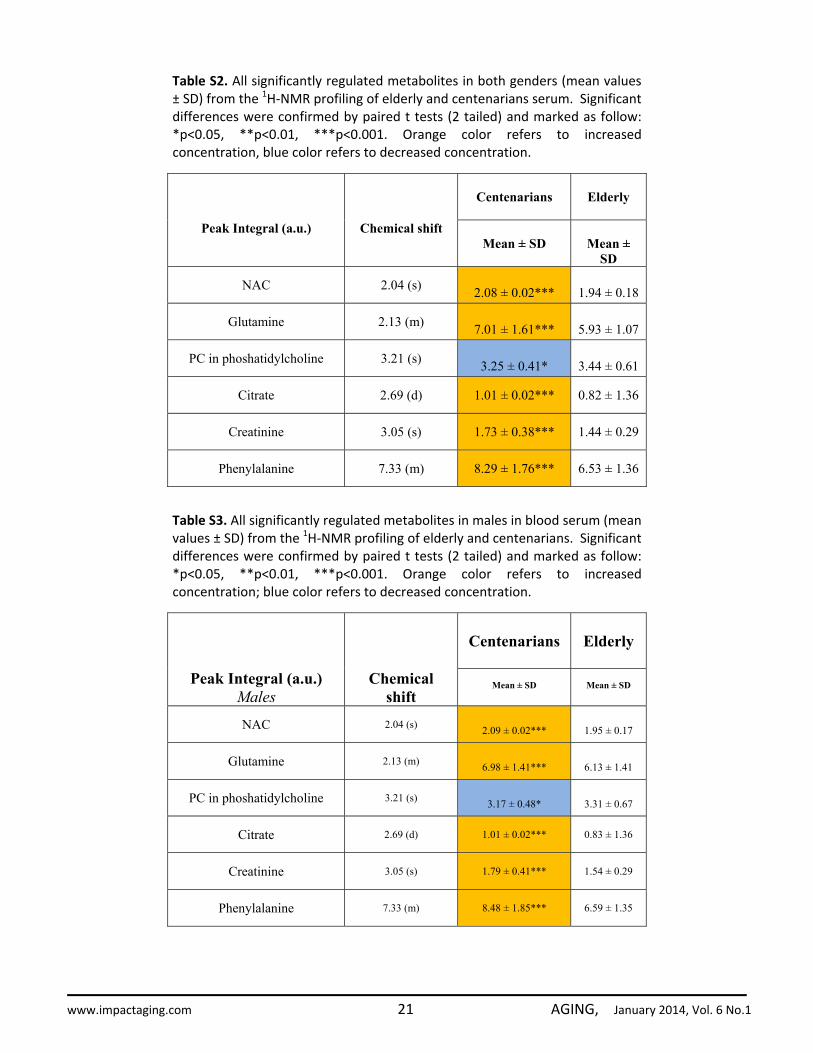
Table S2. All significantly regulated metabolites in both genders (mean values ± SD) from the 1H‐NMR profiling of elderly and centenarians serum. Significant differences were confirmed by paired t tests (2 tailed) and marked as follow: *p<0.05, **p<0.01, ***p<0.001. Orange color refers to increased concentration, blue color refers to decreased concentration.
Centenarians
Elderly
Peak Integral (a.u.) Chemical shift Mean ± SD
Mean ±
SD
NAC 2.04 (s) 2.08 ± 0.02***
1.94 ± 0.18
Glutamine 2.13 (m) 7.01 ± 1.61***
5.93 ± 1.07
PC in phoshatidylcholine 3.21 (s) 3.25 ± 0.41*
3.44 ± 0.61
Citrate 2.69 (d) 1.01 ± 0.02*** 0.82 ± 1.36
Creatinine 3.05 (s) 1.73 ± 0.38*** 1.44 ± 0.29
Phenylalanine 7.33 (m) 8.29 ± 1.76*** 6.53 ± 1.36
Table S3. All significantly regulated metabolites in males in blood serum (mean values ± SD) from the 1H‐NMR profiling of elderly and centenarians. Significant differences were confirmed by paired t tests (2 tailed) and marked as follow: *p<0.05, **p<0.01, ***p<0.001. Orange color refers to increased concentration; blue color refers to decreased concentration.
Centenarians
Elderly
Peak Integral (a.u.) Males
Chemical shift
Mean ± SD
Mean ± SD
NAC 2.04 (s) 2.09 ± 0.02***
1.95 ± 0.17
Glutamine 2.13 (m) 6.98 ± 1.41***
6.13 ± 1.41
PC in phoshatidylcholine 3.21 (s) 3.17 ± 0.48*
3.31 ± 0.67
Citrate 2.69 (d) 1.01 ± 0.02*** 0.83 ± 1.36
Creatinine 3.05 (s) 1.79 ± 0.41*** 1.54 ± 0.29
Phenylalanine 7.33 (m) 8.48 ± 1.85*** 6.59 ± 1.35
www.impactaging.com 21 AGING, January 2014, Vol. 6 No.1
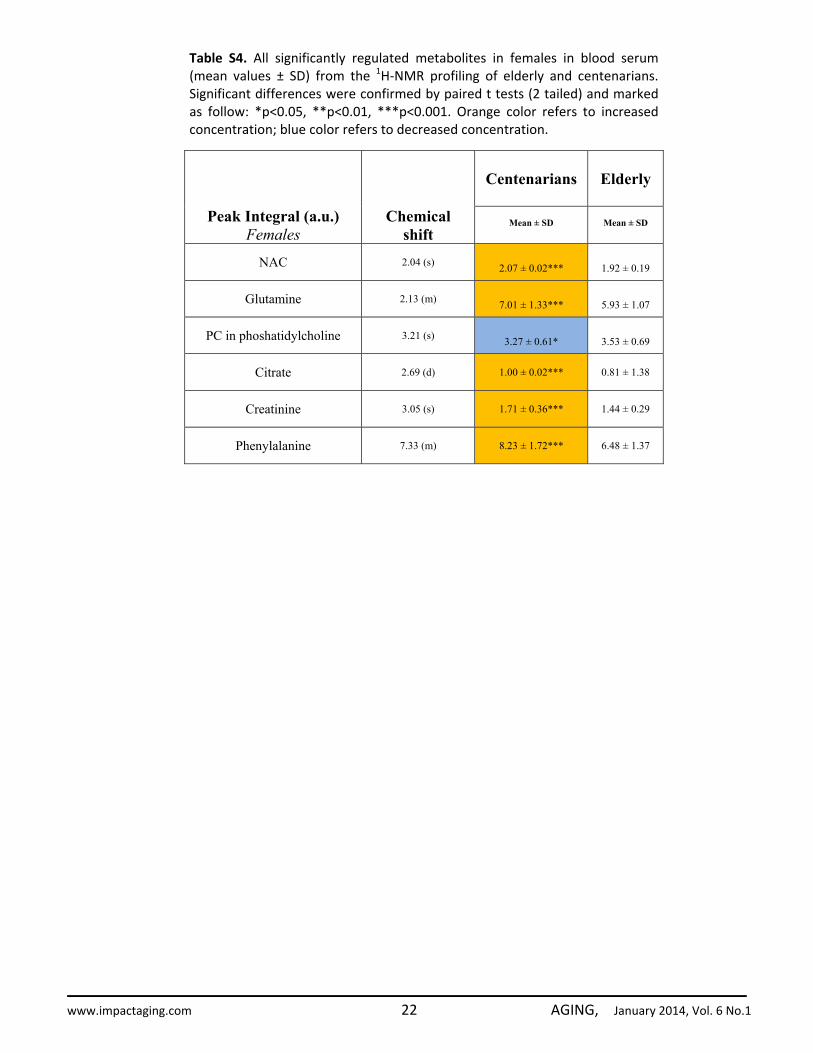
Table S4. All significantly regulated metabolites in females in blood serum (mean values ± SD) from the 1H‐NMR profiling of elderly and centenarians. Significant differences were confirmed by paired t tests (2 tailed) and marked as follow: *p<0.05, **p<0.01, ***p<0.001. Orange color refers to increased concentration; blue color refers to decreased concentration.
Centenarians
Elderly
Peak Integral (a.u.) Females
Chemical shift
Mean ± SD
Mean ± SD
NAC 2.04 (s) 2.07 ± 0.02***
1.92 ± 0.19
Glutamine 2.13 (m) 7.01 ± 1.33***
5.93 ± 1.07
PC in phoshatidylcholine 3.21 (s) 3.27 ± 0.61*
3.53 ± 0.69
Citrate 2.69 (d) 1.00 ± 0.02*** 0.81 ± 1.38
Creatinine 3.05 (s) 1.71 ± 0.36*** 1.44 ± 0.29
Phenylalanine 7.33 (m) 8.23 ± 1.72*** 6.48 ± 1.37
www.impactaging.com 22 AGING, January 2014, Vol. 6 No.1
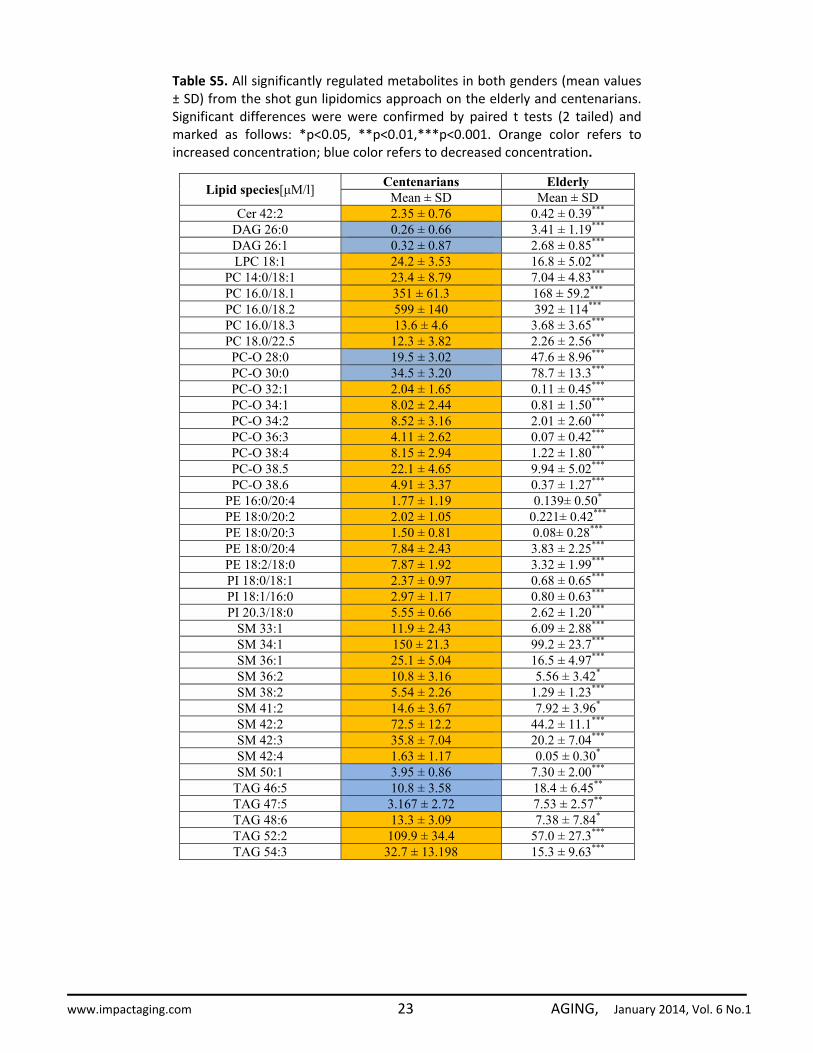
Table S5. All significantly regulated metabolites in both genders (mean values ± SD) from the shot gun lipidomics approach on the elderly and centenarians. Significant differences were were confirmed by paired t tests (2 tailed) and marked as follows: *p<0.05, **p<0.01,***p<0.001. Orange color refers to increased concentration; blue color refers to decreased concentration.
Lipid species[μM/l] Centenarians Elderly Mean ± SD Mean ± SD
Cer 42:2 2.35 ± 0.76 0.42 ± 0.39*** DAG 26:0 0.26 ± 0.66 3.41 ± 1.19*** DAG 26:1 0.32 ± 0.87 2.68 ± 0.85*** LPC 18:1 24.2 ± 3.53 16.8 ± 5.02***
PC 14:0/18:1 23.4 ± 8.79 7.04 ± 4.83*** PC 16.0/18.1 351 ± 61.3 168 ± 59.2*** PC 16.0/18.2 599 ± 140 392 ± 114*** PC 16.0/18.3 13.6 ± 4.6 3.68 ± 3.65*** PC 18.0/22.5 12.3 ± 3.82 2.26 ± 2.56*** PC-O 28:0 19.5 ± 3.02 47.6 ± 8.96*** PC-O 30:0 34.5 ± 3.20 78.7 ± 13.3*** PC-O 32:1 2.04 ± 1.65 0.11 ± 0.45*** PC-O 34:1 8.02 ± 2.44 0.81 ± 1.50*** PC-O 34:2 8.52 ± 3.16 2.01 ± 2.60*** PC-O 36:3 4.11 ± 2.62 0.07 ± 0.42*** PC-O 38:4 8.15 ± 2.94 1.22 ± 1.80*** PC-O 38.5 22.1 ± 4.65 9.94 ± 5.02*** PC-O 38.6 4.91 ± 3.37 0.37 ± 1.27***
PE 16:0/20:4 1.77 ± 1.19 0.139± 0.50* PE 18:0/20:2 2.02 ± 1.05 0.221± 0.42*** PE 18:0/20:3 1.50 ± 0.81 0.08± 0.28*** PE 18:0/20:4 7.84 ± 2.43 3.83 ± 2.25*** PE 18:2/18:0 7.87 ± 1.92 3.32 ± 1.99*** PI 18:0/18:1 2.37 ± 0.97 0.68 ± 0.65*** PI 18:1/16:0 2.97 ± 1.17 0.80 ± 0.63*** PI 20.3/18:0 5.55 ± 0.66 2.62 ± 1.20***
SM 33:1 11.9 ± 2.43 6.09 ± 2.88*** SM 34:1 150 ± 21.3 99.2 ± 23.7*** SM 36:1 25.1 ± 5.04 16.5 ± 4.97*** SM 36:2 10.8 ± 3.16 5.56 ± 3.42* SM 38:2 5.54 ± 2.26 1.29 ± 1.23*** SM 41:2 14.6 ± 3.67 7.92 ± 3.96* SM 42:2 72.5 ± 12.2 44.2 ± 11.1*** SM 42:3 35.8 ± 7.04 20.2 ± 7.04*** SM 42:4 1.63 ± 1.17 0.05 ± 0.30* SM 50:1 3.95 ± 0.86 7.30 ± 2.00***
TAG 46:5 10.8 ± 3.58 18.4 ± 6.45** TAG 47:5 3.167 ± 2.72 7.53 ± 2.57** TAG 48:6 13.3 ± 3.09 7.38 ± 7.84* TAG 52:2 109.9 ± 34.4 57.0 ± 27.3*** TAG 54:3 32.7 ± 13.198 15.3 ± 9.63***
www.impactaging.com 23 AGING, January 2014, Vol. 6 No.1

Table S6. All significantly regulated metabolites in males (mean values ± SD) from the shot gun lipidomics approach on the elderly and centenarians. Significant differences were assessed by paired t tests (2 tailed) and marked as follows: *p<0.05, **p<0.01, ***p<0.001. Orange color refers to increased concentration; blue color refers to decreased concentration.
Lipid species[μM/l] Males
Centenarians Elderly Mean ± SD Mean ± SD
Cer 42:2 2.56 ± 0.17 0.41 ± 0.59*** DAG 26:0 0.590 ± 0.83 3.29 ± 1.64*** DAG 26:1 0.49 ± 0.69 2.61 ± 1.25*** LPC 18:1 27.3 ± 3.59 18.1 ± 8.21***
PC 14:0/18:1 23.45 ± 0.63 5.88 ± 4.28*** PC 16.0/18.1 327.9 ± 58.1 165.1 ± 53.9*** PC 16.0/18.2 625.5 ± 151.2 370.6 ± 131.1*** PC 16.0/18.3 14.4 ± 3.12 3.32 ± 3.78*** PC 18.0/22.5 12.0 ± 2.53 2.31 ± 3.21*** PC-O 28:0 19.5 ± 1.34 45.6 ± 13.3*** PC-O/30:0 35.6 ± 2.36 74.7 ± 20.8*** PC-O 32:1 2.51 ± 1.83 0.31 ± 0.71*** PC-O 34:1 9.23 ± 2.24 1.11 ± 2.21*** PC-O 34:2 8.81 ± 2.25 2.95 ± 3.44*** PC-O 36:3 4.35 ± 1.32 0.43 ± 1.19*** PC-O 38:4 9.71 ± 4.34 2.00 ± 1.17*** PC-O 38.5 23.6 ± 6.31 10.5 ± 5.08*** PC-O 38.6 4.73 ± 3.55 0.94 ± 1.98*
PE 16:0/20:4 1.51 ± 1.33 0.06 ± 0.51* PE 18:0/20:2 1.68 ± 0.57 0.28 ± 0.61* PE 18:0/20:3 1.12 ± 0.02 0.15 ± 0.04* PE 18:0/20:4 6.48 ± 1.15 2.93 ± 1.94** PE 18:2/18:0 7.53 ± 1.58 2.82 ± 1.98* PI 18:0/18:1 2.378 ± 0.973 0.688 ± 0.657* PI 18:1/16:0 1.60 ± 0.56 0.72 ± 0.81* PI 20.3/18:0 5.71 ± 0.09 2.51 ± 1.29*
SM 33:1 12.2 ± 2.46 5.61 ± 3.15* SM 34:1 151 ± 30.5 94.8 ± 25.8** SM 36:1 22.9 ± 4.81 15.4 ± 5.86* SM 36:2 8.71 ± 2.19 4.52 ± 3.69* SM 38:2 4.45 ± 1.62 1.05 ± 1.19* SM 41:2 14.09 ± 3.94 7.39 ± 3.21** SM 42:2 75.7 ± 15.8 44.1 ± 12.1*** SM 42:3 35.2 ± 7.31 19.3 ± 7.31** SM 42:4 1.22 ± 0.91 0.08± 0.31* SM 50:1 4.29 ± 1.31 6.79 ± 2.15*
TAG 46:5 10.14 ± 3.58 17.0 ± 3.47** TAG 47:5 2.86 ± 2.07 6.60 ± 2.84** TAG 48:6 11.7 ± 1.04 6.73 ± 4.24** TAG 52:2 85.7 ± 10.0 51.5 ± 20.6** TAG 54:3 22.8 ± 1.27 14.4 ± 10.5*
www.impactaging.com 24 AGING, January 2014, Vol. 6 No.1
www.impactaging.com 25 AGING, January 2014, Vol. 6 No.1
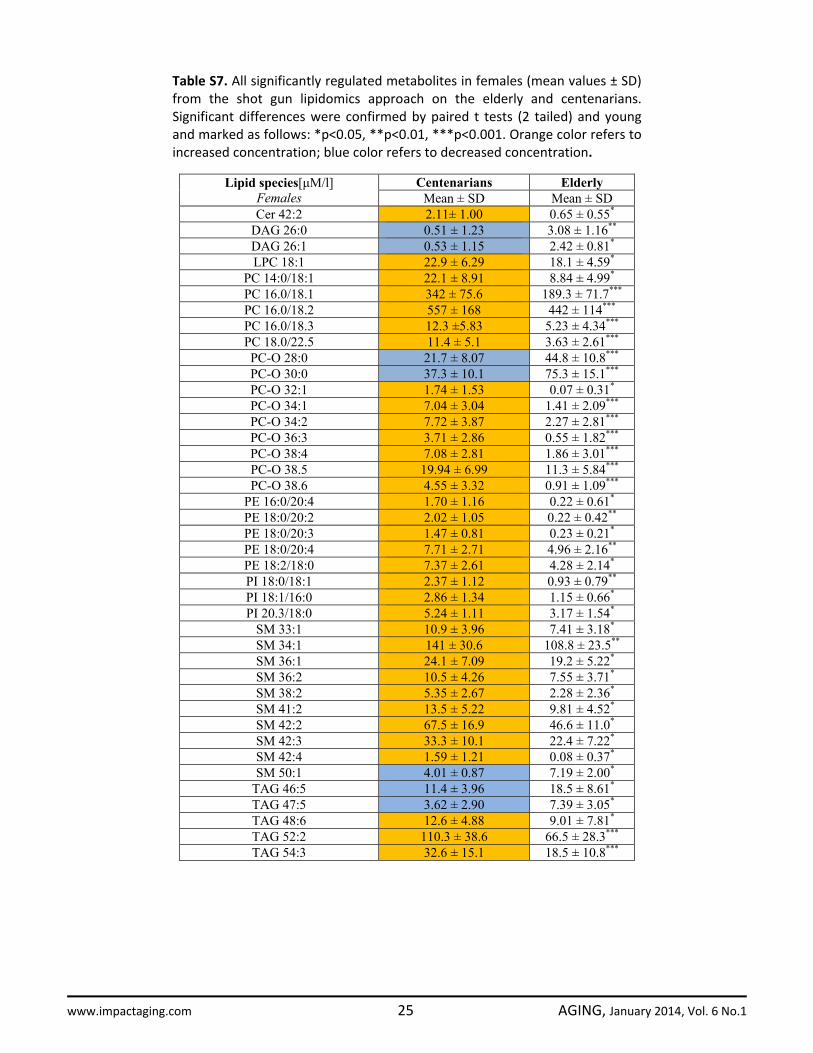
Table S7. All significantly regulated metabolites in females (mean values ± SD) from the shot gun lipidomics approach on the elderly and centenarians. Significant differences were confirmed by paired t tests (2 tailed) and young and marked as follows: *p<0.05, **p<0.01, ***p<0.001. Orange color refers to increased concentration; blue color refers to decreased concentration.
Lipid species[μM/l] Females
Centenarians Elderly Mean ± SD Mean ± SD
Cer 42:2 2.11± 1.00 0.65 ± 0.55* DAG 26:0 0.51 ± 1.23 3.08 ± 1.16** DAG 26:1 0.53 ± 1.15 2.42 ± 0.81* LPC 18:1 22.9 ± 6.29 18.1 ± 4.59*
PC 14:0/18:1 22.1 ± 8.91 8.84 ± 4.99* PC 16.0/18.1 342 ± 75.6 189.3 ± 71.7*** PC 16.0/18.2 557 ± 168 442 ± 114*** PC 16.0/18.3 12.3 ±5.83 5.23 ± 4.34*** PC 18.0/22.5 11.4 ± 5.1 3.63 ± 2.61*** PC-O 28:0 21.7 ± 8.07 44.8 ± 10.8*** PC-O 30:0 37.3 ± 10.1 75.3 ± 15.1*** PC-O 32:1 1.74 ± 1.53 0.07 ± 0.31* PC-O 34:1 7.04 ± 3.04 1.41 ± 2.09*** PC-O 34:2 7.72 ± 3.87 2.27 ± 2.81*** PC-O 36:3 3.71 ± 2.86 0.55 ± 1.82*** PC-O 38:4 7.08 ± 2.81 1.86 ± 3.01*** PC-O 38.5 19.94 ± 6.99 11.3 ± 5.84*** PC-O 38.6 4.55 ± 3.32 0.91 ± 1.09***
PE 16:0/20:4 1.70 ± 1.16 0.22 ± 0.61* PE 18:0/20:2 2.02 ± 1.05 0.22 ± 0.42** PE 18:0/20:3 1.47 ± 0.81 0.23 ± 0.21* PE 18:0/20:4 7.71 ± 2.71 4.96 ± 2.16** PE 18:2/18:0 7.37 ± 2.61 4.28 ± 2.14* PI 18:0/18:1 2.37 ± 1.12 0.93 ± 0.79** PI 18:1/16:0 2.86 ± 1.34 1.15 ± 0.66* PI 20.3/18:0 5.24 ± 1.11 3.17 ± 1.54*
SM 33:1 10.9 ± 3.96 7.41 ± 3.18* SM 34:1 141 ± 30.6 108.8 ± 23.5** SM 36:1 24.1 ± 7.09 19.2 ± 5.22* SM 36:2 10.5 ± 4.26 7.55 ± 3.71* SM 38:2 5.35 ± 2.67 2.28 ± 2.36* SM 41:2 13.5 ± 5.22 9.81 ± 4.52* SM 42:2 67.5 ± 16.9 46.6 ± 11.0* SM 42:3 33.3 ± 10.1 22.4 ± 7.22* SM 42:4 1.59 ± 1.21 0.08 ± 0.37* SM 50:1 4.01 ± 0.87 7.19 ± 2.00*
TAG 46:5 11.4 ± 3.96 18.5 ± 8.61* TAG 47:5 3.62 ± 2.90 7.39 ± 3.05* TAG 48:6 12.6 ± 4.88 9.01 ± 7.81* TAG 52:2 110.3 ± 38.6 66.5 ± 28.3*** TAG 54:3 32.6 ± 15.1 18.5 ± 10.8***