Embed Size (px)
Citation preview

1
Profiling and diagnosinglarge-scale decentralized systems
David Oppenheimer
ROC RetreatThursday, June 5, 2003

2
Why focus on P2P systems?• There are a few real ones
– file trading, backup, IM• Look a lot like other decentralized wide-area sys.
– Grid, sensor networks, mobile ad-hoc networks, …• Look a little like all wide-area systems
– geog. dist. Internet services, content distribution. networks, federated web services, *@home, DNS, BGP, …
• Good platform for prototyping services that will eventually be deployed on a large cluster (Brewer)
• P2P principles seeping into other types of large systems (corporate networks, clusters, …)
– self-configuration/healing/optimization– decentralized control
• Large variability (in configurations, software versions, …) justifies a rich fault model
3
Why focus on P2P systems? (cont.)• This is NOT about the DHT abstraction• DHT research code just happens to be the best platform for doing wide-area networked systems research right now
4
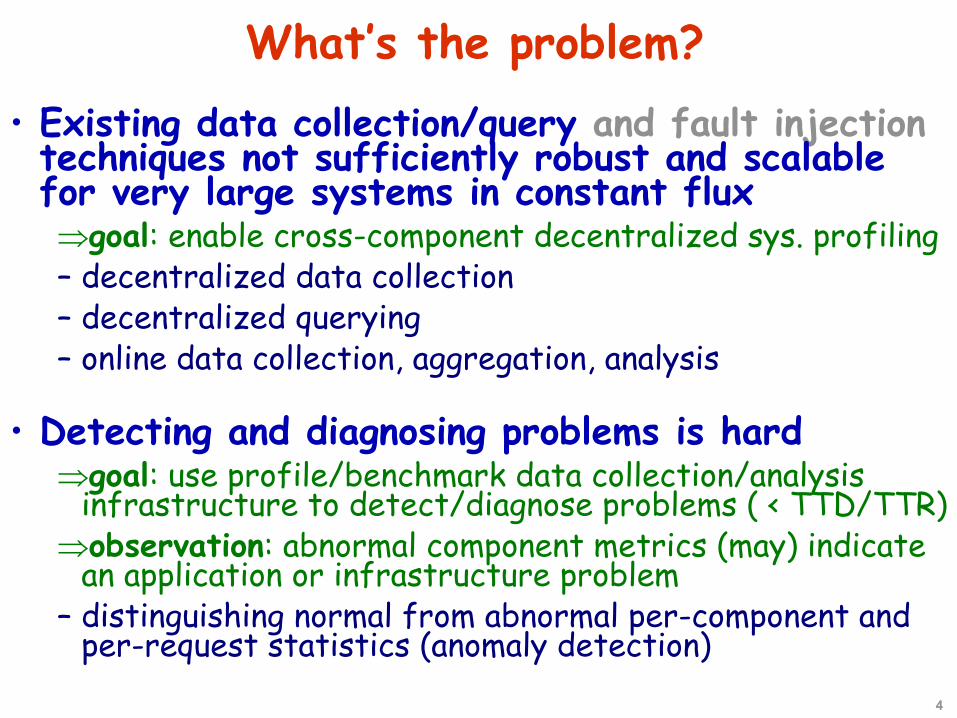
What’s the problem?• Existing data collection/query and fault injectiontechniques not sufficiently robust and scalable for very large systems in constant flux⇒goal: enable cross-component decentralized sys. profiling– decentralized data collection– decentralized querying– online data collection, aggregation, analysis
• Detecting and diagnosing problems is hard⇒goal: use profile/benchmark data collection/analysis
infrastructure to detect/diagnose problems ( < TTD/TTR)⇒observation: abnormal component metrics (may) indicate
an application or infrastructure problem– distinguishing normal from abnormal per-component and
per-request statistics (anomaly detection)

5
Benchmark metrics• Visible at user application interface
– latency, throughput, precision, recall• Visible at application routing layer interface
– latency and throughput to {find object’s owner, route msgto owner, read/write object}, latency to join/depart net
• Cracking open the black box– per-component and per-request consumption of CPU,
memory, net resources; # of requests component handles; degree of load balance; # of replicas of data item
• Recovery time, degradation during recovery– recovery time broken into TT{detect, diagnose, repair}
• Philosophy: collect fine-grained events, aggregate later as needed
aggregateaggregateacross all requestsaggregatecollectper-requestacross all componentsper-component

6
Querying the data: simple example(SQL used for illustration purposes only)
x1x1x1
nodeID
……10:0.0125:0.181timereq id
KS KR
SELECT avg(KR.time-KS.time)FROM KR, KSWHERE KR.id = KS.id AND
nodeID = x1
0:0.50
x1x1x1
nodeID
……10:0.9125:0.281timereq id
app-level request sends app-level response receives
application
DHT storage
node x1
routing routing
application
DHT storagerouting
node x2 node x3 node x4
routing
7
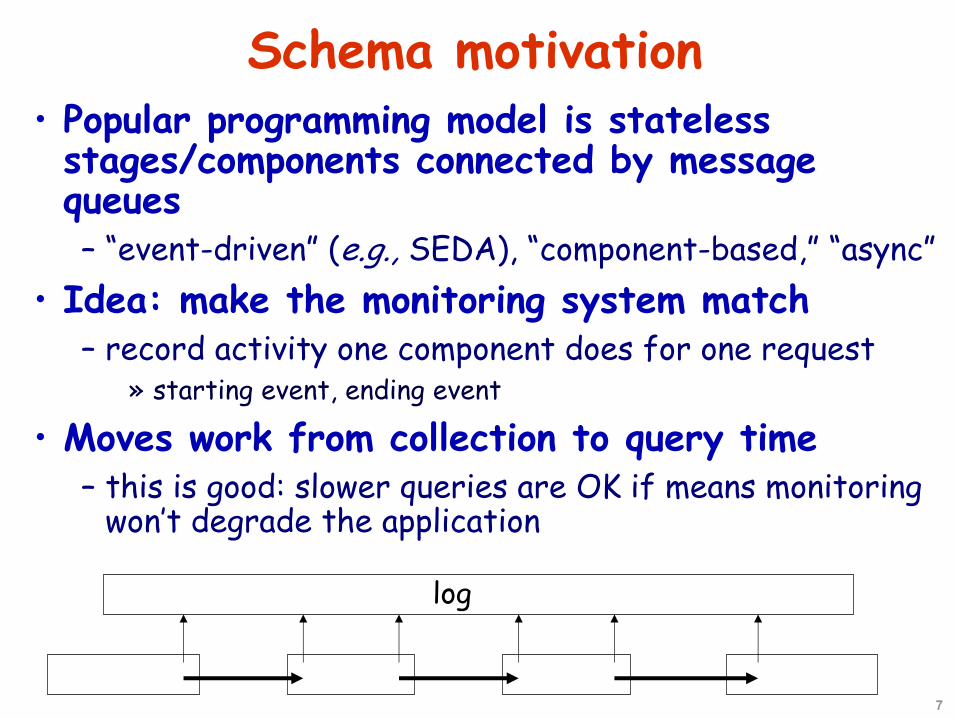
Schema motivation• Popular programming model is stateless stages/components connected by message queues– “event-driven” (e.g., SEDA), “component-based,” “async”
• Idea: make the monitoring system match– record activity one component does for one request
» starting event, ending event
• Moves work from collection to query time– this is good: slower queries are OK if means monitoring
won’t degrade the application
log
8
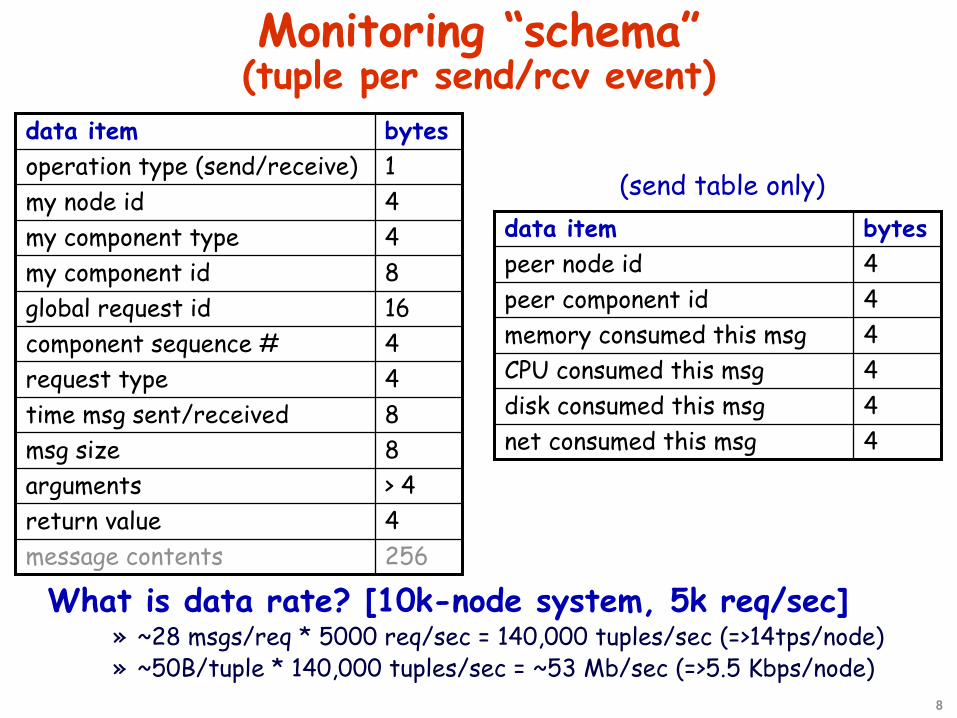
Monitoring “schema” (tuple per send/rcv event)
> 4arguments
256message contents4return value
8msg size8time msg sent/received4request type4component sequence #16global request id8my component id4my component type4my node id1operation type (send/receive)bytesdata item
4net consumed this msg4disk consumed this msg4CPU consumed this msg4memory consumed this msg4peer component id4peer node idbytesdata item
(send table only)
What is data rate? [10k-node system, 5k req/sec]» ~28 msgs/req * 5000 req/sec = 140,000 tuples/sec (=>14tps/node)» ~50B/tuple * 140,000 tuples/sec = ~53 Mb/sec (=>5.5 Kbps/node)
9
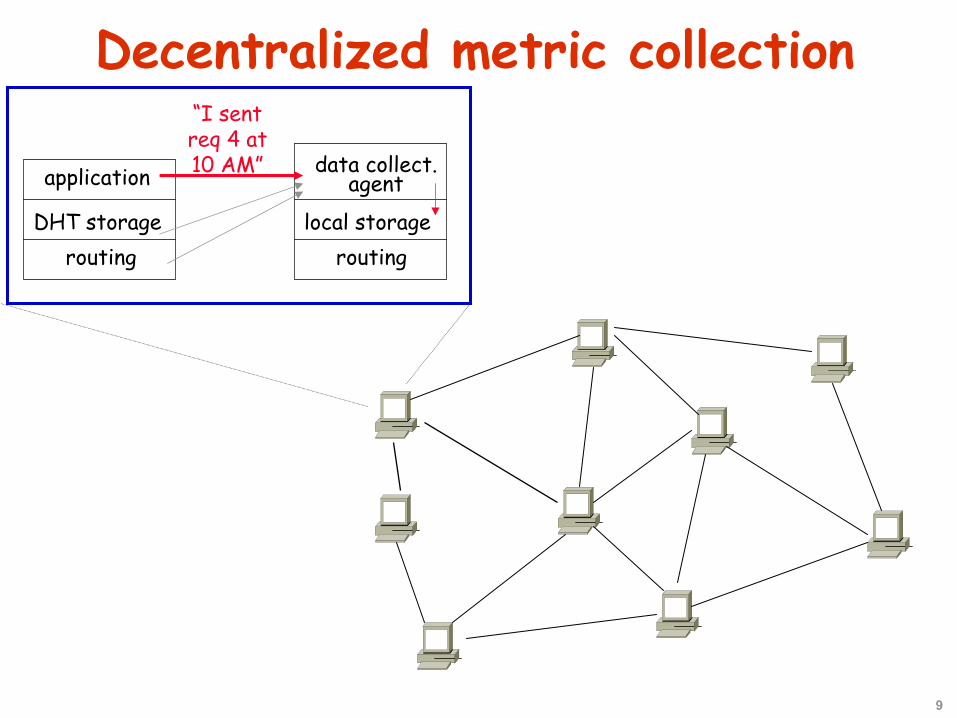
Decentralized metric collection
data collect.agent
local storagerouting
application
DHT storagerouting
“I sent req 4 at 10 AM”
10
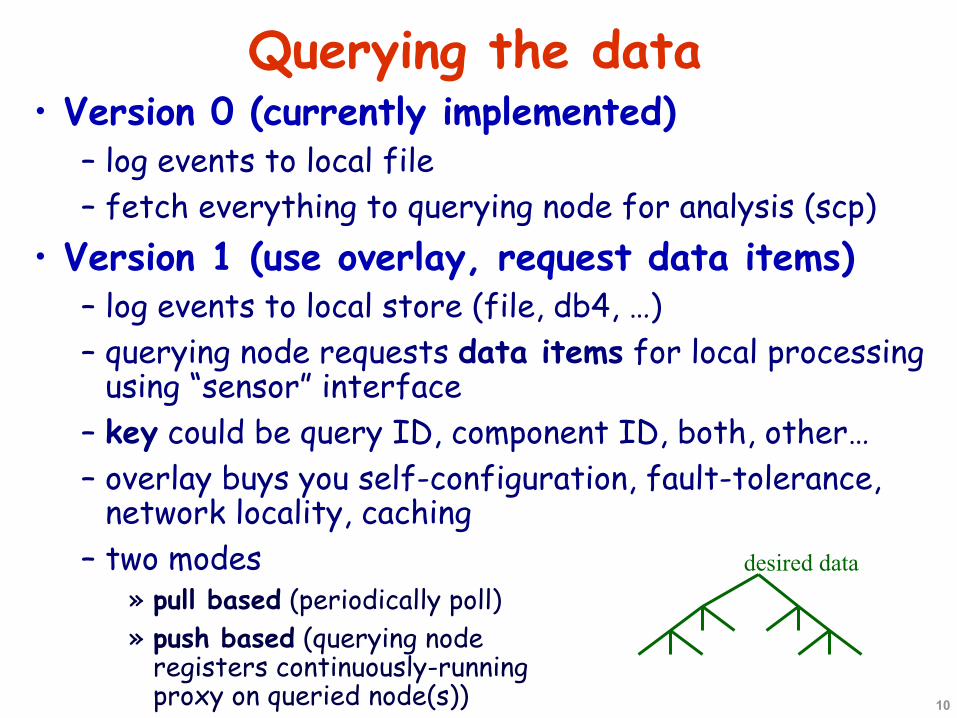
• Version 0 (currently implemented)– log events to local file– fetch everything to querying node for analysis (scp)
• Version 1 (use overlay, request data items)– log events to local store (file, db4, …)– querying node requests data items for local processing
using “sensor” interface– key could be query ID, component ID, both, other…– overlay buys you self-configuration, fault-tolerance,
network locality, caching– two modes
» pull based (periodically poll)» push based (querying node
registers continuously-runningproxy on queried node(s))
Querying the data
desired data
11
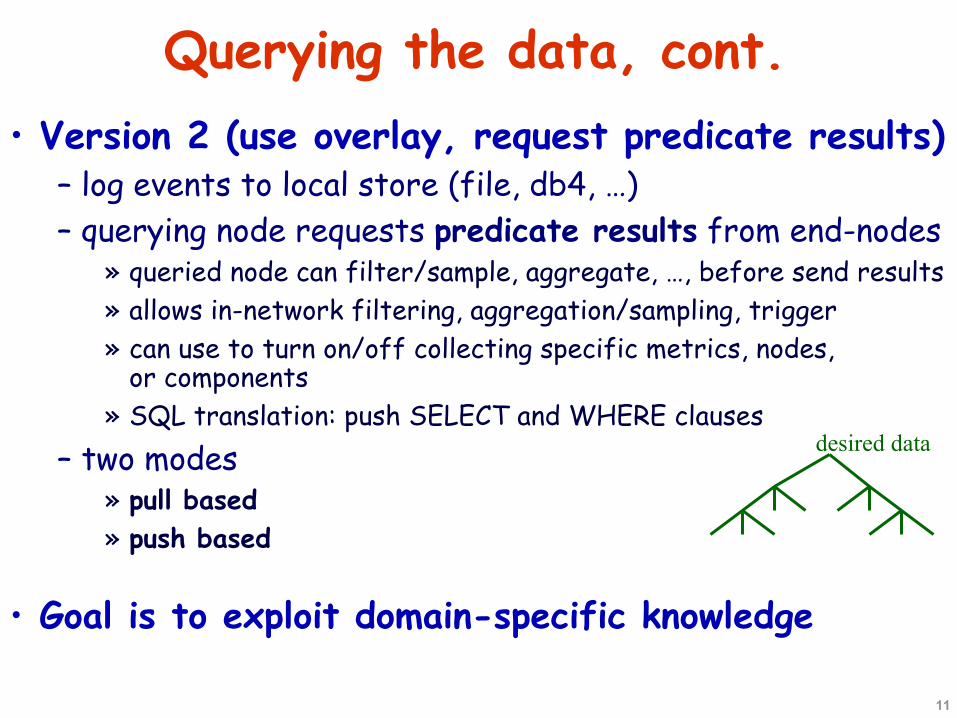
Querying the data, cont.• Version 2 (use overlay, request predicate results)
– log events to local store (file, db4, …)– querying node requests predicate results from end-nodes
» queried node can filter/sample, aggregate, …, before send results» allows in-network filtering, aggregation/sampling, trigger » can use to turn on/off collecting specific metrics, nodes,
or components» SQL translation: push SELECT and WHERE clauses
– two modes» pull based » push based
• Goal is to exploit domain-specific knowledge
desired data

12
What’s the problem?• Existing data collection/query and fault injection techniques not sufficiently robust and scalable for very large systems in constant flux⇒goal: enable cross-component decentralized sys. profiling– decentralized data collection– decentralized querying– online data collection, aggregation, analysis
• Detecting and diagnosing problems is hard⇒goal: use profile/benchmark data collection/analysis
infrastructure to detect/diagnose problems ( < TTD/TTR)⇒observation: abnormal component metrics (may) indicate
an application or infrastructure problem– distinguishing normal from abnormal per-component and
per-request statistics (anomaly detection)
13
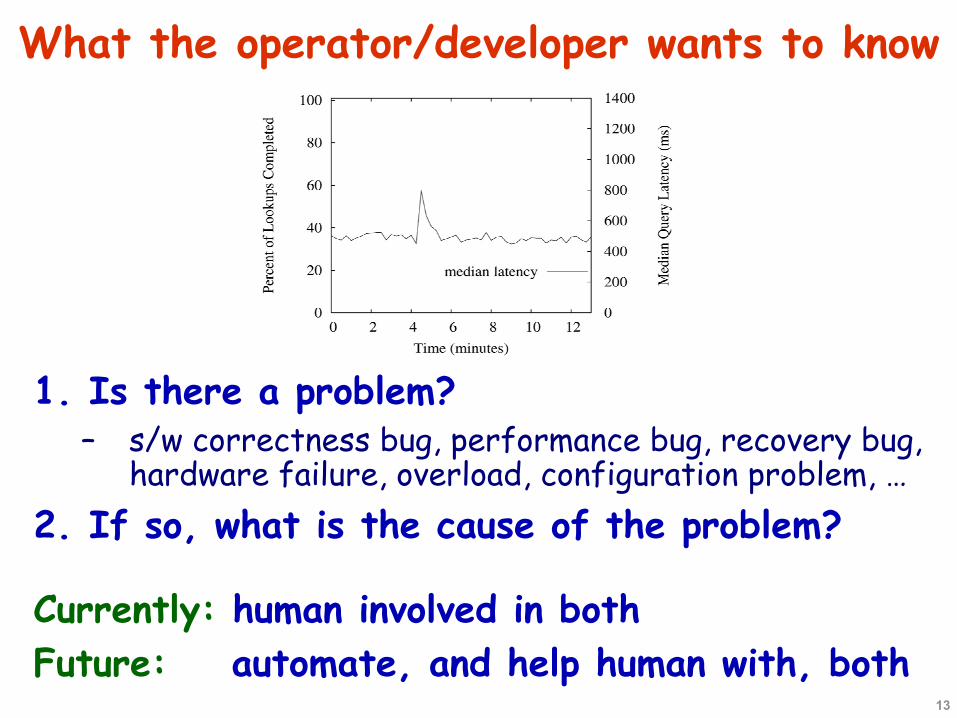
What the operator/developer wants to know
1. Is there a problem?– s/w correctness bug, performance bug, recovery bug,
hardware failure, overload, configuration problem, …2. If so, what is the cause of the problem?
Currently: human involved in both Future: automate, and help human with, both

14
Vision: automatic fault detection• Continuously-running queries that generate alert when exceptional conditions are met– example: avg application response time during last
minute > 1.1 * avg response time during last 10 minutes
SELECT “alert” AS result WHERE(SELECT avg(KR.time-KS.time) FROM KR[Range 1 Minute], KS WHERE KR.id=KS.id) > 1.1 *(SELECT avg(KR.time-KS.time)FROM KR[Range 10 Minute], KS WHERE KR.id=KS.id)
0:0.90 > 1.1 * 0:0.50 ? ALERT!
[now = 11:0.0]
……10:0.0125:0.181timereq id
KS KR
……10:0.9125:0.281timereq id
app-level request sends
app-level response receives

15
Status: essentially implemented(for a few metrics)
• Built on top of event logging + data collection infrastructure used for the benchmarks
• Not yet implemented: threshholding– currently just collects and graphs the data– human generates alert using eyeballs and brain
16
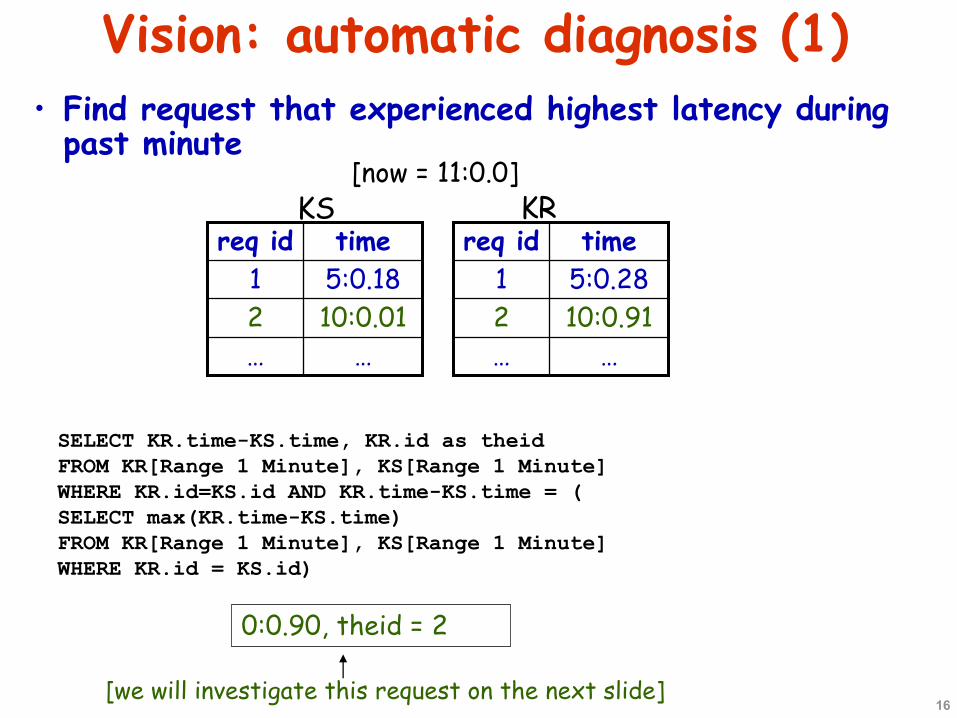
Vision: automatic diagnosis (1)• Find request that experienced highest latency during
past minute[now = 11:0.0]
……10:0.0125:0.181timereq id
KS KR
……10:0.9125:0.281timereq id
SELECT KR.time-KS.time, KR.id as theidFROM KR[Range 1 Minute], KS[Range 1 Minute]WHERE KR.id=KS.id AND KR.time-KS.time = (SELECT max(KR.time-KS.time)FROM KR[Range 1 Minute], KS[Range 1 Minute]WHERE KR.id = KS.id)
0:0.90, theid = 2
[we will investigate this request on the next slide]

17
Vision: automatic diagnosis (2)• How long did it take that message to get from
hop to hop in the overlay? •
IS, IR tables: decentralized routing layer sends/receives
…A……DA…11BA10:0.052
nexthopmetimereq id
A……A…11A…2metimereq id
IS (node A) IR (node A)
…B……EB…13CB…2
nexthopmetimereq id
B……B…23B10:0.852metimereq id
IS (node B) IR (node B)
SELECT IR.time-IS.time as latency, IS.me as sender, IR.me as receiverWHERE IS.nexthop=IR.me AND IS.id = 2 AND IR.id = 2
latency = …, sender = …, receiver = Alatency = 0.80, sender = A, receiver = Blatency = …, sender = B, receiver = …

18
Status: manual “overlay traceroute”• Simple tool to answer previous question
– “How long did it take that message to get from hop to hop in theoverlay?”
• Built on top of event logging+data collection infrastructure used for the benchmarks
• Only one metric: overlay hop-to-hop latency• Synchronizes clocks (currently out-of-band)• Operates passively• No fault injection experiments yet; coming soon
optype reporting_node request_id report_time diff
inject 169.229.50.219 [email protected] 1054576732997161
forward169.229.50.223 [email protected] 1054576732998725 1564
forward169.229.50.213 [email protected] 1054576733008831 10106
forward169.229.50.226 3@:169.229.50.219 1054576733021493 12662
deliver 169.229.50.214 [email protected] 1054576733023786 2293

19
• Benchmarks measure behavioral profile for fixed w/load• Goal is to automate problem detection/diagnosis
– too much data for a human to do it manually• Version 0 (human builds and applies model)
– human detects and diagnosis problems» watch aggregate benchmark metrics, drill down w/ traceroute
• Version 1 (human builds, system applies model)– “tell me when condition X is met”– human defines alarm conditions, system detects when met
• Version 2 (system builds, system applies model)– “tell me when something bad happens, and why/where”– system defines alarm conditions and detects when met (anomaly
detection)• Keep human in loop
– big red button– make model and metrics understandable for human
Building and using behavioral profiles
20
Questions for current/future work• Explore techniques for failure inference/diagnosis
– leverage statistical techniques from Magpie and intrusion detection
• Applicability of statistical techniques from real Internet services to wide-area (need data!!!)
• What is a component?– profile Java object time spent and data accesses
» had undergrads working on this this semester
• Robustness to system flux
• Minimizing code changes to profiled systems
• Handling schema evolution and application-specific metrics– XML suggested yesterday
• Using these techniques for intrusion detection
21
Related work• Closely related to Magpie (MSR Cambridge)
– embrace and extend» larger, geographically distributed systems» explore more models and techniques for change detection
• Part 2 has some relationship to Pinpoint– but larger, geographically distributed systems– adds latency profiles– adds per-component metrics – means very different data collection techniques and
types of analyses
• Various distributed query processors
• Remote monitoring of instrumented software

22
Conclusion and status• Existing data collection/analysis techniques not sufficiently robust and scalable for very large systems in constant flux– currently: collect data in per-node logs, aggregate on
central node for analysis– future: decentralized storage, query, analysis
• Detecting and diagnosing problems is hard– currently: collect aggregate metrics (latency,
consistency, bandwidth consumed) and per-request metrics (hop-to-hop overlay latencies)
– future: online data collection, aggregation, analysis; automatically distinguish normal from abnormal component and request statistics (anomaly detection)
• Initial application targets– DHTs: Bamboo, Tapestry– applications: Seagull, (Palimpsest), other suggestions??