Embed Size (px)
Citation preview
C
PmC
M
SA
ICa
0h
omplementary Therapies in Medicine (2013) 21, 364—378
Available online at www.sciencedirect.com
j ourna l ho me pa g e: www.elsev ierhea l th .com/ journa ls /c t im
rofile of the complementary and alternativeedicine workforce across Australia, New Zealand,anada, United States and United Kingdom
atthew J. Leach ∗
chool of Nursing & Midwifery, University of South Australia, North Terrace, Adelaide, South Australia 5000, Australiavailable online 23 May 2013
KEYWORDSCensus;Complementary andalternative medicine;Health services;Workforce
SummaryBackground: Despite the expressed demand for complementary and alternative medicine (CAM)services in developed countries, little is known about the CAM workforce in terms of supply andcomposition.Objective: To describe the CAM workforce across five developed countries to better informhealth workforce and health services planning, and perchance, inform debate on future publichealth and primary care policy.Methods: Data from the Australian, New Zealand, Canadian, UK and US Censuses of popula-tion were interrogated for information pertaining to the size and characteristics of the CAMworkforce. This was supplemented by other population-level workforce data where available.Results: The quality and availability of population-level data on the CAM workforce vary sub-stantially across nations. Of the nine CAM disciplines explored, massage therapy consistentlycomprised the largest portion of the CAM workforce, followed closely by chiropractic. Disci-plines in shortest supply were homoeopathy in Australia, traditional Chinese medicine in NewZealand, and naturopathy in the US. Across the broader CAM workforce, practitioners weretypically female, aged ≥40 years, worked within a primary care setting, held a vocational orhigher education level qualification, worked full-time, and earned <$1000 gross per week.Conclusions: This work has helped shape current understandings of the CAM workforce. In doing
so, it will help to inform the training and continuing education needs of the evolving CAMworkforce, and further, ensure the provision of a competent CAM workforce to service theneeds of consumers. Addressing the many limitations of existing data sources will assist inmeeting these needs.hts re
© 2013 Elsevier Ltd. All rigntroductionomplementary and alternative medicine (CAM) represents
diverse range of health-related therapies and interven-
∗ Tel.: +61 8 8302 2846; fax: +61 8 8302 2168.E-mail address: [email protected]
toaopAt
965-2299/$ — see front matter © 2013 Elsevier Ltd. All rights reserved.ttp://dx.doi.org/10.1016/j.ctim.2013.04.004
served.
ions that are largely considered to be outside the realmf Western medicine. Consumer interest in complementarynd alternative medicines and CAM services has increased
ver the past decade. Recent data indicate that a large pro-ortion of the population of developed countries,1 includingustralia (52—69% of those surveyed),2,3 Canada (59—60%),4he United States (62%),5 Singapore (76%)6 and Japan (50%),7
wNS
comtCmmk
bfUeBS2fBgwscptmqpwpirfida
qctd
R
Q
TvCdpoawo
Profile of the CAM workforce
have used CAM at least once over a twelve-month period.Over the same period of time, close to twelve percent ofCanadian adults,8 sixteen percent of US adults,9 twenty-sixpercent of English adults,10 and twenty-three11 to forty-fourpercent of Australians3 had consulted a CAM practitioner,with massage being the most commonly used service.
Even though a comparatively greater proportion of thepopulation of developed countries visit Western medicalpractitioners (i.e. >77%) than CAM practitioners,12,13 thereis surprisingly little difference in the total number and costof visits between groups, at least in Australia. For instance,in 2005, Australian adults made an estimated 69.2 millionvisits to CAM practitioners, at an estimated cost of AU$1.73billion. In the same year, there were approximately 68.9 mil-lion consults with Western medical practitioners, at a totalcost of AU$1.6 billion.3 In the US, the out-of pocket costsfor CAM services are far less than Western medical care. In2007, US adults made 354.2 million visits to CAM practition-ers, at an estimated out-of-pocket cost of US$11.9 billion14;the out-of-pocket cost of Western physician services in thesame year was $US46.8 billion.15 These data provide clearevidence of expressed demand for CAM services in developedcountries, which is not too dissimilar from the expresseddemand for Western medical services.
There are several explanations for the increasing useof complementary medicines and CAM services across theglobe.2,9 Earlier studies have suggested that consumer dis-satisfaction with Western medicine may be a leading reasonfor CAM use1; however, more recent reports indicate that anaspiration for active health-care participation, greater dis-ease chronicity and severity, holistic health-care beliefs, andan increase in health-awareness behaviour are more likelyto be associated with CAM use.16—18 These transformationsin consumer attitude and health behaviour have paralleledchanges in the way many CAM specialties practice.19 Thissuggests that complementary medicines and CAM servicesare addressing unmet needs in health care.
Despite the increasing demand and need for CAM servicesin developed countries, little is known about the CAM work-force in terms of supply and composition; and apart froma few workforce surveys, which are hampered by narrowscope, limited data, poor response rates, and/or moderate-sized convenience samples,20—23 little has been published inthe public domain. Without knowledge of the compositionof the CAM workforce, it is difficult to (1) understand thediversity and characteristics of the CAM workforce, (2) meetthe training and continuing education needs of the evolvingCAM workforce, and (3) ensure the provision of a compe-tent CAM workforce to service the needs of consumers. Inrecognising these concerns, this article describes the CAMworkforce across five developed countries in order to bet-ter inform health workforce and health services planning,and perchance, inform debate on future public health andprimary care policy.
Methods
Geographical regions were limited to organisation for eco-
nomic cooperation and development (OECD) countries asthe increasing demand for CAM is largely reported in thesedeveloped nations. Of these countries, only those that pro-vided publicly accessible census data on the CAM workforcesomf
365
ere considered. Five countries were selected: Australia,ew Zealand, Canada, United Kingdom and the Unitedtates.
The CAM workforce was defined as any health service notonsidered a core component of Western medicine, nursingr allied health,24 and delivered in any industry of employ-ent. This included, but was not limited to, system-based
herapies (e.g. naturopathy, herbal medicine, traditionalhinese medicine [TCM], acupuncture, homoeopathy) andanipulative therapies (e.g. chiropractic, osteopathy andassage therapy). Diagnostic techniques (e.g. iridology,
inesiology) were excluded.Census data were acquisitioned by request where possi-
le (e.g. Australia and New Zealand), and where requestsor data were not feasible or cost-prohibitive (e.g. UK,S and Canada), data were sourced from the websites ofach census administrator. Data from the 2006 Australianureau of Statistics Census of Population and Housing, 2006tatistics New Zealand Census of Population and Dwellings,006 Statistics Canada Census of Population, 2001 UK Officeor National Statistics Census, and the 2000 US Censusureau Census of Population and Housing were interro-ated for information pertaining to the size of the CAMorkforce, as well as key characteristics of the workforce,
uch as age, sex, primary discipline, highest level of edu-ation attained, industry of employment, hours workeder week, and gross weekly income. These five popula-ion censuses were selected as they employed similar studyethods, used comparable survey items, and provided high-uality data that were highly representative of each nationalopulation (Table 1). Where possible, census informationas supplemented by workforce data reported by otherertinent sources where the publication date closely approx-mated the census date of the selected country. While moreecent censuses have been conducted across four of theve selected countries (i.e. Australia, Canada, UK and US),etailed occupation data were not publicly available fromny of these censuses during the conduct of the project.
Available data were analysed descriptively using fre-uencies and percentages. Workforce populations wereonverted to patient-provider ratios to allow for interna-ional comparisons. General/family practitioner populationata were included as a point of reference only.
esults
uality of CAM workforce data
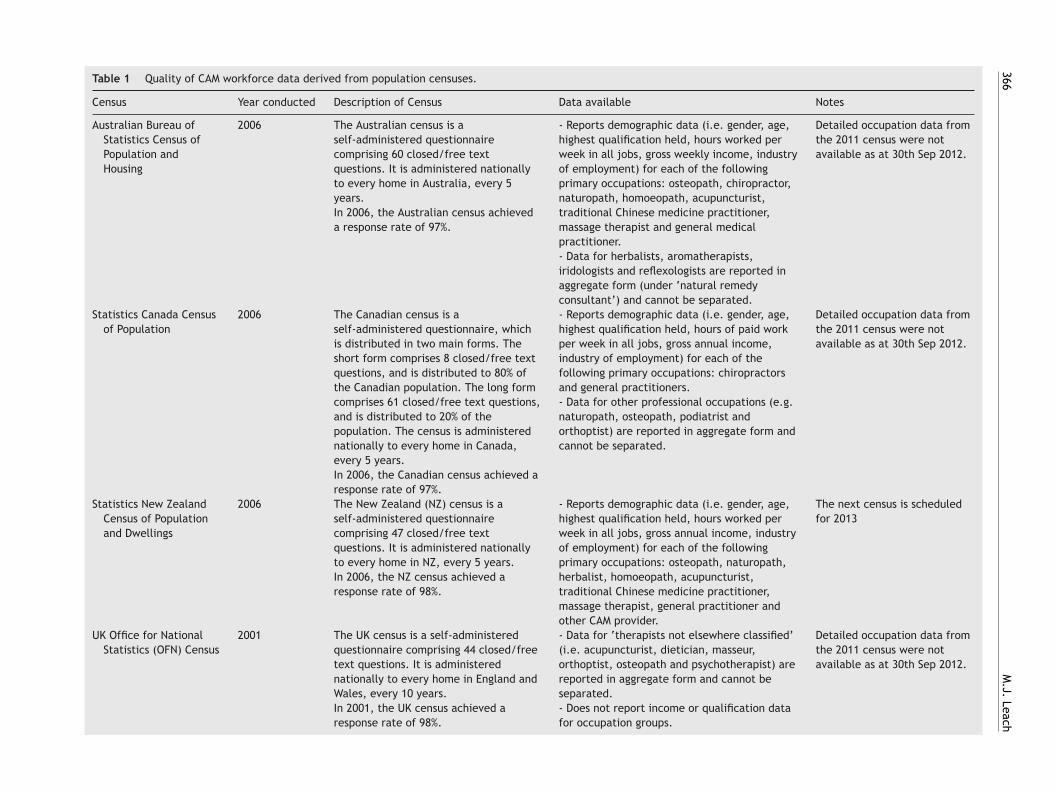
he Australian and New Zealand Census of population pro-ided the most comprehensive population-level data on theAM workforce; although, data were only available for sevenistinct CAM disciplines (Table 1). The Canadian Census ofopulation provided data for most fields of interest, butnly for chiropractors and general practitioners. Data forll other CAM occupations were reported in aggregate formith other non-CAM occupations and were not useful forccupation-specific workforce planning. US population cen-
us data were limited, with data available for only few fieldsf interest for chiropractors and massage therapists; data forost fields had to be sourced from workforce surveys. Dataor all other occupations were reported in aggregate form
366
M.J.
Leach
Table 1 Quality of CAM workforce data derived from population censuses.
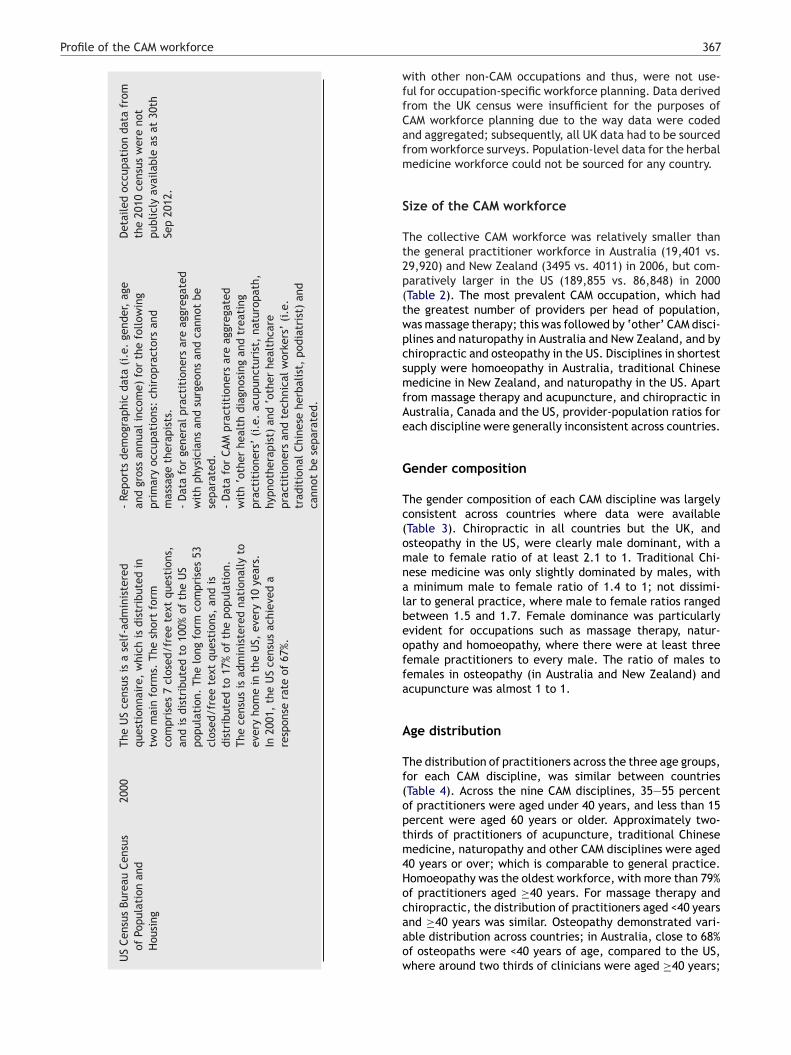
Census Year conducted Description of Census Data available Notes
Australian Bureau ofStatistics Census ofPopulation andHousing
2006 The Australian census is aself-administered questionnairecomprising 60 closed/free textquestions. It is administered nationallyto every home in Australia, every 5years.In 2006, the Australian census achieveda response rate of 97%.
- Reports demographic data (i.e. gender, age,highest qualification held, hours worked perweek in all jobs, gross weekly income, industryof employment) for each of the followingprimary occupations: osteopath, chiropractor,naturopath, homoeopath, acupuncturist,traditional Chinese medicine practitioner,massage therapist and general medicalpractitioner.- Data for herbalists, aromatherapists,iridologists and reflexologists are reported inaggregate form (under ‘natural remedyconsultant’) and cannot be separated.
Detailed occupation data fromthe 2011 census were notavailable as at 30th Sep 2012.
Statistics Canada Censusof Population
2006 The Canadian census is aself-administered questionnaire, whichis distributed in two main forms. Theshort form comprises 8 closed/free textquestions, and is distributed to 80% ofthe Canadian population. The long formcomprises 61 closed/free text questions,and is distributed to 20% of thepopulation. The census is administerednationally to every home in Canada,every 5 years.In 2006, the Canadian census achieved aresponse rate of 97%.
- Reports demographic data (i.e. gender, age,highest qualification held, hours of paid workper week in all jobs, gross annual income,industry of employment) for each of thefollowing primary occupations: chiropractorsand general practitioners.- Data for other professional occupations (e.g.naturopath, osteopath, podiatrist andorthoptist) are reported in aggregate form andcannot be separated.
Detailed occupation data fromthe 2011 census were notavailable as at 30th Sep 2012.
Statistics New ZealandCensus of Populationand Dwellings
2006 The New Zealand (NZ) census is aself-administered questionnairecomprising 47 closed/free textquestions. It is administered nationallyto every home in NZ, every 5 years.In 2006, the NZ census achieved aresponse rate of 98%.
- Reports demographic data (i.e. gender, age,highest qualification held, hours worked perweek in all jobs, gross annual income, industryof employment) for each of the followingprimary occupations: osteopath, naturopath,herbalist, homoeopath, acupuncturist,traditional Chinese medicine practitioner,massage therapist, general practitioner andother CAM provider.
The next census is scheduledfor 2013
UK Office for NationalStatistics (OFN) Census
2001 The UK census is a self-administeredquestionnaire comprising 44 closed/freetext questions. It is administerednationally to every home in England andWales, every 10 years.In 2001, the UK census achieved aresponse rate of 98%.
- Data for ‘therapists not elsewhere classified’(i.e. acupuncturist, dietician, masseur,orthoptist, osteopath and psychotherapist) arereported in aggregate form and cannot beseparated.- Does not report income or qualification datafor occupation groups.
Detailed occupation data fromthe 2011 census were notavailable as at 30th Sep 2012.
Profile of the CAM workforce
US
Cens
us
Bure
au
Cens
usof
Popu
lati
on
and
Hou
sing
2000
The
US
cens
us
is
a
self
-adm
inis
tere
dqu
esti
onna
ire,
whi
ch
is
dist
ribu
ted
intw
o
mai
n
form
s.
The
shor
t
form
com
pris
es
7
clos
ed/f
ree
text
ques
tion
s,an
d
is
dist
ribu
ted
to
100%
of
the
US
popu
lati
on.
The
long
form
com
pris
es
53cl
osed
/fre
e
text
ques
tion
s,
and
isdi
stri
bute
d
to
17%
of
the
popu
lati
on.
The
cens
us
is
adm
inis
tere
d
nati
onal
ly
toev
ery
hom
e
in
the
US,
ever
y
10
year
s.In
2001
,
the
US
cens
us
achi
eved
are
spon
se
rate
of
67%.
-
Repo
rts
dem
ogra
phic
data
(i.e
.
gend
er,
age
and
gros
s
annu
al
inco
me)
for
the
follo
win
gpr
imar
y
occu
pati
ons:
chir
opra
ctor
s
and
mas
sage
ther
apis
ts.
-
Dat
a
for
gene
ral p
ract
itio
ners
are
aggr
egat
edw
ith
phys
icia
ns
and
surg
eons
and
cann
ot
bese
para
ted.
-
Dat
a
for
CAM
prac
titi
oner
s
are
aggr
egat
edw
ith
‘oth
er
heal
th
diag
nosi
ng
and
trea
ting
prac
titi
oner
s’
(i.e
.
acup
unct
uris
t,
natu
ropa
th,
hypn
othe
rapi
st)
and
‘oth
er
heal
thca
repr
acti
tion
ers
and
tech
nica
l wor
kers
’
(i.e
.tr
adit
iona
l Chi
nese
herb
alis
t,
podi
atri
st)
and
cann
ot
be
sepa
rate
d.
Det
aile
d
occu
pati
on
data
from
the
2010
cens
us
wer
e no
tpu
blic
ly
avai
labl
e as
at
30th
Sep
2012
.
wffCafm
S
Tt2p(twpcsmfAe
G
Tc(omnalbeoffa
A
Tf(optm4Hocaaow
367
ith other non-CAM occupations and thus, were not use-ul for occupation-specific workforce planning. Data derivedrom the UK census were insufficient for the purposes ofAM workforce planning due to the way data were codednd aggregated; subsequently, all UK data had to be sourcedrom workforce surveys. Population-level data for the herbaledicine workforce could not be sourced for any country.
ize of the CAM workforce
he collective CAM workforce was relatively smaller thanhe general practitioner workforce in Australia (19,401 vs.9,920) and New Zealand (3495 vs. 4011) in 2006, but com-aratively larger in the US (189,855 vs. 86,848) in 2000Table 2). The most prevalent CAM occupation, which hadhe greatest number of providers per head of population,as massage therapy; this was followed by ‘other’ CAM disci-lines and naturopathy in Australia and New Zealand, and byhiropractic and osteopathy in the US. Disciplines in shortestupply were homoeopathy in Australia, traditional Chineseedicine in New Zealand, and naturopathy in the US. Apart
rom massage therapy and acupuncture, and chiropractic inustralia, Canada and the US, provider-population ratios forach discipline were generally inconsistent across countries.
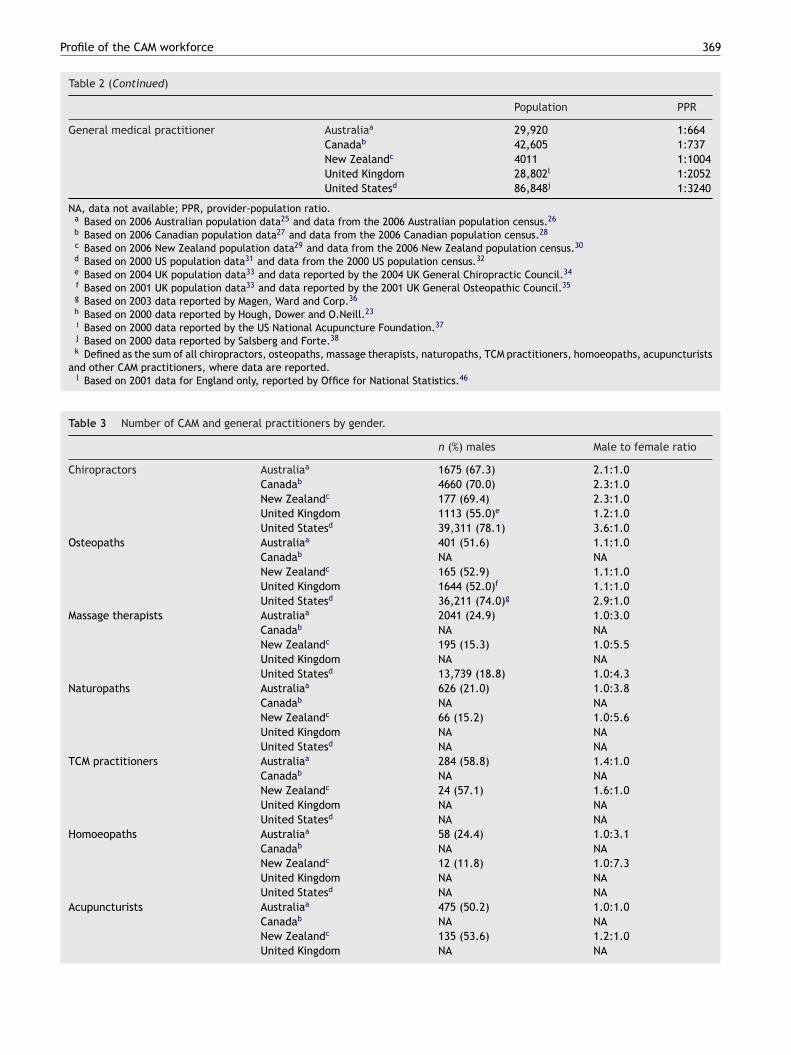
ender composition
he gender composition of each CAM discipline was largelyonsistent across countries where data were availableTable 3). Chiropractic in all countries but the UK, andsteopathy in the US, were clearly male dominant, with aale to female ratio of at least 2.1 to 1. Traditional Chi-
ese medicine was only slightly dominated by males, with minimum male to female ratio of 1.4 to 1; not dissimi-ar to general practice, where male to female ratios rangedetween 1.5 and 1.7. Female dominance was particularlyvident for occupations such as massage therapy, natur-pathy and homoeopathy, where there were at least threeemale practitioners to every male. The ratio of males toemales in osteopathy (in Australia and New Zealand) andcupuncture was almost 1 to 1.
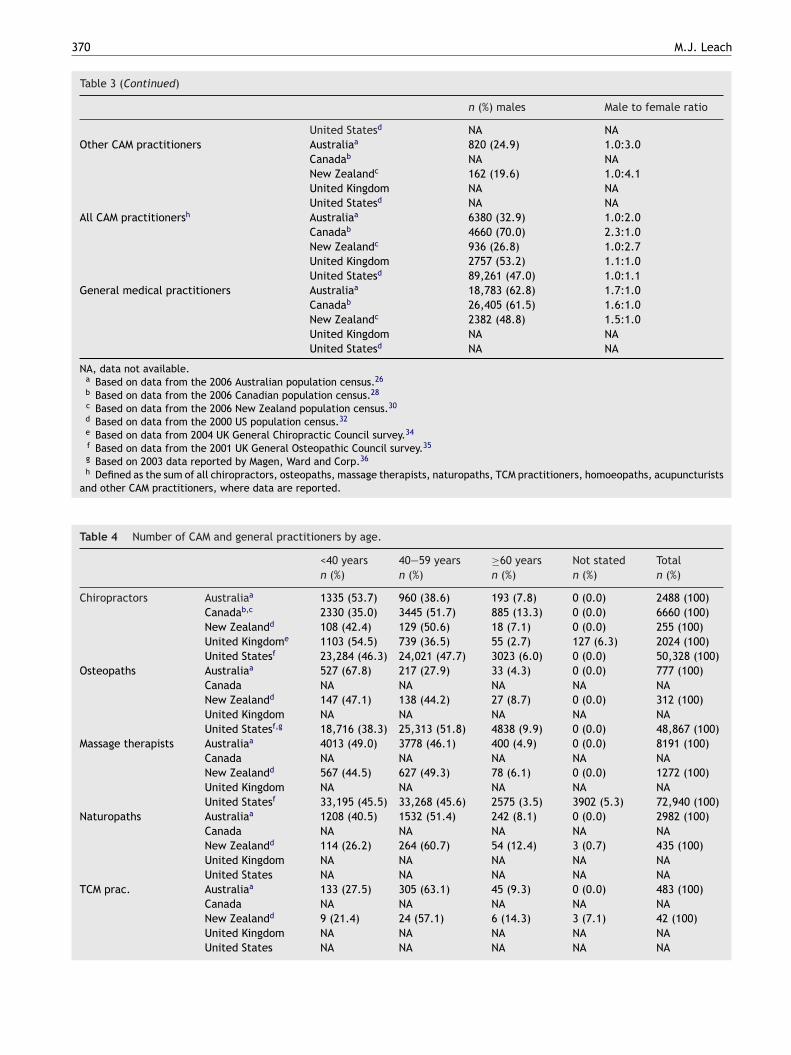
ge distribution
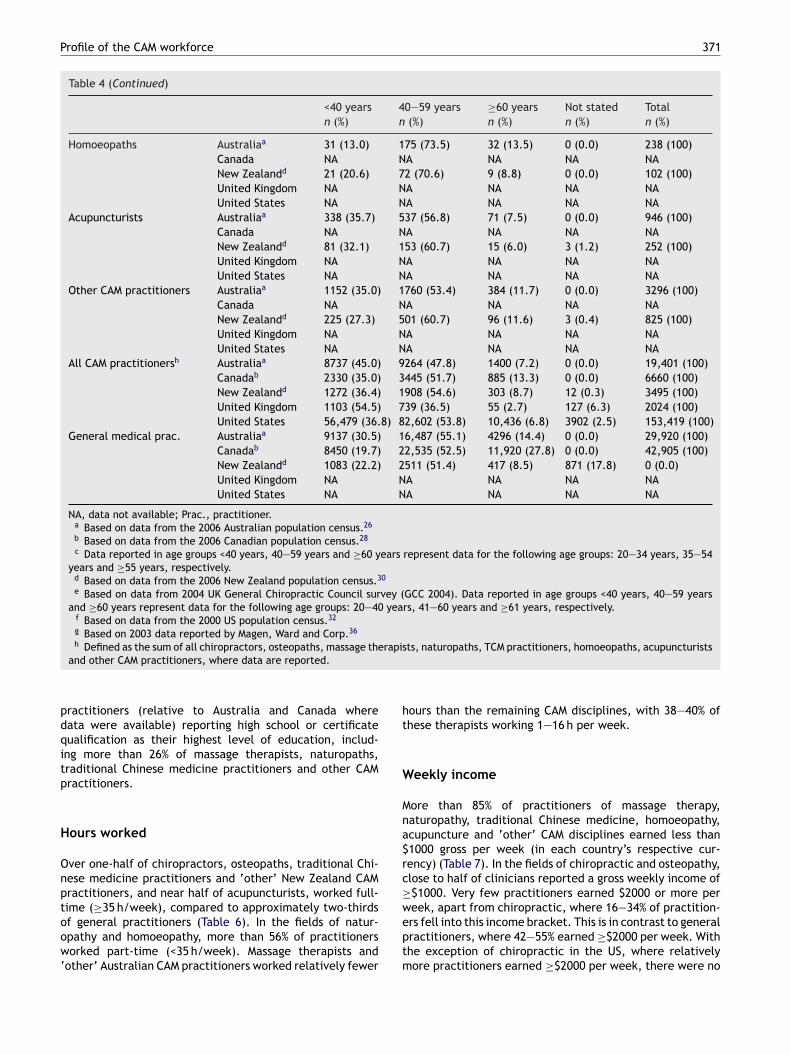
he distribution of practitioners across the three age groups,or each CAM discipline, was similar between countriesTable 4). Across the nine CAM disciplines, 35—55 percentf practitioners were aged under 40 years, and less than 15ercent were aged 60 years or older. Approximately two-hirds of practitioners of acupuncture, traditional Chineseedicine, naturopathy and other CAM disciplines were aged
0 years or over; which is comparable to general practice.omoeopathy was the oldest workforce, with more than 79%f practitioners aged ≥40 years. For massage therapy andhiropractic, the distribution of practitioners aged <40 years
nd ≥40 years was similar. Osteopathy demonstrated vari-ble distribution across countries; in Australia, close to 68%f osteopaths were <40 years of age, compared to the US,here around two thirds of clinicians were aged ≥40 years;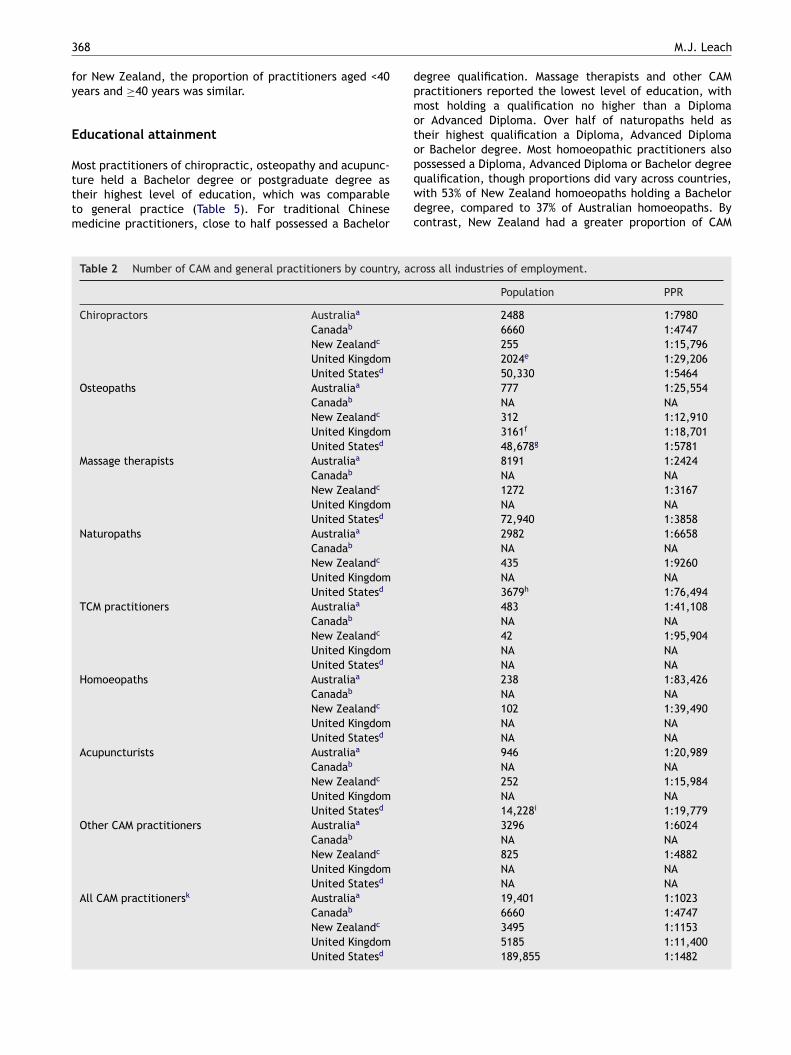
3
fy
E
Mtttm
dpmotop
68
or New Zealand, the proportion of practitioners aged <40ears and ≥40 years was similar.
ducational attainment
ost practitioners of chiropractic, osteopathy and acupunc-
ure held a Bachelor degree or postgraduate degree asheir highest level of education, which was comparableo general practice (Table 5). For traditional Chineseedicine practitioners, close to half possessed a Bachelorqwdc
Table 2 Number of CAM and general practitioners by country, ac
Chiropractors Australiaa
Canadab
New Zealandc
United Kingdom
United Statesd
Osteopaths Australiaa
Canadab
New Zealandc
United Kingdom
United Statesd
Massage therapists Australiaa
Canadab
New Zealandc
United Kingdom
United Statesd
Naturopaths Australiaa
Canadab
New Zealandc
United KingdomUnited Statesd
TCM practitioners Australiaa
Canadab
New Zealandc
United Kingdom
United Statesd
Homoeopaths Australiaa
Canadab
New Zealandc
United Kingdom
United Statesd
Acupuncturists Australiaa
Canadab
New Zealandc
United Kingdom
United Statesd
Other CAM practitioners Australiaa
Canadab
New Zealandc
United Kingdom
United Statesd
All CAM practitionersk Australiaa
Canadab
New Zealandc
United Kingdom
United Statesd
M.J. Leach
egree qualification. Massage therapists and other CAMractitioners reported the lowest level of education, withost holding a qualification no higher than a Diploma
r Advanced Diploma. Over half of naturopaths held asheir highest qualification a Diploma, Advanced Diplomar Bachelor degree. Most homoeopathic practitioners alsoossessed a Diploma, Advanced Diploma or Bachelor degree
ualification, though proportions did vary across countries,ith 53% of New Zealand homoeopaths holding a Bacheloregree, compared to 37% of Australian homoeopaths. Byontrast, New Zealand had a greater proportion of CAMross all industries of employment.
Population PPR
2488 1:79806660 1:4747255 1:15,7962024e 1:29,20650,330 1:5464777 1:25,554NA NA312 1:12,9103161f 1:18,70148,678g 1:57818191 1:2424NA NA1272 1:3167NA NA72,940 1:38582982 1:6658NA NA435 1:9260NA NA3679h 1:76,494483 1:41,108NA NA42 1:95,904NA NANA NA238 1:83,426NA NA102 1:39,490NA NANA NA946 1:20,989NA NA252 1:15,984NA NA14,228i 1:19,7793296 1:6024NA NA825 1:4882NA NANA NA19,401 1:10236660 1:47473495 1:11535185 1:11,400189,855 1:1482
Profile of the CAM workforce 369
Table 2 (Continued)
Population PPR
General medical practitioner Australiaa 29,920 1:664Canadab 42,605 1:737New Zealandc 4011 1:1004United Kingdom 28,802l 1:2052United Statesd 86,848j 1:3240
NA, data not available; PPR, provider-population ratio.a Based on 2006 Australian population data25 and data from the 2006 Australian population census.26
b Based on 2006 Canadian population data27 and data from the 2006 Canadian population census.28
c Based on 2006 New Zealand population data29 and data from the 2006 New Zealand population census.30
d Based on 2000 US population data31 and data from the 2000 US population census.32
e Based on 2004 UK population data33 and data reported by the 2004 UK General Chiropractic Council.34
f Based on 2001 UK population data33 and data reported by the 2001 UK General Osteopathic Council.35
g Based on 2003 data reported by Magen, Ward and Corp.36
h Based on 2000 data reported by Hough, Dower and O.Neill.23
i Based on 2000 data reported by the US National Acupuncture Foundation.37
j Based on 2000 data reported by Salsberg and Forte.38
k Defined as the sum of all chiropractors, osteopaths, massage therapists, naturopaths, TCM practitioners, homoeopaths, acupuncturistsand other CAM practitioners, where data are reported.
l Based on 2001 data for England only, reported by Office for National Statistics.46
Table 3 Number of CAM and general practitioners by gender.
n (%) males Male to female ratio
Chiropractors Australiaa 1675 (67.3) 2.1:1.0Canadab 4660 (70.0) 2.3:1.0New Zealandc 177 (69.4) 2.3:1.0United Kingdom 1113 (55.0)e 1.2:1.0United Statesd 39,311 (78.1) 3.6:1.0
Osteopaths Australiaa 401 (51.6) 1.1:1.0Canadab NA NANew Zealandc 165 (52.9) 1.1:1.0United Kingdom 1644 (52.0)f 1.1:1.0United Statesd 36,211 (74.0)g 2.9:1.0
Massage therapists Australiaa 2041 (24.9) 1.0:3.0Canadab NA NANew Zealandc 195 (15.3) 1.0:5.5United Kingdom NA NAUnited Statesd 13,739 (18.8) 1.0:4.3
Naturopaths Australiaa 626 (21.0) 1.0:3.8Canadab NA NANew Zealandc 66 (15.2) 1.0:5.6United Kingdom NA NAUnited Statesd NA NA
TCM practitioners Australiaa 284 (58.8) 1.4:1.0Canadab NA NANew Zealandc 24 (57.1) 1.6:1.0United Kingdom NA NAUnited Statesd NA NA
Homoeopaths Australiaa 58 (24.4) 1.0:3.1Canadab NA NANew Zealandc 12 (11.8) 1.0:7.3United Kingdom NA NAUnited Statesd NA NA
Acupuncturists Australiaa 475 (50.2) 1.0:1.0Canadab NA NANew Zealandc 135 (53.6) 1.2:1.0United Kingdom NA NA
370 M.J. Leach
Table 3 (Continued)
n (%) males Male to female ratio
United Statesd NA NAOther CAM practitioners Australiaa 820 (24.9) 1.0:3.0
Canadab NA NANew Zealandc 162 (19.6) 1.0:4.1United Kingdom NA NAUnited Statesd NA NA
All CAM practitionersh Australiaa 6380 (32.9) 1.0:2.0Canadab 4660 (70.0) 2.3:1.0New Zealandc 936 (26.8) 1.0:2.7United Kingdom 2757 (53.2) 1.1:1.0United Statesd 89,261 (47.0) 1.0:1.1
General medical practitioners Australiaa 18,783 (62.8) 1.7:1.0Canadab 26,405 (61.5) 1.6:1.0New Zealandc 2382 (48.8) 1.5:1.0United Kingdom NA NAUnited Statesd NA NA
NA, data not available.a Based on data from the 2006 Australian population census.26
b Based on data from the 2006 Canadian population census.28
c Based on data from the 2006 New Zealand population census.30
d Based on data from the 2000 US population census.32
e Based on data from 2004 UK General Chiropractic Council survey.34
f Based on data from the 2001 UK General Osteopathic Council survey.35
g Based on 2003 data reported by Magen, Ward and Corp.36
h Defined as the sum of all chiropractors, osteopaths, massage therapists, naturopaths, TCM practitioners, homoeopaths, acupuncturistsand other CAM practitioners, where data are reported.
Table 4 Number of CAM and general practitioners by age.
<40 years 40—59 years ≥60 years Not stated Totaln (%) n (%) n (%) n (%) n (%)
Chiropractors Australiaa 1335 (53.7) 960 (38.6) 193 (7.8) 0 (0.0) 2488 (100)Canadab,c 2330 (35.0) 3445 (51.7) 885 (13.3) 0 (0.0) 6660 (100)New Zealandd 108 (42.4) 129 (50.6) 18 (7.1) 0 (0.0) 255 (100)United Kingdome 1103 (54.5) 739 (36.5) 55 (2.7) 127 (6.3) 2024 (100)United Statesf 23,284 (46.3) 24,021 (47.7) 3023 (6.0) 0 (0.0) 50,328 (100)
Osteopaths Australiaa 527 (67.8) 217 (27.9) 33 (4.3) 0 (0.0) 777 (100)Canada NA NA NA NA NANew Zealandd 147 (47.1) 138 (44.2) 27 (8.7) 0 (0.0) 312 (100)United Kingdom NA NA NA NA NAUnited Statesf,g 18,716 (38.3) 25,313 (51.8) 4838 (9.9) 0 (0.0) 48,867 (100)
Massage therapists Australiaa 4013 (49.0) 3778 (46.1) 400 (4.9) 0 (0.0) 8191 (100)Canada NA NA NA NA NANew Zealandd 567 (44.5) 627 (49.3) 78 (6.1) 0 (0.0) 1272 (100)United Kingdom NA NA NA NA NAUnited Statesf 33,195 (45.5) 33,268 (45.6) 2575 (3.5) 3902 (5.3) 72,940 (100)
Naturopaths Australiaa 1208 (40.5) 1532 (51.4) 242 (8.1) 0 (0.0) 2982 (100)Canada NA NA NA NA NANew Zealandd 114 (26.2) 264 (60.7) 54 (12.4) 3 (0.7) 435 (100)United Kingdom NA NA NA NA NAUnited States NA NA NA NA NA
TCM prac. Australiaa 133 (27.5) 305 (63.1) 45 (9.3) 0 (0.0) 483 (100)Canada NA NA NA NA NANew Zealandd 9 (21.4) 24 (57.1) 6 (14.3) 3 (7.1) 42 (100)United Kingdom NA NA NA NA NAUnited States NA NA NA NA NA
Profile of the CAM workforce 371
Table 4 (Continued)
<40 years 40—59 years ≥60 years Not stated Totaln (%) n (%) n (%) n (%) n (%)
Homoeopaths Australiaa 31 (13.0) 175 (73.5) 32 (13.5) 0 (0.0) 238 (100)Canada NA NA NA NA NANew Zealandd 21 (20.6) 72 (70.6) 9 (8.8) 0 (0.0) 102 (100)United Kingdom NA NA NA NA NAUnited States NA NA NA NA NA
Acupuncturists Australiaa 338 (35.7) 537 (56.8) 71 (7.5) 0 (0.0) 946 (100)Canada NA NA NA NA NANew Zealandd 81 (32.1) 153 (60.7) 15 (6.0) 3 (1.2) 252 (100)United Kingdom NA NA NA NA NAUnited States NA NA NA NA NA
Other CAM practitioners Australiaa 1152 (35.0) 1760 (53.4) 384 (11.7) 0 (0.0) 3296 (100)Canada NA NA NA NA NANew Zealandd 225 (27.3) 501 (60.7) 96 (11.6) 3 (0.4) 825 (100)United Kingdom NA NA NA NA NAUnited States NA NA NA NA NA
All CAM practitionersh Australiaa 8737 (45.0) 9264 (47.8) 1400 (7.2) 0 (0.0) 19,401 (100)Canadab 2330 (35.0) 3445 (51.7) 885 (13.3) 0 (0.0) 6660 (100)New Zealandd 1272 (36.4) 1908 (54.6) 303 (8.7) 12 (0.3) 3495 (100)United Kingdom 1103 (54.5) 739 (36.5) 55 (2.7) 127 (6.3) 2024 (100)United States 56,479 (36.8) 82,602 (53.8) 10,436 (6.8) 3902 (2.5) 153,419 (100)
General medical prac. Australiaa 9137 (30.5) 16,487 (55.1) 4296 (14.4) 0 (0.0) 29,920 (100)Canadab 8450 (19.7) 22,535 (52.5) 11,920 (27.8) 0 (0.0) 42,905 (100)New Zealandd 1083 (22.2) 2511 (51.4) 417 (8.5) 871 (17.8) 0 (0.0)United Kingdom NA NA NA NA NAUnited States NA NA NA NA NA
NA, data not available; Prac., practitioner.a Based on data from the 2006 Australian population census.26
b Based on data from the 2006 Canadian population census.28
c Data reported in age groups <40 years, 40—59 years and ≥60 years represent data for the following age groups: 20—34 years, 35—54years and ≥55 years, respectively.
d Based on data from the 2006 New Zealand population census.30
e Based on data from 2004 UK General Chiropractic Council survey (GCC 2004). Data reported in age groups <40 years, 40—59 yearsand ≥60 years represent data for the following age groups: 20—40 years, 41—60 years and ≥61 years, respectively.
f Based on data from the 2000 US population census.32
g Based on 2003 data reported by Magen, Ward and Corp.36
h Defined as the sum of all chiropractors, osteopaths, massage therapists, naturopaths, TCM practitioners, homoeopaths, acupuncturists
ht
W
Mna$rc≥w
and other CAM practitioners, where data are reported.
practitioners (relative to Australia and Canada wheredata were available) reporting high school or certificatequalification as their highest level of education, includ-ing more than 26% of massage therapists, naturopaths,traditional Chinese medicine practitioners and other CAMpractitioners.
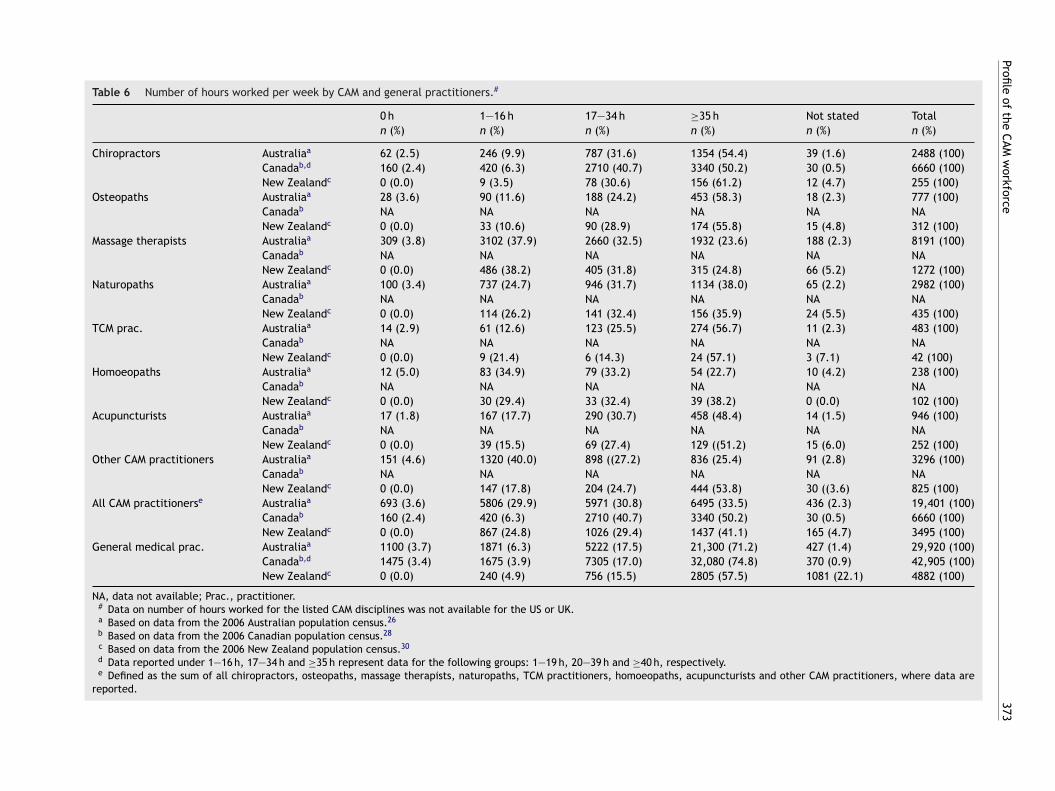
Hours worked
Over one-half of chiropractors, osteopaths, traditional Chi-nese medicine practitioners and ‘other’ New Zealand CAMpractitioners, and near half of acupuncturists, worked full-time (≥35 h/week), compared to approximately two-thirds
of general practitioners (Table 6). In the fields of natur-opathy and homoeopathy, more than 56% of practitionersworked part-time (<35 h/week). Massage therapists and‘other’ Australian CAM practitioners worked relatively fewereptm
ours than the remaining CAM disciplines, with 38—40% ofhese therapists working 1—16 h per week.
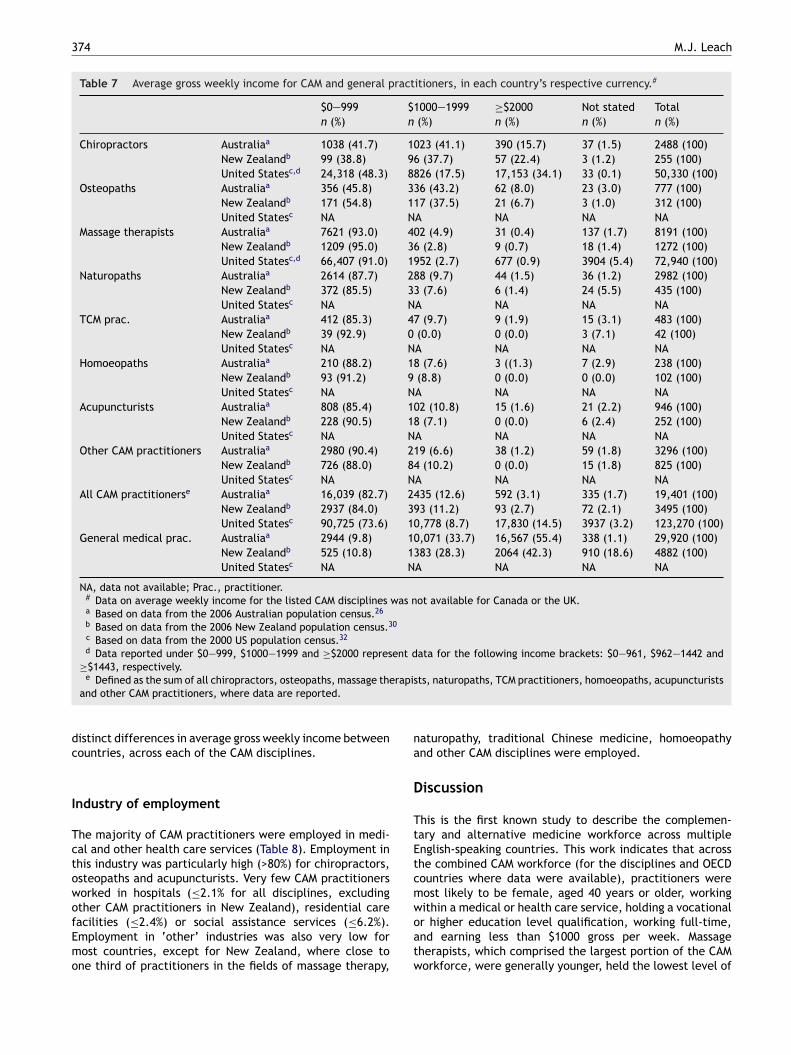
eekly income
ore than 85% of practitioners of massage therapy,aturopathy, traditional Chinese medicine, homoeopathy,cupuncture and ‘other’ CAM disciplines earned less than1000 gross per week (in each country’s respective cur-ency) (Table 7). In the fields of chiropractic and osteopathy,lose to half of clinicians reported a gross weekly income of$1000. Very few practitioners earned $2000 or more pereek, apart from chiropractic, where 16—34% of practition-
rs fell into this income bracket. This is in contrast to generalractitioners, where 42—55% earned ≥$2000 per week. Withhe exception of chiropractic in the US, where relativelyore practitioners earned ≥$2000 per week, there were no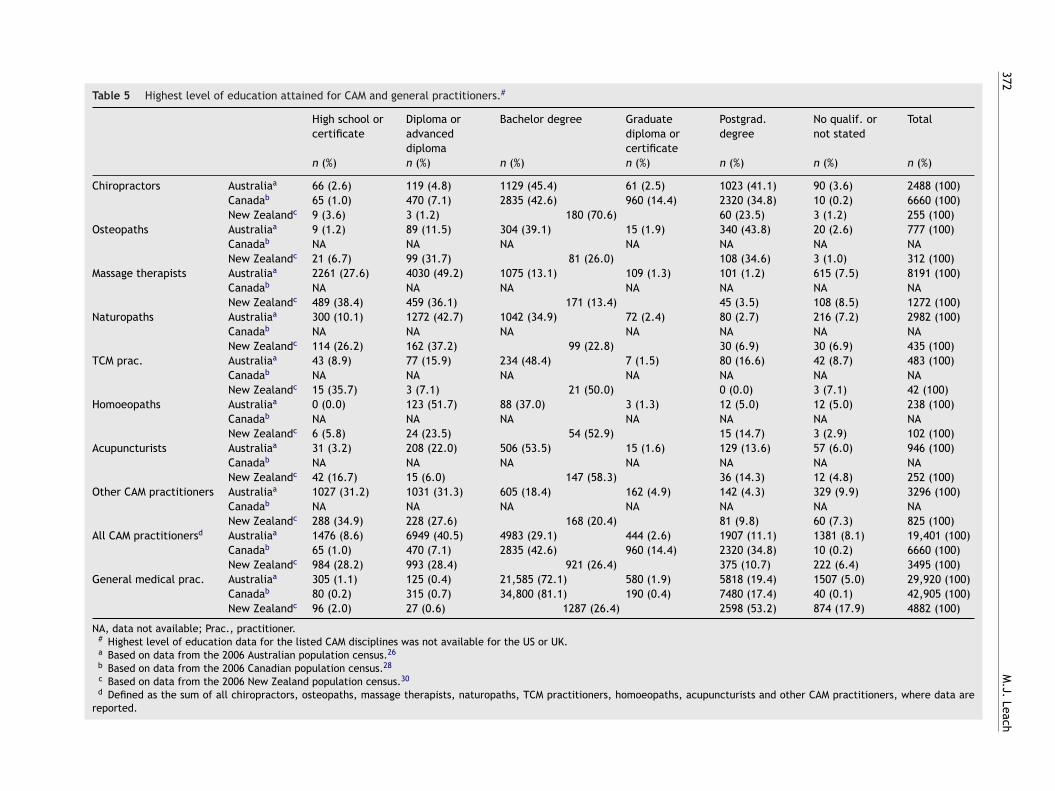
372
M.J.
Leach
Table 5 Highest level of education attained for CAM and general practitioners.#
High school orcertificate
Diploma oradvanceddiploma
Bachelor degree Graduatediploma orcertificate
Postgrad.degree
No qualif. ornot stated
Total
n (%) n (%) n (%) n (%) n (%) n (%) n (%)
Chiropractors Australiaa 66 (2.6) 119 (4.8) 1129 (45.4) 61 (2.5) 1023 (41.1) 90 (3.6) 2488 (100)Canadab 65 (1.0) 470 (7.1) 2835 (42.6) 960 (14.4) 2320 (34.8) 10 (0.2) 6660 (100)New Zealandc 9 (3.6) 3 (1.2) 180 (70.6) 60 (23.5) 3 (1.2) 255 (100)
Osteopaths Australiaa 9 (1.2) 89 (11.5) 304 (39.1) 15 (1.9) 340 (43.8) 20 (2.6) 777 (100)Canadab NA NA NA NA NA NA NANew Zealandc 21 (6.7) 99 (31.7) 81 (26.0) 108 (34.6) 3 (1.0) 312 (100)
Massage therapists Australiaa 2261 (27.6) 4030 (49.2) 1075 (13.1) 109 (1.3) 101 (1.2) 615 (7.5) 8191 (100)Canadab NA NA NA NA NA NA NANew Zealandc 489 (38.4) 459 (36.1) 171 (13.4) 45 (3.5) 108 (8.5) 1272 (100)
Naturopaths Australiaa 300 (10.1) 1272 (42.7) 1042 (34.9) 72 (2.4) 80 (2.7) 216 (7.2) 2982 (100)Canadab NA NA NA NA NA NA NANew Zealandc 114 (26.2) 162 (37.2) 99 (22.8) 30 (6.9) 30 (6.9) 435 (100)
TCM prac. Australiaa 43 (8.9) 77 (15.9) 234 (48.4) 7 (1.5) 80 (16.6) 42 (8.7) 483 (100)Canadab NA NA NA NA NA NA NANew Zealandc 15 (35.7) 3 (7.1) 21 (50.0) 0 (0.0) 3 (7.1) 42 (100)
Homoeopaths Australiaa 0 (0.0) 123 (51.7) 88 (37.0) 3 (1.3) 12 (5.0) 12 (5.0) 238 (100)Canadab NA NA NA NA NA NA NANew Zealandc 6 (5.8) 24 (23.5) 54 (52.9) 15 (14.7) 3 (2.9) 102 (100)
Acupuncturists Australiaa 31 (3.2) 208 (22.0) 506 (53.5) 15 (1.6) 129 (13.6) 57 (6.0) 946 (100)Canadab NA NA NA NA NA NA NANew Zealandc 42 (16.7) 15 (6.0) 147 (58.3) 36 (14.3) 12 (4.8) 252 (100)
Other CAM practitioners Australiaa 1027 (31.2) 1031 (31.3) 605 (18.4) 162 (4.9) 142 (4.3) 329 (9.9) 3296 (100)Canadab NA NA NA NA NA NA NANew Zealandc 288 (34.9) 228 (27.6) 168 (20.4) 81 (9.8) 60 (7.3) 825 (100)
All CAM practitionersd Australiaa 1476 (8.6) 6949 (40.5) 4983 (29.1) 444 (2.6) 1907 (11.1) 1381 (8.1) 19,401 (100)Canadab 65 (1.0) 470 (7.1) 2835 (42.6) 960 (14.4) 2320 (34.8) 10 (0.2) 6660 (100)New Zealandc 984 (28.2) 993 (28.4) 921 (26.4) 375 (10.7) 222 (6.4) 3495 (100)
General medical prac. Australiaa 305 (1.1) 125 (0.4) 21,585 (72.1) 580 (1.9) 5818 (19.4) 1507 (5.0) 29,920 (100)Canadab 80 (0.2) 315 (0.7) 34,800 (81.1) 190 (0.4) 7480 (17.4) 40 (0.1) 42,905 (100)New Zealandc 96 (2.0) 27 (0.6) 1287 (26.4) 2598 (53.2) 874 (17.9) 4882 (100)
NA, data not available; Prac., practitioner.# Highest level of education data for the listed CAM disciplines was not available for the US or UK.a Based on data from the 2006 Australian population census.26
b Based on data from the 2006 Canadian population census.28
c Based on data from the 2006 New Zealand population census.30
d Defined as the sum of all chiropractors, osteopaths, massage therapists, naturopaths, TCM practitioners, homoeopaths, acupuncturists and other CAM practitioners, where data arereported.
Profile of
the CAM
workforce
373
Table 6 Number of hours worked per week by CAM and general practitioners.#
0 h 1—16 h 17—34 h ≥35 h Not stated Totaln (%) n (%) n (%) n (%) n (%) n (%)
Chiropractors Australiaa 62 (2.5) 246 (9.9) 787 (31.6) 1354 (54.4) 39 (1.6) 2488 (100)Canadab,d 160 (2.4) 420 (6.3) 2710 (40.7) 3340 (50.2) 30 (0.5) 6660 (100)New Zealandc 0 (0.0) 9 (3.5) 78 (30.6) 156 (61.2) 12 (4.7) 255 (100)
Osteopaths Australiaa 28 (3.6) 90 (11.6) 188 (24.2) 453 (58.3) 18 (2.3) 777 (100)Canadab NA NA NA NA NA NANew Zealandc 0 (0.0) 33 (10.6) 90 (28.9) 174 (55.8) 15 (4.8) 312 (100)
Massage therapists Australiaa 309 (3.8) 3102 (37.9) 2660 (32.5) 1932 (23.6) 188 (2.3) 8191 (100)Canadab NA NA NA NA NA NANew Zealandc 0 (0.0) 486 (38.2) 405 (31.8) 315 (24.8) 66 (5.2) 1272 (100)
Naturopaths Australiaa 100 (3.4) 737 (24.7) 946 (31.7) 1134 (38.0) 65 (2.2) 2982 (100)Canadab NA NA NA NA NA NANew Zealandc 0 (0.0) 114 (26.2) 141 (32.4) 156 (35.9) 24 (5.5) 435 (100)
TCM prac. Australiaa 14 (2.9) 61 (12.6) 123 (25.5) 274 (56.7) 11 (2.3) 483 (100)Canadab NA NA NA NA NA NANew Zealandc 0 (0.0) 9 (21.4) 6 (14.3) 24 (57.1) 3 (7.1) 42 (100)
Homoeopaths Australiaa 12 (5.0) 83 (34.9) 79 (33.2) 54 (22.7) 10 (4.2) 238 (100)Canadab NA NA NA NA NA NANew Zealandc 0 (0.0) 30 (29.4) 33 (32.4) 39 (38.2) 0 (0.0) 102 (100)
Acupuncturists Australiaa 17 (1.8) 167 (17.7) 290 (30.7) 458 (48.4) 14 (1.5) 946 (100)Canadab NA NA NA NA NA NANew Zealandc 0 (0.0) 39 (15.5) 69 (27.4) 129 ((51.2) 15 (6.0) 252 (100)
Other CAM practitioners Australiaa 151 (4.6) 1320 (40.0) 898 ((27.2) 836 (25.4) 91 (2.8) 3296 (100)Canadab NA NA NA NA NA NANew Zealandc 0 (0.0) 147 (17.8) 204 (24.7) 444 (53.8) 30 ((3.6) 825 (100)
All CAM practitionerse Australiaa 693 (3.6) 5806 (29.9) 5971 (30.8) 6495 (33.5) 436 (2.3) 19,401 (100)Canadab 160 (2.4) 420 (6.3) 2710 (40.7) 3340 (50.2) 30 (0.5) 6660 (100)New Zealandc 0 (0.0) 867 (24.8) 1026 (29.4) 1437 (41.1) 165 (4.7) 3495 (100)
General medical prac. Australiaa 1100 (3.7) 1871 (6.3) 5222 (17.5) 21,300 (71.2) 427 (1.4) 29,920 (100)Canadab,d 1475 (3.4) 1675 (3.9) 7305 (17.0) 32,080 (74.8) 370 (0.9) 42,905 (100)New Zealandc 0 (0.0) 240 (4.9) 756 (15.5) 2805 (57.5) 1081 (22.1) 4882 (100)
NA, data not available; Prac., practitioner.# Data on number of hours worked for the listed CAM disciplines was not available for the US or UK.a Based on data from the 2006 Australian population census.26
b Based on data from the 2006 Canadian population census.28
c Based on data from the 2006 New Zealand population census.30
d Data reported under 1—16 h, 17—34 h and ≥35 h represent data for the following groups: 1—19 h, 20—39 h and ≥40 h, respectively.e Defined as the sum of all chiropractors, osteopaths, massage therapists, naturopaths, TCM practitioners, homoeopaths, acupuncturists and other CAM practitioners, where data are
reported.
374 M.J. Leach
Table 7 Average gross weekly income for CAM and general practitioners, in each country’s respective currency.#
$0—999 $1000—1999 ≥$2000 Not stated Totaln (%) n (%) n (%) n (%) n (%)
Chiropractors Australiaa 1038 (41.7) 1023 (41.1) 390 (15.7) 37 (1.5) 2488 (100)New Zealandb 99 (38.8) 96 (37.7) 57 (22.4) 3 (1.2) 255 (100)United Statesc,d 24,318 (48.3) 8826 (17.5) 17,153 (34.1) 33 (0.1) 50,330 (100)
Osteopaths Australiaa 356 (45.8) 336 (43.2) 62 (8.0) 23 (3.0) 777 (100)New Zealandb 171 (54.8) 117 (37.5) 21 (6.7) 3 (1.0) 312 (100)United Statesc NA NA NA NA NA
Massage therapists Australiaa 7621 (93.0) 402 (4.9) 31 (0.4) 137 (1.7) 8191 (100)New Zealandb 1209 (95.0) 36 (2.8) 9 (0.7) 18 (1.4) 1272 (100)United Statesc,d 66,407 (91.0) 1952 (2.7) 677 (0.9) 3904 (5.4) 72,940 (100)
Naturopaths Australiaa 2614 (87.7) 288 (9.7) 44 (1.5) 36 (1.2) 2982 (100)New Zealandb 372 (85.5) 33 (7.6) 6 (1.4) 24 (5.5) 435 (100)United Statesc NA NA NA NA NA
TCM prac. Australiaa 412 (85.3) 47 (9.7) 9 (1.9) 15 (3.1) 483 (100)New Zealandb 39 (92.9) 0 (0.0) 0 (0.0) 3 (7.1) 42 (100)United Statesc NA NA NA NA NA
Homoeopaths Australiaa 210 (88.2) 18 (7.6) 3 ((1.3) 7 (2.9) 238 (100)New Zealandb 93 (91.2) 9 (8.8) 0 (0.0) 0 (0.0) 102 (100)United Statesc NA NA NA NA NA
Acupuncturists Australiaa 808 (85.4) 102 (10.8) 15 (1.6) 21 (2.2) 946 (100)New Zealandb 228 (90.5) 18 (7.1) 0 (0.0) 6 (2.4) 252 (100)United Statesc NA NA NA NA NA
Other CAM practitioners Australiaa 2980 (90.4) 219 (6.6) 38 (1.2) 59 (1.8) 3296 (100)New Zealandb 726 (88.0) 84 (10.2) 0 (0.0) 15 (1.8) 825 (100)United Statesc NA NA NA NA NA
All CAM practitionerse Australiaa 16,039 (82.7) 2435 (12.6) 592 (3.1) 335 (1.7) 19,401 (100)New Zealandb 2937 (84.0) 393 (11.2) 93 (2.7) 72 (2.1) 3495 (100)United Statesc 90,725 (73.6) 10,778 (8.7) 17,830 (14.5) 3937 (3.2) 123,270 (100)
General medical prac. Australiaa 2944 (9.8) 10,071 (33.7) 16,567 (55.4) 338 (1.1) 29,920 (100)New Zealandb 525 (10.8) 1383 (28.3) 2064 (42.3) 910 (18.6) 4882 (100)United Statesc NA NA NA NA NA
NA, data not available; Prac., practitioner.# Data on average weekly income for the listed CAM disciplines was not available for Canada or the UK.a Based on data from the 2006 Australian population census.26
b Based on data from the 2006 New Zealand population census.30
c Based on data from the 2000 US population census.32
d Data reported under $0—999, $1000—1999 and ≥$2000 represent data for the following income brackets: $0—961, $962—1442 and≥$1443, respectively.
e rapis
dc
I
TctowofEmo
na
D
TtEtcmw
Defined as the sum of all chiropractors, osteopaths, massage theand other CAM practitioners, where data are reported.
istinct differences in average gross weekly income betweenountries, across each of the CAM disciplines.
ndustry of employment
he majority of CAM practitioners were employed in medi-al and other health care services (Table 8). Employment inhis industry was particularly high (>80%) for chiropractors,steopaths and acupuncturists. Very few CAM practitionersorked in hospitals (≤2.1% for all disciplines, excludingther CAM practitioners in New Zealand), residential care
acilities (≤2.4%) or social assistance services (≤6.2%).mployment in ‘other’ industries was also very low forost countries, except for New Zealand, where close tone third of practitioners in the fields of massage therapy,
oatw
ts, naturopaths, TCM practitioners, homoeopaths, acupuncturists
aturopathy, traditional Chinese medicine, homoeopathynd other CAM disciplines were employed.
iscussion
his is the first known study to describe the complemen-ary and alternative medicine workforce across multiplenglish-speaking countries. This work indicates that acrosshe combined CAM workforce (for the disciplines and OECDountries where data were available), practitioners wereost likely to be female, aged 40 years or older, workingithin a medical or health care service, holding a vocational
r higher education level qualification, working full-time,nd earning less than $1000 gross per week. Massageherapists, which comprised the largest portion of the CAMorkforce, were generally younger, held the lowest level of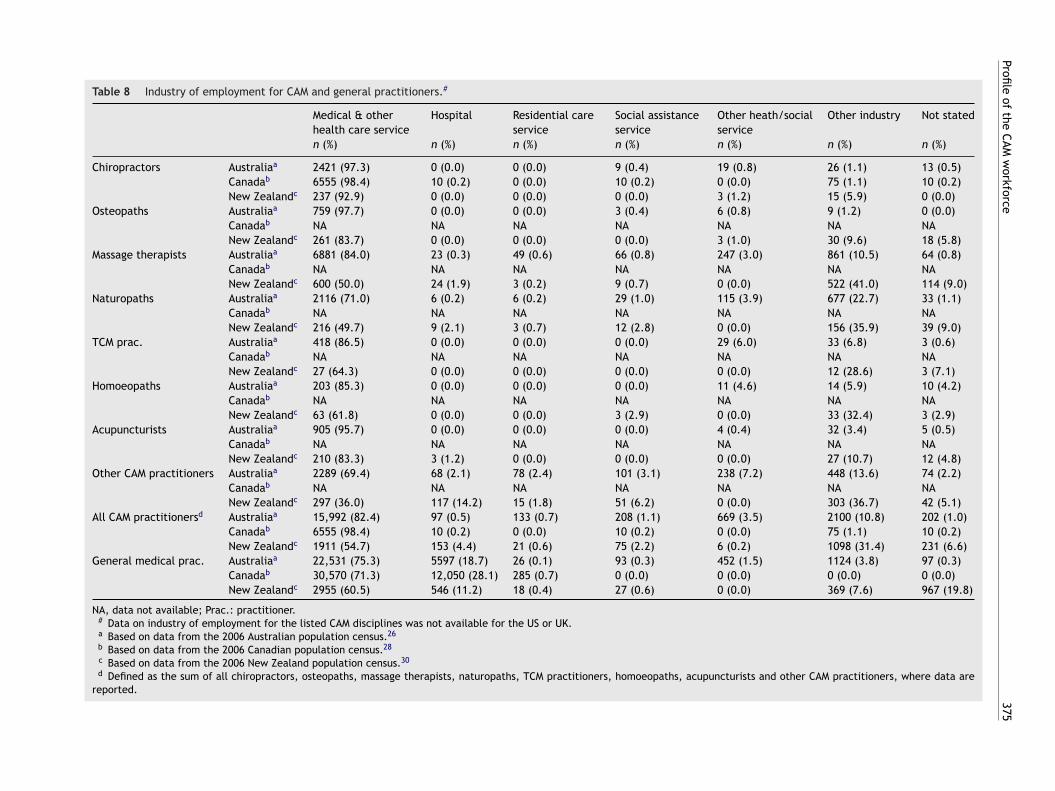
Profile of
the CAM
workforce
375
Table 8 Industry of employment for CAM and general practitioners.#
Medical & otherhealth care service
Hospital Residential careservice
Social assistanceservice
Other heath/socialservice
Other industry Not stated
n (%) n (%) n (%) n (%) n (%) n (%) n (%)
Chiropractors Australiaa 2421 (97.3) 0 (0.0) 0 (0.0) 9 (0.4) 19 (0.8) 26 (1.1) 13 (0.5)Canadab 6555 (98.4) 10 (0.2) 0 (0.0) 10 (0.2) 0 (0.0) 75 (1.1) 10 (0.2)New Zealandc 237 (92.9) 0 (0.0) 0 (0.0) 0 (0.0) 3 (1.2) 15 (5.9) 0 (0.0)
Osteopaths Australiaa 759 (97.7) 0 (0.0) 0 (0.0) 3 (0.4) 6 (0.8) 9 (1.2) 0 (0.0)Canadab NA NA NA NA NA NA NANew Zealandc 261 (83.7) 0 (0.0) 0 (0.0) 0 (0.0) 3 (1.0) 30 (9.6) 18 (5.8)
Massage therapists Australiaa 6881 (84.0) 23 (0.3) 49 (0.6) 66 (0.8) 247 (3.0) 861 (10.5) 64 (0.8)Canadab NA NA NA NA NA NA NANew Zealandc 600 (50.0) 24 (1.9) 3 (0.2) 9 (0.7) 0 (0.0) 522 (41.0) 114 (9.0)
Naturopaths Australiaa 2116 (71.0) 6 (0.2) 6 (0.2) 29 (1.0) 115 (3.9) 677 (22.7) 33 (1.1)Canadab NA NA NA NA NA NA NANew Zealandc 216 (49.7) 9 (2.1) 3 (0.7) 12 (2.8) 0 (0.0) 156 (35.9) 39 (9.0)
TCM prac. Australiaa 418 (86.5) 0 (0.0) 0 (0.0) 0 (0.0) 29 (6.0) 33 (6.8) 3 (0.6)Canadab NA NA NA NA NA NA NANew Zealandc 27 (64.3) 0 (0.0) 0 (0.0) 0 (0.0) 0 (0.0) 12 (28.6) 3 (7.1)
Homoeopaths Australiaa 203 (85.3) 0 (0.0) 0 (0.0) 0 (0.0) 11 (4.6) 14 (5.9) 10 (4.2)Canadab NA NA NA NA NA NA NANew Zealandc 63 (61.8) 0 (0.0) 0 (0.0) 3 (2.9) 0 (0.0) 33 (32.4) 3 (2.9)
Acupuncturists Australiaa 905 (95.7) 0 (0.0) 0 (0.0) 0 (0.0) 4 (0.4) 32 (3.4) 5 (0.5)Canadab NA NA NA NA NA NA NANew Zealandc 210 (83.3) 3 (1.2) 0 (0.0) 0 (0.0) 0 (0.0) 27 (10.7) 12 (4.8)
Other CAM practitioners Australiaa 2289 (69.4) 68 (2.1) 78 (2.4) 101 (3.1) 238 (7.2) 448 (13.6) 74 (2.2)Canadab NA NA NA NA NA NA NANew Zealandc 297 (36.0) 117 (14.2) 15 (1.8) 51 (6.2) 0 (0.0) 303 (36.7) 42 (5.1)
All CAM practitionersd Australiaa 15,992 (82.4) 97 (0.5) 133 (0.7) 208 (1.1) 669 (3.5) 2100 (10.8) 202 (1.0)Canadab 6555 (98.4) 10 (0.2) 0 (0.0) 10 (0.2) 0 (0.0) 75 (1.1) 10 (0.2)New Zealandc 1911 (54.7) 153 (4.4) 21 (0.6) 75 (2.2) 6 (0.2) 1098 (31.4) 231 (6.6)
General medical prac. Australiaa 22,531 (75.3) 5597 (18.7) 26 (0.1) 93 (0.3) 452 (1.5) 1124 (3.8) 97 (0.3)Canadab 30,570 (71.3) 12,050 (28.1) 285 (0.7) 0 (0.0) 0 (0.0) 0 (0.0) 0 (0.0)New Zealandc 2955 (60.5) 546 (11.2) 18 (0.4) 27 (0.6) 0 (0.0) 369 (7.6) 967 (19.8)
NA, data not available; Prac.: practitioner.# Data on industry of employment for the listed CAM disciplines was not available for the US or UK.a Based on data from the 2006 Australian population census.26
b Based on data from the 2006 Canadian population census.28
c Based on data from the 2006 New Zealand population census.30
d Defined as the sum of all chiropractors, osteopaths, massage therapists, naturopaths, TCM practitioners, homoeopaths, acupuncturists and other CAM practitioners, where data arereported.
3
etcci
t(ofsT(mZotliafacdimf
Twmatbmittaooifit
aaoatabdto
itmsos
wnotttptili
Zolofftythfipns
gtwetiddm4s2th
Alsctcctpoofcaoi
76
ducation, worked the least number of hours and earnedhe lowest income relative to other disciplines. By contrast,hiropractors and osteopaths held the highest level of edu-ation, worked the longest hours and earned the highestncome, compared with most other CAM disciplines.
The CAM workforce collectively contained a high propor-ion of female practitioners relative to male practitionersi.e. 54% vs. 46%). This is not dissimilar to the patternbserved within the mainstream health workforce acrossour of the five included countries, where more thaneventy-one percent of practitioners were female.25,28,29,32
he proportion of females in female-dominant occupationsi.e. >60% female) was also similar between the CAM andainstream health workforce (at least in Australia and Newealand). For instance, for the female-dominant disciplinesf massage therapy, naturopathy and homoeopathy, morehan seventy-nine percent of practitioners were female;ikewise, across the female-dominant professions of nurs-ng, physiotherapy, dietetics, social work, speech therapynd occupational therapy, more than 80% of clinicians wereemale.39 For the fields of chiropractic, osteopathy, TCM andcupuncture, which collectively comprise seventy-four per-ent male practitioners, this was similar to the fields ofentistry, optometry and general practice, where approx-mately 58% of practitioners were male.25 Further researchay help in understanding the reasons for these gender dif-
erences across CAM disciplines.Many fields of CAM, such as acupuncture, naturopathy,
CM and homoeopathy, were characterised by an olderorkforce. This is consistent with the age profile of manyainstream health occupations, namely dentistry, nursing
nd general practice.25,28,29,32 Several factors may explainhe older age profile of these CAM disciplines: it is proba-le that the older age profile reflects the high number ofature-age students entering CAM courses or programs40;
t also may be indicative of high rates of retention inhese disciplines.39 These same factors may also explainhe relatively younger age profile of massage therapistsnd chiropractors across the selected countries, as well assteopaths in Australia. It is difficult to determine how thislder workforce and/or potentially low retention rates willmpact on the future supply of CAM practitioners withoutrst understanding CAM workforce demand; unfortunately,his work has yet to be done.
Three occupations (i.e. chiropractic, osteopathy andcupuncture) demonstrated a higher level of education rel-tive to other CAM disciplines. This may be because eachf these occupations are statutory regulated (includingcupuncture and TCM in Australia), and as such, minimumraining requirements for board certification or registrationre clearly stipulated. On the other hand, no assurance cane given that these qualifications are related to these CAMiscipline areas; it is possible that the high levels of educa-ion could, in some cases, be related to other fields or priorccupations.
For most of the other CAM occupations, the highest qual-fication held was a Diploma or Advanced Diploma (withhe exception of homoeopathy in New Zealand, for which
ost practitioners held a Bachelor degree). Several rea-ons can be given for the relatively lower education levelf these disciplines. First, neither of these occupations istatutory regulated (at least in Australia and New Zealand
cc
b
M.J. Leach
here data were available). Second, membership of perti-ent Australian/New Zealand CAM professional associationsnly requires a Diploma/Advanced Diploma as a minimumraining requirement. Third, Bachelor degrees for many ofhese disciplines have only emerged recently.41 Given thathese conditions are likely to vary across countries, it isrobable that the highest qualifications held by CAM practi-ioners in other countries will vary. It also infers that changesn the regulation of CAM disciplines (i.e. introduction oficensing or statutory regulation) may drive improvementsn the education level of practitioners.
Most CAM practitioners in Australia, Canada and Newealand had worked full-time (≥35 h a week) in the yearf the population census (i.e. 2006). The disciplines thatargely comprised a part-time workforce, such as natur-pathy, homoeopathy and massage therapy, were alsoemale-dominant occupations. This is not surprising asemale practitioners work on average fewer hours per weekhan their male counterparts; one reason being to care forounger children.42,43 The older age profile of naturopa-hy and homoeopathy also may have contributed to theigher proportion of practitioners working part-time in theseelds.42 The association between increasing female partici-ation in the workforce, an ageing workforce, and the risingumber of medical practitioners working part-time, lendsupport to these assertions.42
Much of the CAM workforce earned less than $1000ross per week. Practitioners earning equal to or greaterhan $1000 per week (i.e. chiropractors and osteopaths)ere typically in male-dominant occupations, held a higher-ducation qualification, and worked full-time. While each ofhese factors is likely to contribute to the higher weeklyncome of these disciplines, another consideration is theuration of the patient consultation. Relative to other CAMisciplines (e.g. naturopathy, herbalism, acupuncture andassage therapy), which typically provide consultations of
0—60 min duration,10,44 chiropractic and osteopathic con-ultations are generally of shorter length, often less than0 min duration; similar to Western physicians.44 This poten-ially allows for greater patient throughput, and hence,igher turnover.
Complementary and alternative medicine services inustralia and New Zealand, and possibly Canada, were
argely delivered through primary care settings. Very fewervices were provided through secondary or tertiary healthare settings, such as hospitals and residential care facili-ies. Given that patients attending CAM services are in manyases self-referred,10,44 CAM practitioners may be for manyonsumers the first point of contact with the health care sys-em, and in such cases, may be the patient’s primary carerovider. There are concerns, however, that the low levelf education of some practitioners, as well as the absencef appropriate regulatory and quality standards for practiceor some CAM disciplines,45 could mean that some clini-ians may not have the necessary competencies to deliverppropriate and effective primary care. Tighter regulationf several CAM disciplines, including the stipulation of min-mum training requirements, may help to safeguard those
onsumers who choose to use CAM practitioners as primaryare providers.While this work has provided some insights into theroader CAM workforce, it has highlighted two major issues
ddwegbo
C
N
R
1
1
1
1
Profile of the CAM workforce
with using census data for the assessment of CAM workforcesupply, and more generally, health workforce planning. Thefirst issue is that few data sources provide comprehensivelow-level data on the characteristics of the CAM workforce,with the exception of the Australian Bureau of Statistics Cen-sus of Population and Housing and Statistics New ZealandCensus of Population and Dwellings. As illustrated in Table 1,most sources only capture limited data on age, gender andincome, with few reporting on hours worked, highest quali-fication held, and industry of employment.
The second issue relates to the paucity of data foreach distinct discipline area, particularly herbalism. Thismay be attributed in part to the way CAM disciplines arecategorised, with each country utilising different occupa-tional classification systems to code occupations; despiteeach census questionnaire recording occupation in free-textform. As a result, many data sources had grouped distinctCAM disciplines (e.g. herbalists) with often unrelated occu-pations (e.g. podiatry); such data is unlikely to be of anyuse to either discipline. Similarly, many data providers col-lapsed data from multiple CAM occupations into broader,often meaningless categories (e.g. other healthcare practi-tioners), which has little value in health workforce planning.
Even though census data from each of the selectedcountries is trustworthy, reliable and highly representativeof each nation’s population, the data quality issues afore-mentioned limit the conclusions that can be made aboutthe CAM workforce across these countries. Furthermore,because much of the US and UK data were derived fromsources other than the census, it is possible that method-ological differences between data sources could contributein part to the differences observed between countries.
These data quality issues draw attention to the need formore comprehensive data on the CAM workforce, includ-ing specific details on each distinct CAM discipline. Furtherexploration of the CAM workforce beyond the five selectedcountries is also recommended, as distinct cultural, polit-ical and social differences between countries are likely tohave a notable impact on the profile of the CAM workforce.Many of these issues could be addressed through the imple-mentation of a comprehensive CAM workforce survey, or byrevising the way CAM disciplines are coded and reported inpopulation censuses. This work is a call for that research.
Conclusion
This work has broadened understanding of the CAM work-force across Australia, Canada, New Zealand, UnitedKingdom and United States. One insight gained from thiswork was the notable differences between disciplines inincome, hours worked and education level. Whilst differ-ences in the former may be attributed to the gender profileof the discipline and the duration of the patient consul-tation, the latter is expected to be driven by disparateregulatory and training requirements across disciplines. Theimplementation of tighter regulation is one strategy thatmay help to raise the education level of many CAM practi-
tioners, and in so doing, ensure the provision of a competentCAM workforce to service the needs of consumers; it mayalso serve to safeguard consumers who use CAM practitionersas primary care providers. Although the quality of available1
377
ata somewhat limits the conclusions that can be made, itoes emphasise the need for better quality data on the CAMorkforce, including the provision of comprehensive data onach distinct CAM discipline; it also highlights the need forreater understanding of CAM workforce demand in order toetter inform the training and continuing education needsf the evolving CAM workforce.
onflict of interest statement
one declared.
eferences
1. Leach MJ. Public, nurse and medical practitioner attitude andpractice of natural medicine. Complementary Therapies inNursing and Midwifery 2004;10:13—21.
2. MacLennan AH, Myers SP, Taylor AW. The continuing use ofcomplementary and alternative medicine in South Australia:costs and beliefs in 2004. Medical Journal of Australia2006;184:27—31.
3. Xue CCL, Zhang AL, Lin PHV, Da Costa C, Story DF. Comple-mentary and alternative medicine use in Australia: a nationalpopulation-based survey. Journal of Alternative and Comple-mentary Medicine 2007;13:643—50.
4. Quan H, Lai D, Johnson D, Verhoef M, Musto R. Complemen-tary and alternative medicine use among Chinese and whiteCanadians. Canadian Family Physician 2008;54:1563—9.
5. Barnes PM, Powell-Griner E, McFann K, Nahin RL. Complemen-tary and alternative medicine use among adults: United States,2002. Seminars in Integrative Medicine 2004;2:54—71.
6. Lim MK, Sadarangani P, Chan HL, Heng JY. Complementary andalternative medicine use in multiracial Singapore. Complemen-tary Therapies in Medicine 2005;13:16—24.
7. Hori S, Mihaylov I, Vasconcelos JC, McCoubrie M. Patterns ofcomplementary and alternative medicine use amongst outpa-tients in Tokyo, Japan. BMC Complementary and AlternativeMedicine 2008;8:14—23.
8. Metcalfe A, Williams J, McChesney J, Patten SB, Jette N. Useof complementary and alternative medicine by those with achronic disease and the general population — results of anational population based survey. BMC Complementary andAlternative Medicine 2010;10:58.
9. Su D, Li L. Trends in the use of complementary and alternativemedicine in the United States: 2002—2007. Journal of HealthCare for the Poor and Underserved 2011;22:296—310.
0. Hunt KJ, Coelho HF, Wider B, Perry R, Hung SK, Terry R,et al. Complementary and alternative medicine use in England:results from a national survey. International Journal of ClinicalPractice 2010;64:1496—502.
1. Lin V, Bensoussan A, Myers S, McCabe P, Cohen M, Hill S, et al.The practice and regulatory requirements of naturopathy andwestern herbal medicine. Melbourne: State of Victoria Depart-ment of Human Services; 2006.
2. Hurwitz EL, Chiang LM. A comparative analysis of chiroprac-tic and general practitioner patients in North America: findingsfrom the joint Canada/United States survey of health, 2002—03.BMC Health Services Research 2006;6:49.
3. Knox SA, Harrison CM, Britt HC, Henderson JV. Estimating preva-lence of common chronic morbidities in Australia. Medical
Journal of Australia 2008;189:66—70.4. Nahin RL, Barnes PM, Shussman BJ, Bloom B. Costs if comple-mentary and alternative medicine (CAM) and frequency of visitsto CAM practitioners: United States, 2007. National Health
3
1
1
1
1
1
2
2
2
2
2
2
2
2
2
2
3
3
3
3
3
3
3
3
3
3
4
4
4
4
4
4
4
78
Statistics Reports, No. 18. Hyattsville. Maryland: National Cen-tre for Health Statistics; 2009.
5. Centers for Medicare and Medicaid Services. Nationalhealth expenditures by source of funds and type ofexpenditure: calendar years 2004—2010. Baltimore,MD: Department of Health & Human Services; 2010.http://www.cms.gov/Research-Statistics-Data-and-Systems/Statistics-Trends-and-Reports/NationalHealthExpendData/Downloads/tables.pdf [accessed 12.03.12].
6. Busato A, Donges A, Herren S, Widmer M, Marian F. Health sta-tus and health care utilisation of patients in complementaryand conventional primary care in Switzerland-an observationalstudy. Family Practice 2006;23:116—24.
7. Robinson A, Chesters J, Cooper S. People’s choice: comple-mentary and alternative medicine modalities. ComplementaryHealth Practice Review 2007;12:99—119.
8. Sirois FM, Purc-Stephenson RJ. Consumer decision factorsfor initial and long-term use of complementary and alter-native medicine. Complementary Health Practice Review2008;13:3—20.
9. Leach MJ. Clinical decision making in complementary and alter-native medicine. Sydney, Australia: Churchill Livingstone; 2010.
0. Bensoussan A, Myers SP, Wu SM, O’Connor K. Naturopathicand western herbal medicine practice in Australia — a work-force survey. Complementary Therapies in Medicine 2004;12:17—27.
1. Hale A. National survey of naturopaths, herbalists and acupunc-turists. Macarthur, New South Wales: School of Behavioural andCommunity Health Sciences, Faculty of Health Sciences, Uni-versity of Sydney; 2002.
2. Davis MA, Davis AM, Luan J, Weeks WB. The supply and demandof chiropractors in the United States from 1996 to 2005. Alter-native Therapies in Health and Medicine 2009;15:36—40.
3. Hough HJ, Dower C, Neill OEH. Profile of a profession:naturopathic practice. San Francisco: Center for the HealthProfessions, University of California; 2001.
4. National Center for Complementary and AlternativeMedicine (NCCAM). What is CAM?. Maryland: NCCAM;2011. http://nccam.nih.gov/health/whatiscam/ [accessed01.03.12].
5. Australian Bureau of Statistics (ABS). CDATA online. Canberra:ABS; 2012. http://www.abs.gov.au/CDATAOnline [accessed24.03.12].
6. Australian Bureau of Statistics (ABS). 2006 Census of populationand housing: customised data report. Brisbane: InformationConsultancy Services; 2012.
7. Statistics Canada. Population and dwelling counts, for Canada,provinces and territories, 2006 and 2001 censuses. Cat. No. 97-550-XWE2006002. Ottawa: Statistics Canada; 2008.
8. Statistics Canada. Occupation — national occupational clas-sification for statistics 2006 (720C), sex (3) and selecteddemographic, cultural, labour force, educational and incomecharacteristics (273) for the population 15 years and over ofCanada, provinces, territories, census metropolitan areas andcensus agglomerations, 2006 census. Ottawa: Statistics Canada;2008.
9. Statistics New Zealand. Quick stats New Zealand. Christchurch:Statistics New Zealand; 2009. http://www.stats.govt.nz/census/census-outputs/quickstats/snapshotplace2.htm?id=
9999999&type=region [accessed 16.07.11].0. Statistics New Zealand. 2006 census of population anddwellings: customised data report. Christchurch: Statistics NewZealand; 2012.
M.J. Leach
1. United States Census Bureau. Population estimates. Wash-ington, District of Columbia: United States Census Bureau;2011. http://www.census.gov/popest/national/national.html[accessed 15.02.12].
2. United States Census Bureau. EEO residence data results fortotal US, by occupation. Retrieved from Census 2000 EEOdata tool. Washington, District of Columbia: United StatesCensus Bureau; 2000. http://www.census.gov/cgi-bin/broker[accessed 14.02.12].
3. Office for National Statistics. Population estimates forUK, England and Wales, Scotland and Northern Ireland,population estimates timeseries 1971 to current year.Newport, South Wales: Office for National Statistics; 2011.http://www.ons.gov.uk/ons/rel/pop-estimate/population-estimates-for-uk–england-and-wales–scotland-and-northern-ireland/population-estimates-timeseries-1971-to-current-year/index.html [accessed 05.07.12].
4. General Chiropractic Council (GCC). Consulting the pro-fession: a survey of UK chiropractors. London: GCC; 2004.http://www.gcc-uk.org/files/link file/ConsultTheProfession.pdf [accessed 06.07.12].
5. General Osteopathic Council. Snapshot survey 2001. Lon-don: GOC; 2001. http://www.osteopathy.org.uk/uploads/survey2snapshot survery results 2001.pdf [accessed 06.07.12].
6. Magen MS, Ward D, Corp S. Osteopathic workforce study.In: Swartwout JE, editor. Compendium of osteopathicworkforce studies. 2004. http://www.tst.do-online.org/pdf/lcl optirepworkstudycompenium.pdf [accessed 15.08.12].
7. National Acupuncture Foundation. Acupuncture and Orientalmedicine state laws and regulations. Washington: NationalAcupuncture Foundation; 2005.
8. Salsberg ES, Forte GJ. Trends in the physician workforce,1980—2000. Health Affairs 2002;21:165—73.
9. Leach MJ, Segal L, May E. Lost opportunities forAustralia’s workforce? Medical Journal of Australia 2010;193:167—72.
0. Princetonreview.com. The Princeton review. Fra-mingham, MA: TPR Education IP Holdings; 2012.http://www.princetonreview.com [accessed 19.08.12].
1. Evans S. The story of naturopathic education in Australia. Com-plementary Therapies in Medicine 2000;8:234—5.
2. Australian Bureau of Statistics (ABS). Selected health occupa-tions: Australia, 2006. Cat. No. 4819.0. Canberra: ABS; 2006.
3. Productivity Commission. Australia’s health workforce:Productivity Commission research report. Canberra:Commonwealth of Australia; 2005. http://www.pc.gov.au/ data/assets/pdf file/0003/9480/healthworkforce.pdf[accessed 15.06.12].
4. Cherkin DC, Deyo RA, Sherman KJ, Hart LG, Street JH, HrbekA, et al. Characteristics of visits to licensed acupuncturists,chiropractors, massage therapists, and naturopathic physi-cians. Journal of the American Board of Family Practice2002;15:463—72.
5. Wardle J, Adams J, Magalhaes RJS, Sibbritt D. Distribution ofcomplementary and alternative medicine (CAM) providers inrural New South Wales, Australia: a step towards explaininghigh CAM use in rural health? Australian Journal of Rural Health2011;19:197—204.
6. Office for National Statistics. General and personal medical
services, England — 1999—2009. Newport, South Wales:Office for National Statistics; 2011. http://data.gov.uk/dataset/general and personal medical services england[accessed 07.01.13].