Embed Size (px)
Citation preview
PROFILE OF HISPANIC-OWNED BUSINESSES MIAMI-DADE COUNTY
2007
Miami-Dade County
Department of Planning and Zoning
Planning Research
111 NW 1 Street, Suite 1220
Miami, Florida 33128-1972
December 2010
2
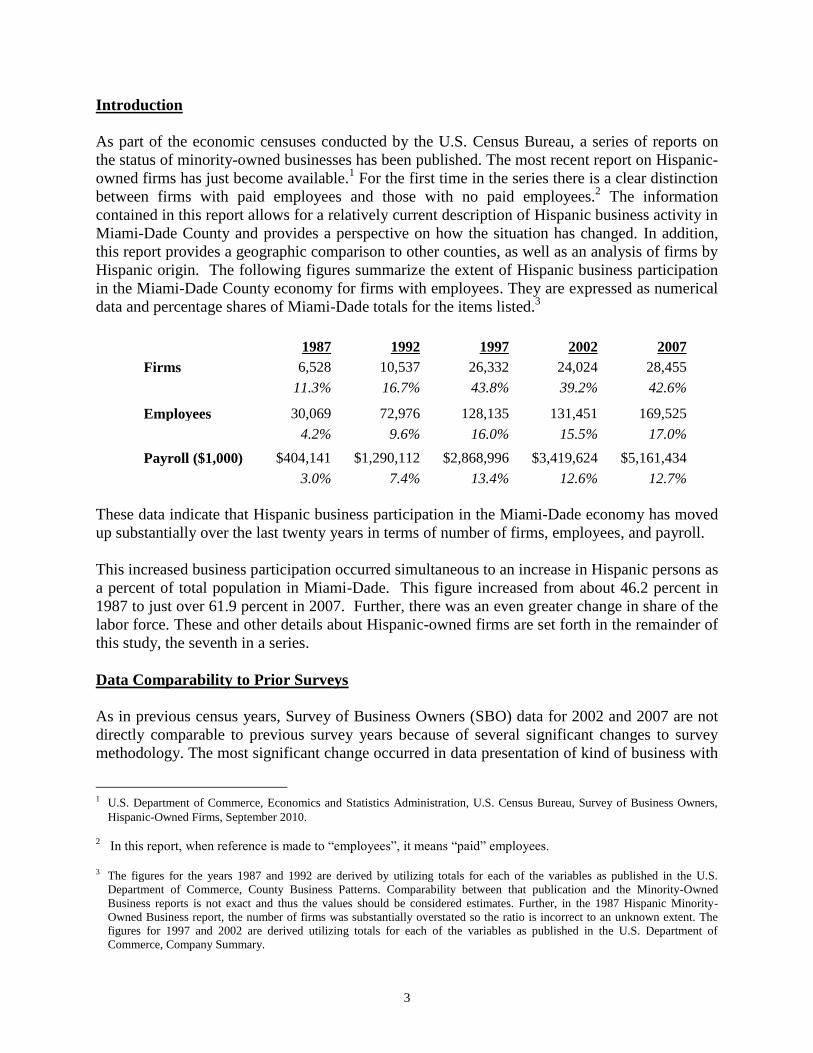
HIGHLIGHTS
The number of Hispanic firms in Miami-Dade County increased from 47,725 in 1987 to
244,148 in 2007, a 412 percent increase.
Total sales and receipts of these firms increased tenfold from 1987 to 2007 to about $45.0
billion.
Employment went up by 464 percent and stood at 169,525 in 2007.
There were 28,455 Hispanic firms with paid employees. About two-thirds of these are in
five sectors, Professional, scientific, and technical services (4,361), Retail trade (3,503),
Wholesale trade (3,471), Health care and social assistance (3,433), and Construction
(3,048).
There were 215,693 Hispanic firms with no paid employees. About two-thirds of these
are in five sectors, Other services (40,872), Administrative and support and waste
management and remediation services (29,611), Construction (29,175), Transportation
and warehousing (21,754), and Health care and social assistance (19,551).
Sales in firms without employees are characterized by very low sales per firm compared
to their counterparts with employees.
Overall, about 61.8 percent of Hispanic business activity in Florida occurs in Miami-Dade
County when measured by sales and receipts.
In general, Hispanic business participation in the Miami-Dade County economy is higher,
in percentage terms, than their counterparts nationwide.
Twelve counties with the largest number of Hispanic-owned firms in the U.S. contain 41.6
percent of all the nation's Hispanic firms. These twelve also account for 40.5 percent of
all sales and receipts of Hispanic firms.
Miami-Dade County tops all other counties as a center of Hispanic business activity. It is
ranked first by number of firms, total receipts, number of employees, and annual payroll.
In terms of average pay per firm, Miami-Dade County ranks eighth among the top twelve
counties with the largest number of Hispanic-owned firms in the U.S.
In Miami-Dade County, Cubans are the predominant Hispanic group with respect to
Hispanic businesses; they own 48.2 percent of the firms and generate 54.8 percent of the
sales. However, those firms classified as Other Hispanic, Latino, or Spanish firms now
own 38.9 percent of all Hispanic firms versus less than 20.1 percent in 1987.
3
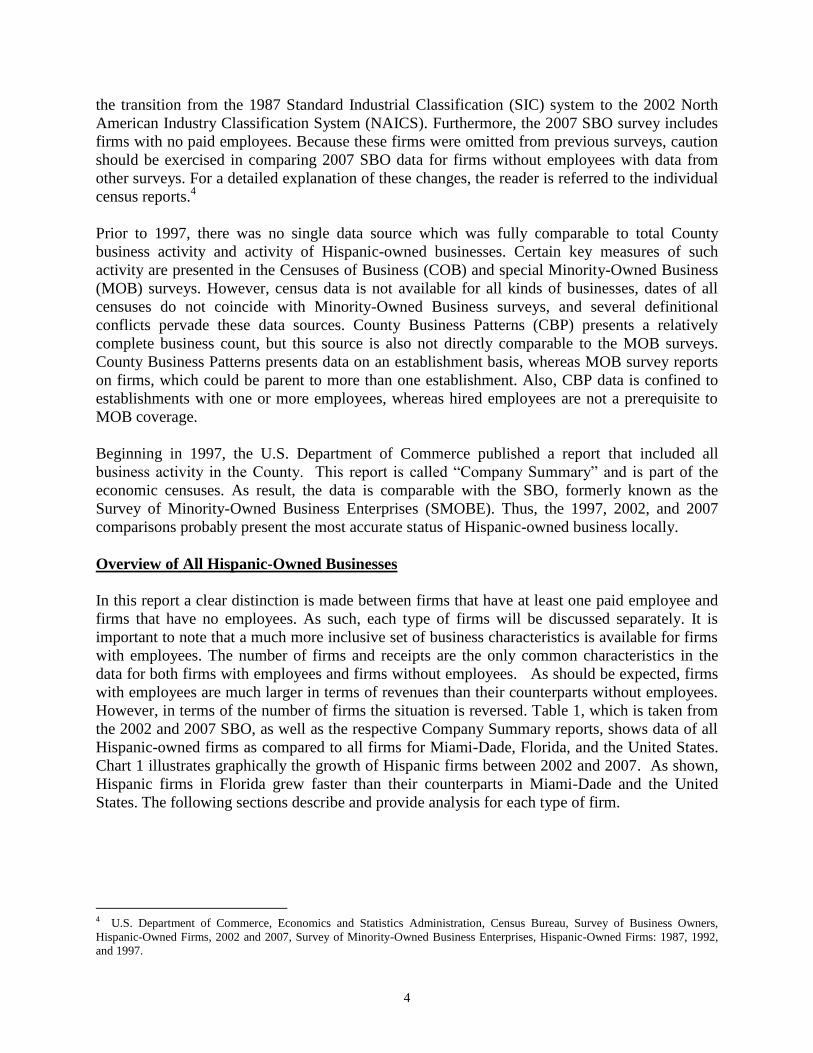
Introduction
As part of the economic censuses conducted by the U.S. Census Bureau, a series of reports on
the status of minority-owned businesses has been published. The most recent report on Hispanic-
owned firms has just become available.1 For the first time in the series there is a clear distinction
between firms with paid employees and those with no paid employees.2 The information
contained in this report allows for a relatively current description of Hispanic business activity in
Miami-Dade County and provides a perspective on how the situation has changed. In addition,
this report provides a geographic comparison to other counties, as well as an analysis of firms by
Hispanic origin. The following figures summarize the extent of Hispanic business participation
in the Miami-Dade County economy for firms with employees. They are expressed as numerical
data and percentage shares of Miami-Dade totals for the items listed.3
1987 1992 1997 2002 2007
Firms 6,528 10,537 26,332 24,024 28,455
11.3% 16.7% 43.8% 39.2% 42.6%
Employees 30,069 72,976 128,135 131,451 169,525
4.2% 9.6% 16.0% 15.5% 17.0%
Payroll ($1,000) $404,141 $1,290,112 $2,868,996 $3,419,624 $5,161,434
3.0% 7.4% 13.4% 12.6% 12.7%
These data indicate that Hispanic business participation in the Miami-Dade economy has moved
up substantially over the last twenty years in terms of number of firms, employees, and payroll.
This increased business participation occurred simultaneous to an increase in Hispanic persons as
a percent of total population in Miami-Dade. This figure increased from about 46.2 percent in
1987 to just over 61.9 percent in 2007. Further, there was an even greater change in share of the
labor force. These and other details about Hispanic-owned firms are set forth in the remainder of
this study, the seventh in a series.
Data Comparability to Prior Surveys
As in previous census years, Survey of Business Owners (SBO) data for 2002 and 2007 are not
directly comparable to previous survey years because of several significant changes to survey
methodology. The most significant change occurred in data presentation of kind of business with
1 U.S. Department of Commerce, Economics and Statistics Administration, U.S. Census Bureau, Survey of Business Owners,
Hispanic-Owned Firms, September 2010.
2 In this report, when reference is made to “employees”, it means “paid” employees.
3 The figures for the years 1987 and 1992 are derived by utilizing totals for each of the variables as published in the U.S.
Department of Commerce, County Business Patterns. Comparability between that publication and the Minority-Owned
Business reports is not exact and thus the values should be considered estimates. Further, in the 1987 Hispanic Minority-
Owned Business report, the number of firms was substantially overstated so the ratio is incorrect to an unknown extent. The
figures for 1997 and 2002 are derived utilizing totals for each of the variables as published in the U.S. Department of
Commerce, Company Summary.
4
the transition from the 1987 Standard Industrial Classification (SIC) system to the 2002 North
American Industry Classification System (NAICS). Furthermore, the 2007 SBO survey includes
firms with no paid employees. Because these firms were omitted from previous surveys, caution
should be exercised in comparing 2007 SBO data for firms without employees with data from
other surveys. For a detailed explanation of these changes, the reader is referred to the individual
census reports.4
Prior to 1997, there was no single data source which was fully comparable to total County
business activity and activity of Hispanic-owned businesses. Certain key measures of such
activity are presented in the Censuses of Business (COB) and special Minority-Owned Business
(MOB) surveys. However, census data is not available for all kinds of businesses, dates of all
censuses do not coincide with Minority-Owned Business surveys, and several definitional
conflicts pervade these data sources. County Business Patterns (CBP) presents a relatively
complete business count, but this source is also not directly comparable to the MOB surveys.
County Business Patterns presents data on an establishment basis, whereas MOB survey reports
on firms, which could be parent to more than one establishment. Also, CBP data is confined to
establishments with one or more employees, whereas hired employees are not a prerequisite to
MOB coverage.
Beginning in 1997, the U.S. Department of Commerce published a report that included all
business activity in the County. This report is called “Company Summary” and is part of the
economic censuses. As result, the data is comparable with the SBO, formerly known as the
Survey of Minority-Owned Business Enterprises (SMOBE). Thus, the 1997, 2002, and 2007
comparisons probably present the most accurate status of Hispanic-owned business locally.
Overview of All Hispanic-Owned Businesses
In this report a clear distinction is made between firms that have at least one paid employee and
firms that have no employees. As such, each type of firms will be discussed separately. It is
important to note that a much more inclusive set of business characteristics is available for firms
with employees. The number of firms and receipts are the only common characteristics in the
data for both firms with employees and firms without employees. As should be expected, firms
with employees are much larger in terms of revenues than their counterparts without employees.
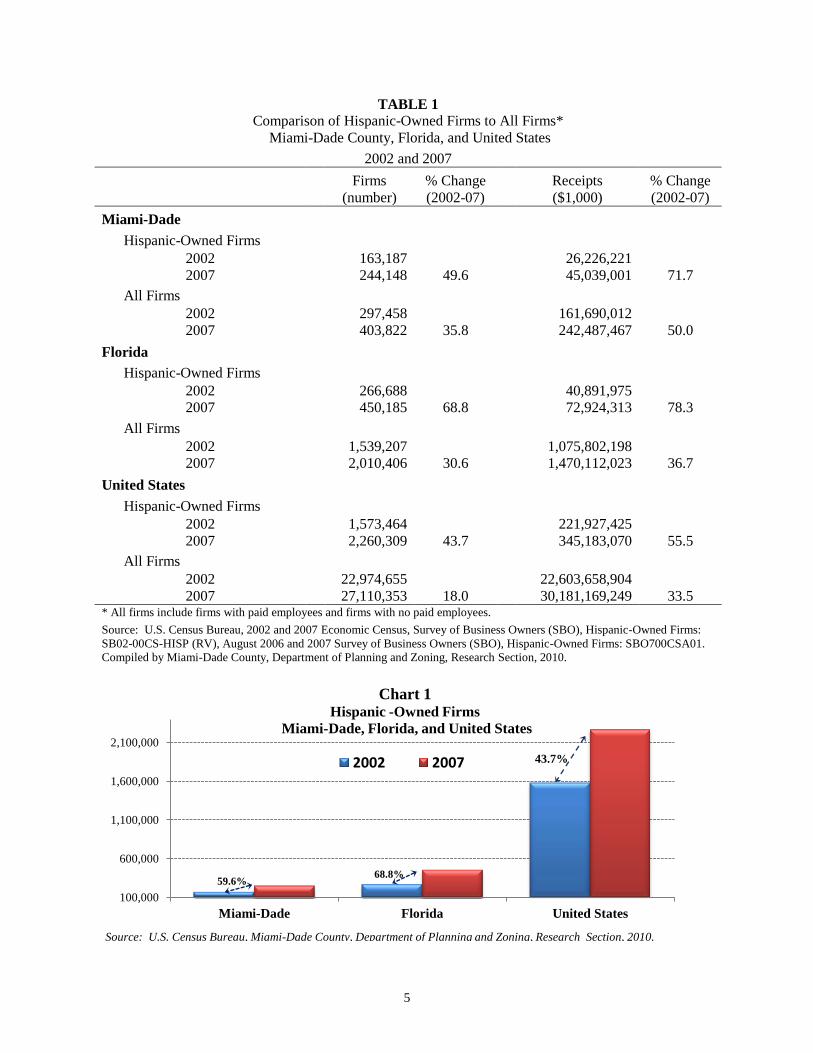
However, in terms of the number of firms the situation is reversed. Table 1, which is taken from
the 2002 and 2007 SBO, as well as the respective Company Summary reports, shows data of all
Hispanic-owned firms as compared to all firms for Miami-Dade, Florida, and the United States.
Chart 1 illustrates graphically the growth of Hispanic firms between 2002 and 2007. As shown,
Hispanic firms in Florida grew faster than their counterparts in Miami-Dade and the United
States. The following sections describe and provide analysis for each type of firm.
4 U.S. Department of Commerce, Economics and Statistics Administration, Census Bureau, Survey of Business Owners,
Hispanic-Owned Firms, 2002 and 2007, Survey of Minority-Owned Business Enterprises, Hispanic-Owned Firms: 1987, 1992,
and 1997.
5
TABLE 1
Comparison of Hispanic-Owned Firms to All Firms*
Miami-Dade County, Florida, and United States
2002 and 2007
Firms % Change Receipts % Change
(number) (2002-07) ($1,000) (2002-07)
Miami-Dade
Hispanic-Owned Firms
2002
163,187
26,226,221
2007
244,148 49.6
45,039,001 71.7
All Firms
2002
297,458
161,690,012
2007
403,822 35.8
242,487,467 50.0
Florida
Hispanic-Owned Firms
2002
266,688
40,891,975
2007
450,185 68.8
72,924,313 78.3
All Firms
2002
1,539,207
1,075,802,198
2007
2,010,406 30.6
1,470,112,023 36.7
United States
Hispanic-Owned Firms
2002
1,573,464
221,927,425
2007
2,260,309 43.7
345,183,070 55.5
All Firms
2002
22,974,655
22,603,658,904
2007 27,110,353 18.0 30,181,169,249 33.5 * All firms include firms with paid employees and firms with no paid employees.
Source: U.S. Census Bureau, 2002 and 2007 Economic Census, Survey of Business Owners (SBO), Hispanic-Owned Firms:
SB02-00CS-HISP (RV), August 2006 and 2007 Survey of Business Owners (SBO), Hispanic-Owned Firms: SBO700CSA01.
Compiled by Miami-Dade County, Department of Planning and Zoning, Research Section, 2010.
100,000
600,000
1,100,000
1,600,000
2,100,000
Miami-Dade Florida United States
Chart 1Hispanic -Owned Firms
Miami-Dade, Florida, and United States
2002 2007
59.6%68.8%
43.7%
Source: U.S. Census Bureau, Miami-Dade County, Department of Planning and Zoning, Research Section, 2010.
6
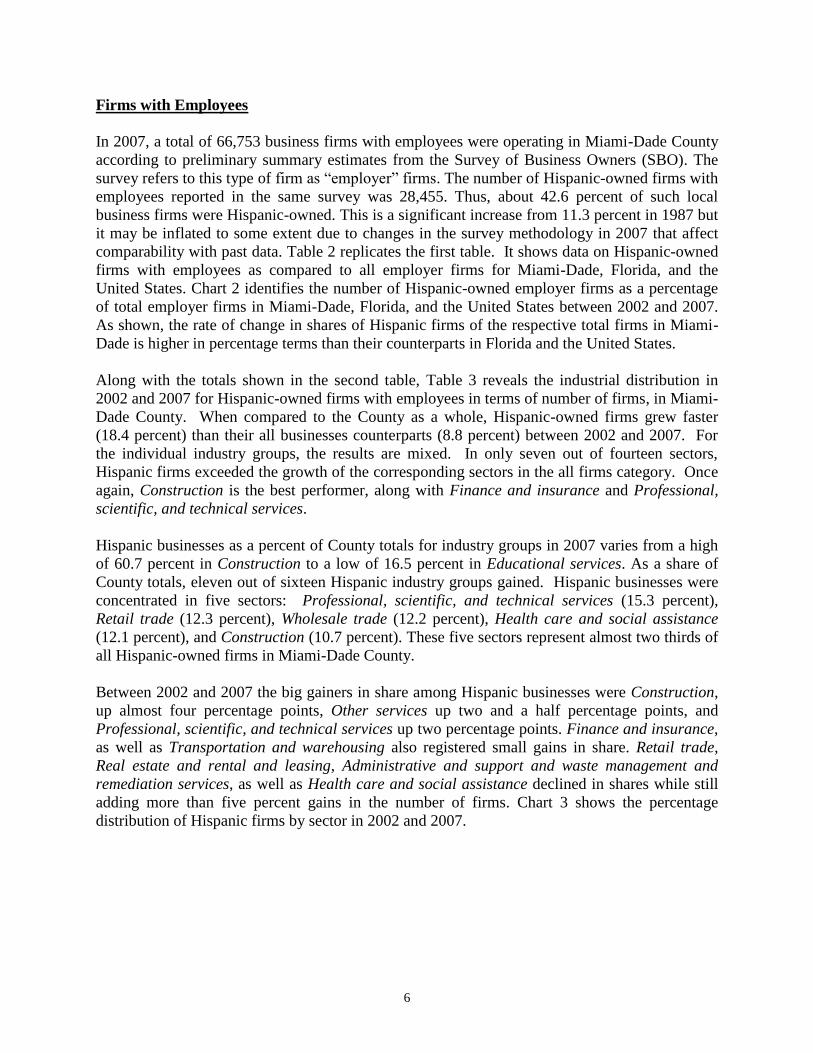
Firms with Employees
In 2007, a total of 66,753 business firms with employees were operating in Miami-Dade County
according to preliminary summary estimates from the Survey of Business Owners (SBO). The
survey refers to this type of firm as “employer” firms. The number of Hispanic-owned firms with
employees reported in the same survey was 28,455. Thus, about 42.6 percent of such local
business firms were Hispanic-owned. This is a significant increase from 11.3 percent in 1987 but
it may be inflated to some extent due to changes in the survey methodology in 2007 that affect
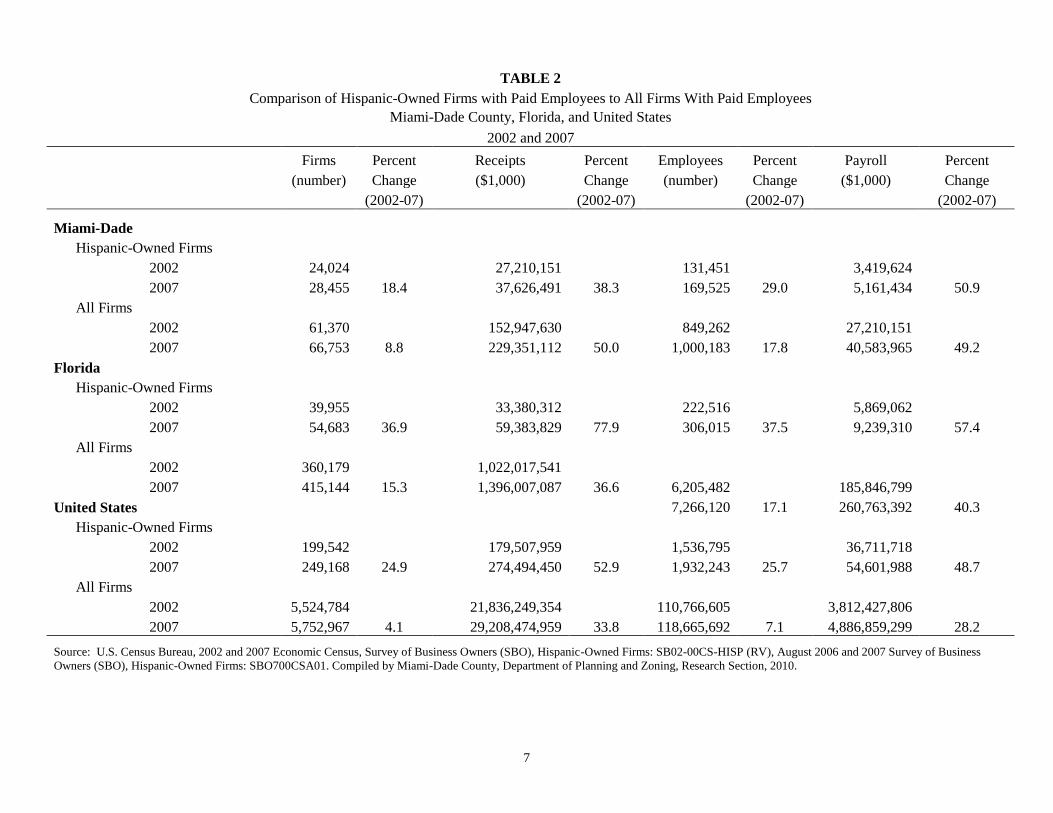
comparability with past data. Table 2 replicates the first table. It shows data on Hispanic-owned
firms with employees as compared to all employer firms for Miami-Dade, Florida, and the
United States. Chart 2 identifies the number of Hispanic-owned employer firms as a percentage
of total employer firms in Miami-Dade, Florida, and the United States between 2002 and 2007.
As shown, the rate of change in shares of Hispanic firms of the respective total firms in Miami-
Dade is higher in percentage terms than their counterparts in Florida and the United States.
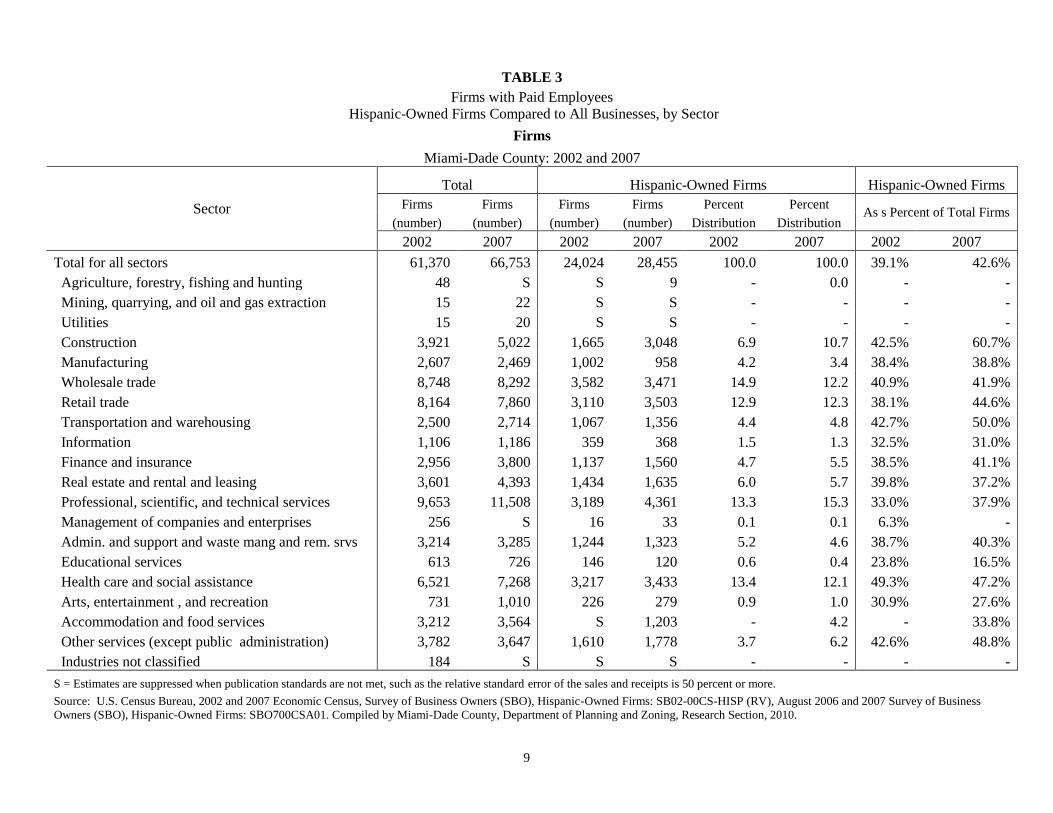
Along with the totals shown in the second table, Table 3 reveals the industrial distribution in
2002 and 2007 for Hispanic-owned firms with employees in terms of number of firms, in Miami-
Dade County. When compared to the County as a whole, Hispanic-owned firms grew faster
(18.4 percent) than their all businesses counterparts (8.8 percent) between 2002 and 2007. For
the individual industry groups, the results are mixed. In only seven out of fourteen sectors,
Hispanic firms exceeded the growth of the corresponding sectors in the all firms category. Once
again, Construction is the best performer, along with Finance and insurance and Professional,
scientific, and technical services.
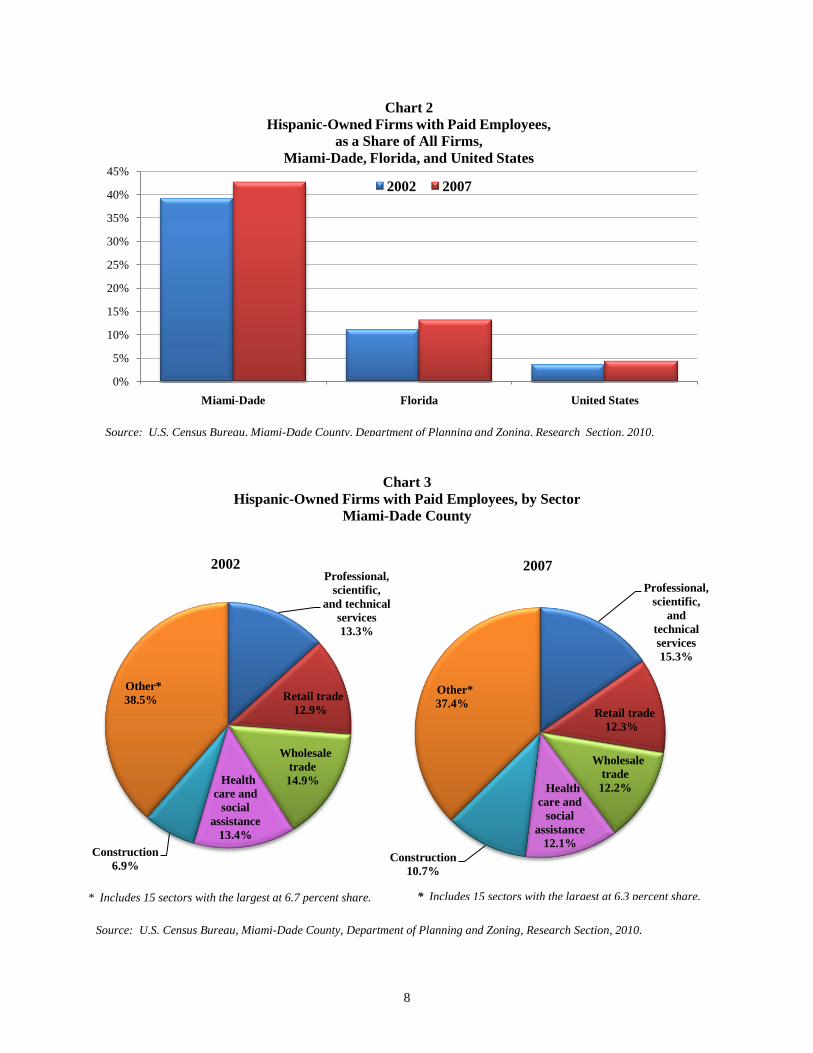
Hispanic businesses as a percent of County totals for industry groups in 2007 varies from a high
of 60.7 percent in Construction to a low of 16.5 percent in Educational services. As a share of
County totals, eleven out of sixteen Hispanic industry groups gained. Hispanic businesses were
concentrated in five sectors: Professional, scientific, and technical services (15.3 percent),
Retail trade (12.3 percent), Wholesale trade (12.2 percent), Health care and social assistance
(12.1 percent), and Construction (10.7 percent). These five sectors represent almost two thirds of
all Hispanic-owned firms in Miami-Dade County.
Between 2002 and 2007 the big gainers in share among Hispanic businesses were Construction,
up almost four percentage points, Other services up two and a half percentage points, and
Professional, scientific, and technical services up two percentage points. Finance and insurance,
as well as Transportation and warehousing also registered small gains in share. Retail trade,
Real estate and rental and leasing, Administrative and support and waste management and
remediation services, as well as Health care and social assistance declined in shares while still
adding more than five percent gains in the number of firms. Chart 3 shows the percentage
distribution of Hispanic firms by sector in 2002 and 2007.
7
TABLE 2
Comparison of Hispanic-Owned Firms with Paid Employees to All Firms With Paid Employees
Miami-Dade County, Florida, and United States
2002 and 2007
Firms Percent Receipts Percent Employees Percent Payroll Percent
(number) Change ($1,000) Change (number) Change ($1,000) Change
(2002-07) (2002-07) (2002-07) (2002-07)
Miami-Dade
Hispanic-Owned Firms
2002 24,024
27,210,151
131,451
3,419,624
2007 28,455 18.4 37,626,491 38.3 169,525 29.0 5,161,434 50.9
All Firms
2002 61,370
152,947,630
849,262
27,210,151
2007 66,753 8.8 229,351,112 50.0 1,000,183 17.8 40,583,965 49.2
Florida
Hispanic-Owned Firms
2002 39,955
33,380,312
222,516
5,869,062
2007 54,683 36.9 59,383,829 77.9 306,015 37.5 9,239,310 57.4
All Firms
2002 360,179
1,022,017,541
2007 415,144 15.3 1,396,007,087 36.6 6,205,482
185,846,799
United States
7,266,120 17.1 260,763,392 40.3
Hispanic-Owned Firms
2002 199,542
179,507,959
1,536,795
36,711,718
2007 249,168 24.9 274,494,450 52.9 1,932,243 25.7 54,601,988 48.7
All Firms
2002 5,524,784
21,836,249,354
110,766,605
3,812,427,806
2007 5,752,967 4.1 29,208,474,959 33.8 118,665,692 7.1 4,886,859,299 28.2
Source: U.S. Census Bureau, 2002 and 2007 Economic Census, Survey of Business Owners (SBO), Hispanic-Owned Firms: SB02-00CS-HISP (RV), August 2006 and 2007 Survey of Business
Owners (SBO), Hispanic-Owned Firms: SBO700CSA01. Compiled by Miami-Dade County, Department of Planning and Zoning, Research Section, 2010.
8
Chart 3
Hispanic-Owned Firms with Paid Employees, by Sector
Miami-Dade County
Source: U.S. Census Bureau, Miami-Dade County, Department of Planning and Zoning, Research Section, 2010.
0%
5%
10%
15%
20%
25%
30%
35%
40%
45%
Miami-Dade Florida United States
Chart 2
Hispanic-Owned Firms with Paid Employees,
as a Share of All Firms,
Miami-Dade, Florida, and United States
2002 2007
Source: U.S. Census Bureau, Miami-Dade County, Department of Planning and Zoning, Research Section, 2010.
Professional,
scientific,
and
technical
services
15.3%
Retail trade
12.3%
Wholesale
trade
12.2%Health
care and
social
assistance
12.1%
Construction
10.7%
Other*
37.4%
2007
* Includes 15 sectors with the largest at 6.3 percent share.
Professional,
scientific,
and technical
services
13.3%
Retail trade
12.9%
Wholesale
trade
14.9%Health
care and
social
assistance
13.4%
Construction
6.9%
Other*
38.5%
2002
* Includes 15 sectors with the largest at 6.7 percent share.
9
TABLE 3
Firms with Paid Employees
Hispanic-Owned Firms Compared to All Businesses, by Sector
Firms
Miami-Dade County: 2002 and 2007
Sector
Total Hispanic-Owned Firms Hispanic-Owned Firms
Firms Firms Firms Firms Percent Percent As s Percent of Total Firms
(number) (number) (number) (number) Distribution Distribution
2002 2007 2002 2007 2002 2007 2002 2007
Total for all sectors 61,370 66,753 24,024 28,455 100.0 100.0 39.1% 42.6%
Agriculture, forestry, fishing and hunting 48 S S 9 - 0.0 - -
Mining, quarrying, and oil and gas extraction 15 22 S S - - - -
Utilities 15 20 S S - - - -
Construction 3,921 5,022 1,665 3,048 6.9 10.7 42.5% 60.7%
Manufacturing 2,607 2,469 1,002 958 4.2 3.4 38.4% 38.8%
Wholesale trade 8,748 8,292 3,582 3,471 14.9 12.2 40.9% 41.9%
Retail trade 8,164 7,860 3,110 3,503 12.9 12.3 38.1% 44.6%
Transportation and warehousing 2,500 2,714 1,067 1,356 4.4 4.8 42.7% 50.0%
Information 1,106 1,186 359 368 1.5 1.3 32.5% 31.0%
Finance and insurance 2,956 3,800 1,137 1,560 4.7 5.5 38.5% 41.1%
Real estate and rental and leasing 3,601 4,393 1,434 1,635 6.0 5.7 39.8% 37.2%
Professional, scientific, and technical services 9,653 11,508 3,189 4,361 13.3 15.3 33.0% 37.9%
Management of companies and enterprises 256 S 16 33 0.1 0.1 6.3% -
Admin. and support and waste mang and rem. srvs 3,214 3,285 1,244 1,323 5.2 4.6 38.7% 40.3%
Educational services 613 726 146 120 0.6 0.4 23.8% 16.5%
Health care and social assistance 6,521 7,268 3,217 3,433 13.4 12.1 49.3% 47.2%
Arts, entertainment , and recreation 731 1,010 226 279 0.9 1.0 30.9% 27.6%
Accommodation and food services 3,212 3,564 S 1,203 - 4.2 - 33.8%
Other services (except public administration) 3,782 3,647 1,610 1,778 3.7 6.2 42.6% 48.8%
Industries not classified 184 S S S - - - -
S = Estimates are suppressed when publication standards are not met, such as the relative standard error of the sales and receipts is 50 percent or more.
Source: U.S. Census Bureau, 2002 and 2007 Economic Census, Survey of Business Owners (SBO), Hispanic-Owned Firms: SB02-00CS-HISP (RV), August 2006 and 2007 Survey of Business
Owners (SBO), Hispanic-Owned Firms: SBO700CSA01. Compiled by Miami-Dade County, Department of Planning and Zoning, Research Section, 2010.
10
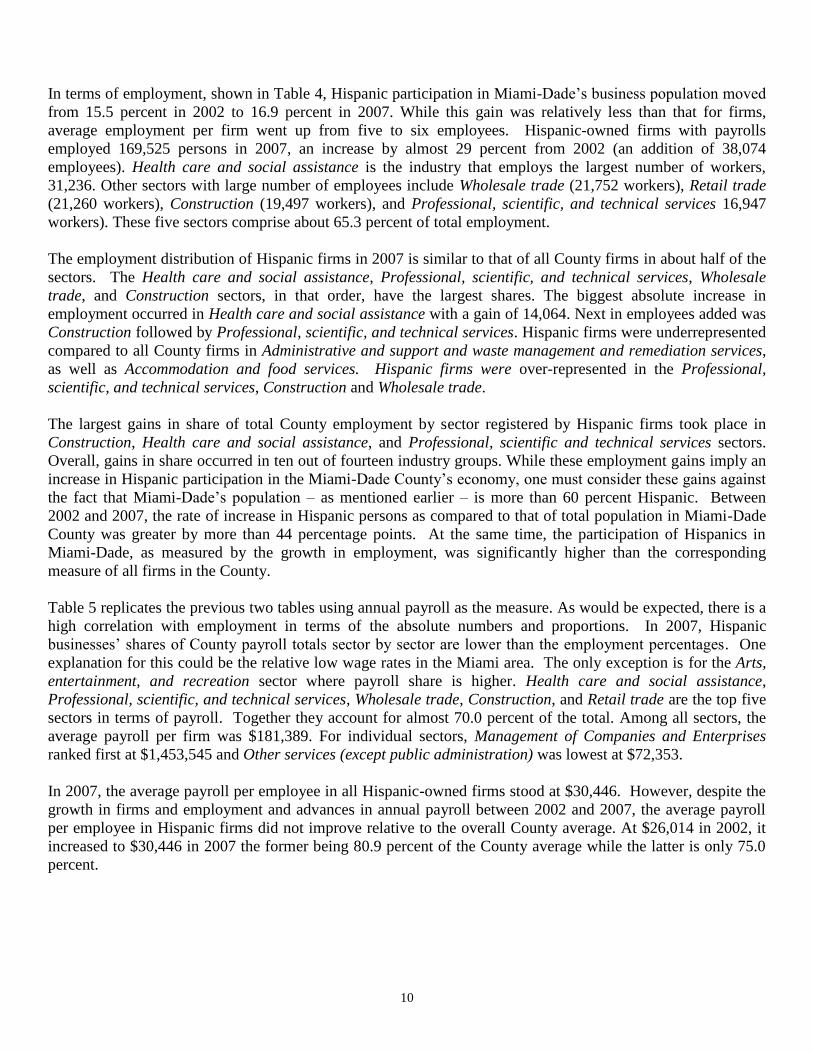
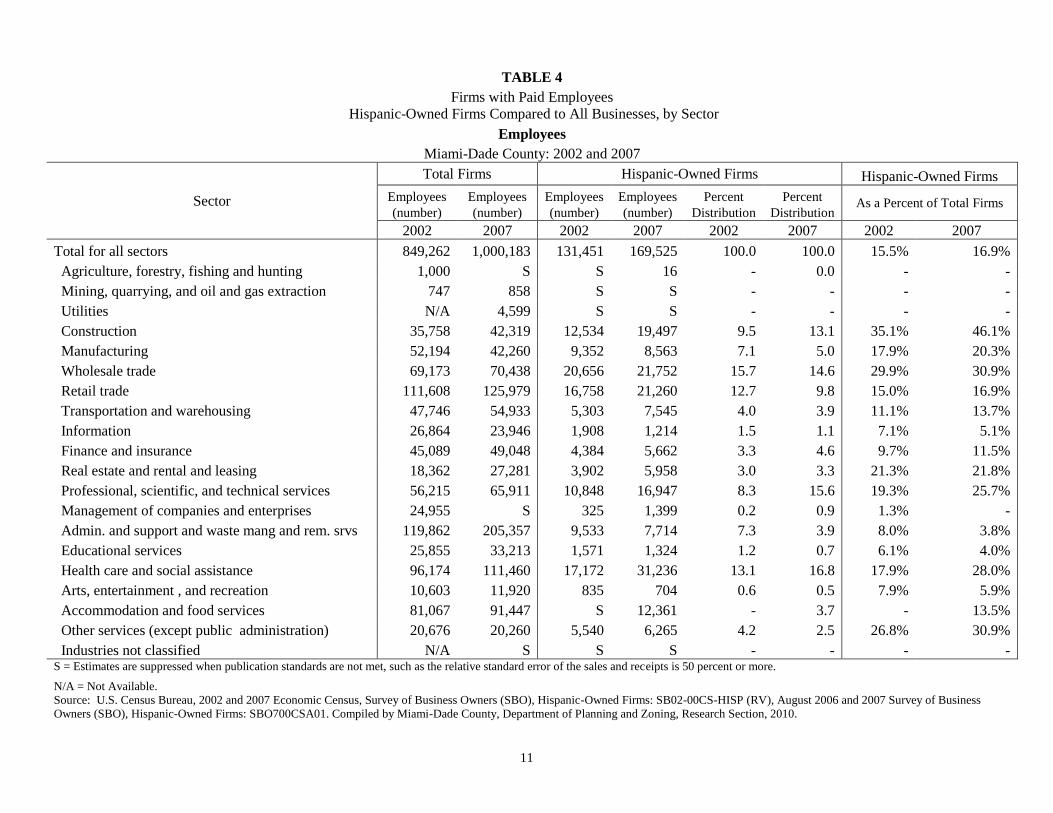
In terms of employment, shown in Table 4, Hispanic participation in Miami-Dade’s business population moved
from 15.5 percent in 2002 to 16.9 percent in 2007. While this gain was relatively less than that for firms,
average employment per firm went up from five to six employees. Hispanic-owned firms with payrolls
employed 169,525 persons in 2007, an increase by almost 29 percent from 2002 (an addition of 38,074
employees). Health care and social assistance is the industry that employs the largest number of workers,
31,236. Other sectors with large number of employees include Wholesale trade (21,752 workers), Retail trade
(21,260 workers), Construction (19,497 workers), and Professional, scientific, and technical services 16,947
workers). These five sectors comprise about 65.3 percent of total employment.
The employment distribution of Hispanic firms in 2007 is similar to that of all County firms in about half of the
sectors. The Health care and social assistance, Professional, scientific, and technical services, Wholesale
trade, and Construction sectors, in that order, have the largest shares. The biggest absolute increase in
employment occurred in Health care and social assistance with a gain of 14,064. Next in employees added was
Construction followed by Professional, scientific, and technical services. Hispanic firms were underrepresented
compared to all County firms in Administrative and support and waste management and remediation services,
as well as Accommodation and food services. Hispanic firms were over-represented in the Professional,
scientific, and technical services, Construction and Wholesale trade.
The largest gains in share of total County employment by sector registered by Hispanic firms took place in
Construction, Health care and social assistance, and Professional, scientific and technical services sectors.
Overall, gains in share occurred in ten out of fourteen industry groups. While these employment gains imply an
increase in Hispanic participation in the Miami-Dade County’s economy, one must consider these gains against
the fact that Miami-Dade’s population – as mentioned earlier – is more than 60 percent Hispanic. Between
2002 and 2007, the rate of increase in Hispanic persons as compared to that of total population in Miami-Dade
County was greater by more than 44 percentage points. At the same time, the participation of Hispanics in
Miami-Dade, as measured by the growth in employment, was significantly higher than the corresponding
measure of all firms in the County.
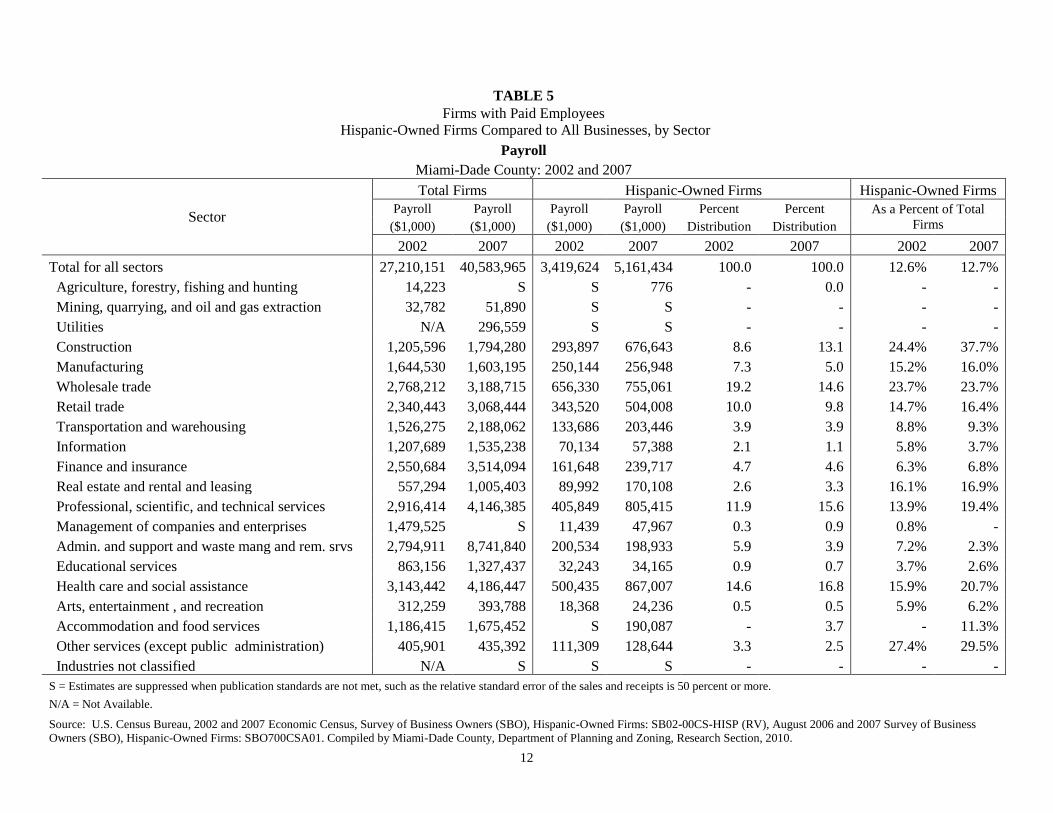
Table 5 replicates the previous two tables using annual payroll as the measure. As would be expected, there is a
high correlation with employment in terms of the absolute numbers and proportions. In 2007, Hispanic
businesses’ shares of County payroll totals sector by sector are lower than the employment percentages. One
explanation for this could be the relative low wage rates in the Miami area. The only exception is for the Arts,
entertainment, and recreation sector where payroll share is higher. Health care and social assistance,
Professional, scientific, and technical services, Wholesale trade, Construction, and Retail trade are the top five
sectors in terms of payroll. Together they account for almost 70.0 percent of the total. Among all sectors, the
average payroll per firm was $181,389. For individual sectors, Management of Companies and Enterprises
ranked first at $1,453,545 and Other services (except public administration) was lowest at $72,353.
In 2007, the average payroll per employee in all Hispanic-owned firms stood at $30,446. However, despite the
growth in firms and employment and advances in annual payroll between 2002 and 2007, the average payroll
per employee in Hispanic firms did not improve relative to the overall County average. At $26,014 in 2002, it
increased to $30,446 in 2007 the former being 80.9 percent of the County average while the latter is only 75.0
percent.
11
TABLE 4
Firms with Paid Employees
Hispanic-Owned Firms Compared to All Businesses, by Sector
Employees
Miami-Dade County: 2002 and 2007
Sector
Total Firms Hispanic-Owned Firms Hispanic-Owned Firms
Employees Employees Employees Employees Percent Percent As a Percent of Total Firms
(number) (number) (number) (number) Distribution Distribution
2002 2007 2002 2007 2002 2007 2002 2007
Total for all sectors 849,262 1,000,183 131,451 169,525 100.0 100.0 15.5% 16.9%
Agriculture, forestry, fishing and hunting 1,000 S S 16 - 0.0 - -
Mining, quarrying, and oil and gas extraction 747 858 S S - - - -
Utilities N/A 4,599 S S - - - -
Construction 35,758 42,319 12,534 19,497 9.5 13.1 35.1% 46.1%
Manufacturing 52,194 42,260 9,352 8,563 7.1 5.0 17.9% 20.3%
Wholesale trade 69,173 70,438 20,656 21,752 15.7 14.6 29.9% 30.9%
Retail trade 111,608 125,979 16,758 21,260 12.7 9.8 15.0% 16.9%
Transportation and warehousing 47,746 54,933 5,303 7,545 4.0 3.9 11.1% 13.7%
Information 26,864 23,946 1,908 1,214 1.5 1.1 7.1% 5.1%
Finance and insurance 45,089 49,048 4,384 5,662 3.3 4.6 9.7% 11.5%
Real estate and rental and leasing 18,362 27,281 3,902 5,958 3.0 3.3 21.3% 21.8%
Professional, scientific, and technical services 56,215 65,911 10,848 16,947 8.3 15.6 19.3% 25.7%
Management of companies and enterprises 24,955 S 325 1,399 0.2 0.9 1.3% -
Admin. and support and waste mang and rem. srvs 119,862 205,357 9,533 7,714 7.3 3.9 8.0% 3.8%
Educational services 25,855 33,213 1,571 1,324 1.2 0.7 6.1% 4.0%
Health care and social assistance 96,174 111,460 17,172 31,236 13.1 16.8 17.9% 28.0%
Arts, entertainment , and recreation 10,603 11,920 835 704 0.6 0.5 7.9% 5.9%
Accommodation and food services 81,067 91,447 S 12,361 - 3.7 - 13.5%
Other services (except public administration) 20,676 20,260 5,540 6,265 4.2 2.5 26.8% 30.9%
Industries not classified N/A S S S - - - - S = Estimates are suppressed when publication standards are not met, such as the relative standard error of the sales and receipts is 50 percent or more.
N/A = Not Available.
Source: U.S. Census Bureau, 2002 and 2007 Economic Census, Survey of Business Owners (SBO), Hispanic-Owned Firms: SB02-00CS-HISP (RV), August 2006 and 2007 Survey of Business
Owners (SBO), Hispanic-Owned Firms: SBO700CSA01. Compiled by Miami-Dade County, Department of Planning and Zoning, Research Section, 2010.
12
TABLE 5
Firms with Paid Employees
Hispanic-Owned Firms Compared to All Businesses, by Sector
Payroll
Miami-Dade County: 2002 and 2007
Sector
Total Firms Hispanic-Owned Firms Hispanic-Owned Firms
Payroll Payroll Payroll Payroll Percent Percent As a Percent of Total
Firms ($1,000) ($1,000) ($1,000) ($1,000) Distribution Distribution
2002 2007 2002 2007 2002 2007 2002 2007
Total for all sectors 27,210,151 40,583,965 3,419,624 5,161,434 100.0 100.0 12.6% 12.7%
Agriculture, forestry, fishing and hunting 14,223 S S 776 - 0.0 - -
Mining, quarrying, and oil and gas extraction 32,782 51,890 S S - - - -
Utilities N/A 296,559 S S - - - -
Construction 1,205,596 1,794,280 293,897 676,643 8.6 13.1 24.4% 37.7%
Manufacturing 1,644,530 1,603,195 250,144 256,948 7.3 5.0 15.2% 16.0%
Wholesale trade 2,768,212 3,188,715 656,330 755,061 19.2 14.6 23.7% 23.7%
Retail trade 2,340,443 3,068,444 343,520 504,008 10.0 9.8 14.7% 16.4%
Transportation and warehousing 1,526,275 2,188,062 133,686 203,446 3.9 3.9 8.8% 9.3%
Information 1,207,689 1,535,238 70,134 57,388 2.1 1.1 5.8% 3.7%
Finance and insurance 2,550,684 3,514,094 161,648 239,717 4.7 4.6 6.3% 6.8%
Real estate and rental and leasing 557,294 1,005,403 89,992 170,108 2.6 3.3 16.1% 16.9%
Professional, scientific, and technical services 2,916,414 4,146,385 405,849 805,415 11.9 15.6 13.9% 19.4%
Management of companies and enterprises 1,479,525 S 11,439 47,967 0.3 0.9 0.8% -
Admin. and support and waste mang and rem. srvs 2,794,911 8,741,840 200,534 198,933 5.9 3.9 7.2% 2.3%
Educational services 863,156 1,327,437 32,243 34,165 0.9 0.7 3.7% 2.6%
Health care and social assistance 3,143,442 4,186,447 500,435 867,007 14.6 16.8 15.9% 20.7%
Arts, entertainment , and recreation 312,259 393,788 18,368 24,236 0.5 0.5 5.9% 6.2%
Accommodation and food services 1,186,415 1,675,452 S 190,087 - 3.7 - 11.3%
Other services (except public administration) 405,901 435,392 111,309 128,644 3.3 2.5 27.4% 29.5%
Industries not classified N/A S S S - - - -
S = Estimates are suppressed when publication standards are not met, such as the relative standard error of the sales and receipts is 50 percent or more.
N/A = Not Available.
Source: U.S. Census Bureau, 2002 and 2007 Economic Census, Survey of Business Owners (SBO), Hispanic-Owned Firms: SB02-00CS-HISP (RV), August 2006 and 2007 Survey of Business
Owners (SBO), Hispanic-Owned Firms: SBO700CSA01. Compiled by Miami-Dade County, Department of Planning and Zoning, Research Section, 2010.
13
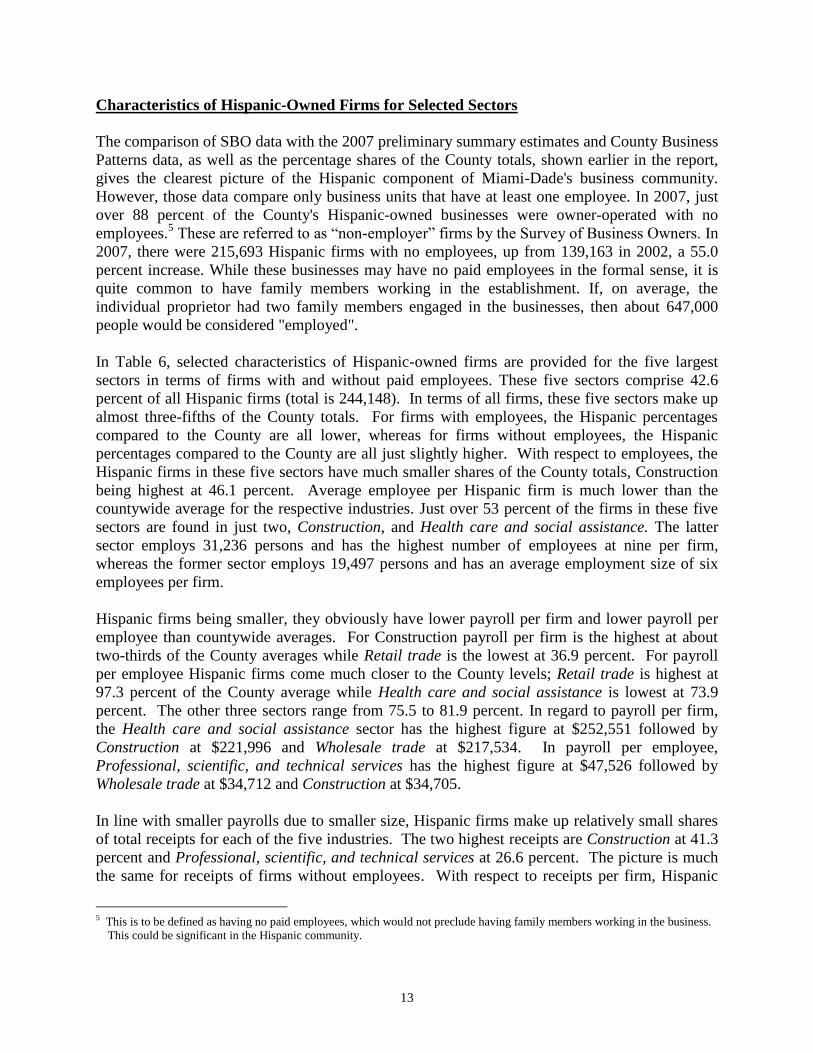
Characteristics of Hispanic-Owned Firms for Selected Sectors
The comparison of SBO data with the 2007 preliminary summary estimates and County Business
Patterns data, as well as the percentage shares of the County totals, shown earlier in the report,
gives the clearest picture of the Hispanic component of Miami-Dade's business community.
However, those data compare only business units that have at least one employee. In 2007, just
over 88 percent of the County's Hispanic-owned businesses were owner-operated with no
employees.5 These are referred to as “non-employer” firms by the Survey of Business Owners. In
2007, there were 215,693 Hispanic firms with no employees, up from 139,163 in 2002, a 55.0
percent increase. While these businesses may have no paid employees in the formal sense, it is
quite common to have family members working in the establishment. If, on average, the
individual proprietor had two family members engaged in the businesses, then about 647,000
people would be considered "employed".
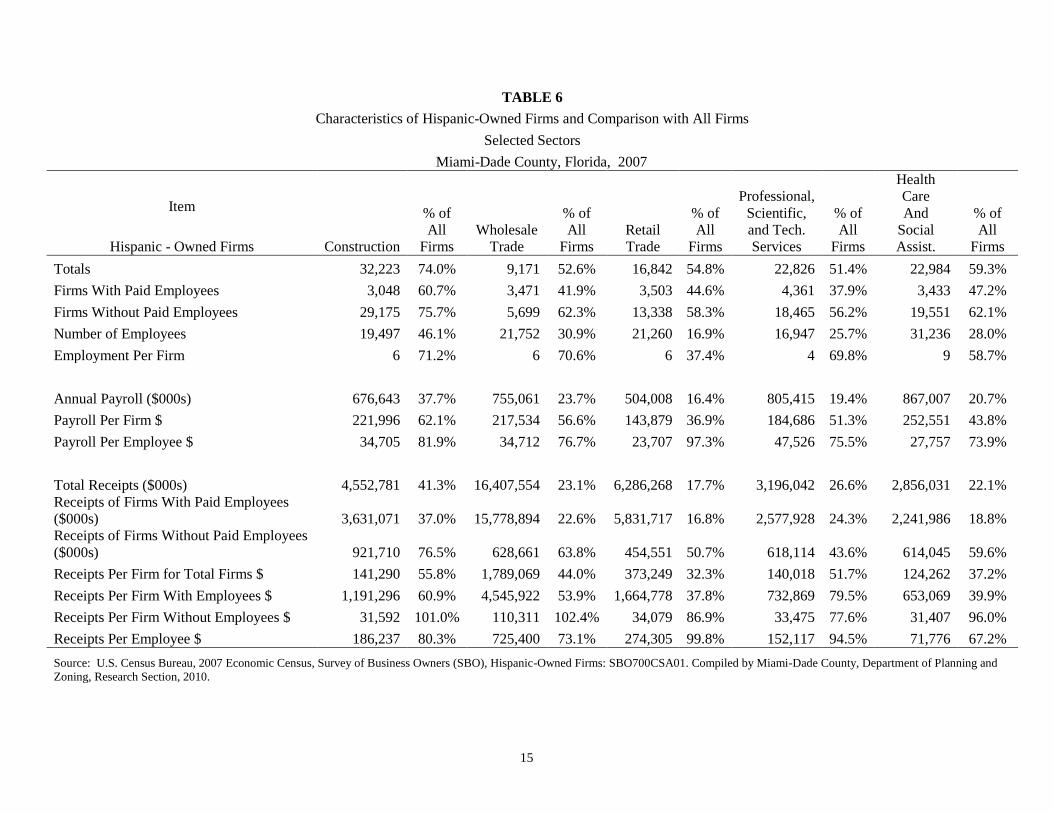
In Table 6, selected characteristics of Hispanic-owned firms are provided for the five largest
sectors in terms of firms with and without paid employees. These five sectors comprise 42.6
percent of all Hispanic firms (total is 244,148). In terms of all firms, these five sectors make up
almost three-fifths of the County totals. For firms with employees, the Hispanic percentages
compared to the County are all lower, whereas for firms without employees, the Hispanic
percentages compared to the County are all just slightly higher. With respect to employees, the
Hispanic firms in these five sectors have much smaller shares of the County totals, Construction
being highest at 46.1 percent. Average employee per Hispanic firm is much lower than the
countywide average for the respective industries. Just over 53 percent of the firms in these five
sectors are found in just two, Construction, and Health care and social assistance. The latter
sector employs 31,236 persons and has the highest number of employees at nine per firm,
whereas the former sector employs 19,497 persons and has an average employment size of six
employees per firm.
Hispanic firms being smaller, they obviously have lower payroll per firm and lower payroll per
employee than countywide averages. For Construction payroll per firm is the highest at about
two-thirds of the County averages while Retail trade is the lowest at 36.9 percent. For payroll
per employee Hispanic firms come much closer to the County levels; Retail trade is highest at
97.3 percent of the County average while Health care and social assistance is lowest at 73.9
percent. The other three sectors range from 75.5 to 81.9 percent. In regard to payroll per firm,
the Health care and social assistance sector has the highest figure at $252,551 followed by
Construction at $221,996 and Wholesale trade at $217,534. In payroll per employee,
Professional, scientific, and technical services has the highest figure at $47,526 followed by
Wholesale trade at $34,712 and Construction at $34,705.
In line with smaller payrolls due to smaller size, Hispanic firms make up relatively small shares
of total receipts for each of the five industries. The two highest receipts are Construction at 41.3
percent and Professional, scientific, and technical services at 26.6 percent. The picture is much
the same for receipts of firms without employees. With respect to receipts per firm, Hispanic
5 This is to be defined as having no paid employees, which would not preclude having family members working in the business.
This could be significant in the Hispanic community.
14
businesses show up somewhat better. For all Hispanic firms, Construction is nearly 56 percent
of the County average and Professional, scientific, and technical services is almost 52 percent.
Considering only firms with employees these percentages on the whole inch up a bit. However,
examination of the figures for receipts per employee reveals that Hispanic firms are much more
on par with county measures. In fact, for Retail trade firms Hispanics are close to 100 percent of
the County level and Professional, scientific, and technical services is almost 95 percent.
In terms of receipts, there is a large disparity between firms with and without paid employees.
Near the bottom of Table 6 are shown the receipts per firm for firms with employees. The same
variable for firms without employees is only a fraction of these values. Sector by sector they are
as follows: Construction 2.7 percent, Wholesale trade 2.4 percent, Retail trade 2.0 percent,
Professional, scientific, and technical services 5.7 percent, and Health care and social assistance
4.8 percent. These percentages represent a very low level of returns. The lowest is $31,407 in
Health care and social assistance with Construction at $31,592 and Professional, scientific, and
technical services at $33,475. Thus, it should be clear that the per capita earnings in these
Hispanic firms without employees are very low. Nevertheless, the earnings in these Hispanic
firms fall in line with the earnings of all firms without employees, in part because they constitute
a majority of such firms.
15
TABLE 6
Characteristics of Hispanic-Owned Firms and Comparison with All Firms
Selected Sectors
Miami-Dade County, Florida, 2007
Item
Construction
% of
All
Firms
Wholesale
Trade
% of
All
Firms
Retail
Trade
% of
All
Firms
Professional,
Scientific,
and Tech.
Services
% of
All
Firms
Health
Care
And
Social
Assist.
% of
All
Firms Hispanic - Owned Firms
Totals 32,223 74.0% 9,171 52.6% 16,842 54.8% 22,826 51.4% 22,984 59.3%
Firms With Paid Employees 3,048 60.7% 3,471 41.9% 3,503 44.6% 4,361 37.9% 3,433 47.2%
Firms Without Paid Employees 29,175 75.7% 5,699 62.3% 13,338 58.3% 18,465 56.2% 19,551 62.1%
Number of Employees 19,497 46.1% 21,752 30.9% 21,260 16.9% 16,947 25.7% 31,236 28.0%
Employment Per Firm 6 71.2% 6 70.6% 6 37.4% 4 69.8% 9 58.7%
Annual Payroll ($000s) 676,643 37.7% 755,061 23.7% 504,008 16.4% 805,415 19.4% 867,007 20.7%
Payroll Per Firm $ 221,996 62.1% 217,534 56.6% 143,879 36.9% 184,686 51.3% 252,551 43.8%
Payroll Per Employee $ 34,705 81.9% 34,712 76.7% 23,707 97.3% 47,526 75.5% 27,757 73.9%
Total Receipts ($000s) 4,552,781 41.3% 16,407,554 23.1% 6,286,268 17.7% 3,196,042 26.6% 2,856,031 22.1%
Receipts of Firms With Paid Employees
($000s) 3,631,071 37.0% 15,778,894 22.6% 5,831,717 16.8% 2,577,928 24.3% 2,241,986 18.8%
Receipts of Firms Without Paid Employees
($000s) 921,710 76.5% 628,661 63.8% 454,551 50.7% 618,114 43.6% 614,045 59.6%
Receipts Per Firm for Total Firms $ 141,290 55.8% 1,789,069 44.0% 373,249 32.3% 140,018 51.7% 124,262 37.2%
Receipts Per Firm With Employees $ 1,191,296 60.9% 4,545,922 53.9% 1,664,778 37.8% 732,869 79.5% 653,069 39.9%
Receipts Per Firm Without Employees $ 31,592 101.0% 110,311 102.4% 34,079 86.9% 33,475 77.6% 31,407 96.0%
Receipts Per Employee $ 186,237 80.3% 725,400 73.1% 274,305 99.8% 152,117 94.5% 71,776 67.2%
Source: U.S. Census Bureau, 2007 Economic Census, Survey of Business Owners (SBO), Hispanic-Owned Firms: SBO700CSA01. Compiled by Miami-Dade County, Department of Planning and
Zoning, Research Section, 2010.
16
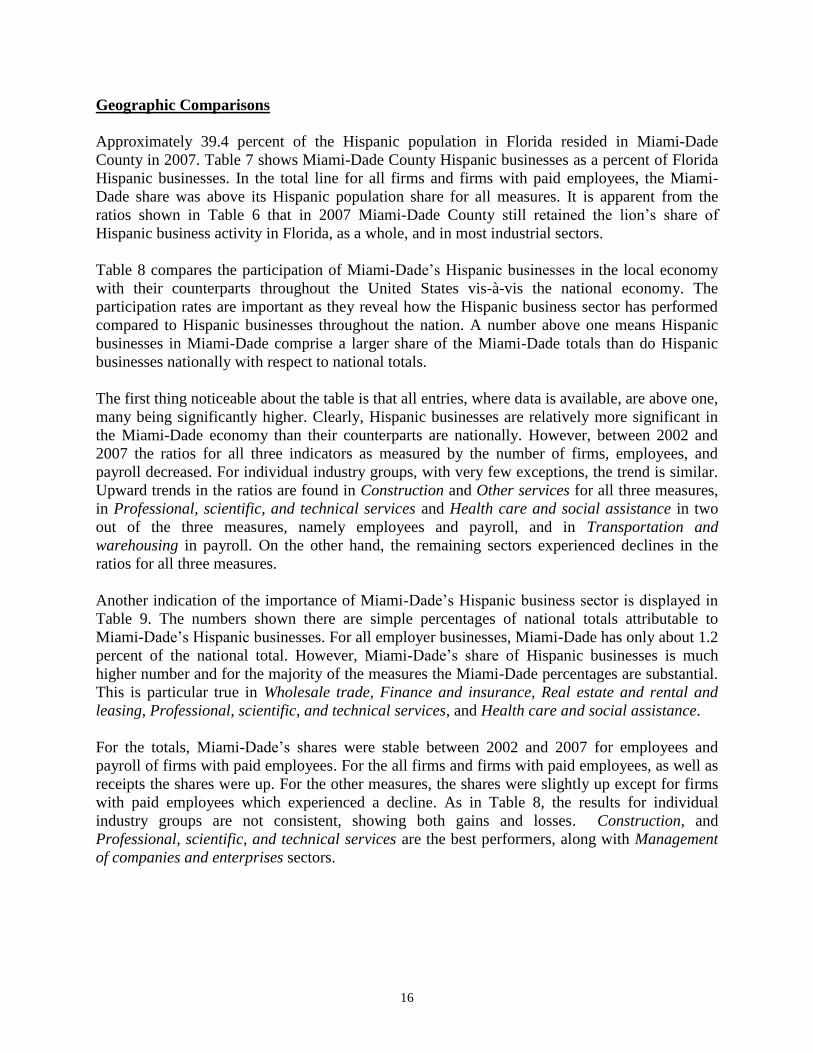
Geographic Comparisons
Approximately 39.4 percent of the Hispanic population in Florida resided in Miami-Dade
County in 2007. Table 7 shows Miami-Dade County Hispanic businesses as a percent of Florida
Hispanic businesses. In the total line for all firms and firms with paid employees, the Miami-
Dade share was above its Hispanic population share for all measures. It is apparent from the
ratios shown in Table 6 that in 2007 Miami-Dade County still retained the lion’s share of
Hispanic business activity in Florida, as a whole, and in most industrial sectors.
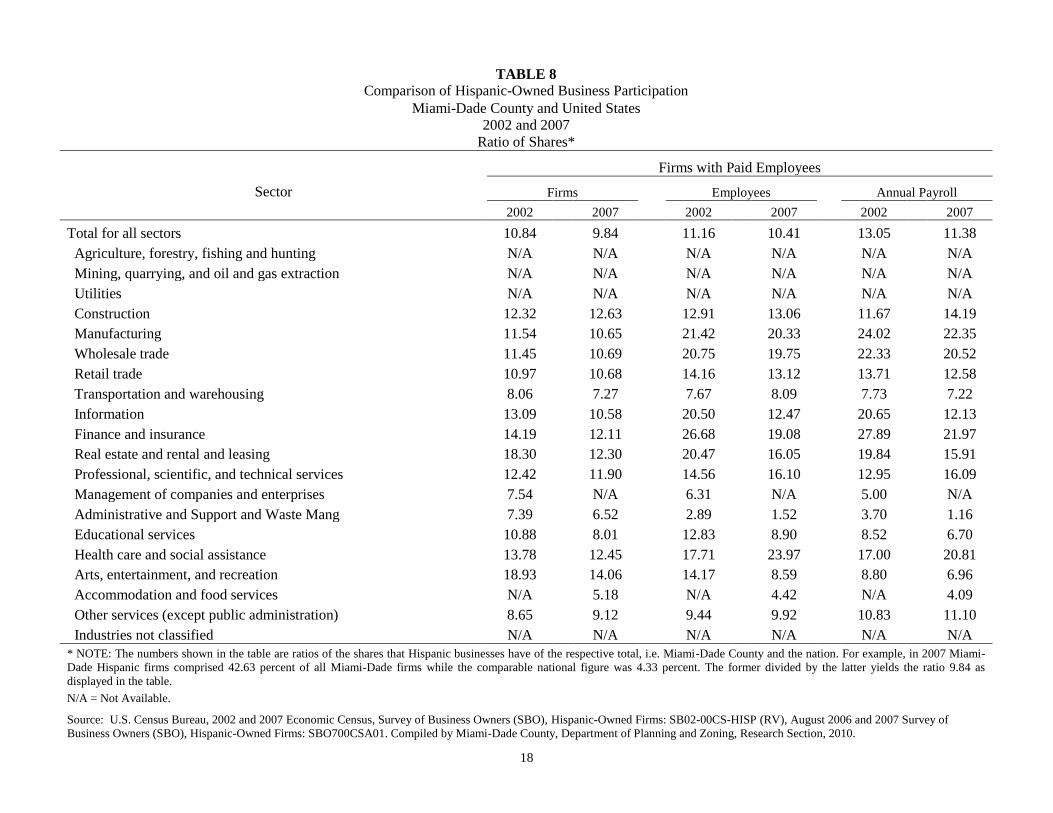
Table 8 compares the participation of Miami-Dade’s Hispanic businesses in the local economy
with their counterparts throughout the United States vis-à-vis the national economy. The
participation rates are important as they reveal how the Hispanic business sector has performed
compared to Hispanic businesses throughout the nation. A number above one means Hispanic
businesses in Miami-Dade comprise a larger share of the Miami-Dade totals than do Hispanic
businesses nationally with respect to national totals.
The first thing noticeable about the table is that all entries, where data is available, are above one,
many being significantly higher. Clearly, Hispanic businesses are relatively more significant in
the Miami-Dade economy than their counterparts are nationally. However, between 2002 and
2007 the ratios for all three indicators as measured by the number of firms, employees, and
payroll decreased. For individual industry groups, with very few exceptions, the trend is similar.
Upward trends in the ratios are found in Construction and Other services for all three measures,
in Professional, scientific, and technical services and Health care and social assistance in two
out of the three measures, namely employees and payroll, and in Transportation and
warehousing in payroll. On the other hand, the remaining sectors experienced declines in the
ratios for all three measures.
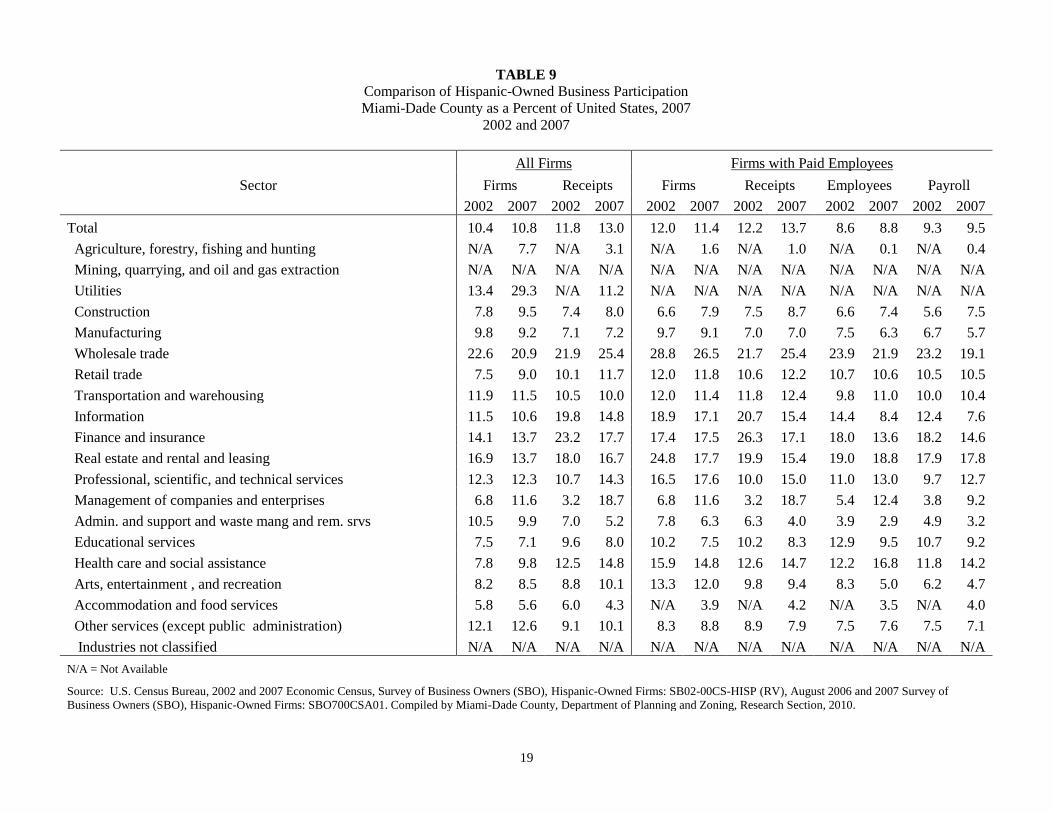
Another indication of the importance of Miami-Dade’s Hispanic business sector is displayed in
Table 9. The numbers shown there are simple percentages of national totals attributable to
Miami-Dade’s Hispanic businesses. For all employer businesses, Miami-Dade has only about 1.2
percent of the national total. However, Miami-Dade’s share of Hispanic businesses is much
higher number and for the majority of the measures the Miami-Dade percentages are substantial.
This is particular true in Wholesale trade, Finance and insurance, Real estate and rental and
leasing, Professional, scientific, and technical services, and Health care and social assistance.
For the totals, Miami-Dade’s shares were stable between 2002 and 2007 for employees and
payroll of firms with paid employees. For the all firms and firms with paid employees, as well as
receipts the shares were up. For the other measures, the shares were slightly up except for firms
with paid employees which experienced a decline. As in Table 8, the results for individual
industry groups are not consistent, showing both gains and losses. Construction, and
Professional, scientific, and technical services are the best performers, along with Management
of companies and enterprises sectors.
17
TABLE 7
Comparison of Hispanic-Owned Business Participation
Miami-Dade County as a Percent of State of Florida
2002 and 2007
All Firms Firms with Paid Employees
Sector Firms Receipts Firms Receipts Employees Payroll
2002 2007 2002 2007 2002 2007 2002 2007 2002 2007 2002 2007
Total 61.2 54.2 64.1 61.8 60.1 52.0 65.5 63.4 59.1 55.4 58.3 55.9
Agriculture, forestry, fishing and hunting N/A 33.9 N/A 22.4 N/A 13.8 N/A 19.2 N/A 2.5 N/A 10.8
Mining, quarrying, and oil and gas extraction N/A N/A N/A N/A N/A N/A N/A N/A N/A N/A N/A N/A
Utilities N/A 76.7 N/A 68.2 N/A N/A N/A N/A N/A N/A N/A N/A
Construction 54.1 51.4 52.9 47.8 48.0 38.7 56.2 38.1 55.6 44.5 52.9 48.6
Manufacturing 64.3 55.3 60.3 68.7 66.2 59.2 60.3 63.5 63.5 64.2 60.6 63.0
Wholesale trade 69.4 65.1 74.9 74.4 71.2 68.2 74.8 71.6 73.0 73.5 73.3 68.8
Retail trade 56.4 54.1 63.9 60.5 60.4 56.2 65.3 56.1 66.5 64.4 64.2 61.5
Transportation and warehousing 65.1 54.7 57.4 63.0 69.5 58.4 58.2 35.6 55.5 72.3 57.2 71.4
Information 60.0 51.2 79.8 64.2 71.9 53.5 81.3 54.3 74.7 53.4 73.3 47.8
Finance and insurance 61.8 55.9 79.3 67.9 65.6 65.1 83.7 69.6 68.7 63.7 73.2 64.6
Real estate and rental and leasing 65.8 50.2 66.9 58.2 70.5 52.3 65.6 54.3 70.5 62.1 59.1 63.6
Professional, scientific, and technical services 62.6 56.1 61.9 60.1 61.3 59.3 58.8 62.2 58.1 57.0 57.5 58.0
Management of companies and enterprises 44.4 64.7 N/A 64.7 44.4 64.7 N/A 64.7 N/A 69.3 N/A 59.5
Admin. and support and waste mang and rem. srvs 61.7 49.3 53.0 41.7 50.3 38.1 50.9 39.9 47.0 35.9 42.0 38.7
Educational services 58.9 47.0 73.5 40.5 58.4 38.0 76.7 39.4 78.6 48.7 78.7 43.0
Health care and social assistance 63.0 58.2 54.7 54.7 57.6 50.5 52.7 52.3 57.7 62.3 51.3 52.9
Arts, entertainment , and recreation 52.7 52.7 37.9 63.2 N/A 56.8 N/A 67.6 N/A 61.6 N/A 65.5
Accommodation and food services 60.0 47.6 62.8 41.5 N/A 42.1 N/A 42.3 N/A 36.7 N/A 41.4
Other services (except public administration) 63.1 59.0 56.3 54.9 52.3 45.5 61.2 51.5 52.0 46.5 56.8 46.1
Industries not classified N/A N/A N/A N/A N/A N/A N/A N/A N/A N/A N/A N/A
N/A = Not Available
Source: U.S. Census Bureau, 2002 and 2007 Economic Census, Survey of Business Owners (SBO), Hispanic-Owned Firms: SB02-00CS-HISP (RV), August 2006 and 2007
Survey of Business Owners (SBO), Hispanic-Owned Firms: SBO700CSA01. Compiled by Miami-Dade County, Department of Planning and Zoning, Research Section, 2010.
18
TABLE 8
Comparison of Hispanic-Owned Business Participation
Miami-Dade County and United States
2002 and 2007
Ratio of Shares*
Firms with Paid Employees
Sector Firms
Employees
Annual Payroll
2002 2007 2002 2007 2002 2007
Total for all sectors 10.84
9.84
11.16
10.41
13.05
11.38
Agriculture, forestry, fishing and hunting N/A
N/A
N/A
N/A
N/A
N/A
Mining, quarrying, and oil and gas extraction N/A
N/A
N/A
N/A
N/A
N/A
Utilities N/A
N/A
N/A
N/A
N/A
N/A
Construction 12.32
12.63
12.91
13.06
11.67
14.19
Manufacturing 11.54
10.65
21.42
20.33
24.02
22.35
Wholesale trade 11.45
10.69
20.75
19.75
22.33
20.52
Retail trade 10.97
10.68
14.16
13.12
13.71
12.58
Transportation and warehousing 8.06
7.27
7.67
8.09
7.73
7.22
Information 13.09
10.58
20.50
12.47
20.65
12.13
Finance and insurance 14.19
12.11
26.68
19.08
27.89
21.97
Real estate and rental and leasing 18.30
12.30
20.47
16.05
19.84
15.91
Professional, scientific, and technical services 12.42
11.90
14.56
16.10
12.95
16.09
Management of companies and enterprises 7.54
N/A
6.31
N/A
5.00
N/A
Administrative and Support and Waste Mang 7.39
6.52
2.89
1.52
3.70
1.16
Educational services 10.88
8.01
12.83
8.90
8.52
6.70
Health care and social assistance 13.78
12.45
17.71
23.97
17.00
20.81
Arts, entertainment, and recreation 18.93
14.06
14.17
8.59
8.80
6.96
Accommodation and food services N/A
5.18
N/A
4.42
N/A
4.09
Other services (except public administration) 8.65
9.12
9.44
9.92
10.83
11.10
Industries not classified N/A N/A N/A N/A N/A N/A
* NOTE: The numbers shown in the table are ratios of the shares that Hispanic businesses have of the respective total, i.e. Miami-Dade County and the nation. For example, in 2007 Miami-
Dade Hispanic firms comprised 42.63 percent of all Miami-Dade firms while the comparable national figure was 4.33 percent. The former divided by the latter yields the ratio 9.84 as
displayed in the table.
N/A = Not Available.
Source: U.S. Census Bureau, 2002 and 2007 Economic Census, Survey of Business Owners (SBO), Hispanic-Owned Firms: SB02-00CS-HISP (RV), August 2006 and 2007 Survey of
Business Owners (SBO), Hispanic-Owned Firms: SBO700CSA01. Compiled by Miami-Dade County, Department of Planning and Zoning, Research Section, 2010.
19
TABLE 9
Comparison of Hispanic-Owned Business Participation
Miami-Dade County as a Percent of United States, 2007
2002 and 2007
All Firms Firms with Paid Employees
Sector Firms Receipts Firms Receipts Employees Payroll
2002 2007 2002 2007 2002 2007 2002 2007 2002 2007 2002 2007
Total 10.4 10.8 11.8 13.0 12.0 11.4 12.2 13.7 8.6 8.8 9.3 9.5
Agriculture, forestry, fishing and hunting N/A 7.7 N/A 3.1 N/A 1.6 N/A 1.0 N/A 0.1 N/A 0.4
Mining, quarrying, and oil and gas extraction N/A N/A N/A N/A N/A N/A N/A N/A N/A N/A N/A N/A
Utilities 13.4 29.3 N/A 11.2 N/A N/A N/A N/A N/A N/A N/A N/A
Construction 7.8 9.5 7.4 8.0 6.6 7.9 7.5 8.7 6.6 7.4 5.6 7.5
Manufacturing 9.8 9.2 7.1 7.2 9.7 9.1 7.0 7.0 7.5 6.3 6.7 5.7
Wholesale trade 22.6 20.9 21.9 25.4 28.8 26.5 21.7 25.4 23.9 21.9 23.2 19.1
Retail trade 7.5 9.0 10.1 11.7 12.0 11.8 10.6 12.2 10.7 10.6 10.5 10.5
Transportation and warehousing 11.9 11.5 10.5 10.0 12.0 11.4 11.8 12.4 9.8 11.0 10.0 10.4
Information 11.5 10.6 19.8 14.8 18.9 17.1 20.7 15.4 14.4 8.4 12.4 7.6
Finance and insurance 14.1 13.7 23.2 17.7 17.4 17.5 26.3 17.1 18.0 13.6 18.2 14.6
Real estate and rental and leasing 16.9 13.7 18.0 16.7 24.8 17.7 19.9 15.4 19.0 18.8 17.9 17.8
Professional, scientific, and technical services 12.3 12.3 10.7 14.3 16.5 17.6 10.0 15.0 11.0 13.0 9.7 12.7
Management of companies and enterprises 6.8 11.6 3.2 18.7 6.8 11.6 3.2 18.7 5.4 12.4 3.8 9.2
Admin. and support and waste mang and rem. srvs 10.5 9.9 7.0 5.2 7.8 6.3 6.3 4.0 3.9 2.9 4.9 3.2
Educational services 7.5 7.1 9.6 8.0 10.2 7.5 10.2 8.3 12.9 9.5 10.7 9.2
Health care and social assistance 7.8 9.8 12.5 14.8 15.9 14.8 12.6 14.7 12.2 16.8 11.8 14.2
Arts, entertainment , and recreation 8.2 8.5 8.8 10.1 13.3 12.0 9.8 9.4 8.3 5.0 6.2 4.7
Accommodation and food services 5.8 5.6 6.0 4.3 N/A 3.9 N/A 4.2 N/A 3.5 N/A 4.0
Other services (except public administration) 12.1 12.6 9.1 10.1 8.3 8.8 8.9 7.9 7.5 7.6 7.5 7.1
Industries not classified N/A N/A N/A N/A N/A N/A N/A N/A N/A N/A N/A N/A
N/A = Not Available
Source: U.S. Census Bureau, 2002 and 2007 Economic Census, Survey of Business Owners (SBO), Hispanic-Owned Firms: SB02-00CS-HISP (RV), August 2006 and 2007 Survey of
Business Owners (SBO), Hispanic-Owned Firms: SBO700CSA01. Compiled by Miami-Dade County, Department of Planning and Zoning, Research Section, 2010.
20
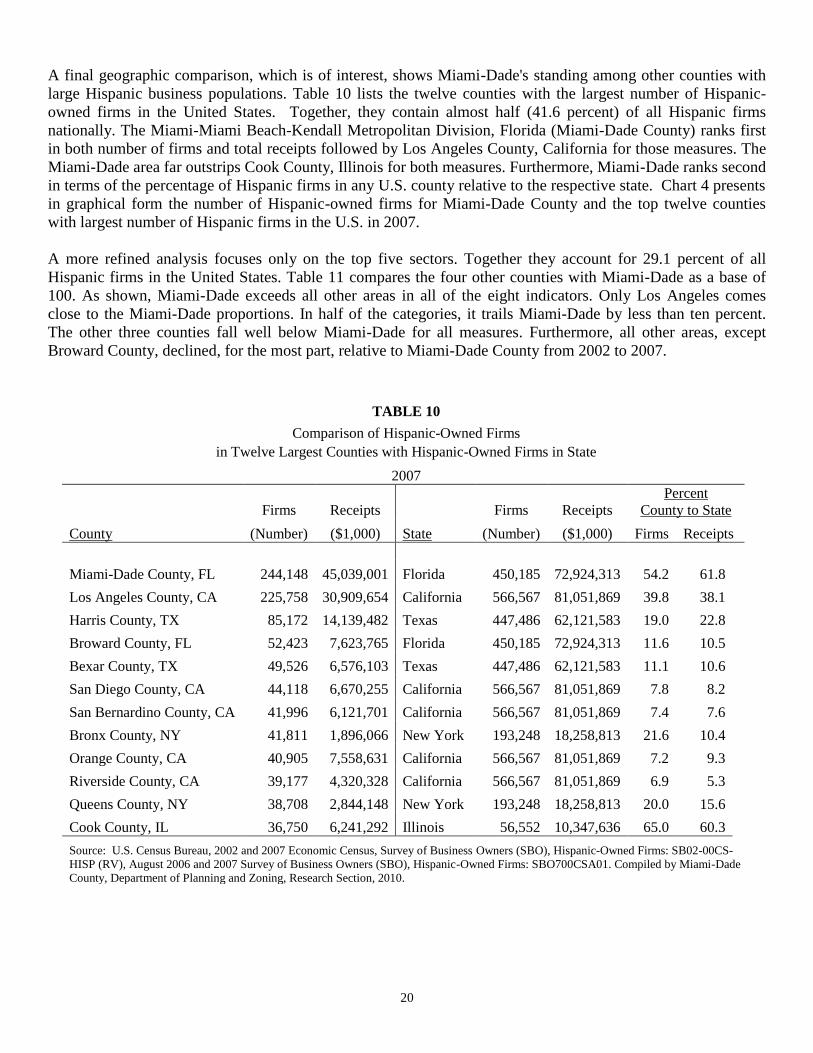
A final geographic comparison, which is of interest, shows Miami-Dade's standing among other counties with
large Hispanic business populations. Table 10 lists the twelve counties with the largest number of Hispanic-
owned firms in the United States. Together, they contain almost half (41.6 percent) of all Hispanic firms
nationally. The Miami-Miami Beach-Kendall Metropolitan Division, Florida (Miami-Dade County) ranks first
in both number of firms and total receipts followed by Los Angeles County, California for those measures. The
Miami-Dade area far outstrips Cook County, Illinois for both measures. Furthermore, Miami-Dade ranks second
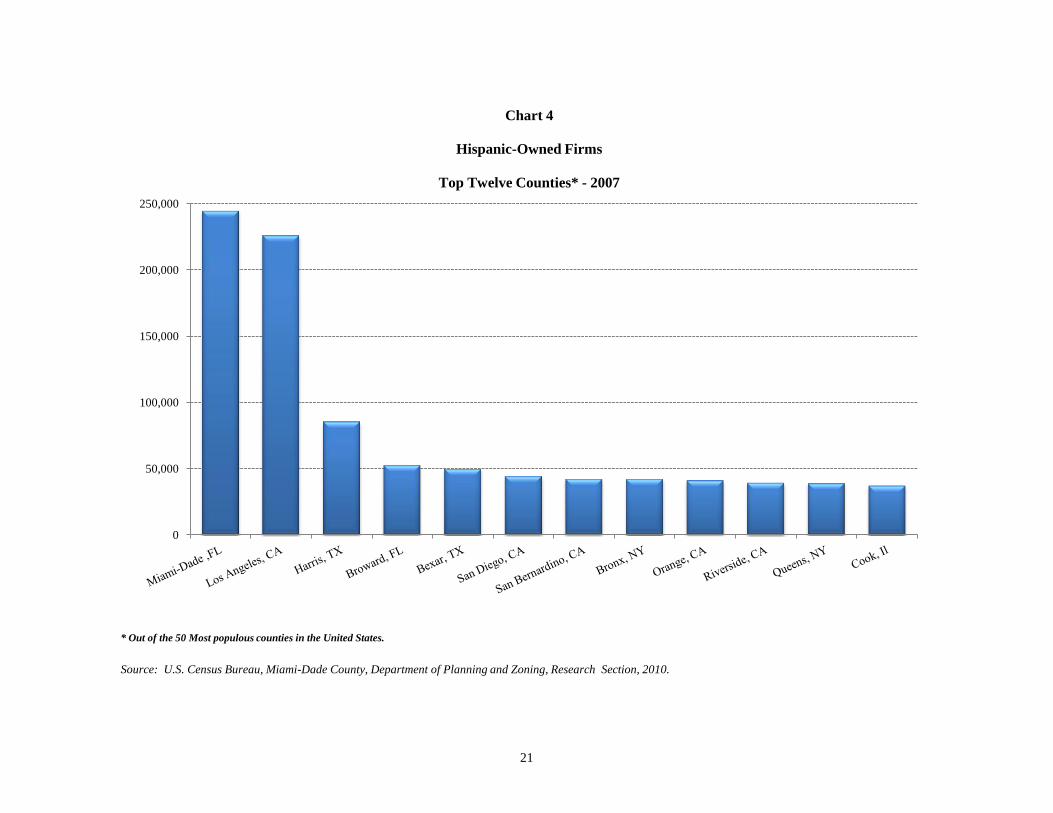
in terms of the percentage of Hispanic firms in any U.S. county relative to the respective state. Chart 4 presents
in graphical form the number of Hispanic-owned firms for Miami-Dade County and the top twelve counties
with largest number of Hispanic firms in the U.S. in 2007.
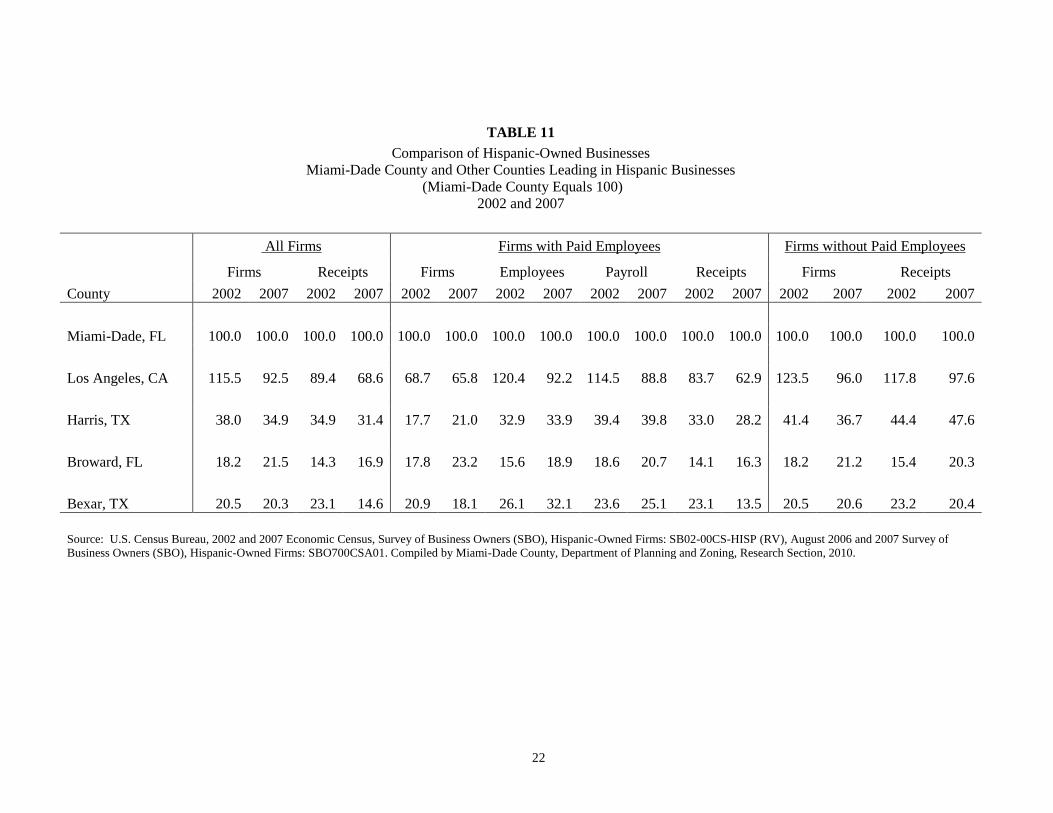
A more refined analysis focuses only on the top five sectors. Together they account for 29.1 percent of all
Hispanic firms in the United States. Table 11 compares the four other counties with Miami-Dade as a base of
100. As shown, Miami-Dade exceeds all other areas in all of the eight indicators. Only Los Angeles comes
close to the Miami-Dade proportions. In half of the categories, it trails Miami-Dade by less than ten percent.
The other three counties fall well below Miami-Dade for all measures. Furthermore, all other areas, except
Broward County, declined, for the most part, relative to Miami-Dade County from 2002 to 2007.
TABLE 10
Comparison of Hispanic-Owned Firms
in Twelve Largest Counties with Hispanic-Owned Firms in State
2007
County
Firms Receipts
State
Firms Receipts
Percent
County to State
(Number) ($1,000) (Number) ($1,000) Firms Receipts
Miami-Dade County, FL 244,148 45,039,001 Florida 450,185 72,924,313 54.2 61.8
Los Angeles County, CA 225,758 30,909,654 California 566,567 81,051,869 39.8 38.1
Harris County, TX 85,172 14,139,482 Texas 447,486 62,121,583 19.0 22.8
Broward County, FL 52,423 7,623,765 Florida 450,185 72,924,313 11.6 10.5
Bexar County, TX 49,526 6,576,103 Texas 447,486 62,121,583 11.1 10.6
San Diego County, CA 44,118 6,670,255 California 566,567 81,051,869 7.8 8.2
San Bernardino County, CA 41,996 6,121,701 California 566,567 81,051,869 7.4 7.6
Bronx County, NY 41,811 1,896,066 New York 193,248 18,258,813 21.6 10.4
Orange County, CA 40,905 7,558,631 California 566,567 81,051,869 7.2 9.3
Riverside County, CA 39,177 4,320,328 California 566,567 81,051,869 6.9 5.3
Queens County, NY 38,708 2,844,148 New York 193,248 18,258,813 20.0 15.6
Cook County, IL 36,750 6,241,292 Illinois 56,552 10,347,636 65.0 60.3
Source: U.S. Census Bureau, 2002 and 2007 Economic Census, Survey of Business Owners (SBO), Hispanic-Owned Firms: SB02-00CS-
HISP (RV), August 2006 and 2007 Survey of Business Owners (SBO), Hispanic-Owned Firms: SBO700CSA01. Compiled by Miami-Dade
County, Department of Planning and Zoning, Research Section, 2010.
21
0
50,000
100,000
150,000
200,000
250,000
Chart 4
Hispanic-Owned Firms
Top Twelve Counties* - 2007
* Out of the 50 Most populous counties in the United States.
Source: U.S. Census Bureau, Miami-Dade County, Department of Planning and Zoning, Research Section, 2010.
22
TABLE 11
Comparison of Hispanic-Owned Businesses
Miami-Dade County and Other Counties Leading in Hispanic Businesses
(Miami-Dade County Equals 100)
2002 and 2007
All Firms Firms with Paid Employees Firms without Paid Employees
County
Firms Receipts Firms Employees Payroll Receipts Firms Receipts
2002 2007 2002 2007 2002 2007 2002 2007 2002 2007 2002 2007 2002 2007 2002 2007
Miami-Dade, FL 100.0 100.0 100.0 100.0 100.0 100.0 100.0 100.0 100.0 100.0 100.0 100.0 100.0 100.0 100.0 100.0
Los Angeles, CA 115.5 92.5 89.4 68.6 68.7 65.8 120.4 92.2 114.5 88.8 83.7 62.9 123.5 96.0 117.8 97.6
Harris, TX 38.0 34.9 34.9 31.4 17.7 21.0 32.9 33.9 39.4 39.8 33.0 28.2 41.4 36.7 44.4 47.6
Broward, FL 18.2 21.5 14.3 16.9 17.8 23.2 15.6 18.9 18.6 20.7 14.1 16.3 18.2 21.2 15.4 20.3
Bexar, TX 20.5 20.3 23.1 14.6 20.9 18.1 26.1 32.1 23.6 25.1 23.1 13.5 20.5 20.6 23.2 20.4
Source: U.S. Census Bureau, 2002 and 2007 Economic Census, Survey of Business Owners (SBO), Hispanic-Owned Firms: SB02-00CS-HISP (RV), August 2006 and 2007 Survey of
Business Owners (SBO), Hispanic-Owned Firms: SBO700CSA01. Compiled by Miami-Dade County, Department of Planning and Zoning, Research Section, 2010.
23
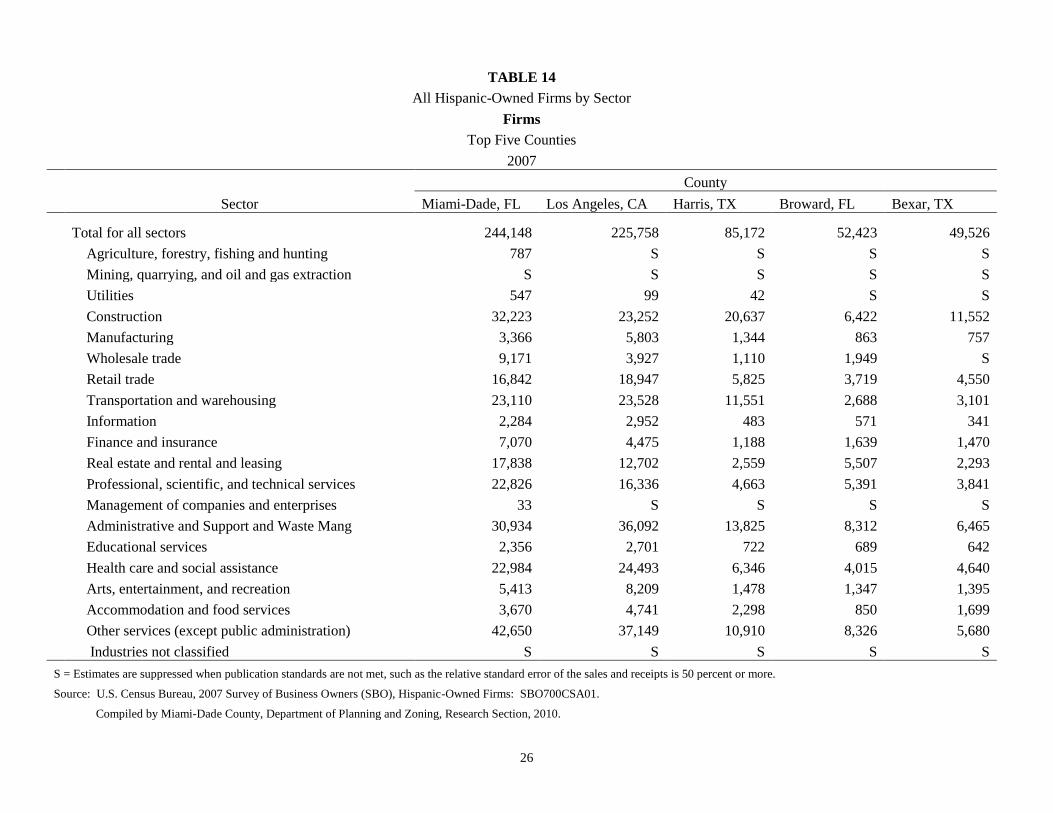
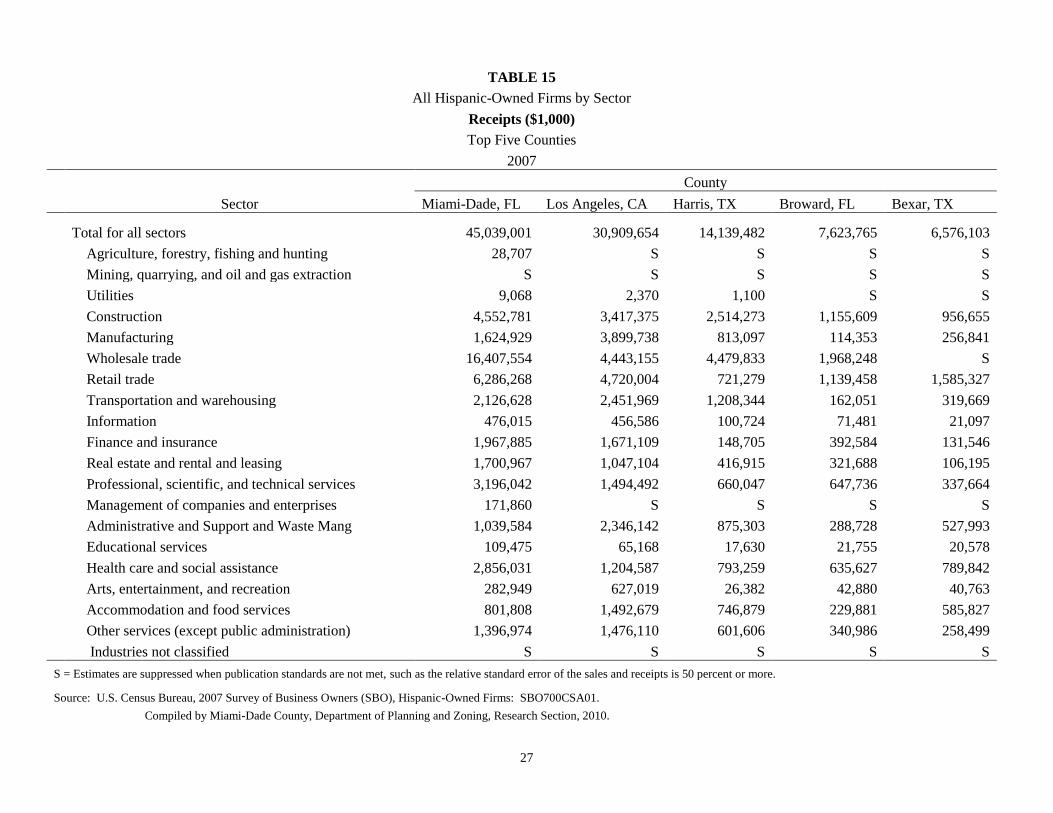
The following seven tables reveal a comparison, for both 2002 and 2007, of all five counties in terms of number
of firms, sales and receipts, employment, annual payroll, as well as selected key ratios. These tables provide
details for the above characteristics by major industry sector. Table 14 and Table 15 display data on the number of
firms and receipts for all firms. The remaining tables are specific only to firms with paid employees. While an in-
depth analysis at this level of detail is beyond the scope of this report, some salient points emerge.
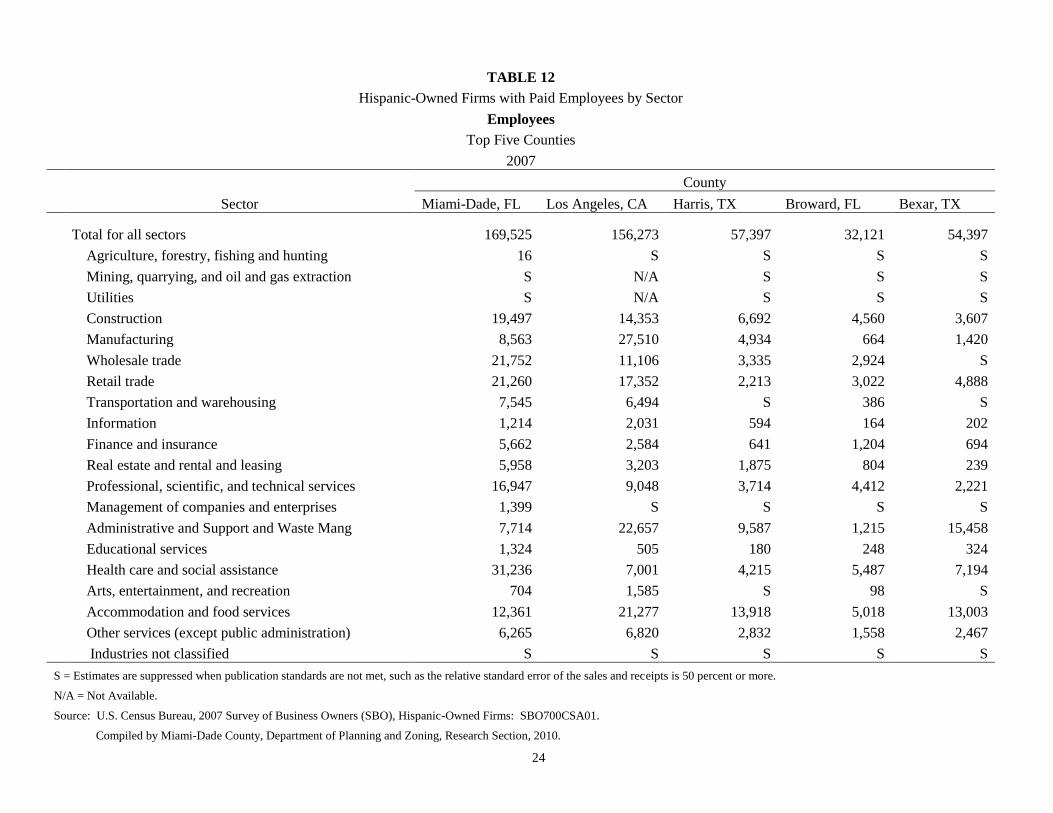
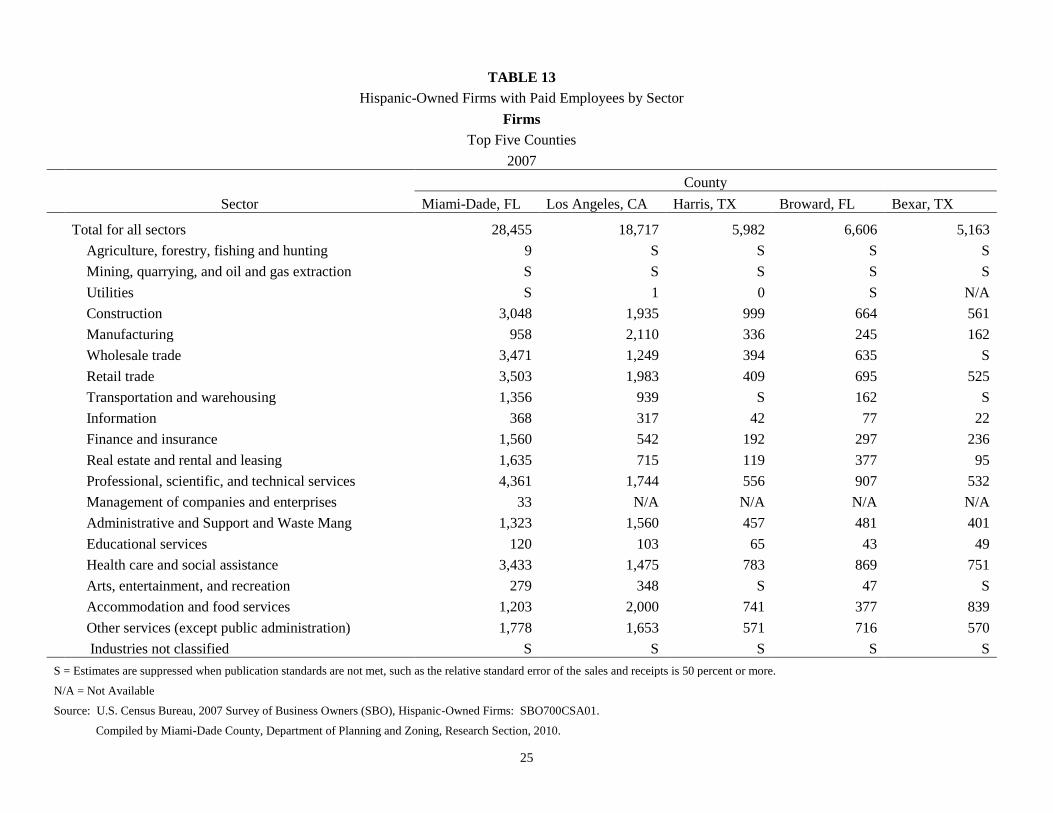
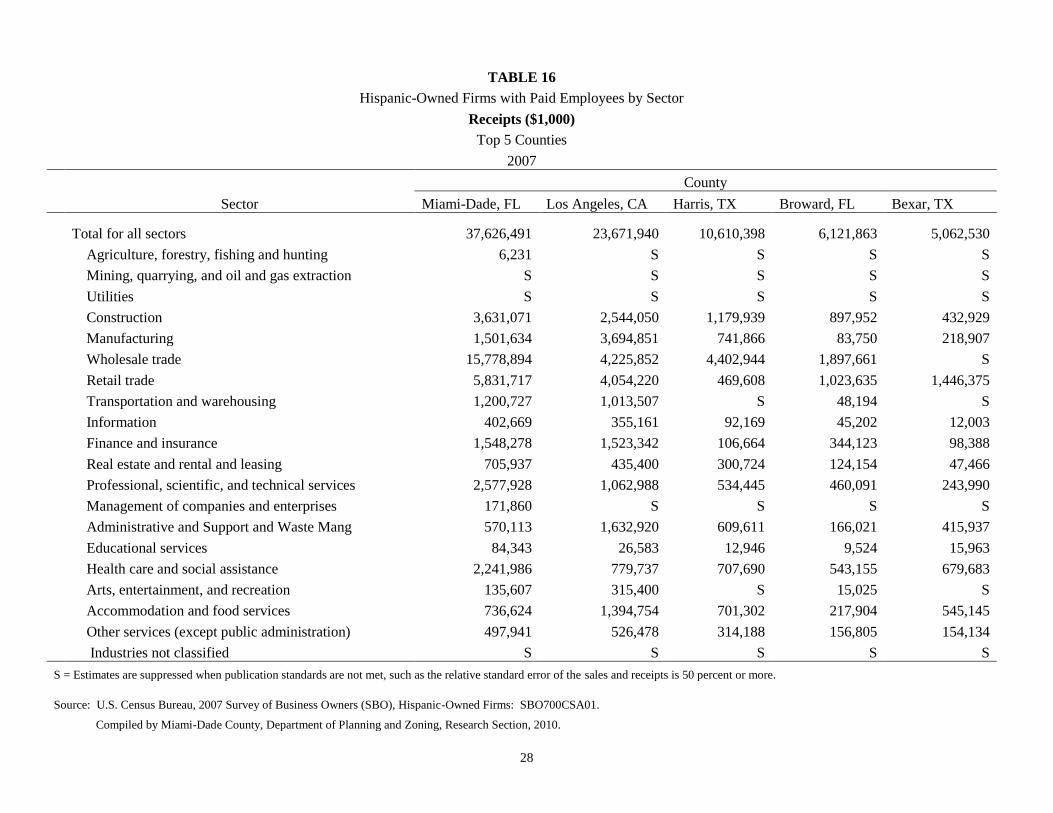
Table 12 shows that Miami-Dade has almost twice as many paid employees in Wholesale trade and more than
four times the number of employees in Health care and social assistance than does Los Angeles. This
weighting of employees is also generally reflected in the other three counties. These relationships also hold true
in Table 13 and 16 that show the number of firms and receipts, respectively. Tables 14 and 15 provide data on
number of firms and receipts for all firms. There are some significant differences in terms of proportionate
share. Table 15 contains data in regard to total receipts. The most outstanding difference is seen in the
Wholesale trade sector, where Miami-Dade significantly exceeds the other counties in proportionate share.
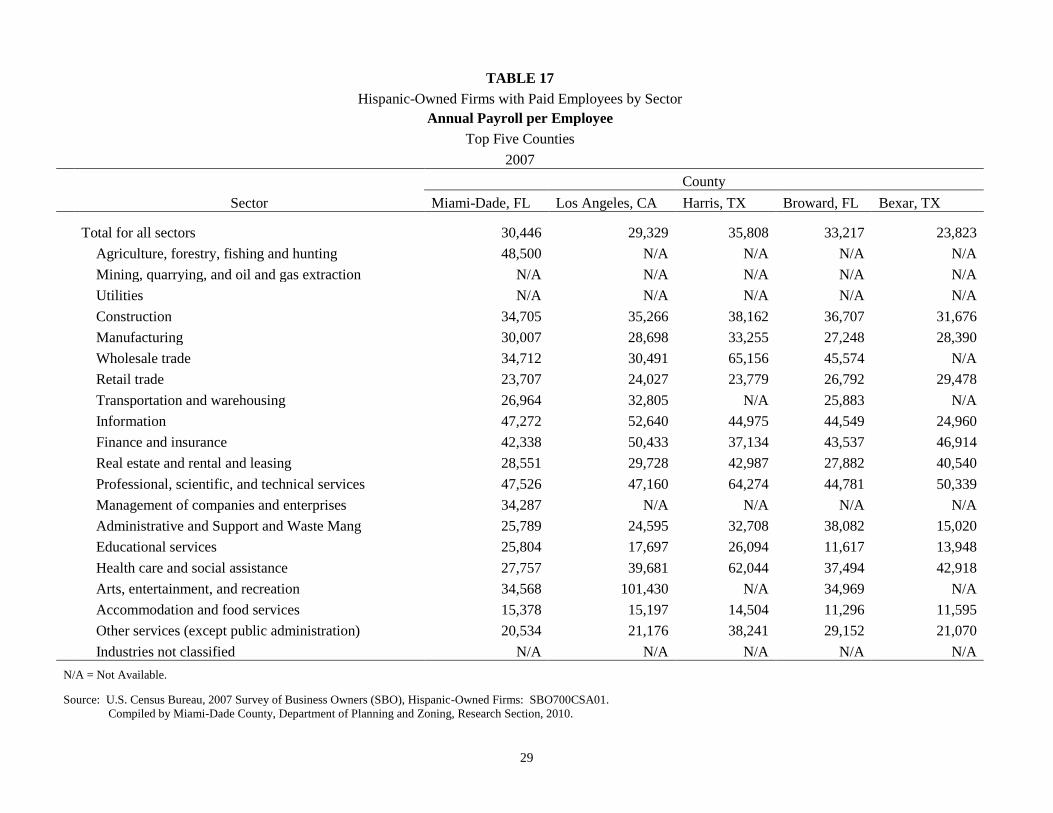
This is also true for the Professional, scientific and technical services sector. Tables 17 and 18 present two
characteristics, payroll and receipts, on a per employee basis for those firms with employees. As seen in Table
16, although annual payroll per employee in all sectors for Miami-Dade falls near the average for the five
counties, there are some important differences by sector.
For example, Harris County has the highest annual payroll per employee overall at $35,808, and markedly
exceeds this characteristic relative to Miami-Dade in the Wholesale trade and Health care and social assistance
sectors. Further in the latter sector, Miami-Dade is significantly lower in this measure than the three other
counties as well. In terms of receipts per employee, Miami-Dade is higher in Miami-Dade than in any of the
other counties in the Educational services, and Professional, scientific, and technical services sectors.
In summary, it should be clear that there is significant variation between Miami-Dade and the other counties in
a variety of business measures. In particular, Hispanic-owned businesses in Miami-Dade are strong relative to
other counties in several sectors. In the three business measures of number of firms, employees, and receipts
these Miami-Dade businesses, as a whole, fare well in the Wholesale trade, Health care and social assistance
sectors and Professional, scientific and technical services sectors. These sectors are weighted more heavily in
the Miami-Dade economy as a whole and Hispanic-owned businesses appear to reflect this fact.
24
TABLE 12
Hispanic-Owned Firms with Paid Employees by Sector
Employees
Top Five Counties
2007
County
Sector Miami-Dade, FL Los Angeles, CA Harris, TX Broward, FL Bexar, TX
Total for all sectors 169,525 156,273 57,397 32,121 54,397
Agriculture, forestry, fishing and hunting 16 S S S S
Mining, quarrying, and oil and gas extraction S N/A S S S
Utilities S N/A S S S
Construction 19,497 14,353 6,692 4,560 3,607
Manufacturing 8,563 27,510 4,934 664 1,420
Wholesale trade 21,752 11,106 3,335 2,924 S
Retail trade 21,260 17,352 2,213 3,022 4,888
Transportation and warehousing 7,545 6,494 S 386 S
Information 1,214 2,031 594 164 202
Finance and insurance 5,662 2,584 641 1,204 694
Real estate and rental and leasing 5,958 3,203 1,875 804 239
Professional, scientific, and technical services 16,947 9,048 3,714 4,412 2,221
Management of companies and enterprises 1,399 S S S S
Administrative and Support and Waste Mang 7,714 22,657 9,587 1,215 15,458
Educational services 1,324 505 180 248 324
Health care and social assistance 31,236 7,001 4,215 5,487 7,194
Arts, entertainment, and recreation 704 1,585 S 98 S
Accommodation and food services 12,361 21,277 13,918 5,018 13,003
Other services (except public administration) 6,265 6,820 2,832 1,558 2,467
Industries not classified S S S S S
S = Estimates are suppressed when publication standards are not met, such as the relative standard error of the sales and receipts is 50 percent or more.
N/A = Not Available.
Source: U.S. Census Bureau, 2007 Survey of Business Owners (SBO), Hispanic-Owned Firms: SBO700CSA01.
Compiled by Miami-Dade County, Department of Planning and Zoning, Research Section, 2010.
25
TABLE 13
Hispanic-Owned Firms with Paid Employees by Sector
Firms
Top Five Counties
2007
County
Sector Miami-Dade, FL Los Angeles, CA Harris, TX Broward, FL Bexar, TX
Total for all sectors 28,455 18,717 5,982 6,606 5,163
Agriculture, forestry, fishing and hunting 9 S S S S
Mining, quarrying, and oil and gas extraction S S S S S
Utilities S 1 0 S N/A
Construction 3,048 1,935 999 664 561
Manufacturing 958 2,110 336 245 162
Wholesale trade 3,471 1,249 394 635 S
Retail trade 3,503 1,983 409 695 525
Transportation and warehousing 1,356 939 S 162 S
Information 368 317 42 77 22
Finance and insurance 1,560 542 192 297 236
Real estate and rental and leasing 1,635 715 119 377 95
Professional, scientific, and technical services 4,361 1,744 556 907 532
Management of companies and enterprises 33 N/A N/A N/A N/A
Administrative and Support and Waste Mang 1,323 1,560 457 481 401
Educational services 120 103 65 43 49
Health care and social assistance 3,433 1,475 783 869 751
Arts, entertainment, and recreation 279 348 S 47 S
Accommodation and food services 1,203 2,000 741 377 839
Other services (except public administration) 1,778 1,653 571 716 570
Industries not classified S S S S S
S = Estimates are suppressed when publication standards are not met, such as the relative standard error of the sales and receipts is 50 percent or more.
N/A = Not Available
Source: U.S. Census Bureau, 2007 Survey of Business Owners (SBO), Hispanic-Owned Firms: SBO700CSA01.
Compiled by Miami-Dade County, Department of Planning and Zoning, Research Section, 2010.
26
TABLE 14
All Hispanic-Owned Firms by Sector
Firms
Top Five Counties
2007
County
Sector Miami-Dade, FL Los Angeles, CA Harris, TX Broward, FL Bexar, TX
Total for all sectors 244,148 225,758 85,172 52,423 49,526
Agriculture, forestry, fishing and hunting 787 S S S S
Mining, quarrying, and oil and gas extraction S S S S S
Utilities 547 99 42 S S
Construction 32,223 23,252 20,637 6,422 11,552
Manufacturing 3,366 5,803 1,344 863 757
Wholesale trade 9,171 3,927 1,110 1,949 S
Retail trade 16,842 18,947 5,825 3,719 4,550
Transportation and warehousing 23,110 23,528 11,551 2,688 3,101
Information 2,284 2,952 483 571 341
Finance and insurance 7,070 4,475 1,188 1,639 1,470
Real estate and rental and leasing 17,838 12,702 2,559 5,507 2,293
Professional, scientific, and technical services 22,826 16,336 4,663 5,391 3,841
Management of companies and enterprises 33 S S S S
Administrative and Support and Waste Mang 30,934 36,092 13,825 8,312 6,465
Educational services 2,356 2,701 722 689 642
Health care and social assistance 22,984 24,493 6,346 4,015 4,640
Arts, entertainment, and recreation 5,413 8,209 1,478 1,347 1,395
Accommodation and food services 3,670 4,741 2,298 850 1,699
Other services (except public administration) 42,650 37,149 10,910 8,326 5,680
Industries not classified S S S S S
S = Estimates are suppressed when publication standards are not met, such as the relative standard error of the sales and receipts is 50 percent or more.
Source: U.S. Census Bureau, 2007 Survey of Business Owners (SBO), Hispanic-Owned Firms: SBO700CSA01.
Compiled by Miami-Dade County, Department of Planning and Zoning, Research Section, 2010.
27
TABLE 15
All Hispanic-Owned Firms by Sector
Receipts ($1,000)
Top Five Counties
2007
County
Sector Miami-Dade, FL Los Angeles, CA Harris, TX Broward, FL Bexar, TX
Total for all sectors 45,039,001 30,909,654 14,139,482 7,623,765 6,576,103
Agriculture, forestry, fishing and hunting 28,707 S S S S
Mining, quarrying, and oil and gas extraction S S S S S
Utilities 9,068 2,370 1,100 S S
Construction 4,552,781 3,417,375 2,514,273 1,155,609 956,655
Manufacturing 1,624,929 3,899,738 813,097 114,353 256,841
Wholesale trade 16,407,554 4,443,155 4,479,833 1,968,248 S
Retail trade 6,286,268 4,720,004 721,279 1,139,458 1,585,327
Transportation and warehousing 2,126,628 2,451,969 1,208,344 162,051 319,669
Information 476,015 456,586 100,724 71,481 21,097
Finance and insurance 1,967,885 1,671,109 148,705 392,584 131,546
Real estate and rental and leasing 1,700,967 1,047,104 416,915 321,688 106,195
Professional, scientific, and technical services 3,196,042 1,494,492 660,047 647,736 337,664
Management of companies and enterprises 171,860 S S S S
Administrative and Support and Waste Mang 1,039,584 2,346,142 875,303 288,728 527,993
Educational services 109,475 65,168 17,630 21,755 20,578
Health care and social assistance 2,856,031 1,204,587 793,259 635,627 789,842
Arts, entertainment, and recreation 282,949 627,019 26,382 42,880 40,763
Accommodation and food services 801,808 1,492,679 746,879 229,881 585,827
Other services (except public administration) 1,396,974 1,476,110 601,606 340,986 258,499
Industries not classified S S S S S
S = Estimates are suppressed when publication standards are not met, such as the relative standard error of the sales and receipts is 50 percent or more.
Source: U.S. Census Bureau, 2007 Survey of Business Owners (SBO), Hispanic-Owned Firms: SBO700CSA01.
Compiled by Miami-Dade County, Department of Planning and Zoning, Research Section, 2010.
28
TABLE 16
Hispanic-Owned Firms with Paid Employees by Sector
Receipts ($1,000)
Top 5 Counties
2007
County
Sector Miami-Dade, FL Los Angeles, CA Harris, TX Broward, FL Bexar, TX
Total for all sectors 37,626,491 23,671,940 10,610,398 6,121,863 5,062,530
Agriculture, forestry, fishing and hunting 6,231 S S S S
Mining, quarrying, and oil and gas extraction S S S S S
Utilities S S S S S
Construction 3,631,071 2,544,050 1,179,939 897,952 432,929
Manufacturing 1,501,634 3,694,851 741,866 83,750 218,907
Wholesale trade 15,778,894 4,225,852 4,402,944 1,897,661 S
Retail trade 5,831,717 4,054,220 469,608 1,023,635 1,446,375
Transportation and warehousing 1,200,727 1,013,507 S 48,194 S
Information 402,669 355,161 92,169 45,202 12,003
Finance and insurance 1,548,278 1,523,342 106,664 344,123 98,388
Real estate and rental and leasing 705,937 435,400 300,724 124,154 47,466
Professional, scientific, and technical services 2,577,928 1,062,988 534,445 460,091 243,990
Management of companies and enterprises 171,860 S S S S
Administrative and Support and Waste Mang 570,113 1,632,920 609,611 166,021 415,937
Educational services 84,343 26,583 12,946 9,524 15,963
Health care and social assistance 2,241,986 779,737 707,690 543,155 679,683
Arts, entertainment, and recreation 135,607 315,400 S 15,025 S
Accommodation and food services 736,624 1,394,754 701,302 217,904 545,145
Other services (except public administration) 497,941 526,478 314,188 156,805 154,134
Industries not classified S S S S S
S = Estimates are suppressed when publication standards are not met, such as the relative standard error of the sales and receipts is 50 percent or more.
Source: U.S. Census Bureau, 2007 Survey of Business Owners (SBO), Hispanic-Owned Firms: SBO700CSA01.
Compiled by Miami-Dade County, Department of Planning and Zoning, Research Section, 2010.
29
TABLE 17
Hispanic-Owned Firms with Paid Employees by Sector
Annual Payroll per Employee
Top Five Counties
2007
County
Sector Miami-Dade, FL Los Angeles, CA Harris, TX Broward, FL Bexar, TX
Total for all sectors 30,446 29,329 35,808 33,217 23,823
Agriculture, forestry, fishing and hunting 48,500 N/A N/A N/A N/A
Mining, quarrying, and oil and gas extraction N/A N/A N/A N/A N/A
Utilities N/A N/A N/A N/A N/A
Construction 34,705 35,266 38,162 36,707 31,676
Manufacturing 30,007 28,698 33,255 27,248 28,390
Wholesale trade 34,712 30,491 65,156 45,574 N/A
Retail trade 23,707 24,027 23,779 26,792 29,478
Transportation and warehousing 26,964 32,805 N/A 25,883 N/A
Information 47,272 52,640 44,975 44,549 24,960
Finance and insurance 42,338 50,433 37,134 43,537 46,914
Real estate and rental and leasing 28,551 29,728 42,987 27,882 40,540
Professional, scientific, and technical services 47,526 47,160 64,274 44,781 50,339
Management of companies and enterprises 34,287 N/A N/A N/A N/A
Administrative and Support and Waste Mang 25,789 24,595 32,708 38,082 15,020
Educational services 25,804 17,697 26,094 11,617 13,948
Health care and social assistance 27,757 39,681 62,044 37,494 42,918
Arts, entertainment, and recreation 34,568 101,430 N/A 34,969 N/A
Accommodation and food services 15,378 15,197 14,504 11,296 11,595
Other services (except public administration) 20,534 21,176 38,241 29,152 21,070
Industries not classified N/A N/A N/A N/A N/A
N/A = Not Available.
Source: U.S. Census Bureau, 2007 Survey of Business Owners (SBO), Hispanic-Owned Firms: SBO700CSA01.
Compiled by Miami-Dade County, Department of Planning and Zoning, Research Section, 2010.
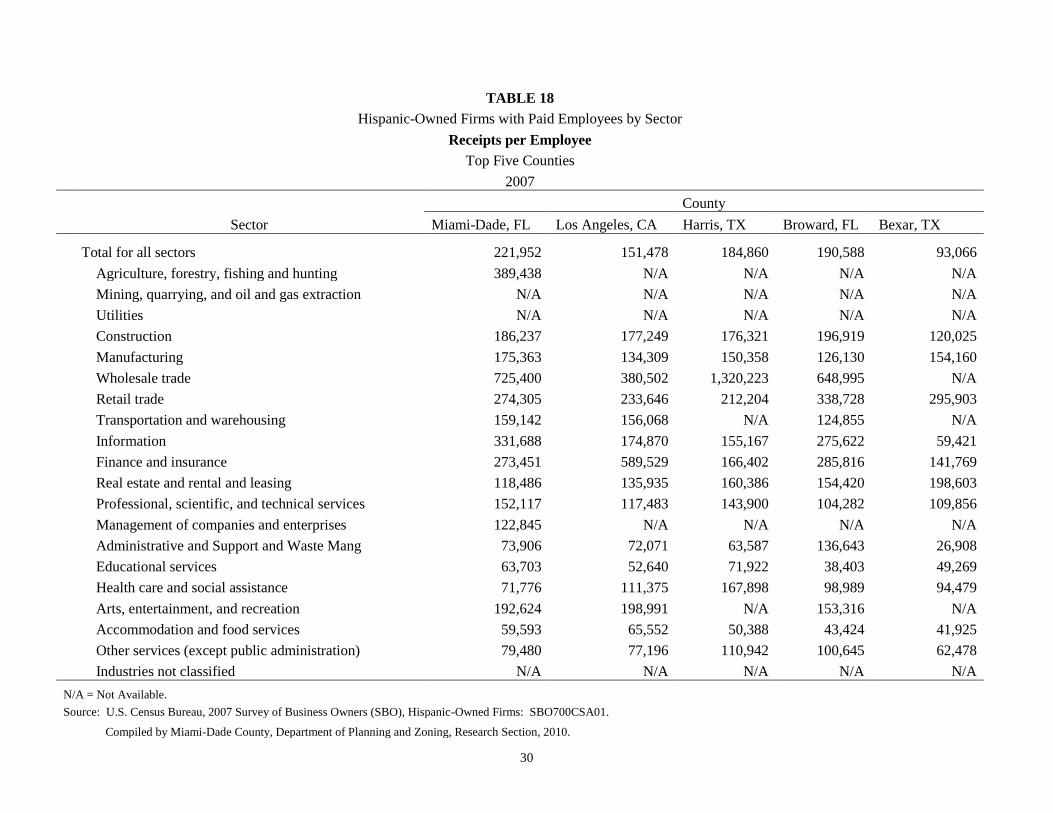
30
TABLE 18
Hispanic-Owned Firms with Paid Employees by Sector
Receipts per Employee
Top Five Counties
2007
County
Sector Miami-Dade, FL Los Angeles, CA Harris, TX Broward, FL Bexar, TX
Total for all sectors 221,952 151,478 184,860 190,588 93,066
Agriculture, forestry, fishing and hunting 389,438 N/A N/A N/A N/A
Mining, quarrying, and oil and gas extraction N/A N/A N/A N/A N/A
Utilities N/A N/A N/A N/A N/A
Construction 186,237 177,249 176,321 196,919 120,025
Manufacturing 175,363 134,309 150,358 126,130 154,160
Wholesale trade 725,400 380,502 1,320,223 648,995 N/A
Retail trade 274,305 233,646 212,204 338,728 295,903
Transportation and warehousing 159,142 156,068 N/A 124,855 N/A
Information 331,688 174,870 155,167 275,622 59,421
Finance and insurance 273,451 589,529 166,402 285,816 141,769
Real estate and rental and leasing 118,486 135,935 160,386 154,420 198,603
Professional, scientific, and technical services 152,117 117,483 143,900 104,282 109,856
Management of companies and enterprises 122,845 N/A N/A N/A N/A
Administrative and Support and Waste Mang 73,906 72,071 63,587 136,643 26,908
Educational services 63,703 52,640 71,922 38,403 49,269
Health care and social assistance 71,776 111,375 167,898 98,989 94,479
Arts, entertainment, and recreation 192,624 198,991 N/A 153,316 N/A
Accommodation and food services 59,593 65,552 50,388 43,424 41,925
Other services (except public administration) 79,480 77,196 110,942 100,645 62,478
Industries not classified N/A N/A N/A N/A N/A
N/A = Not Available.
Source: U.S. Census Bureau, 2007 Survey of Business Owners (SBO), Hispanic-Owned Firms: SBO700CSA01.
Compiled by Miami-Dade County, Department of Planning and Zoning, Research Section, 2010.
31
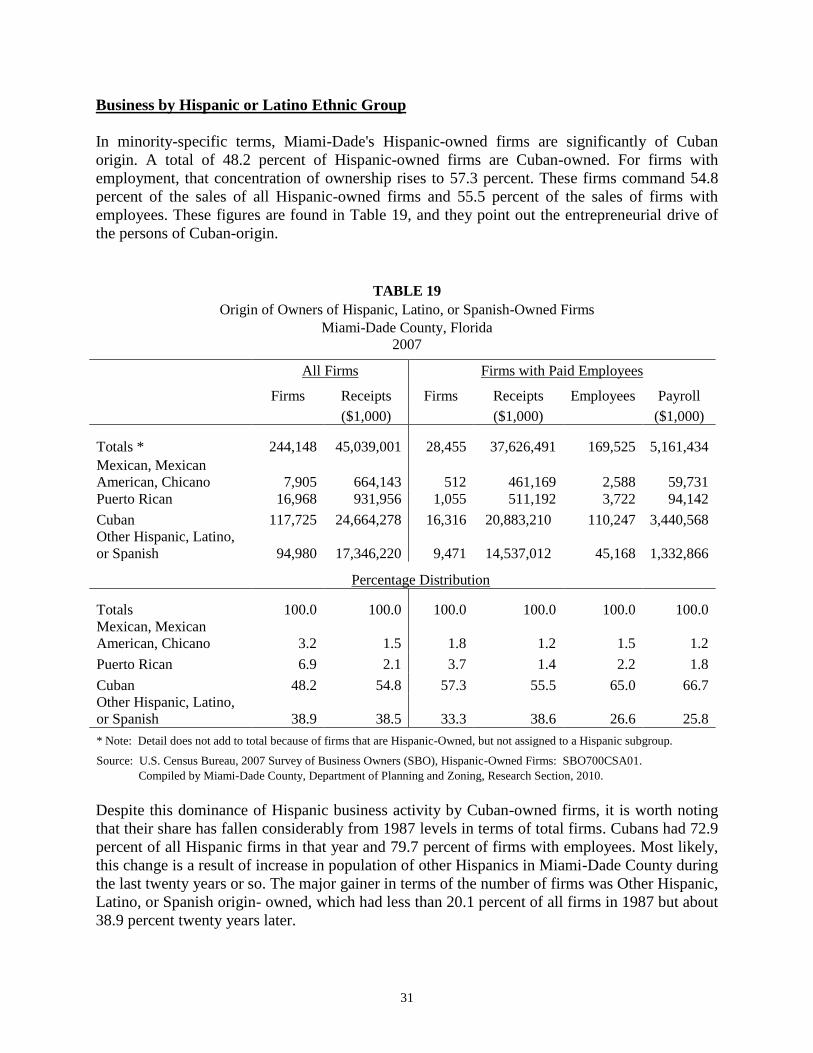
Business by Hispanic or Latino Ethnic Group
In minority-specific terms, Miami-Dade's Hispanic-owned firms are significantly of Cuban
origin. A total of 48.2 percent of Hispanic-owned firms are Cuban-owned. For firms with
employment, that concentration of ownership rises to 57.3 percent. These firms command 54.8
percent of the sales of all Hispanic-owned firms and 55.5 percent of the sales of firms with
employees. These figures are found in Table 19, and they point out the entrepreneurial drive of
the persons of Cuban-origin.
TABLE 19
Origin of Owners of Hispanic, Latino, or Spanish-Owned Firms
Miami-Dade County, Florida
2007
All Firms Firms with Paid Employees
Firms Receipts Firms Receipts Employees Payroll
($1,000) ($1,000) ($1,000)
Totals * 244,148 45,039,001 28,455 37,626,491 169,525 5,161,434
Mexican, Mexican
American, Chicano 7,905 664,143 512 461,169 2,588 59,731
Puerto Rican 16,968 931,956 1,055 511,192 3,722 94,142
Cuban 117,725 24,664,278 16,316 20,883,210 110,247 3,440,568
Other Hispanic, Latino,
or Spanish 94,980 17,346,220 9,471 14,537,012 45,168 1,332,866
Percentage Distribution
Totals 100.0 100.0 100.0 100.0 100.0 100.0
Mexican, Mexican
American, Chicano 3.2 1.5 1.8 1.2 1.5 1.2
Puerto Rican 6.9 2.1 3.7 1.4 2.2 1.8
Cuban 48.2 54.8 57.3 55.5 65.0 66.7
Other Hispanic, Latino,
or Spanish 38.9 38.5 33.3 38.6 26.6 25.8
* Note: Detail does not add to total because of firms that are Hispanic-Owned, but not assigned to a Hispanic subgroup.
Source: U.S. Census Bureau, 2007 Survey of Business Owners (SBO), Hispanic-Owned Firms: SBO700CSA01.
Compiled by Miami-Dade County, Department of Planning and Zoning, Research Section, 2010.
Despite this dominance of Hispanic business activity by Cuban-owned firms, it is worth noting
that their share has fallen considerably from 1987 levels in terms of total firms. Cubans had 72.9
percent of all Hispanic firms in that year and 79.7 percent of firms with employees. Most likely,
this change is a result of increase in population of other Hispanics in Miami-Dade County during
the last twenty years or so. The major gainer in terms of the number of firms was Other Hispanic,
Latino, or Spanish origin- owned, which had less than 20.1 percent of all firms in 1987 but about
38.9 percent twenty years later.
32
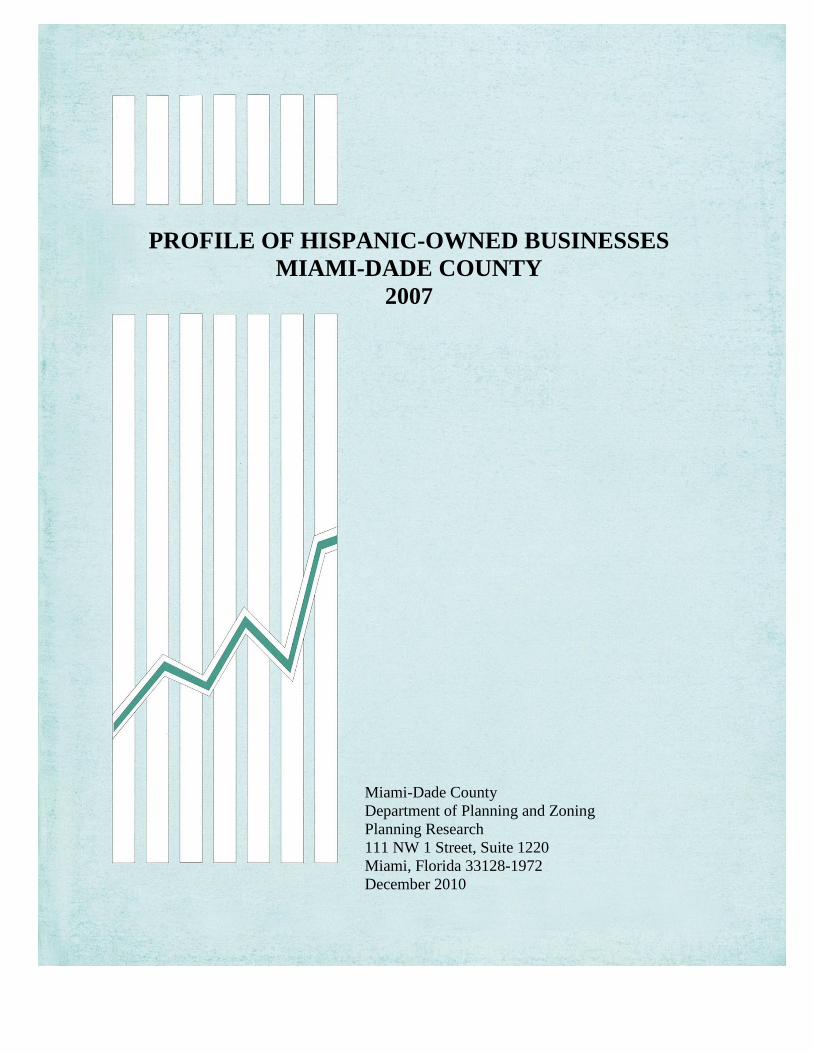
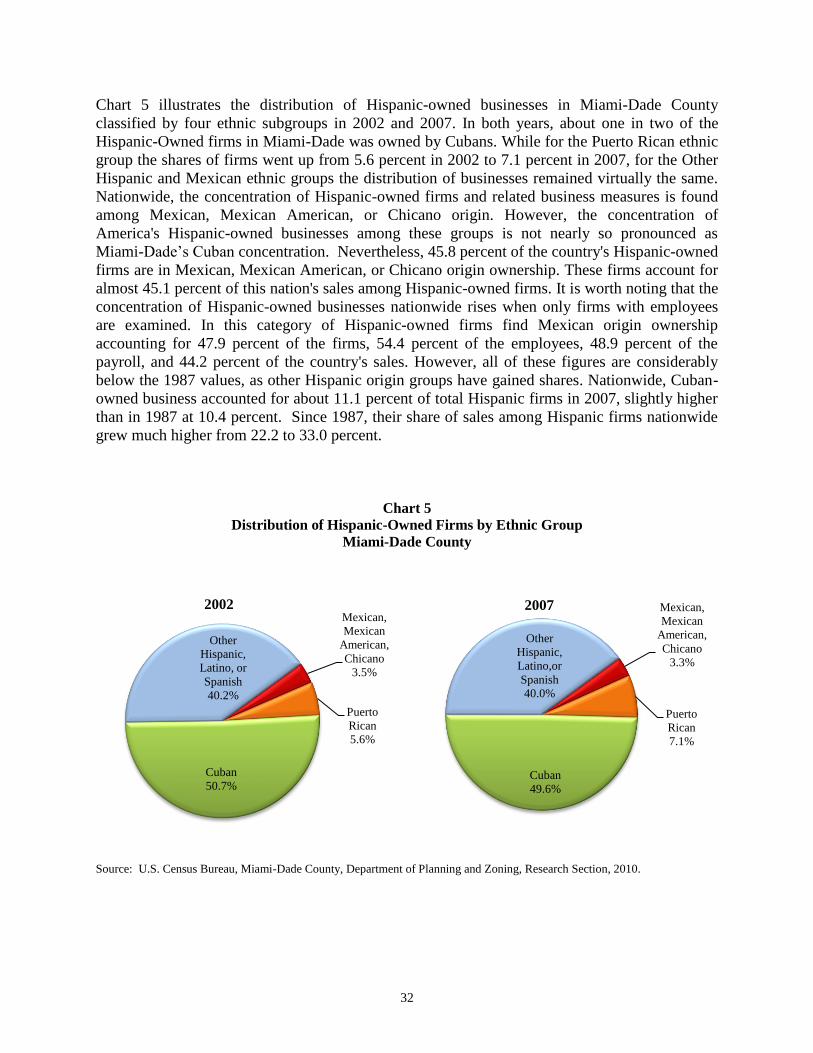
Chart 5 illustrates the distribution of Hispanic-owned businesses in Miami-Dade County
classified by four ethnic subgroups in 2002 and 2007. In both years, about one in two of the
Hispanic-Owned firms in Miami-Dade was owned by Cubans. While for the Puerto Rican ethnic
group the shares of firms went up from 5.6 percent in 2002 to 7.1 percent in 2007, for the Other
Hispanic and Mexican ethnic groups the distribution of businesses remained virtually the same.
Nationwide, the concentration of Hispanic-owned firms and related business measures is found
among Mexican, Mexican American, or Chicano origin. However, the concentration of
America's Hispanic-owned businesses among these groups is not nearly so pronounced as
Miami-Dade’s Cuban concentration. Nevertheless, 45.8 percent of the country's Hispanic-owned
firms are in Mexican, Mexican American, or Chicano origin ownership. These firms account for
almost 45.1 percent of this nation's sales among Hispanic-owned firms. It is worth noting that the
concentration of Hispanic-owned businesses nationwide rises when only firms with employees
are examined. In this category of Hispanic-owned firms find Mexican origin ownership
accounting for 47.9 percent of the firms, 54.4 percent of the employees, 48.9 percent of the
payroll, and 44.2 percent of the country's sales. However, all of these figures are considerably
below the 1987 values, as other Hispanic origin groups have gained shares. Nationwide, Cuban-
owned business accounted for about 11.1 percent of total Hispanic firms in 2007, slightly higher
than in 1987 at 10.4 percent. Since 1987, their share of sales among Hispanic firms nationwide
grew much higher from 22.2 to 33.0 percent.
Chart 5
Distribution of Hispanic-Owned Firms by Ethnic Group
Miami-Dade County
Source: U.S. Census Bureau, Miami-Dade County, Department of Planning and Zoning, Research Section, 2010.
Mexican,
Mexican
American,
Chicano
3.3%
Puerto
Rican
7.1%
Cuban
49.6%
Other
Hispanic,
Latino,or
Spanish
40.0%
2007
Mexican,
Mexican
American,
Chicano
3.5%
Puerto
Rican
5.6%
Cuban
50.7%
Other
Hispanic,
Latino, or
Spanish
40.2%
2002
33
Summary
In conclusion, it should be clear that while Hispanic-owned firms in Miami-Dade County have
grown substantially, in fact by more than five times from 1987 to 2007, they still trail the broad
group of all firms in the County in terms of number of paid employees and average receipts. While
their participation in the local business community has increased significantly during the period,
their true economic potential is still unrealized. If Hispanic-owned firms in Miami-Dade reached
their potential and operated and performed at a level similar to the County’s average firm, there
would be a much higher number of firms with employees creating close to 327,000 jobs and
generating $76.3 billion in receipts. This can be inferred from the composition of the Hispanic-
owned firms with employees, where the average firm size as well as the average receipts per firm
is well below the corresponding measure for all firms in the County. As Miami-Dade’s population
increases, the growth of Hispanic-owned businesses in size and capacity becomes critical for job
creation and this should be encouraged by the area’s public and private leaders.
MIAMI-DADE COUNTY DEPARTMENT OF PLANNING AND ZONING PLANNING DIVISION
Marc L. LaFerrier, AICP, Director
Subrata Basu, AICP, Assistant Director for Planning
Manuel A. Armada Chief, Planning Research Section
Staff Contributory to Report:
Manuel A. Armada, Chief Panos Efstathiou, Principal Planner
Robert Schwarzreich, Section Supervisor Antoaneta Apostolakos, Senior Planner
John Lucas, Senior Planner
With assistance from:
Helen Rodriguez Administrative Secretary
Copies of this report are available from:
Planning Research Section Miami-Dade Department of Planning and Zoning
Stephen P. Clark Center, Suite 1220 111 NW 1st Street
Miami, Florida 33128-1972 (305) 375-2845