Embed Size (px)
Citation preview
ECONOMIC REPORT ON THE SCREEN-BASEDECONOMIC REPORT ON THE SCREEN-BASEDMEDIA PRODUCTION INDUSTRY IN CANADAMEDIA PRODUCTION INDUSTRY IN CANADA
PROFILEPROFILE 20
20
20
20


ECONOMIC REPORT ON THE SCREEN-BASEDECONOMIC REPORT ON THE SCREEN-BASEDMEDIA PRODUCTION INDUSTRY IN CANADAMEDIA PRODUCTION INDUSTRY IN CANADA
PROFILEPROFILE 20
20
20
20
Published by the Canadian Media Producers Association in collaboration with the Department of Canadian Heritage,
Telefilm Canada and Association québécoise de la production médiatique
Production facts and figures prepared by Nordicity Group Ltd.
Profile 20202
Ottawa251 Laurier Avenue West, 11th Floor Ottawa, ON K1P 5J6
Tel: 1-800-656-7440 / [email protected] cmpa.ca
Toronto1 Toronto Street, Suite 702Toronto, ON M5C 2V6
Tel: 1-800-267-8208 / [email protected]
Vancouver736 Granville Street, Suite 600Vancouver, BC V6Z 1G3
Tel: 1-866-390-7639 / [email protected]
1470 Peel Street, Suite 950, Tower AMontréal, QC H3A 1T1
Tel: [email protected]
Hélène MessierPresident and CEO
Dustin Chodorowicz, Partner
Stephen Hignell, Associate Director
Kristian Roberts, Managing Partner
Greg McClary, Manager
Peter Lyman, Senior Partner
nordicity.com
Nordicity is a leading international consulting firm providing private- and public-sector clients with solutions for economic analysis, strategy and business, and policy and regulation across four priority sectors: arts, culture and heritage; digital and creative media; information and communication technologies (ICTs) and innovation; and, telecommunications and spectrum.
360 St. Jacques Street, Suite 500Montréal, QC H2Y 1P5
Tel: 1-800-567-0890 / [email protected]
Telefilm Canada contributed to the funding of this report. Its content represents the opinions of the authors and does not necessarily represent the policies or the views of Telefilm Canada or of the Government of Canada. Maya BandiaAnalyst, Policy and Business Intelligence
Mathieu PerreaultSpecialist, Economic Analysis and Program Performance
Elisa SuppaAttaché, Corporate Affairs and Industry Relations
Department of Canadian Heritage25 Eddy StreetGatineau, QC K1A 0M5
Tel: 1-866-811-0055 / 819-997-0055TTY/TDD: [email protected] https://www.canada.ca/en/canadian-heritage.html
Profile 2020 is published by the Canadian Media Producers Association (CMPA) in collaboration with the Department of Canadian Heritage, Telefilm Canada, the Association québécoise de la production médiatique (AQPM) and Nordicity. Profile 2020 marks the 24th edition of the annual economic report prepared by CMPA and its project partners over the years.
The report provides an analysis of economic activity in Canada’s screen-based media production industry during the period April 1, 2019 to March 31, 2020. It also provides comprehensive reviews of the historical trends in production activity between fiscal years 2010/11 to 2019/20.
The Department of Canadian Heritage contributed to the funding of this report. Its content represents the opinions of the authors and does not necessarily represent the policies or the views of the Department of Canadian Heritage or of the Government of Canada.
Mohamad Ibrahim Ahmad Statistics and Data Analytics Supervisor, CAVCO
Marwan BadranStatistics and Data Analytics Officer, CAVCO
Vincent Fecteau Senior Policy Analyst, Film and Video Policy and Programs
Adnan HadzimahovicPolicy Analyst, Film and Video Policy and Programs
Catherine Rossiter Senior Policy Analyst,Film and Video Policy and Programs
Ali RuzindanaSenior Policy Analyst,Film and Video Policy and Programs
Wayne Timbers Manager, Film and Video Policy and Programs
Susanne VaasVice-President, Corporate & International Affairs
Kyle O’ByrneManager, Media Relations & Communications
Cover design: Sarolta Csete
Profile 2020 3
1. Overview of the screen sector in Canada . . . . . . . . . . 7 Film and television production in Canada . . . . . . . . . . . . 9 Region . . . . . . . . . . . . . . . . . . . . . . . . . . . . . . . . . . . . 12 Foreign investment in production . . . . . . . . . . . . . . . . . . 12 Employment and economic contribution . . . . . . . . . . . . . 14 Summary of employment and GDP impacts . . . . . . . . . . 18
2. Canadian content production . . . . . . . . . . . . . . . . 20 Release medium . . . . . . . . . . . . . . . . . . . . . . . . . . . . . 22 Language . . . . . . . . . . . . . . . . . . . . . . . . . . . . . . . . . . 24 Genre. . . . . . . . . . . . . . . . . . . . . . . . . . . . . . . . . . . . . 25 Animation. . . . . . . . . . . . . . . . . . . . . . . . . . . . . . . . . . 26 Region . . . . . . . . . . . . . . . . . . . . . . . . . . . . . . . . . . . . 27 Financing . . . . . . . . . . . . . . . . . . . . . . . . . . . . . . . . . . 28
3. Canadian television production . . . . . . . . . . . . . . . 29 Type. . . . . . . . . . . . . . . . . . . . . . . . . . . . . . . . . . . . . . 31 Language . . . . . . . . . . . . . . . . . . . . . . . . . . . . . . . . . . 32 Genres . . . . . . . . . . . . . . . . . . . . . . . . . . . . . . . . . . . . 33
Budgets . . . . . . . . . . . . . . . . . . . . . . . . . . . . . . . . . . . 37 Animation. . . . . . . . . . . . . . . . . . . . . . . . . . . . . . . . . . 38
Canadian content points . . . . . . . . . . . . . . . . . . . . . . . 38 Region . . . . . . . . . . . . . . . . . . . . . . . . . . . . . . . . . . . . 39
Canada Media Fund . . . . . . . . . . . . . . . . . . . . . . . . . . 40 Financing . . . . . . . . . . . . . . . . . . . . . . . . . . . . . . . . . . 43
4. Canadian theatrical feature film production . . . . . . 47 Language . . . . . . . . . . . . . . . . . . . . . . . . . . . . . . . . . . 49
Budgets . . . . . . . . . . . . . . . . . . . . . . . . . . . . . . . . . . . 50 Genres . . . . . . . . . . . . . . . . . . . . . . . . . . . . . . . . . . . . 51
Region . . . . . . . . . . . . . . . . . . . . . . . . . . . . . . . . . . . . 51 Financing . . . . . . . . . . . . . . . . . . . . . . . . . . . . . . . . . . 52
5. Audiovisual treaty coproduction. . . . . . . . . . . . . . . 53 All release windows . . . . . . . . . . . . . . . . . . . . . . . . . . . 55
Television . . . . . . . . . . . . . . . . . . . . . . . . . . . . . . . . . . 57 Feature film . . . . . . . . . . . . . . . . . . . . . . . . . . . . . . . . 59
6. Foreign location and service production . . . . . . . . . 60 Total production and types . . . . . . . . . . . . . . . . . . . . . . 62
Region . . . . . . . . . . . . . . . . . . . . . . . . . . . . . . . . . . . . 64 Country . . . . . . . . . . . . . . . . . . . . . . . . . . . . . . . . . . . 64
7. Broadcaster in-house production . . . . . . . . . . . . . . 65 Production volume . . . . . . . . . . . . . . . . . . . . . . . . . . . 67 Genre. . . . . . . . . . . . . . . . . . . . . . . . . . . . . . . . . . . . . 68 Region . . . . . . . . . . . . . . . . . . . . . . . . . . . . . . . . . . . . 69
8. Distribution. . . . . . . . . . . . . . . . . . . . . . . . . . . . . 70
Revenue. . . . . . . . . . . . . . . . . . . . . . . . . . . . . . . . . . . 72 Investment in Canadian productions . . . . . . . . . . . . . . . 73
9. Television broadcasting and audiences. . . . . . . . . . 74 Revenue. . . . . . . . . . . . . . . . . . . . . . . . . . . . . . . . . . . 76 Top television programs . . . . . . . . . . . . . . . . . . . . . . . . 77 Audience share . . . . . . . . . . . . . . . . . . . . . . . . . . . . . . 79
10. Theatrical exhibition and audiences . . . . . . . . . . . . 80 Total revenue . . . . . . . . . . . . . . . . . . . . . . . . . . . . . . . 82 Film festivals . . . . . . . . . . . . . . . . . . . . . . . . . . . . . . . 83 National box office trends . . . . . . . . . . . . . . . . . . . . . . 84 Box office by language market . . . . . . . . . . . . . . . . . . . 86 Top feature films by language of presentation. . . . . . . . . 87
11. Broadcasting distribution undertakings . . . . . . . . . 89 BDU subscribers and revenue. . . . . . . . . . . . . . . . . . . . 90 Investment in Canadian programming . . . . . . . . . . . . . . 92
Notes on Methodology . . . . . . . . . . . . . . . . . . . . . . . . 93
Glossary . . . . . . . . . . . . . . . . . . . . . . . . . . . . . . . . . . 96
CONTENTS
Introduction . . . . . . . . . . . . . . . . . . . . . . . . . . . . . . . . 4
At a glance . . . . . . . . . . . . . . . . . . . . . . . . . . . . . . . . . 6

Profile 202044
IntroductionIntroduction
An Important Message About This Year’s Report
Profile 2020 stands as what will be the final and most essential contribution to our understanding of Canada’s on-screen production sector pre-pandemic. In this way, it contains insights and information vital to the decisions we must consider as we approach the pending post-pandemic world.
This report offers a snapshot of economic activity in Canada’s screen-based media production industry from the start of April 2019 to the end of March 2020. It’s also a snapshot that ends almost exactly as the global pandemic was just beginning to exert its full effect.
Once COVID-19 hit, productions were halted in unprecedented numbers. Projects were suspended and sometimes cancelled altogether. Many working in the sector found themselves unemployed.
If a reminder was ever needed of exactly how significant the economic impact of this sector truly is, the period since March 2020 has provided that perspective in thorough detail. The importance of film and television production in Canada is not just something that can be measured with statistics.
In many ways, this past year underscores the necessity of reports like this and the ongoing effort to ensure the strength and sustainability of our sector. So much depends upon its health and growth. Indeed, preliminary data from 2020/21 Canadian Audio-Visual Certification Office (CAVCO) applications hints that the impact on sector-based work has been widespread and deep.
In the months that followed March 2020, other relevant trends have also become visible. Viewing and consumption patterns have been upended. For many, screen-time now means online schooling and video conference calls – not just the act of watching television, going to the cinema or using one’s devices to access content.
INTRODUCTION
Profile 2020 5
Nevertheless, demand for content seems to have risen sharply. Lockdowns and restrictions have kept people at home, seeking out a wide variety of information and entertainment as a means of coping with pandemic life. In particular, reliance on online streaming services appears to have intensified, although to what degree exactly is difficult to report on until data can be properly collected and analysed.
This report tells us that foreign location and service (FLS) production was, once again, up significantly in 2019/20, fuelling increases in gross domestic product (GDP) and employment. That boost was not quite enough, however, to offset a drop in overall volume of Canadian content production: Canadian television, theatrical feature film and broadcaster in-house production were all down when compared to 2018/19 levels.
Overall, the total volume of film and television production in Canada decreased by 1.1%, in 2019/20, representing a loss of approximately $100 million.
In a post-pandemic world, we must consider this growing reliance on FLS with an eye to potential impacts on cross-border travel and investments. What might be needed to ensure an increase in Canadian content production – not just to reverse declining trends but to help manage new pandemic realities?
The hiatus in film and television production brought on by COVID-19 highlighted just how much this industry affects the economic lives of so many Canadians and their families – something that was not readily apparent when the industry’s employment impact was viewed in terms of full-time equivalents (FTEs). Profile 2020 addresses this by, for the first time, relying on a measure of headcount in the place of the FTEs metric. This change is particularly opportune given the likelihood that a post-COVID-19 recovery may see a greater reliance on casual employment, meaning that our analysis of employment trends going forward will be more accurate.
Finally, against the backdrop of all this, the legislative and regulatory framework governing our sector is under widespread review. At the end of January 2020, the Broadcasting and Telecommunications Legislative Review Panel released its full report and, currently, Bill C-10: An Act to amend the Broadcasting Act and to make consequential amendments to other Acts, which recommends widespread changes, sits before Parliament.
Profile 2020 provides a comprehensive accounting of Canada’s screen-based media production industry before COVID-19 disrupted everything. While it does not measure the impact of the pandemic, it highlights vitally important trends emerging before COVID-19, which will help inform our approach to recovery – and the road ahead.
Profile 20206
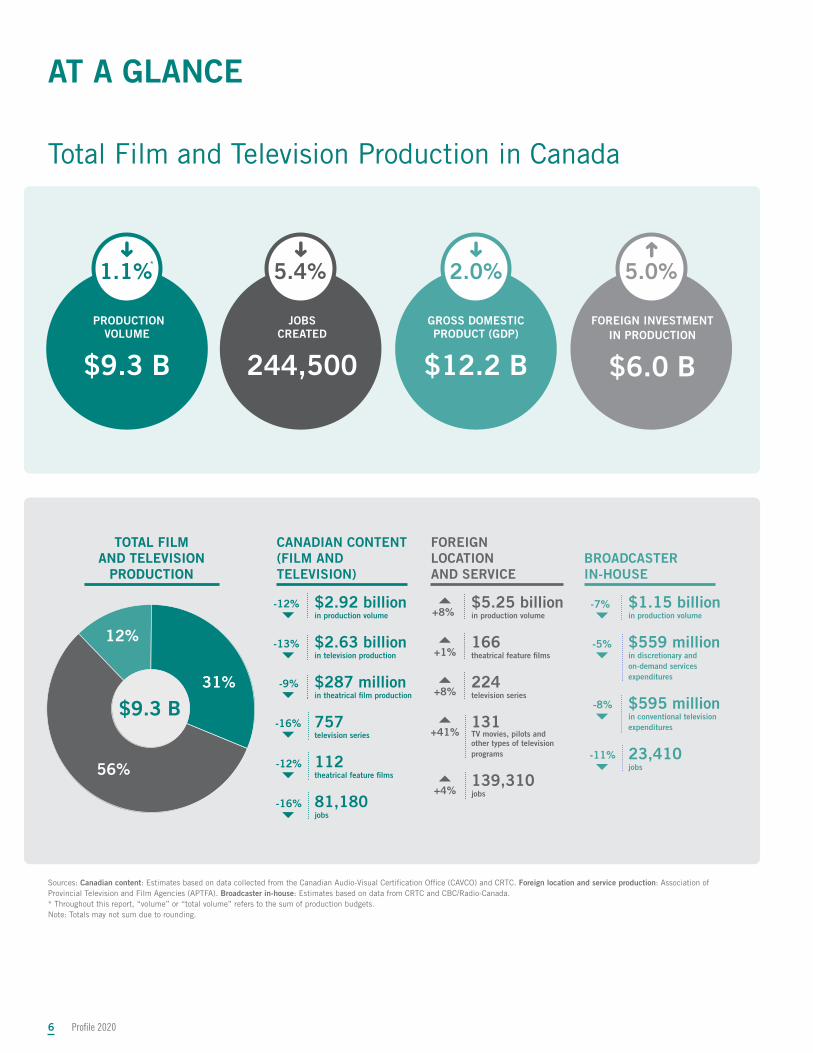
AT A GLANCE The screen-based production industry in Canada is a major source of economic activity and jobs for Canadians across the country. The industry comprises film and television production as well as convergent digital media production.
Total Film and Television Production in CanadaTotal Film and Television Production in Canada
PRODUCTION VOLUME
$9.3 B
JOBS CREATED
244,500
GROSS DOMESTIC PRODUCT (GDP)
$12.2 B
FOREIGN INVESTMENT IN PRODUCTION
$6.0 B
Sources: Canadian content: Estimates based on data collected from the Canadian Audio-Visual Certification Office (CAVCO) and CRTC. Foreign location and service production: Association of Provincial Television and Film Agencies (APTFA). Broadcaster in-house: Estimates based on data from CRTC and CBC/Radio-Canada. * Throughout this report, “volume” or “total volume” refers to the sum of production budgets.Note: Totals may not sum due to rounding.
➜
➜➜
CANADIAN CONTENT (FILM AND TELEVISION)
FOREIGN LOCATION AND SERVICE
BROADCASTER IN-HOUSE
TOTAL FILM TOTAL FILM AND TELEVISION AND TELEVISION
PRODUCTIONPRODUCTION
$2.92 billion in production volume
$2.63 billion in television production
$287 million in theatrical film production
757 television series
112 theatrical feature films
81,180jobs
$5.25 billion in production volume
166 theatrical feature films
224television series
131 TV movies, pilots and other types of television programs
139,310 jobs
$1.15 billion in production volume
$559 million in discretionary and on-demand services expenditures
$595 million in conventional television expenditures
23,410 jobs
-16%
-12%-11%
-8%
-9%
-12%
-13%
+8%-7%
-16%
+1%
+41%
+4%
+8%
-5%
31%
56%
12%
$9.3 B$9.3 B➜
* 5.0%2.0%5.4%1.1%
Profile 2020 7
1. 1. Overview of the screen Overview of the screen sector in Canadasector in Canada
Highlights from 2019/20Highlights from 2019/20
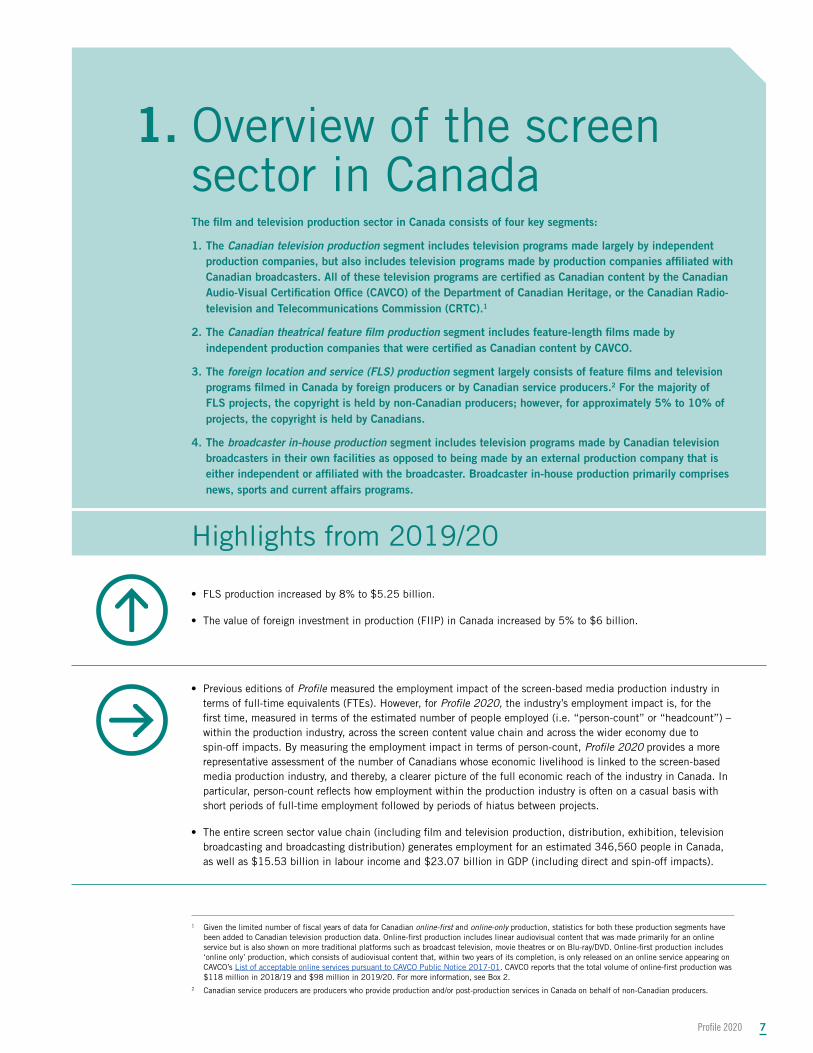
The film and television production sector in Canada consists of four key segments:The film and television production sector in Canada consists of four key segments:
1. The 1. The Canadian television productionCanadian television production segment includes television programs made largely by independent segment includes television programs made largely by independent production companies, but also includes television programs made by production companies affiliated with production companies, but also includes television programs made by production companies affiliated with Canadian broadcasters. All of these television programs are certified as Canadian content by the Canadian Canadian broadcasters. All of these television programs are certified as Canadian content by the Canadian Audio-Visual Certification Office (CAVCO) of the Department of Canadian Heritage, or the Canadian Radio-Audio-Visual Certification Office (CAVCO) of the Department of Canadian Heritage, or the Canadian Radio-television and Telecommunications Commission (CRTC).television and Telecommunications Commission (CRTC).11
2. The 2. The Canadian theatrical feature film productionCanadian theatrical feature film production segment includes feature-length films made by segment includes feature-length films made by independent production companies that were certified as Canadian content by CAVCO.independent production companies that were certified as Canadian content by CAVCO.
3. The 3. The foreign location and service (FLS) productionforeign location and service (FLS) production segment largely consists of feature films and television segment largely consists of feature films and television programs filmed in Canada by foreign producers or by Canadian service producers.programs filmed in Canada by foreign producers or by Canadian service producers.22 For the majority of For the majority of FLS projects, the copyright is held by non-Canadian producers; however, for approximately 5% to 10% of FLS projects, the copyright is held by non-Canadian producers; however, for approximately 5% to 10% of projects, the copyright is held by Canadians.projects, the copyright is held by Canadians.
4. The 4. The broadcaster in-house productionbroadcaster in-house production segment includes television programs made by Canadian television segment includes television programs made by Canadian television broadcasters in their own facilities as opposed to being made by an external production company that is broadcasters in their own facilities as opposed to being made by an external production company that is either independent or affiliated with the broadcaster. Broadcaster in-house production primarily comprises either independent or affiliated with the broadcaster. Broadcaster in-house production primarily comprises news, sports and current affairs programs.news, sports and current affairs programs.
1 Given the limited number of fiscal years of data for Canadian online-first and online-only production, statistics for both these production segments have been added to Canadian television production data. Online-first production includes linear audiovisual content that was made primarily for an online service but is also shown on more traditional platforms such as broadcast television, movie theatres or on Blu-ray/DVD. Online-first production includes ‘online only’ production, which consists of audiovisual content that, within two years of its completion, is only released on an online service appearing on CAVCO’s List of acceptable online services pursuant to CAVCO Public Notice 2017-01. CAVCO reports that the total volume of online-first production was $118 million in 2018/19 and $98 million in 2019/20. For more information, see Box 2.
2 Canadian service producers are producers who provide production and/or post-production services in Canada on behalf of non-Canadian producers.
• FLS production increased by 8% to $5.25 billion.
• The value of foreign investment in production (FIIP) in Canada increased by 5% to $6 billion.
• Previous editions of Profile measured the employment impact of the screen-based media production industry in terms of full-time equivalents (FTEs). However, for Profile 2020, the industry’s employment impact is, for the first time, measured in terms of the estimated number of people employed (i.e. “person-count” or “headcount”) – within the production industry, across the screen content value chain and across the wider economy due to spin-off impacts. By measuring the employment impact in terms of person-count, Profile 2020 provides a more representative assessment of the number of Canadians whose economic livelihood is linked to the screen-based media production industry, and thereby, a clearer picture of the full economic reach of the industry in Canada. In particular, person-count reflects how employment within the production industry is often on a casual basis with short periods of full-time employment followed by periods of hiatus between projects.
• The entire screen sector value chain (including film and television production, distribution, exhibition, television broadcasting and broadcasting distribution) generates employment for an estimated 346,560 people in Canada, as well as $15.53 billion in labour income and $23.07 billion in GDP (including direct and spin-off impacts).
Profile 20208
1. OVERVIEW OF THE SCREEN SECTOR IN CANADA
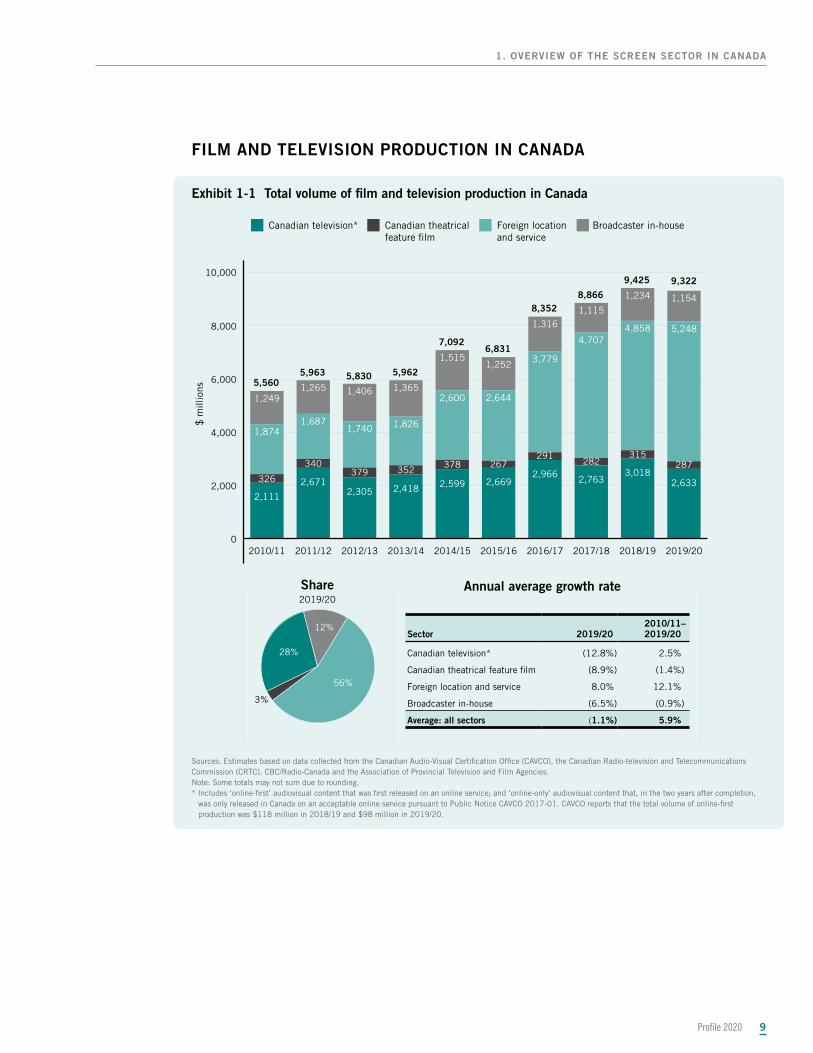
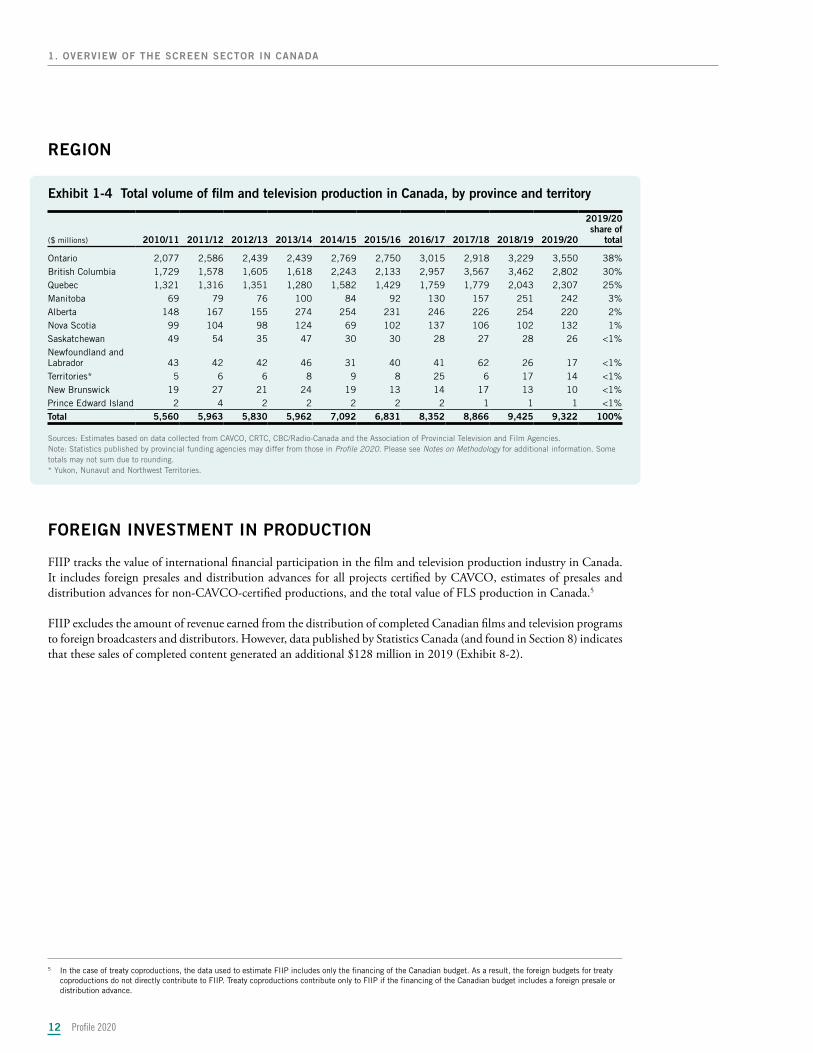
After reaching an all-time high of $9.43 billion in 2018/19, the total volume of film and television production in Canada experienced a modest 1.1% dip in 2019/20. The only segment that saw an increase in production volume was FLS production, totalling over $5 billion for the first time, and continuing its growth pattern over the last 10 years. FLS production increased by 180% between 2010/11 and 2019/20 (Exhibit 1-1). With over $2.3 billion in volume, British Columbia remained Canada’s leading province for FLS production; however, higher levels of FLS television production in Ontario and Quebec drove the segment’s overall growth (Exhibit 6-4).
Canadian television production reached an all-time high of $3.02 billion in 2018/19 before falling by 12.8% in 2019/20, to its lowest level since 2014/15 (Exhibit 1-1). Every genre category except for variety and performing arts (VAPA), contributed to this drop (Exhibit 3-8). Children’s and youth programming was the biggest factor, falling by $165 million, or nearly 30%, to its lowest level since 2012/13 (Exhibit 3-5).
Although the volume of English-language production4 in the Canadian theatrical feature film segment increased by $5 million, or 2.3%, in 2019/20, a sharp drop in the volume of films produced in French-language drove the segment’s overall decrease in 2019/20 (Exhibit 4-1).
Historically, the year-to-year fluctuations in broadcaster in-house production have corresponded with the broadcast of major global sporting events. Without any major global sport event to televise in 2019, Canadian broadcasters’ total spending on the in-house production of sports programming decreased by $77 million or 22.4% (Exhibit 7-2), leading to an $80 million decline in in-house production volume (Exhibit 1-1).
4 Due to the very low number of projects produced in bilingual format and non-official languages, the data for this category was combined with the data for the English-language market
• The total volume3 of film and television production in Canada decreased by 1.1% to $9.32 billion in 2019/20.
• Canadian television production decreased by 12.8% to $2.63 billion.
• Canadian theatrical feature film production decreased by 8.9% to $287 million.
• Broadcaster in-house production decreased by 6.5% to $1.15 billion.
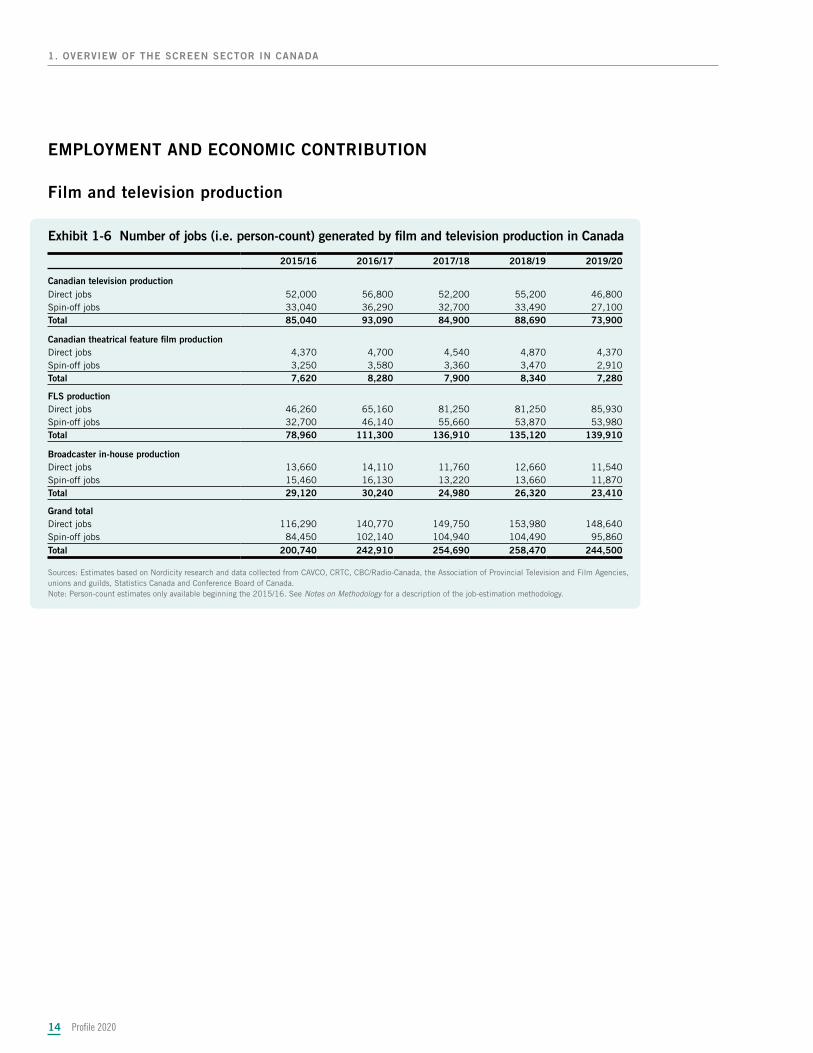
• Film and television production in Canada generated employment for 244,500 Canadians in 2019/20 (including direct and spin-off impacts), down by 5.4% compared to 2018/19.
• The total GDP impact of film and television production in Canada decreased by 2% – from $12.50 billion to $12.24 billion in 2019/20.
3 “Volume” or “total volume” refers to the sum of production budgets.
Highlights from 2019/20Highlights from 2019/20 continuedcontinued
Profile 2020 9
1. OVERVIEW OF THE SCREEN SECTOR IN CANADA
FILM AND TELEVISION PRODUCTION IN CANADA
Exhibit 1-1 Total volume of film and television production in Canada
Annual average growth rateShare2019/20
3%
56%
12%
28%
0
2,000
4,000
6,000
8,000
10,000
1,1541,234
1,1151,316
1,2521,515
1,3651,4061,2651,249
5,2484,8584,707
3,779
2,6442,600
1,8261,7401,687
1,874
287315
282291
267378352379340
326 2,6333,018
2,7632,9662,6692,5992,4182,305
2,671
2,111
2019/202018/192017/182016/172015/162014/152013/142012/132011/122010/11
Canadian television*
$ m
illio
ns
Canadian theatrical feature �lm
Foreign location and service
Broadcaster in-house
9,425 9,3228,866
8,352
6,8317,092
5,9625,8305,9635,560
Sources: Estimates based on data collected from the Canadian Audio-Visual Certification Office (CAVCO), the Canadian Radio-television and Telecommunications Commission (CRTC), CBC/Radio-Canada and the Association of Provincial Television and Film Agencies.Note: Some totals may not sum due to rounding.* Includes ‘online-first’ audiovisual content that was first released on an online service; and ‘online-only’ audiovisual content that, in the two years after completion,
was only released in Canada on an acceptable online service pursuant to Public Notice CAVCO 2017-01. CAVCO reports that the total volume of online-first production was $118 million in 2018/19 and $98 million in 2019/20.
Sector 2019/20 2010/11– 2019/20–
Canadian television* (12.8%) 2.5%
Canadian theatrical feature film (8.9%) (1.4%)
Foreign location and service 8.0% 12.1%
Broadcaster in-house (6.5%) (0.9%)
Average: all sectors (1.1%) 5.9%

Exhibit 1-2 Total volume of film and television production in Canada, share by segment
0%
20%
40%
60%
80%
100%12%13%13%16%18%21%23%24%21%22%
56%52%53%45%
39%37%
31%30%28%34%
3%3%3%
3%4%5%
6%6%
6%
6%
28%32%31%
36%39%
37%41%40%
45%
38%
2019/202018/192017/182016/172015/162014/152013/142012/132011/122010/11
Canadian television Canadian theatrical feature �lm
Foreign location and service
Broadcaster in-house
Sources: Estimates based on data collected from CAVCO, CRTC, CBC/Radio-Canada and the Association of Provincial Television and Film Agencies.Note: Some totals may not sum due to rounding.
Profile 202010
1. OVERVIEW OF THE SCREEN SECTOR IN CANADA
Profile 2020 11
1. OVERVIEW OF THE SCREEN SECTOR IN CANADA
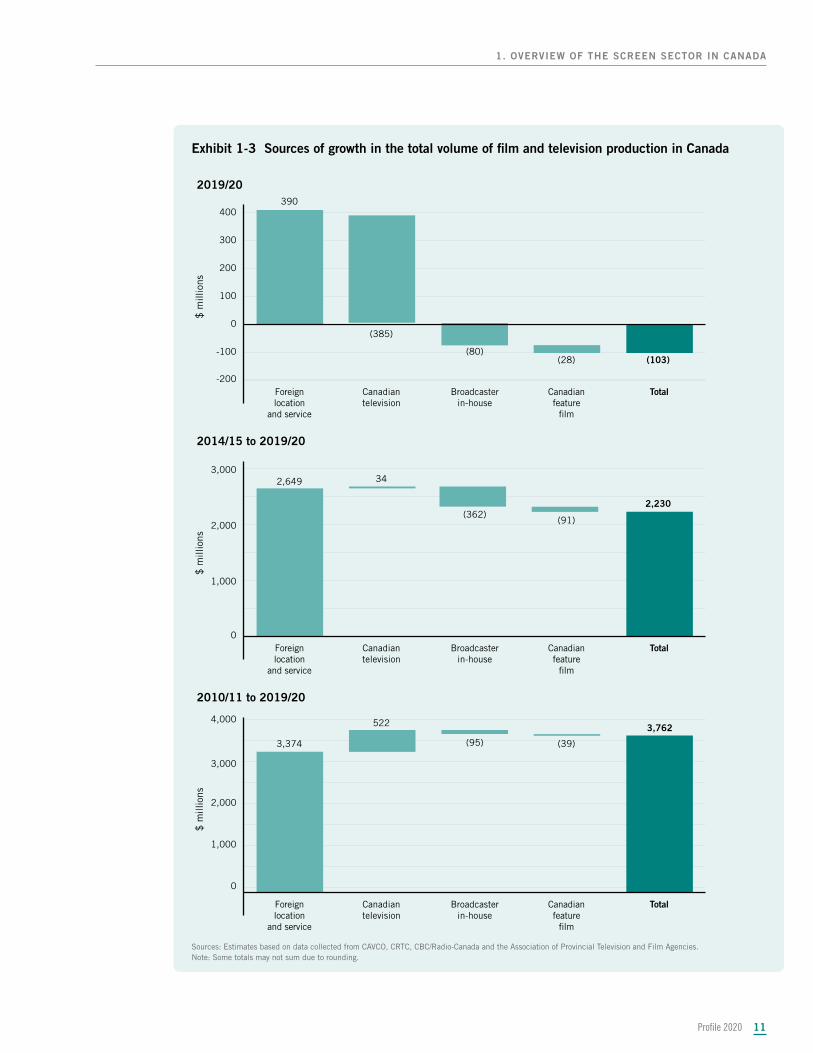
Exhibit 1-3 Sources of growth in the total volume of film and television production in Canada
-200
-100
0
100
200
300
400
TotalCanadianfeature
�lm
Broadcasterin-house
Canadiantelevision
Foreignlocation
and service
$ m
illio
ns390
(385)
(80)(28) (103)
2019/20
0
1,000
2,000
3,000
TotalCanadianfeature
�lm
Broadcasterin-house
Canadiantelevision
Foreignlocation
and service
$ m
illio
ns
2,649 34
(362)(91)
2,230
2014/15 to 2019/20
0
1,000
2,000
3,000
4,000
TotalCanadianfeature
�lm
Broadcasterin-house
Canadiantelevision
Foreignlocation
and service
$ m
illio
ns
3,374
522
(95) (39)
3,762
2010/11 to 2019/20
Sources: Estimates based on data collected from CAVCO, CRTC, CBC/Radio-Canada and the Association of Provincial Television and Film Agencies.Note: Some totals may not sum due to rounding.
Profile 202012
1. OVERVIEW OF THE SCREEN SECTOR IN CANADA
REGION
Exhibit 1-4 Total volume of film and television production in Canada, by province and territory
($ millions) 2010/11 2011/12 2012/13 2013/14 2014/15 2015/16 2016/17 2017/18 2018/19 2019/20
2019/20 share of
total
Ontario 2,077 2,586 2,439 2,439 2,769 2,750 3,015 2,918 3,229 3,550 38%British Columbia 1,729 1,578 1,605 1,618 2,243 2,133 2,957 3,567 3,462 2,802 30%Quebec 1,321 1,316 1,351 1,280 1,582 1,429 1,759 1,779 2,043 2,307 25%Manitoba 69 79 76 100 84 92 130 157 251 242 3%Alberta 148 167 155 274 254 231 246 226 254 220 2%Nova Scotia 99 104 98 124 69 102 137 106 102 132 1%Saskatchewan 49 54 35 47 30 30 28 27 28 26 <1%Newfoundland and Labrador 43 42 42 46 31 40 41 62 26 17 <1%Territories* 5 6 6 8 9 8 25 6 17 14 <1%New Brunswick 19 27 21 24 19 13 14 17 13 10 <1%Prince Edward Island 2 4 2 2 2 2 2 1 1 1 <1%Total 5,560 5,963 5,830 5,962 7,092 6,831 8,352 8,866 9,425 9,322 100%
Sources: Estimates based on data collected from CAVCO, CRTC, CBC/Radio-Canada and the Association of Provincial Television and Film Agencies.Note: Statistics published by provincial funding agencies may differ from those in Profile 2020. Please see Notes on Methodology for additional information. Some totals may not sum due to rounding. * Yukon, Nunavut and Northwest Territories.
FOREIGN INVESTMENT IN PRODUCTION
FIIP tracks the value of international financial participation in the film and television production industry in Canada. It includes foreign presales and distribution advances for all projects certified by CAVCO, estimates of presales and distribution advances for non-CAVCO-certified productions, and the total value of FLS production in Canada.5
FIIP excludes the amount of revenue earned from the distribution of completed Canadian films and television programs to foreign broadcasters and distributors. However, data published by Statistics Canada (and found in Section 8) indicates that these sales of completed content generated an additional $128 million in 2019 (Exhibit 8-2).
5 In the case of treaty coproductions, the data used to estimate FIIP includes only the financing of the Canadian budget. As a result, the foreign budgets for treaty coproductions do not directly contribute to FIIP. Treaty coproductions contribute only to FIIP if the financing of the Canadian budget includes a foreign presale or distribution advance.
Profile 2020 13
1. OVERVIEW OF THE SCREEN SECTOR IN CANADA
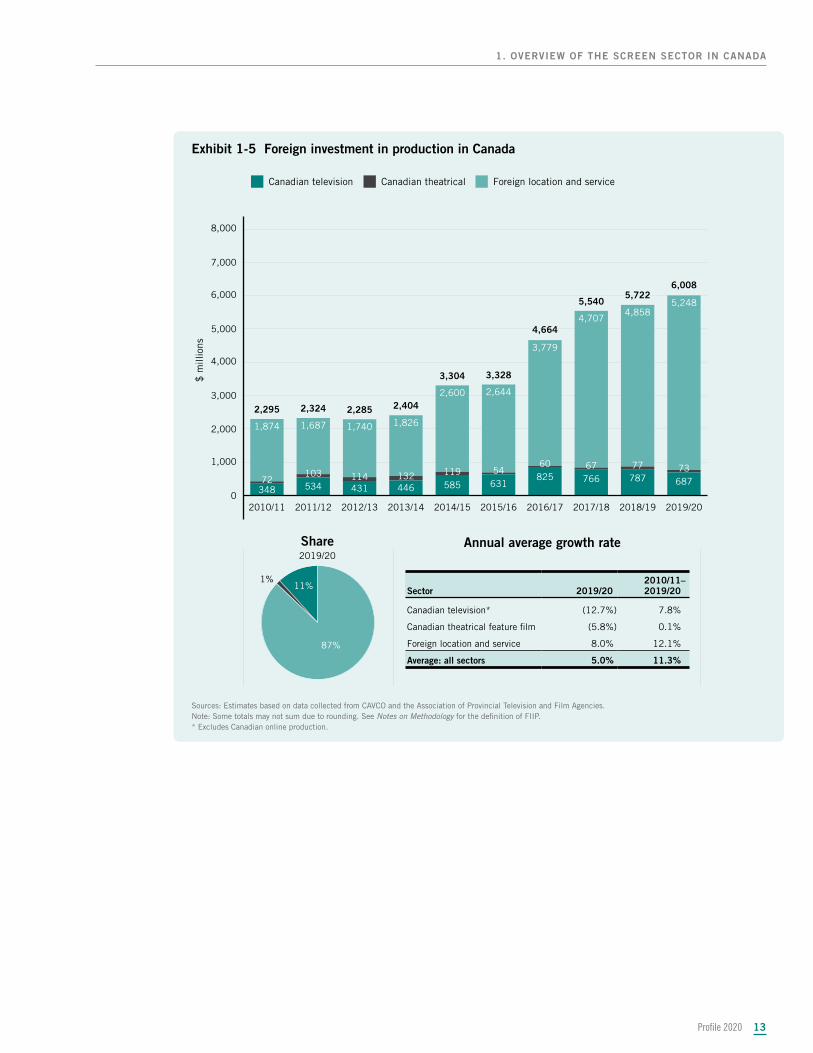
Exhibit 1-5 Foreign investment in production in Canada
Annual average growth rateShare2019/20
1%
87%
11%
0
1,000
2,000
3,000
4,000
5,000
6,000
7,000
8,000
5,2484,858
4,707
3,779
2,6442,600
1,8261,7401,6871,874
7377676054119132114103
72 687787766825631585446431534348
2019/202018/192017/182016/172015/162014/152013/142012/132011/122010/11
Canadian television
$ m
illio
ns
Canadian theatrical Foreign location and service
6,0085,722
5,540
4,664
3,3283,304
2,4042,2852,3242,295
Sources: Estimates based on data collected from CAVCO and the Association of Provincial Television and Film Agencies.Note: Some totals may not sum due to rounding. See Notes on Methodology for the definition of FIIP. * Excludes Canadian online production.
Sector 2019/20 2010/11– 2019/20–
Canadian television* (12.7%) 7.8%
Canadian theatrical feature film (5.8%) 0.1%
Foreign location and service 8.0% 12.1%
Average: all sectors 5.0% 11.3%
Profile 202014
1. OVERVIEW OF THE SCREEN SECTOR IN CANADA
EMPLOYMENT AND ECONOMIC CONTRIBUTION
Film and television production
Exhibit 1-6 Number of jobs (i.e. person-count) generated by film and television production in Canada
2015/16 2016/17 2017/18 2018/19 2019/20
Canadian television productionDirect jobs 52,000 56,800 52,200 55,200 46,800Spin-off jobs 33,040 36,290 32,700 33,490 27,100Total 85,040 93,090 84,900 88,690 73,900
Canadian theatrical feature film productionDirect jobs 4,370 4,700 4,540 4,870 4,370Spin-off jobs 3,250 3,580 3,360 3,470 2,910Total 7,620 8,280 7,900 8,340 7,280
FLS productionDirect jobs 46,260 65,160 81,250 81,250 85,930Spin-off jobs 32,700 46,140 55,660 53,870 53,980Total 78,960 111,300 136,910 135,120 139,910
Broadcaster in-house productionDirect jobs 13,660 14,110 11,760 12,660 11,540Spin-off jobs 15,460 16,130 13,220 13,660 11,870Total 29,120 30,240 24,980 26,320 23,410
Grand totalDirect jobs 116,290 140,770 149,750 153,980 148,640Spin-off jobs 84,450 102,140 104,940 104,490 95,860Total 200,740 242,910 254,690 258,470 244,500
Sources: Estimates based on Nordicity research and data collected from CAVCO, CRTC, CBC/Radio-Canada, the Association of Provincial Television and Film Agencies, unions and guilds, Statistics Canada and Conference Board of Canada.Note: Person-count estimates only available beginning the 2015/16. See Notes on Methodology for a description of the job-estimation methodology.
Profile 2020 15
1. OVERVIEW OF THE SCREEN SECTOR IN CANADA
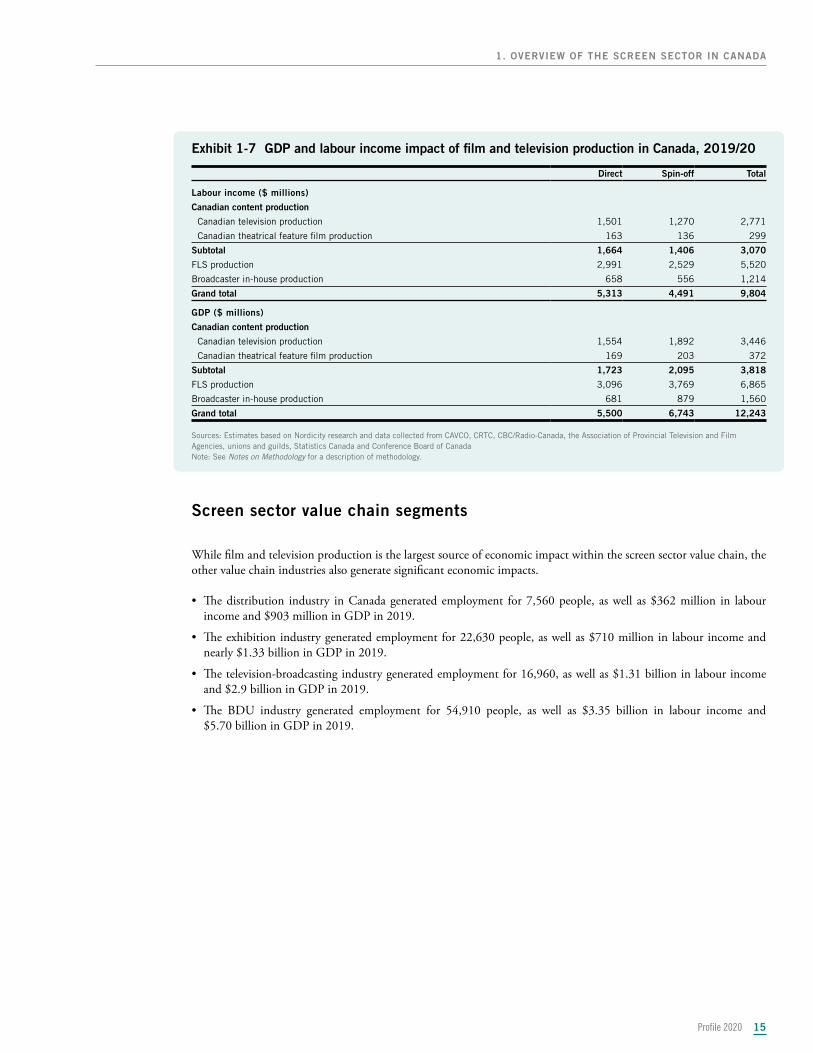
Exhibit 1-7 GDP and labour income impact of film and television production in Canada, 2019/20
Direct Spin-off Total
Labour income ($ millions)
Canadian content production
Canadian television production 1,501 1,270 2,771
Canadian theatrical feature film production 163 136 299
Subtotal 1,664 1,406 3,070
FLS production 2,991 2,529 5,520
Broadcaster in-house production 658 556 1,214
Grand total 5,313 4,491 9,804
GDP ($ millions)
Canadian content production
Canadian television production 1,554 1,892 3,446
Canadian theatrical feature film production 169 203 372
Subtotal 1,723 2,095 3,818
FLS production 3,096 3,769 6,865
Broadcaster in-house production 681 879 1,560
Grand total 5,500 6,743 12,243
Sources: Estimates based on Nordicity research and data collected from CAVCO, CRTC, CBC/Radio-Canada, the Association of Provincial Television and Film Agencies, unions and guilds, Statistics Canada and Conference Board of CanadaNote: See Notes on Methodology for a description of methodology.
Screen sector value chain segments
While film and television production is the largest source of economic impact within the screen sector value chain, the other value chain industries also generate significant economic impacts.
• The distribution industry in Canada generated employment for 7,560 people, as well as $362 million in labour income and $903 million in GDP in 2019.
• The exhibition industry generated employment for 22,630 people, as well as $710 million in labour income and nearly $1.33 billion in GDP in 2019.
• The television-broadcasting industry generated employment for 16,960, as well as $1.31 billion in labour income and $2.9 billion in GDP in 2019.
• The BDU industry generated employment for 54,910 people, as well as $3.35 billion in labour income and $5.70 billion in GDP in 2019.
Profile 202016
1. OVERVIEW OF THE SCREEN SECTOR IN CANADA
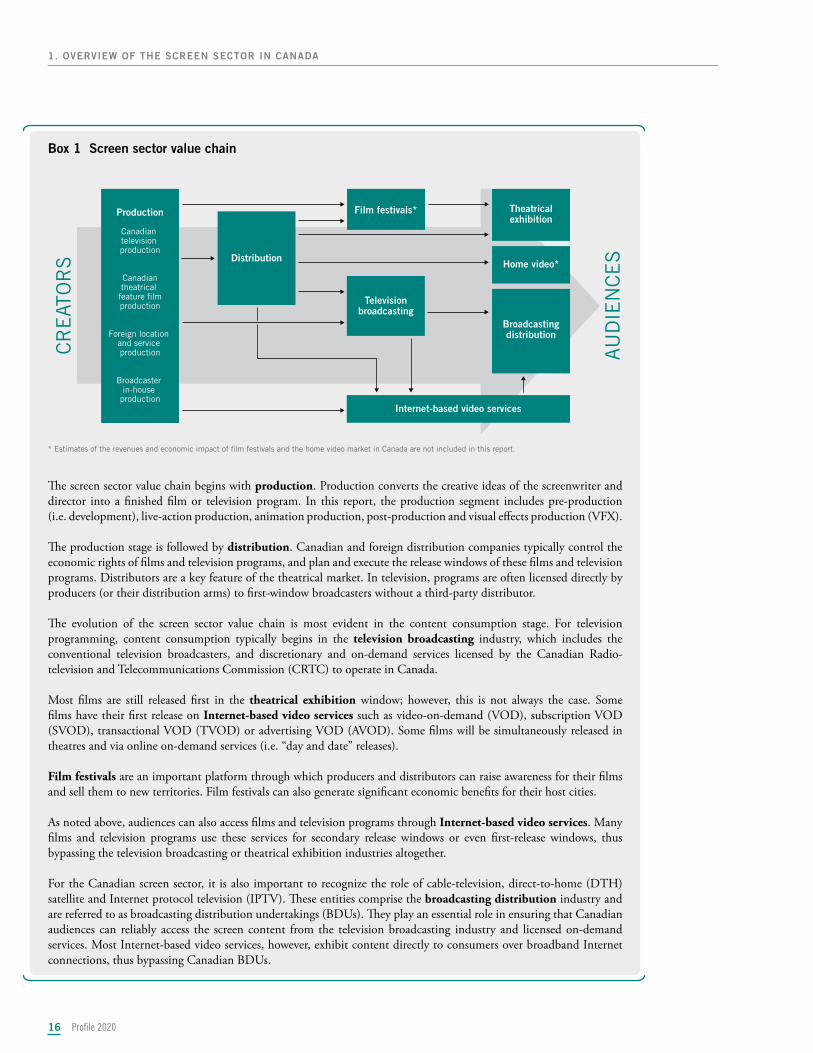
Box 1 Screen sector value chain
CR
EAT
OR
S
AU
DIE
NC
ES
Production
Canadian television production
Canadiantheatrical feature �lmproduction
Foreign location and service production
Broadcaster in-house
production
Distribution
Film festivals* Theatricalexhibition
Televisionbroadcasting
Broadcastingdistribution
Home video*
Internet-based video services
* Estimates of the revenues and economic impact of film festivals and the home video market in Canada are not included in this report.
The screen sector value chain begins with production. Production converts the creative ideas of the screenwriter and director into a finished film or television program. In this report, the production segment includes pre-production (i.e. development), live-action production, animation production, post-production and visual effects production (VFX).
The production stage is followed by distribution. Canadian and foreign distribution companies typically control the economic rights of films and television programs, and plan and execute the release windows of these films and television programs. Distributors are a key feature of the theatrical market. In television, programs are often licensed directly by producers (or their distribution arms) to first-window broadcasters without a third-party distributor.
The evolution of the screen sector value chain is most evident in the content consumption stage. For television programming, content consumption typically begins in the television broadcasting industry, which includes the conventional television broadcasters, and discretionary and on-demand services licensed by the Canadian Radio-television and Telecommunications Commission (CRTC) to operate in Canada.
Most films are still released first in the theatrical exhibition window; however, this is not always the case. Some films have their first release on Internet-based video services such as video-on-demand (VOD), subscription VOD (SVOD), transactional VOD (TVOD) or advertising VOD (AVOD). Some films will be simultaneously released in theatres and via online on-demand services (i.e. “day and date” releases).
Film festivals are an important platform through which producers and distributors can raise awareness for their films and sell them to new territories. Film festivals can also generate significant economic benefits for their host cities.
As noted above, audiences can also access films and television programs through Internet-based video services. Many films and television programs use these services for secondary release windows or even first-release windows, thus bypassing the television broadcasting or theatrical exhibition industries altogether.
For the Canadian screen sector, it is also important to recognize the role of cable-television, direct-to-home (DTH) satellite and Internet protocol television (IPTV). These entities comprise the broadcasting distribution industry and are referred to as broadcasting distribution undertakings (BDUs). They play an essential role in ensuring that Canadian audiences can reliably access the screen content from the television broadcasting industry and licensed on-demand services. Most Internet-based video services, however, exhibit content directly to consumers over broadband Internet connections, thus bypassing Canadian BDUs.
Profile 2020 17
1. OVERVIEW OF THE SCREEN SECTOR IN CANADA
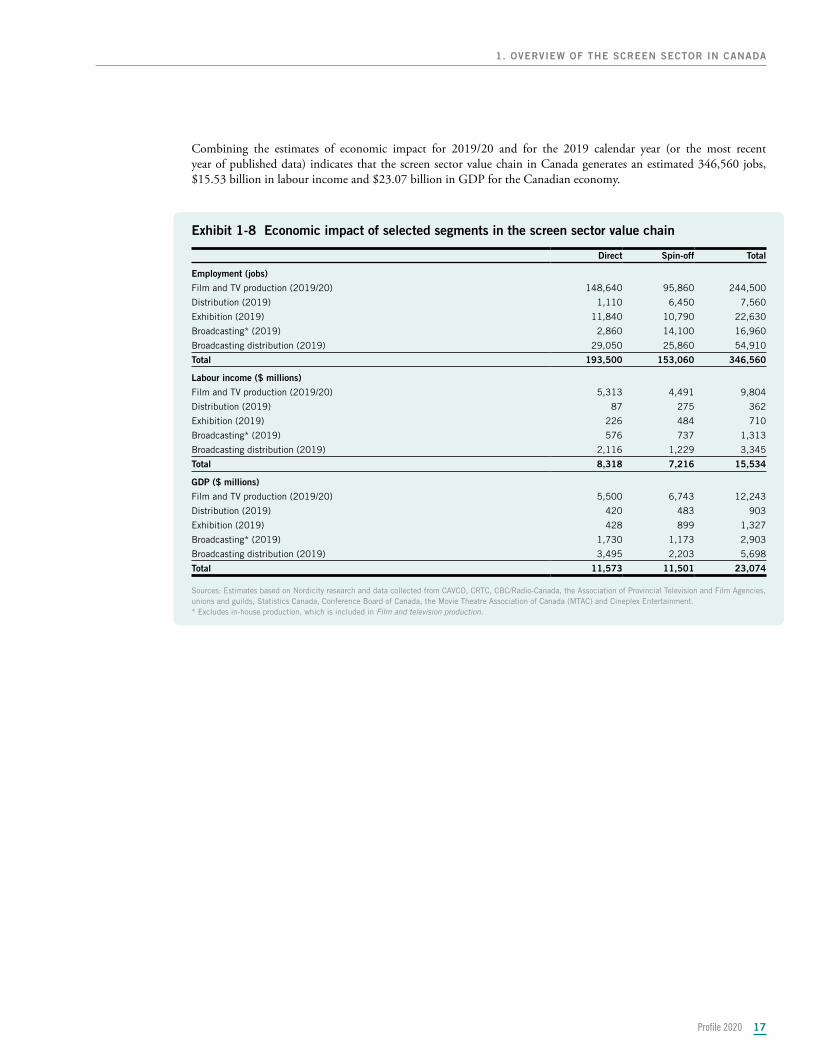
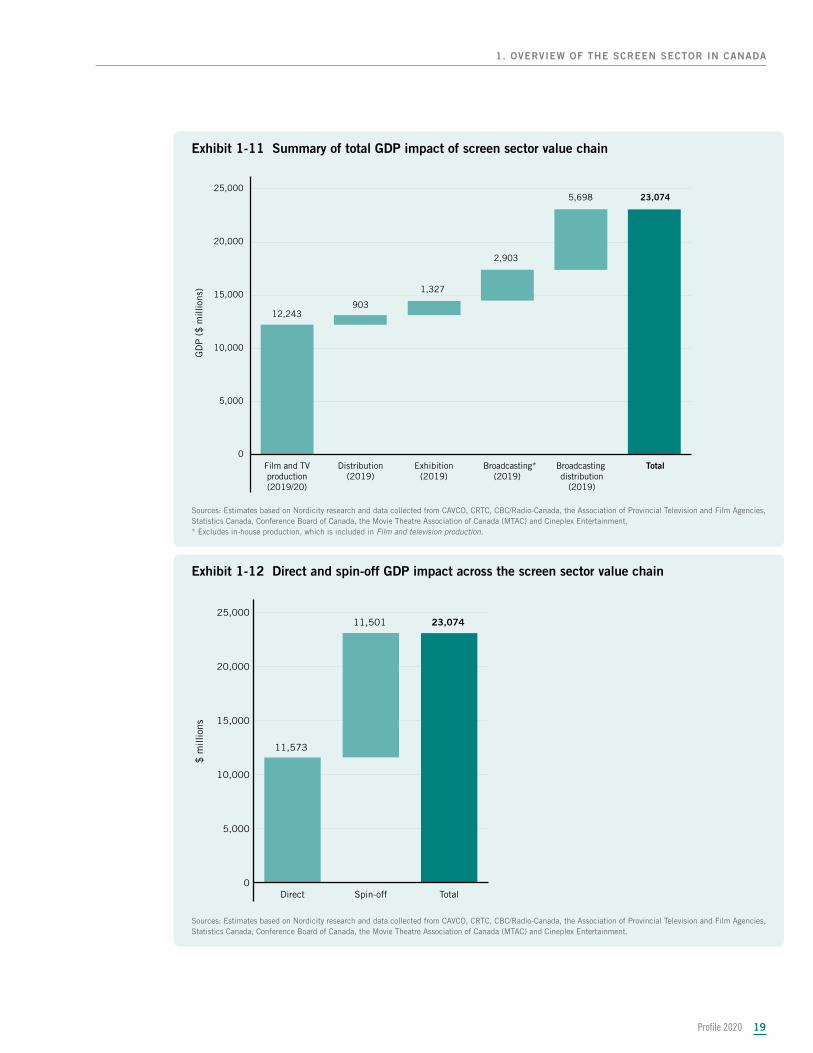
Combining the estimates of economic impact for 2019/20 and for the 2019 calendar year (or the most recent year of published data) indicates that the screen sector value chain in Canada generates an estimated 346,560 jobs, $15.53 billion in labour income and $23.07 billion in GDP for the Canadian economy.
Exhibit 1-8 Economic impact of selected segments in the screen sector value chain
Direct Spin-off Total
Employment (jobs)
Film and TV production (2019/20) 148,640 95,860 244,500
Distribution (2019) 1,110 6,450 7,560
Exhibition (2019) 11,840 10,790 22,630
Broadcasting* (2019) 2,860 14,100 16,960
Broadcasting distribution (2019) 29,050 25,860 54,910
Total 193,500 153,060 346,560
Labour income ($ millions)
Film and TV production (2019/20) 5,313 4,491 9,804
Distribution (2019) 87 275 362
Exhibition (2019) 226 484 710
Broadcasting* (2019) 576 737 1,313
Broadcasting distribution (2019) 2,116 1,229 3,345
Total 8,318 7,216 15,534
GDP ($ millions)
Film and TV production (2019/20) 5,500 6,743 12,243
Distribution (2019) 420 483 903
Exhibition (2019) 428 899 1,327
Broadcasting* (2019) 1,730 1,173 2,903
Broadcasting distribution (2019) 3,495 2,203 5,698
Total 11,573 11,501 23,074
Sources: Estimates based on Nordicity research and data collected from CAVCO, CRTC, CBC/Radio-Canada, the Association of Provincial Television and Film Agencies, unions and guilds, Statistics Canada, Conference Board of Canada, the Movie Theatre Association of Canada (MTAC) and Cineplex Entertainment.* Excludes in-house production, which is included in Film and television production.
Profile 202018
1. OVERVIEW OF THE SCREEN SECTOR IN CANADA
SUMMARY OF EMPLOYMENT AND GDP IMPACTS
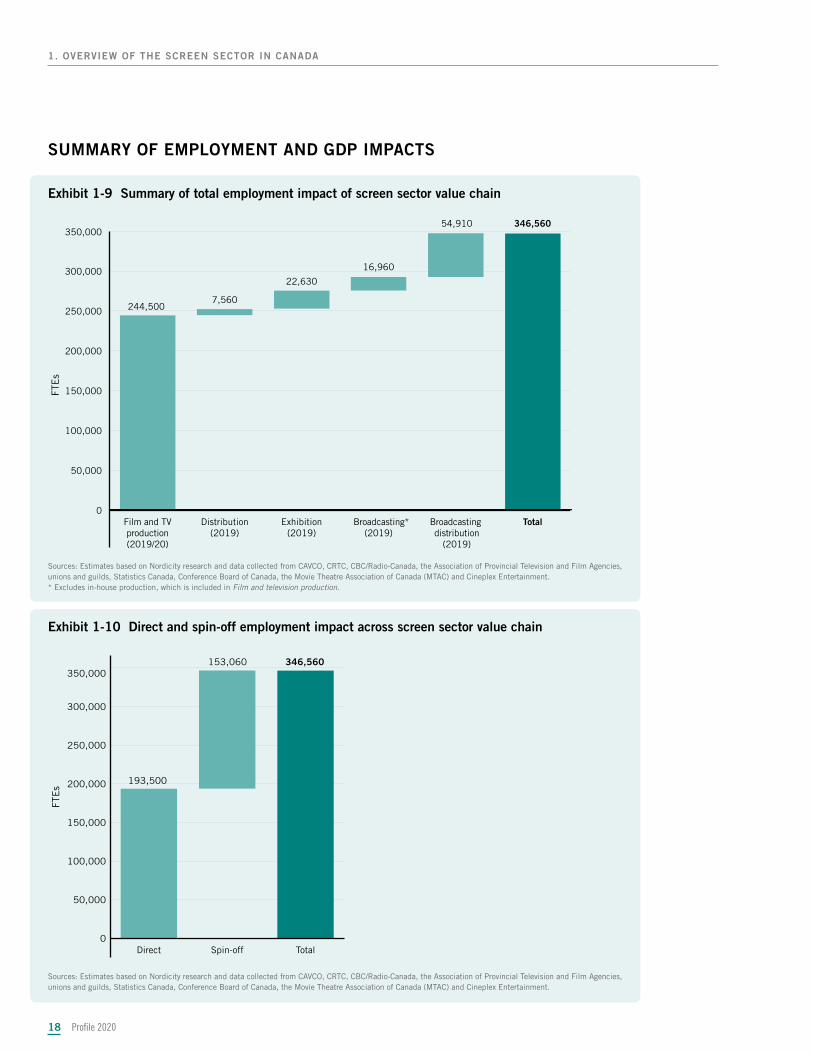
Exhibit 1-9 Summary of total employment impact of screen sector value chain
0
50,000
100,000
150,000
200,000
250,000
300,000
350,000
TotalBroadcasting distribution
(2019)
Broadcasting*(2019)
Exhibition(2019)
Distribution(2019)
Film and TVproduction(2019/20)
FTE
s
244,5007,560
22,630
16,960
54,910 346,560
Sources: Estimates based on Nordicity research and data collected from CAVCO, CRTC, CBC/Radio-Canada, the Association of Provincial Television and Film Agencies, unions and guilds, Statistics Canada, Conference Board of Canada, the Movie Theatre Association of Canada (MTAC) and Cineplex Entertainment.* Excludes in-house production, which is included in Film and television production.
Exhibit 1-10 Direct and spin-off employment impact across screen sector value chain
0
50,000
100,000
150,000
200,000
250,000
300,000
350,000
TotalSpin-offDirect
FTE
s
193,500
346,560153,060
Sources: Estimates based on Nordicity research and data collected from CAVCO, CRTC, CBC/Radio-Canada, the Association of Provincial Television and Film Agencies, unions and guilds, Statistics Canada, Conference Board of Canada, the Movie Theatre Association of Canada (MTAC) and Cineplex Entertainment.
Profile 2020 19
1. OVERVIEW OF THE SCREEN SECTOR IN CANADA
Exhibit 1-11 Summary of total GDP impact of screen sector value chain
0
5,000
10,000
15,000
20,000
25,000
TotalBroadcasting distribution
(2019)
Broadcasting*(2019)
Exhibition(2019)
Distribution(2019)
Film and TVproduction(2019/20)
GD
P (
$ m
illio
ns)
12,243903
1,327
2,903
5,698 23,074
Sources: Estimates based on Nordicity research and data collected from CAVCO, CRTC, CBC/Radio-Canada, the Association of Provincial Television and Film Agencies, Statistics Canada, Conference Board of Canada, the Movie Theatre Association of Canada (MTAC) and Cineplex Entertainment.* Excludes in-house production, which is included in Film and television production.
Exhibit 1-12 Direct and spin-off GDP impact across the screen sector value chain
0
5,000
10,000
15,000
20,000
25,000
TotalSpin-offDirect
$ m
illio
ns
11,573
11,501 23,074
Sources: Estimates based on Nordicity research and data collected from CAVCO, CRTC, CBC/Radio-Canada, the Association of Provincial Television and Film Agencies, Statistics Canada, Conference Board of Canada, the Movie Theatre Association of Canada (MTAC) and Cineplex Entertainment.
Profile 202020
Highlights from 2019/20Highlights from 2019/20
20
• Canadian content production decreased by 12.4% to $2.92 billion.
• English-language production7 decreased by 14.3% to $2.13 billion.
• French-language production decreased by 6.8% to $791 million.
• Fiction production decreased by 5.2% to $1.65 billion.
• Children’s and youth production decreased by 30.8% to $415 million.
• Documentary production decreased by 27.2% to $213 million.
• Production of programs in the lifestyle and human interest genre8 decreased by 14.8% to $513 million.
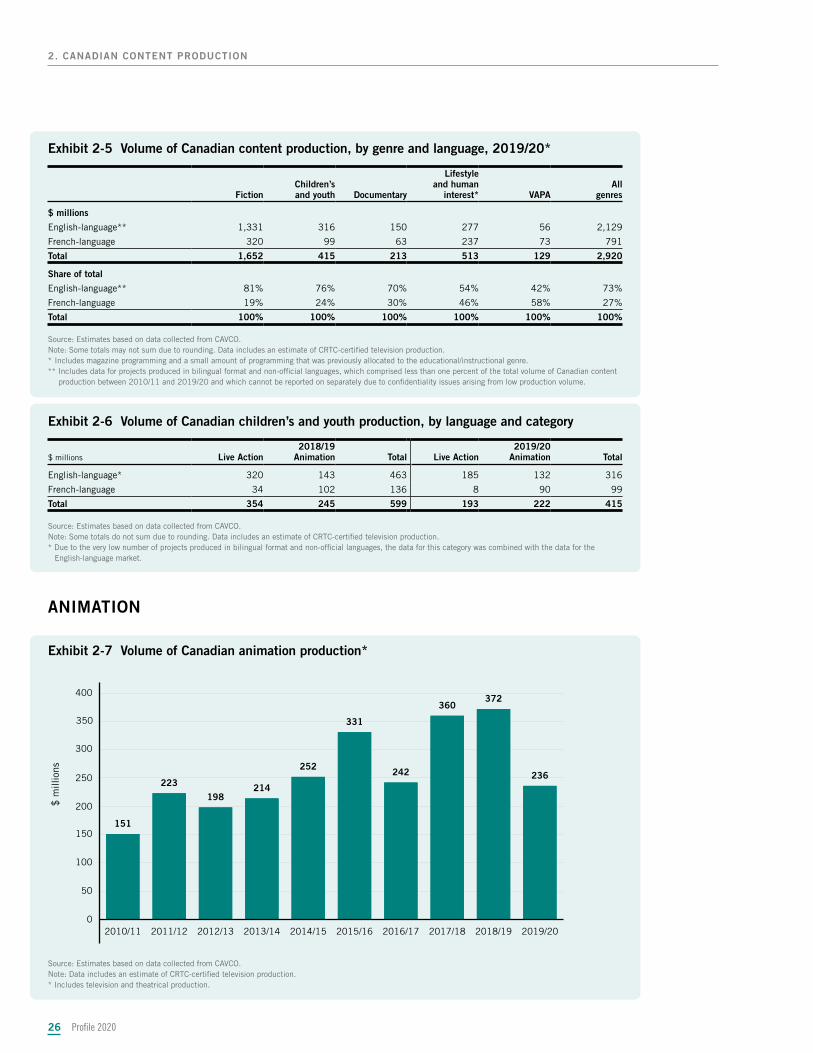
• Animation production decreased by 36.6% to $236 million.
7 Includes data for projects produced in bilingual format and non-official languages, which comprised less than one percent of the total volume of Canadian content production between 2010/11 and 2019/20 and which cannot be reported on separately due to confidentiality issues arising from low production volume.
8 Includes magazine programming and a small amount of programming that was previously allocated to the educational/instructional genre.
• Production in the variety and performing arts (VAPA) genre increased by 31.9% to $129 million.
2. 2. Canadian content Canadian content productionproductionCanadian content production consists of all films and television programs certified as Canadian content by the Canadian content production consists of all films and television programs certified as Canadian content by the Canadian Audio-Visual Certification Office (CAVCO), and includes audiovisual content made for initial release Canadian Audio-Visual Certification Office (CAVCO), and includes audiovisual content made for initial release on online services. Most Canadian content productions are made by independent production companies, on online services. Most Canadian content productions are made by independent production companies, although broadcaster-affiliated production companiesalthough broadcaster-affiliated production companies66 also account for some production in this segment. also account for some production in this segment.
The Canadian content production segment excludes broadcaster in-house and foreign location and service The Canadian content production segment excludes broadcaster in-house and foreign location and service (FLS) production. In this section, we provide summary statistics for Canadian content production. In Sections (FLS) production. In this section, we provide summary statistics for Canadian content production. In Sections 3 and 4, we provide more detailed statistics for Canadian television and Canadian theatrical feature film 3 and 4, we provide more detailed statistics for Canadian television and Canadian theatrical feature film production, respectively.production, respectively.
6 Affiliated production companies are production companies in which a Canadian broadcaster owns or controls at least 30% of the voting equity.
Profile 2020 21
2. CANADIAN CONTENT PRODUCTION
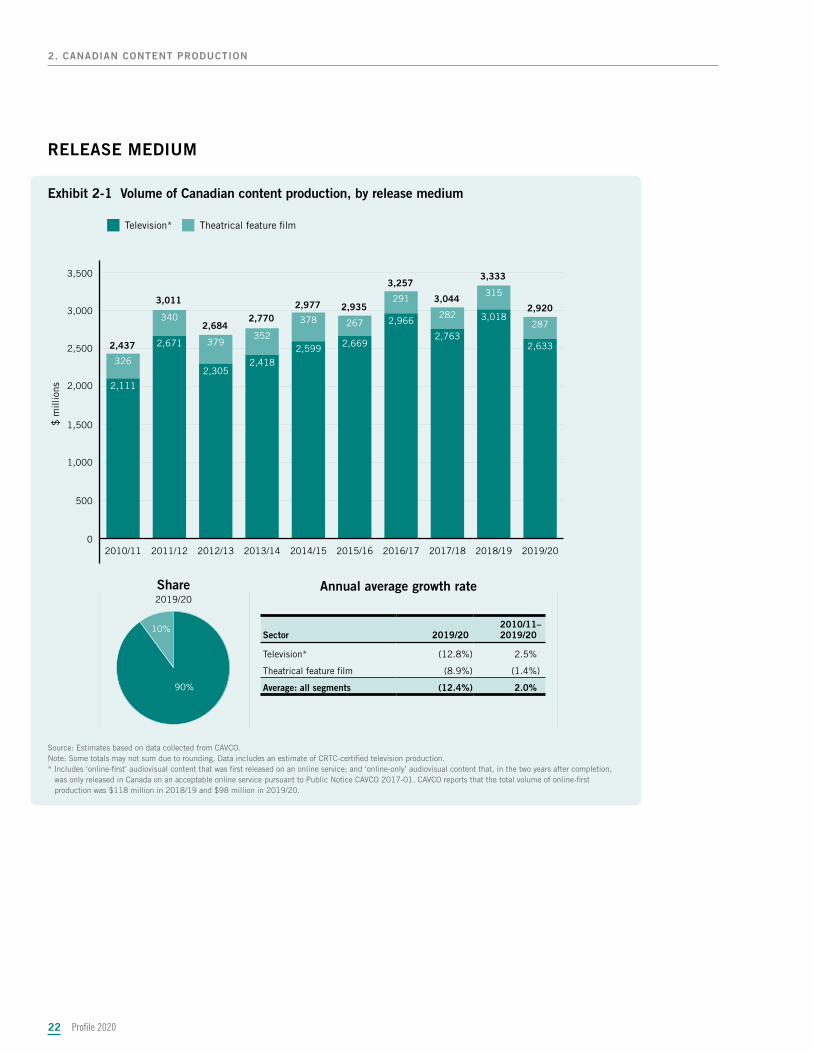
After climbing to an all-time high of $3.33 billion in 2018/19, the total volume of Canadian content production dropped by 12.4% to $2.92 billion in 2019/20 (Exhibit 2-1). While both the Canadian television and Canadian theatrical feature film segments contributed to the overall decrease, the $385 million drop in Canadian television accounted for the vast majority of the decline.
In the Canadian television segment, production levels in both official languages were down, as well as in every genre except for VAPA. The steep drop in the children’s and youth genre category, including animation production, was the biggest contributor to the overall decline (Exhibits 2-3 and 2-7).
The Canadian theatrical feature film segment experienced an 8.9%, or $28 million, drop in overall production volume in 2019/20. Although English-language production actually increased, a decrease in the production of films in the French-language and other-languages categories resulted in the overall decline (Exhibit 4-1).
In recent years, increased demand for content around the globe has been a key driver of investment in Canadian production. This financing most readily takes the form of “pre-sales” of distribution and broadcast rights to international buyers. Between 2010/11 and 2018/19, total foreign investment in production (FIIP) of Canadian content more than doubled – from $421 million to $864 million (Exhibit 1-5). In 2019/20, however, it declined by $104 million. Despite this decrease, foreign investment still accounted for 26% of the total financing for Canadian content production (Exhibit 1-5 and Exhibit 2-1).
Profile 202022
2. CANADIAN CONTENT PRODUCTION
RELEASE MEDIUM
Exhibit 2-1 Volume of Canadian content production, by release medium
Annual average growth rateShare2019/20
90%
10%
0
500
1,000
1,500
2,000
2,500
3,000
3,500
287
315
282
291
267378
352379
340
326
2,633
3,018
2,763
2,966
2,6692,5992,418
2,305
2,671
2,111
2019/202018/192017/182016/172015/162014/152013/142012/132011/122010/11
Television*
$ m
illio
ns
Theatrical feature �lm
3,333
2,9203,044
3,257
2,9352,9772,770
2,684
3,011
2,437
Source: Estimates based on data collected from CAVCO.Note: Some totals may not sum due to rounding. Data includes an estimate of CRTC-certified television production.* Includes ‘online-first’ audiovisual content that was first released on an online service; and ‘online-only’ audiovisual content that, in the two years after completion,
was only released in Canada on an acceptable online service pursuant to Public Notice CAVCO 2017-01. CAVCO reports that the total volume of online-first production was $118 million in 2018/19 and $98 million in 2019/20.
Sector 2019/20 2010/11– 2019/20–
Television* (12.8%) 2.5%
Theatrical feature film (8.9%) (1.4%)
Average: all segments (12.4%) 2.0%
Profile 2020 23
2. CANADIAN CONTENT PRODUCTION
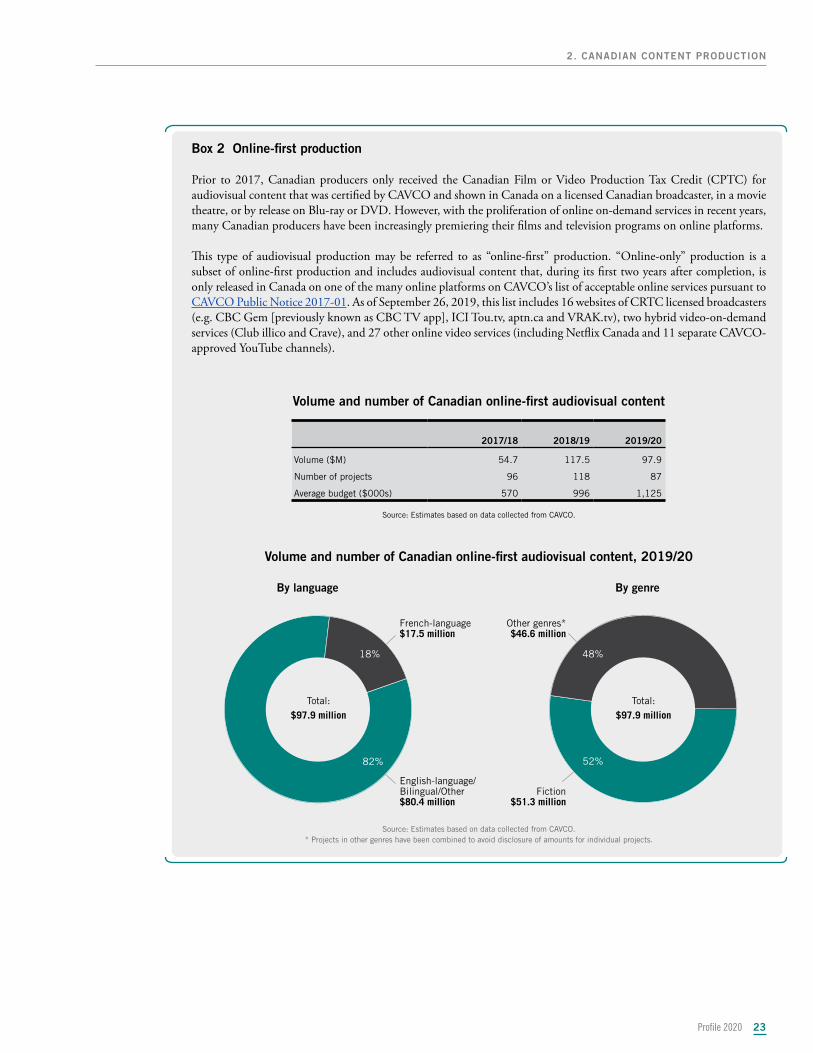
Box 2 Online-first production
Prior to 2017, Canadian producers only received the Canadian Film or Video Production Tax Credit (CPTC) for audiovisual content that was certified by CAVCO and shown in Canada on a licensed Canadian broadcaster, in a movie theatre, or by release on Blu-ray or DVD. However, with the proliferation of online on-demand services in recent years, many Canadian producers have been increasingly premiering their films and television programs on online platforms.
This type of audiovisual production may be referred to as “online-first” production. “Online-only” production is a subset of online-first production and includes audiovisual content that, during its first two years after completion, is only released in Canada on one of the many online platforms on CAVCO’s list of acceptable online services pursuant to CAVCO Public Notice 2017-01. As of September 26, 2019, this list includes 16 websites of CRTC licensed broadcasters (e.g. CBC Gem [previously known as CBC TV app], ICI Tou.tv, aptn.ca and VRAK.tv), two hybrid video-on-demand services (Club illico and Crave), and 27 other online video services (including Netflix Canada and 11 separate CAVCO-approved YouTube channels).
Volume and number of Canadian online-first audiovisual content
2017/18
2018/19
2019/20
Volume ($M) 54.7 117.5 97.9
Number of projects 96 118 87
Average budget ($000s) 570 996 1,125
Source: Estimates based on data collected from CAVCO.
Volume and number of Canadian online-first audiovisual content, 2019/20
By language By genre
French-language$17.5 million
English-language/Bilingual/Other$80.4 million
Other genres*$46.6 million
Fiction$51.3 million
Total:$97.9 million
82%
18%
Total:$97.9 million
52%
48%
Source: Estimates based on data collected from CAVCO.* Projects in other genres have been combined to avoid disclosure of amounts for individual projects.
Profile 202024
2. CANADIAN CONTENT PRODUCTION
LANGUAGE
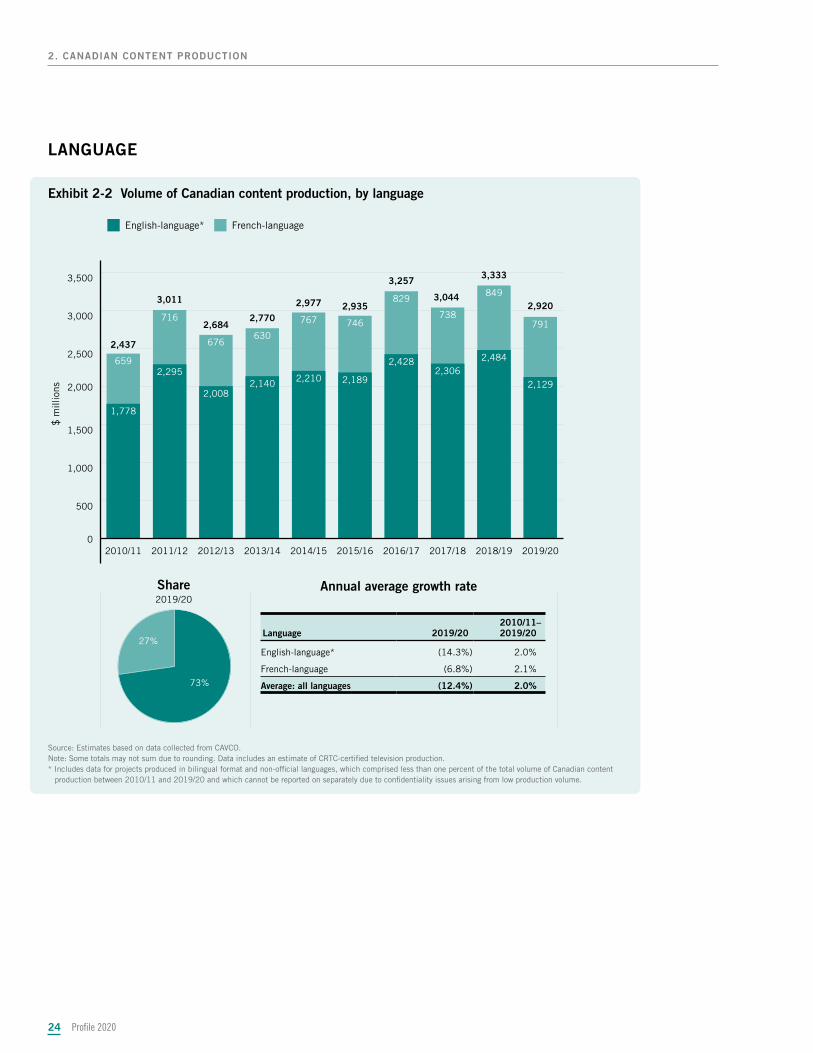
Exhibit 2-2 Volume of Canadian content production, by language
Annual average growth rateShare2019/20
73%
27%
0
500
1,000
1,500
2,000
2,500
3,000
3,500
791
849
738
829
746767
630676
716
659
2,129
2,4842,306
2,428
2,1892,2102,1402,008
2,295
1,778
2019/202018/192017/182016/172015/162014/152013/142012/132011/122010/11
English-language*
$ m
illio
ns
French-language
2,920
3,333
3,044
3,257
2,9352,977
2,7702,684
3,011
2,437
Source: Estimates based on data collected from CAVCO.Note: Some totals may not sum due to rounding. Data includes an estimate of CRTC-certified television production.* Includes data for projects produced in bilingual format and non-official languages, which comprised less than one percent of the total volume of Canadian content
production between 2010/11 and 2019/20 and which cannot be reported on separately due to confidentiality issues arising from low production volume.
Language 2019/20 2010/11– 2019/20–
English-language* (14.3%) 2.0%
French-language (6.8%) 2.1%
Average: all languages (12.4%) 2.0%
Profile 2020 25
2. CANADIAN CONTENT PRODUCTION
GENRE
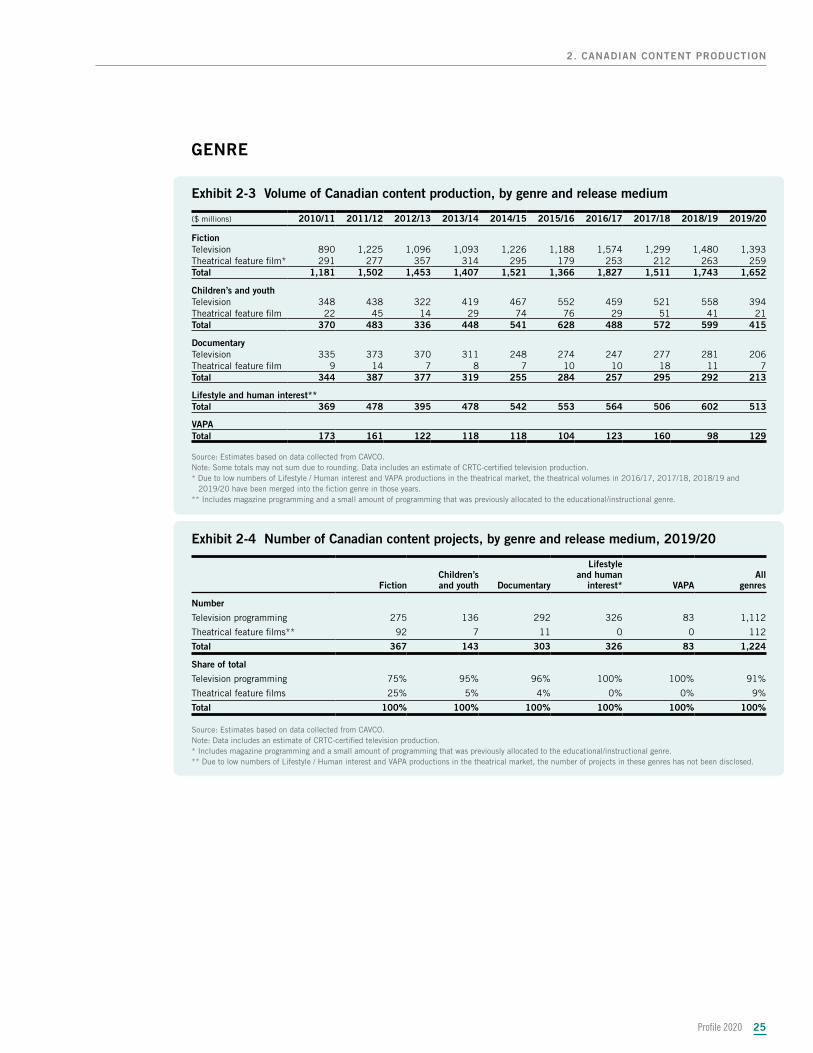
Exhibit 2-3 Volume of Canadian content production, by genre and release medium
($ millions) 2010/11 2011/12 2012/13 2013/14 2014/15 2015/16 2016/17 2017/18 2018/19 2019/20
FictionTelevision 890 1,225 1,096 1,093 1,226 1,188 1,574 1,299 1,480 1,393Theatrical feature film* 291 277 357 314 295 179 253 212 263 259Total 1,181 1,502 1,453 1,407 1,521 1,366 1,827 1,511 1,743 1,652
Children’s and youthTelevision 348 438 322 419 467 552 459 521 558 394Theatrical feature film 22 45 14 29 74 76 29 51 41 21Total 370 483 336 448 541 628 488 572 599 415
DocumentaryTelevision 335 373 370 311 248 274 247 277 281 206Theatrical feature film 9 14 7 8 7 10 10 18 11 7Total 344 387 377 319 255 284 257 295 292 213
Lifestyle and human interest**Total 369 478 395 478 542 553 564 506 602 513
VAPATotal 173 161 122 118 118 104 123 160 98 129
Source: Estimates based on data collected from CAVCO.Note: Some totals may not sum due to rounding. Data includes an estimate of CRTC-certified television production.* Due to low numbers of Lifestyle / Human interest and VAPA productions in the theatrical market, the theatrical volumes in 2016/17, 2017/18, 2018/19 and
2019/20 have been merged into the fiction genre in those years.** Includes magazine programming and a small amount of programming that was previously allocated to the educational/instructional genre.
Exhibit 2-4 Number of Canadian content projects, by genre and release medium, 2019/20
FictionChildren’s and youth Documentary
Lifestyle and human
interest* VAPAAll
genres
Number
Television programming 275 136 292 326 83 1,112
Theatrical feature films** 92 7 11 0 0 112
Total 367 143 303 326 83 1,224
Share of total
Television programming 75% 95% 96% 100% 100% 91%
Theatrical feature films 25% 5% 4% 0% 0% 9%
Total 100% 100% 100% 100% 100% 100%
Source: Estimates based on data collected from CAVCO. Note: Data includes an estimate of CRTC-certified television production.* Includes magazine programming and a small amount of programming that was previously allocated to the educational/instructional genre.** Due to low numbers of Lifestyle / Human interest and VAPA productions in the theatrical market, the number of projects in these genres has not been disclosed.
Profile 202026
2. CANADIAN CONTENT PRODUCTION
Exhibit 2-5 Volume of Canadian content production, by genre and language, 2019/20*
FictionChildren’s and youth Documentary
Lifestyle and human
interest* VAPAAll
genres
$ millions
English-language** 1,331 316 150 277 56 2,129
French-language 320 99 63 237 73 791
Total 1,652 415 213 513 129 2,920
Share of total
English-language** 81% 76% 70% 54% 42% 73%
French-language 19% 24% 30% 46% 58% 27%
Total 100% 100% 100% 100% 100% 100%
Source: Estimates based on data collected from CAVCO.Note: Some totals may not sum due to rounding. Data includes an estimate of CRTC-certified television production.* Includes magazine programming and a small amount of programming that was previously allocated to the educational/instructional genre.** Includes data for projects produced in bilingual format and non-official languages, which comprised less than one percent of the total volume of Canadian content
production between 2010/11 and 2019/20 and which cannot be reported on separately due to confidentiality issues arising from low production volume.
Exhibit 2-6 Volume of Canadian children’s and youth production, by language and category
$ millions Live Action2018/19
Animation Total Live Action2019/20
Animation Total
English-language* 320 143 463 185 132 316
French-language 34 102 136 8 90 99
Total 354 245 599 193 222 415
Source: Estimates based on data collected from CAVCO.Note: Some totals do not sum due to rounding. Data includes an estimate of CRTC-certified television production.* Due to the very low number of projects produced in bilingual format and non-official languages, the data for this category was combined with the data for the
English-language market.
ANIMATION
Exhibit 2-7 Volume of Canadian animation production*
0
50
100
150
200
250
300
350
400
236
372360
242
331
252
214198
223
151
2019/202018/192017/182016/172015/162014/152013/142012/132011/122010/11
$ m
illio
ns
Source: Estimates based on data collected from CAVCO.Note: Data includes an estimate of CRTC-certified television production.* Includes television and theatrical production.
Profile 2020 27
2. CANADIAN CONTENT PRODUCTION
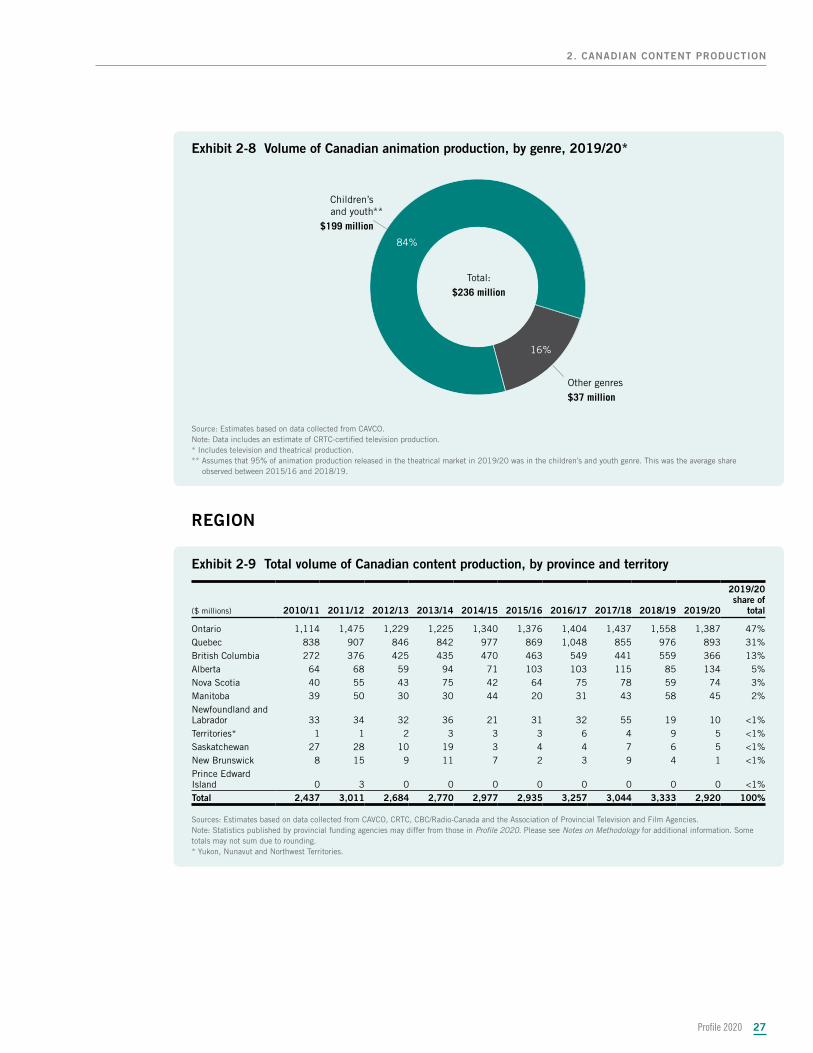
Exhibit 2-8 Volume of Canadian animation production, by genre, 2019/20*
Children’sand youth
$199 million**
Other genres$37 million
Total:$236 million
16%
84%
Source: Estimates based on data collected from CAVCO.Note: Data includes an estimate of CRTC-certified television production.* Includes television and theatrical production.** Assumes that 95% of animation production released in the theatrical market in 2019/20 was in the children’s and youth genre. This was the average share
observed between 2015/16 and 2018/19.
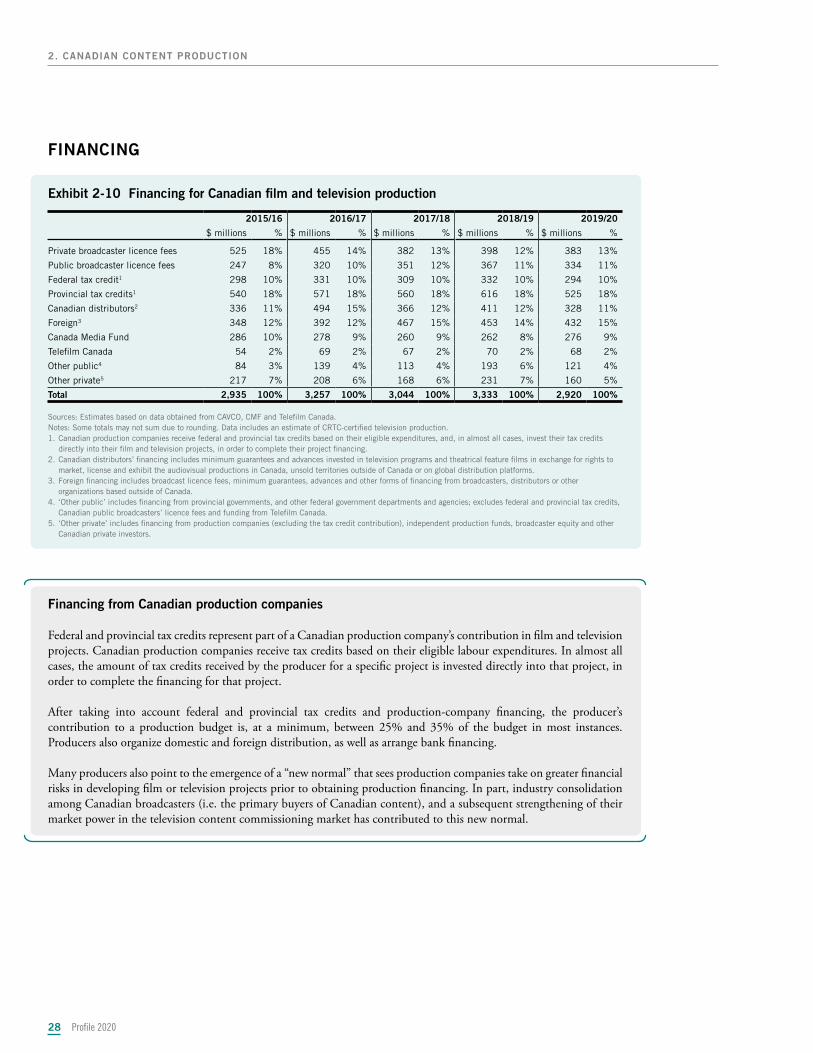
REGION
Exhibit 2-9 Total volume of Canadian content production, by province and territory
($ millions) 2010/11 2011/12 2012/13 2013/14 2014/15 2015/16 2016/17 2017/18 2018/19 2019/20
2019/20 share of
total
Ontario 1,114 1,475 1,229 1,225 1,340 1,376 1,404 1,437 1,558 1,387 47%Quebec 838 907 846 842 977 869 1,048 855 976 893 31%British Columbia 272 376 425 435 470 463 549 441 559 366 13%Alberta 64 68 59 94 71 103 103 115 85 134 5%Nova Scotia 40 55 43 75 42 64 75 78 59 74 3%Manitoba 39 50 30 30 44 20 31 43 58 45 2%Newfoundland and Labrador 33 34 32 36 21 31 32 55 19 10 <1%Territories* 1 1 2 3 3 3 6 4 9 5 <1%Saskatchewan 27 28 10 19 3 4 4 7 6 5 <1%New Brunswick 8 15 9 11 7 2 3 9 4 1 <1%Prince Edward Island 0 3 0 0 0 0 0 0 0 0 <1%Total 2,437 3,011 2,684 2,770 2,977 2,935 3,257 3,044 3,333 2,920 100%
Sources: Estimates based on data collected from CAVCO, CRTC, CBC/Radio-Canada and the Association of Provincial Television and Film Agencies.Note: Statistics published by provincial funding agencies may differ from those in Profile 2020. Please see Notes on Methodology for additional information. Some totals may not sum due to rounding. * Yukon, Nunavut and Northwest Territories.
Profile 202028
2. CANADIAN CONTENT PRODUCTION
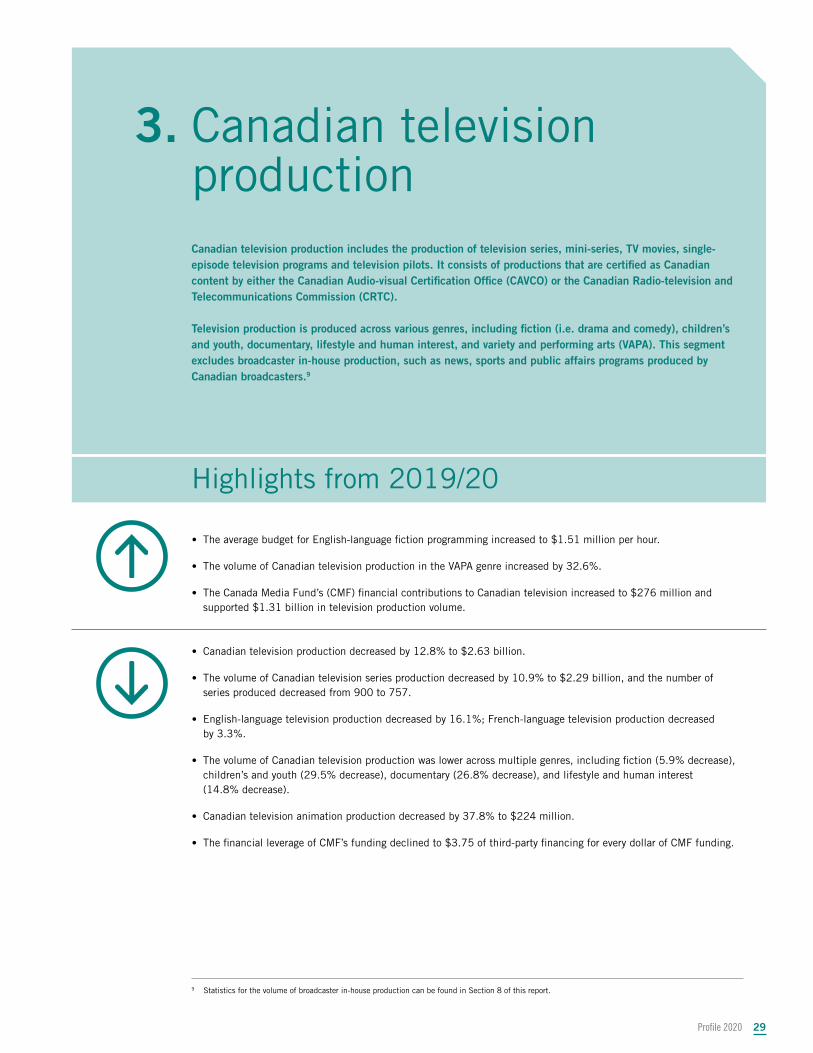
FINANCING
Exhibit 2-10 Financing for Canadian film and television production
2015/16 2016/17 2017/18 2018/19 2019/20
$ millions % $ millions % $ millions % $ millions % $ millions %
Private broadcaster licence fees 525 18% 455 14% 382 13% 398 12% 383 13%
Public broadcaster licence fees 247 8% 320 10% 351 12% 367 11% 334 11%
Federal tax credit1 298 10% 331 10% 309 10% 332 10% 294 10%
Provincial tax credits1 540 18% 571 18% 560 18% 616 18% 525 18%
Canadian distributors2 336 11% 494 15% 366 12% 411 12% 328 11%
Foreign3 348 12% 392 12% 467 15% 453 14% 432 15%
Canada Media Fund 286 10% 278 9% 260 9% 262 8% 276 9%
Telefilm Canada 54 2% 69 2% 67 2% 70 2% 68 2%
Other public4 84 3% 139 4% 113 4% 193 6% 121 4%
Other private5 217 7% 208 6% 168 6% 231 7% 160 5%
Total 2,935 100% 3,257 100% 3,044 100% 3,333 100% 2,920 100%
Sources: Estimates based on data obtained from CAVCO, CMF and Telefilm Canada. Notes: Some totals may not sum due to rounding. Data includes an estimate of CRTC-certified television production.1. Canadian production companies receive federal and provincial tax credits based on their eligible expenditures, and, in almost all cases, invest their tax credits
directly into their film and television projects, in order to complete their project financing.2. Canadian distributors’ financing includes minimum guarantees and advances invested in television programs and theatrical feature films in exchange for rights to
market, license and exhibit the audiovisual productions in Canada, unsold territories outside of Canada or on global distribution platforms.3. Foreign financing includes broadcast licence fees, minimum guarantees, advances and other forms of financing from broadcasters, distributors or other
organizations based outside of Canada.4. ‘Other public’ includes financing from provincial governments, and other federal government departments and agencies; excludes federal and provincial tax credits,
Canadian public broadcasters’ licence fees and funding from Telefilm Canada.5. ‘Other private’ includes financing from production companies (excluding the tax credit contribution), independent production funds, broadcaster equity and other
Canadian private investors.
Financing from Canadian production companies
Federal and provincial tax credits represent part of a Canadian production company’s contribution in film and television projects. Canadian production companies receive tax credits based on their eligible labour expenditures. In almost all cases, the amount of tax credits received by the producer for a specific project is invested directly into that project, in order to complete the financing for that project.
After taking into account federal and provincial tax credits and production-company financing, the producer’s contribution to a production budget is, at a minimum, between 25% and 35% of the budget in most instances. Producers also organize domestic and foreign distribution, as well as arrange bank financing.
Many producers also point to the emergence of a “new normal” that sees production companies take on greater financial risks in developing film or television projects prior to obtaining production financing. In part, industry consolidation among Canadian broadcasters (i.e. the primary buyers of Canadian content), and a subsequent strengthening of their market power in the television content commissioning market has contributed to this new normal.
Highlights from 2019/20Highlights from 2019/20
Profile 2020 29
• Canadian television production decreased by 12.8% to $2.63 billion.
• The volume of Canadian television series production decreased by 10.9% to $2.29 billion, and the number of series produced decreased from 900 to 757.
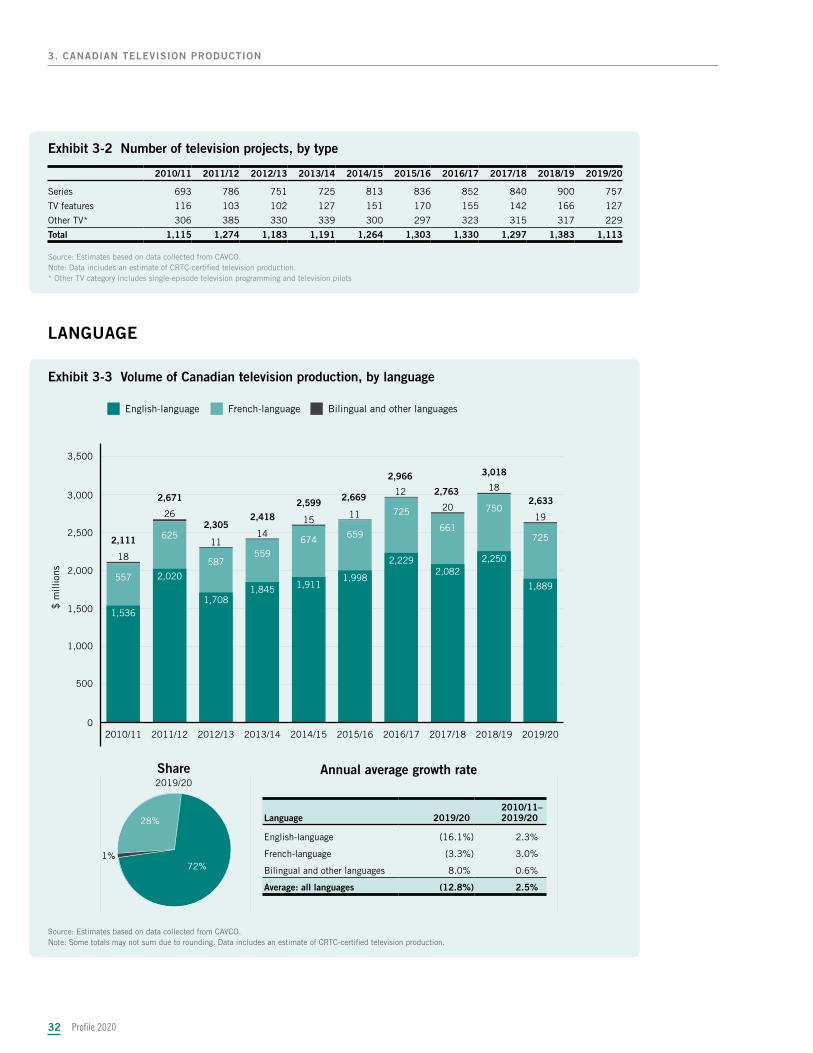
• English-language television production decreased by 16.1%; French-language television production decreased by 3.3%.
• The volume of Canadian television production was lower across multiple genres, including fiction (5.9% decrease), children’s and youth (29.5% decrease), documentary (26.8% decrease), and lifestyle and human interest (14.8% decrease).
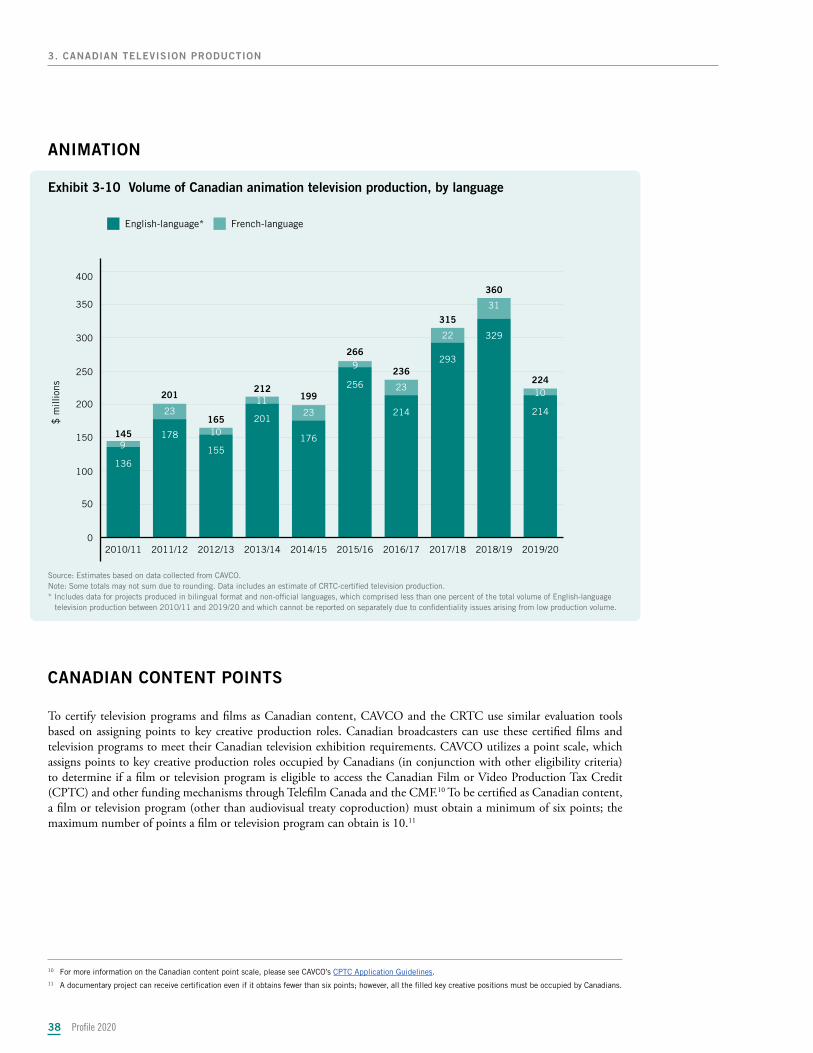
• Canadian television animation production decreased by 37.8% to $224 million.
• The financial leverage of CMF’s funding declined to $3.75 of third-party financing for every dollar of CMF funding.
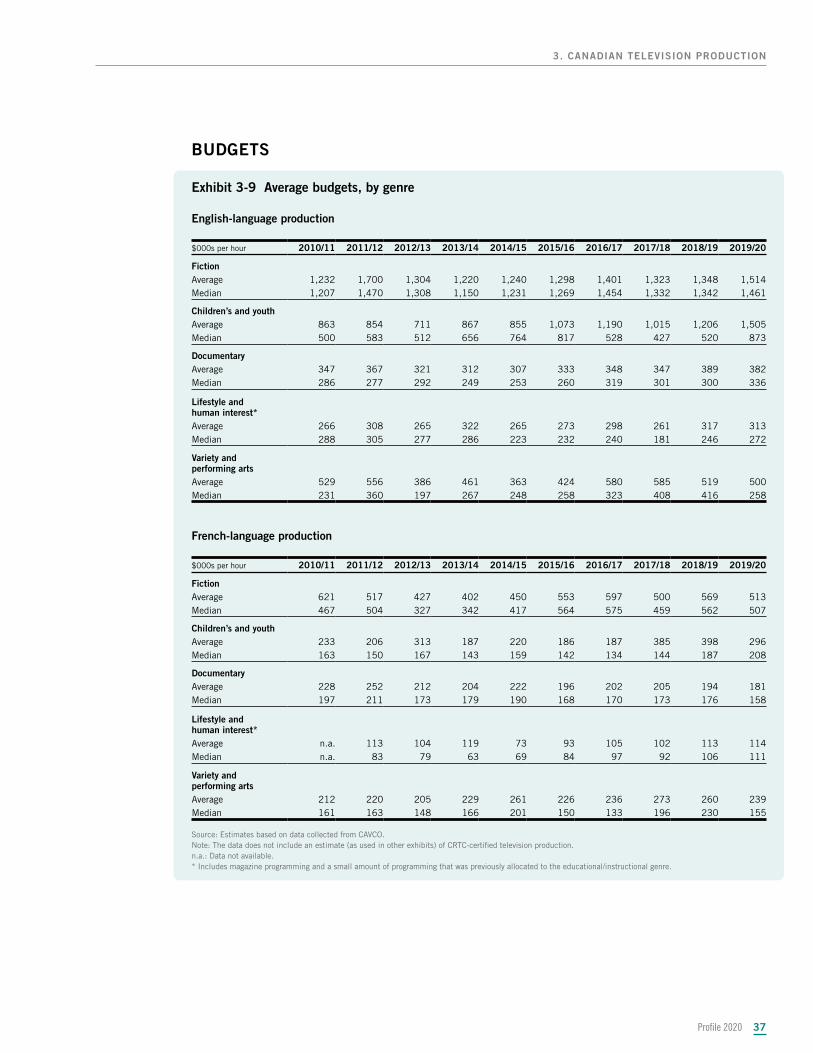
• The average budget for English-language fiction programming increased to $1.51 million per hour.
• The volume of Canadian television production in the VAPA genre increased by 32.6%.
• The Canada Media Fund’s (CMF) financial contributions to Canadian television increased to $276 million and supported $1.31 billion in television production volume.
3. 3. Canadian television Canadian television productionproductionCanadian television production includes the production of television series, mini-series, TV movies, single-Canadian television production includes the production of television series, mini-series, TV movies, single-episode television programs and television pilots. It consists of productions that are certified as Canadian episode television programs and television pilots. It consists of productions that are certified as Canadian content by either the Canadian Audio-visual Certification Office (CAVCO) or the Canadian Radio-television and content by either the Canadian Audio-visual Certification Office (CAVCO) or the Canadian Radio-television and Telecommunications Commission (CRTC).Telecommunications Commission (CRTC).
Television production is produced across various genres, including fiction (i.e. drama and comedy), children’s Television production is produced across various genres, including fiction (i.e. drama and comedy), children’s and youth, documentary, lifestyle and human interest, and variety and performing arts (VAPA). This segment and youth, documentary, lifestyle and human interest, and variety and performing arts (VAPA). This segment excludes broadcaster in-house production, such as news, sports and public affairs programs produced by excludes broadcaster in-house production, such as news, sports and public affairs programs produced by Canadian broadcasters.Canadian broadcasters.99
9 Statistics for the volume of broadcaster in-house production can be found in Section 8 of this report.
Profile 202030
3. CANADIAN TELEVISION PRODUCTION
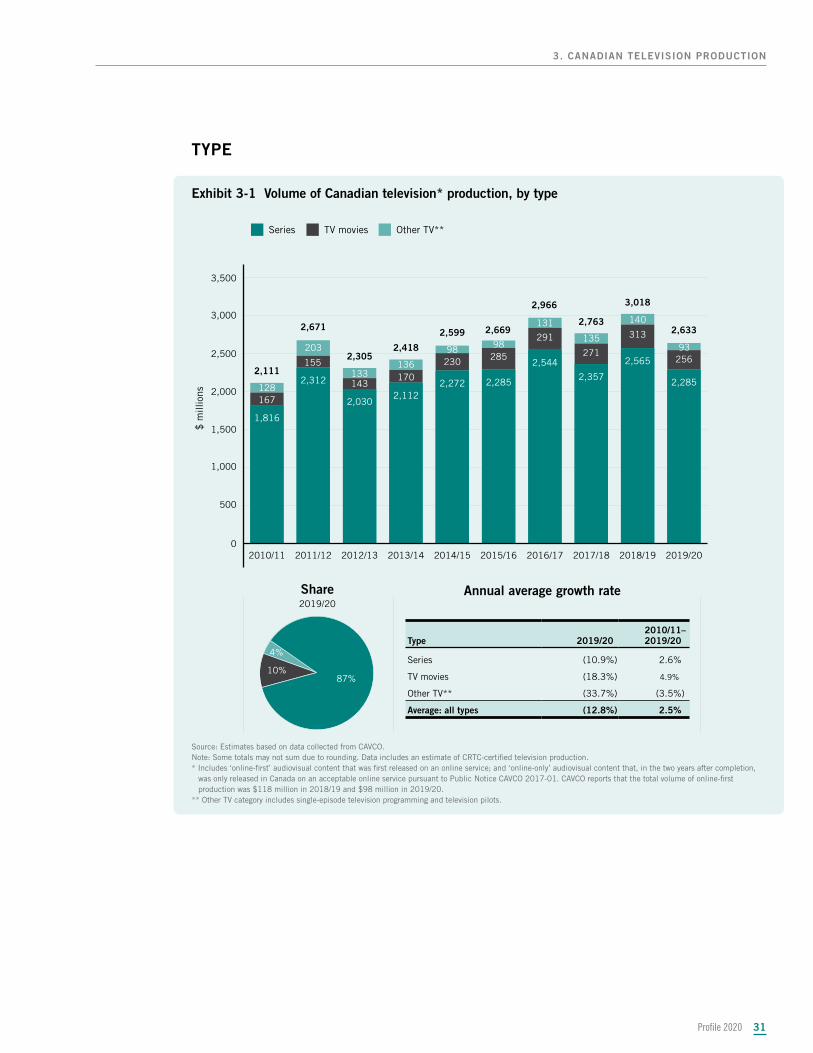
After reaching an all-time high of $3.02 billion in 2018/19, Canadian television production fell to its lowest level since 2014/15 (Exhibit 3-1). This broad-based drop included declines in production volume across language markets, and in every genre but VAPA (Exhibit 3-5).
After reaching a 10-year peak in 2018/19, the production of children’s and youth programming fell by 29.5%, with the vast majority of the overall drop (86%) in the English-language market (Exhibit 3-8). Animation production, which accounts for a large share of children’s and youth production, fell to its lowest level since 2014/15 (Exhibit 3-10). Canadian television documentary production fell to a 10-year low of $206 million, while the lifestyle and human interest genre – which reached an all-time high of $602 million in 2018/19 – fell to $513 million. While the fiction genre contributed to the overall decrease in production volume in 2019/20, over the longer term, it has been the key source of growth in Canadian television production compared to other genres. Between 2014/15 and 2019/20, the fiction genre added $167 million to the total Canadian television production volume (Exhibit 3 - 7). While the VAPA genre added $11 million, each of the other genres saw their volumes decline over the five-year period. However, despite the 6.6% drop in English-language fiction production volume in 2019/20, the average budget actually increased by 11.7% to over $1.51 million per hour, its highest level since 2011/12 (Exhibit 3-9a).
The CMF continued to be a major player in the Canadian television segment, disbursing $276 million and thereby supporting $1.31 billion in Canadian television production (Exhibit 3-13). This accounted for approximately 50% of all Canadian television production in 2019/20. Additionally, foreign pre-sale financing of Canadian television production totalled $381 million, or 14% of total production financing, which is slightly down from a five-year high of 16% in 2017/18 (Exhibit 3-17).
Profile 2020 31
3. CANADIAN TELEVISION PRODUCTION
TYPE
Exhibit 3-1 Volume of Canadian television* production, by type
Annual average growth rateShare2019/20
87%
4%
10%
0
500
1,000
1,500
2,000
2,500
3,000
3,500
140
135
131
9898
136133
203
128
256
313
271
291
285230
170143
155
167
2,285
2,565
2,357
2,544
2,2852,2722,112
2,030
2,312
1,816
2019/202018/192017/182016/172015/162014/152013/142012/132011/122010/11
Series
$ m
illio
ns
TV movies Other TV**
93
2,633
3,018
2,763
2,966
2,6692,599
2,4182,305
2,671
2,111
Source: Estimates based on data collected from CAVCO.Note: Some totals may not sum due to rounding. Data includes an estimate of CRTC-certified television production.* Includes ‘online-first’ audiovisual content that was first released on an online service; and ‘online-only’ audiovisual content that, in the two years after completion,
was only released in Canada on an acceptable online service pursuant to Public Notice CAVCO 2017-01. CAVCO reports that the total volume of online-first production was $118 million in 2018/19 and $98 million in 2019/20.
** Other TV category includes single-episode television programming and television pilots.
Type 2019/20 2010/11– 2019/20–
Series (10.9%) 2.6%
TV movies (18.3%) 4.9%
Other TV** (33.7%) (3.5%)
Average: all types (12.8%) 2.5%
Profile 202032
3. CANADIAN TELEVISION PRODUCTION
Exhibit 3-2 Number of television projects, by type
2010/11 2011/12 2012/13 2013/14 2014/15 2015/16 2016/17 2017/18 2018/19 2019/20
Series 693 786 751 725 813 836 852 840 900 757
TV features 116 103 102 127 151 170 155 142 166 127
Other TV* 306 385 330 339 300 297 323 315 317 229
Total 1,115 1,274 1,183 1,191 1,264 1,303 1,330 1,297 1,383 1,113
Source: Estimates based on data collected from CAVCO.Note: Data includes an estimate of CRTC-certified television production.* Other TV category includes single-episode television programming and television pilots
LANGUAGE
Exhibit 3-3 Volume of Canadian television production, by language
Annual average growth rateShare2019/20
1%72%
28%
0
500
1,000
1,500
2,000
2,500
3,000
3,500
19
18
20
12
1115
1411
26
18
725
750
661
725
659674559
587
625
5571,889
2,2502,082
2,229
1,9981,9111,845
1,708
2,020
1,536
2019/202018/192017/182016/172015/162014/152013/142012/132011/122010/11
English-language
$ m
illio
ns
French-language Bilingual and other languages
3,018
2,763
2,966
2,6692,599
2,4182,305
2,671
2,111
2,633
Source: Estimates based on data collected from CAVCO.Note: Some totals may not sum due to rounding. Data includes an estimate of CRTC-certified television production.
Language 2019/20 2010/11– 2019/20–
English-language (16.1%) 2.3%
French-language (3.3%) 3.0%
Bilingual and other languages 8.0% 0.6%
Average: all languages (12.8%) 2.5%
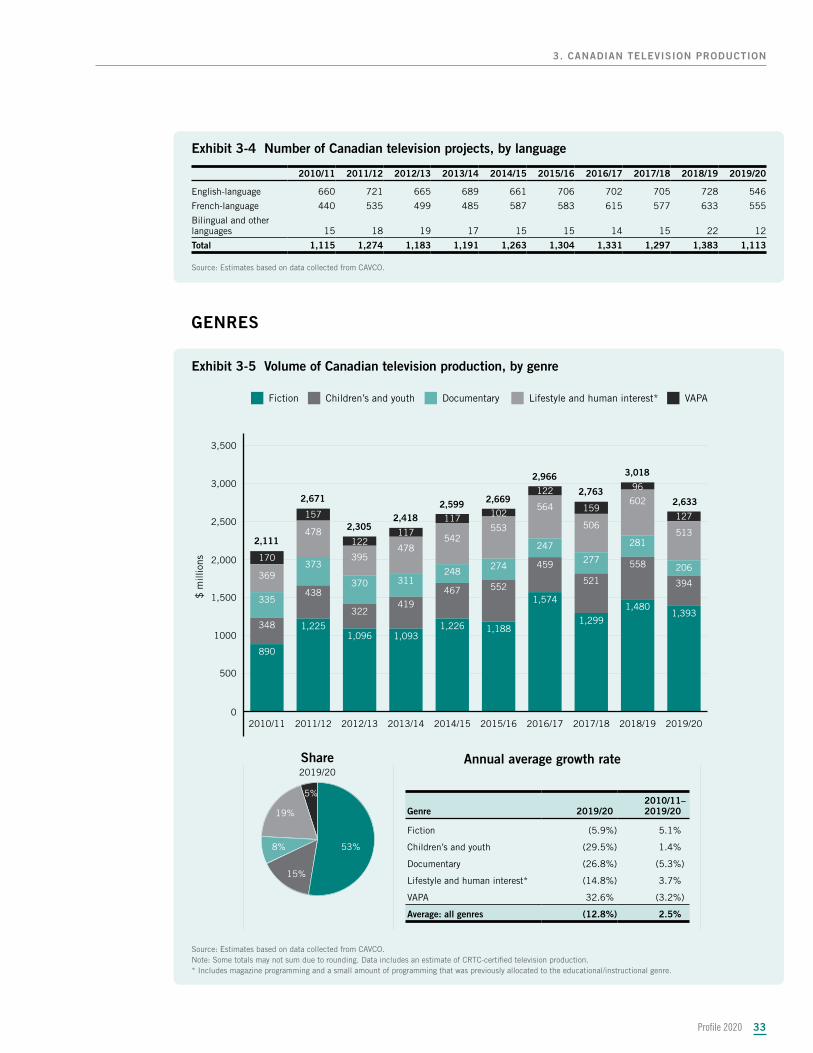
Exhibit 3-4 Number of Canadian television projects, by language
2010/11 2011/12 2012/13 2013/14 2014/15 2015/16 2016/17 2017/18 2018/19 2019/20
English-language 660 721 665 689 661 706 702 705 728 546
French-language 440 535 499 485 587 583 615 577 633 555
Bilingual and other languages 15 18 19 17 15 15 14 15 22 12
Total 1,115 1,274 1,183 1,191 1,263 1,304 1,331 1,297 1,383 1,113
Source: Estimates based on data collected from CAVCO.
GENRES
Exhibit 3-5 Volume of Canadian television production, by genre
Annual average growth rateShare2019/20
53%
15%
8%
5%
19%
0
500
1000
1,500
2,000
2,500
3,000
3,500
513
127
602
96
506
159564
122
553
102
542
117
478
117
395
122478
157
369
170206
281
277
247
274248
311370
373
335
394
558
521
459
552467419
322
438
3481,393
1,4801,299
1,574
1,1881,2261,0931,096
1,225
890
2019/202018/192017/182016/172015/162014/152013/142012/132011/122010/11
Fiction
$ m
illio
ns
Children’s and youth Documentary Lifestyle and human interest* VAPA
3,018
2,763
2,966
2,6692,5992,418
2,305
2,671
2,111
2,633
Source: Estimates based on data collected from CAVCO.Note: Some totals may not sum due to rounding. Data includes an estimate of CRTC-certified television production.* Includes magazine programming and a small amount of programming that was previously allocated to the educational/instructional genre.
Genre 2019/20 2010/11– 2019/20–
Fiction (5.9%) 5.1%
Children’s and youth (29.5%) 1.4%
Documentary (26.8%) (5.3%)
Lifestyle and human interest* (14.8%) 3.7%
VAPA 32.6% (3.2%)
Average: all genres (12.8%) 2.5%
Profile 2020 33
3. CANADIAN TELEVISION PRODUCTION
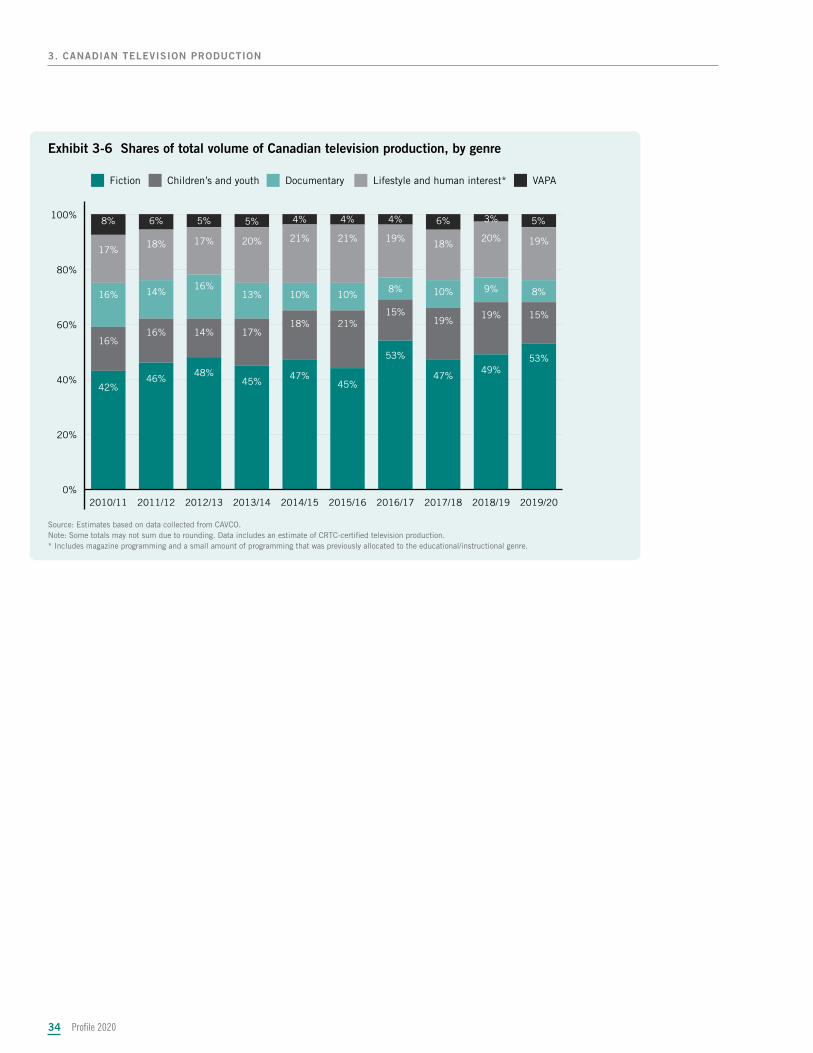
Exhibit 3-6 Shares of total volume of Canadian television production, by genre
0%
20%
40%
60%
80%
100%
19%
5%
20%
3%
18%
6%
19%
4%
21%
4%
21%
4%
20%
5%
17%
5%
18%
6%
17%
8%
8%9%10%8%10%10%13%
16%14%16%
15%19%19%
15%21%18%
17%14%16%16%
53%49%
47%
53%
45%47%
45%48%
46%42%
2019/202018/192017/182016/172015/162014/152013/142012/132011/122010/11
Fiction Children’s and youth Documentary VAPALifestyle and human interest*
Source: Estimates based on data collected from CAVCO.Note: Some totals may not sum due to rounding. Data includes an estimate of CRTC-certified television production.* Includes magazine programming and a small amount of programming that was previously allocated to the educational/instructional genre.
Profile 202034
3. CANADIAN TELEVISION PRODUCTION
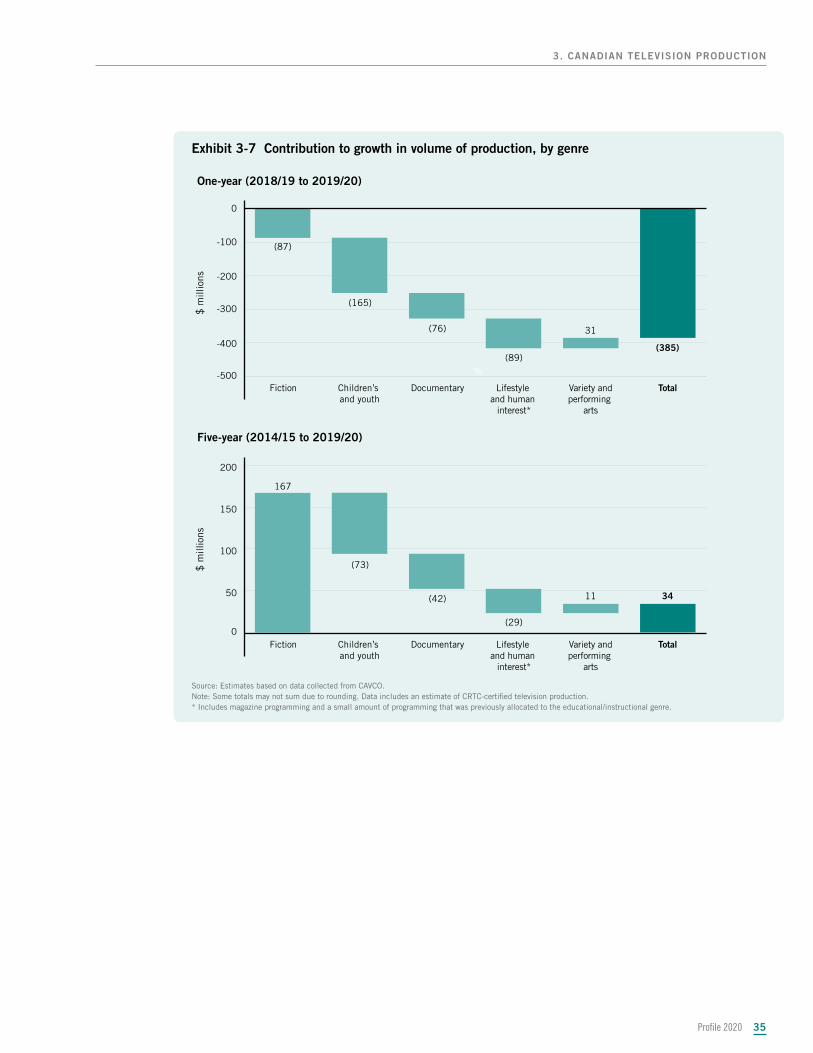
Exhibit 3-7 Contribution to growth in volume of production, by genre
-500
-400
-300
-200
-100
0
Variety andperforming
arts
TotalLifestyle and human
interest*
DocumentaryChildren’s and youth
Fiction
$ m
illio
ns
(87)
(165)
(76)
(89)
31
(385)
0
50
100
150
200
Variety andperforming
arts
TotalLifestyle and human
interest*
DocumentaryChildren’s and youth
Fiction
$ m
illio
ns
167
(73)
(42)
(29)
11 34
One-year (2018/19 to 2019/20)
Five-year (2014/15 to 2019/20)
%
%
Source: Estimates based on data collected from CAVCO.Note: Some totals may not sum due to rounding. Data includes an estimate of CRTC-certified television production.* Includes magazine programming and a small amount of programming that was previously allocated to the educational/instructional genre.
Profile 2020 35
3. CANADIAN TELEVISION PRODUCTION
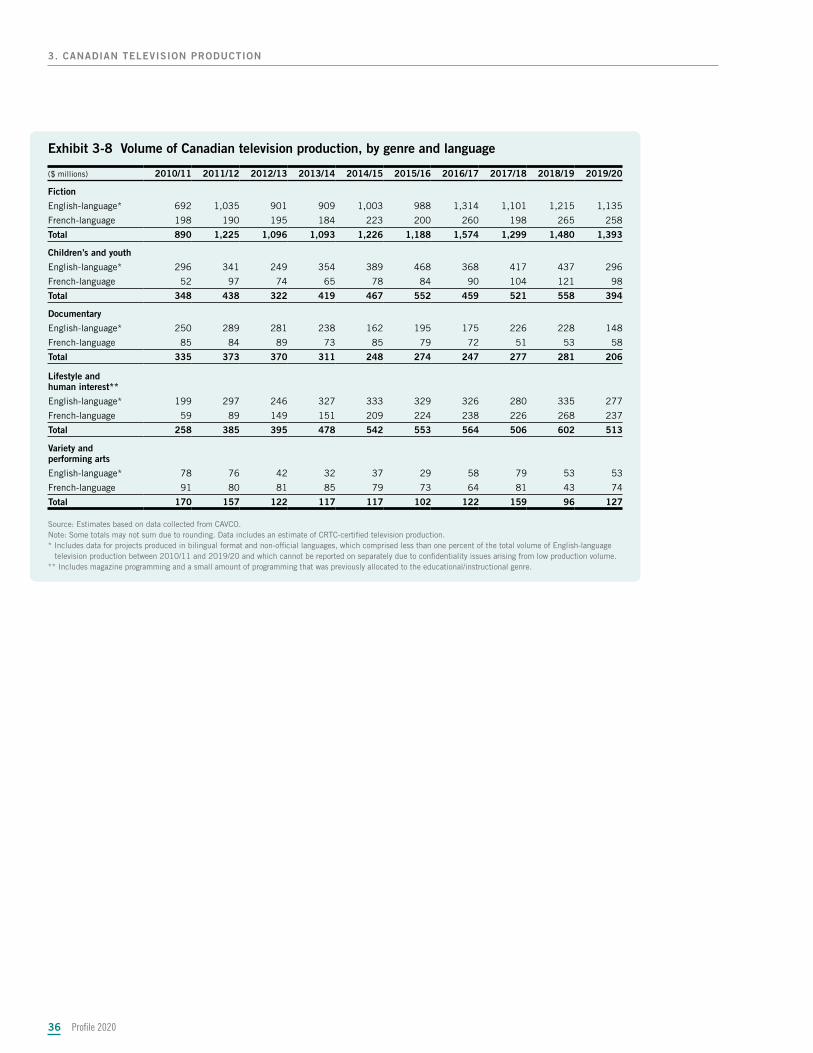
Exhibit 3-8 Volume of Canadian television production, by genre and language
($ millions) 2010/11 2011/12 2012/13 2013/14 2014/15 2015/16 2016/17 2017/18 2018/19 2019/20
Fiction
English-language* 692 1,035 901 909 1,003 988 1,314 1,101 1,215 1,135
French-language 198 190 195 184 223 200 260 198 265 258
Total 890 1,225 1,096 1,093 1,226 1,188 1,574 1,299 1,480 1,393
Children’s and youth
English-language* 296 341 249 354 389 468 368 417 437 296
French-language 52 97 74 65 78 84 90 104 121 98
Total 348 438 322 419 467 552 459 521 558 394
Documentary
English-language* 250 289 281 238 162 195 175 226 228 148
French-language 85 84 89 73 85 79 72 51 53 58
Total 335 373 370 311 248 274 247 277 281 206
Lifestyle and human interest**
English-language* 199 297 246 327 333 329 326 280 335 277
French-language 59 89 149 151 209 224 238 226 268 237
Total 258 385 395 478 542 553 564 506 602 513
Variety and performing arts
English-language* 78 76 42 32 37 29 58 79 53 53
French-language 91 80 81 85 79 73 64 81 43 74
Total 170 157 122 117 117 102 122 159 96 127
Source: Estimates based on data collected from CAVCO.Note: Some totals may not sum due to rounding. Data includes an estimate of CRTC-certified television production.* Includes data for projects produced in bilingual format and non-official languages, which comprised less than one percent of the total volume of English-language
television production between 2010/11 and 2019/20 and which cannot be reported on separately due to confidentiality issues arising from low production volume.** Includes magazine programming and a small amount of programming that was previously allocated to the educational/instructional genre.
Profile 202036
3. CANADIAN TELEVISION PRODUCTION
BUDGETS
Exhibit 3-9 Average budgets, by genre
English-language production
$000s per hour 2010/11 2011/12 2012/13 2013/14 2014/15 2015/16 2016/17 2017/18 2018/19 2019/20
FictionAverage 1,232 1,700 1,304 1,220 1,240 1,298 1,401 1,323 1,348 1,514Median 1,207 1,470 1,308 1,150 1,231 1,269 1,454 1,332 1,342 1,461
Children’s and youthAverage 863 854 711 867 855 1,073 1,190 1,015 1,206 1,505Median 500 583 512 656 764 817 528 427 520 873
DocumentaryAverage 347 367 321 312 307 333 348 347 389 382Median 286 277 292 249 253 260 319 301 300 336
Lifestyle and human interest*Average 266 308 265 322 265 273 298 261 317 313Median 288 305 277 286 223 232 240 181 246 272
Variety and performing artsAverage 529 556 386 461 363 424 580 585 519 500Median 231 360 197 267 248 258 323 408 416 258
French-language production
$000s per hour 2010/11 2011/12 2012/13 2013/14 2014/15 2015/16 2016/17 2017/18 2018/19 2019/20
FictionAverage 621 517 427 402 450 553 597 500 569 513Median 467 504 327 342 417 564 575 459 562 507
Children’s and youthAverage 233 206 313 187 220 186 187 385 398 296Median 163 150 167 143 159 142 134 144 187 208
DocumentaryAverage 228 252 212 204 222 196 202 205 194 181Median 197 211 173 179 190 168 170 173 176 158
Lifestyle and human interest*Average n.a. 113 104 119 73 93 105 102 113 114Median n.a. 83 79 63 69 84 97 92 106 111
Variety and performing artsAverage 212 220 205 229 261 226 236 273 260 239Median 161 163 148 166 201 150 133 196 230 155
Source: Estimates based on data collected from CAVCO.Note: The data does not include an estimate (as used in other exhibits) of CRTC-certified television production. n.a.: Data not available.* Includes magazine programming and a small amount of programming that was previously allocated to the educational/instructional genre.
Profile 2020 37
3. CANADIAN TELEVISION PRODUCTION
ANIMATION
Exhibit 3-10 Volume of Canadian animation television production, by language
0
50
100
150
200
250
300
350
400
31
22
23
2323 214
329
293
214
256
176
201
155
178
136
2019/202018/192017/182016/172015/162014/152013/142012/132011/122010/11
$ m
illio
ns
English-language* French-language
9
11
109
10
360
224
315
236
266
199212
165
201
145
Source: Estimates based on data collected from CAVCO.Note: Some totals may not sum due to rounding. Data includes an estimate of CRTC-certified television production.* Includes data for projects produced in bilingual format and non-official languages, which comprised less than one percent of the total volume of English-language
television production between 2010/11 and 2019/20 and which cannot be reported on separately due to confidentiality issues arising from low production volume.
CANADIAN CONTENT POINTS
To certify television programs and films as Canadian content, CAVCO and the CRTC use similar evaluation tools based on assigning points to key creative production roles. Canadian broadcasters can use these certified films and television programs to meet their Canadian television exhibition requirements. CAVCO utilizes a point scale, which assigns points to key creative production roles occupied by Canadians (in conjunction with other eligibility criteria) to determine if a film or television program is eligible to access the Canadian Film or Video Production Tax Credit (CPTC) and other funding mechanisms through Telefilm Canada and the CMF.10 To be certified as Canadian content, a film or television program (other than audiovisual treaty coproduction) must obtain a minimum of six points; the maximum number of points a film or television program can obtain is 10.11
10 For more information on the Canadian content point scale, please see CAVCO’s CPTC Application Guidelines. 11 A documentary project can receive certification even if it obtains fewer than six points; however, all the filled key creative positions must be occupied by Canadians.
Profile 202038
3. CANADIAN TELEVISION PRODUCTION
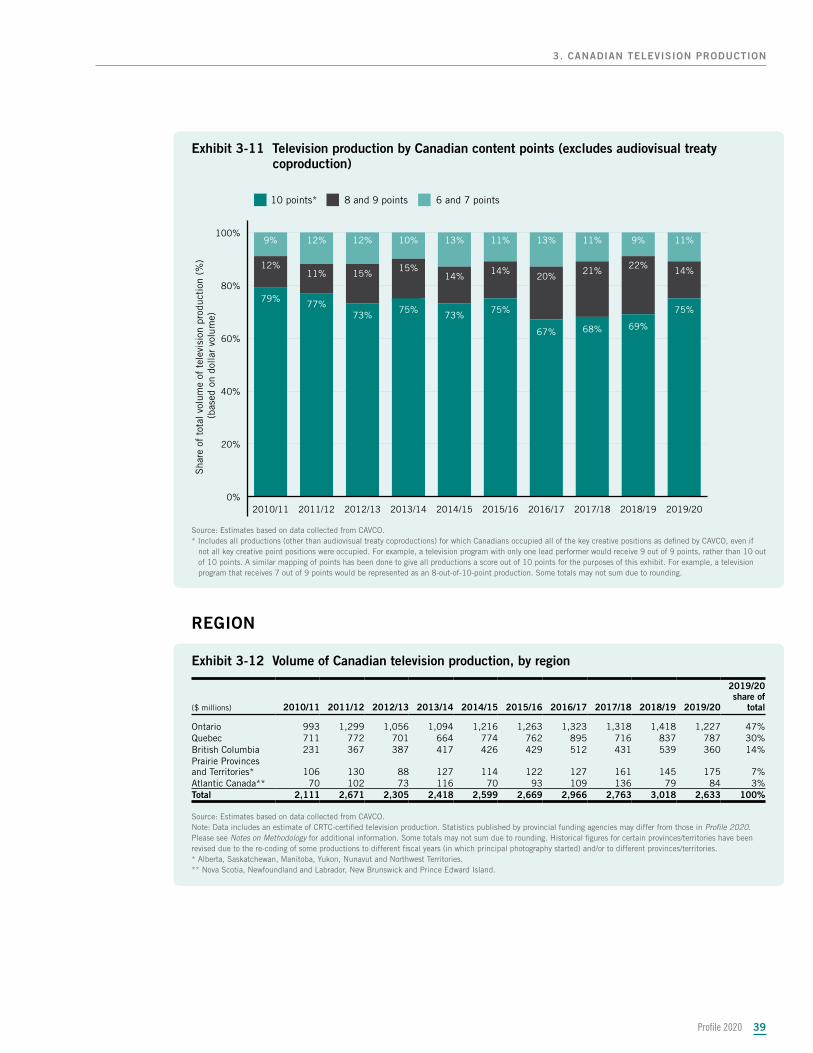
Exhibit 3-11 Television production by Canadian content points (excludes audiovisual treaty coproduction)
0%
20%
40%
60%
80%
100%11%9%11%13%11%13%10%12%12%9%
14%22%
21%20%
14%14%
15%15%11%
12%
75%
69%68%67%
75%73%
75%73%
77%79%
2019/202018/192017/182016/172015/162014/152013/142012/132011/122010/11
10 points* 8 and 9 points 6 and 7 pointsS
hare
of
tota
l vol
ume
of t
elev
isio
n pr
oduc
tion
(%
) (b
ased
on
dolla
r vo
lum
e)
Source: Estimates based on data collected from CAVCO.* Includes all productions (other than audiovisual treaty coproductions) for which Canadians occupied all of the key creative positions as defined by CAVCO, even if
not all key creative point positions were occupied. For example, a television program with only one lead performer would receive 9 out of 9 points, rather than 10 out of 10 points. A similar mapping of points has been done to give all productions a score out of 10 points for the purposes of this exhibit. For example, a television program that receives 7 out of 9 points would be represented as an 8-out-of-10-point production. Some totals may not sum due to rounding.
REGION
Exhibit 3-12 Volume of Canadian television production, by region
($ millions) 2010/11 2011/12 2012/13 2013/14 2014/15 2015/16 2016/17 2017/18 2018/19 2019/20
2019/20 share of
total
Ontario 993 1,299 1,056 1,094 1,216 1,263 1,323 1,318 1,418 1,227 47%Quebec 711 772 701 664 774 762 895 716 837 787 30%British Columbia 231 367 387 417 426 429 512 431 539 360 14%Prairie Provinces and Territories* 106 130 88 127 114 122 127 161 145 175 7%Atlantic Canada** 70 102 73 116 70 93 109 136 79 84 3%Total 2,111 2,671 2,305 2,418 2,599 2,669 2,966 2,763 3,018 2,633 100%
Source: Estimates based on data collected from CAVCO.Note: Data includes an estimate of CRTC-certified television production. Statistics published by provincial funding agencies may differ from those in Profile 2020. Please see Notes on Methodology for additional information. Some totals may not sum due to rounding. Historical figures for certain provinces/territories have been revised due to the re-coding of some productions to different fiscal years (in which principal photography started) and/or to different provinces/territories.* Alberta, Saskatchewan, Manitoba, Yukon, Nunavut and Northwest Territories.** Nova Scotia, Newfoundland and Labrador, New Brunswick and Prince Edward Island.
Profile 2020 39
3. CANADIAN TELEVISION PRODUCTION
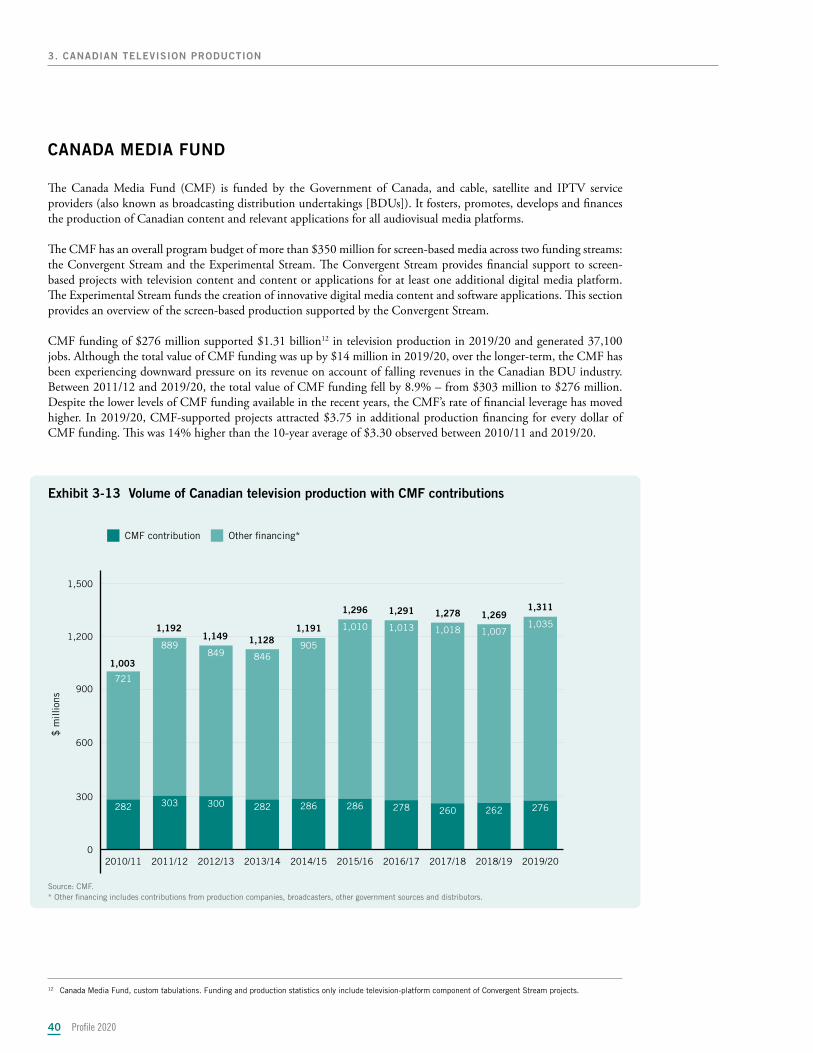
CANADA MEDIA FUND
The Canada Media Fund (CMF) is funded by the Government of Canada, and cable, satellite and IPTV service providers (also known as broadcasting distribution undertakings [BDUs]). It fosters, promotes, develops and finances the production of Canadian content and relevant applications for all audiovisual media platforms.
The CMF has an overall program budget of more than $350 million for screen-based media across two funding streams: the Convergent Stream and the Experimental Stream. The Convergent Stream provides financial support to screen-based projects with television content and content or applications for at least one additional digital media platform. The Experimental Stream funds the creation of innovative digital media content and software applications. This section provides an overview of the screen-based production supported by the Convergent Stream.
CMF funding of $276 million supported $1.31 billion12 in television production in 2019/20 and generated 37,100 jobs. Although the total value of CMF funding was up by $14 million in 2019/20, over the longer-term, the CMF has been experiencing downward pressure on its revenue on account of falling revenues in the Canadian BDU industry. Between 2011/12 and 2019/20, the total value of CMF funding fell by 8.9% – from $303 million to $276 million. Despite the lower levels of CMF funding available in the recent years, the CMF’s rate of financial leverage has moved higher. In 2019/20, CMF-supported projects attracted $3.75 in additional production financing for every dollar of CMF funding. This was 14% higher than the 10-year average of $3.30 observed between 2010/11 and 2019/20.
Exhibit 3-13 Volume of Canadian television production with CMF contributions
0
300
600
900
1,200
1,500
1,0351,0071,0181,0131,010
905846849
889
721
276262260278286286282300303282
2019/202018/192017/182016/172015/162014/152013/142012/132011/122010/11
$ m
illio
ns
CMF contribution Other �nancing*
1,3111,2691,2781,2911,296
1,1911,1281,149
1,192
1,003
Source: CMF.* Other financing includes contributions from production companies, broadcasters, other government sources and distributors.
12 Canada Media Fund, custom tabulations. Funding and production statistics only include television-platform component of Convergent Stream projects.
Profile 202040
3. CANADIAN TELEVISION PRODUCTION
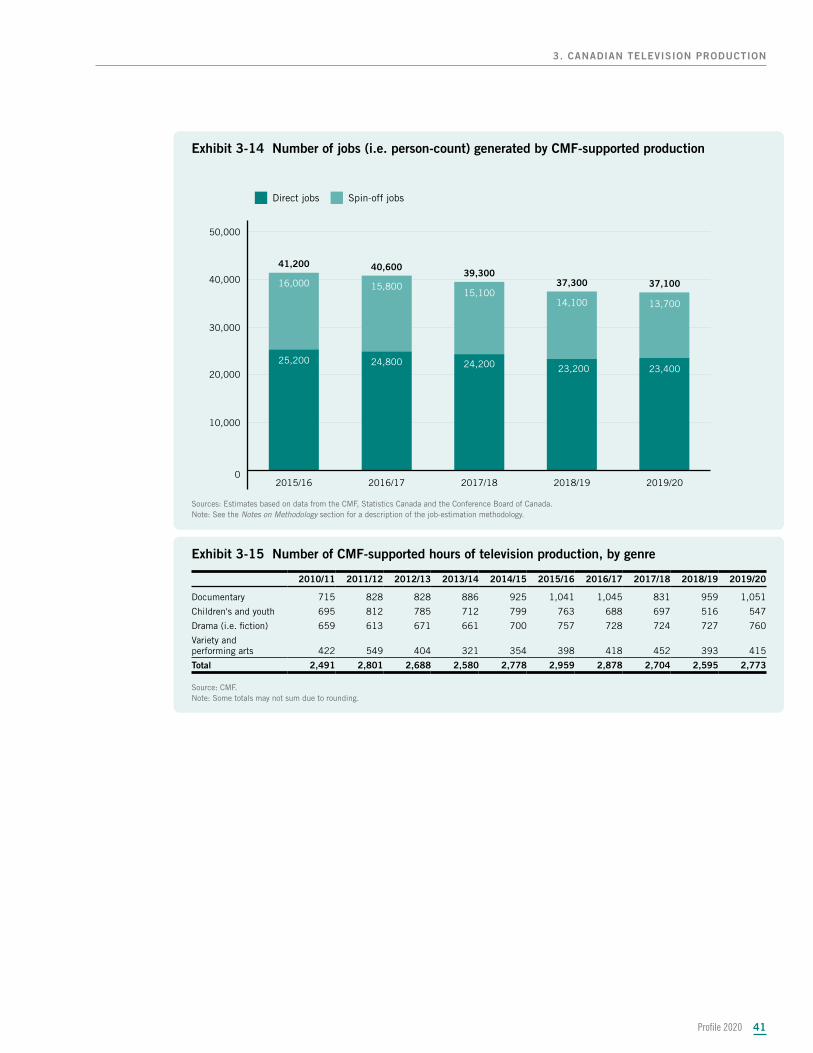
Exhibit 3-14 Number of jobs (i.e. person-count) generated by CMF-supported production
0
10,000
20,000
30,000
40,000
50,000
13,70014,10015,100
15,80016,000
23,40023,20024,20024,80025,200
2019/202018/192017/182016/172015/16
Direct jobs Spin-off jobs
37,10037,30039,300
40,60041,200
Sources: Estimates based on data from the CMF, Statistics Canada and the Conference Board of Canada.Note: See the Notes on Methodology section for a description of the job-estimation methodology.
Exhibit 3-15 Number of CMF-supported hours of television production, by genre
2010/11 2011/12 2012/13 2013/14 2014/15 2015/16 2016/17 2017/18 2018/19 2019/20
Documentary 715 828 828 886 925 1,041 1,045 831 959 1,051
Children's and youth 695 812 785 712 799 763 688 697 516 547
Drama (i.e. fiction) 659 613 671 661 700 757 728 724 727 760
Variety and performing arts 422 549 404 321 354 398 418 452 393 415
Total 2,491 2,801 2,688 2,580 2,778 2,959 2,878 2,704 2,595 2,773
Source: CMF.Note: Some totals may not sum due to rounding.
Profile 2020 41
3. CANADIAN TELEVISION PRODUCTION
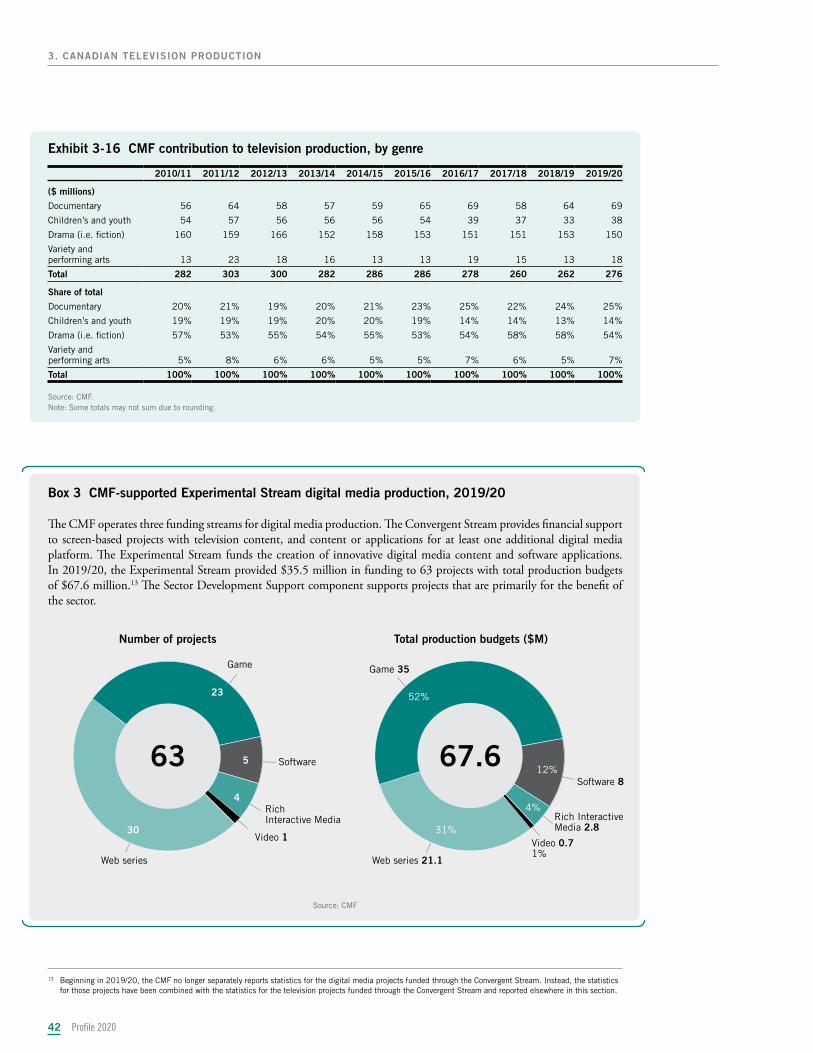
Exhibit 3-16 CMF contribution to television production, by genre
2010/11 2011/12 2012/13 2013/14 2014/15 2015/16 2016/17 2017/18 2018/19 2019/20
($ millions)
Documentary 56 64 58 57 59 65 69 58 64 69
Children’s and youth 54 57 56 56 56 54 39 37 33 38
Drama (i.e. fiction) 160 159 166 152 158 153 151 151 153 150
Variety and performing arts 13 23 18 16 13 13 19 15 13 18
Total 282 303 300 282 286 286 278 260 262 276
Share of total
Documentary 20% 21% 19% 20% 21% 23% 25% 22% 24% 25%
Children’s and youth 19% 19% 19% 20% 20% 19% 14% 14% 13% 14%
Drama (i.e. fiction) 57% 53% 55% 54% 55% 53% 54% 58% 58% 54%
Variety and performing arts 5% 8% 6% 6% 5% 5% 7% 6% 5% 7%
Total 100% 100% 100% 100% 100% 100% 100% 100% 100% 100%
Source: CMF.Note: Some totals may not sum due to rounding.
Box 3 CMF-supported Experimental Stream digital media production, 2019/20
The CMF operates three funding streams for digital media production. The Convergent Stream provides financial support to screen-based projects with television content, and content or applications for at least one additional digital media platform. The Experimental Stream funds the creation of innovative digital media content and software applications. In 2019/20, the Experimental Stream provided $35.5 million in funding to 63 projects with total production budgets of $67.6 million.13 The Sector Development Support component supports projects that are primarily for the benefit of the sector.
Number of projects Total production budgets ($M)
Software
Video 0.71%
Video 1
Software 8
Rich Interactive Media Rich Interactive
Media 2.8
Game
Web series Web series 21.1
Game 35
67.66312%
4%4
5
23
30
52%
31%
Source: CMF
13 Beginning in 2019/20, the CMF no longer separately reports statistics for the digital media projects funded through the Convergent Stream. Instead, the statistics for those projects have been combined with the statistics for the television projects funded through the Convergent Stream and reported elsewhere in this section.
Profile 202042
3. CANADIAN TELEVISION PRODUCTION
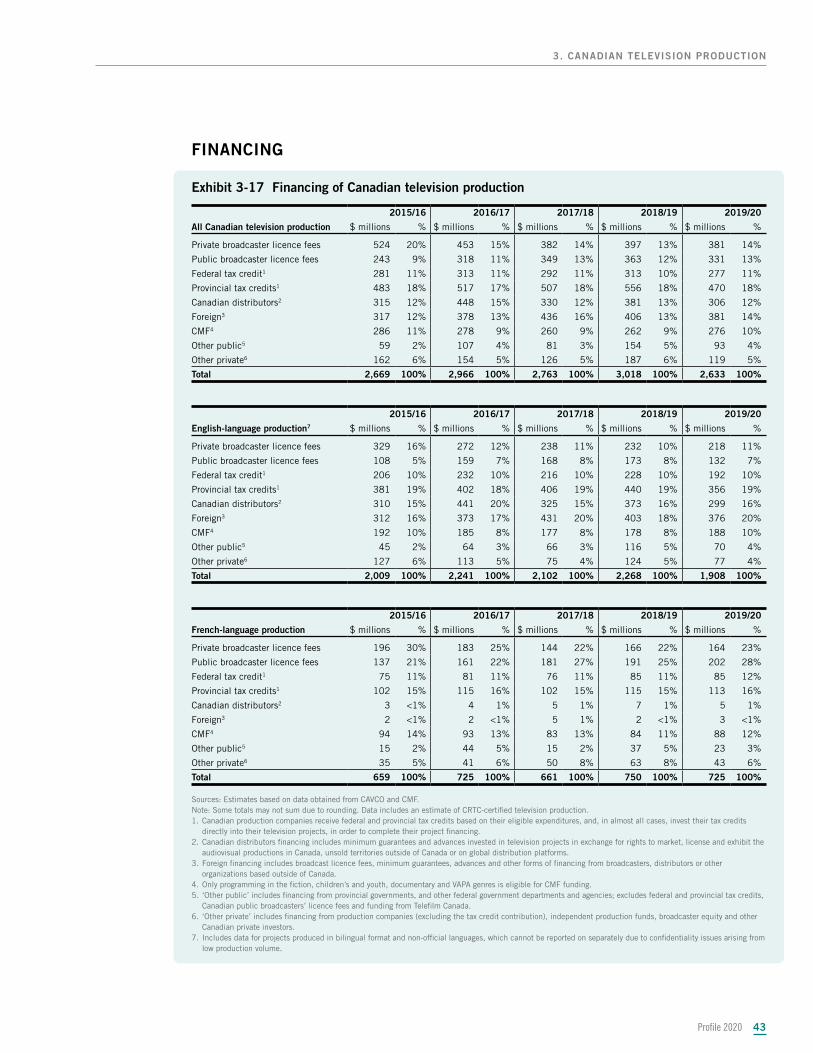
FINANCING
Exhibit 3-17 Financing of Canadian television production
2015/16 2016/17 2017/18 2018/19 2019/20
All Canadian television production $ millions % $ millions % $ millions % $ millions % $ millions %
Private broadcaster licence fees 524 20% 453 15% 382 14% 397 13% 381 14%
Public broadcaster licence fees 243 9% 318 11% 349 13% 363 12% 331 13%
Federal tax credit1 281 11% 313 11% 292 11% 313 10% 277 11%
Provincial tax credits1 483 18% 517 17% 507 18% 556 18% 470 18%
Canadian distributors2 315 12% 448 15% 330 12% 381 13% 306 12%
Foreign3 317 12% 378 13% 436 16% 406 13% 381 14%
CMF4 286 11% 278 9% 260 9% 262 9% 276 10%
Other public5 59 2% 107 4% 81 3% 154 5% 93 4%
Other private6 162 6% 154 5% 126 5% 187 6% 119 5%
Total 2,669 100% 2,966 100% 2,763 100% 3,018 100% 2,633 100%
2015/16 2016/17 2017/18 2018/19 2019/20
English-language production7 $ millions % $ millions % $ millions % $ millions % $ millions %
Private broadcaster licence fees 329 16% 272 12% 238 11% 232 10% 218 11%
Public broadcaster licence fees 108 5% 159 7% 168 8% 173 8% 132 7%
Federal tax credit1 206 10% 232 10% 216 10% 228 10% 192 10%
Provincial tax credits1 381 19% 402 18% 406 19% 440 19% 356 19%
Canadian distributors2 310 15% 441 20% 325 15% 373 16% 299 16%
Foreign3 312 16% 373 17% 431 20% 403 18% 376 20%
CMF4 192 10% 185 8% 177 8% 178 8% 188 10%
Other public5 45 2% 64 3% 66 3% 116 5% 70 4%
Other private6 127 6% 113 5% 75 4% 124 5% 77 4%
Total 2,009 100% 2,241 100% 2,102 100% 2,268 100% 1,908 100%
2015/16 2016/17 2017/18 2018/19 2019/20
French-language production $ millions % $ millions % $ millions % $ millions % $ millions %
Private broadcaster licence fees 196 30% 183 25% 144 22% 166 22% 164 23%
Public broadcaster licence fees 137 21% 161 22% 181 27% 191 25% 202 28%
Federal tax credit1 75 11% 81 11% 76 11% 85 11% 85 12%
Provincial tax credits1 102 15% 115 16% 102 15% 115 15% 113 16%
Canadian distributors2 3 <1% 4 1% 5 1% 7 1% 5 1%
Foreign3 2 <1% 2 <1% 5 1% 2 <1% 3 <1%
CMF4 94 14% 93 13% 83 13% 84 11% 88 12%
Other public5 15 2% 44 5% 15 2% 37 5% 23 3%
Other private6 35 5% 41 6% 50 8% 63 8% 43 6%
Total 659 100% 725 100% 661 100% 750 100% 725 100%
Sources: Estimates based on data obtained from CAVCO and CMF. Note: Some totals may not sum due to rounding. Data includes an estimate of CRTC-certified television production.1. Canadian production companies receive federal and provincial tax credits based on their eligible expenditures, and, in almost all cases, invest their tax credits
directly into their television projects, in order to complete their project financing.2. Canadian distributors financing includes minimum guarantees and advances invested in television projects in exchange for rights to market, license and exhibit the
audiovisual productions in Canada, unsold territories outside of Canada or on global distribution platforms.3. Foreign financing includes broadcast licence fees, minimum guarantees, advances and other forms of financing from broadcasters, distributors or other
organizations based outside of Canada.4. Only programming in the fiction, children’s and youth, documentary and VAPA genres is eligible for CMF funding.5. ‘Other public’ includes financing from provincial governments, and other federal government departments and agencies; excludes federal and provincial tax credits,
Canadian public broadcasters’ licence fees and funding from Telefilm Canada.6. ‘Other private’ includes financing from production companies (excluding the tax credit contribution), independent production funds, broadcaster equity and other
Canadian private investors.7. Includes data for projects produced in bilingual format and non-official languages, which cannot be reported on separately due to confidentiality issues arising from
low production volume.
Profile 2020 43
3. CANADIAN TELEVISION PRODUCTION
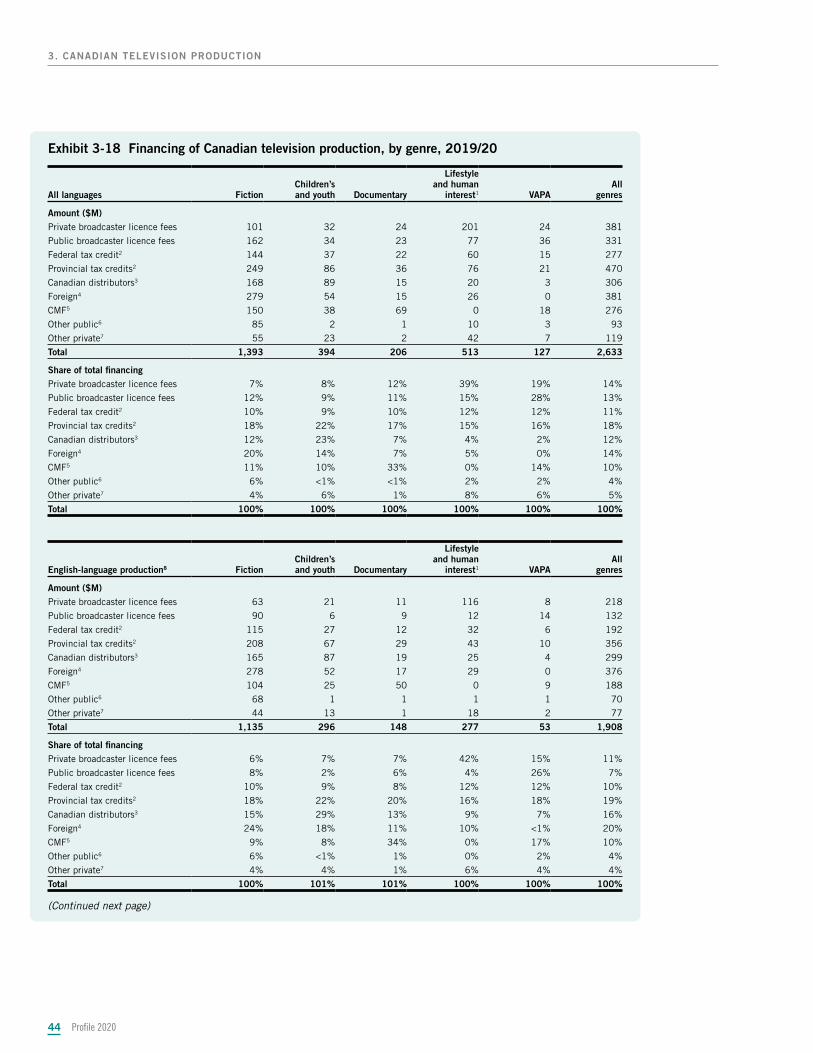
Exhibit 3-18 Financing of Canadian television production, by genre, 2019/20
All languages FictionChildren’s and youth Documentary
Lifestyleand human
interest1 VAPAAll
genres
Amount ($M)Private broadcaster licence fees 101 32 24 201 24 381
Public broadcaster licence fees 162 34 23 77 36 331
Federal tax credit2 144 37 22 60 15 277
Provincial tax credits2 249 86 36 76 21 470
Canadian distributors3 168 89 15 20 3 306
Foreign4 279 54 15 26 0 381
CMF5 150 38 69 0 18 276
Other public6 85 2 1 10 3 93
Other private7 55 23 2 42 7 119
Total 1,393 394 206 513 127 2,633
Share of total financingPrivate broadcaster licence fees 7% 8% 12% 39% 19% 14%
Public broadcaster licence fees 12% 9% 11% 15% 28% 13%
Federal tax credit2 10% 9% 10% 12% 12% 11%
Provincial tax credits2 18% 22% 17% 15% 16% 18%
Canadian distributors3 12% 23% 7% 4% 2% 12%
Foreign4 20% 14% 7% 5% 0% 14%
CMF5 11% 10% 33% 0% 14% 10%
Other public6 6% <1% <1% 2% 2% 4%
Other private7 4% 6% 1% 8% 6% 5%
Total 100% 100% 100% 100% 100% 100%
English-language production8 FictionChildren’s and youth Documentary
Lifestyleand human
interest1 VAPAAll
genres
Amount ($M)Private broadcaster licence fees 63 21 11 116 8 218
Public broadcaster licence fees 90 6 9 12 14 132
Federal tax credit2 115 27 12 32 6 192
Provincial tax credits2 208 67 29 43 10 356
Canadian distributors3 165 87 19 25 4 299
Foreign4 278 52 17 29 0 376
CMF5 104 25 50 0 9 188
Other public6 68 1 1 1 1 70
Other private7 44 13 1 18 2 77
Total 1,135 296 148 277 53 1,908
Share of total financingPrivate broadcaster licence fees 6% 7% 7% 42% 15% 11%
Public broadcaster licence fees 8% 2% 6% 4% 26% 7%
Federal tax credit2 10% 9% 8% 12% 12% 10%
Provincial tax credits2 18% 22% 20% 16% 18% 19%
Canadian distributors3 15% 29% 13% 9% 7% 16%
Foreign4 24% 18% 11% 10% <1% 20%
CMF5 9% 8% 34% 0% 17% 10%
Other public6 6% <1% 1% 0% 2% 4%
Other private7 4% 4% 1% 6% 4% 4%
Total 100% 101% 101% 100% 100% 100%
(Continued next page)
Profile 202044
3. CANADIAN TELEVISION PRODUCTION
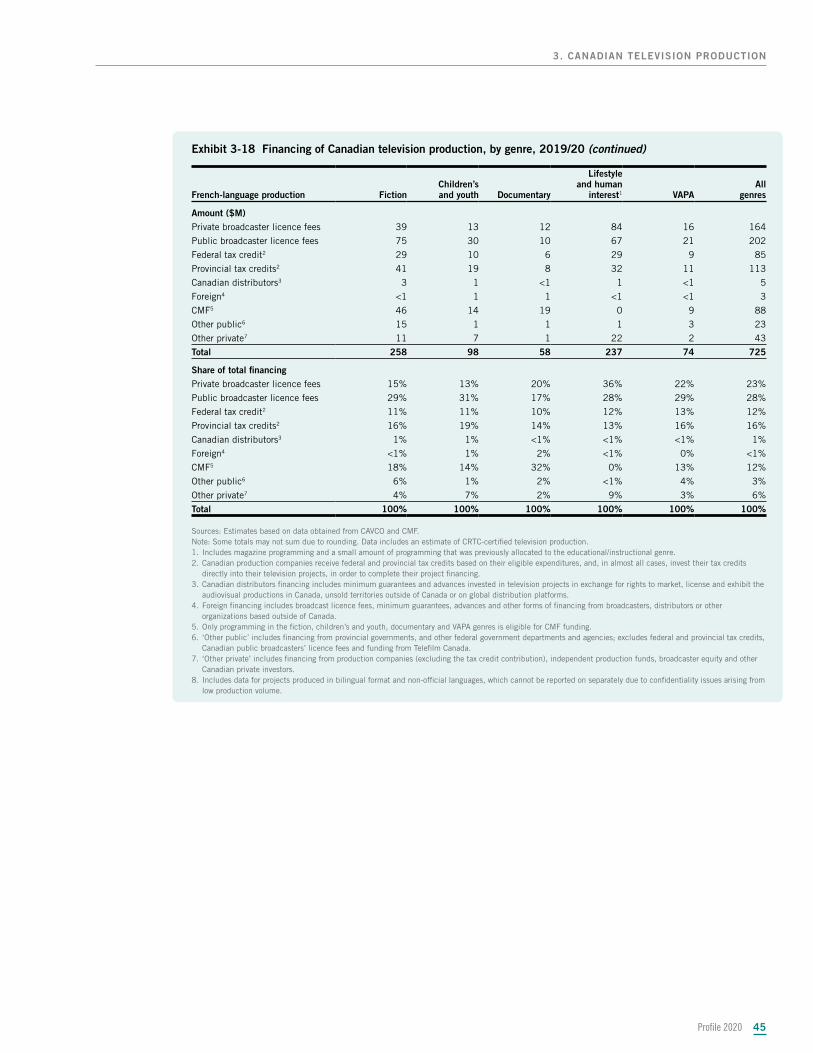
Profile 2020 45
3. CANADIAN TELEVISION PRODUCTION
Exhibit 3-18 Financing of Canadian television production, by genre, 2019/20 (continued)
French-language production FictionChildren’s and youth Documentary
Lifestyleand human
interest1 VAPAAll
genres
Amount ($M)Private broadcaster licence fees 39 13 12 84 16 164
Public broadcaster licence fees 75 30 10 67 21 202
Federal tax credit2 29 10 6 29 9 85
Provincial tax credits2 41 19 8 32 11 113
Canadian distributors3 3 1 <1 1 <1 5
Foreign4 <1 1 1 <1 <1 3
CMF5 46 14 19 0 9 88
Other public6 15 1 1 1 3 23
Other private7 11 7 1 22 2 43
Total 258 98 58 237 74 725
Share of total financingPrivate broadcaster licence fees 15% 13% 20% 36% 22% 23%
Public broadcaster licence fees 29% 31% 17% 28% 29% 28%
Federal tax credit2 11% 11% 10% 12% 13% 12%
Provincial tax credits2 16% 19% 14% 13% 16% 16%
Canadian distributors3 1% 1% <1% <1% <1% 1%
Foreign4 <1% 1% 2% <1% 0% <1%
CMF5 18% 14% 32% 0% 13% 12%
Other public6 6% 1% 2% <1% 4% 3%
Other private7 4% 7% 2% 9% 3% 6%
Total 100% 100% 100% 100% 100% 100%
Sources: Estimates based on data obtained from CAVCO and CMF. Note: Some totals may not sum due to rounding. Data includes an estimate of CRTC-certified television production.1. Includes magazine programming and a small amount of programming that was previously allocated to the educational/instructional genre.2. Canadian production companies receive federal and provincial tax credits based on their eligible expenditures, and, in almost all cases, invest their tax credits
directly into their television projects, in order to complete their project financing.3. Canadian distributors financing includes minimum guarantees and advances invested in television projects in exchange for rights to market, license and exhibit the
audiovisual productions in Canada, unsold territories outside of Canada or on global distribution platforms.4. Foreign financing includes broadcast licence fees, minimum guarantees, advances and other forms of financing from broadcasters, distributors or other
organizations based outside of Canada.5. Only programming in the fiction, children’s and youth, documentary and VAPA genres is eligible for CMF funding.6. ‘Other public’ includes financing from provincial governments, and other federal government departments and agencies; excludes federal and provincial tax credits,
Canadian public broadcasters’ licence fees and funding from Telefilm Canada.7. ‘Other private’ includes financing from production companies (excluding the tax credit contribution), independent production funds, broadcaster equity and other
Canadian private investors.8. Includes data for projects produced in bilingual format and non-official languages, which cannot be reported on separately due to confidentiality issues arising from
low production volume.
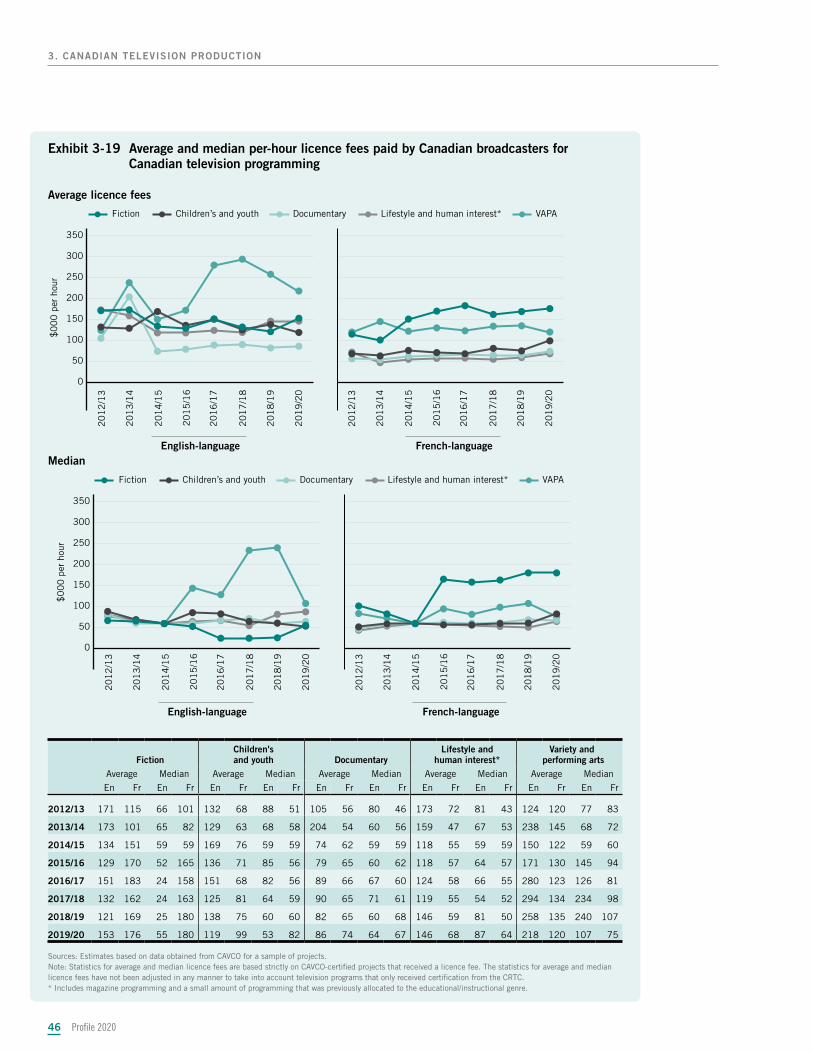
Profile 202046
3. CANADIAN TELEVISION PRODUCTION
Exhibit 3-19 Average and median per-hour licence fees paid by Canadian broadcasters for Canadian television programming
Average licence fees
$0
00
per
hou
r
0
50
100
150
200
250
300
350
Fiction
English-language
VAPADocumentary Lifestyle and human interest*Children’s and youth
French-language
20
17
/18
20
19
/20
20
18
/19
20
16
/17
20
15
/16
20
14
/15
20
13
/14
20
12
/13
20
17
/18
20
19
/20
20
18
/19
20
16
/17
20
15
/16
20
14
/15
20
13
/14
20
12
/13
Median
$0
00
per
hou
r
0
50
100
150
200
250
300
350
Fiction
English-language
VAPADocumentary Lifestyle and human interest*Children’s and youth
French-language
20
17
/18
20
19
/20
20
18
/19
20
16
/17
20
15
/16
20
14
/15
20
13
/14
20
12
/13
20
17
/18
20
19
/20
20
18
/19
20
16
/17
20
15
/16
20
14
/15
20
13
/14
20
12
/13
Fiction Children's and youth Documentary
Lifestyle and human interest*
Variety and performing arts
Average Median Average Median Average Median Average Median Average Median
En Fr En Fr En Fr En Fr En Fr En Fr En Fr En Fr En Fr En Fr
2012/13 171 115 66 101 132 68 88 51 105 56 80 46 173 72 81 43 124 120 77 83
2013/14 173 101 65 82 129 63 68 58 204 54 60 56 159 47 67 53 238 145 68 72
2014/15 134 151 59 59 169 76 59 59 74 62 59 59 118 55 59 59 150 122 59 60
2015/16 129 170 52 165 136 71 85 56 79 65 60 62 118 57 64 57 171 130 145 94
2016/17 151 183 24 158 151 68 82 56 89 66 67 60 124 58 66 55 280 123 126 81
2017/18 132 162 24 163 125 81 64 59 90 65 71 61 119 55 54 52 294 134 234 98
2018/19 121 169 25 180 138 75 60 60 82 65 60 68 146 59 81 50 258 135 240 107
2019/20 153 176 55 180 119 99 53 82 86 74 64 67 146 68 87 64 218 120 107 75
Sources: Estimates based on data obtained from CAVCO for a sample of projects.Note: Statistics for average and median licence fees are based strictly on CAVCO-certified projects that received a licence fee. The statistics for average and median licence fees have not been adjusted in any manner to take into account television programs that only received certification from the CRTC. * Includes magazine programming and a small amount of programming that was previously allocated to the educational/instructional genre.
Highlights from 2019/20Highlights from 2019/20
Profile 2020 47
4. 4. Canadian theatrical Canadian theatrical feature film productionfeature film production
• Theatrical feature film production in English15 increased by 2.3% to $221 million.
• The average budget for Canadian fiction feature films increased to $2.9 million.
• The average budget for fiction films made in English increased to $2.8 million.
• The share of theatrical feature films with a budget of more than $5 million increased to 17%.
• Foreign financing of Canadian theatrical feature film production increased from $47 million to $50 million and accounted for 17% of total financing.
15 Due to the very low number of projects produced in bilingual format and non-official languages, the data for this category was combined with the data for the English-language market for 2016/17 to 2019/20.
• Canadian theatrical feature film production decreased by 8.9% to $287 million.
• Canadian producers made 112 theatrical feature films, down from 128 in 2018/19.
• Theatrical feature film production in French decreased by 33.3% to $66 million.
• The average budget for fiction films made in French decreased to $3.1 million.
• The total volume of theatrical feature film production in the fiction genre decreased by 1.5% to $259 million.
• The number of theatrical feature films in the fiction genre decreased from 99 to 92.
The Canadian theatrical feature film segment produces feature-length films, which are intended for The Canadian theatrical feature film segment produces feature-length films, which are intended for primary release in movie theatres.primary release in movie theatres.1414 Recent examples of notable Canadian theatrical feature films include Recent examples of notable Canadian theatrical feature films include Nadia, ButterflyNadia, Butterfly; ; The NestThe Nest; ; Possessor;Possessor; and and Blood QuantumBlood Quantum..
14 For this report, the feature film category includes all films 75 minutes and over in length.
Examining the last decade (2010/11 to 2019/20), it is clear that the annual levels of Canadian theatrical feature film production were significantly lower in the latter half of the decade (2015/16 to 2019/20) than in the first half (2010/11 to 2014/15). Between 2010/11 and 2014/15, the annual volume of Canadian theatrical feature film production averaged $355 million (Exhibit 4-1). During the second half of the decade, the annual average dropped by nearly 20% to $288 million.
Despite lower volumes in recent years, the annual number of Canadian theatrical feature films produced remained practically unchanged. An average of 121 films were produced annually between 2010/11 and 2014/15, and an average of 122 films were produced annually between 2015/16 and 2019/20 (Exhibit 4-2). This suggests that the drop in theatrical feature film production was due to lower production budgets. In the first half of the decade, English-language theatrical feature films had an average budget of $3.7 million (Exhibit 4-3), which dropped by nearly one-third to $2.5 million in the latter half.
Historically, most of the annual growth or decline in Canadian theatrical feature film production has been closely linked to fluctuations in the inflow of foreign financing. Indeed, lower levels of foreign pre-sale demand for Canadian theatrical feature films were a major factor in the decline in volume between 2015/16 and 2019/20 (Exhibit 1-5). Although the global market drives year-to-year fluctuations in the volume of Canadian theatrical feature film production, Telefilm Canada and other public sources continue to play the largest role in the financing of Canadian theatrical feature film production. In 2019/20, public funding sources combined to provide 59% of the total financing for Canadian theatrical feature film production (Exhibit 4-7).
Telefilm Canada
Telefilm Canada is a Crown corporation established by the Government of Canada in 1967, with a mandate to invest in the production of Canadian films. Today, its mission is to foster and promote the development of the Canadian audiovisual industry by playing a leadership role through financial support and initiatives that contribute to the industry’s commercial, cultural and industrial success. In addition, Telefilm supports the promotion and export of Canadian content at festivals, markets and events – regionally, nationally and around the world.
Furthermore, Telefilm is responsible for making recommendations to the Minister of Canadian Heritage on whether projects can be recognized as audiovisual treaty coproductions, as well as administering the funding programs on behalf of the Canada Media Fund.
In 2019/20, Telefilm Canada provided a total of $102.2 million in financial support to Canada’s audiovisual sector.16 This included $78.3 million in support for the development of the audiovisual industry (e.g. production, development, theatrical documentary programs, and other), and $23.9 million in funding for promotional support.17
16 Telefilm Canada (2018), Building Resilience Through Partnership: 2019-2020 Annual Report, p. 12.17 Ibid.
Profile 202048
4. CANADIAN THEATRICAL FEATURE FILM PRODUCTION
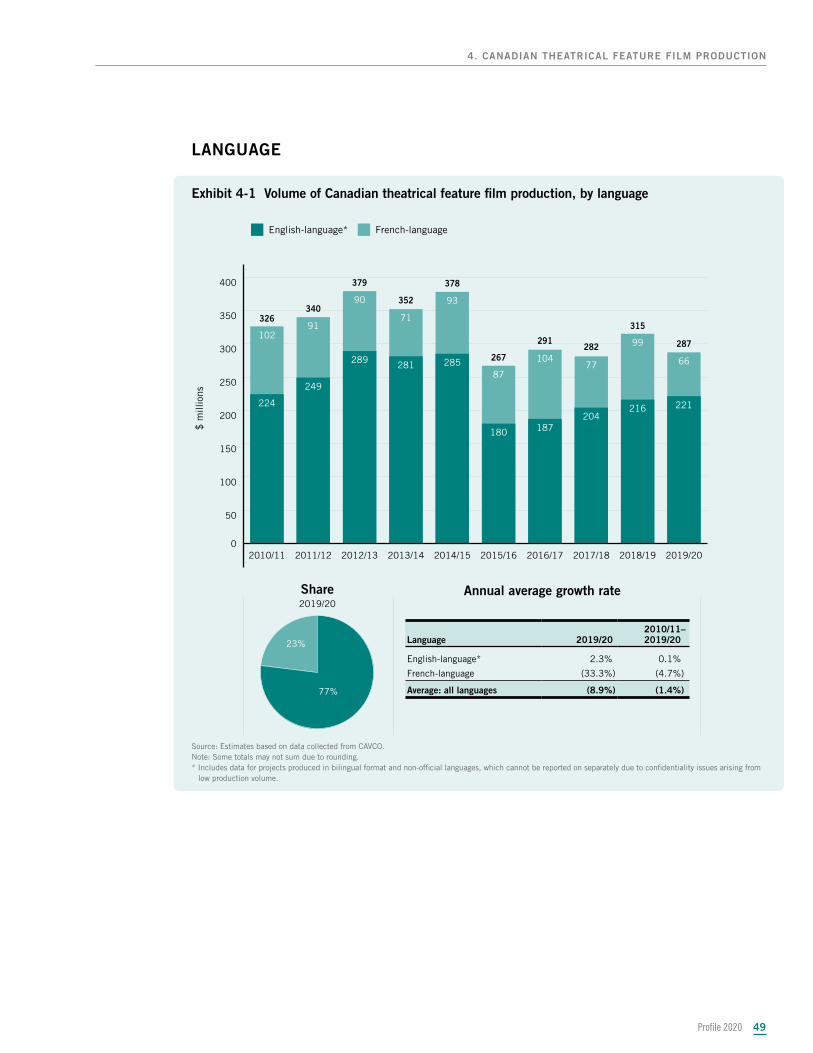
LANGUAGE
Exhibit 4-1 Volume of Canadian theatrical feature film production, by language
Annual average growth rateShare2019/20
77%
23%
0
50
100
150
200
250
300
350
400
66
99
77104
87
93
71
90
91102
221216204
187180
285281289
249
224
2019/202018/192017/182016/172015/162014/152013/142012/132011/122010/11
English-language*
$ m
illio
ns
French-language
287
315
282291
267
378
352
379
340326
Source: Estimates based on data collected from CAVCO.Note: Some totals may not sum due to rounding.* Includes data for projects produced in bilingual format and non-official languages, which cannot be reported on separately due to confidentiality issues arising from
low production volume.
Language 2019/20 2010/11– 2019/20–
English-language* 2.3% 0.1%
French-language (33.3%) (4.7%)
Average: all languages (8.9%) (1.4%)
Profile 2020 49
4. CANADIAN THEATRICAL FEATURE FILM PRODUCTION
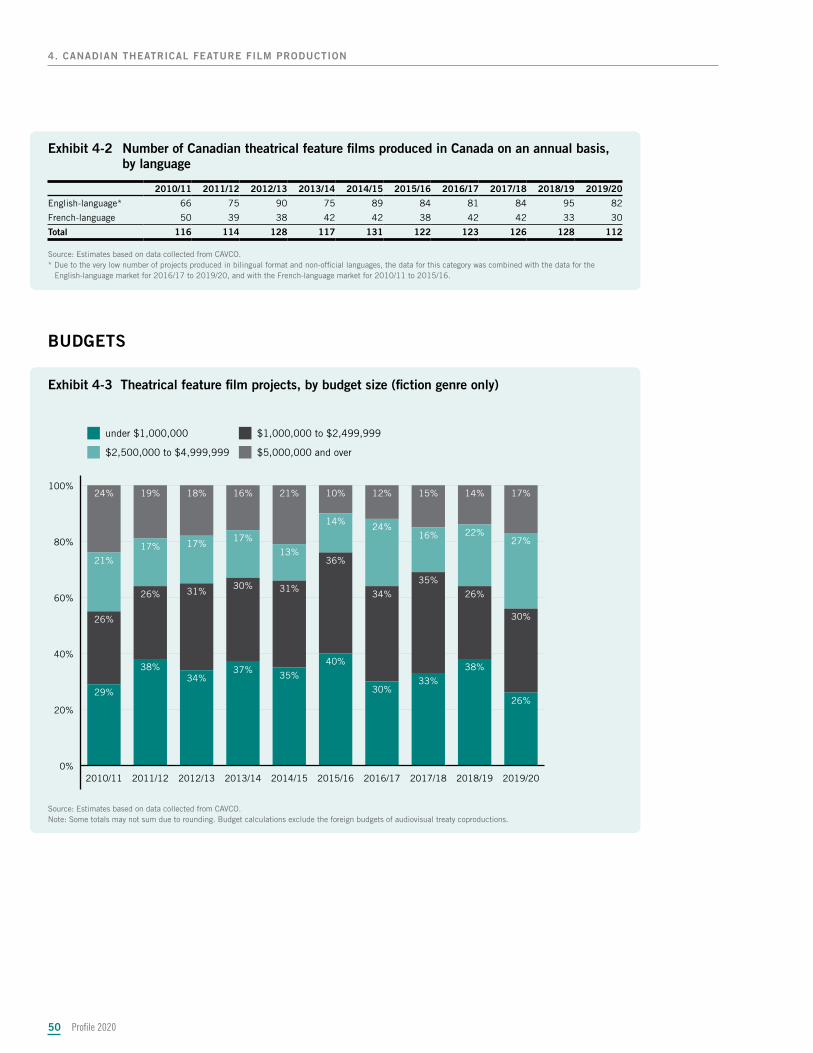
Profile 202050
4. CANADIAN THEATRICAL FEATURE FILM PRODUCTION
Exhibit 4-2 Number of Canadian theatrical feature films produced in Canada on an annual basis, by language
2010/11 2011/12 2012/13 2013/14 2014/15 2015/16 2016/17 2017/18 2018/19 2019/20
English-language* 66 75 90 75 89 84 81 84 95 82
French-language 50 39 38 42 42 38 42 42 33 30
Total 116 114 128 117 131 122 123 126 128 112
Source: Estimates based on data collected from CAVCO.* Due to the very low number of projects produced in bilingual format and non-official languages, the data for this category was combined with the data for the
English-language market for 2016/17 to 2019/20, and with the French-language market for 2010/11 to 2015/16.
BUDGETS
Exhibit 4-3 Theatrical feature film projects, by budget size (fiction genre only)
0%
20%
40%
60%
80%
100%17%14%15%12%10%21%16%18%19%24%
27%22%16%
24%14%
13%
17%17%17%
21%
30%
26%
35%
34%
36%
31%30%31%26%
26%
26%
38%
33%30%
40%
35%37%
34%38%
29%
2019/202018/192017/182016/172015/162014/152013/142012/132011/122010/11
under $1,000,000 $1,000,000 to $2,499,999
$2,500,000 to $4,999,999 $5,000,000 and over
Source: Estimates based on data collected from CAVCO.Note: Some totals may not sum due to rounding. Budget calculations exclude the foreign budgets of audiovisual treaty coproductions.
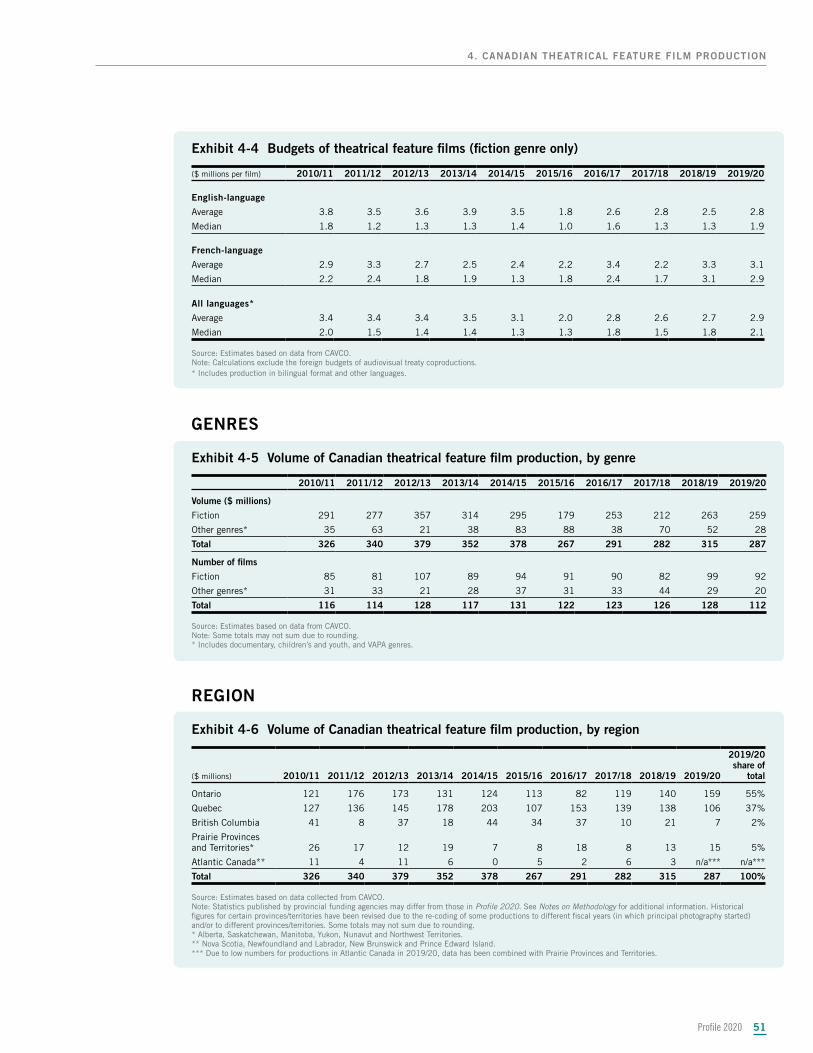
Profile 2020 51
4. CANADIAN THEATRICAL FEATURE FILM PRODUCTION
Exhibit 4-4 Budgets of theatrical feature films (fiction genre only)
($ millions per film) 2010/11 2011/12 2012/13 2013/14 2014/15 2015/16 2016/17 2017/18 2018/19 2019/20
English-language
Average 3.8 3.5 3.6 3.9 3.5 1.8 2.6 2.8 2.5 2.8
Median 1.8 1.2 1.3 1.3 1.4 1.0 1.6 1.3 1.3 1.9
French-language
Average 2.9 3.3 2.7 2.5 2.4 2.2 3.4 2.2 3.3 3.1
Median 2.2 2.4 1.8 1.9 1.3 1.8 2.4 1.7 3.1 2.9
All languages*
Average 3.4 3.4 3.4 3.5 3.1 2.0 2.8 2.6 2.7 2.9
Median 2.0 1.5 1.4 1.4 1.3 1.3 1.8 1.5 1.8 2.1
Source: Estimates based on data from CAVCO.Note: Calculations exclude the foreign budgets of audiovisual treaty coproductions.* Includes production in bilingual format and other languages.
GENRES
Exhibit 4-5 Volume of Canadian theatrical feature film production, by genre
2010/11 2011/12 2012/13 2013/14 2014/15 2015/16 2016/17 2017/18 2018/19 2019/20
Volume ($ millions)
Fiction 291 277 357 314 295 179 253 212 263 259
Other genres* 35 63 21 38 83 88 38 70 52 28
Total 326 340 379 352 378 267 291 282 315 287
Number of films
Fiction 85 81 107 89 94 91 90 82 99 92
Other genres* 31 33 21 28 37 31 33 44 29 20
Total 116 114 128 117 131 122 123 126 128 112
Source: Estimates based on data from CAVCO. Note: Some totals may not sum due to rounding.* Includes documentary, children’s and youth, and VAPA genres.
REGION
Exhibit 4-6 Volume of Canadian theatrical feature film production, by region
($ millions) 2010/11 2011/12 2012/13 2013/14 2014/15 2015/16 2016/17 2017/18 2018/19 2019/20
2019/20 share of
total
Ontario 121 176 173 131 124 113 82 119 140 159 55%
Quebec 127 136 145 178 203 107 153 139 138 106 37%
British Columbia 41 8 37 18 44 34 37 10 21 7 2%
Prairie Provinces and Territories* 26 17 12 19 7 8 18 8 13 15 5%
Atlantic Canada** 11 4 11 6 0 5 2 6 3 n/a*** n/a***
Total 326 340 379 352 378 267 291 282 315 287 100%
Source: Estimates based on data collected from CAVCO. Note: Statistics published by provincial funding agencies may differ from those in Profile 2020. See Notes on Methodology for additional information. Historical figures for certain provinces/territories have been revised due to the re-coding of some productions to different fiscal years (in which principal photography started) and/or to different provinces/territories. Some totals may not sum due to rounding.* Alberta, Saskatchewan, Manitoba, Yukon, Nunavut and Northwest Territories.** Nova Scotia, Newfoundland and Labrador, New Brunswick and Prince Edward Island.*** Due to low numbers for productions in Atlantic Canada in 2019/20, data has been combined with Prairie Provinces and Territories.
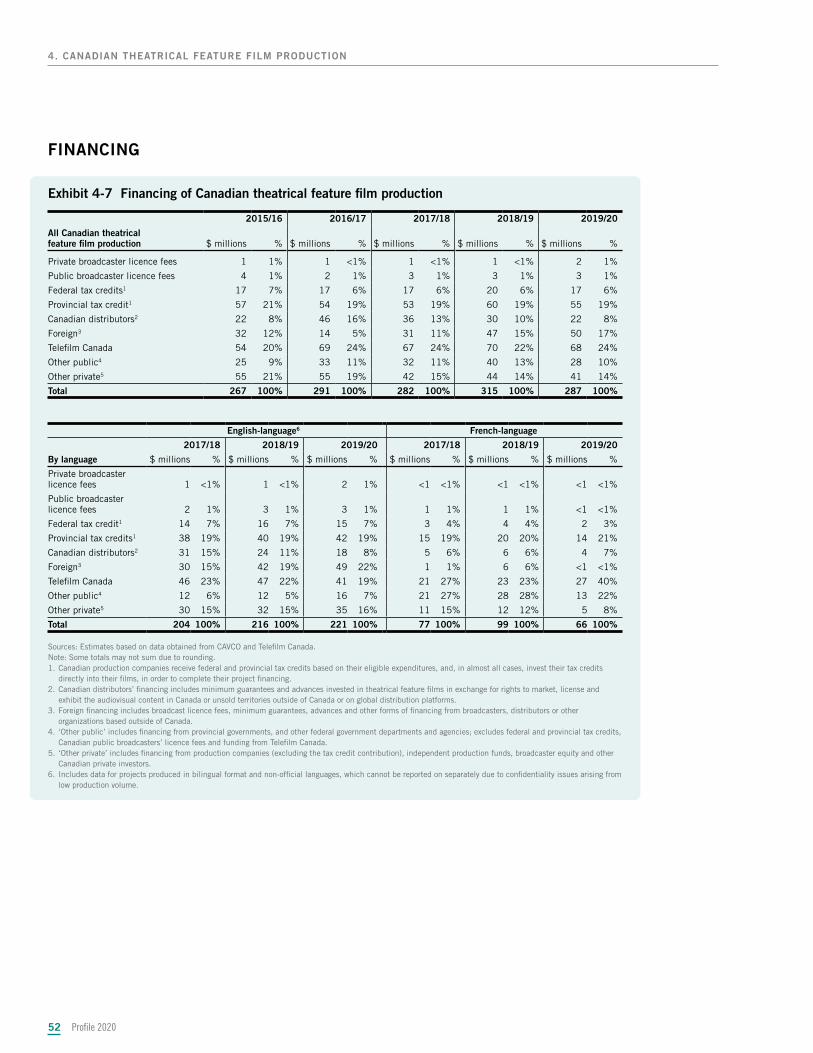
Profile 202052
4. CANADIAN THEATRICAL FEATURE FILM PRODUCTION
FINANCING
Exhibit 4-7 Financing of Canadian theatrical feature film production
2015/16 2016/17 2017/18 2018/19 2019/20
All Canadian theatrical feature film production $ millions % $ millions % $ millions % $ millions % $ millions %
Private broadcaster licence fees 1 1% 1 <1% 1 <1% 1 <1% 2 1%
Public broadcaster licence fees 4 1% 2 1% 3 1% 3 1% 3 1%
Federal tax credits1 17 7% 17 6% 17 6% 20 6% 17 6%
Provincial tax credit1 57 21% 54 19% 53 19% 60 19% 55 19%
Canadian distributors2 22 8% 46 16% 36 13% 30 10% 22 8%
Foreign3 32 12% 14 5% 31 11% 47 15% 50 17%
Telefilm Canada 54 20% 69 24% 67 24% 70 22% 68 24%
Other public4 25 9% 33 11% 32 11% 40 13% 28 10%
Other private5 55 21% 55 19% 42 15% 44 14% 41 14%
Total 267 100% 291 100% 282 100% 315 100% 287 100%
English-language6 French-language
2017/18 2018/19 2019/20 2017/18 2018/19 2019/20
By language $ millions % $ millions % $ millions % $ millions % $ millions % $ millions %
Private broadcaster licence fees 1 <1% 1 <1% 2 1% <1 <1% <1 <1% <1 <1%
Public broadcaster licence fees 2 1% 3 1% 3 1% 1 1% 1 1% <1 <1%
Federal tax credit1 14 7% 16 7% 15 7% 3 4% 4 4% 2 3%
Provincial tax credits1 38 19% 40 19% 42 19% 15 19% 20 20% 14 21%
Canadian distributors2 31 15% 24 11% 18 8% 5 6% 6 6% 4 7%
Foreign3 30 15% 42 19% 49 22% 1 1% 6 6% <1 <1%
Telefilm Canada 46 23% 47 22% 41 19% 21 27% 23 23% 27 40%
Other public4 12 6% 12 5% 16 7% 21 27% 28 28% 13 22%
Other private5 30 15% 32 15% 35 16% 11 15% 12 12% 5 8%
Total 204 100% 216 100% 221 100% 77 100% 99 100% 66 100%
Sources: Estimates based on data obtained from CAVCO and Telefilm Canada. Note: Some totals may not sum due to rounding.1. Canadian production companies receive federal and provincial tax credits based on their eligible expenditures, and, in almost all cases, invest their tax credits
directly into their films, in order to complete their project financing.2. Canadian distributors’ financing includes minimum guarantees and advances invested in theatrical feature films in exchange for rights to market, license and
exhibit the audiovisual content in Canada or unsold territories outside of Canada or on global distribution platforms.3. Foreign financing includes broadcast licence fees, minimum guarantees, advances and other forms of financing from broadcasters, distributors or other
organizations based outside of Canada.4. ‘Other public’ includes financing from provincial governments, and other federal government departments and agencies; excludes federal and provincial tax credits,
Canadian public broadcasters’ licence fees and funding from Telefilm Canada.5. ‘Other private’ includes financing from production companies (excluding the tax credit contribution), independent production funds, broadcaster equity and other
Canadian private investors.6. Includes data for projects produced in bilingual format and non-official languages, which cannot be reported on separately due to confidentiality issues arising from
low production volume.
2. 2. Canadian televisionCanadian television
Profile 2020 53
Highlights from 2019/20Highlights from 2019/20
5. 5. Audiovisual treaty Audiovisual treaty coproductioncoproductionThe Government of Canada currently has audiovisual coproduction treaties or memoranda of understanding The Government of Canada currently has audiovisual coproduction treaties or memoranda of understanding with close to 60 partners.with close to 60 partners.1818 These agreements offer Canadian and foreign producers the opportunity to combine These agreements offer Canadian and foreign producers the opportunity to combine their creative, technical and financial resources to make coproductions that can be granted national production their creative, technical and financial resources to make coproductions that can be granted national production status in each of the partnering countries.status in each of the partnering countries.
Coproductions that have obtained national production status are considered Canadian for the purposes of Coproductions that have obtained national production status are considered Canadian for the purposes of domestic incentives and broadcast quotas. This status enables foreign producers to access their own country’s domestic incentives and broadcast quotas. This status enables foreign producers to access their own country’s incentives for the foreign portion of the budget. Partnering production companies can take either a majority or incentives for the foreign portion of the budget. Partnering production companies can take either a majority or minority participation position in an audiovisual treaty coproduction, depending on the proportion of financing minority participation position in an audiovisual treaty coproduction, depending on the proportion of financing each producer brings to the project.each producer brings to the project.
Note: The statistics for audiovisual treaty coproduction in 2019/20 include two digital media projects: a web series and a short film with a digital component. These projects have been allocated to audiovisual treaty television production and audiovisual treaty feature film production, respectively.
18 A list of these agreements can be found on Telefilm Canada’s website at https://telefilm.ca/en/coproduction/international-treaties.
• Canada was a majority (or equal) partner for 52% of its treaty coproduction projects in 2019/20 – up from 46% in 2018/19.
• The median project budget for television treaty coproductions increased from $2.7 million to $5.1 million.
• The total budgets of television treaty coproductions increased by 9% to $169 million.
• France and the UK were Canada’s leading coproduction partners between 2010/11 and 2019/20. The UK was the leading television treaty coproduction partner. France was the leading partner for feature films.
• Canada participated in 46 treaty coproductions – down from 57 in 2018/19.
• The total budgets of Canada’s treaty coproductions decreased by 11.5% to $322 million.
• Canadian budgets accounted for 41% of total treaty coproduction budgets in 2019/20 compared to 52% in 2018/19.
• The total number of feature film treaty coproductions decreased from 34 to 25.
• The total budgets of Canada’s feature film treaty coproductions decreased by 26.8% to $153 million.
Profile 202054
5. AUDIOVISUAL TREATY COPRODUCTION
Over the past six years, treaty coproduction has been on somewhat of a decline (Exhibit 5-1). The last three years represent the three lowest total volume figures in this last 10-year period. Significant year-to-year fluctuations in treaty coproduction activity and volume is not uncommon due to large productions driving shifts in activity. While the annual data does not point to any single source for this recent long-term decline, two factors appear to have played a significant role.
First is the fact that 2013/14 was a standout year for Canada in terms of participation in treaty feature film production, with $337 million in volume (Exhibit 5-9) – well above the volume experienced in the prior three years (2010/11 to 2011/12). In the subsequent six years (2014/15 to 2019/20), Canada’s annual volume of treaty feature production generally hovered around $150 million.
The second factor is the significant drop-off in the volume of television treaty coproduction in the last two fiscal years. After averaging $277 million annually between 2010/11 and 2017/18, the volume of television treaty coproduction dropped to $155 million in 2018/19, and $169 million in 2019/20 (Exhibit 5-6).
This small recovery in television treaty coproduction in 2019/20 was almost entirely due to higher levels in English-language segment – which actually accounted for approximately 90% of Canada’s total television on treaty coproduction volume in recent years (Exhibit 5-6). English-language television treaty coproduction increased by approximately $17 million from 2018/19 to 2019/20. The increase was also clearly driven by higher levels of coproduction in the drama genre. The number of drama television projects increased from 2 to 6 in 2019/20 (Exhibit 5-7). This tripling of project activity was accompanied by a near-doubling of volume – as the total volume of drama coproduction increased from $56 million in 2018/19 to $96 million in 2019/20. Despite this increase in drama production in the television treaty coproduction segment in 2019/20, the annual volume ($96 million) was still well below the levels reached between 2010/11 and 2017/18. During that 8-year period, the volume of drama coproduction in the television segment averaged $265 million per annum. Indeed, it was this drop off in television drama production in 2018/19 that appears to have pulled down Canada’s entire television treaty coproduction activity in the past two fiscal years.
This partial recovery in drama coproduction in 2019/20 was offset by a steep decline in documentary coproduction within the television treaty coproduction segment. In 2019/20, the number of documentary projects halved – from 16 to 8 – thereby resulting in a 10-year low (Exhibit 5-7). The volume of documentary production fell by 65.3% – from $49 million to $17 million – also a 10-year low.
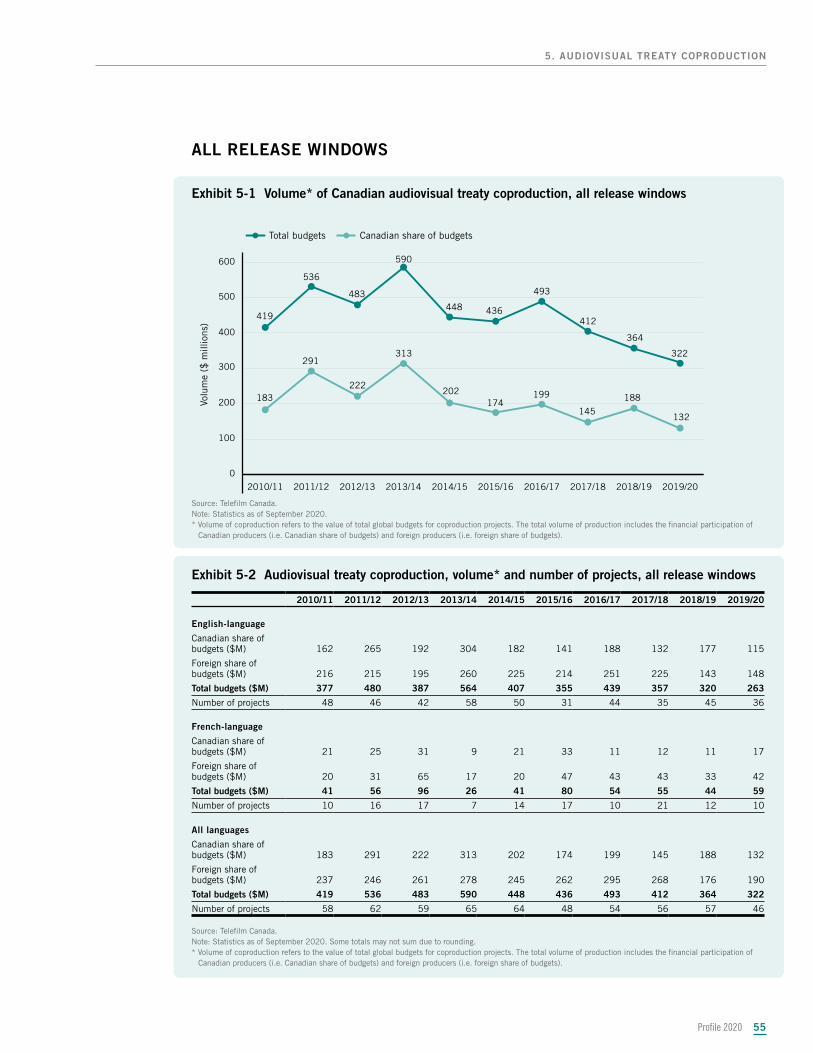
Profile 2020 55
5. AUDIOVISUAL TREATY COPRODUCTION
ALL RELEASE WINDOWS
Exhibit 5-1 Volume* of Canadian audiovisual treaty coproduction, all release windows
0
100
200
300
400
500
600
2019/202018/192017/182016/172015/162014/152013/142012/132011/122010/11
Total budgets Canadian share of budgets
Volu
me
($ m
illio
ns)
419
536
483
590
448 436
493
412
364
322
183
291
222
313
202174
199
145
188
132
Source: Telefilm Canada.Note: Statistics as of September 2020.* Volume of coproduction refers to the value of total global budgets for coproduction projects. The total volume of production includes the financial participation of
Canadian producers (i.e. Canadian share of budgets) and foreign producers (i.e. foreign share of budgets).
Exhibit 5-2 Audiovisual treaty coproduction, volume* and number of projects, all release windows
2010/11 2011/12 2012/13 2013/14 2014/15 2015/16 2016/17 2017/18 2018/19 2019/20
English-language
Canadian share of budgets ($M) 162 265 192 304 182 141 188 132 177 115
Foreign share of budgets ($M) 216 215 195 260 225 214 251 225 143 148
Total budgets ($M) 377 480 387 564 407 355 439 357 320 263
Number of projects 48 46 42 58 50 31 44 35 45 36
French-language
Canadian share of budgets ($M) 21 25 31 9 21 33 11 12 11 17
Foreign share of budgets ($M) 20 31 65 17 20 47 43 43 33 42
Total budgets ($M) 41 56 96 26 41 80 54 55 44 59
Number of projects 10 16 17 7 14 17 10 21 12 10
All languages
Canadian share of budgets ($M) 183 291 222 313 202 174 199 145 188 132
Foreign share of budgets ($M) 237 246 261 278 245 262 295 268 176 190
Total budgets ($M) 419 536 483 590 448 436 493 412 364 322
Number of projects 58 62 59 65 64 48 54 56 57 46
Source: Telefilm Canada.Note: Statistics as of September 2020. Some totals may not sum due to rounding.* Volume of coproduction refers to the value of total global budgets for coproduction projects. The total volume of production includes the financial participation of
Canadian producers (i.e. Canadian share of budgets) and foreign producers (i.e. foreign share of budgets).
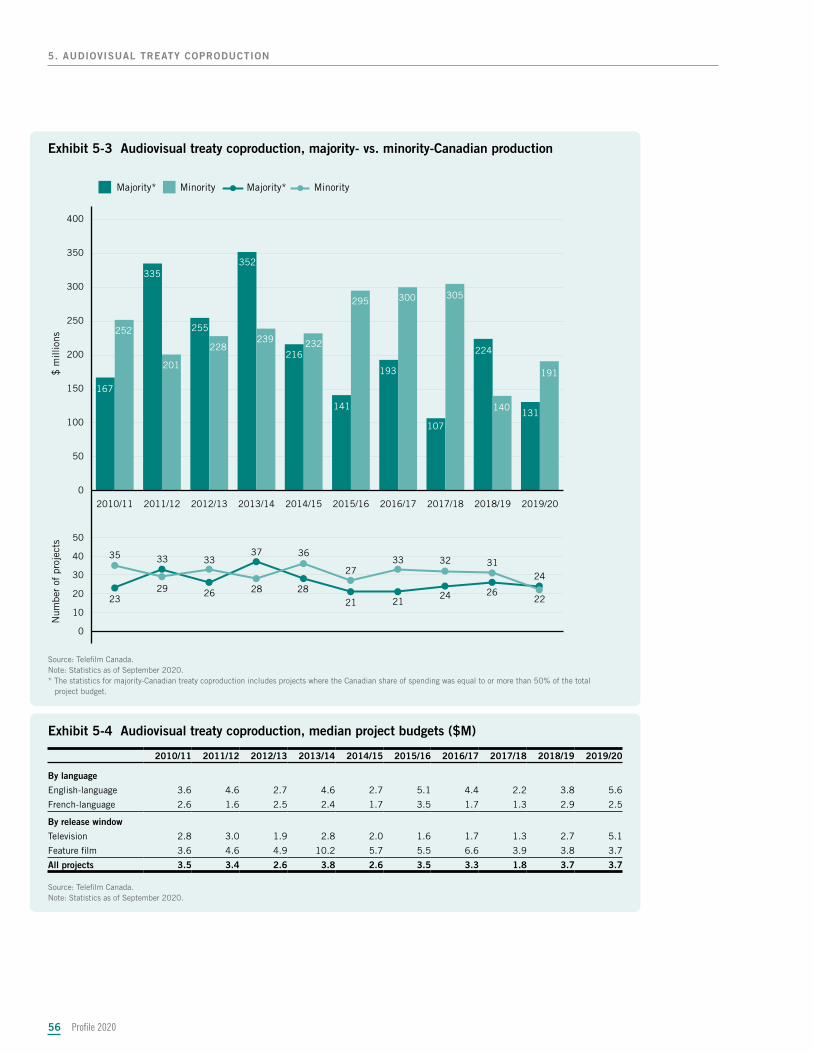
Profile 202056
5. AUDIOVISUAL TREATY COPRODUCTION
Exhibit 5-3 Audiovisual treaty coproduction, majority- vs. minority-Canadian production
Majority* Minority Majority*
0
50
100
150
200
250
300
350
400
2019/202018/192017/182016/172015/162014/152013/142012/132011/122010/11
$ m
illio
nsN
umbe
r of
pro
ject
s
0
10
20
30
40
50
Minority
35
23
31
26
24
22
140131
191
224216
107
193
141
352335
255
167
305300295
232239228
201
252
24
32
21
3327
21
3637
28 28
33
2629
33
Source: Telefilm Canada.Note: Statistics as of September 2020. * The statistics for majority-Canadian treaty coproduction includes projects where the Canadian share of spending was equal to or more than 50% of the total
project budget.
Exhibit 5-4 Audiovisual treaty coproduction, median project budgets ($M)
2010/11 2011/12 2012/13 2013/14 2014/15 2015/16 2016/17 2017/18 2018/19 2019/20
By language
English-language 3.6 4.6 2.7 4.6 2.7 5.1 4.4 2.2 3.8 5.6
French-language 2.6 1.6 2.5 2.4 1.7 3.5 1.7 1.3 2.9 2.5
By release window
Television 2.8 3.0 1.9 2.8 2.0 1.6 1.7 1.3 2.7 5.1
Feature film 3.6 4.6 4.9 10.2 5.7 5.5 6.6 3.9 3.8 3.7
All projects 3.5 3.4 2.6 3.8 2.6 3.5 3.3 1.8 3.7 3.7
Source: Telefilm Canada.Note: Statistics as of September 2020.
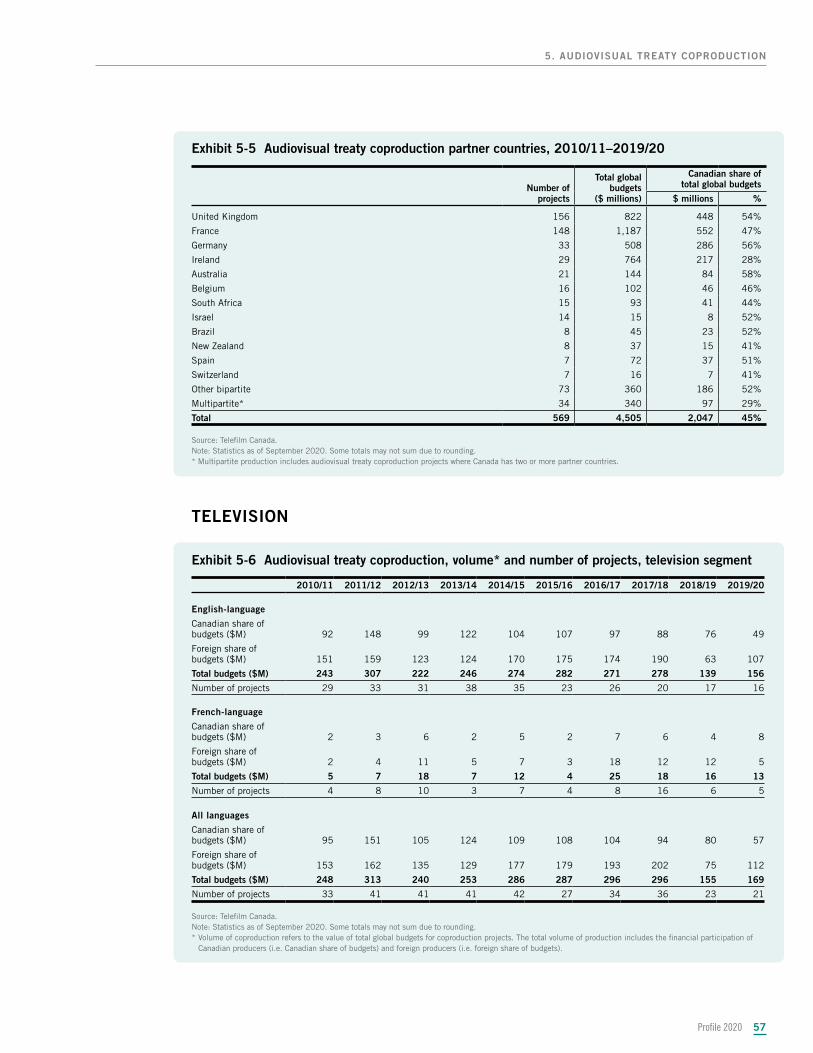
Profile 2020 57
5. AUDIOVISUAL TREATY COPRODUCTION
Exhibit 5-5 Audiovisual treaty coproduction partner countries, 2010/11–2019/20
Number of projects
Total global budgets
($ millions)
Canadian share of total global budgets
$ millions %
United Kingdom 156 822 448 54%
France 148 1,187 552 47%
Germany 33 508 286 56%
Ireland 29 764 217 28%
Australia 21 144 84 58%
Belgium 16 102 46 46%
South Africa 15 93 41 44%
Israel 14 15 8 52%
Brazil 8 45 23 52%
New Zealand 8 37 15 41%
Spain 7 72 37 51%
Switzerland 7 16 7 41%
Other bipartite 73 360 186 52%
Multipartite* 34 340 97 29%
Total 569 4,505 2,047 45%
Source: Telefilm Canada.Note: Statistics as of September 2020. Some totals may not sum due to rounding.* Multipartite production includes audiovisual treaty coproduction projects where Canada has two or more partner countries.
TELEVISION
Exhibit 5-6 Audiovisual treaty coproduction, volume* and number of projects, television segment
2010/11 2011/12 2012/13 2013/14 2014/15 2015/16 2016/17 2017/18 2018/19 2019/20
English-language
Canadian share of budgets ($M) 92 148 99 122 104 107 97 88 76 49
Foreign share of budgets ($M) 151 159 123 124 170 175 174 190 63 107
Total budgets ($M) 243 307 222 246 274 282 271 278 139 156
Number of projects 29 33 31 38 35 23 26 20 17 16
French-language
Canadian share of budgets ($M) 2 3 6 2 5 2 7 6 4 8
Foreign share of budgets ($M) 2 4 11 5 7 3 18 12 12 5
Total budgets ($M) 5 7 18 7 12 4 25 18 16 13
Number of projects 4 8 10 3 7 4 8 16 6 5
All languages
Canadian share of budgets ($M) 95 151 105 124 109 108 104 94 80 57
Foreign share of budgets ($M) 153 162 135 129 177 179 193 202 75 112
Total budgets ($M) 248 313 240 253 286 287 296 296 155 169
Number of projects 33 41 41 41 42 27 34 36 23 21
Source: Telefilm Canada.Note: Statistics as of September 2020. Some totals may not sum due to rounding.* Volume of coproduction refers to the value of total global budgets for coproduction projects. The total volume of production includes the financial participation of
Canadian producers (i.e. Canadian share of budgets) and foreign producers (i.e. foreign share of budgets).
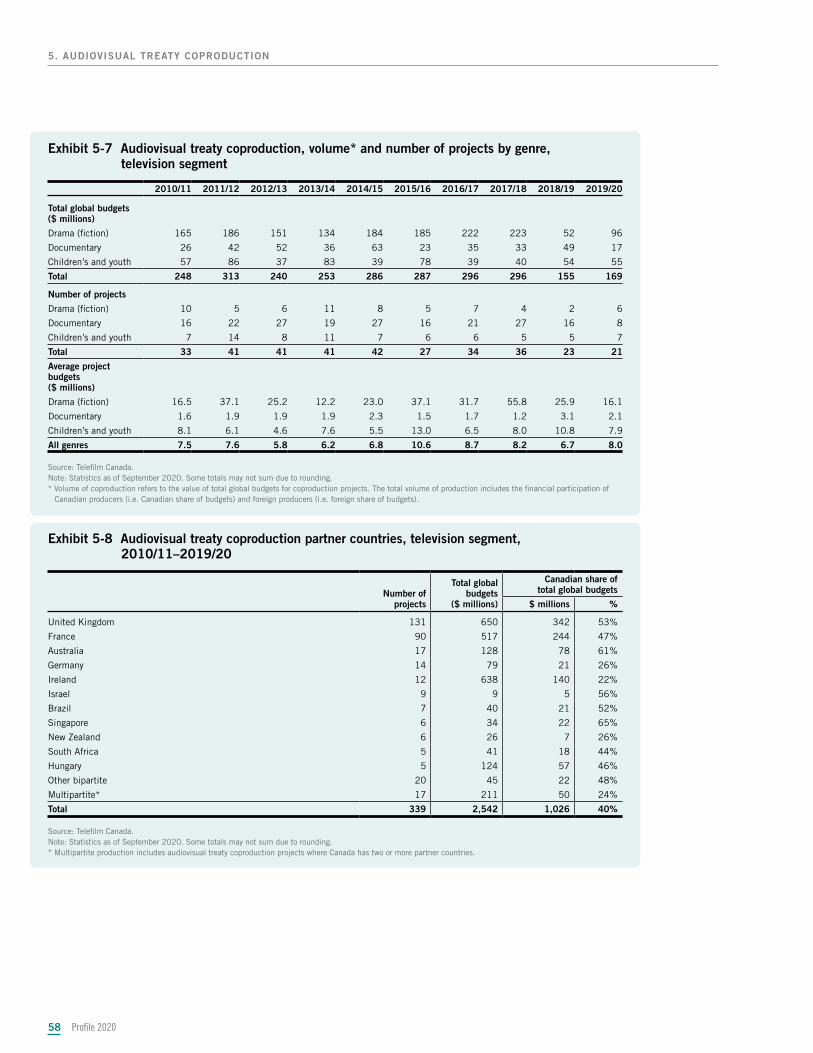
Profile 202058
5. AUDIOVISUAL TREATY COPRODUCTION
Exhibit 5-7 Audiovisual treaty coproduction, volume* and number of projects by genre, television segment
2010/11 2011/12 2012/13 2013/14 2014/15 2015/16 2016/17 2017/18 2018/19 2019/20
Total global budgets($ millions)
Drama (fiction) 165 186 151 134 184 185 222 223 52 96
Documentary 26 42 52 36 63 23 35 33 49 17
Children’s and youth 57 86 37 83 39 78 39 40 54 55
Total 248 313 240 253 286 287 296 296 155 169
Number of projects
Drama (fiction) 10 5 6 11 8 5 7 4 2 6
Documentary 16 22 27 19 27 16 21 27 16 8
Children’s and youth 7 14 8 11 7 6 6 5 5 7
Total 33 41 41 41 42 27 34 36 23 21
Average project budgets ($ millions)
Drama (fiction) 16.5 37.1 25.2 12.2 23.0 37.1 31.7 55.8 25.9 16.1
Documentary 1.6 1.9 1.9 1.9 2.3 1.5 1.7 1.2 3.1 2.1
Children’s and youth 8.1 6.1 4.6 7.6 5.5 13.0 6.5 8.0 10.8 7.9
All genres 7.5 7.6 5.8 6.2 6.8 10.6 8.7 8.2 6.7 8.0
Source: Telefilm Canada.Note: Statistics as of September 2020. Some totals may not sum due to rounding.* Volume of coproduction refers to the value of total global budgets for coproduction projects. The total volume of production includes the financial participation of
Canadian producers (i.e. Canadian share of budgets) and foreign producers (i.e. foreign share of budgets).
Exhibit 5-8 Audiovisual treaty coproduction partner countries, television segment, 2010/11–2019/20
Number of projects
Total global budgets
($ millions)
Canadian share of total global budgets
$ millions %
United Kingdom 131 650 342 53%
France 90 517 244 47%
Australia 17 128 78 61%
Germany 14 79 21 26%
Ireland 12 638 140 22%
Israel 9 9 5 56%
Brazil 7 40 21 52%
Singapore 6 34 22 65%
New Zealand 6 26 7 26%
South Africa 5 41 18 44%
Hungary 5 124 57 46%
Other bipartite 20 45 22 48%
Multipartite* 17 211 50 24%
Total 339 2,542 1,026 40%
Source: Telefilm Canada.Note: Statistics as of September 2020. Some totals may not sum due to rounding.* Multipartite production includes audiovisual treaty coproduction projects where Canada has two or more partner countries.
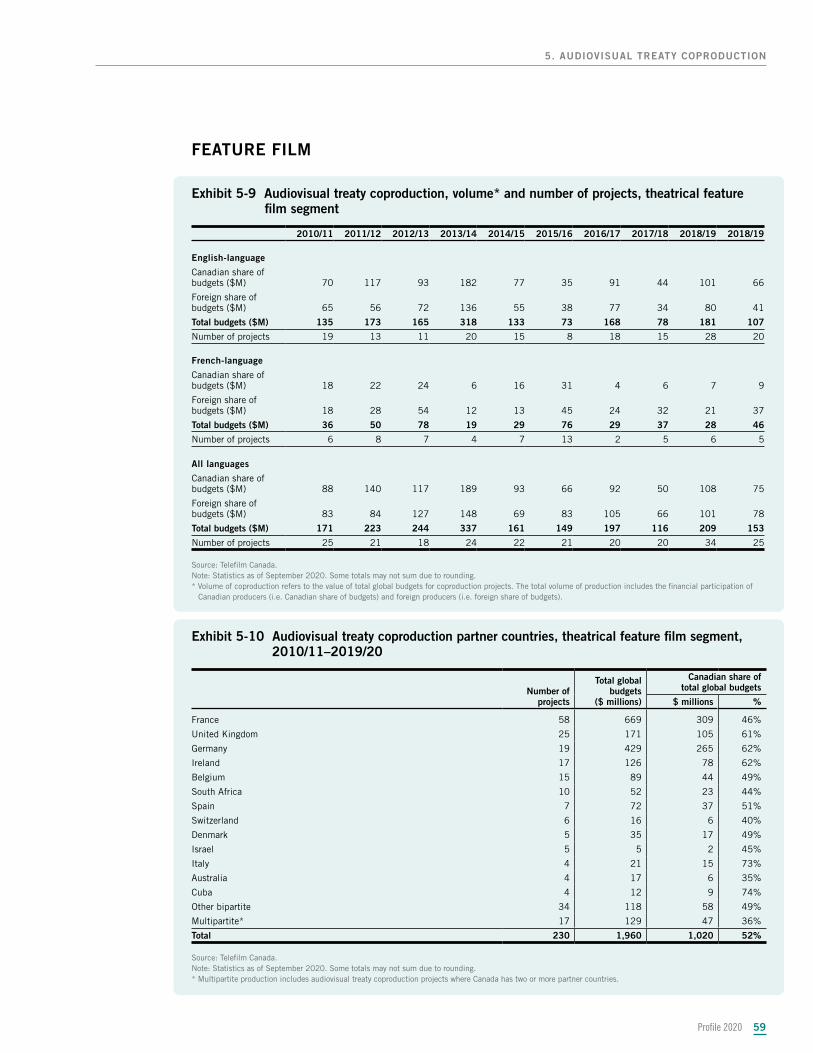
Profile 2020 59
5. AUDIOVISUAL TREATY COPRODUCTION
FEATURE FILM
Exhibit 5-9 Audiovisual treaty coproduction, volume* and number of projects, theatrical feature film segment
2010/11 2011/12 2012/13 2013/14 2014/15 2015/16 2016/17 2017/18 2018/19 2018/19
English-language
Canadian share of budgets ($M) 70 117 93 182 77 35 91 44 101 66
Foreign share of budgets ($M) 65 56 72 136 55 38 77 34 80 41
Total budgets ($M) 135 173 165 318 133 73 168 78 181 107
Number of projects 19 13 11 20 15 8 18 15 28 20
French-language
Canadian share of budgets ($M) 18 22 24 6 16 31 4 6 7 9
Foreign share of budgets ($M) 18 28 54 12 13 45 24 32 21 37
Total budgets ($M) 36 50 78 19 29 76 29 37 28 46
Number of projects 6 8 7 4 7 13 2 5 6 5
All languages
Canadian share of budgets ($M) 88 140 117 189 93 66 92 50 108 75
Foreign share of budgets ($M) 83 84 127 148 69 83 105 66 101 78
Total budgets ($M) 171 223 244 337 161 149 197 116 209 153
Number of projects 25 21 18 24 22 21 20 20 34 25
Source: Telefilm Canada.Note: Statistics as of September 2020. Some totals may not sum due to rounding.* Volume of coproduction refers to the value of total global budgets for coproduction projects. The total volume of production includes the financial participation of
Canadian producers (i.e. Canadian share of budgets) and foreign producers (i.e. foreign share of budgets).
Exhibit 5-10 Audiovisual treaty coproduction partner countries, theatrical feature film segment, 2010/11–2019/20
Number of projects
Total global budgets
($ millions)
Canadian share of total global budgets
$ millions %
France 58 669 309 46%
United Kingdom 25 171 105 61%
Germany 19 429 265 62%
Ireland 17 126 78 62%
Belgium 15 89 44 49%
South Africa 10 52 23 44%
Spain 7 72 37 51%
Switzerland 6 16 6 40%
Denmark 5 35 17 49%
Israel 5 5 2 45%
Italy 4 21 15 73%
Australia 4 17 6 35%
Cuba 4 12 9 74%
Other bipartite 34 118 58 49%
Multipartite* 17 129 47 36%
Total 230 1,960 1,020 52%
Source: Telefilm Canada.Note: Statistics as of September 2020. Some totals may not sum due to rounding.* Multipartite production includes audiovisual treaty coproduction projects where Canada has two or more partner countries.
Profile 20206060
Highlights from 2019/20Highlights from 2019/20
6. 6. Foreign location and Foreign location and service productionservice productionThe foreign location and service (FLS) production segment is primarily comprised of films and television The foreign location and service (FLS) production segment is primarily comprised of films and television programs filmed in Canada mainly by foreign producers with the involvement of Canadian-based service programs filmed in Canada mainly by foreign producers with the involvement of Canadian-based service producers. This includes the visual effects (VFX) work done by Canadian VFX studios for foreign films and producers. This includes the visual effects (VFX) work done by Canadian VFX studios for foreign films and television programs. For the majority of FLS projects, the copyright is held by non-Canadian producers; television programs. For the majority of FLS projects, the copyright is held by non-Canadian producers; however, for approximately 5% to 10% of projects, the copyright is held by Canadians.however, for approximately 5% to 10% of projects, the copyright is held by Canadians.
In recent years, Canada’s FLS production segment has contributed to numerous films that achieved In recent years, Canada’s FLS production segment has contributed to numerous films that achieved successful global box office runs. Some recent Hollywood films that have either been shot in Canada or successful global box office runs. Some recent Hollywood films that have either been shot in Canada or had their VFX work done in Canada include had their VFX work done in Canada include Operation Christmas DropOperation Christmas Drop, , Gretel & HanselGretel & Hansel, , To All the Boys To All the Boys I’ve Loved Before 3I’ve Loved Before 3 and and There’s Someone Inside Your HouseThere’s Someone Inside Your House. .
Canada has also become a destination for the filming of many American television series and mini-series, Canada has also become a destination for the filming of many American television series and mini-series, such as such as The Queen’s GambitThe Queen’s Gambit, , The Umbrella AcademyThe Umbrella Academy, , ArrowArrow, , TitansTitans,, Riverdale Riverdale,, See See,, The Handmaid’s Tale The Handmaid’s Tale,, The BoysThe Boys and and Star Trek: DiscoveryStar Trek: Discovery, which have been commissioned by US networks as well as online video , which have been commissioned by US networks as well as online video streaming services.streaming services.
• The total volume of FLS production in Canada increased by 8% to an all-time high of $5.25 billion.
• The number of FLS productions increased from 465 to an all-time high of 521.
• The total volume of FLS television series production increased by 11.7% to an all-time high of $3.06 billion.
• The number of FLS television series shot in Canada increased from 208 to an all-time high of 224.
• The number of FLS feature films shot in Canada increased slightly from 164 to 166.
• The total volume of FLS feature film production decreased by 6.9% to $1.68 billion.
Profile 2020 61
6. FOREIGN LOCATION AND SERVICE PRODUCTION
Content production by existing international subscription video on demand (SVOD) platforms such as Netflix, Amazon Prime Video, Disney+, AppleTV+, HBO Max, and Hulu helped lift FLS production in Canada to an all-time high in 2019/20. Overall, the volume of FLS production in Canada increased to a new record of $5.25 billion (Exhibit 6-1). This increase was due entirely to higher levels of television production, as FLS feature film production19 actually declined by $125 million.
A total of 224 FLS television series were shot in Canada in 2019/20, up from 208 series in 2018/19 (Exhibit 6-2). These 224 FLS television series generated $3.06 billion in production, up from $2.74 billion in volume in 2018/19 (Exhibit 6-1). The production of pilots and other types of single-episode television programming also rose from $315 million in 2018/19 to $508 million in 2019/20, a $193 million increase that accounted for 38% of the overall increase in FLS volume in 2019/20. Television series production accounted for the other 62% of the overall increase.
Ontario, Quebec, Nova Scotia, Manitoba and the territories were all beneficiaries of higher FLS production in 2019/20 (Exhibit 6-4). Indeed, Ontario and Quebec both saw their volumes of FLS production increase by well over $300 million in 2019/20.
• In Ontario, the total volume of FLS production increased by $556 million to a record $1.54 billon, due to an increase in production volume of FLS TV series (from $726 million to a record $1.21 billon) and TV movies, pilots and other single-episode programming (from $79 million to $151 million).
• Quebec benefited from higher demand for services from its VFX studios, and total FLS production rose by $371 million to $1.14 billon.
• In Nova Scotia, FLS production volume rose from $26 million in 2018/19 to $40 million in 2019/20 – growth supported in part by the province’s decision to increase the size of its Film and Television Production Incentive Fund from $20 million to $26 million in 2019/20.20
• In Manitoba, FLS production was $4 million, or 2.3%, higher in 2019/20, reaching a 10-year record of $171 million.21
• Across the territories, FLS production increased from $7 million in 2018/19 to $8 million in 2019/20, but was still short of the 10-year peak of $18 million recorded in 2016/17.
Statistics published by Creative BC and included in Profile 2020 suggest that the total volume of FLS production in British Columbia decreased by 16.7% in 2019/20 (Exhibit 6-4). According to Creative BC, the actual level of FLS production activity in British Columbia in 2019/20 was more likely to have been at the same level as it was 2017/18 and 2018/19, rather than being lower. For further information on the reporting methodology used by Creative BC and how to interpret the province’s film and TV production statistics, please see “Film and Television Tax Credit Certification/ Explanation of Reporting Methodology” at creativebc.ca.
19 This can also include feature films for which visual effects or digital animation work was done in Canada.20 Province of Nova Scotia (2019), “Nova Scotia Film and Television Production Incentive Fund Increase for 2019-20,” news release, September 18, 2019.21 Lauren Malyk (2018), “Manitoba hits $210M in production volume,” Playback, December 18, 2018.
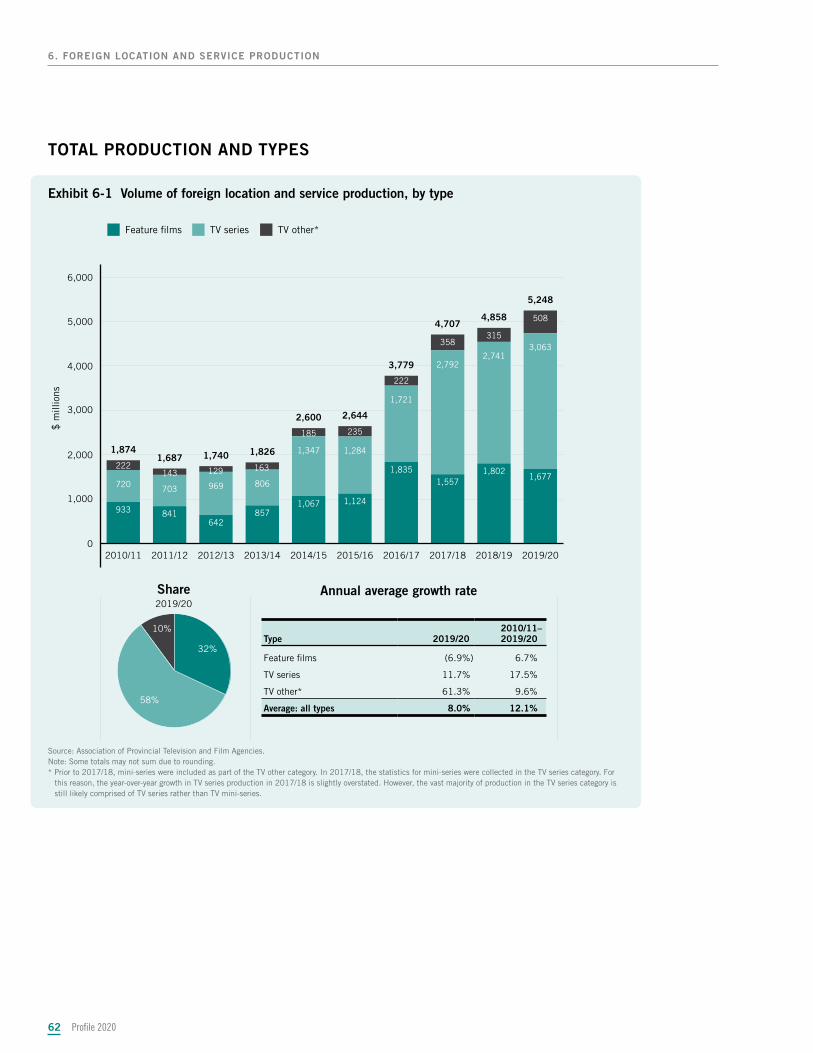
Profile 202062
6. FOREIGN LOCATION AND SERVICE PRODUCTION
TOTAL PRODUCTION AND TYPES
Exhibit 6-1 Volume of foreign location and service production, by type
Annual average growth rateShare2019/20
58%
10%
32%
0
1,000
2,000
3,000
4,000
5,000
6,000
508
315358
222
235
222
3,0632,741
2,792
1,721
1,2841,347
8069697037201,677
1,8021,557
1,835
1,1241,067857
642841933
2019/202018/192017/182016/172015/162014/152013/142012/132011/122010/11
Feature �lms
$ m
illio
ns
TV series TV other*
163
185
129143
5,248
4,8584,707
3,779
2,6442,600
1,8261,7401,6871,874
Source: Association of Provincial Television and Film Agencies.Note: Some totals may not sum due to rounding. * Prior to 2017/18, mini-series were included as part of the TV other category. In 2017/18, the statistics for mini-series were collected in the TV series category. For
this reason, the year-over-year growth in TV series production in 2017/18 is slightly overstated. However, the vast majority of production in the TV series category is still likely comprised of TV series rather than TV mini-series.
Type 2019/20 2010/11– 2019/20–
Feature films (6.9%) 6.7%
TV series 11.7% 17.5%
TV other* 61.3% 9.6%
Average: all types 8.0% 12.1%
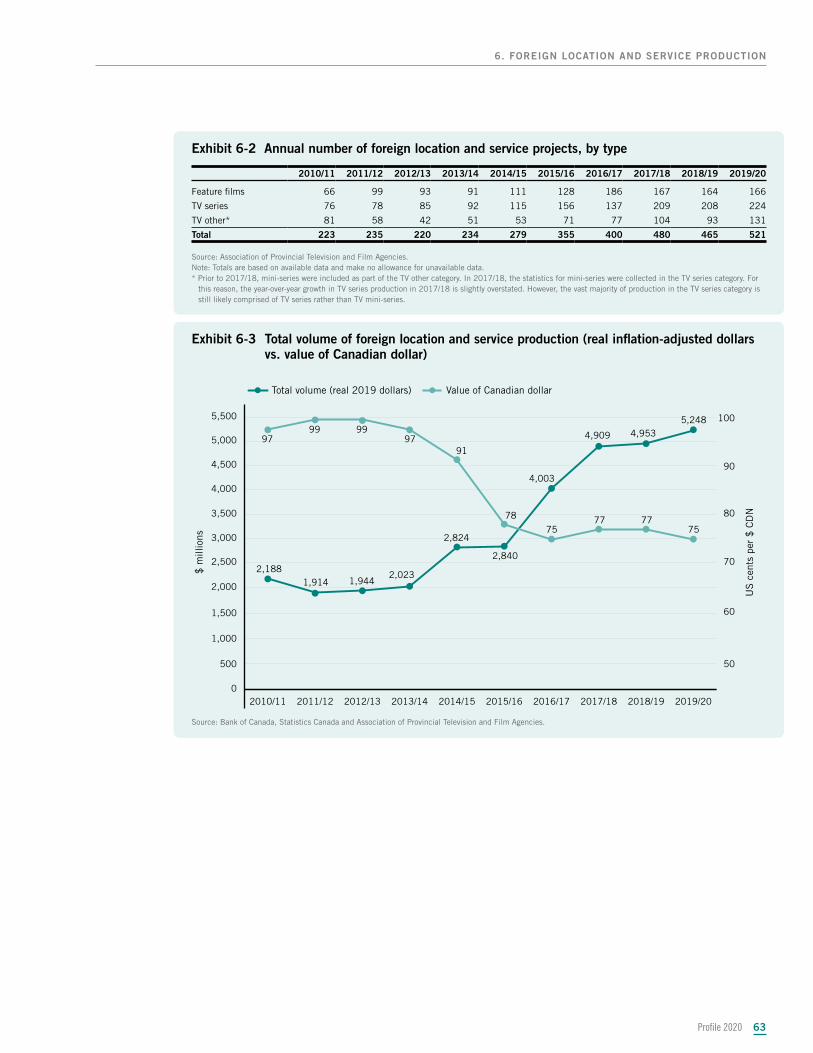
Profile 2020 63
6. FOREIGN LOCATION AND SERVICE PRODUCTION
Exhibit 6-2 Annual number of foreign location and service projects, by type
2010/11 2011/12 2012/13 2013/14 2014/15 2015/16 2016/17 2017/18 2018/19 2019/20
Feature films 66 99 93 91 111 128 186 167 164 166
TV series 76 78 85 92 115 156 137 209 208 224
TV other* 81 58 42 51 53 71 77 104 93 131
Total 223 235 220 234 279 355 400 480 465 521
Source: Association of Provincial Television and Film Agencies.Note: Totals are based on available data and make no allowance for unavailable data.* Prior to 2017/18, mini-series were included as part of the TV other category. In 2017/18, the statistics for mini-series were collected in the TV series category. For
this reason, the year-over-year growth in TV series production in 2017/18 is slightly overstated. However, the vast majority of production in the TV series category is still likely comprised of TV series rather than TV mini-series.
Exhibit 6-3 Total volume of foreign location and service production (real inflation-adjusted dollars vs. value of Canadian dollar)
0
500
1,000
1,500
2,000
2,500
3,000
3,500
4,000
4,500
5,500
5,000
2019/202018/192017/182016/172015/162014/152013/142012/132011/122010/11
Total volume (real 2019 dollars) Value of Canadian dollar
$ m
illio
ns
US
cen
ts p
er $
CD
N
50
60
70
80
90
100
2,840
7777
5,2484,953
78
4,909
91
4,003
2,023
2,824
99 99
1,944
9797
1,914
7575
2,188
Source: Bank of Canada, Statistics Canada and Association of Provincial Television and Film Agencies.
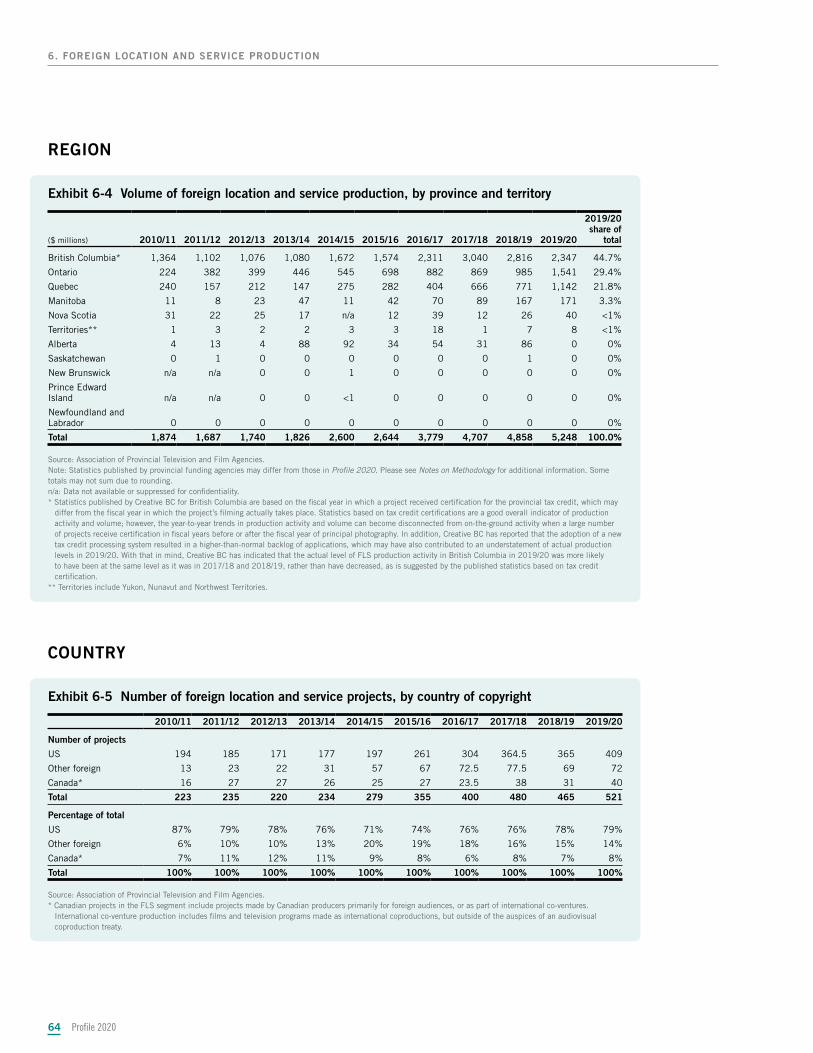
REGION
Exhibit 6-4 Volume of foreign location and service production, by province and territory
($ millions) 2010/11 2011/12 2012/13 2013/14 2014/15 2015/16 2016/17 2017/18 2018/19 2019/20
2019/20share of
total
British Columbia* 1,364 1,102 1,076 1,080 1,672 1,574 2,311 3,040 2,816 2,347 44.7%
Ontario 224 382 399 446 545 698 882 869 985 1,541 29.4%
Quebec 240 157 212 147 275 282 404 666 771 1,142 21.8%
Manitoba 11 8 23 47 11 42 70 89 167 171 3.3%
Nova Scotia 31 22 25 17 n/a 12 39 12 26 40 <1%
Territories** 1 3 2 2 3 3 18 1 7 8 <1%
Alberta 4 13 4 88 92 34 54 31 86 0 0%
Saskatchewan 0 1 0 0 0 0 0 0 1 0 0%
New Brunswick n/a n/a 0 0 1 0 0 0 0 0 0%
Prince Edward Island n/a n/a 0 0 <1 0 0 0 0 0 0%
Newfoundland and Labrador 0 0 0 0 0 0 0 0 0 0 0%
Total 1,874 1,687 1,740 1,826 2,600 2,644 3,779 4,707 4,858 5,248 100.0%
Source: Association of Provincial Television and Film Agencies.Note: Statistics published by provincial funding agencies may differ from those in Profile 2020. Please see Notes on Methodology for additional information. Some totals may not sum due to rounding. n/a: Data not available or suppressed for confidentiality.* Statistics published by Creative BC for British Columbia are based on the fiscal year in which a project received certification for the provincial tax credit, which may
differ from the fiscal year in which the project’s filming actually takes place. Statistics based on tax credit certifications are a good overall indicator of production activity and volume; however, the year-to-year trends in production activity and volume can become disconnected from on-the-ground activity when a large number of projects receive certification in fiscal years before or after the fiscal year of principal photography. In addition, Creative BC has reported that the adoption of a new tax credit processing system resulted in a higher-than-normal backlog of applications, which may have also contributed to an understatement of actual production levels in 2019/20. With that in mind, Creative BC has indicated that the actual level of FLS production activity in British Columbia in 2019/20 was more likely to have been at the same level as it was in 2017/18 and 2018/19, rather than have decreased, as is suggested by the published statistics based on tax credit certification.
** Territories include Yukon, Nunavut and Northwest Territories.
COUNTRY
Exhibit 6-5 Number of foreign location and service projects, by country of copyright
2010/11 2011/12 2012/13 2013/14 2014/15 2015/16 2016/17 2017/18 2018/19 2019/20
Number of projects
US 194 185 171 177 197 261 304 364.5 365 409
Other foreign 13 23 22 31 57 67 72.5 77.5 69 72
Canada* 16 27 27 26 25 27 23.5 38 31 40
Total 223 235 220 234 279 355 400 480 465 521
Percentage of total
US 87% 79% 78% 76% 71% 74% 76% 76% 78% 79%
Other foreign 6% 10% 10% 13% 20% 19% 18% 16% 15% 14%
Canada* 7% 11% 12% 11% 9% 8% 6% 8% 7% 8%
Total 100% 100% 100% 100% 100% 100% 100% 100% 100% 100%
Source: Association of Provincial Television and Film Agencies.* Canadian projects in the FLS segment include projects made by Canadian producers primarily for foreign audiences, or as part of international co-ventures.
International co-venture production includes films and television programs made as international coproductions, but outside of the auspices of an audiovisual coproduction treaty.
Profile 202064
6. FOREIGN LOCATION AND SERVICE PRODUCTION
Profile 2020 65
Highlights from 2019Highlights from 2019
7. 7. Broadcaster in-houseBroadcaster in-house production production
• Spending on the in-house production of news programming was virtually unchanged (decreasing by 0.6%) at $706 million.
• The total volume of in-house production decreased by 6.5% to $1.15 billion.
• Conventional broadcasters’ spending on in-house production decreased by 8.1% to $595 million.
• Spending on in-house production by discretionary and on-demand services decreased by 4.7% to $559 million.
• Spending on the in-house production of sports programming decreased by 22.4% to $266 million.
Broadcaster in-house production (“in-house production”) refers to television programs Broadcaster in-house production (“in-house production”) refers to television programs made internally by private conventional television broadcasters, public broadcasters, made internally by private conventional television broadcasters, public broadcasters, and discretionary and on-demand services. In-house production largely consists of and discretionary and on-demand services. In-house production largely consists of news and sports programs, but can also include production in other genres.news and sports programs, but can also include production in other genres.
After rising in 2018, in-house production volume in Canada decreased in 2019, due to lower spending in both the conventional television sub-segment and the discretionary and on-demand sub-segments of the broadcasting industry. The decrease was driven almost entirely by lower spending on the in-house production of sports programming.
Without a major global sporting event – such as the Olympic Games or FIFA World Cup – to televise in the 2019 broadcast year, total spending on the in-house production of sports programming decreased by $77 million (Exhibit 7-2). Statistics published by the CRTC indicate that while spending on in-house production of sports programming by discretionary services remained stable at just over $233 million in 2019, spending by CBC/Radio-Canada dropped from $108.1 million to $32.3 million.22 This $75.8 million drop accounted for practically all of the overall decrease observed across the entire Canadian broadcasting industry.23
While the in-house production of sports programming experienced a cyclical decrease at CBC/Radio-Canada in 2019, spending on the in-house production of news programming remained relatively stable across all sub-segments of the Canadian broadcasting sector. Private conventional services’ spending on the in-house production of news declined by $4.4 million, which accounted for a decline of 1.2%.23 Across its conventional and discretionary services, CBC/Radio-Canada’s spending on in-house news production declined by $1.4 million, or 1.1%.23 These declines were offset somewhat by a $1.3 million increase in spending on news at discretionary services (excluding those operated by CBC/Radio-Canada).24
22 Calculations based on data from CRTC (2020a), Conventional Television: Statistical and Financial Summaries, 2015-2019; CRTC, Conventional Television: Statistical and Financial Summaries, 2014-2018 (2019a), CRTC (2020b), Discretionary and On-Demand Services: Statistical and Financial Summaries, 2015-2019; and CRTC (2019b), Discretionary and On-Demand Services: Statistical and Financial Summaries, 2014-2018.
23 Calculations based on data from CRTC (2020a), CRTC (2019a), CRTC (2020b), and CRTC (2019b).24 Calculations based on data from CRTC (2020b) and CRTC (2019b).
Profile 202066
7. BROADCASTER IN-HOUSE PRODUCTION
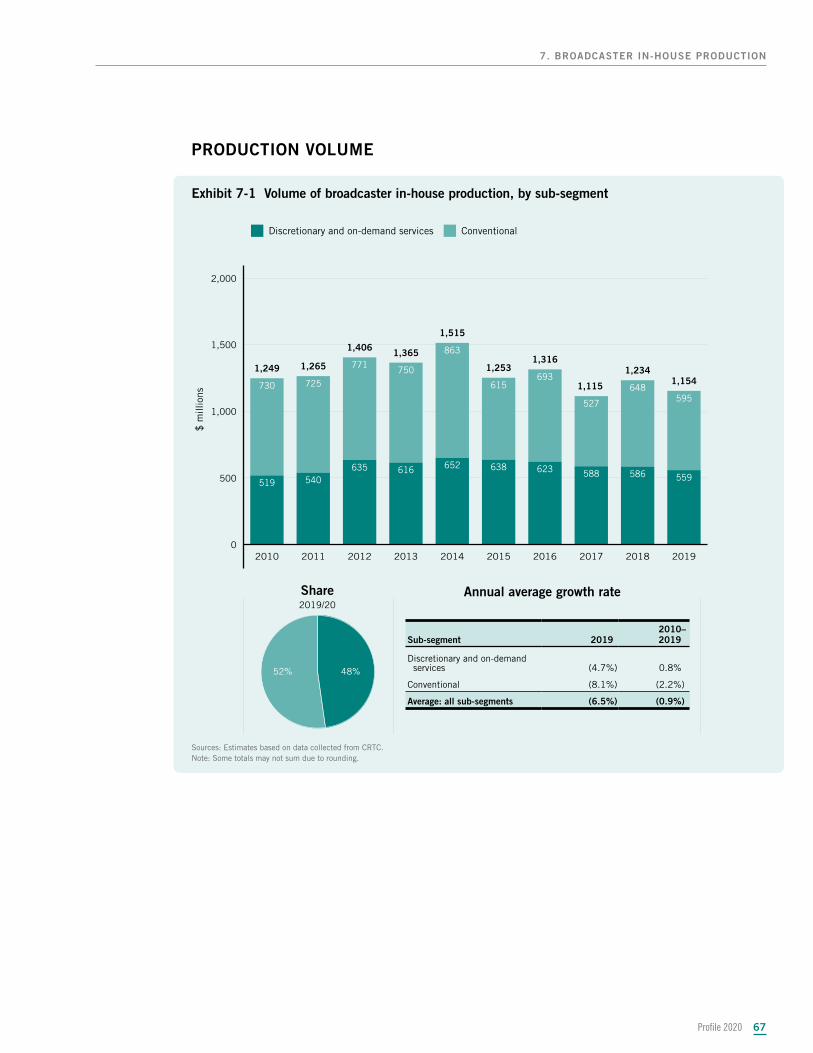
PRODUCTION VOLUME
Exhibit 7-1 Volume of broadcaster in-house production, by sub-segment
Annual average growth rateShare2019/20
48%52%
0
500
1,000
1,500
2,000
595648
527
693615
863
750771
725730
559586588623638652616635540519
2019201820172016201520142013201220112010
Discretionary and on-demand services
$ m
illio
ns
Conventional
1,1541,234
1,115
1,3161,253
1,515
1,3651,406
1,2651,249
Sources: Estimates based on data collected from CRTC. Note: Some totals may not sum due to rounding.
Sub-segment 2019 2010– 2019–
Discretionary and on-demand services (4.7%) 0.8%
Conventional (8.1%) (2.2%)
Average: all sub-segments (6.5%) (0.9%)
Profile 2020 67
7. BROADCASTER IN-HOUSE PRODUCTION
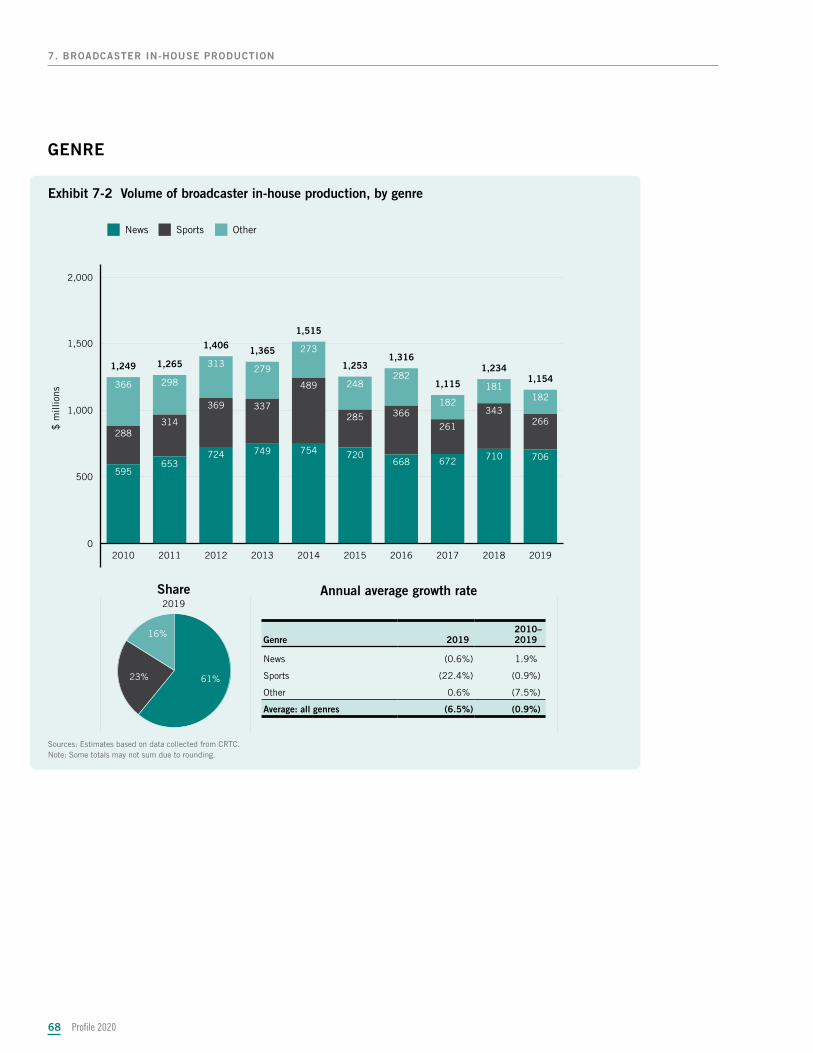
Profile 202068
7. BROADCASTER IN-HOUSE PRODUCTION
GENRE
Exhibit 7-2 Volume of broadcaster in-house production, by genre
Annual average growth rateShare2019
61%23%
16%
0
500
1,000
1,500
2,000
182181
182
282248
273
279313
298366
266343
261366285
489
337369
314288
706710672668720754749724
653595
2019201820172016201520142013201220112010
News
$ m
illio
ns
Sports Other
1,1541,234
1,115
1,3161,253
1,515
1,3651,406
1,2651,249
Sources: Estimates based on data collected from CRTC. Note: Some totals may not sum due to rounding.
Genre 2019 2010– 2019–
News (0.6%) 1.9%
Sports (22.4%) (0.9%)
Other 0.6% (7.5%)
Average: all genres (6.5%) (0.9%)
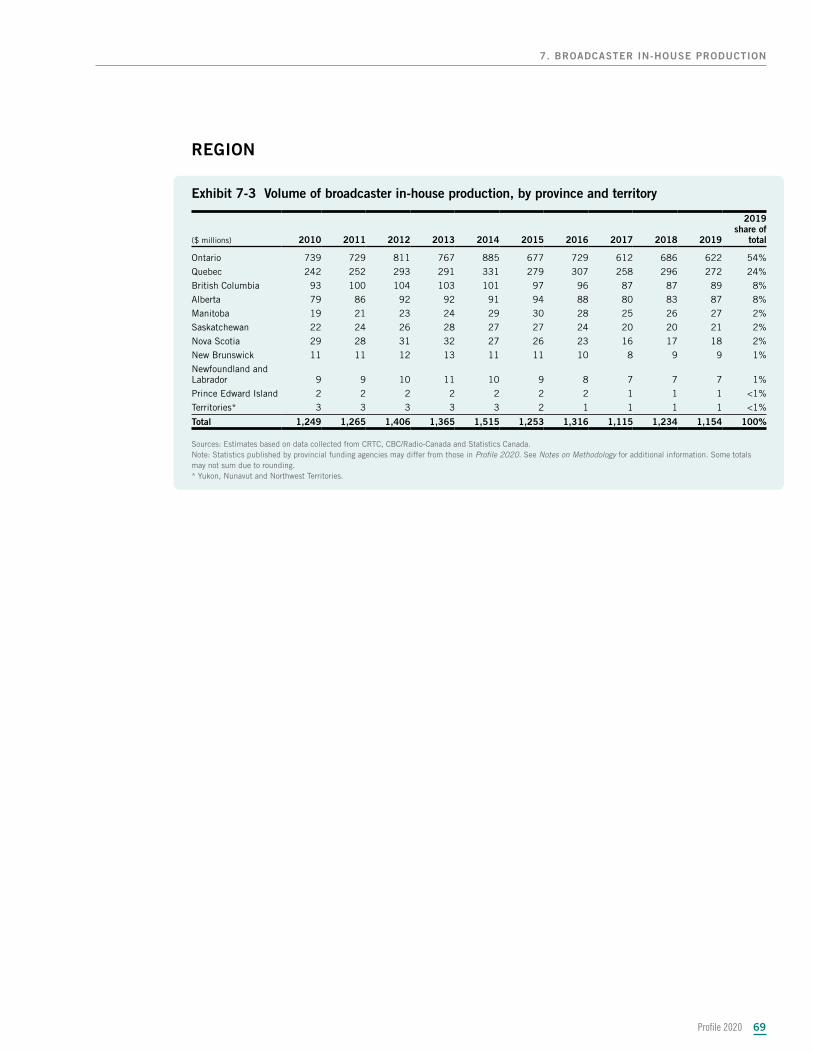
Profile 2020 69
7. BROADCASTER IN-HOUSE PRODUCTION
REGION
Exhibit 7-3 Volume of broadcaster in-house production, by province and territory
($ millions) 2010 2011 2012 2013 2014 2015 2016 2017 2018 2019
2019share of
total
Ontario 739 729 811 767 885 677 729 612 686 622 54%
Quebec 242 252 293 291 331 279 307 258 296 272 24%
British Columbia 93 100 104 103 101 97 96 87 87 89 8%
Alberta 79 86 92 92 91 94 88 80 83 87 8%
Manitoba 19 21 23 24 29 30 28 25 26 27 2%
Saskatchewan 22 24 26 28 27 27 24 20 20 21 2%
Nova Scotia 29 28 31 32 27 26 23 16 17 18 2%
New Brunswick 11 11 12 13 11 11 10 8 9 9 1%
Newfoundland and Labrador 9 9 10 11 10 9 8 7 7 7 1%
Prince Edward Island 2 2 2 2 2 2 2 1 1 1 <1%
Territories* 3 3 3 3 3 2 1 1 1 1 <1%
Total 1,249 1,265 1,406 1,365 1,515 1,253 1,316 1,115 1,234 1,154 100%
Sources: Estimates based on data collected from CRTC, CBC/Radio-Canada and Statistics Canada.Note: Statistics published by provincial funding agencies may differ from those in Profile 2020. See Notes on Methodology for additional information. Some totals may not sum due to rounding. * Yukon, Nunavut and Northwest Territories.
Profile 20207070
Highlights from 2019Highlights from 2019
8. 8. DistributionDistributionCanada’s distribution industry includes both Canadian-controlled and foreign-controlled companies Canada’s distribution industry includes both Canadian-controlled and foreign-controlled companies that distribute film and television content through theatres, television broadcasters, Blu-ray/DVDthat distribute film and television content through theatres, television broadcasters, Blu-ray/DVDwholesaling and other video platforms. wholesaling and other video platforms.
Some of the leading Canadian-controlled distribution companies include eOne Distribution, Mongrel Some of the leading Canadian-controlled distribution companies include eOne Distribution, Mongrel Media and Metropole Films Distribution, as well as the distribution arms of Canadian independent Media and Metropole Films Distribution, as well as the distribution arms of Canadian independent production companies such as WildBrain (formerly DHX Media), Cineflix Media and Thunderbird production companies such as WildBrain (formerly DHX Media), Cineflix Media and Thunderbird Entertainment. Foreign-controlled distribution companies operating in Canada include the distribution Entertainment. Foreign-controlled distribution companies operating in Canada include the distribution arms of major Hollywood studios.arms of major Hollywood studios.
• Revenue from the distribution of Canadian films and television programs accounted for 12.9% of total industry revenue – virtually unchanged from 12.6% in 2017.
• Revenue decreased by 15.7% between 2017 and 2019 to a total of $1.81 billion.
• Revenue from the distribution of Canadian films and television programs decreased by 14.1% (compared with 2017) to a total of $232 million.
• Sales of Canadian films and television programs to foreign markets in 2019 decreased by 1.5% (compared with 2017) to a total of $128 million.
• Canadian distributors’ investment in Canadian films and television programs in 2019/20 decreased by 20.2% (compared with 2018/19) and totalled $328 million.
Profile 2020 71
8. DISTRIBUTION
While total revenue within the Canadian film and television distribution industry topped $2 billion in both 2015 and 2017,25 industry revenue dropped by 15.7% to $1.81 billion in 2019 (Exhibit 8-1). According to Statistics Canada, this drop in revenue can be linked to the ongoing evolution of film and television distribution and consumption26 – in particular, Canadians’ decreasing purchase of DVDs and increasing use of Internet-based video services. Not only did revenue from the distribution of film and television content drop by 13.4% in 2019, but revenue from other sources (namely, the wholesaling of pre-recorded videos) fell by 20% over the two-year period.
The revenue earned by Canadian distributors from Canadian content also fell in 2019, at the same rate of decline experienced by the overall industry. In 2019, revenue from the distribution of Canadian films and television programs decreased by 14.1% to $232 million (Exhibit 8-2). Canadian content accounted for 12.9% of industry revenue – up marginally from 12.6% in 2017.
A closer look at the distribution revenue for Canadian content shows that despite the overall decline, foreign demand remained stable. Revenue from foreign markets was down slightly at $128 million, and raised its share of total revenue from 48.1% in 2017 to 55.2% in 2019 (Exhibit 8-2).
Canadian distributors invest in Canadian films and television programs through minimum guarantees and advances on anticipated distribution revenues. Between 2010/11 and 2016/17, Canadian distributors more than doubled their annual investments in Canadian films and television programs – from $225 million to $494 million (Exhibit 8-3). In recent years, however, these annual levels of investment have waned. In 2019/20, Canadian distributors invested an estimated $328 million in Canadian films and television programs – down by a third from 2016/17’s 10-year peak and below the 10-year average of $349 million.
25 As of 2011, Statistics Canada only publishes data for the audiovisual distribution industry on a biennial basis. For that reason, no data is available for 2016 and 2018.
26 Statistics Canada (2021), “Revenue and expenses drop for Canada's film, television and video distribution industry in 2019,” The Daily, February 18, 2021.
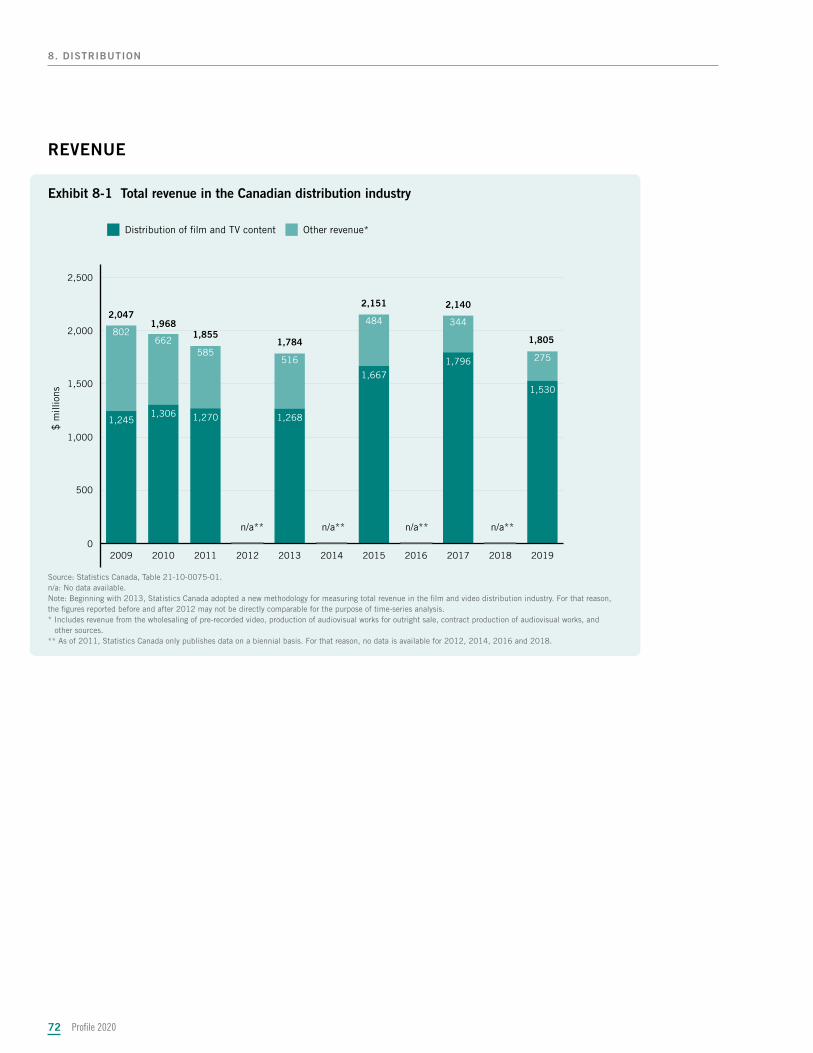
Profile 202072
8. DISTRIBUTION
REVENUE
Exhibit 8-1 Total revenue in the Canadian distribution industry
0
500
1,000
1,500
2,000
2,500
275
344484
516585
662802
1,530
1,7961,667
1,2681,2701,3061,245
20192018201720162015201420132012201120102009
$ m
illio
ns
Distribution of �lm and TV content Other revenue*
n/a**n/a**n/a**n/a**
1,805
2,1402,151
1,7841,855
1,9682,047
Source: Statistics Canada, Table 21-10-0075-01.n/a: No data available. Note: Beginning with 2013, Statistics Canada adopted a new methodology for measuring total revenue in the film and video distribution industry. For that reason, the figures reported before and after 2012 may not be directly comparable for the purpose of time-series analysis.* Includes revenue from the wholesaling of pre-recorded video, production of audiovisual works for outright sale, contract production of audiovisual works, and
other sources.** As of 2011, Statistics Canada only publishes data on a biennial basis. For that reason, no data is available for 2012, 2014, 2016 and 2018.
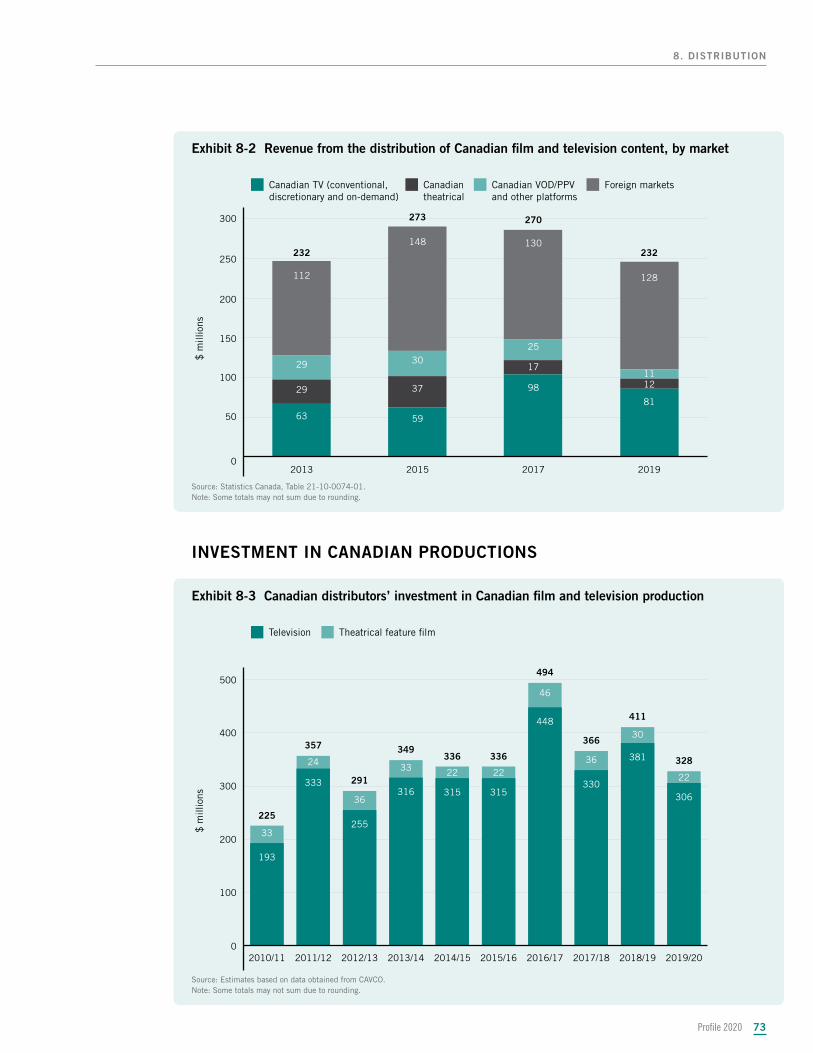
Profile 2020 73
8. DISTRIBUTION
Exhibit 8-2 Revenue from the distribution of Canadian film and television content, by market
0
50
100
150
200
250
300
128
130148
112
11
253029
12
17
372981
98
5963
2019201720152013
$ m
illio
nsCanadian TV (conventional, discretionary and on-demand)
Foreign marketsCanadian theatrical
Canadian VOD/PPVand other platforms
232
270273
232
Source: Statistics Canada, Table 21-10-0074-01.Note: Some totals may not sum due to rounding.
INVESTMENT IN CANADIAN PRODUCTIONS
Exhibit 8-3 Canadian distributors’ investment in Canadian film and television production
0
100
200
300
400
500
22
30
36
46
222233
36
24
33
306
381
330
448
315315316
255
333
193
2019/202018/192017/182016/172015/162014/152013/142012/132011/122010/11
Television
$ m
illio
ns
Theatrical feature �lm
328
411
366
494
336336349
291
357
225
Source: Estimates based on data obtained from CAVCO. Note: Some totals may not sum due to rounding.
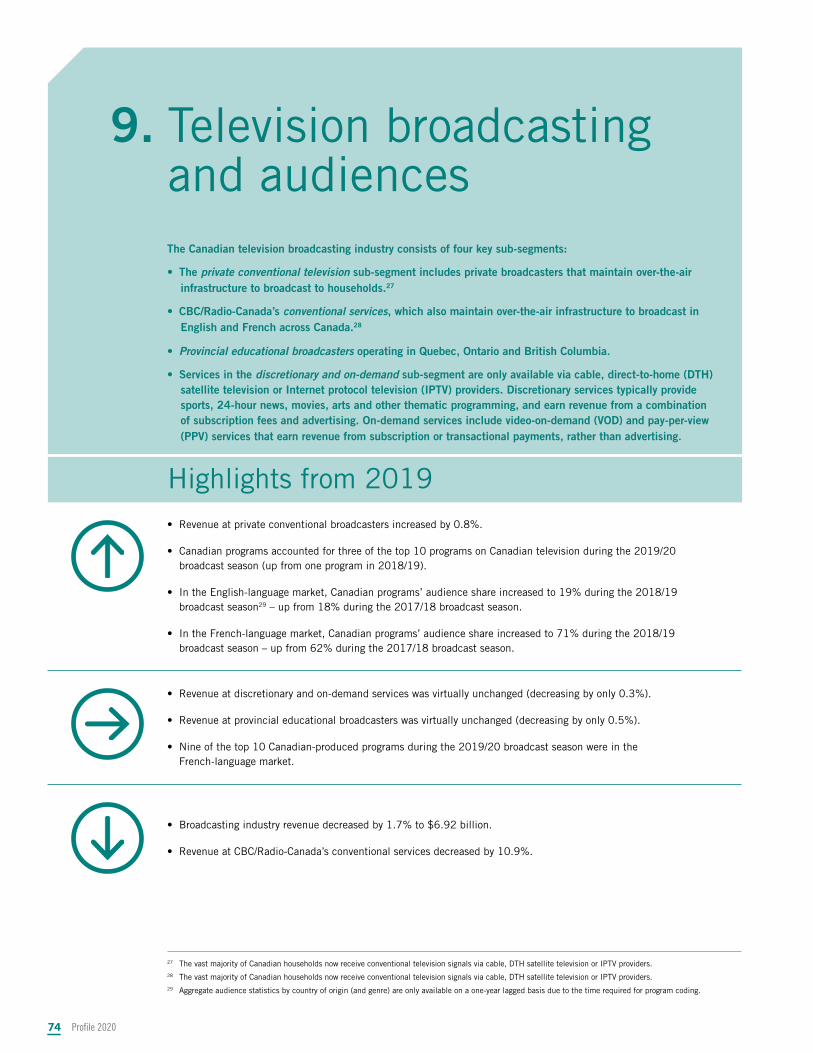
Profile 20207474
Highlights from 2019Highlights from 2019
• Broadcasting industry revenue decreased by 1.7% to $6.92 billion.
• Revenue at CBC/Radio-Canada’s conventional services decreased by 10.9%.
9. 9. Television broadcasting Television broadcasting and audiencesand audiences
• Revenue at discretionary and on-demand services was virtually unchanged (decreasing by only 0.3%).
• Revenue at provincial educational broadcasters was virtually unchanged (decreasing by only 0.5%).
• Nine of the top 10 Canadian-produced programs during the 2019/20 broadcast season were in the French-language market.
• Revenue at private conventional broadcasters increased by 0.8%.
• Canadian programs accounted for three of the top 10 programs on Canadian television during the 2019/20 broadcast season (up from one program in 2018/19).
• In the English-language market, Canadian programs’ audience share increased to 19% during the 2018/19 broadcast season29 – up from 18% during the 2017/18 broadcast season.
• In the French-language market, Canadian programs’ audience share increased to 71% during the 2018/19 broadcast season – up from 62% during the 2017/18 broadcast season.
29 Aggregate audience statistics by country of origin (and genre) are only available on a one-year lagged basis due to the time required for program coding.
The Canadian television broadcasting industry consists of four key sub-segments: The Canadian television broadcasting industry consists of four key sub-segments:
• The • The private conventional television private conventional television sub-segment includes private broadcasters that maintain over-the-air sub-segment includes private broadcasters that maintain over-the-air infrastructure to broadcast to households.infrastructure to broadcast to households.2727
• CBC/Radio-Canada’s • CBC/Radio-Canada’s conventional servicesconventional services, which also maintain over-the-air infrastructure to broadcast in , which also maintain over-the-air infrastructure to broadcast in English and French across Canada.English and French across Canada.2828
• • Provincial educational broadcastersProvincial educational broadcasters operating in Quebec, Ontario and British Columbia. operating in Quebec, Ontario and British Columbia.
• Services in the • Services in the discretionary and on-demand discretionary and on-demand sub-segment are only available via cable, direct-to-home (DTH) sub-segment are only available via cable, direct-to-home (DTH) satellite television or Internet protocol television (IPTV) providers. Discretionary services typically provide satellite television or Internet protocol television (IPTV) providers. Discretionary services typically provide sports, 24-hour news, movies, arts and other thematic programming, and earn revenue from a combination sports, 24-hour news, movies, arts and other thematic programming, and earn revenue from a combination of subscription fees and advertising. On-demand services include video-on-demand (VOD) and pay-per-view of subscription fees and advertising. On-demand services include video-on-demand (VOD) and pay-per-view (PPV) services that earn revenue from subscription or transactional payments, rather than advertising.(PPV) services that earn revenue from subscription or transactional payments, rather than advertising.
27 The vast majority of Canadian households now receive conventional television signals via cable, DTH satellite television or IPTV providers.28 The vast majority of Canadian households now receive conventional television signals via cable, DTH satellite television or IPTV providers.
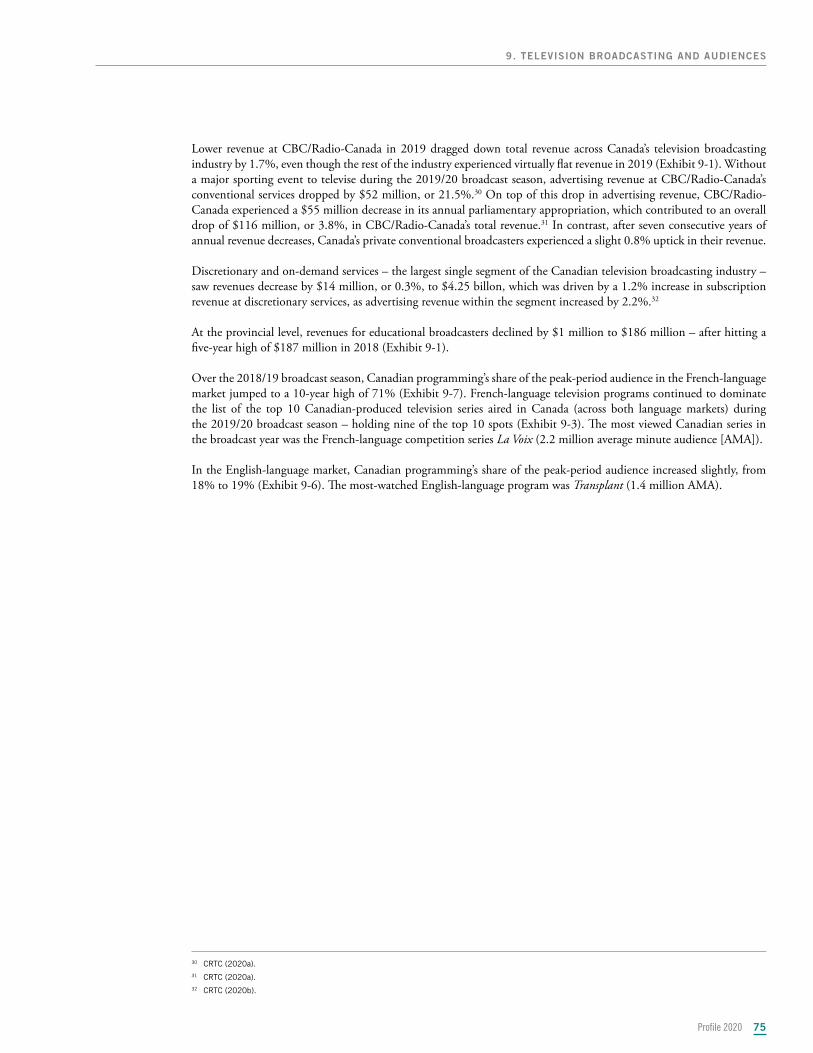
Profile 2020 75
9. TELEVISION BROADCASTING AND AUDIENCES
Lower revenue at CBC/Radio-Canada in 2019 dragged down total revenue across Canada’s television broadcasting industry by 1.7%, even though the rest of the industry experienced virtually flat revenue in 2019 (Exhibit 9-1). Without a major sporting event to televise during the 2019/20 broadcast season, advertising revenue at CBC/Radio-Canada’s conventional services dropped by $52 million, or 21.5%.30 On top of this drop in advertising revenue, CBC/Radio-Canada experienced a $55 million decrease in its annual parliamentary appropriation, which contributed to an overall drop of $116 million, or 3.8%, in CBC/Radio-Canada’s total revenue.31 In contrast, after seven consecutive years of annual revenue decreases, Canada’s private conventional broadcasters experienced a slight 0.8% uptick in their revenue.
Discretionary and on-demand services – the largest single segment of the Canadian television broadcasting industry – saw revenues decrease by $14 million, or 0.3%, to $4.25 billon, which was driven by a 1.2% increase in subscription revenue at discretionary services, as advertising revenue within the segment increased by 2.2%.32
At the provincial level, revenues for educational broadcasters declined by $1 million to $186 million – after hitting a five-year high of $187 million in 2018 (Exhibit 9-1).
Over the 2018/19 broadcast season, Canadian programming’s share of the peak-period audience in the French-language market jumped to a 10-year high of 71% (Exhibit 9-7). French-language television programs continued to dominate the list of the top 10 Canadian-produced television series aired in Canada (across both language markets) during the 2019/20 broadcast season – holding nine of the top 10 spots (Exhibit 9-3). The most viewed Canadian series in the broadcast year was the French-language competition series La Voix (2.2 million average minute audience [AMA]).
In the English-language market, Canadian programming’s share of the peak-period audience increased slightly, from 18% to 19% (Exhibit 9-6). The most-watched English-language program was Transplant (1.4 million AMA).
30 CRTC (2020a).31 CRTC (2020a).32 CRTC (2020b).
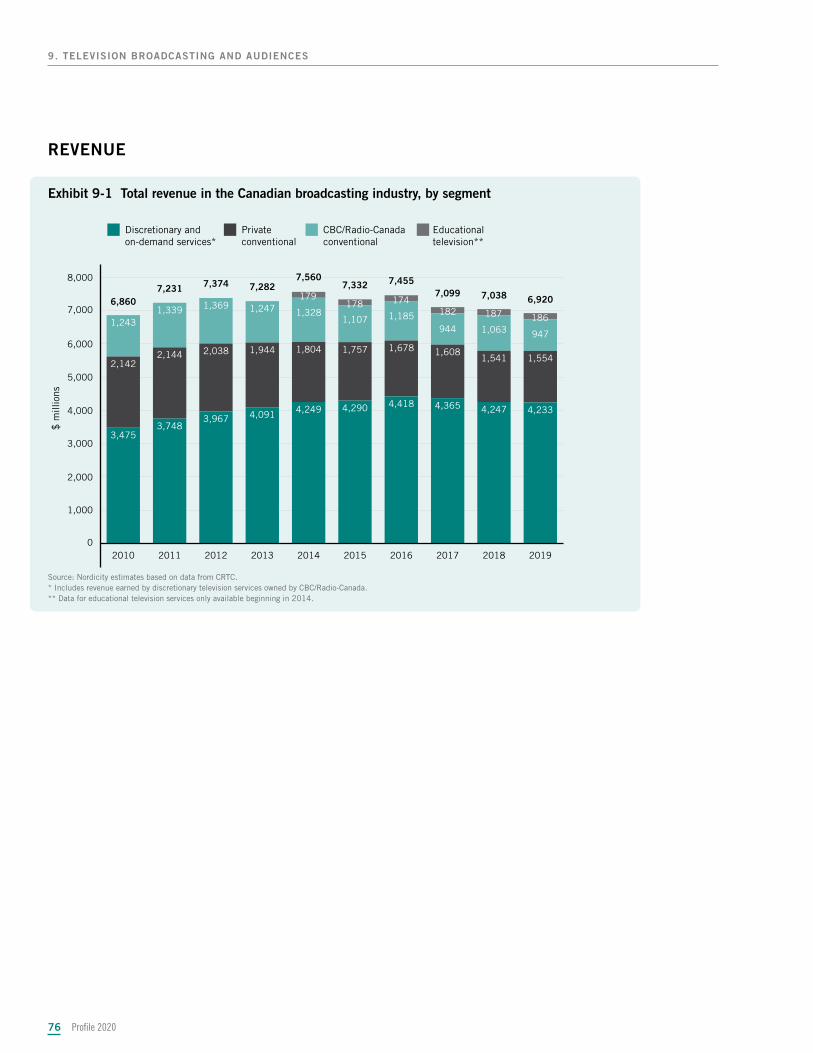
Profile 202076
9. TELEVISION BROADCASTING AND AUDIENCES
REVENUE
Exhibit 9-1 Total revenue in the Canadian broadcasting industry, by segment
0
1,000
2,000
3,000
4,000
5,000
6,000
7,000
8,000
9471,0639441,1851,107
1,3281,2471,3691,3391,243
1,5541,5411,6081,6781,7571,8041,9442,0382,144
2,142
4,2334,2474,3654,4184,2904,2494,0913,9673,748
3,475
2019201820172016201520142013201220112010
Discretionary and on-demand services*
$ m
illio
ns
Private conventional
CBC/Radio-Canada conventional
Educationaltelevision**
186187174178
182
179 6,9207,0387,0997,4557,332
7,5607,2827,3747,231
6,860
Source: Nordicity estimates based on data from CRTC.* Includes revenue earned by discretionary television services owned by CBC/Radio-Canada.** Data for educational television services only available beginning in 2014.
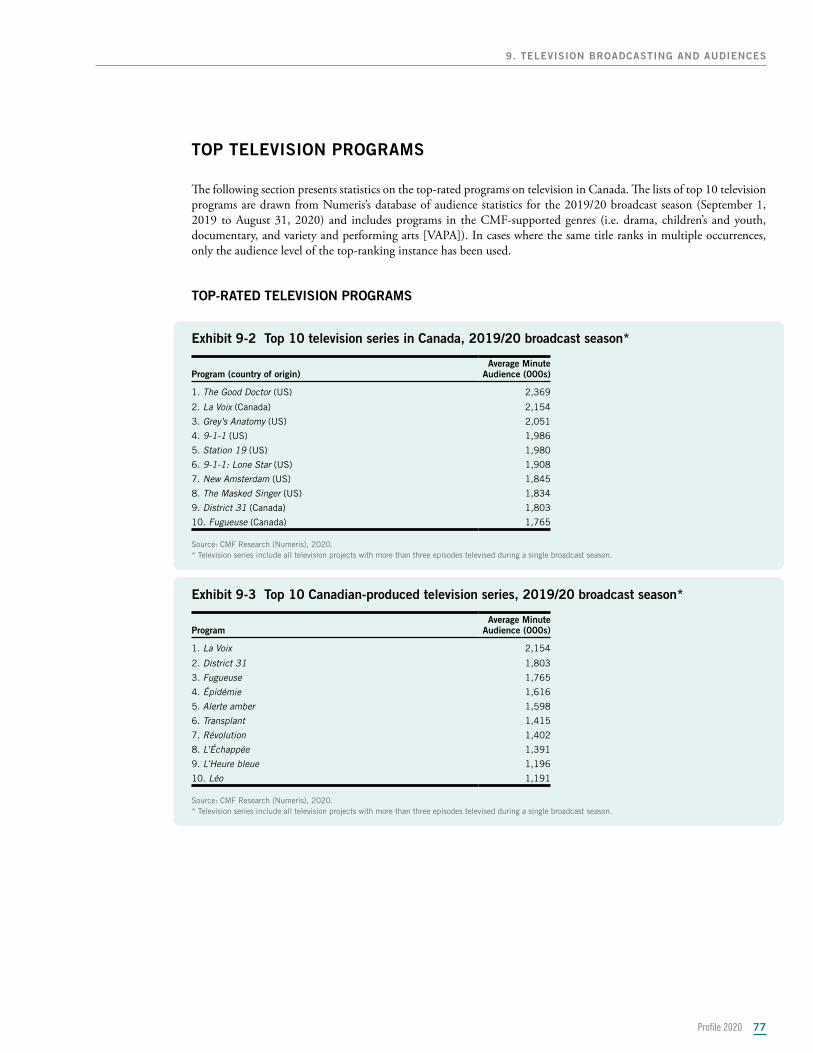
Profile 2020 77
9. TELEVISION BROADCASTING AND AUDIENCES
TOP TELEVISION PROGRAMS
The following section presents statistics on the top-rated programs on television in Canada. The lists of top 10 television programs are drawn from Numeris’s database of audience statistics for the 2019/20 broadcast season (September 1, 2019 to August 31, 2020) and includes programs in the CMF-supported genres (i.e. drama, children’s and youth, documentary, and variety and performing arts [VAPA]). In cases where the same title ranks in multiple occurrences, only the audience level of the top-ranking instance has been used.
TOP-RATED TELEVISION PROGRAMS
Exhibit 9-2 Top 10 television series in Canada, 2019/20 broadcast season*
Program (country of origin)Average Minute
Audience (000s)
1. The Good Doctor (US) 2,369
2. La Voix (Canada) 2,154
3. Grey’s Anatomy (US) 2,051
4. 9-1-1 (US) 1,986
5. Station 19 (US) 1,980
6. 9-1-1: Lone Star (US) 1,908
7. New Amsterdam (US) 1,845
8. The Masked Singer (US) 1,834
9. District 31 (Canada) 1,803
10. Fugueuse (Canada) 1,765
Source: CMF Research (Numeris), 2020.* Television series include all television projects with more than three episodes televised during a single broadcast season.
Exhibit 9-3 Top 10 Canadian-produced television series, 2019/20 broadcast season*
ProgramAverage Minute
Audience (000s)
1. La Voix 2,154
2. District 31 1,803
3. Fugueuse 1,765
4. Épidémie 1,616
5. Alerte amber 1,598
6. Transplant 1,415
7. Révolution 1,402
8. L’Échappée 1,391
9. L’Heure bleue 1,196
10. Léo 1,191
Source: CMF Research (Numeris), 2020.* Television series include all television projects with more than three episodes televised during a single broadcast season.
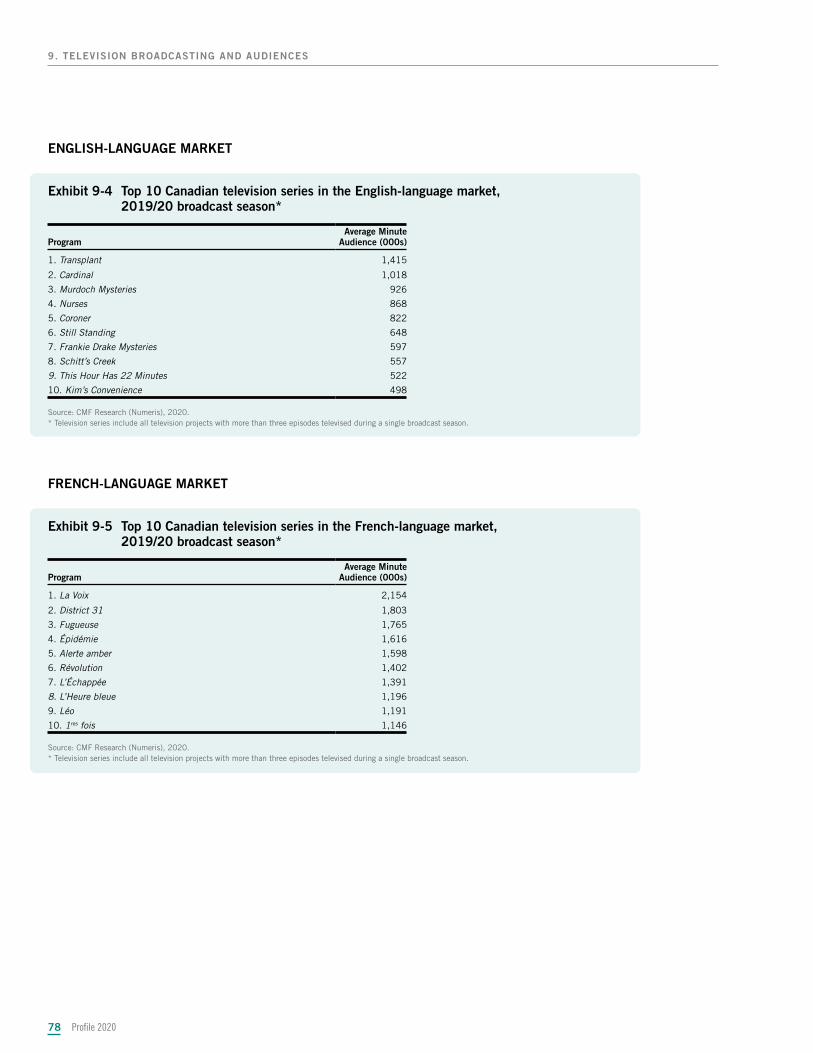
Profile 202078
9. TELEVISION BROADCASTING AND AUDIENCES
ENGLISH-LANGUAGE MARKET
Exhibit 9-4 Top 10 Canadian television series in the English-language market, 2019/20 broadcast season*
ProgramAverage Minute
Audience (000s)
1. Transplant 1,415
2. Cardinal 1,018
3. Murdoch Mysteries 926
4. Nurses 868
5. Coroner 822
6. Still Standing 648
7. Frankie Drake Mysteries 597
8. Schitt’s Creek 557
9. This Hour Has 22 Minutes 522
10. Kim’s Convenience 498
Source: CMF Research (Numeris), 2020.* Television series include all television projects with more than three episodes televised during a single broadcast season.
FRENCH-LANGUAGE MARKET
Exhibit 9-5 Top 10 Canadian television series in the French-language market, 2019/20 broadcast season*
ProgramAverage Minute
Audience (000s)
1. La Voix 2,154
2. District 31 1,803
3. Fugueuse 1,765
4. Épidémie 1,616
5. Alerte amber 1,598
6. Révolution 1,402
7. L’Échappée 1,391
8. L’Heure bleue 1,196
9. Léo 1,191
10. 1res fois 1,146
Source: CMF Research (Numeris), 2020.* Television series include all television projects with more than three episodes televised during a single broadcast season.
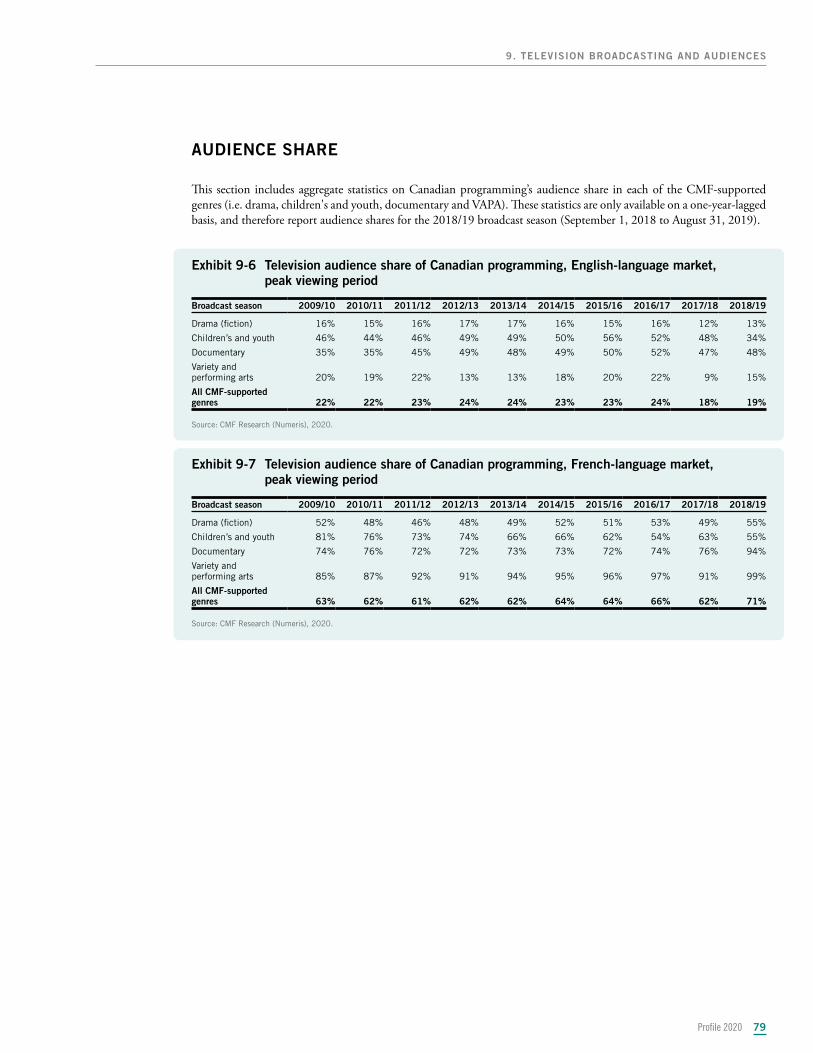
Profile 2020 79
9. TELEVISION BROADCASTING AND AUDIENCES
AUDIENCE SHARE
This section includes aggregate statistics on Canadian programming’s audience share in each of the CMF-supported genres (i.e. drama, children's and youth, documentary and VAPA). These statistics are only available on a one-year-lagged basis, and therefore report audience shares for the 2018/19 broadcast season (September 1, 2018 to August 31, 2019).
Exhibit 9-6 Television audience share of Canadian programming, English-language market, peak viewing period
Broadcast season 2009/10 2010/11 2011/12 2012/13 2013/14 2014/15 2015/16 2016/17 2017/18 2018/19
Drama (fiction) 16% 15% 16% 17% 17% 16% 15% 16% 12% 13%
Children’s and youth 46% 44% 46% 49% 49% 50% 56% 52% 48% 34%
Documentary 35% 35% 45% 49% 48% 49% 50% 52% 47% 48%
Variety and performing arts 20% 19% 22% 13% 13% 18% 20% 22% 9% 15%
All CMF-supported genres 22% 22% 23% 24% 24% 23% 23% 24% 18% 19%
Source: CMF Research (Numeris), 2020.
Exhibit 9-7 Television audience share of Canadian programming, French-language market, peak viewing period
Broadcast season 2009/10 2010/11 2011/12 2012/13 2013/14 2014/15 2015/16 2016/17 2017/18 2018/19
Drama (fiction) 52% 48% 46% 48% 49% 52% 51% 53% 49% 55%
Children’s and youth 81% 76% 73% 74% 66% 66% 62% 54% 63% 55%
Documentary 74% 76% 72% 72% 73% 73% 72% 74% 76% 94%
Variety and performing arts 85% 87% 92% 91% 94% 95% 96% 97% 91% 99%
All CMF-supported genres 63% 62% 61% 62% 62% 64% 64% 66% 62% 71%
Source: CMF Research (Numeris), 2020.
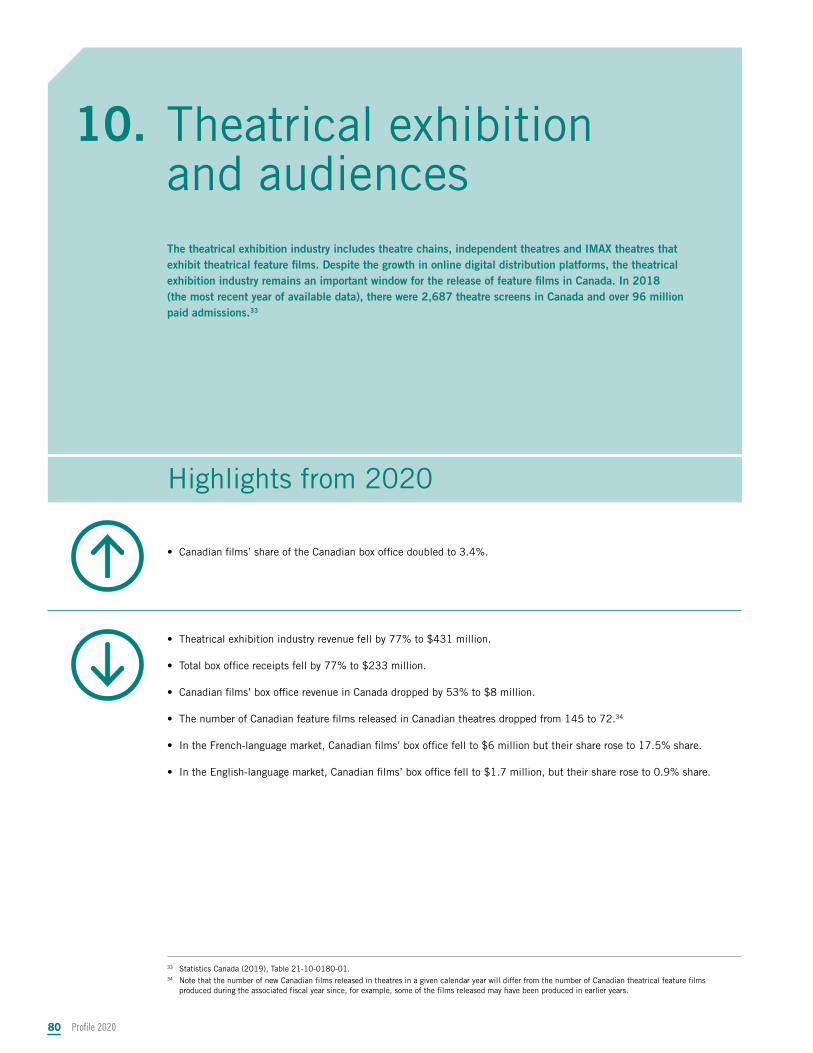
Profile 20208080
Highlights from 2020Highlights from 2020
10. 10. Theatrical exhibition Theatrical exhibition and audiencesand audiences
• Canadian films’ share of the Canadian box office doubled to 3.4%.
• Theatrical exhibition industry revenue fell by 77% to $431 million.
• Total box office receipts fell by 77% to $233 million.
• Canadian films’ box office revenue in Canada dropped by 53% to $8 million.
• The number of Canadian feature films released in Canadian theatres dropped from 145 to 72.34
• In the French-language market, Canadian films’ box office fell to $6 million but their share rose to 17.5% share.
• In the English-language market, Canadian films’ box office fell to $1.7 million, but their share rose to 0.9% share.
34 Note that the number of new Canadian films released in theatres in a given calendar year will differ from the number of Canadian theatrical feature films produced during the associated fiscal year since, for example, some of the films released may have been produced in earlier years.
The theatrical exhibition industry includes theatre chains, independent theatres and IMAX theatres that The theatrical exhibition industry includes theatre chains, independent theatres and IMAX theatres that exhibit theatrical feature films. Despite the growth in online digital distribution platforms, the theatrical exhibit theatrical feature films. Despite the growth in online digital distribution platforms, the theatrical exhibition industry remains an important window for the release of feature films in Canada. In 2018 exhibition industry remains an important window for the release of feature films in Canada. In 2018 (the most recent year of available data), there were 2,687 theatre screens in Canada and over 96 million (the most recent year of available data), there were 2,687 theatre screens in Canada and over 96 million paid admissions.paid admissions.3333
33 Statistics Canada (2019), Table 21-10-0180-01.
Profile 2020 81
10. THEATRICAL EXHIBITION AND AUDIENCES
Between 2011 and 2019, even with increasing competition from Internet-based television services, the annual value of the theatrical box office in Canada was consistently around $1 billion (Exhibit 10-4). In 2020, however, COVID-19 led to the widespread closure of theatres in Canada and collapse in box office revenue. Statistics from the Movie Theatre Association of Canada reveal that box office revenue fell by 77% in 2020 and ended the year at $233 million. Total revenue in the exhibition industry is estimated to have fallen from over $1.8 billion in 2019 to $433 million in 2020 (Exhibit 10-1).
While 2020 was a devastating year for Canada’s movie theatres, proportionally more of the lost box office was borne by American films. Compared to 2019, the number of Canadian and foreign non-American films released in Canadian theatres dropped by approximately half in 2020, but the supply of American films dropped by two-thirds (Exhibit 10-6). With Hollywood studios postponing the release of many of their films, foreign (non-American) and Canadian films increased their box office – albeit on much lower box office revenue. Foreign non-American films’ box office revenue dropped from $71 million to $47 million in 2020, but their market share rose from 7.9% to 20.2% (Exhibits 10-4 and 10-5). Similarly, Canadian films’ box office revenue dropped from $17 million to $8 million, but their market share doubled from 1.7% to 3.4%.
The long-term resiliency of Canada’s movie-theatre industry may be further tested in 2021 and beyond. In 2020, several of the leading Hollywood studios announced changes to the theatrical release of their films going forward. Universal and Paramount announced agreements with the US theatre chain AMC, which effectively shorten the exclusive theatrical window for their films.35 Disney announced that it would be diverting some films to Disney+.36 WarnerMedia announced that it would simultaneously release its entire 2021 slate of films in theatres and on its HBO Max service in the US.37 The future of Canada’s theatrical exhibition industry will be tied to the degree to which these practices extend into Canada in years to come.
35 Daniel Loria (2020), “AMC Theatres Welcomes Back Universal Titles Under Shortened Theatrical Exclusivity Window,” BoxOffice.com, July 28, 2020.36 Daniel Loria and Rebecca Pahle (2020), “Disney Shifts Focus to Streaming, Expresses Flexibility on Windows, in Direct to Consumer Restructuring,”
BoxOffice.com, December 10, 2021.37 Bradly Shankar (2020), “Warner Bros.’ 2021 films will stream in Canada on Crave after they hit theatres,” mobilesyrup.com, December 3, 2020.
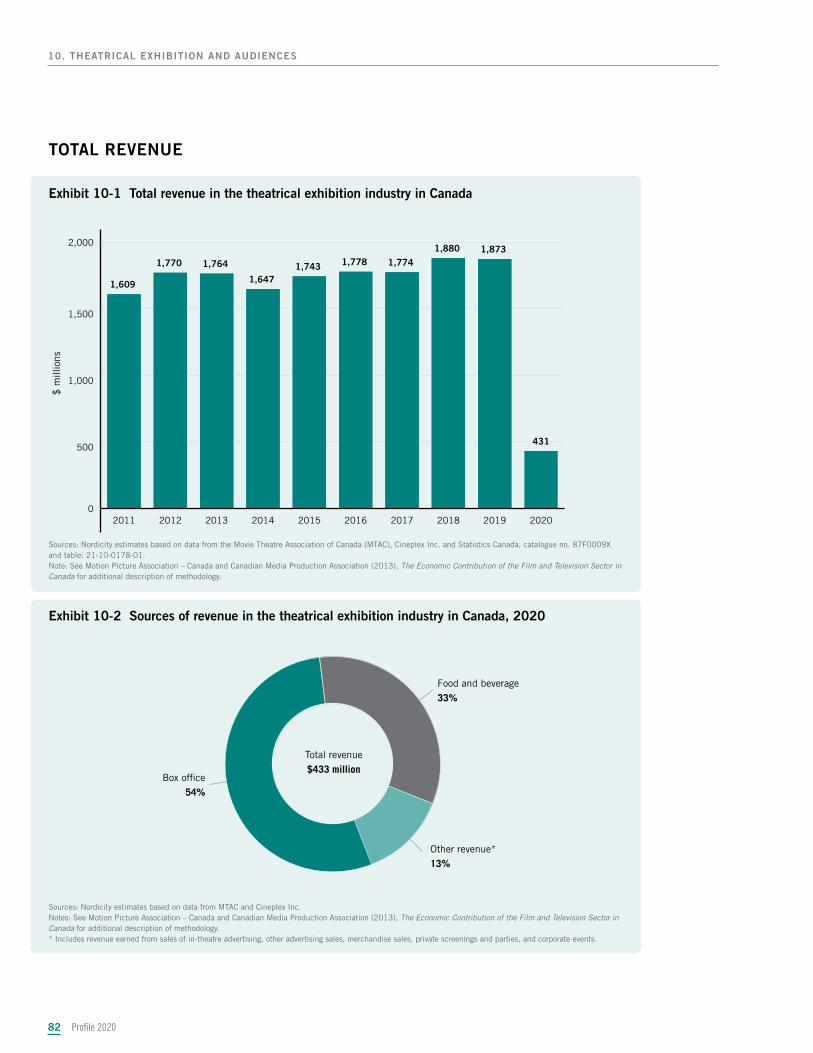
Profile 202082
10. THEATRICAL EXHIBITION AND AUDIENCES
TOTAL REVENUE
Exhibit 10-1 Total revenue in the theatrical exhibition industry in Canada
0
500
1,000
1,500
2,000
431
1,8731,880
1,7741,7781,7431,647
1,7641,770
1,609
2020201920182017201620152014201320122011
$ m
illio
ns
Sources: Nordicity estimates based on data from the Movie Theatre Association of Canada (MTAC), Cineplex Inc. and Statistics Canada, catalogue no. 87F0009X and table: 21-10-0178-01.Note: See Motion Picture Association – Canada and Canadian Media Production Association (2013), The Economic Contribution of the Film and Television Sector in Canada for additional description of methodology.
Exhibit 10-2 Sources of revenue in the theatrical exhibition industry in Canada, 2020
Box of�ce54%
Other revenue*13%
Food and beverage33%
Total revenue$433 million
Sources: Nordicity estimates based on data from MTAC and Cineplex Inc. Notes: See Motion Picture Association – Canada and Canadian Media Production Association (2013), The Economic Contribution of the Film and Television Sector in Canada for additional description of methodology.* Includes revenue earned from sales of in-theatre advertising, other advertising sales, merchandise sales, private screenings and parties, and corporate events.
Profile 2020 83
10. THEATRICAL EXHIBITION AND AUDIENCES
FILM FESTIVALS
In recent years, many of the film festivals that traditionally acted as markets for the selling of independent productions to distributors have evolved into more sophisticated marketing and sales operations. Now festivals are often a means of building word-of-mouth and interest by actively cultivating audiences ahead of a theatrical release, as well as providing the fora for industry practitioners to engage with each other and filmmakers.
In terms of the value chain that operates in the film and television sector, film festivals often play a key role in mediating the transactions between independent filmmakers and distributors and broadcasters. These significant economic benefits are mostly captured within the distribution and broadcasting segment of the value chain.
Film festivals continue to be an integral element of the film sector ecosystem, with hundreds spread all across Canada, covering a broad range of genres. There are genuinely global festivals such as Toronto International Film Festival (TIFF), operating in the company of Cannes, Venice, and Sundance; world-leading specialist film festivals such as the Ottawa International Animation Festival, Hot Docs Canadian International Documentary Festival, and imagineNATIVE Film + Media Arts Festival; and popular genre festivals, such as Montreal’s Fantasia International Film Festival, which continue to bring in the crowds.
As part of its support of the promotion of Canadian films, Telefilm Canada provided financial support to 75 Canadian film festivals and 88 industry events and initiatives in Canada in 2019/20.38 These 75 festivals represent the major events in Canada; however, there are numerous smaller local film festivals that operate without funding from Telefilm Canada. Telefilm Canada’s Success Index39 tracks Canadian films’ recognition (i.e. selections, prize nominations and awards) at 14 Canadian film festivals as part of its assessment of Canadian films’ commercial, cultural and industrial performance.
Exhibit 10-3 Canadian film festivals that contribute to Telefilm Canada’s Success Index
1. Calgary International Film Festival
2. Cinéfest Sudbury International Film Festival
3. Festival du nouveau cinéma de Montréal
4. Fantasia International Film Festival
5. Festival international du film pour enfants de Montréal (FIFEM)
6. FIN Atlantic International Film Festival
7. Hot Docs
8. Ottawa International Animation Festival
9. Rencontres internationales du documentaire de Montréal
10. Toronto International Film Festival (TIFF)
11. TIFF Kids International Film Festival
12. Vancouver International Film Festival (VIFF)
13. Victoria Film Festival
14. Whistler Film Festival
Source: Telefilm Canada (2019).Note: Due to the negative impact of COVID-19 on the Canadian feature film industry, Telefilm Canada suspended further use of the Success Index for the 2020–2021 fiscal year.
38 Telefilm Canada (2020), Building Resilience Through Partnership: 2019-2020 Annual Report, p. 12.39 Telefilm Canada’s Success Index combines seven indicators that measure Canadian films’ commercial, cultural and industrial performance to track the overall
success of the films it funds. For more information, see https://telefilm.ca/en/industry-resources/success-index.
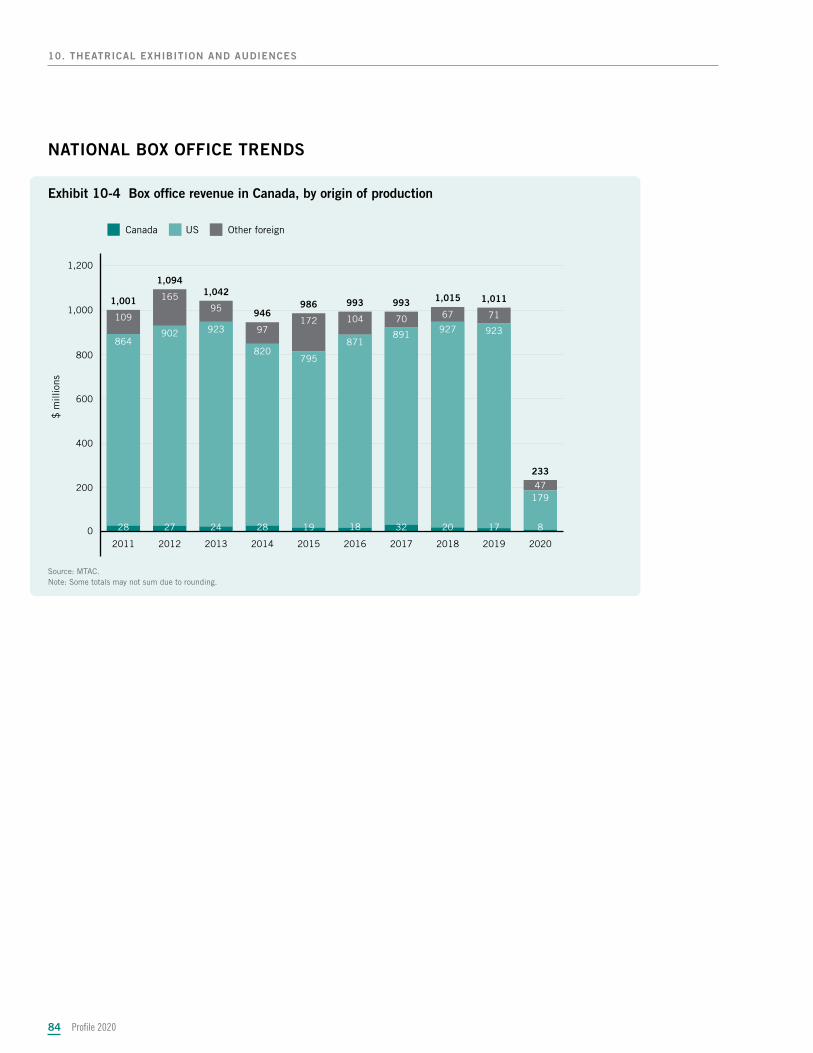
Profile 202084
10. THEATRICAL EXHIBITION AND AUDIENCES
NATIONAL BOX OFFICE TRENDS
Exhibit 10-4 Box office revenue in Canada, by origin of production
0
200
400
600
800
1,000
1,200
47
71677010417297
95165
109
179
923927891871
795820
923902864
8172032181928242728
2020201920182017201620152014201320122011
$ m
illio
ns
Canada US Other foreign
233
1,0111,015993993986946
1,0421,094
1,001
Source: MTAC.Note: Some totals may not sum due to rounding.
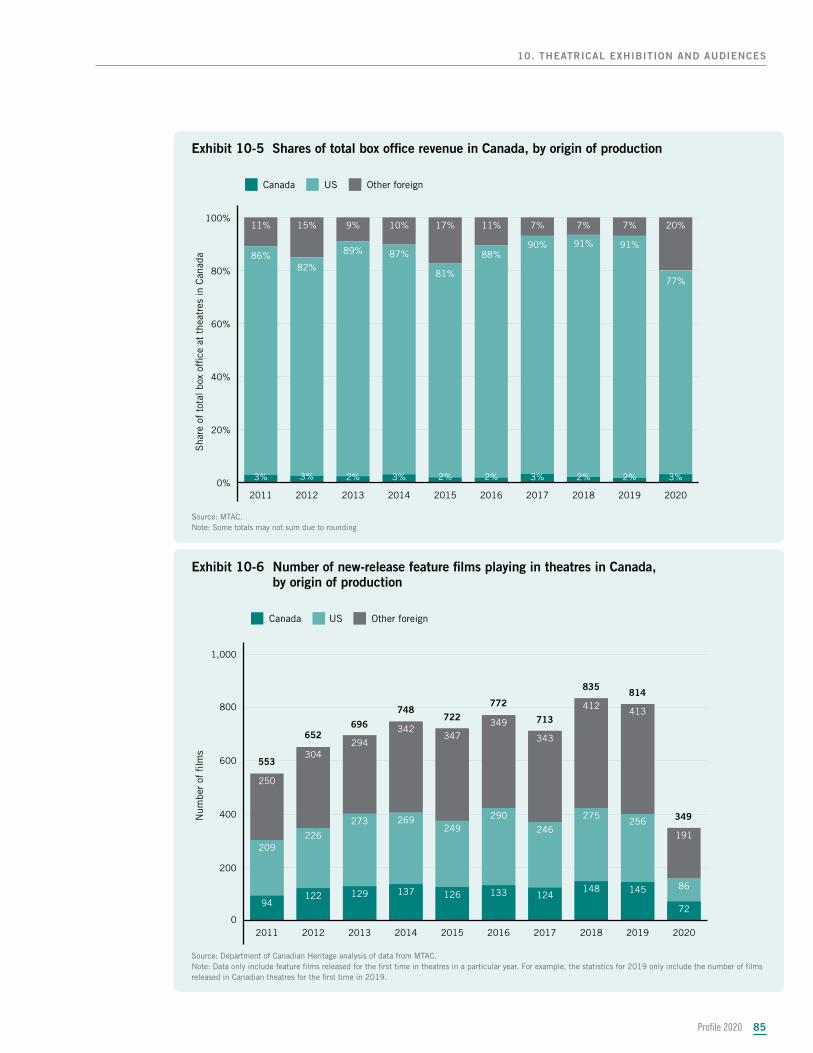
Profile 2020 85
10. THEATRICAL EXHIBITION AND AUDIENCES
Exhibit 10-5 Shares of total box office revenue in Canada, by origin of production
0%
20%
40%
60%
80%
100%20%7%7%7%11%17%10%9%15%11%
77%
91%91%90%88%
81%
87%89%
82%86%
3%2%2%3%2%2%3%2%3%3%
2020201920182017201620152014201320122011
Canada US Other foreignS
hare
of
tota
l box
of�
ce a
t th
eatr
es in
Can
ada
Source: MTAC.Note: Some totals may not sum due to rounding
Exhibit 10-6 Number of new-release feature films playing in theatres in Canada, by origin of production
0
200
400
600
800
1,000
191
413412
343
349347
342
294304
250
86
256275
246
290249
269273
226209
72
145148124133126137129122
94
2020201920182017201620152014201320122011
Num
ber
of �
lms
Canada US Other foreign
814835
713
772722
748
696652
553
349
Source: Department of Canadian Heritage analysis of data from MTAC.Note: Data only include feature films released for the first time in theatres in a particular year. For example, the statistics for 2019 only include the number of films released in Canadian theatres for the first time in 2019.
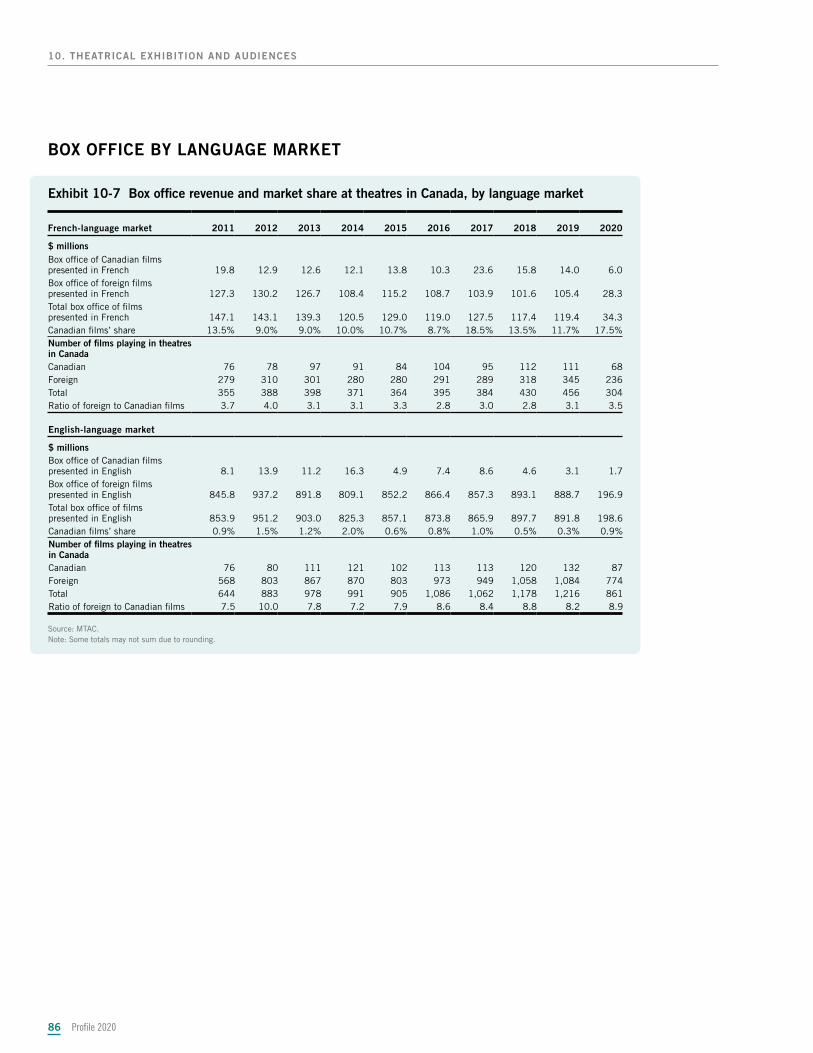
Profile 202086
10. THEATRICAL EXHIBITION AND AUDIENCES
BOX OFFICE BY LANGUAGE MARKET
Exhibit 10-7 Box office revenue and market share at theatres in Canada, by language market
French-language market 2011 2012 2013 2014 2015 2016 2017 2018 2019 2020
$ millionsBox office of Canadian films presented in French 19.8 12.9 12.6 12.1 13.8 10.3 23.6 15.8 14.0 6.0Box office of foreign films presented in French 127.3 130.2 126.7 108.4 115.2 108.7 103.9 101.6 105.4 28.3Total box office of films presented in French 147.1 143.1 139.3 120.5 129.0 119.0 127.5 117.4 119.4 34.3Canadian films’ share 13.5% 9.0% 9.0% 10.0% 10.7% 8.7% 18.5% 13.5% 11.7% 17.5%Number of films playing in theatres in CanadaCanadian 76 78 97 91 84 104 95 112 111 68Foreign 279 310 301 280 280 291 289 318 345 236Total 355 388 398 371 364 395 384 430 456 304Ratio of foreign to Canadian films 3.7 4.0 3.1 3.1 3.3 2.8 3.0 2.8 3.1 3.5
English-language market
$ millionsBox office of Canadian films presented in English 8.1 13.9 11.2 16.3 4.9 7.4 8.6 4.6 3.1 1.7Box office of foreign films presented in English 845.8 937.2 891.8 809.1 852.2 866.4 857.3 893.1 888.7 196.9Total box office of films presented in English 853.9 951.2 903.0 825.3 857.1 873.8 865.9 897.7 891.8 198.6Canadian films’ share 0.9% 1.5% 1.2% 2.0% 0.6% 0.8% 1.0% 0.5% 0.3% 0.9%Number of films playing in theatres in CanadaCanadian 76 80 111 121 102 113 113 120 132 87Foreign 568 803 867 870 803 973 949 1,058 1,084 774Total 644 883 978 991 905 1,086 1,062 1,178 1,216 861Ratio of foreign to Canadian films 7.5 10.0 7.8 7.2 7.9 8.6 8.4 8.8 8.2 8.9
Source: MTAC.Note: Some totals may not sum due to rounding.
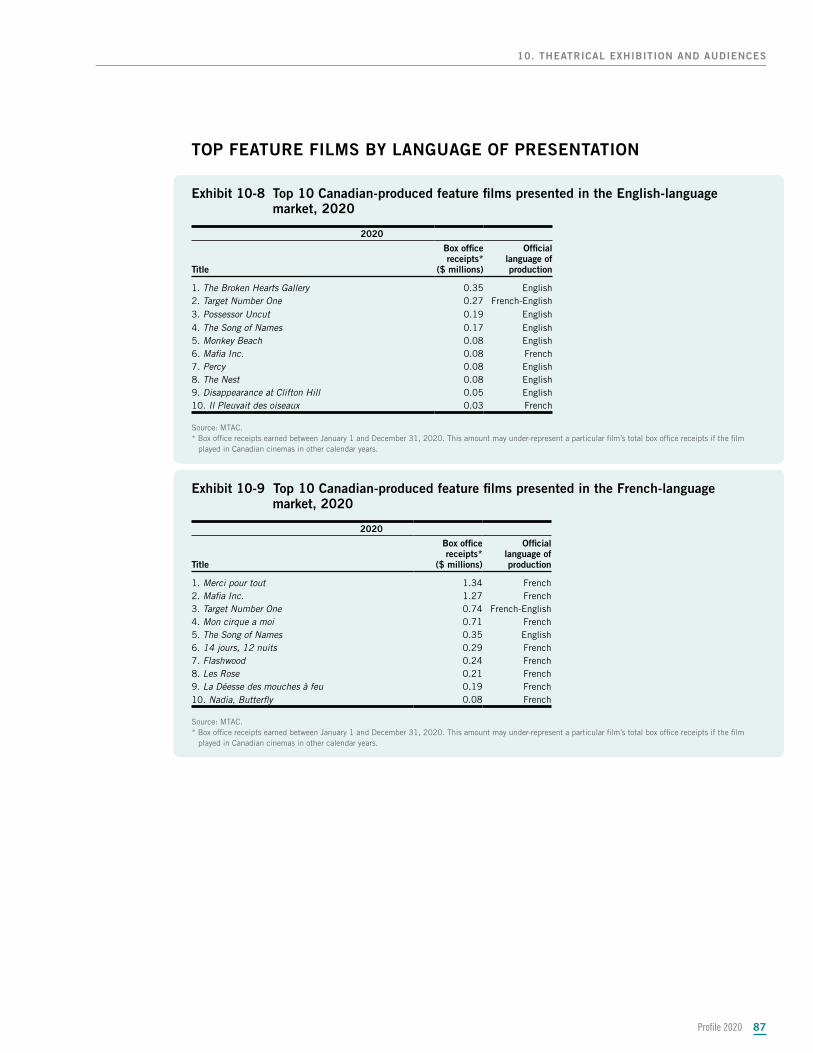
Profile 2020 87
10. THEATRICAL EXHIBITION AND AUDIENCES
TOP FEATURE FILMS BY LANGUAGE OF PRESENTATION
Exhibit 10-8 Top 10 Canadian-produced feature films presented in the English-language market, 2020
2020
Title
Box office receipts*
($ millions)
Official language of production
1. The Broken Hearts Gallery 0.35 English2. Target Number One 0.27 French-English3. Possessor Uncut 0.19 English4. The Song of Names 0.17 English5. Monkey Beach 0.08 English6. Mafia Inc. 0.08 French7. Percy 0.08 English8. The Nest 0.08 English9. Disappearance at Clifton Hill 0.05 English10. Il Pleuvait des oiseaux 0.03 French
Source: MTAC.* Box office receipts earned between January 1 and December 31, 2020. This amount may under-represent a particular film’s total box office receipts if the film
played in Canadian cinemas in other calendar years.
Exhibit 10-9 Top 10 Canadian-produced feature films presented in the French-language market, 2020
2020
Title
Box office receipts*
($ millions)
Official language of production
1. Merci pour tout 1.34 French2. Mafia Inc. 1.27 French3. Target Number One 0.74 French-English4. Mon cirque a moi 0.71 French5. The Song of Names 0.35 English6. 14 jours, 12 nuits 0.29 French7. Flashwood 0.24 French8. Les Rose 0.21 French9. La Déesse des mouches à feu 0.19 French10. Nadia, Butterfly 0.08 French
Source: MTAC.* Box office receipts earned between January 1 and December 31, 2020. This amount may under-represent a particular film’s total box office receipts if the film
played in Canadian cinemas in other calendar years.
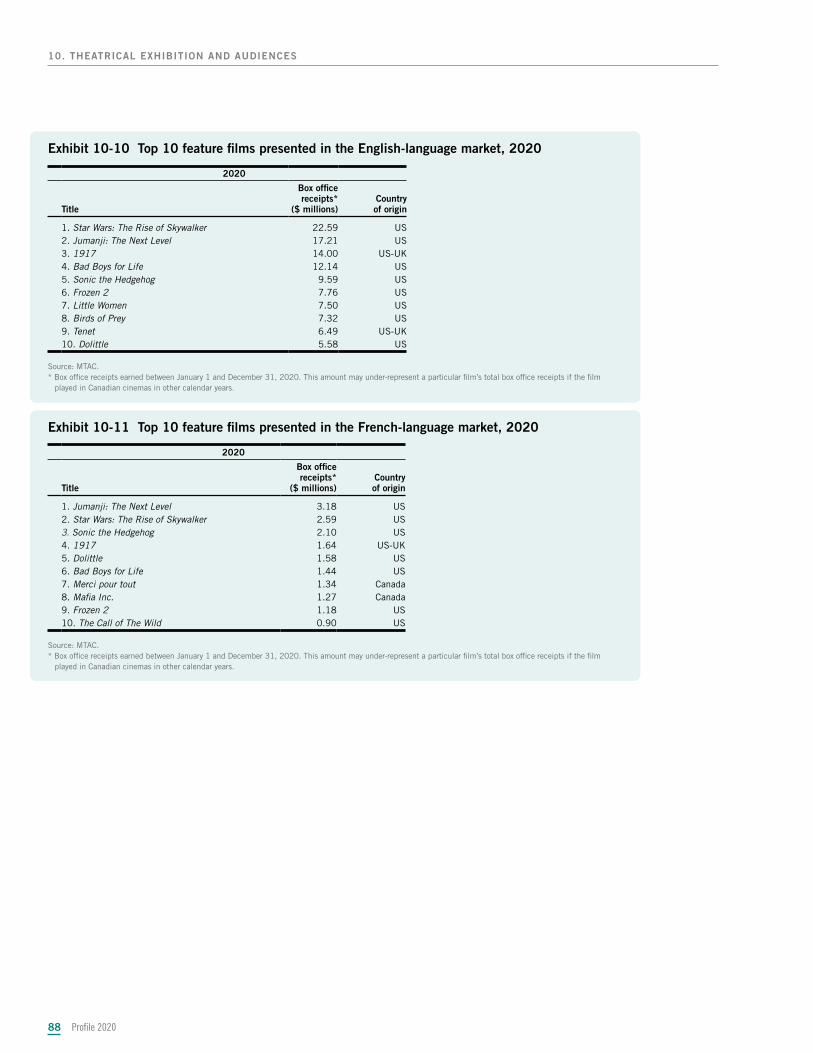
Profile 202088
10. THEATRICAL EXHIBITION AND AUDIENCES
Exhibit 10-10 Top 10 feature films presented in the English-language market, 2020
2020
Title
Box office receipts*
($ millions)Country of origin
1. Star Wars: The Rise of Skywalker 22.59 US2. Jumanji: The Next Level 17.21 US3. 1917 14.00 US-UK4. Bad Boys for Life 12.14 US5. Sonic the Hedgehog 9.59 US6. Frozen 2 7.76 US7. Little Women 7.50 US8. Birds of Prey 7.32 US9. Tenet 6.49 US-UK10. Dolittle 5.58 US
Source: MTAC.* Box office receipts earned between January 1 and December 31, 2020. This amount may under-represent a particular film’s total box office receipts if the film
played in Canadian cinemas in other calendar years.
Exhibit 10-11 Top 10 feature films presented in the French-language market, 2020
2020
Title
Box office receipts*
($ millions)Country of origin
1. Jumanji: The Next Level 3.18 US2. Star Wars: The Rise of Skywalker 2.59 US3. Sonic the Hedgehog 2.10 US4. 1917 1.64 US-UK5. Dolittle 1.58 US6. Bad Boys for Life 1.44 US7. Merci pour tout 1.34 Canada8. Mafia Inc. 1.27 Canada9. Frozen 2 1.18 US10. The Call of The Wild 0.90 US
Source: MTAC.* Box office receipts earned between January 1 and December 31, 2020. This amount may under-represent a particular film’s total box office receipts if the film
played in Canadian cinemas in other calendar years.
Profile 2020 89
Highlights from 2019Highlights from 2019
11. 11. Broadcasting distribution Broadcasting distribution undertakingsundertakingsThe broadcasting distribution sector includes cable, direct-to-home (DTH) satellite and Internet protocol The broadcasting distribution sector includes cable, direct-to-home (DTH) satellite and Internet protocol TV (IPTV) services, which allow Canadian households and businesses to access licensed television TV (IPTV) services, which allow Canadian households and businesses to access licensed television programming services, including conventional, discretionary and on-demand services, by subscribing to programming services, including conventional, discretionary and on-demand services, by subscribing to channel packages and certain à la carte services. Cable, DTH satellite and IPTV services are also referred to channel packages and certain à la carte services. Cable, DTH satellite and IPTV services are also referred to as broadcasting distribution undertakings (BDUs); collectively they comprise the BDU industry.as broadcasting distribution undertakings (BDUs); collectively they comprise the BDU industry.
• IPTV subscribers and revenues increased to 3 million and $2.2 billion, respectively.
• The number of BDU subscribers declined by 2.6% to 10.5 million.
• Lower revenues for cable TV and DTH satellite led to a slight 0.8% decrease in total BDU revenues.
• BDUs’ contributions to the creation of Canadian programming decreased by 1.9% to $407 million.
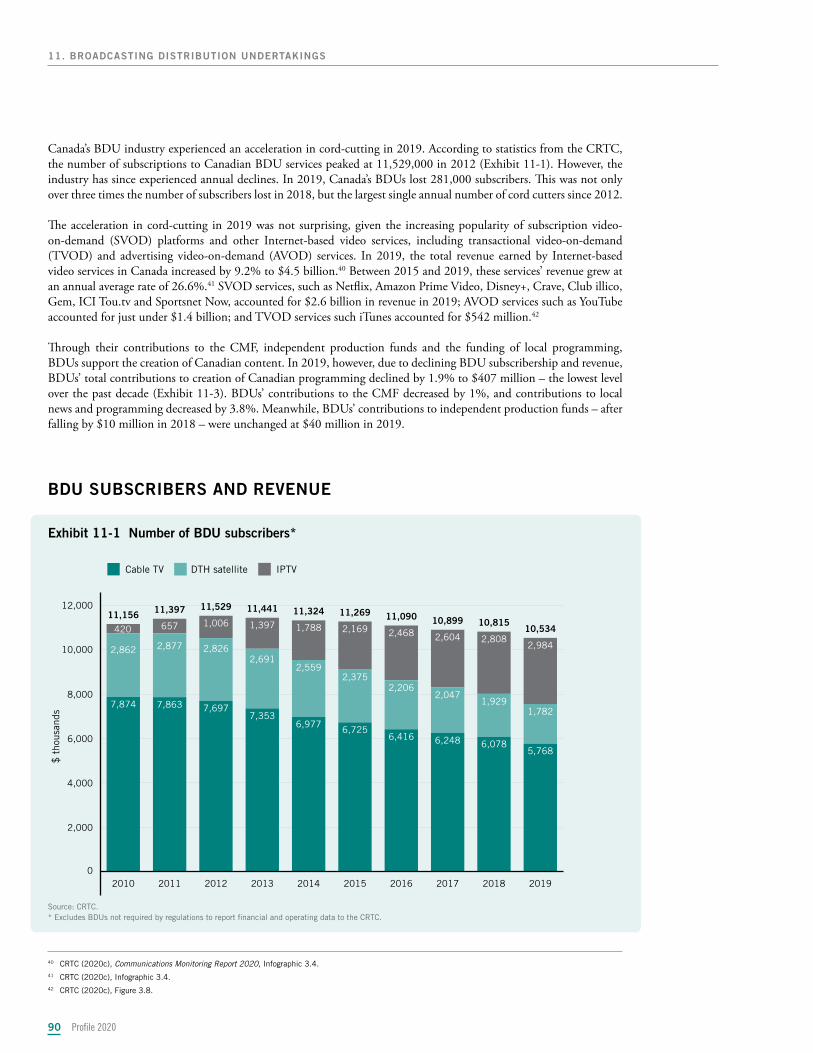
Profile 202090
11. BROADCASTING DISTRIBUTION UNDERTAKINGS
Canada’s BDU industry experienced an acceleration in cord-cutting in 2019. According to statistics from the CRTC, the number of subscriptions to Canadian BDU services peaked at 11,529,000 in 2012 (Exhibit 11-1). However, the industry has since experienced annual declines. In 2019, Canada’s BDUs lost 281,000 subscribers. This was not only over three times the number of subscribers lost in 2018, but the largest single annual number of cord cutters since 2012.
The acceleration in cord-cutting in 2019 was not surprising, given the increasing popularity of subscription video-on-demand (SVOD) platforms and other Internet-based video services, including transactional video-on-demand (TVOD) and advertising video-on-demand (AVOD) services. In 2019, the total revenue earned by Internet-based video services in Canada increased by 9.2% to $4.5 billion.40 Between 2015 and 2019, these services’ revenue grew at an annual average rate of 26.6%.41 SVOD services, such as Netflix, Amazon Prime Video, Disney+, Crave, Club illico, Gem, ICI Tou.tv and Sportsnet Now, accounted for $2.6 billion in revenue in 2019; AVOD services such as YouTube accounted for just under $1.4 billion; and TVOD services such iTunes accounted for $542 million.42
Through their contributions to the CMF, independent production funds and the funding of local programming, BDUs support the creation of Canadian content. In 2019, however, due to declining BDU subscribership and revenue, BDUs’ total contributions to creation of Canadian programming declined by 1.9% to $407 million – the lowest level over the past decade (Exhibit 11-3). BDUs’ contributions to the CMF decreased by 1%, and contributions to local news and programming decreased by 3.8%. Meanwhile, BDUs’ contributions to independent production funds – after falling by $10 million in 2018 – were unchanged at $40 million in 2019.
BDU SUBSCRIBERS AND REVENUE
Exhibit 11-1 Number of BDU subscribers*
0
2,000
4,000
6,000
8,000
10,000
12,000
2,9842,8082,6042,4682,1691,7881,3971,006657
1,7821,929
2,0472,206
2,3752,559
2,6912,8262,8772,862
5,7686,0786,2486,416
6,7256,977
7,3537,6977,8637,874
2019201820172016201520142013201220112010
$ t
hous
ands
Cable TV DTH satellite IPTV
420 10,53410,81510,89911,09011,26911,32411,44111,52911,39711,156
Source: CRTC.* Excludes BDUs not required by regulations to report financial and operating data to the CRTC.
40 CRTC (2020c), Communications Monitoring Report 2020, Infographic 3.4.41 CRTC (2020c), Infographic 3.4.42 CRTC (2020c), Figure 3.8.
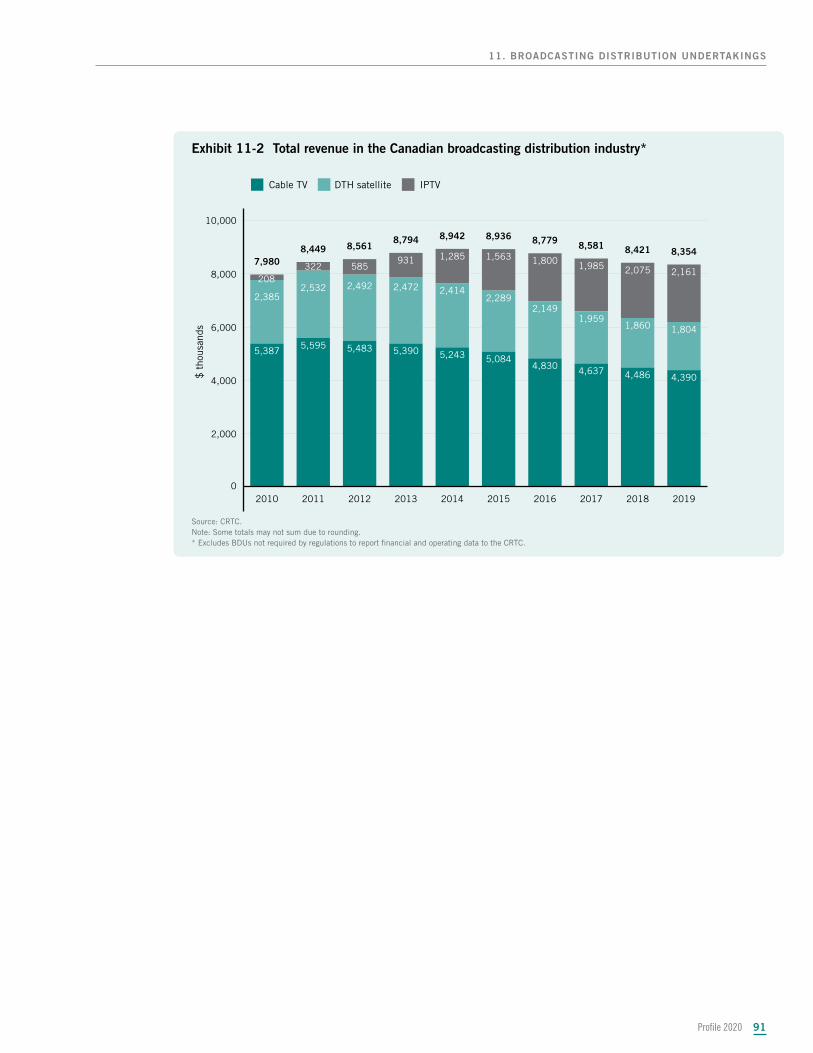
Profile 2020 91
11. BROADCASTING DISTRIBUTION UNDERTAKINGS
Exhibit 11-2 Total revenue in the Canadian broadcasting distribution industry*
0
2,000
4,000
6,000
8,000
10,000
2,1612,0751,9851,8001,5631,285931585
1,8041,8601,959
2,1492,289
2,4142,4722,4922,5322,385
4,3904,4864,6374,8305,0845,2435,3905,4835,595
5,387
2019201820172016201520142013201220112010
$ t
hous
ands
Cable TV DTH satellite IPTV
208322
8,3548,4218,5818,7798,9368,9428,7948,5618,449
7,980
Source: CRTC.Note: Some totals may not sum due to rounding.* Excludes BDUs not required by regulations to report financial and operating data to the CRTC.
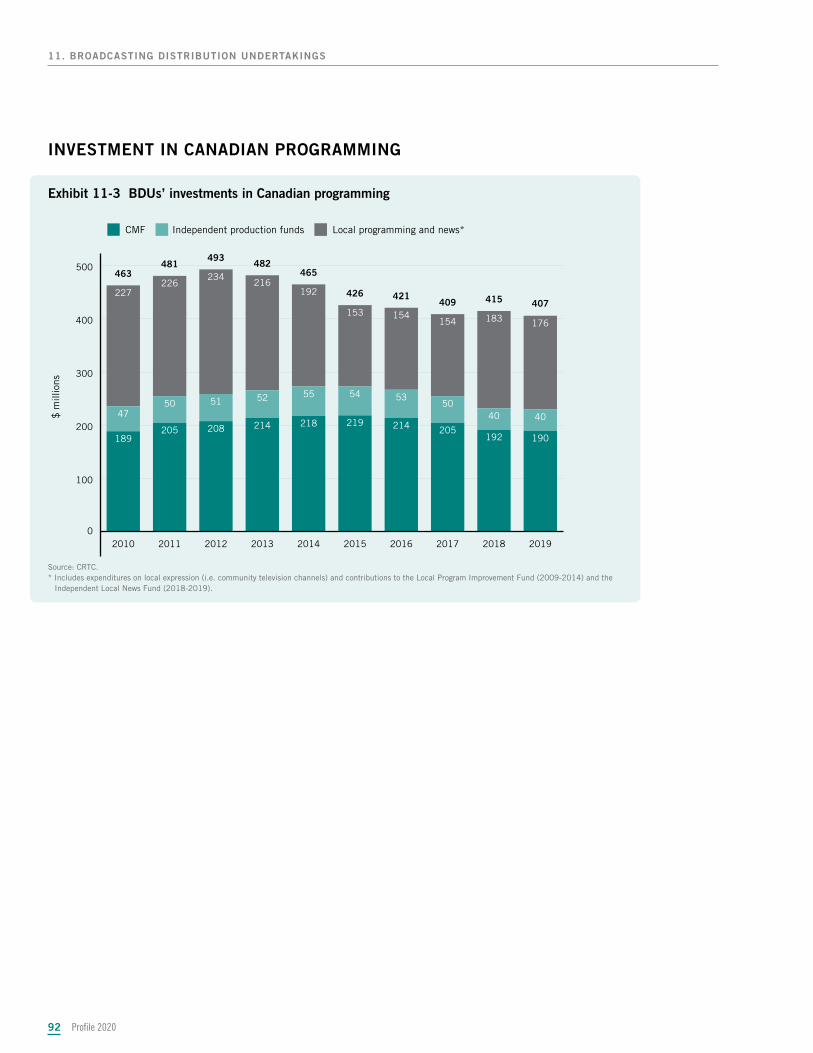
Profile 202092
11. BROADCASTING DISTRIBUTION UNDERTAKINGS
INVESTMENT IN CANADIAN PROGRAMMING
Exhibit 11-3 BDUs’ investments in Canadian programming
0
100
200
300
400
500
176183154154153
192216
234226
227
404050
53545552515047
190192205214219218214208205
189
2019201820172016201520142013201220112010
$ m
illio
ns
CMF Independent production funds Local programming and news*
407415409421426
465482
493481
463
Source: CRTC.* Includes expenditures on local expression (i.e. community television channels) and contributions to the Local Program Improvement Fund (2009-2014) and the
Independent Local News Fund (2018-2019).
Profile 2020 93
Notes on MethodologyNotes on Methodology
Estimates of Canadian production
The estimates of Canadian production are based on data from the Canadian Audio-Visual Certification Office (CAVCO) of the Department of Canadian Heritage. In order to account for the fact that there is a 42-month window in which producers may submit their application to CAVCO,43 Nordicity applied the following gross-up factors to the raw production data supplied by CAVCO:
• 2017/18: 2.9%
• 2018/19: 5.4%
• 2019/20: 11.0%
These rates were based on historical rates of under-coverage observed in the CAVCO statistics over the past decade, with particular weight given to the rates of under-coverage observed in recent years.
Revisions to historical statistics
Due to the 42-month application lag at CAVCO, it is possible that the data from CAVCO may not provide a comprehensive indication of production volume until up to four years after the end of a particular fiscal year. As a result, the Canadian production statistics reported in Profile 2020 for the previous three years (2016/17, 2017/18 and 2018/19) have been revised to reflect all currently available data from CAVCO.
Estimates of CRTC-certified Canadian television production
The estimates of Canadian television production include an estimate of CRTC-certified television production (i.e. television production exclusively certified by the CRTC). Research conducted by Nordicity and the Department of Canadian Heritage in 2009 indicated that CRTC-certified television production accounted for an estimated 13.5% of total Canadian production. This rate was used in Profile 2020 to estimate the total volume of CRTC-certified production.
Short films
Short films include films under 75 minutes in length. In Profile 2012 and earlier editions, data for theatrical short films was included in the overall statistics for Canadian theatrical production. Beginning in Profile 2013, data for theatrical short films was included in the statistics for Canadian television production. In Profile 2020, data for theatrical short films has been included in Canadian television production for all years – 2010/11 through 2019/20.
Although the definition of theatrical short films would imply that they should be included in the Canadian theatrical production statistics, by removing them, we can better isolate data on theatrical feature films. Furthermore, we note that the low volume of theatrical short film production reported in earlier editions of Profile suggests that applicants had in fact reported many theatrical short films in the Canadian television production category.
43 The Income Tax Act allows producers to submit their CPTC application to CAVCO up to 42 months after the end of the fiscal year in which principal photography started.
Profile 202094
NOTES ON METHODOLOGY
Canada Media Fund
The statistics reported for the CMF include data for Convergent Stream production supported by the CMF starting in 2010/11.
Broadcaster in-house production
A complete set of provincial statistics was not available for private broadcaster in-house production in the Prairie Provinces and Atlantic Canada. For the Prairie Provinces, Nordicity developed estimates based on the historical shares observed in the CRTC statistics prior to 2001 – before the CRTC began to suppress the provincial statistics. The breakdown of private broadcaster in-house production among the provinces in Atlantic Canada was also based on the development of estimates. Because no historical data existed, each province’s share of Atlantic Canada’s total gross domestic product (GDP) was used as the proxy variable for the estimate.
Reconciliation with statistics published by provincial funding agencies
Certain provincial funding agencies in Canada also publish statistics for film and television production activity within their provinces. The statistics published by the provincial funding agencies may differ from those in Profile 2020 for a variety of reasons:
• Some provincial funding agencies publish production statistics on a calendar-year basis rather than on a fiscal-year basis, as they are reported in Profile.
• Some provincial funding agencies report production activity on the basis of the fiscal year in which a film or television project receives approval for its tax credit application rather than the year in which the project’s principal photography starts (i.e. the practice used by CAVCO).
• Statistics reported by provincial funding agencies exclude broadcaster in-house production.
• Provincial funding agencies typically report production activity on the basis of the province in which the film or television project occurred, whereas the statistics in Profile are reported on the basis of the province in which the producer of the project is based (i.e. the practice used by CAVCO).
Foreign investment in production
Foreign investment in production (FIIP) tracks the value of international financial participation in the film and television production industry in Canada. FIIP includes foreign presales and distribution advances for all projects certified by CAVCO; estimates of presales and distribution advances for non-CAVCO-certified productions; and the total value of foreign location and service (FLS) production in Canada. FIIP as opposed to just exports better reflects the nature of film and television production in Canada. It acknowledges that film and television productions are intangible products and portions of the copyright can be exported to foreign countries. It also accounts for the budgets of productions shot in Canada, even when the copyright is held by a foreign entity.
The data used to estimate FIIP only includes the financing of the Canadian budget of treaty coproductions. As a result, the foreign budgets for treaty coproductions do not directly contribute to FIIP. Treaty coproductions contribute only to FIIP if the financing of the Canadian budget includes a foreign presale or distribution advance.
Estimation of person-count employment
To estimate the number of people employed in film and TV production (i.e. direct employment) as well as the spin-off employment generated by film and TV production, Nordicity developed multipliers for converting the number of full-time equivalents (FTEs) into headcount. See below for description of the methodology for estimating FTEs.
For direct employment, these multipliers were developed based on research of aggregate wages, days worked, and the number of people currently registered with unions and guilds to work in film and TV production in Canada. Separate multipliers were calculated for each type of production and reflect the composition of the labour force by department.
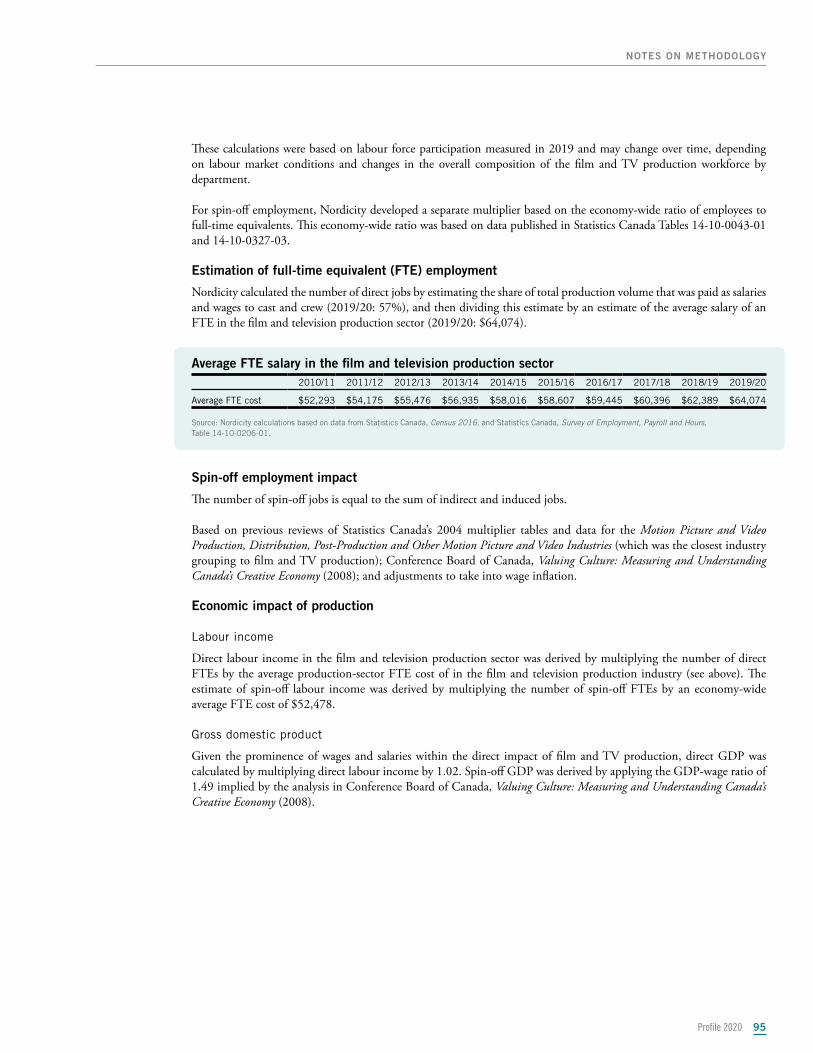
Profile 2020 95
NOTES ON METHODOLOGY
These calculations were based on labour force participation measured in 2019 and may change over time, depending on labour market conditions and changes in the overall composition of the film and TV production workforce by department.
For spin-off employment, Nordicity developed a separate multiplier based on the economy-wide ratio of employees to full-time equivalents. This economy-wide ratio was based on data published in Statistics Canada Tables 14-10-0043-01 and 14-10-0327-03.
Estimation of full-time equivalent (FTE) employment
Nordicity calculated the number of direct jobs by estimating the share of total production volume that was paid as salaries and wages to cast and crew (2019/20: 57%), and then dividing this estimate by an estimate of the average salary of an FTE in the film and television production sector (2019/20: $64,074).
Average FTE salary in the film and television production sector2010/11 2011/12 2012/13 2013/14 2014/15 2015/16 2016/17 2017/18 2018/19 2019/20
Average FTE cost $52,293 $54,175 $55,476 $56,935 $58,016 $58,607 $59,445 $60,396 $62,389 $64,074
Source: Nordicity calculations based on data from Statistics Canada, Census 2016, and Statistics Canada, Survey of Employment, Payroll and Hours, Table 14-10-0206-01.
Spin-off employment impact
The number of spin-off jobs is equal to the sum of indirect and induced jobs.
Based on previous reviews of Statistics Canada’s 2004 multiplier tables and data for the Motion Picture and Video Production, Distribution, Post-Production and Other Motion Picture and Video Industries (which was the closest industry grouping to film and TV production); Conference Board of Canada, Valuing Culture: Measuring and Understanding Canada’s Creative Economy (2008); and adjustments to take into wage inflation.
Economic impact of production
Labour income
Direct labour income in the film and television production sector was derived by multiplying the number of direct FTEs by the average production-sector FTE cost of in the film and television production industry (see above). The estimate of spin-off labour income was derived by multiplying the number of spin-off FTEs by an economy-wide average FTE cost of $52,478. Gross domestic product
Given the prominence of wages and salaries within the direct impact of film and TV production, direct GDP was calculated by multiplying direct labour income by 1.02. Spin-off GDP was derived by applying the GDP-wage ratio of 1.49 implied by the analysis in Conference Board of Canada, Valuing Culture: Measuring and Understanding Canada’s Creative Economy (2008).
Profile 202096
Advertising video-on-demand (AVOD) An Internet-based service that gives consumers free access to video content in exchange for being exposed to advertising (e.g. YouTube).
Average minute audience (AMA) The average number of persons watching a television program during any 60-second portion of that program.
Broadcaster in-house production Refers to television programs made internally by broadcasters. It largely consists of news and sports programming, but can also include production in other genres.
Broadcasting distribution undertakings (BDUs) Includes cable, direct-to-home (DTH) satellite multipoint distribution services (MDS) and Internet protocol TV (IPTV) services that allow Canadian households and businesses to access licensed television programming services, including conventional television, discretionary television services and on-demand television services, by subscribing to channel packages and certain à la carte services.
Canada Media Fund (CMF) Funded by the Government of Canada, and cable, DTH satellite and IPTV service providers, with a mandate to support the creation of Canadian convergent digital content across multiple platforms, including television and leading-edge new media applications, as well as experimental content applications or software for the Internet, wireless and other emerging digital platforms. Launched on April 1, 2010.
Canadian Audio-Visual Certification Office (CAVCO) The section within the Department of Canadian Heritage that co-administers (with the Canada Revenue Agency) the two federal tax credit programs (Canadian Film or Video Production Tax Credit [CPTC] and Film or Video Production Services Tax Credit [PSTC]). As part of this role, it is responsible for assessing television programs and films against its content-points scale (in conjunction with other eligibility criteria) to determine if a film or television program is eligible to access the CPTC and thereby can also access other funding mechanisms available through Telefilm Canada or the CMF.
GlossaryGlossary
97Profile 2020
GLOSSARY
Canadian Film or Video Production Tax Credit (CPTC) The federal government tax credit program for supporting the production of films and television programs that qualify as Canadian content. The CPTC provides a tax credit equal to 25% of a production’s qualified labour expenditures.Qualified labour expenditures are capped at 60% of a production’s total costs, net of any assistance received.
Canadian Radio-television and Telecommunication Commission (CRTC)
Canada’s regulator of the broadcasting and telecommunications sectors.
Conventional television / Conventional TV Includes private and public broadcasters that maintain over-the-air (OTA) infrastructure to broadcast to households, although the vast majority of Canadian households now receive conventional television signals via cable, DTH satellite television or IPTV providers.
Convergent Stream A funding stream of the CMF that provides financial support to the production of digital media components that are related to CMF-funded television productions in order to provide content on different digital media platforms.
Coproduction A film or television program made by producers from two or more countries and typically shot in those producers’ countries. Coproductions are often made in accordance with international treaties to ensure that they receive national treatment in each producer’s country (“audiovisual treaty coproductions”). Note that this report only includes statistics for audiovisual treaty coproductions.
Direct-to-home (DTH) satellite A BDU service under which households and businesses utilize a small aperture satellite antenna to receive television signals.
Discretionary services Refers to television services that are only available via cable, DTH satellite and IPTV service providers, and typically provide sports, 24-hour news, movies, arts and other thematic programming. Discretionary services earn revenue from a combination of subscription fees and advertising. They may also be referred to as specialty television or pay television services.
Educational broadcasters Refers to the four television broadcasting licensees controlled by provincial governments, which focus on the provision of educational programming. The four educational broadcasters include TéléQuébec, TVO, Knowledge Network (BC) and Groupe Média TFO.
Experimental Stream A funding stream of the CMF that provides financial support to the production of interactive digital media content, software applications and web series that are unrelated to CMF-funded television productions.
Profile 202098
GLOSSARY
Film or Video Production Services Tax Credit (PSTC) The federal government tax credit program for supporting the production of films and television programs that do not qualify as Canadian content. The PSTC provides a tax credit equal to 16% of a production’s qualified Canadian labour expenditures, net of any assistance received.
Foreign investment in production (FIIP) A measurement of the value of international financial participation in the film and television production sector in Canada. It includes foreign presales and distribution advances for all projects certified by CAVCO; estimates of presales and distribution advances for non-CAVCO-certified productions; and the total value of foreign location and service (FLS) production in Canada.
Foreign location and service (FLS) Includes feature films and television programs filmed in Canada primarily by foreign producers. It also includes the visual effects (VFX) work done by Canadian VFX studios for foreign films and television programs.
Full-time equivalents (FTEs) A measurement of employment that converts the number of part-time workers or any workers working less than a full work year into the equivalent number of full-time workers.
Gross domestic product (GDP) Refers to the monetary value of the unduplicated value- added generated by an industry or economy. The difference between the value of an industry’s output and the value of the inputs it consumes from other industries.
Internet-based television servicesor Internet-based video services
Includes SVOD, AVOD and TVOD services.
Internet protocol TV (IPTV) A BDU service that is supplied to households and businesses through a broadband connection.
Multipoint distribution systems (MDS) A fixed wireless broadcast communications system that uses microwave antennae to transmit broadcast signals point-to-multipoint basis.
On-demand services On-demand services permit consumers to watch specific films or television programs whenever they want, rather than at a scheduled time (i.e. linear television). On-demand services can be offered over BDU platforms (e.g. cable-TV or DTH satellite) or over the Internet.
Pay television / Pay TV Pay television services are available via cable or satellite television services. They typically feature premium programming such as recently released films and do not earn revenue from advertising; instead, they rely on subscription or transactional payments.
99Profile 2020
GLOSSARY
Specialty television / Specialty TV Specialty television services are only available via cable or satellite television providers and typically provide sports, 24-hour news, movies, arts and other thematic programming. Specialty television services earn revenue from a combination of subscription fees and advertising.
Spin-off impact Refers to the sum of the indirect and induced economic impacts. The indirect impact includes the employment and GDP generated within industries that supply goods and services to the production sector. The induced impact includes the employment and GDP generated in consumer industries within the Canadian economy that benefit from the re-spending of wages earned by production sector cast and crew, and the workers employed in the supplier industries.
Subscription video-on-demand (SVOD) A television service whereby consumers pay a monthly subscription fee so that they can choose which specific films or television programs to watch and when to watch them (e.g. Netflix, Crave, Club illico, Amazon Prime Video, Hulu, NFL Game Pass). Consumers typically access SVOD services over the Internet.
Telefilm Canada A Crown corporation established by the Government of Canada in 1968 with a mandate to invest in the production of Canadian films. Telefilm Canada now administers most of the federal government’s programs for supporting the Canadian film industry. It also administers Canada’s treaty coproduction agreements on behalf of the federal government, and the funding programs of the CMF.
Transactional video-on-demand (TVOD) An online service whereby consumers can pay a fee to download a specific film or television program (e.g. Apple iTunes). In some cases, TVOD can be used to rent a film or television program, where use of the download is restricted to a period of time.
Video-on-demand (VOD) A television service whereby consumers can pay a fee to choose specific films or television programs to watch, and when to watch them. In Canada, VOD is typically offered over BDU platforms (i.e. cable-TV, IPTV or DTH satellite).