Embed Size (px)
Citation preview
46
CM
PA T
echn
ical
Rep
ort S
erie
s
Hydrology Study and Climate Change Vulnerability Assessment to inform
Management Planning of Khijadiya Wildlife Sanctuary
in Gujarat
August 2017
Indo-German Biodiversity ProgrammeConservation and Sustainable Management of Coastal and Marine Protected Areas
GEER Foundation
CMPA Technical Report Series No. 46Hydrology Study and Climate Change Vulnerability Assessment to inform Man-agement Planning of Khijadiya Wildlife Sanctuary in Gujarat
AuthorsDr. YRS Rao, National Institute of HydrologyDr. Suhas Khobragade, National Institute of HydrologyDr. Sandeep Sahany, Assistant Professor, IIT Delhi & Director, Brownbag Corporate & Social Sustainability Private LimitedDr. Saroj Mishra, Assistant Professor, IIT Delhi & Director, Brownbag Corporate & Social Sustainability Private LimitedMr. Manpreet Singh, KPMGMs. Tanima Singh, KPMGMr. Sandip Keswani, KPMG
Published byDeutsche Gesellschaft für Internationale Zusammenarbeit (GIZ) GmbHIndo-German Biodiversity Programme (IGBP),GIZ-India, A-2/18, Safdarjung Enclave,New Delhi - 110029, IndiaE-Mail: [email protected]: www.giz.de
August 2017
ResponsibleDirector, Indo-German Biodiversity Programme
Photo CreditDr. Neeraj Khera
LayoutAspire Design, Delhi
DisclaimerThe views expressed in this document are solely those of the authors and may not in anycircumstances be regarded as stating an official position of the Ministry of Environment,Forest and Climate Change (MoEFCC), Government of India, of the German FederalMinistry for the Environment, Nature Conservation, Building and Nuclear Safety (BMUB)or the Deutsche Gesellschaft für Internationale Zusammenarbeit (GIZ) GmbH. Thedesignation of geographical entities and presentation of material in this document donot imply the expression or opinion whatsoever on the part of MoEFCC, BMUB or GIZconcerning the legal or development status of any country, territory, city or area or ofits authorities or concerning the delimitation of its frontiers or boundaries. Referenceherein to any specific organisation, consulting firm, service provider or process followeddoes not necessarily constitute or imply its endorsement, recommendation or favouringby MoEFCC, BMUB or GIZ.
CitationYRS Rao, Suhas Khobragade, Sandeep Sahany, Saroj Mishra, Manpreet Singh, Tanima Singh, Sandip Keswani (2017). Hydrology Study and Climate Change Vulnerability Assessment to inform Management Planning of Khijadiya Wildlife Sanctuary in Gujarat. CMPA Technical Series No. 46. Indo German Biodiversity Programme, GIZ India, New Delhi. pp 80.
Hydrology Study and Climate Change Vulnerability Assessment to inform Management Planning of Khijadiya Wildlife Sanctuary in
Gujarat
CMPA Technical Report Series
Indo-German Biodiversity Programme Conservation and Sustainable Management of Coastal and Marine Protected Areas
46
August 2017
AuthorsDr. YRS Rao, National Institute of Hydrology
Dr. Suhas Khobragade, National Institute of HydrologyDr. Sandeep Sahany, Assistant Professor, IIT Delhi & Director, Brownbag Corporate & Social Sustainability Private Limited
Dr. Saroj Mishra, Assistant Professor, IIT Delhi & Director, Brownbag Corporate & Social Sustainability Private Limited
Mr. Manpreet Singh, KPMGMs. Tanima Singh, KPMG
Mr. Sandip Keswani, KPMG

Table of contents
EXECUTIVE SUMMARY 5
1. BACKGROUND 8
1.1 Objective and scope 9
1.2 Overview of Khijadiya Bird Sanctuary 10
2. HYDROLOGICAL ASSESSMENT 11
2.1 Hydrological characterisation of the wetland 11
2.2 Climate 12
2.3 Assessment of water quality profiles 15
2.4 Run-off modelling 16
2.5 Water balance of Khijadiya 17
2.6 Recommendations for improving water retention in the wetland 26
3. CLIMATE RISKS AND VULNERABILITY 28
3.1 Key climate change issues and influencing factors 28
3.2 Approach to assessing climate vulnerability 29
3.3 Climate change assessment, projections and vulnerability of Khijadiya Bird Sanctuary
31
3.3.1 Temperature characteristics over the Khijadiya wetland in the current climate 32
3.3.2 Temperature characteristics over the Khijadiya wetland under global warming 34
3.3.3 Rainfall characteristics over the Khijadiya wetland in the current climate 35
3.3.4 Rainfall characteristics over the Khijadiya wetland under global warming 36
3.3.5 Sea level rise projections for the coastlines neigbouring Khijadiya Bird Sanctuary 37
3.4 Impacts of climate change on hydrology of Khijadiya Bird Sanctuary 39
3.5 Impacts of climate change on biodiversity of the wetland 46
3.6 Recommendations for improving adaptive capacity of Khijadiya Bird Sanctuary 51
4. CARBON SEQUESTRATION ASSESSMENT 56
4.1 Carbon fluxes in Khijadiya 57
4.1.1 Carbon flux influencers in Khijadiya 58
4.2 Assessing carbon sequestration potential of Khijadiya 61
4.3 Potential to increase carbon sequestration of Khijadiya 63
ANNEXURE 1: CARBON SEQUESTRATION 65
ANNEXURE 2: FIELD VISITS 67
REFERENCES 70
List of tables
Table 1 Physical, Chemical and Trace Metal analysis of water samples collected from site in
March 2017 ......................................................................................................................... 16
Table 2 Measured monthly rainfall in mm for the water year 2014–15 ................................. 18
Table 3 Various combinations of wetland storage capacity ................................................. 20
Table 4 Computed wetland inflows for the water year 2014–15 .......................................... 21
Table 5 Average daily evaporation from wetland (2011–16) ................................................ 22
Table 6 Average evaporation rate for the year 2014–15 ...................................................... 23
Table 7 Evapaoration across the year ................................................................................. 24
Table 8 Projected temperature and rainfall changes in Khijadiya wetland, 2016–36 ........... 37
Table 9 Projected temperature and rainfall changes in Khijadiya catchment, 2016–36 ....... 37
Table 10 Historical SLR trends over Mumbai, Kochi, Visakhapatnam and Diamond Harbour
........................................................................................................................................... 38
Table 11 Sea level rise projections near Khijadiya wetland, 2020–35 ................................. 39
Table 12 Sea level rise and estimated losses in wetland cover in Gujarat ........................... 39
Table 13 Expected evaporation characteristics of different projected years ........................ 44
Table 14 Month-wise expected average change in evaporation for different projected years
........................................................................................................................................... 44
Table 15 Expected average evaporation for the Khijadiya wetland for the period 2016–35 . 45
Table 16 Sub-habitat driven carbon flux in Khijadiya (Source: Nagar, 2016 and KPMG
analysis).............................................................................................................................. 60
Table 17 Carbon sequestration potential for mangrove sub-habitat in Khijadiya.................. 65
Table 18 Carbon sequestration potential for land vegetation sub-habitat in Khijadiya ......... 66
List of figures Figure 1 Location of Khijadiyawetland, its effective and total catchment area ..................... 11
Figure 2 Sub-watershed delineation and location of Full Climatic Station (FCS) ................. 12
Figure 3 Observed average rainfall and pan evaporation (2011–16) nearby study area ...... 13
Figure 4 Map of Khijadiya wetland and bird sanctuary (Source: Zoological Survey of India,
2013) .................................................................................................................................. 14
Figure 5 Synoptic view of the satellite image (IRS LISS III) of Khijadiya wetland catchment
area, 23-02-2012 ................................................................................................................ 15
Figure 6 Location of water samples collected within the wetland in the month of March 2017
........................................................................................................................................... 16
Figure 7 Relation between annual rainfallrun-off from Jamnagar district (1991–2010) ........ 17
Figure 8 Seasonal wetland and water balance components ................................................ 19
Figure 9 Cross-section of a hypothetical wetland ................................................................ 19
Figure 10 Computed daily wetland evaporation rate ........................................................... 22
Figure 11 Wetland water spread area and capacity at different depths of the wetland ........ 24
Figure 12 Examples of temporary silt traps .................................................................... 27
Figure 14 Potential impacts of climate change on coastal wetlands .................................... 29
Figure 15 Approach to climate risk and vulnerablity assessment ........................................ 30
Figure 16 Atmospheric CO2-equivalent concentrations (ppmv) of all forcing agents in RCP
Scenarios (IPCC AR5) ........................................................................................................ 31
Figure 17 Climatological mean 2m air temperature (degree C) over the Khijadiya wetland
region (marked by a star) from ERA-Interim reanalysis dataset for the period 1979–2016 for
individual months ................................................................................................................ 32
Figure 18 Observed trend in the mean 2m air temperature (degree C per 38 years) over the
Khijadiya wetland region (marked by a star) from ERA-Interim reanalysis dataset for the
period 1979–2016 for individual months .............................................................................. 33
Figure 19 Projected change in 2m-air temperature (degree C) over the Khijadiya wetland
region (marked by a star) under the RCP8.5 global warming scenario for the near-term
(2016–36) for individual months as compared to the baseline period of 1985–2005 ........... 34
Figure 20 Climatological mean rainfall (mm/day) over the Khijadiya wetland region (marked
by a star) from TRMM satellite retrievals for the period 1998–2014 for individual months ... 35
Figure 21 Projected change in rainfall over the Khijadiya wetland complex region (marked by
a star) under the RCP8.5 global warming scenario in the near-term (2016–36) as compared
to the baseline period of 1985–2005 ................................................................................... 36
Figure 22 Projected annual rainfall of Khijadiya wetland for 2016–36 .................................. 40
Figure 23 Projected temperature of Khijadiya wetland for 2016–36 ..................................... 41
Figure 24 Observed versus projected mean temperature data for year 2016 ...................... 42
Figure 25 Comparison of projected evaporation rates of 2020 with the evaporation rates of
2016 for Khijadiya wetland .................................................................................................. 43
Figure 26 Comparison of projected evaporation rates of 2025 with the evaporation rates of
2016 for Khijadiya wetland .................................................................................................. 43
Figure 27 Comparison of projected evaporation rates of 2035 with the evaporation rates of
2016 for Khijadiya wetland .................................................................................................. 43
Figure 28 Illustration of a typical wetland food web. It consists of detritus (the decomposing
cordgrass), nutrients produced by primary producers (algae, codgrass, diatoms) and a range
of consumers (zooplankton, cricket, fish, frog, snake and birds) ......................................... 47
Figure 29 Dietary behaviours of the terrestrial birds in Khijadiya Bird Sanctuary. ................ 48

Figure 30 Carbon cycle for wetlands (Kayranli Birol, 2010) ................................................. 57
Figure 31 Khijadiya Wetland Habitat Map – Wet season 2015, (Nagar, 2016) .................... 59
Figure 32 Khijadiya Wetland Habitat Map – Dry Season 2016, (Nagar, 2016) .................... 59
Figure 33 Indicative Water level, Carbon Capture, Carbon Removal processes .................. 61
Figure 34 Indicative Productivity and aerobic Decomposition Rate variance and differential.
........................................................................................................................................... 62
Executive Summary Wetlands are crucial ecosystems, and human activity induced stressors have induced large amounts
of pressures on these ecosystems. The objective of this report is to assess the hydrological regime and
effects of climate change on Khijadiya Bird Sanctuary in Jamnagar district of Gujarat, and explore
potential solutions for their informed management planning. The carbon sequestration potential of the
wetland was also assessed.
Khijadiya Bird Sanctuary (KBS) is located at a distance of about 12 km from Jamnagar city in Gujarat.
It is an outcome of two earthen reclamation bunds constructed to restrict rapid flow of fresh water from
draining into the Gulf of Kutch and to control salinity ingress from sea tides. The measured annual
rainfall near the wetland area for the period from 2011 to 2016 was found to be- 660 mm, 348 mm, 1211
mm, 262 mm, 303 mm and 435 mm respectively. The hydrological assessment has been carried out
assuming the rainfall level of the lowest rainfall year, that is, 2014-15, amongst the past six years.
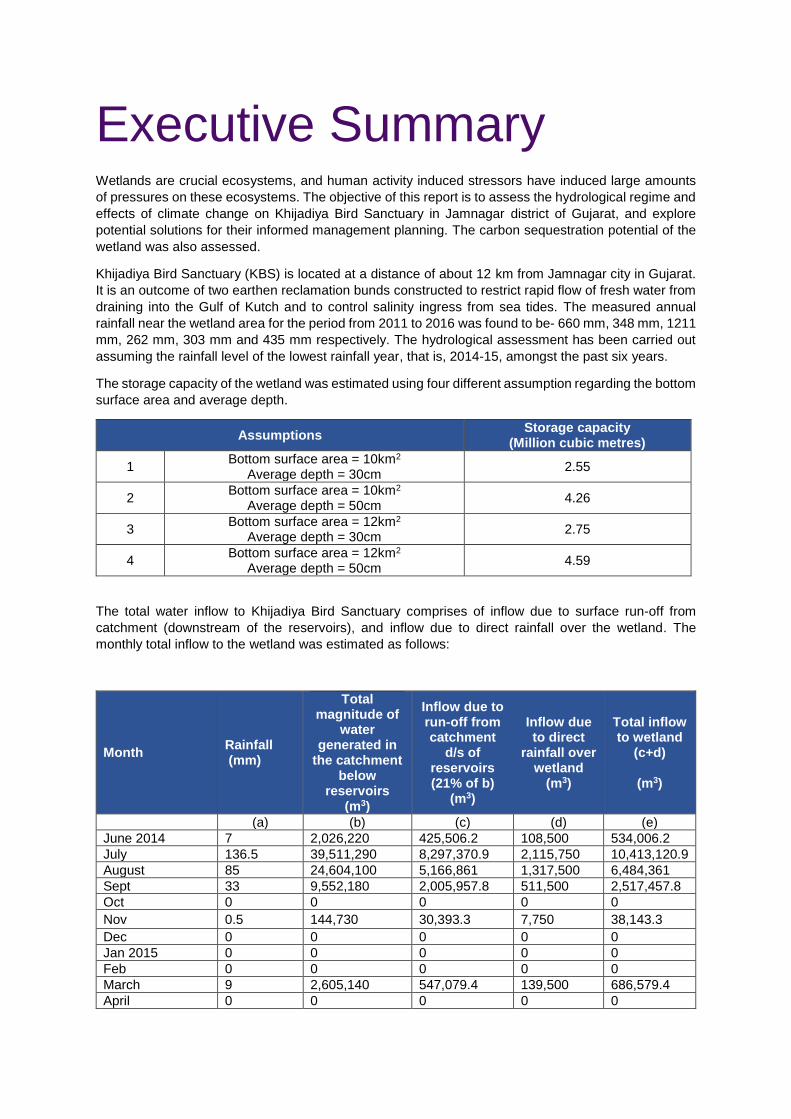
The storage capacity of the wetland was estimated using four different assumption regarding the bottom
surface area and average depth.
Assumptions Storage capacity
(Million cubic metres)
1 Bottom surface area = 10km2
Average depth = 30cm 2.55
2 Bottom surface area = 10km2
Average depth = 50cm 4.26
3 Bottom surface area = 12km2
Average depth = 30cm 2.75
4 Bottom surface area = 12km2
Average depth = 50cm 4.59
The total water inflow to Khijadiya Bird Sanctuary comprises of inflow due to surface run-off from
catchment (downstream of the reservoirs), and inflow due to direct rainfall over the wetland. The
monthly total inflow to the wetland was estimated as follows:
Month Rainfall (mm)
Total magnitude of
water generated in
the catchment below
reservoirs (m3)
Inflow due to run-off from catchment
d/s of reservoirs (21% of b)
(m3)
Inflow due to direct
rainfall over wetland
(m3)
Total inflow to wetland
(c+d)
(m3)
(a) (b) (c) (d) (e)
June 2014 7 2,026,220 425,506.2 108,500 534,006.2
July 136.5 39,511,290 8,297,370.9 2,115,750 10,413,120.9
August 85 24,604,100 5,166,861 1,317,500 6,484,361
Sept 33 9,552,180 2,005,957.8 511,500 2,517,457.8
Oct 0 0 0 0 0
Nov 0.5 144,730 30,393.3 7,750 38,143.3
Dec 0 0 0 0 0
Jan 2015 0 0 0 0 0
Feb 0 0 0 0 0
March 9 2,605,140 547,079.4 139,500 686,579.4
April 0 0 0 0 0
Month Rainfall (mm)
Total magnitude of
water generated in
the catchment below
reservoirs (m3)
Inflow due to run-off from catchment
d/s of reservoirs (21% of b)
(m3)
Inflow due to direct
rainfall over wetland
(m3)
Total inflow to wetland
(c+d)
(m3)
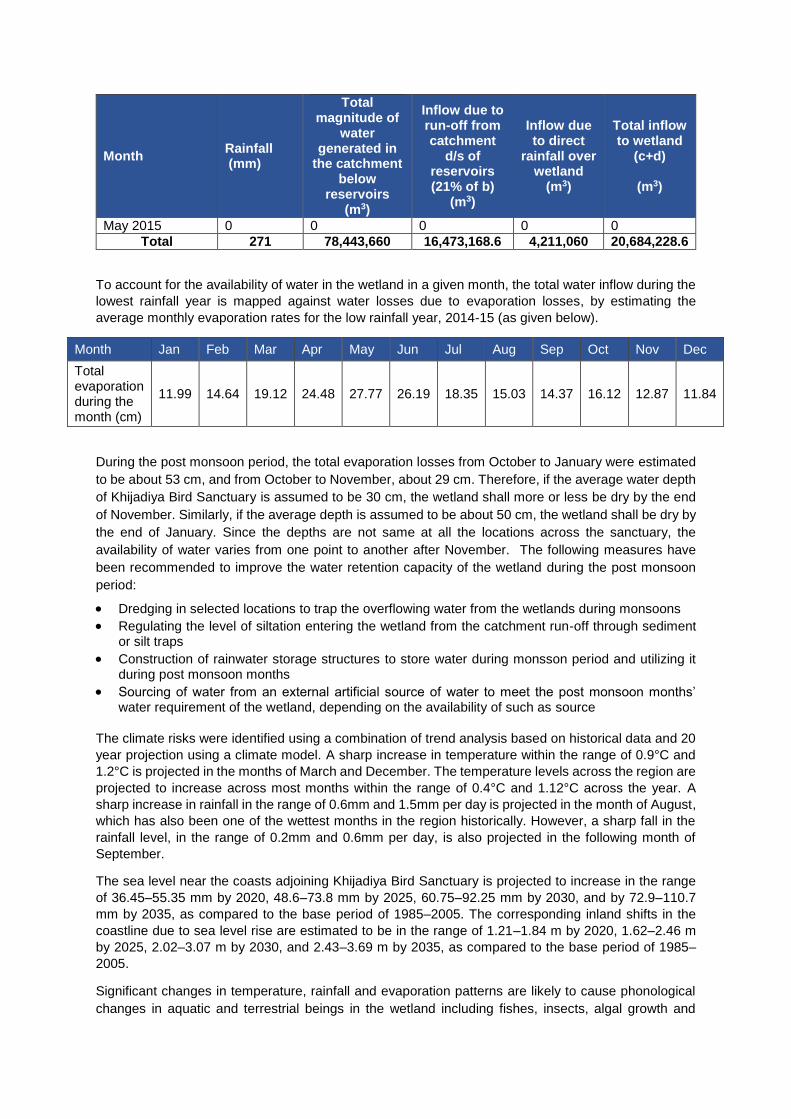
May 2015 0 0 0 0 0
Total 271 78,443,660 16,473,168.6 4,211,060 20,684,228.6
To account for the availability of water in the wetland in a given month, the total water inflow during the
lowest rainfall year is mapped against water losses due to evaporation losses, by estimating the
average monthly evaporation rates for the low rainfall year, 2014-15 (as given below).
Month Jan Feb Mar Apr May Jun Jul Aug Sep Oct Nov Dec
Total evaporation during the month (cm)
11.99 14.64 19.12 24.48 27.77 26.19 18.35 15.03 14.37 16.12 12.87 11.84
During the post monsoon period, the total evaporation losses from October to January were estimated
to be about 53 cm, and from October to November, about 29 cm. Therefore, if the average water depth
of Khijadiya Bird Sanctuary is assumed to be 30 cm, the wetland shall more or less be dry by the end
of November. Similarly, if the average depth is assumed to be about 50 cm, the wetland shall be dry by
the end of January. Since the depths are not same at all the locations across the sanctuary, the
availability of water varies from one point to another after November. The following measures have
been recommended to improve the water retention capacity of the wetland during the post monsoon
period:
Dredging in selected locations to trap the overflowing water from the wetlands during monsoons
Regulating the level of siltation entering the wetland from the catchment run-off through sediment or silt traps
Construction of rainwater storage structures to store water during monsson period and utilizing it during post monsoon months
Sourcing of water from an external artificial source of water to meet the post monsoon months’ water requirement of the wetland, depending on the availability of such as source
The climate risks were identified using a combination of trend analysis based on historical data and 20
year projection using a climate model. A sharp increase in temperature within the range of 0.9°C and
1.2°C is projected in the months of March and December. The temperature levels across the region are
projected to increase across most months within the range of 0.4°C and 1.12°C across the year. A
sharp increase in rainfall in the range of 0.6mm and 1.5mm per day is projected in the month of August,
which has also been one of the wettest months in the region historically. However, a sharp fall in the
rainfall level, in the range of 0.2mm and 0.6mm per day, is also projected in the following month of
September.
The sea level near the coasts adjoining Khijadiya Bird Sanctuary is projected to increase in the range
of 36.45–55.35 mm by 2020, 48.6–73.8 mm by 2025, 60.75–92.25 mm by 2030, and by 72.9–110.7
mm by 2035, as compared to the base period of 1985–2005. The corresponding inland shifts in the
coastline due to sea level rise are estimated to be in the range of 1.21–1.84 m by 2020, 1.62–2.46 m
by 2025, 2.02–3.07 m by 2030, and 2.43–3.69 m by 2035, as compared to the base period of 1985–
2005.
Significant changes in temperature, rainfall and evaporation patterns are likely to cause phonological
changes in aquatic and terrestrial beings in the wetland including fishes, insects, algal growth and
vegetation patterns, thus, disturbing the food web of bird population visiting the wetland. This points to
the need for specific adaptation measures to be put in place to ensure steady water and food availability,
especially during the peak season for migratory birds. Some adaptation measures to manage the
impacts of these climate risks have been detailed:
Outreach and educational programmes for sensitization and awareness of the surrounding
communities
Training programmes for management officials responsible for maintenance of the wetland
Sustainable water management, including improving water retention of the wetland and exploring
external sources of water
Expanding vegetation cover and controlling existing invasive species
Strengthening monitoring protocols and improving the knowledge database of the wetland
Human activity diminution, such as prevention of over grazing by cattle, extraction of water, etc.
Shoreline control measures to prevent coastal erosion due to potential sea level rise
Creating open channels between policymakers and researchers
Development of migration corridors in the long run
Since Khijadiya Bird Sanctuary is a partially flooded wetland, it sequesters carbon dioxide and releases
methane into the atmosphere. The combination of these two factors determines whether these offsetting
processes make a wetland system an overall contributor to the greenhouse effect. Maximising
permanent vegetation in Khijadiya could provide an increase in the carbon sequestration potential.
Increasing the carbon sequestration potential for Khijadiya while ensuring that its ecological character
is not disturbed would require:
A systematic improvement of the Mangroves of Khijadiya wetland
Replacement of the Prosopis juliflora occupied land vegetation sub-habitats with native species such as Acacia nilotica, Azarithiracta indica, etc.,
Gap plantation using similar native species on the land vegetation sub-habitat
The carbon sequestration potential of Khijadiya can be increased through plantation of tree species on
the land area that does not get submerged during the wet season. Preference needs to be given to non-
invasive locally abundant species.
1. Background Wetlands cover 6 per cent of the world’s land surface and contain about 12 per cent of the global carbon
pool, which play an important role in the global carbon cycle. Wetlands act as major carbon reservoirs
on earth. According to Ramsar Secretariat, about one-third of the world’s terrestrial carbon is trapped
and stored in wetlands, double to that of forests. As per estimations, carbon sequestration potential of
restored wetlands (over 50-year period) comes out to be about 0.4 tonnes carbon per hectare per year
(C/ha/year). Coastal wetlands in India, especially the mangrove wetlands in the eastern region and west
coast, serve as carbon sink, sequestering approximately 1.5 metric tonne C/ha/year, and the upper
layers of mangrove sediments have high carbon content, with conservative estimates indicating the
levels of 10 per cent.
The interconnected nature of water, food and energy systems is a fundamental relationship in any
ecosystem. Water security, including both the availability and quality of water, is an increasing challenge
faced by the entire world. In fact, the global and local water cycles are strongly dependent on wetlands
is well established. Hence, the adversities faced by India’s wetlands have the potential to adversely
impact the local water carbon and nutrient cycles.
The human interaction with wetlands during the last few decades has been of serious concern; the rapid
population growth, accompanied by intensified industrial, commercial and residential developments,
has led to pollution of wetlands by domestic and industrial sewage, and agricultural run-off as fertilisers,
insecticides and feed lot wastes. This, along with a general lack of effort directed towards conservation
of wetlands, has created a major threat to wetlands. Hydrologic conditions can directly modify or change
the chemical and physical properties of wetlands, such as nutrient availability, degree of substrate
anoxia, soil salinity, sediment properties and pH level. These modifications of the physiochemical
environment, in turn, have a direct impact on the biotic response in the wetland (Gosselink & Turner
1978). With a slight change in hydrologic conditions in wetlands, the biota may respond with significant
changes in species composition and ecosystem productivity. Wetlands perform numerous valuable
functions, such as recycling of nutrients; purifying of water; attenuate floods; maintain stream flow;
recharge ground water; provide drinking water, fish, fodder, fuel and wildlife habitat; control the rate of
run-off in urban areas; buffer shorelines against erosion; and, recreation to the society.
Climate change is another pressing issue affecting the hydrology and biodiversity of wetland
ecosystems mostly through changes in precipitation and temperature regimes. The impact of climatic
variations on the wetland ecosystems greatly depends upon temperature and water availability through
run-off in the inland fresh water bodies, and rise of sea level and storm surges in coastal area wetlands.
The predicted hydrologic changes associated with climate change can also affect the performance of
infrastructure (e.g., surface water management systems), thereby affecting the different uses of water
in many areas. Several examples of impacts resulting from projected changes in extreme climate events
include:
change in base flows;
altered hydrology (depth and hydroperiod);
increased heat stress in wildlife;
extended range and activity of some pest and disease vectors;
increased flooding, landslide, avalanche, and mudslide damage;
increased soil erosion;
increased flood run-off resulting a decrease in recharge of some floodplain aquifers;
decreased water resource quantity and quality;
increased coastal erosion and damage to coastal buildings and infrastructure;
increased damage to coastal ecosystems, such as coral reefs and mangroves, and increased
tropical cyclone activity
Climate change is also expected to act in conjunction with a range of other pressures, many of which,
depending on the region, may pose far greater immediate concern for wetlands and their water
resources in the short to medium term. Wetland systems are vulnerable and particularly susceptible to
changes in quantity and quality of water supply. It has been observed that climate change may have its
most pronounced effects on wetlands through alterations in hydrological regimes, as well as through
impacts on the biodiversity of wetlands’ ecosystem.
In India, there are about 26 designated National Ramsar wetlands / sites as per their habitat functions
and on the basis of importance of biodiversity. The wetland system is sandwiched between fluvial and
marine forces, and also has some fragile zones in their flood plains, lakes and river mouths. Currently,
wetland areas are designated as per classifications that are primarily biodiversity centric. Given the role
played by wetlands in water and food security, there is a strong necessity that such criteria include the
consideration of hydrological services of wetlands. However, only a few scientific studies have been
undertaken so far. According to Parrette et. al., 1993, wetlands, or the lack thereof, were a significant
factor for severe flooding in medium and large river systems in their middle and lower reaches. The
anthropogenic impact on the original wetlands had destroyed their ability to modify flooding; support
water supply and basin yield; enhance aquifer recharge, etc. Understanding the functions of wetlands
will make it easier to evaluate and preserve wetlands and the water bodies. Any sustainable
development of wetland needs primarily identification of hydrological pathways in terms of inflow and
water quality.
Gujarat contributes about 22.77 per cent of the total wetland area of the country, which is the highest
amongst all states in the country (NWA, 2011). The total wetland area estimated in Gujarat is
3,474,950ha, which accounts for about 17.56 per cent of geographical area of the state (NWA, 2010).
The Gujarat coast, due to its varied physiographic features, geomorphology, coastal processes and
river discharges into the sea, provides a wide variety of coastal features. Coastal wetlands such as
coral reefs, mangroves, tidal flats, mudflats, marshes, creeks, estuaries and beaches are exclusively
found here. Wetlands can be wet or dry for one or more seasons in a year. Seasonal wetlands in arid
and semi-arid regions may be wet, only periodically. Functions of such seasonal wetlands and their role
in environment, in parts, are determined by the timing of wet and dry periods and water quantity. The
spatial and temporal characteristics of inflow and water quality are very crucial in the wetlands.
However, the information available on these aspects is generally limited. Therefore, in the intended
project proposal these hydrological aspects have been included to understand the hydrological
processes in the selected wetlands.
The CMPA project is one of the flagship projects of the Indo German Bilateral Technical Cooperation,
co-managed by the Ministry of Environment, Forests and Climate Change, Government of India and
GIZ-India. The project aims at improving the management of selected existing, and potential coastal
and marine protected areas through strengthened participatory management, capacity development,
and information, communication and training.
The project is funded by the German Federal Ministry for the Environment, Nature Conservation,
Building and Nuclear Safety (BMUB), and implemented by the Ministry of Environment, Forests and
Climate Change (MoEFCC), and GIZ, on behalf of BMUB. Under this project, the following research
study is being conducted with the objective of supporting integrated management planning for two
coastal wetlands of Gujarat — Khijadiya Bird Sanctuary and Gosabara Wetland Complex. This report
provides the results of the study for Khijadiya Bird Sanctuary.
1.1 Objective and scope
The overarching aim of this study is to support integrated management planning of Khijadiya Bird
Sanctuary via following specific objectives:
Conducting a hydrological analysis of the wetland, including the review of current water
management practices and recommending measures for the maintenance of hydrological regimes
in support of biodiversity and ecosystem services
Assessing vulnerability of the wetland to climate change and identifying adaptation options
Assessing carbon sequestration potential and flux of the wetland
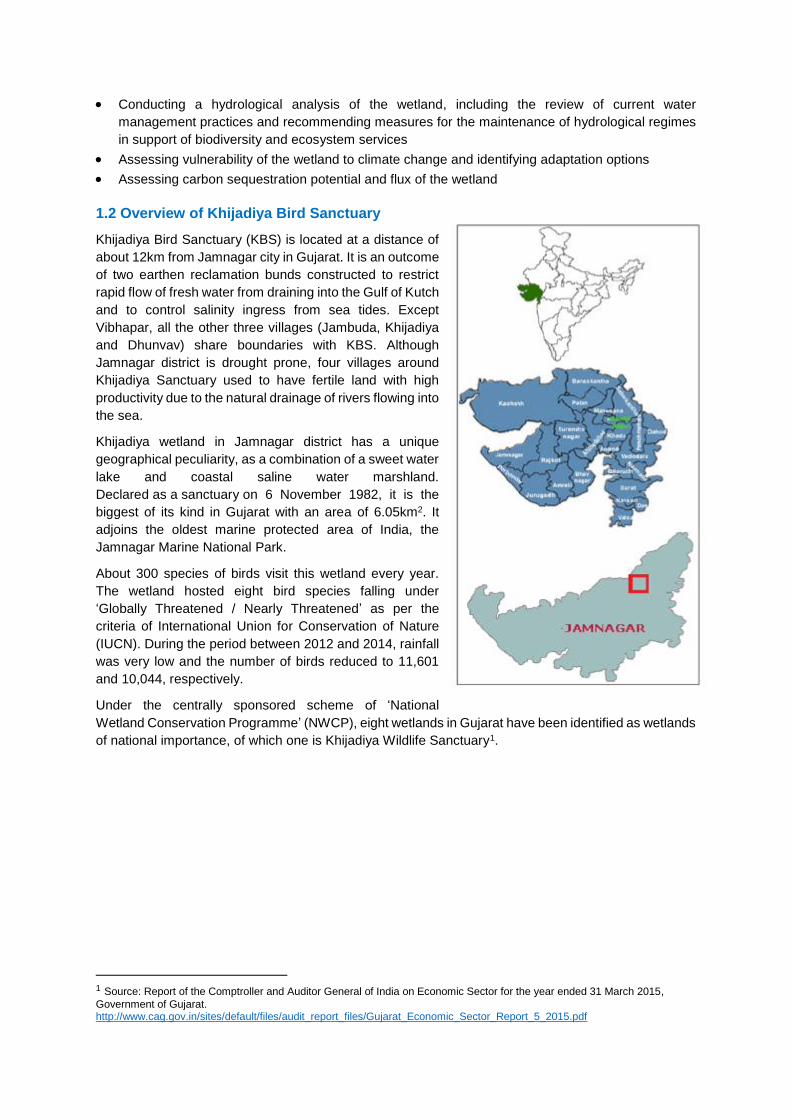
1.2 Overview of Khijadiya Bird Sanctuary
Khijadiya Bird Sanctuary (KBS) is located at a distance of
about 12km from Jamnagar city in Gujarat. It is an outcome
of two earthen reclamation bunds constructed to restrict
rapid flow of fresh water from draining into the Gulf of Kutch
and to control salinity ingress from sea tides. Except
Vibhapar, all the other three villages (Jambuda, Khijadiya
and Dhunvav) share boundaries with KBS. Although
Jamnagar district is drought prone, four villages around
Khijadiya Sanctuary used to have fertile land with high
productivity due to the natural drainage of rivers flowing into
the sea.
Khijadiya wetland in Jamnagar district has a unique
geographical peculiarity, as a combination of a sweet water
lake and coastal saline water marshland.
Declared as a sanctuary on 6 November 1982, it is the
biggest of its kind in Gujarat with an area of 6.05km2. It
adjoins the oldest marine protected area of India, the
Jamnagar Marine National Park.
About 300 species of birds visit this wetland every year.
The wetland hosted eight bird species falling under
‘Globally Threatened / Nearly Threatened’ as per the
criteria of International Union for Conservation of Nature
(IUCN). During the period between 2012 and 2014, rainfall
was very low and the number of birds reduced to 11,601
and 10,044, respectively.
Under the centrally sponsored scheme of ‘National
Wetland Conservation Programme’ (NWCP), eight wetlands in Gujarat have been identified as wetlands
of national importance, of which one is Khijadiya Wildlife Sanctuary1.
1 Source: Report of the Comptroller and Auditor General of India on Economic Sector for the year ended 31 March 2015,
Government of Gujarat. http://www.cag.gov.in/sites/default/files/audit_report_files/Gujarat_Economic_Sector_Report_5_2015.pdf
2. Hydrological assessment 2.1 Hydrological characterisation of the wetland
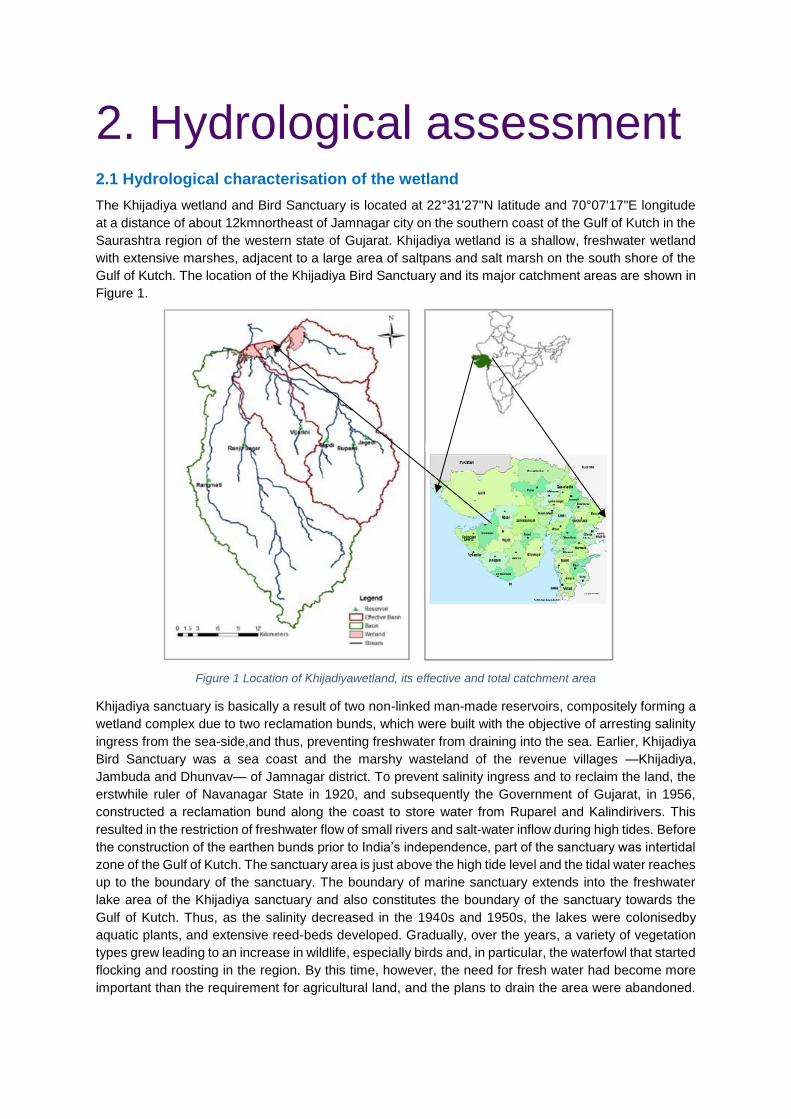
The Khijadiya wetland and Bird Sanctuary is located at 22°31'27"N latitude and 70°07'17"E longitude
at a distance of about 12kmnortheast of Jamnagar city on the southern coast of the Gulf of Kutch in the
Saurashtra region of the western state of Gujarat. Khijadiya wetland is a shallow, freshwater wetland
with extensive marshes, adjacent to a large area of saltpans and salt marsh on the south shore of the
Gulf of Kutch. The location of the Khijadiya Bird Sanctuary and its major catchment areas are shown in
Figure 1.
Figure 1 Location of Khijadiyawetland, its effective and total catchment area
Khijadiya sanctuary is basically a result of two non-linked man-made reservoirs, compositely forming a
wetland complex due to two reclamation bunds, which were built with the objective of arresting salinity
ingress from the sea-side,and thus, preventing freshwater from draining into the sea. Earlier, Khijadiya
Bird Sanctuary was a sea coast and the marshy wasteland of the revenue villages —Khijadiya,
Jambuda and Dhunvav— of Jamnagar district. To prevent salinity ingress and to reclaim the land, the
erstwhile ruler of Navanagar State in 1920, and subsequently the Government of Gujarat, in 1956,
constructed a reclamation bund along the coast to store water from Ruparel and Kalindirivers. This
resulted in the restriction of freshwater flow of small rivers and salt-water inflow during high tides. Before
the construction of the earthen bunds prior to India’s independence, part of the sanctuary was intertidal
zone of the Gulf of Kutch. The sanctuary area is just above the high tide level and the tidal water reaches
up to the boundary of the sanctuary. The boundary of marine sanctuary extends into the freshwater
lake area of the Khijadiya sanctuary and also constitutes the boundary of the sanctuary towards the
Gulf of Kutch. Thus, as the salinity decreased in the 1940s and 1950s, the lakes were colonisedby
aquatic plants, and extensive reed-beds developed. Gradually, over the years, a variety of vegetation
types grew leading to an increase in wildlife, especially birds and, in particular, the waterfowl that started
flocking and roosting in the region. By this time, however, the need for fresh water had become more
important than the requirement for agricultural land, and the plans to drain the area were abandoned.
Instead, four pumping stations were installed at the east of the main Khijadiya Lake to supply fresh
water to nearby villages.
The sanctuary and its surrounding environment, thus, represent a mosaic of ecosystems largely
comprising freshwater wetlands, brackish water impoundments, mangroves, salt pans, intertidal
mudflats, a creek, surrounding agricultural land and the large area as wasteland with Prosopisdominant
vegetation. Khijadiya Lake Complex, thus, not only includes the two lakes, but also has extensive
marshes on the southern shore of the Gulf of Kutch (Sanjeev Kumar, 2013). . A stretch of creek and
salt pans, adjoining the freshwater wetland complex, has a direct bearing on the ecosystem of Khijadiya
wetlands.
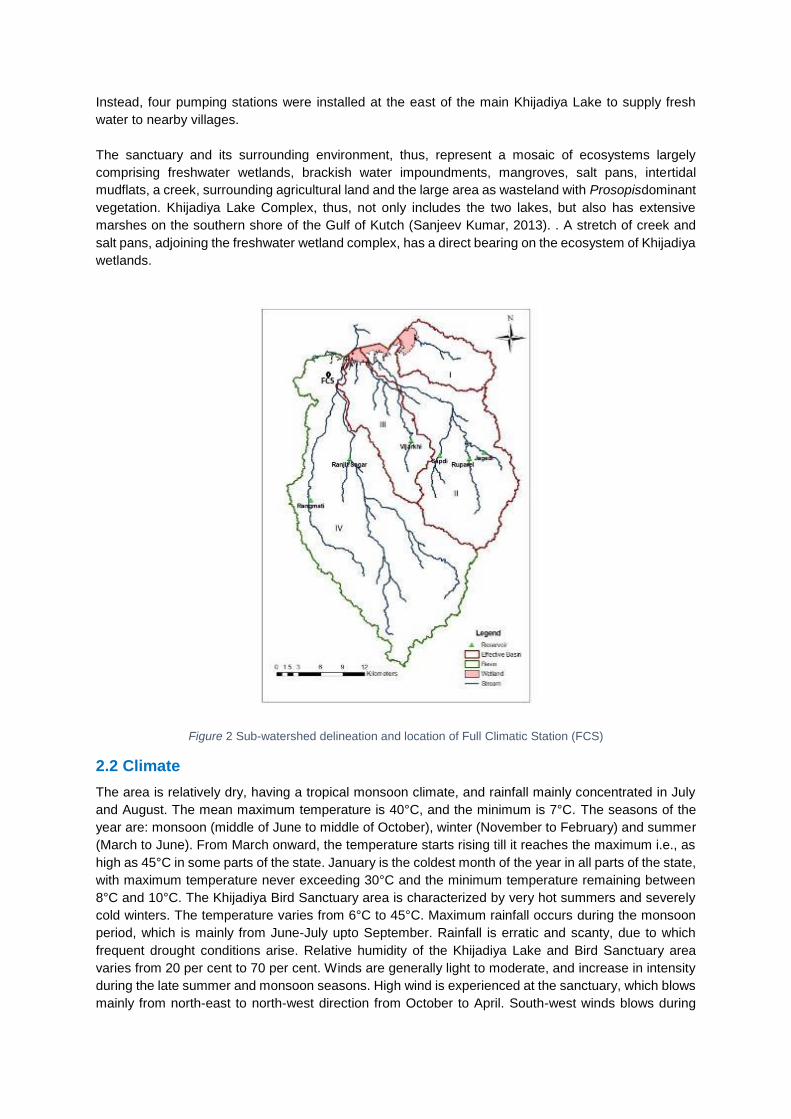
Figure 2 Sub-watershed delineation and location of Full Climatic Station (FCS)
2.2 Climate
The area is relatively dry, having a tropical monsoon climate, and rainfall mainly concentrated in July
and August. The mean maximum temperature is 40°C, and the minimum is 7°C. The seasons of the
year are: monsoon (middle of June to middle of October), winter (November to February) and summer
(March to June). From March onward, the temperature starts rising till it reaches the maximum i.e., as
high as 45°C in some parts of the state. January is the coldest month of the year in all parts of the state,
with maximum temperature never exceeding 30°C and the minimum temperature remaining between
8°C and 10°C. The Khijadiya Bird Sanctuary area is characterized by very hot summers and severely
cold winters. The temperature varies from 6°C to 45°C. Maximum rainfall occurs during the monsoon
period, which is mainly from June-July upto September. Rainfall is erratic and scanty, due to which
frequent drought conditions arise. Relative humidity of the Khijadiya Lake and Bird Sanctuary area
varies from 20 per cent to 70 per cent. Winds are generally light to moderate, and increase in intensity
during the late summer and monsoon seasons. High wind is experienced at the sanctuary, which blows
mainly from north-east to north-west direction from October to April. South-west winds blows during
monsoon and chilly wind direction keeps on changing in winters from south-west to south-east. Coastal
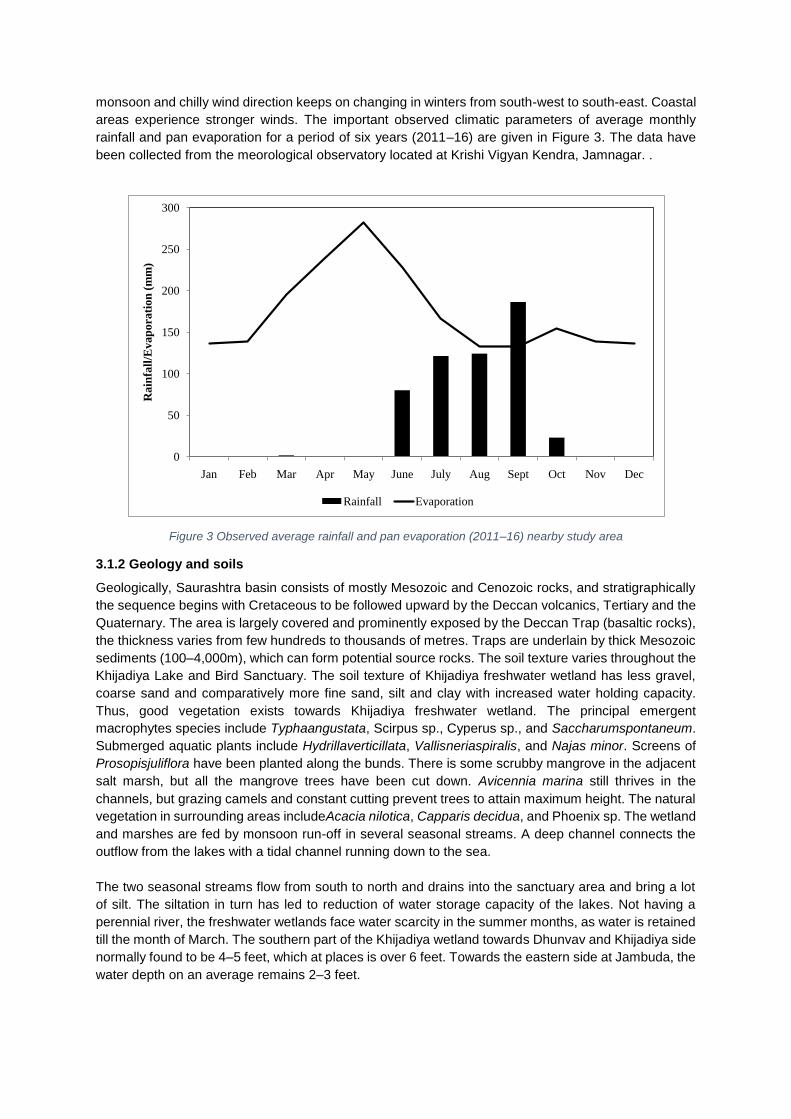
areas experience stronger winds. The important observed climatic parameters of average monthly
rainfall and pan evaporation for a period of six years (2011–16) are given in Figure 3. The data have
been collected from the meorological observatory located at Krishi Vigyan Kendra, Jamnagar. .
0
50
100
150
200
250
300
Jan Feb Mar Apr May June July Aug Sept Oct Nov Dec
Rain
fall
/Evap
ora
tion
(m
m)
Rainfall Evaporation
Figure 3 Observed average rainfall and pan evaporation (2011–16) nearby study area
3.1.2 Geology and soils
Geologically, Saurashtra basin consists of mostly Mesozoic and Cenozoic rocks, and stratigraphically
the sequence begins with Cretaceous to be followed upward by the Deccan volcanics, Tertiary and the
Quaternary. The area is largely covered and prominently exposed by the Deccan Trap (basaltic rocks),
the thickness varies from few hundreds to thousands of metres. Traps are underlain by thick Mesozoic
sediments (100–4,000m), which can form potential source rocks. The soil texture varies throughout the
Khijadiya Lake and Bird Sanctuary. The soil texture of Khijadiya freshwater wetland has less gravel,
coarse sand and comparatively more fine sand, silt and clay with increased water holding capacity.
Thus, good vegetation exists towards Khijadiya freshwater wetland. The principal emergent
macrophytes species include Typhaangustata, Scirpus sp., Cyperus sp., and Saccharumspontaneum.
Submerged aquatic plants include Hydrillaverticillata, Vallisneriaspiralis, and Najas minor. Screens of
Prosopisjuliflora have been planted along the bunds. There is some scrubby mangrove in the adjacent
salt marsh, but all the mangrove trees have been cut down. Avicennia marina still thrives in the
channels, but grazing camels and constant cutting prevent trees to attain maximum height. The natural
vegetation in surrounding areas includeAcacia nilotica, Capparis decidua, and Phoenix sp. The wetland
and marshes are fed by monsoon run-off in several seasonal streams. A deep channel connects the
outflow from the lakes with a tidal channel running down to the sea.
The two seasonal streams flow from south to north and drains into the sanctuary area and bring a lot
of silt. The siltation in turn has led to reduction of water storage capacity of the lakes. Not having a
perennial river, the freshwater wetlands face water scarcity in the summer months, as water is retained
till the month of March. The southern part of the Khijadiya wetland towards Dhunvav and Khijadiya side
normally found to be 4–5 feet, which at places is over 6 feet. Towards the eastern side at Jambuda, the
water depth on an average remains 2–3 feet.
The wetland is an extremely important staging and wintering area for a wide variety of waterfowl. Almost
300 species of birds have been recorded in the sanctuary, including about 94 species of water birds.
Various freshwater turtles are reported to exist and many visitors come to observe birdlife in the
sanctuary. Khijadiya lakes provide water for irrigation and domestic use, while salt is extracted from the
two neighbouring salt works; as water levels recede, local villagers cultivate vegetables on the exposed
beds of the lakes. Cattle and other domestic livestock graze the edge of the reed-beds, and up to 150
camels graze the adjacent salt marsh at neap tides. The Government of Gujarat through the State
Forest Department has taken initiative to conserve the wetland from biodiversity viewpoint under the
Wildlife (Protection) Act, 1972. The Ministry of Environment and Forest, New Delhi, has identified the
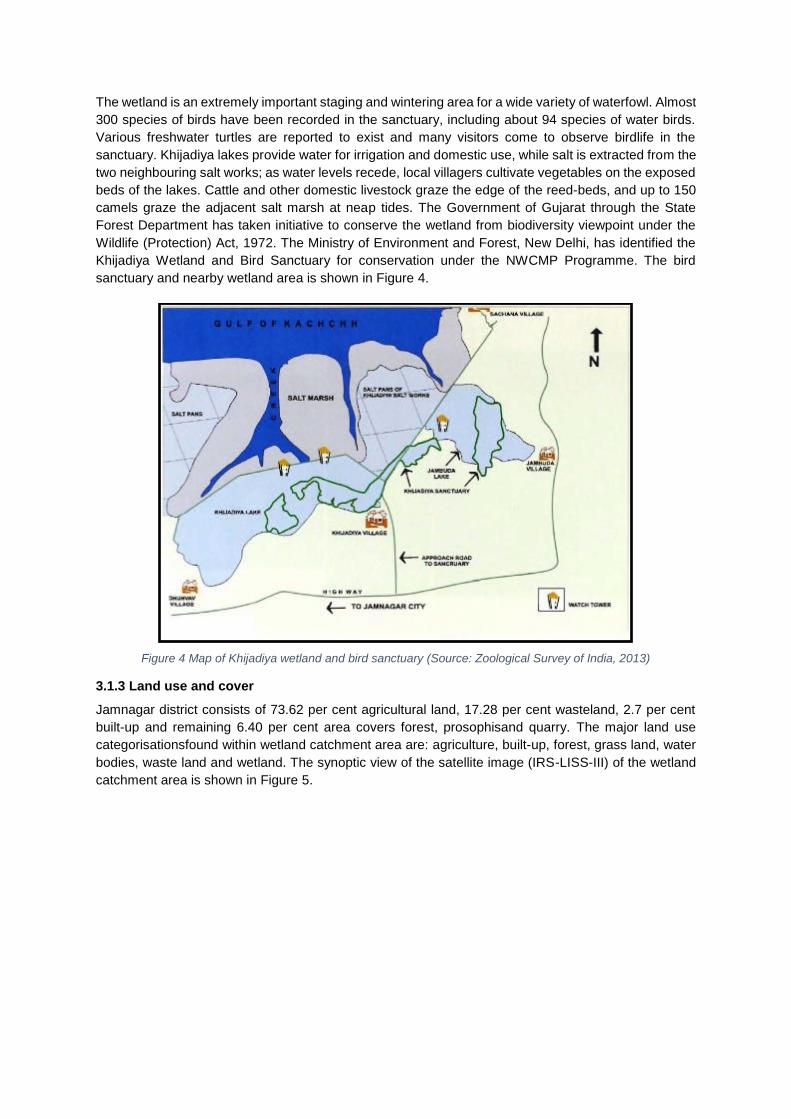
Khijadiya Wetland and Bird Sanctuary for conservation under the NWCMP Programme. The bird
sanctuary and nearby wetland area is shown in Figure 4.
Figure 4 Map of Khijadiya wetland and bird sanctuary (Source: Zoological Survey of India, 2013)
3.1.3 Land use and cover
Jamnagar district consists of 73.62 per cent agricultural land, 17.28 per cent wasteland, 2.7 per cent
built-up and remaining 6.40 per cent area covers forest, prosophisand quarry. The major land use
categorisationsfound within wetland catchment area are: agriculture, built-up, forest, grass land, water
bodies, waste land and wetland. The synoptic view of the satellite image (IRS-LISS-III) of the wetland
catchment area is shown in Figure 5.
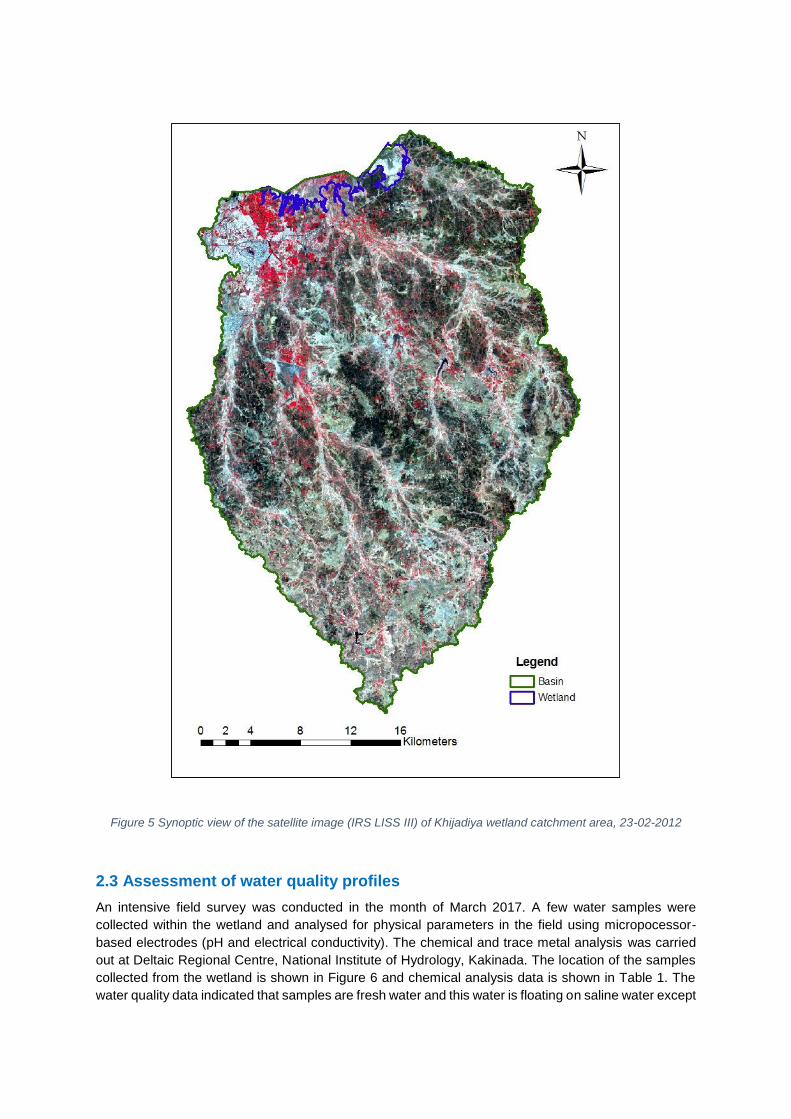
Figure 5 Synoptic view of the satellite image (IRS LISS III) of Khijadiya wetland catchment area, 23-02-2012
2.3 Assessment of water quality profiles
An intensive field survey was conducted in the month of March 2017. A few water samples were
collected within the wetland and analysed for physical parameters in the field using micropocessor-
based electrodes (pH and electrical conductivity). The chemical and trace metal analysis was carried
out at Deltaic Regional Centre, National Institute of Hydrology, Kakinada. The location of the samples
collected from the wetland is shown in Figure 6 and chemical analysis data is shown in Table 1. The
water quality data indicated that samples are fresh water and this water is floating on saline water except
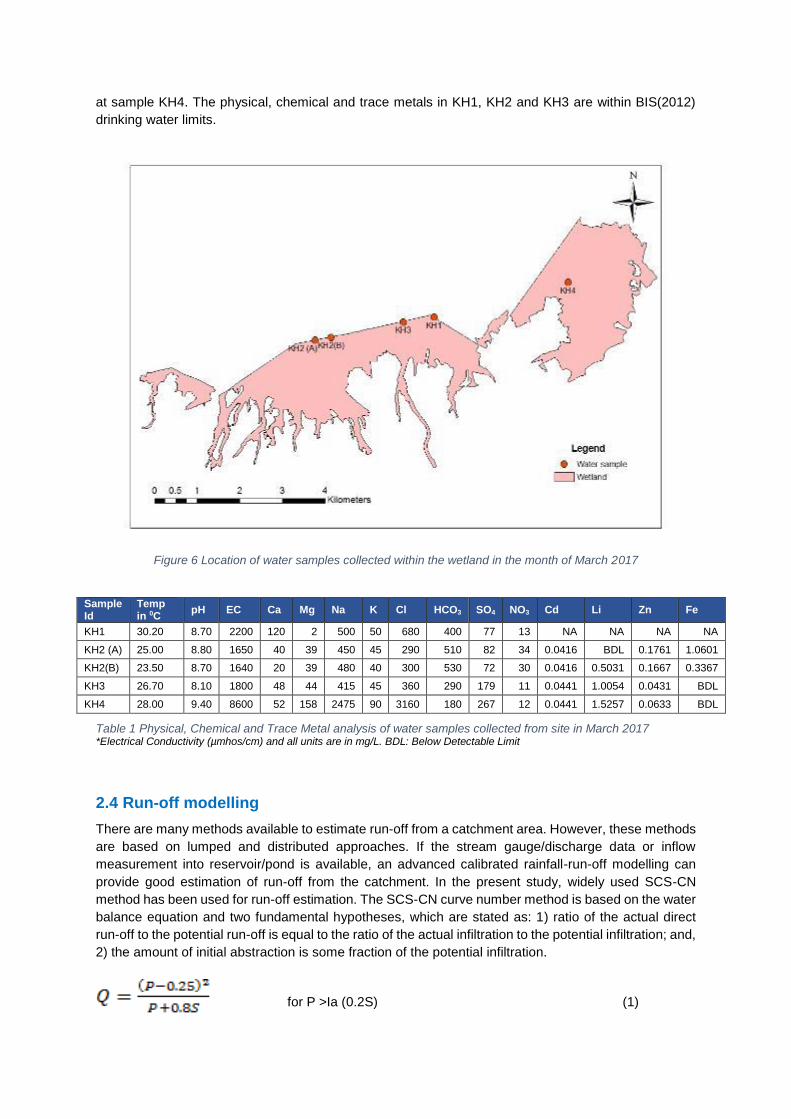
at sample KH4. The physical, chemical and trace metals in KH1, KH2 and KH3 are within BIS(2012)
drinking water limits.
Figure 6 Location of water samples collected within the wetland in the month of March 2017
Sample Id
Temp in 0C
pH EC Ca Mg Na K Cl HCO3 SO4 NO3 Cd Li Zn Fe
KH1 30.20 8.70 2200 120 2 500 50 680 400 77 13 NA NA NA NA
KH2 (A) 25.00 8.80 1650 40 39 450 45 290 510 82 34 0.0416 BDL 0.1761 1.0601
KH2(B) 23.50 8.70 1640 20 39 480 40 300 530 72 30 0.0416 0.5031 0.1667 0.3367
KH3 26.70 8.10 1800 48 44 415 45 360 290 179 11 0.0441 1.0054 0.0431 BDL
KH4 28.00 9.40 8600 52 158 2475 90 3160 180 267 12 0.0441 1.5257 0.0633 BDL
Table 1 Physical, Chemical and Trace Metal analysis of water samples collected from site in March 2017 *Electrical Conductivity (µmhos/cm) and all units are in mg/L. BDL: Below Detectable Limit
2.4 Run-off modelling
There are many methods available to estimate run-off from a catchment area. However, these methods
are based on lumped and distributed approaches. If the stream gauge/discharge data or inflow
measurement into reservoir/pond is available, an advanced calibrated rainfall-run-off modelling can
provide good estimation of run-off from the catchment. In the present study, widely used SCS-CN
method has been used for run-off estimation. The SCS-CN curve number method is based on the water
balance equation and two fundamental hypotheses, which are stated as: 1) ratio of the actual direct
run-off to the potential run-off is equal to the ratio of the actual infiltration to the potential infiltration; and,
2) the amount of initial abstraction is some fraction of the potential infiltration.
for P >Ia (0.2S) (1)
Where Q is run-off in mm and P is precipitation in mm, S = potential infiltration after the run-off begins
given by:
(2)
Where CN is Curve Number, The CN (dimensionless number ranging from 0 to 100) is determined from
a table, based on land-cover, Hydrological soil groups (HSG), and Antecedent Moisture Content (AMC).
HSG is expressed in terms of four groups (A, B, C and D), according to the soils infiltration rate. AMC
is expressed in three levels (I, II and III), according to rainfall limits for dormant and growing seasons.
CN value was adopted from Technical release (TR-55).
(3)
Where CNw is the weighted curve number, while CNi is the curve number from 1 to any number; Ai is
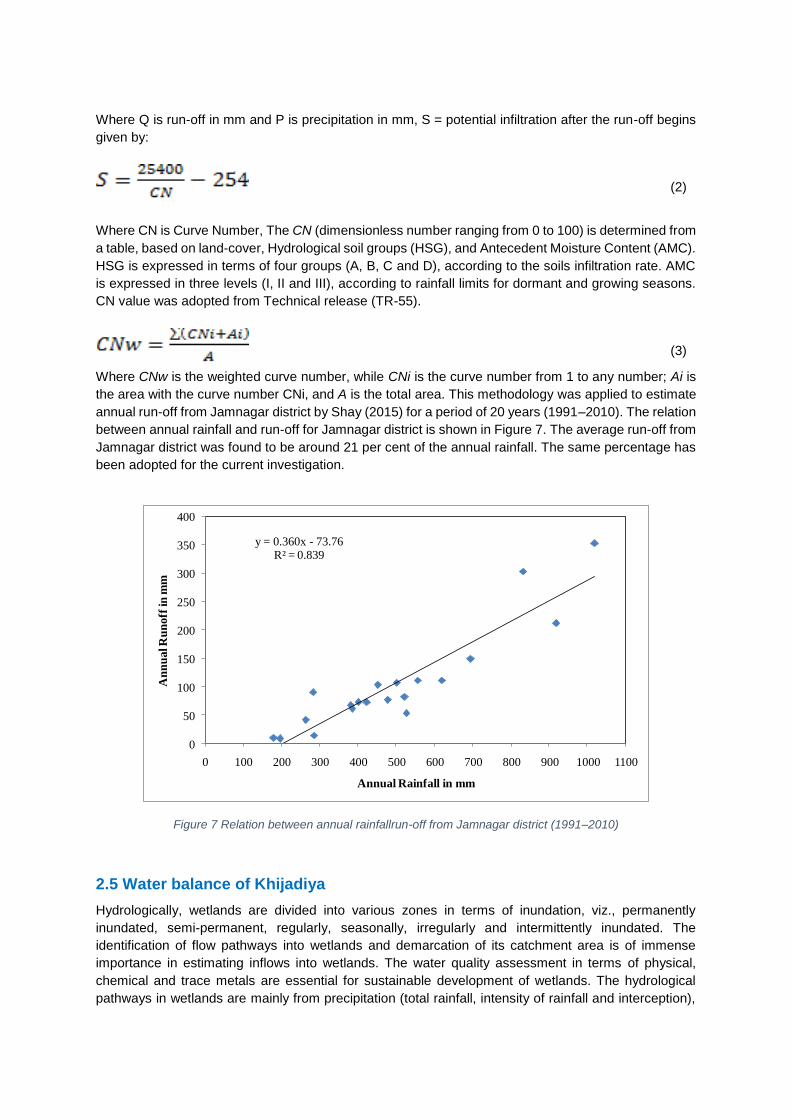
the area with the curve number CNi, and A is the total area. This methodology was applied to estimate
annual run-off from Jamnagar district by Shay (2015) for a period of 20 years (1991–2010). The relation
between annual rainfall and run-off for Jamnagar district is shown in Figure 7. The average run-off from
Jamnagar district was found to be around 21 per cent of the annual rainfall. The same percentage has
been adopted for the current investigation.
y = 0.360x - 73.76R² = 0.839
0
50
100
150
200
250
300
350
400
0 100 200 300 400 500 600 700 800 900 1000 1100
An
nu
al R
un
off
in m
m
Annual Rainfall in mm
Figure 7 Relation between annual rainfallrun-off from Jamnagar district (1991–2010)
2.5 Water balance of Khijadiya
Hydrologically, wetlands are divided into various zones in terms of inundation, viz., permanently
inundated, semi-permanent, regularly, seasonally, irregularly and intermittently inundated. The
identification of flow pathways into wetlands and demarcation of its catchment area is of immense
importance in estimating inflows into wetlands. The water quality assessment in terms of physical,
chemical and trace metals are essential for sustainable development of wetlands. The hydrological
pathways in wetlands are mainly from precipitation (total rainfall, intensity of rainfall and interception),
surface flow (overland flow, stream flow and run-off), groundwater (recharge into wetlands and
discharge from wetlands), evapotranspiration and tides (frequency and magnitude). The water balance
equation for typical wetland is as follows:
(4)
= net precipitation, = surface inflows (sheet, stream flow), = ground water inflow, ET =
evapotranspiration, = surface outflows, = ground water outflows, T= tidal inflow (+) and outflow
(-), = change in volume of water storage per unit time.
Generally, the ground water inflow is equal to ground water outflow and, hence, net groundwater flow
is considered as zero in most water balance studies. Since the wetland is heavily silted causing the
bottom to be almost impervious, there is hardly any loss of water as losses from the bottom of the
wetland. Therefore, the water balance of the Khijadiya wetland can be written in simplified terms as:
Change in storage = Total inflow total outflow
While ‘total inflow’ includes inflow due to surface run-off from catchment + inflow due to direct rainfall
over the wetland, ‘total outflow’ includes evaporation losses + overflow. If the amount of inflow is more
than the capacity of the wetland, it shall go as overflow.
Computation of water balance components
a. Water year
The data of various meteorological parameters for Jamnagar have been collected from KrishiVigyan
Kendra, Jamnagar, from 2011 to 2016. The monthly average of rainfall and pan evaporation have been
computed and shown in Figure 3. The measured annual rainfall near to wetland for the period from
2011 to 2016 was found to be- 660mm, 348mm, 1,211mm, 262mm, 303mm and 435mm respectively.
The dry year or deficit rainfall year has been chosen for formulating management plan for the wetland.
This is because if the management plan is prepared for the worst scenario, it can work for the lesser
rainfall years also. Accordingly the water year of 2014–15 has been considered for the analysis, as it
was the year with lowest rainfall during the period 2011–16 for which the data were available. The total
annual rainfall for the water year 2014–15 was only 271mm and the monthly rainfall is given in the
following Table 2.
Month Jun-14
Jul- 14
Aug-14
Sep-14
Oct-14
Nov-14
Dec-14
Jan-15
Feb-15
March-15
April-15
May-15
Total rainfall (in mm)
7 136.5 85 33 0 0.5 0 0 0 9 0 0
Table 2 Measured monthly rainfall in mm for the water year 2014–15
b. Estimating storage capacity of the wetland
A wetland is a very shallow water body with depths of generally a few centimeters or less. Since the
depth is very less, there is not much difference in the top surface area (which is maximum surface area
at full water level or FWL) and in the bottom surface area. The general shape of the seasonal coastal
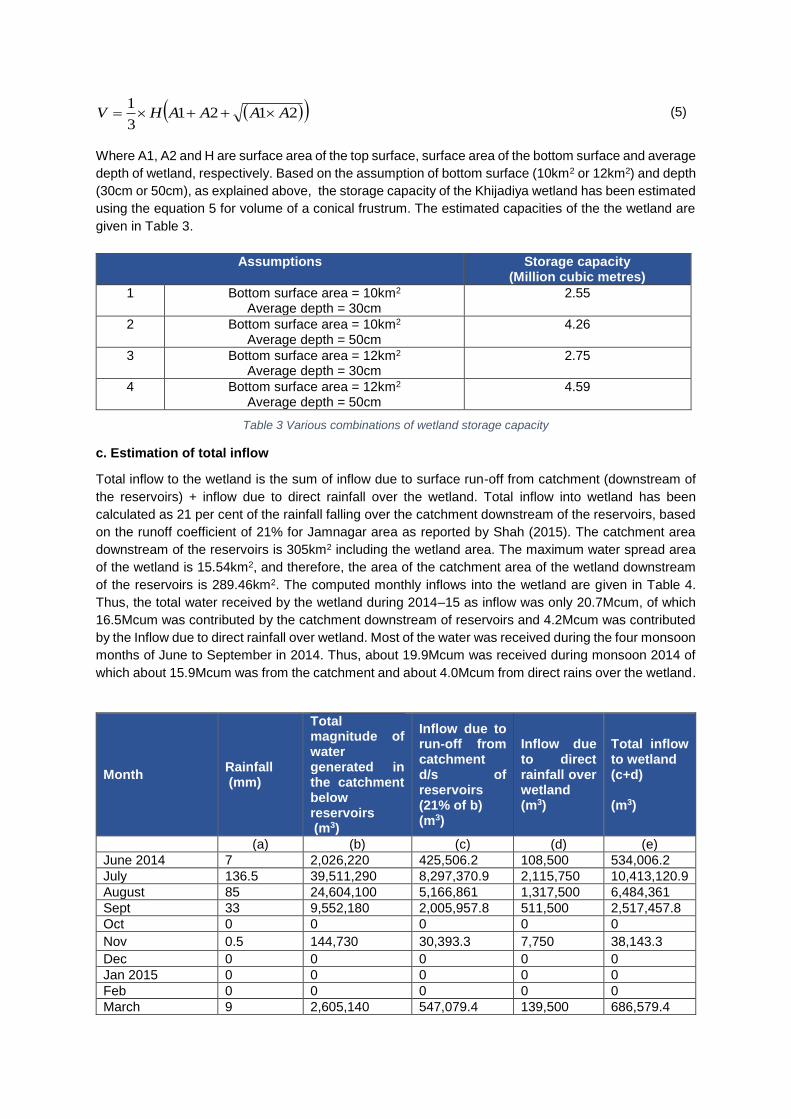
wetland and its major water balance components are shown in Figure 8 (Kashaigili et al 2006). In the
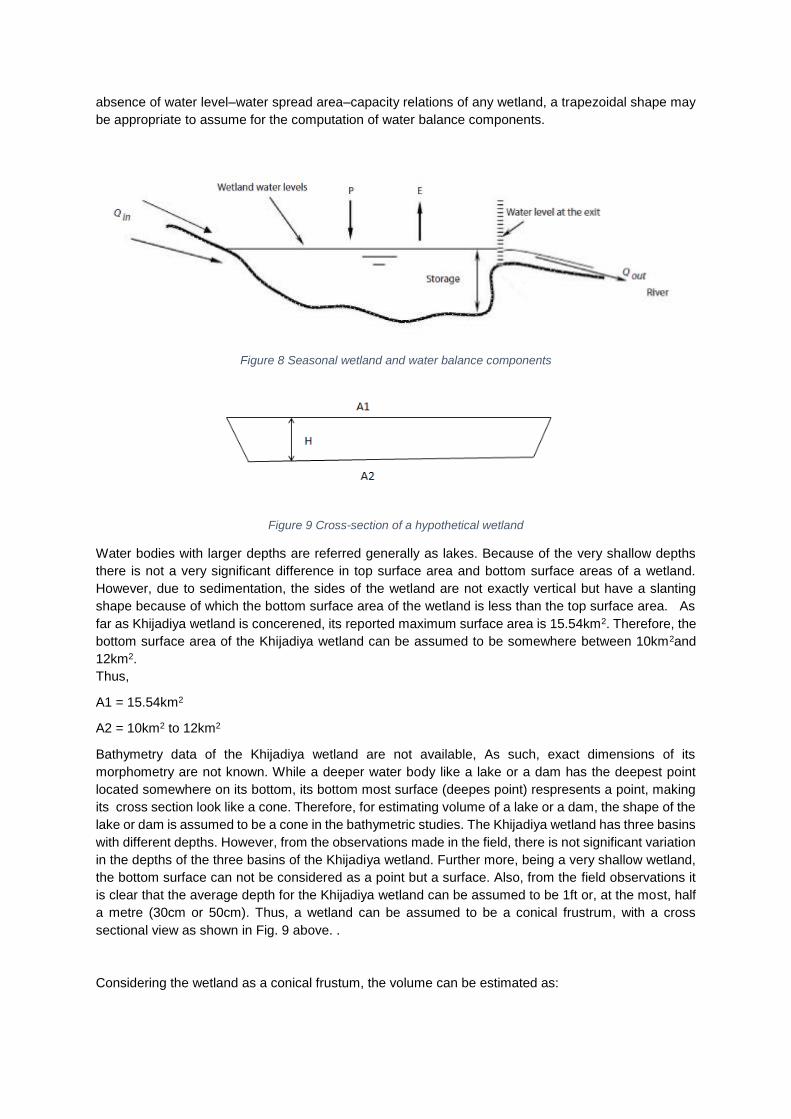
absence of water level–water spread area–capacity relations of any wetland, a trapezoidal shape may
be appropriate to assume for the computation of water balance components.
Figure 8 Seasonal wetland and water balance components
Figure 9 Cross-section of a hypothetical wetland
Water bodies with larger depths are referred generally as lakes. Because of the very shallow depths
there is not a very significant difference in top surface area and bottom surface areas of a wetland.
However, due to sedimentation, the sides of the wetland are not exactly vertical but have a slanting
shape because of which the bottom surface area of the wetland is less than the top surface area. As
far as Khijadiya wetland is concerened, its reported maximum surface area is 15.54km2. Therefore, the
bottom surface area of the Khijadiya wetland can be assumed to be somewhere between 10km2and
12km2.
Thus,
A1 = 15.54km2
A2 = 10km2 to 12km2
Bathymetry data of the Khijadiya wetland are not available, As such, exact dimensions of its
morphometry are not known. While a deeper water body like a lake or a dam has the deepest point
located somewhere on its bottom, its bottom most surface (deepes point) respresents a point, making
its cross section look like a cone. Therefore, for estimating volume of a lake or a dam, the shape of the
lake or dam is assumed to be a cone in the bathymetric studies. The Khijadiya wetland has three basins
with different depths. However, from the observations made in the field, there is not significant variation
in the depths of the three basins of the Khijadiya wetland. Further more, being a very shallow wetland,
the bottom surface can not be considered as a point but a surface. Also, from the field observations it
is clear that the average depth for the Khijadiya wetland can be assumed to be 1ft or, at the most, half
a metre (30cm or 50cm). Thus, a wetland can be assumed to be a conical frustrum, with a cross
sectional view as shown in Fig. 9 above. .
Considering the wetland as a conical frustum, the volume can be estimated as:
21213
1AAAAHV (5)
Where A1, A2 and H are surface area of the top surface, surface area of the bottom surface and average
depth of wetland, respectively. Based on the assumption of bottom surface (10km2 or 12km2) and depth
(30cm or 50cm), as explained above, the storage capacity of the Khijadiya wetland has been estimated
using the equation 5 for volume of a conical frustrum. The estimated capacities of the the wetland are
given in Table 3.
Assumptions Storage capacity (Million cubic metres)
1 Bottom surface area = 10km2 Average depth = 30cm
2.55
2 Bottom surface area = 10km2 Average depth = 50cm
4.26
3 Bottom surface area = 12km2 Average depth = 30cm
2.75
4 Bottom surface area = 12km2 Average depth = 50cm
4.59
Table 3 Various combinations of wetland storage capacity
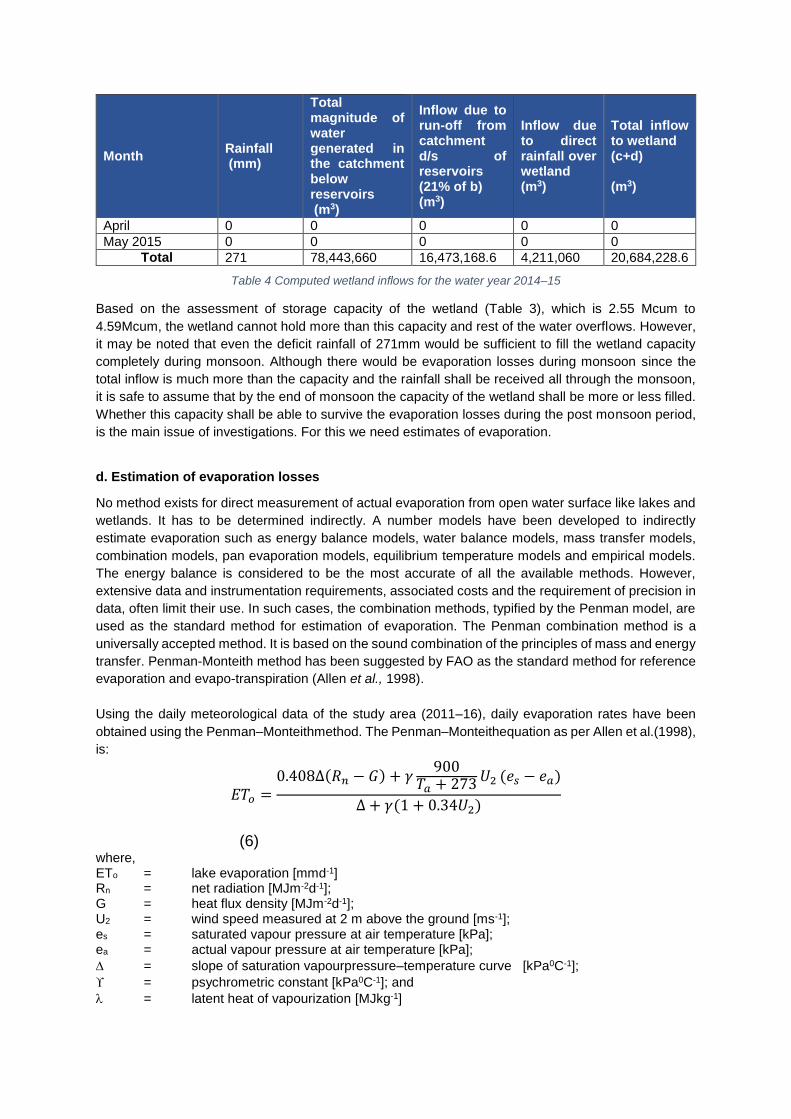
c. Estimation of total inflow
Total inflow to the wetland is the sum of inflow due to surface run-off from catchment (downstream of
the reservoirs) + inflow due to direct rainfall over the wetland. Total inflow into wetland has been
calculated as 21 per cent of the rainfall falling over the catchment downstream of the reservoirs, based
on the runoff coefficient of 21% for Jamnagar area as reported by Shah (2015). The catchment area
downstream of the reservoirs is 305km2 including the wetland area. The maximum water spread area
of the wetland is 15.54km2, and therefore, the area of the catchment area of the wetland downstream
of the reservoirs is 289.46km2. The computed monthly inflows into the wetland are given in Table 4.
Thus, the total water received by the wetland during 2014–15 as inflow was only 20.7Mcum, of which
16.5Mcum was contributed by the catchment downstream of reservoirs and 4.2Mcum was contributed
by the Inflow due to direct rainfall over wetland. Most of the water was received during the four monsoon
months of June to September in 2014. Thus, about 19.9Mcum was received during monsoon 2014 of
which about 15.9Mcum was from the catchment and about 4.0Mcum from direct rains over the wetland.
Month Rainfall (mm)
Total magnitude of water generated in the catchment below reservoirs (m3)
Inflow due to run-off from catchment d/s of reservoirs (21% of b) (m3)
Inflow due to direct rainfall over wetland (m3)
Total inflow to wetland (c+d) (m3)
(a) (b) (c) (d) (e)
June 2014 7 2,026,220 425,506.2 108,500 534,006.2
July 136.5 39,511,290 8,297,370.9 2,115,750 10,413,120.9
August 85 24,604,100 5,166,861 1,317,500 6,484,361
Sept 33 9,552,180 2,005,957.8 511,500 2,517,457.8
Oct 0 0 0 0 0
Nov 0.5 144,730 30,393.3 7,750 38,143.3
Dec 0 0 0 0 0
Jan 2015 0 0 0 0 0
Feb 0 0 0 0 0
March 9 2,605,140 547,079.4 139,500 686,579.4
Month Rainfall (mm)
Total magnitude of water generated in the catchment below reservoirs (m3)
Inflow due to run-off from catchment d/s of reservoirs (21% of b) (m3)
Inflow due to direct rainfall over wetland (m3)
Total inflow to wetland (c+d) (m3)
April 0 0 0 0 0
May 2015 0 0 0 0 0
Total 271 78,443,660 16,473,168.6 4,211,060 20,684,228.6
Table 4 Computed wetland inflows for the water year 2014–15
Based on the assessment of storage capacity of the wetland (Table 3), which is 2.55 Mcum to
4.59Mcum, the wetland cannot hold more than this capacity and rest of the water overflows. However,
it may be noted that even the deficit rainfall of 271mm would be sufficient to fill the wetland capacity
completely during monsoon. Although there would be evaporation losses during monsoon since the
total inflow is much more than the capacity and the rainfall shall be received all through the monsoon,
it is safe to assume that by the end of monsoon the capacity of the wetland shall be more or less filled.
Whether this capacity shall be able to survive the evaporation losses during the post monsoon period,
is the main issue of investigations. For this we need estimates of evaporation.
d. Estimation of evaporation losses
No method exists for direct measurement of actual evaporation from open water surface like lakes and
wetlands. It has to be determined indirectly. A number models have been developed to indirectly
estimate evaporation such as energy balance models, water balance models, mass transfer models,
combination models, pan evaporation models, equilibrium temperature models and empirical models.
The energy balance is considered to be the most accurate of all the available methods. However,
extensive data and instrumentation requirements, associated costs and the requirement of precision in
data, often limit their use. In such cases, the combination methods, typified by the Penman model, are
used as the standard method for estimation of evaporation. The Penman combination method is a
universally accepted method. It is based on the sound combination of the principles of mass and energy
transfer. Penman-Monteith method has been suggested by FAO as the standard method for reference
evaporation and evapo-transpiration (Allen et al., 1998).
Using the daily meteorological data of the study area (2011–16), daily evaporation rates have been
obtained using the Penman–Monteithmethod. The Penman–Monteithequation as per Allen et al.(1998),
is:
𝐸𝑇𝑜 =0.408∆(𝑅𝑛 − 𝐺) + 𝛾
900𝑇𝑎 + 273 𝑈2 (𝑒𝑠 − 𝑒𝑎)
∆ + 𝛾(1 + 0.34𝑈2)
(6) where, ETo = lake evaporation [mmd-1] Rn = net radiation [MJm-2d-1]; G = heat flux density [MJm-2d-1]; U2 = wind speed measured at 2 m above the ground [ms-1]; es = saturated vapour pressure at air temperature [kPa]; ea = actual vapour pressure at air temperature [kPa];
= slope of saturation vapourpressure–temperature curve [kPa0C-1];
= psychrometric constant [kPa0C-1]; and
= latent heat of vapourization [MJkg-1]
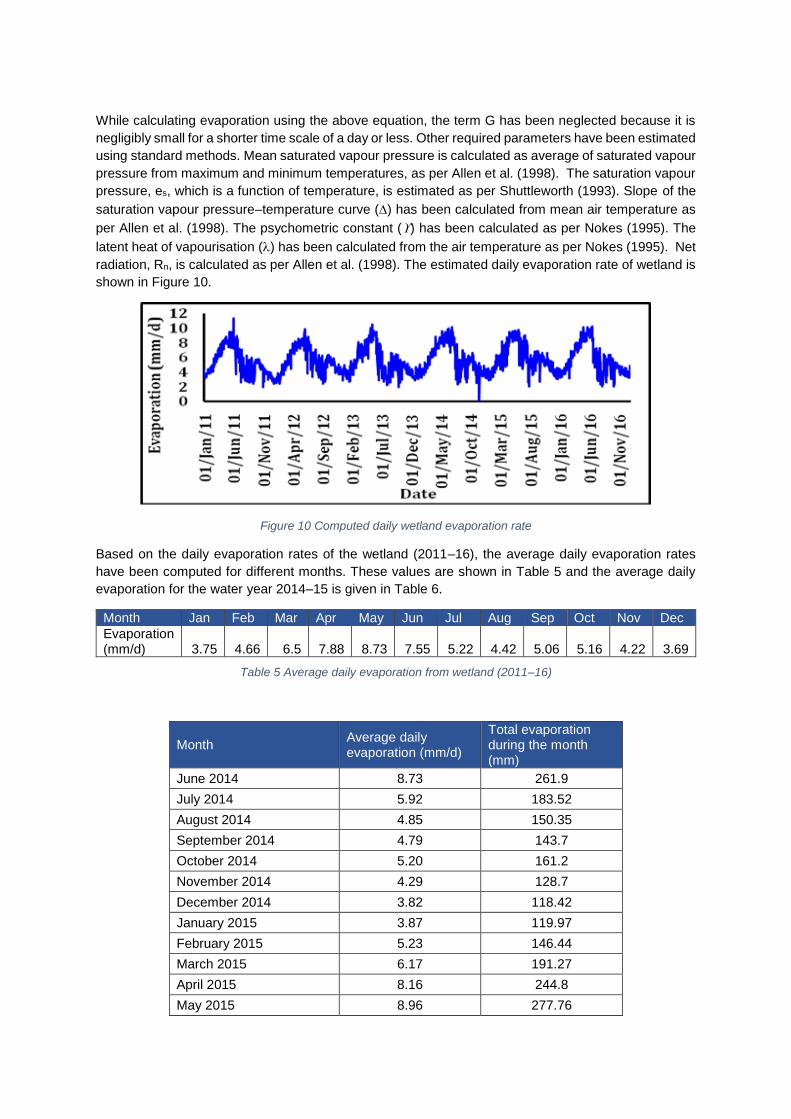
While calculating evaporation using the above equation, the term G has been neglected because it is
negligibly small for a shorter time scale of a day or less. Other required parameters have been estimated
using standard methods. Mean saturated vapour pressure is calculated as average of saturated vapour
pressure from maximum and minimum temperatures, as per Allen et al. (1998). The saturation vapour
pressure, es, which is a function of temperature, is estimated as per Shuttleworth (1993). Slope of the
saturation vapour pressure–temperature curve () has been calculated from mean air temperature as
per Allen et al. (1998). The psychometric constant () has been calculated as per Nokes (1995). The
latent heat of vapourisation () has been calculated from the air temperature as per Nokes (1995). Net
radiation, Rn, is calculated as per Allen et al. (1998). The estimated daily evaporation rate of wetland is
shown in Figure 10.
Figure 10 Computed daily wetland evaporation rate
Based on the daily evaporation rates of the wetland (2011–16), the average daily evaporation rates
have been computed for different months. These values are shown in Table 5 and the average daily
evaporation for the water year 2014–15 is given in Table 6.
Month Jan Feb Mar Apr May Jun Jul Aug Sep Oct Nov Dec
Evaporation (mm/d) 3.75 4.66 6.5 7.88 8.73 7.55 5.22 4.42 5.06 5.16 4.22 3.69
Table 5 Average daily evaporation from wetland (2011–16)
Month Average daily evaporation (mm/d)
Total evaporation during the month (mm)
June 2014 8.73 261.9
July 2014 5.92 183.52
August 2014 4.85 150.35
September 2014 4.79 143.7
October 2014 5.20 161.2
November 2014 4.29 128.7
December 2014 3.82 118.42
January 2015 3.87 119.97
February 2015 5.23 146.44
March 2015 6.17 191.27
April 2015 8.16 244.8
May 2015 8.96 277.76
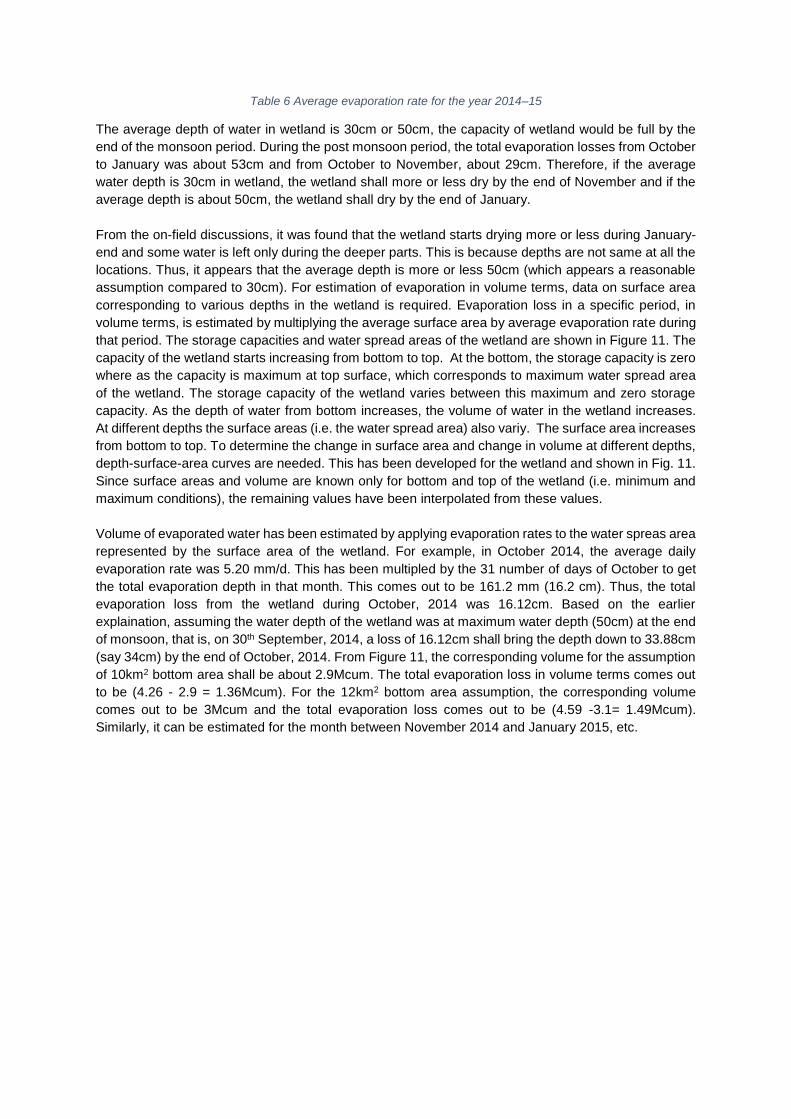
Table 6 Average evaporation rate for the year 2014–15
The average depth of water in wetland is 30cm or 50cm, the capacity of wetland would be full by the
end of the monsoon period. During the post monsoon period, the total evaporation losses from October
to January was about 53cm and from October to November, about 29cm. Therefore, if the average
water depth is 30cm in wetland, the wetland shall more or less dry by the end of November and if the
average depth is about 50cm, the wetland shall dry by the end of January.
From the on-field discussions, it was found that the wetland starts drying more or less during January-
end and some water is left only during the deeper parts. This is because depths are not same at all the
locations. Thus, it appears that the average depth is more or less 50cm (which appears a reasonable
assumption compared to 30cm). For estimation of evaporation in volume terms, data on surface area
corresponding to various depths in the wetland is required. Evaporation loss in a specific period, in
volume terms, is estimated by multiplying the average surface area by average evaporation rate during
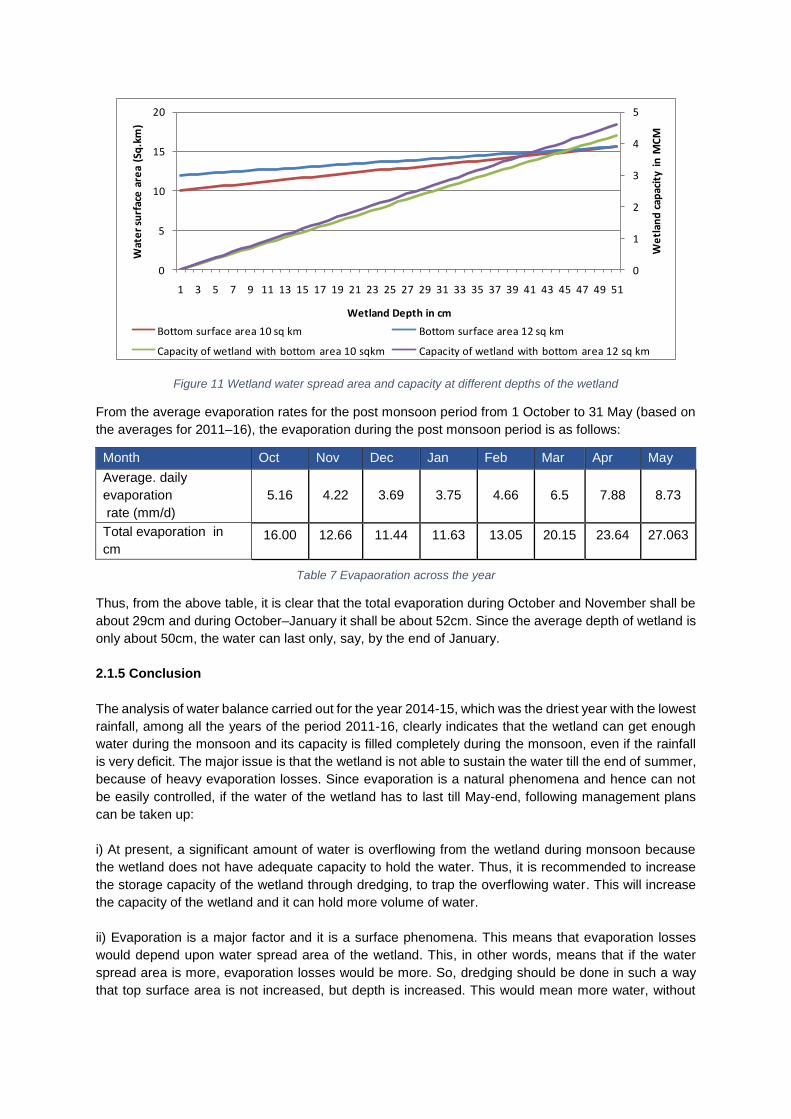
that period. The storage capacities and water spread areas of the wetland are shown in Figure 11. The
capacity of the wetland starts increasing from bottom to top. At the bottom, the storage capacity is zero
where as the capacity is maximum at top surface, which corresponds to maximum water spread area
of the wetland. The storage capacity of the wetland varies between this maximum and zero storage
capacity. As the depth of water from bottom increases, the volume of water in the wetland increases.
At different depths the surface areas (i.e. the water spread area) also variy. The surface area increases
from bottom to top. To determine the change in surface area and change in volume at different depths,
depth-surface-area curves are needed. This has been developed for the wetland and shown in Fig. 11.
Since surface areas and volume are known only for bottom and top of the wetland (i.e. minimum and
maximum conditions), the remaining values have been interpolated from these values.
Volume of evaporated water has been estimated by applying evaporation rates to the water spreas area
represented by the surface area of the wetland. For example, in October 2014, the average daily
evaporation rate was 5.20 mm/d. This has been multipled by the 31 number of days of October to get
the total evaporation depth in that month. This comes out to be 161.2 mm (16.2 cm). Thus, the total
evaporation loss from the wetland during October, 2014 was 16.12cm. Based on the earlier
explaination, assuming the water depth of the wetland was at maximum water depth (50cm) at the end
of monsoon, that is, on 30th September, 2014, a loss of 16.12cm shall bring the depth down to 33.88cm
(say 34cm) by the end of October, 2014. From Figure 11, the corresponding volume for the assumption
of 10km2 bottom area shall be about 2.9Mcum. The total evaporation loss in volume terms comes out
to be (4.26 - 2.9 = 1.36Mcum). For the 12km2 bottom area assumption, the corresponding volume
comes out to be 3Mcum and the total evaporation loss comes out to be (4.59 -3.1= 1.49Mcum).
Similarly, it can be estimated for the month between November 2014 and January 2015, etc.
0
1
2
3
4
5
0
5
10
15
20
1 3 5 7 9 11 13 15 17 19 21 23 25 27 29 31 33 35 37 39 41 43 45 47 49 51
We
tlan
d c
apac
ity
in M
CM
Wat
er
surf
ace
are
a (S
q.k
m)
Wetland Depth in cm
Bottom surface area 10 sq km Bottom surface area 12 sq km
Capacity of wetland with bottom area 10 sqkm Capacity of wetland with bottom area 12 sq km
Figure 11 Wetland water spread area and capacity at different depths of the wetland
From the average evaporation rates for the post monsoon period from 1 October to 31 May (based on
the averages for 2011–16), the evaporation during the post monsoon period is as follows:
Month Oct Nov Dec Jan Feb Mar Apr May
Average. daily
evaporation
rate (mm/d)
5.16 4.22 3.69 3.75 4.66 6.5 7.88 8.73
Total evaporation in
cm 16.00 12.66 11.44 11.63 13.05 20.15 23.64 27.063
Table 7 Evapaoration across the year
Thus, from the above table, it is clear that the total evaporation during October and November shall be
about 29cm and during October–January it shall be about 52cm. Since the average depth of wetland is
only about 50cm, the water can last only, say, by the end of January.
2.1.5 Conclusion
The analysis of water balance carried out for the year 2014-15, which was the driest year with the lowest
rainfall, among all the years of the period 2011-16, clearly indicates that the wetland can get enough
water during the monsoon and its capacity is filled completely during the monsoon, even if the rainfall
is very deficit. The major issue is that the wetland is not able to sustain the water till the end of summer,
because of heavy evaporation losses. Since evaporation is a natural phenomena and hence can not
be easily controlled, if the water of the wetland has to last till May-end, following management plans
can be taken up:
i) At present, a significant amount of water is overflowing from the wetland during monsoon because
the wetland does not have adequate capacity to hold the water. Thus, it is recommended to increase
the storage capacity of the wetland through dredging, to trap the overflowing water. This will increase
the capacity of the wetland and it can hold more volume of water.
ii) Evaporation is a major factor and it is a surface phenomena. This means that evaporation losses
would depend upon water spread area of the wetland. This, in other words, means that if the water
spread area is more, evaporation losses would be more. So, dredging should be done in such a way
that top surface area is not increased, but depth is increased. This would mean more water, without

increasing the top water spread area. In other words, it means that the water may be stored depth-wise
and not laterally, so that it can last for more days by reducing the volume of evaporation losses.
iii) If we want to maintain a specific depth say 30cm (of the average depth of 50cm) throughout the
summer months, then we have to work out the total evaporation loss of water during the post monsoon
season for this depth. The corresponding water spread area for the 30cm depth for assumed 10km2
bottom condition is 13.32km2 and for 12km2 bottom surface assumption it comes out to be 14.12km2
from the interpolation curves. Now, the average evaporation for the post monsoon period of October–
May is 5.57mm/d. So the total evaporation losses would come out to be 0.074Mcum per day for the
assumed 10km2 bottom condition and 0.079 for the 12km2 assumed bottom condition. Since there are
243 days from 1 October to 31 May, the total evaporation loss for these 243 days comes out to be
18.02–19.11MCM. This means that about 18–19Mcum (say, about 20Mcum) of water shall be required
for the post monsoon period to maintain the 30cm depth in the wetland throughout the summer (if there
is no increase in the present capacity)
iv) Some of this water may be supplied by preventing the overflow and storing the water in a reservoir.
However, since there would be evaporation losses from such reservoirs, it is likely to be a challenge to
fulfil the above demand. Increasing depth of the wetland through dredging may not be able to fulfill the
requirement. This is because the present capacity of the wetland is about 5 Mcum at the average depth
of about 50 cm. If we increase the depth by about 50 cm, the additional storage capacity would be only
about 5 Mcum, which is not adequate. If we increase the depth too much, it would become a lake and
will not be preferred by some of the water birds that prefer only shallow water. Moreover, too much
depening may also be risky as it may give rise to possible interaction with the brakish ground water.
v) Thus, it is obvious that additional water may have to be brought from other sources, such as the
reservoirs located upstream of the wetland to meet the water requirements of the wetland for the period
of January to May. This requirement could be around 19 Mcum, if no dredging of the wetland is carried
out or less, depending upon the depth of dredging, if it is carried out.
2.6 Recommendations for improving water retention in the wetland
When considering the water retention capacity of some forms of wetlands, such as mires, swamps, marshes, and wet grasslands, it is crucial to particularly focus on:
Water retention capacity of the wetland soil, the ability to retain water in soil pores of the aeration zone
Water retention capacity of the wetland (marsh and swamp), the ability to retain water on the surface of wetland areas
Water retention capacity of the plateau in the adjacent area, can occur as a result of the delay of groundwater outflow by the creation of peat in a fen or bog on the slope of the valley.
Rainwater can be retained in soil pores in the unsaturated zone, which is a zone between the ground level, and the groundwater table level. The higher the level of groundwater, the smaller the soil retention capacity, with the soil retention capacity being defined as the space that can be filled with inflowing water as a result of flood or excessive precipitation.
In a natural wetland, if the groundwater table level is located on the surface of the ground, water retention capacity equals almost to zero. Therefore, every single drop that falls on the surface on such wetland can, theoretically, run-off to the river. The drainage of wetlands does not minimisethe flood wave.
Natural wetlands that are covered with some kind of swamp plants, for example shrubs, are characterised by significant hydraulic resistance. Moreover, small elevation differences of the terrain are typical to these areas. This is the reason why water in the form of snow melt or flood water run-off from the area of wetlands slowly. Therefore, swampy river valleys can be treated as retention reservoirs. Water that flows into the area of the wetland can slowly run-off back into rivers, which decreases the flood wave on a river section situated below the wetland. This phenomenon is clearly visible; for example, the wide (over 10km width) Biebrza valley in Poland. Water can be retained on the surface of the valley for more than a few months. Therefore, as discussed above, a single drop of water can freely, but slowly, get back to the river it came from.
Some of the potential management options include:
Dredging
The depth of the wetland is an important parameter when looking at the water storage capacity of the wetland. Rainwater is retained in soil pores in the unsaturated zone, which is a zone between the ground or surface level, and the groundwater table level. The higher the level of groundwater, the smaller the soil retention capacity, with the soil retention capacity being defined as the space that can be filled with inflowing water as a result of flood or excessive precipitation.
Dredging can be used as a measure to increase the level of water stored in the wetland during monsoon months, thus, increasing the water availability during non-monsoon months.
However, it may be noted that increasing depth of the wetland through dredging may not be able to fulfill the requirement, as explained earlier. If we increase the depth by about 50 cm, the additional storage capacity would be only about 5 Mcum, which is not adequate. If we increase the depth too much, it would become a lake and will not be preferred by some of the water birds that prefer only shallow water. Moreover, too much depening may also be risky as it may give rise to possible interaction with the brackish/saline ground water. Since the groundwater surrounding Khijadiya Bird Sanctuary is likely to be highly saline due to seawater interaction, dredging beyond the groundwater table depth can lead to a significant increase the salinity levels of fresh or brackish surface water, and the soil quality of wetland. Nevertheless, careful dredging can be done in some selected pockets of the wetland, where ground water salinity is not too high; the water in these dredged pockets can be pumped across other parts of the wetland during the dry period (post monsoon period of October–May).
Siltation prevention measures:
Through the hydrological assessment exercise, it was found that siltation from the run-off of streams surrounding the wetland is one of the reasons for reduced water retention capacity of the wetland. However, siltation is also an essential ecological feature of wetlands, and removing
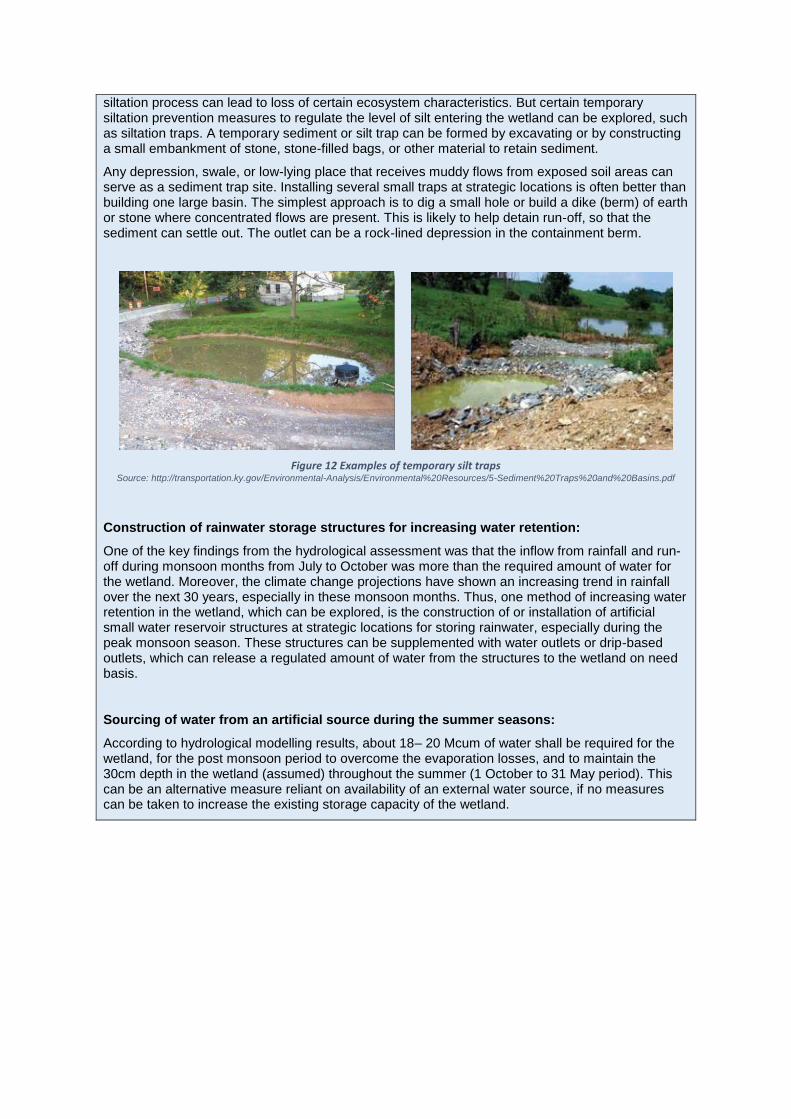
siltation process can lead to loss of certain ecosystem characteristics. But certain temporary siltation prevention measures to regulate the level of silt entering the wetland can be explored, such as siltation traps. A temporary sediment or silt trap can be formed by excavating or by constructing a small embankment of stone, stone-filled bags, or other material to retain sediment.
Any depression, swale, or low-lying place that receives muddy flows from exposed soil areas can serve as a sediment trap site. Installing several small traps at strategic locations is often better than building one large basin. The simplest approach is to dig a small hole or build a dike (berm) of earth or stone where concentrated flows are present. This is likely to help detain run-off, so that the sediment can settle out. The outlet can be a rock-lined depression in the containment berm.
Figure 12 Examples of temporary silt traps Source: http://transportation.ky.gov/Environmental-Analysis/Environmental%20Resources/5-Sediment%20Traps%20and%20Basins.pdf
Construction of rainwater storage structures for increasing water retention:
One of the key findings from the hydrological assessment was that the inflow from rainfall and run-off during monsoon months from July to October was more than the required amount of water for the wetland. Moreover, the climate change projections have shown an increasing trend in rainfall over the next 30 years, especially in these monsoon months. Thus, one method of increasing water retention in the wetland, which can be explored, is the construction of or installation of artificial small water reservoir structures at strategic locations for storing rainwater, especially during the peak monsoon season. These structures can be supplemented with water outlets or drip-based outlets, which can release a regulated amount of water from the structures to the wetland on need basis.
Sourcing of water from an artificial source during the summer seasons:
According to hydrological modelling results, about 18– 20 Mcum of water shall be required for the wetland, for the post monsoon period to overcome the evaporation losses, and to maintain the 30cm depth in the wetland (assumed) throughout the summer (1 October to 31 May period). This can be an alternative measure reliant on availability of an external water source, if no measures can be taken to increase the existing storage capacity of the wetland.
3. Climate risks and
vulnerability This section provides a detailed assessment of the vulnerability of Khijadiya Bird Sanctuary to the
impacts of climate change, with particular emphasis on understanding the likely changes in hydrological
regimes in these regions.
3.1 Key climate change issues and influencing factors
Climate change refers to any change in climatic conditions over and above the natural variability of the
climate system, resulting either from natural causes, or by human action, or both. Recently, climate
change has been directly linked to the intensification of emissions of greenhouse gases on the terrestrial
atmosphere (IPCC, 2007a). Greenhouse gases that are naturally found in the atmosphere are carbon
dioxide (CO2), ozone (O3), methane (CH4), nitrous oxide (N2O) and water vapour (H2O). Moreover, there
are a number of entirely man-made greenhouse gases in the atmosphere, such as the halocarbons and
other chlorine and bromine containing substances, sulphur hexafluoride (SF6), hydrofluorocarbons
(HFCs) and perfluorocarbons (PFCs).2 The presence of these gases modulates the temperature of the
earth’s surface. However, since the industrial revolution, there is evidence that human activities,
especially the burning of fossil fuels (coal, oil and natural gas), have caused an increase in the
concentration of some greenhouse gases, especially CO2, which is considered to have the strongest
effect on global warming.3
The main characteristics of climate change are: increases in average global temperature (global
warming); changes in cloud cover and precipitation particularly over land; melting of ice caps and
glaciers and reduced snow cover; and, increases in ocean temperatures and ocean acidity — due to
seawater absorbing heat and carbon dioxide from the atmosphere. As a result of global warming, the
type, frequency and intensity of extreme events, such as tropical cyclones (including hurricanes and
typhoons), floods, droughts and heavy precipitation events, are expected to rise even with relatively
small average temperature increases. Changes in some types of extreme events have already been
observed; for example, increases in the frequency and intensity of heat waves and heavy precipitation
events. Changes in rainfall pattern are likely to lead to severe water shortages and/or flooding. Melting
of glaciers can cause flooding and soil erosion. Rising temperatures will cause shifts in crop growing
seasons which affects food security and changes in the distribution of disease vectors putting more
people at risk from diseases such as malaria and dengue fever. Temperature increases would
potentially severely increase the rate of extinction for many habitats and species (up to 30 per cent with
a 2°C rise in temperature), and coral reefs, forests, and mountain habitats are likely to be significantly
affected, in particular. Increasing level of seas means greater risk of storm surge, inundation and wave
damage to coastlines.4
The range of impacts that climate change may have on wetlands is wide and varied. Climate change is
predicted to alter patterns of rainfall, river flow, groundwater level and sea level and also result in
changes to other variables such as temperature and evaporation. These are all important drivers of
wetland structure and function. However, the overarching driver is via changes in wetland hydrology,
particularly the frequency and duration of inundation events. Changes in frequency and duration of the
wet phase are predicted to result in a shift in vegetation community composition towards species
2 Source: IPCC, https://www.ipcc.ch/ipccreports/tar/wg1/518.htm 3 Source: ‘Possible impacts of climate change on wetlands and its biota in the Brazilian Amazon’, Braz. J. Biol. vol.74 no.4 São Carlos Nov. 2014, http://www.scielo.br/scielo.php?script=sci_arttext&pid=S1519-69842014000400810 4 Source: https://unfccc.int/resource/docs/publications/impacts.pdf
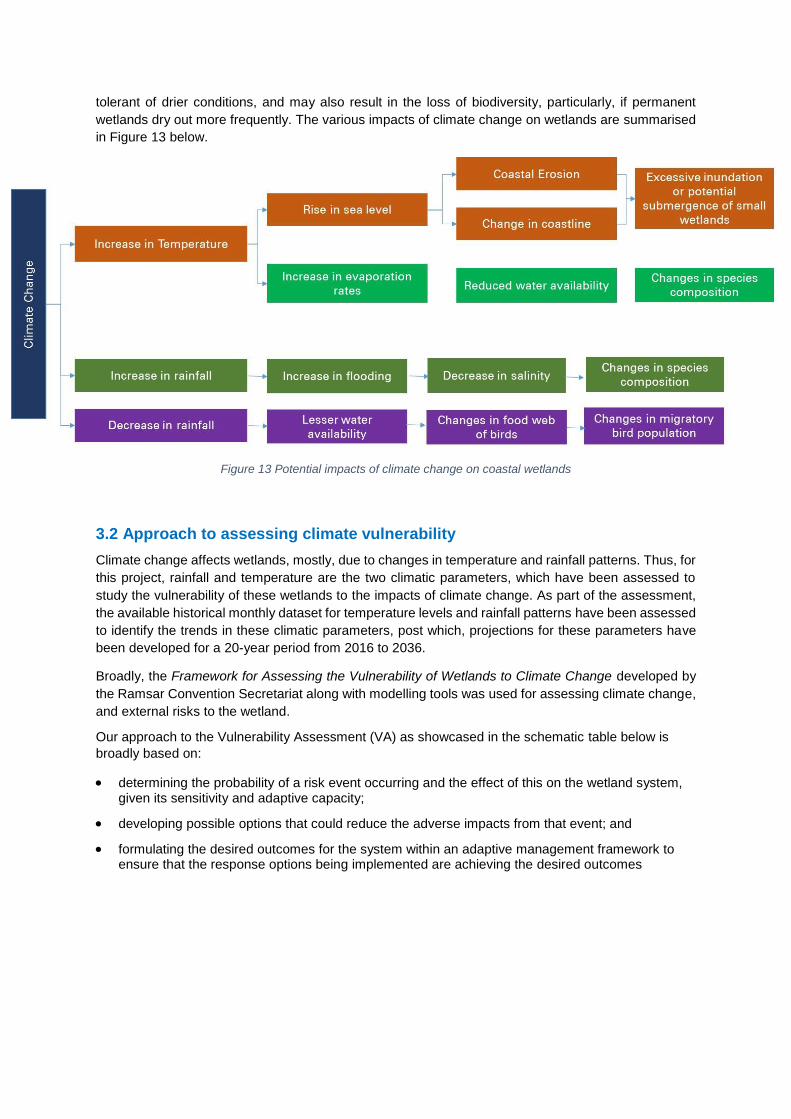
tolerant of drier conditions, and may also result in the loss of biodiversity, particularly, if permanent
wetlands dry out more frequently. The various impacts of climate change on wetlands are summarised
in Figure 13 below.
Figure 13 Potential impacts of climate change on coastal wetlands
3.2 Approach to assessing climate vulnerability
Climate change affects wetlands, mostly, due to changes in temperature and rainfall patterns. Thus, for
this project, rainfall and temperature are the two climatic parameters, which have been assessed to
study the vulnerability of these wetlands to the impacts of climate change. As part of the assessment,
the available historical monthly dataset for temperature levels and rainfall patterns have been assessed
to identify the trends in these climatic parameters, post which, projections for these parameters have
been developed for a 20-year period from 2016 to 2036.
Broadly, the Framework for Assessing the Vulnerability of Wetlands to Climate Change developed by
the Ramsar Convention Secretariat along with modelling tools was used for assessing climate change,
and external risks to the wetland.
Our approach to the Vulnerability Assessment (VA) as showcased in the schematic table below is
broadly based on:
determining the probability of a risk event occurring and the effect of this on the wetland system, given its sensitivity and adaptive capacity;
developing possible options that could reduce the adverse impacts from that event; and
formulating the desired outcomes for the system within an adaptive management framework to ensure that the response options being implemented are achieving the desired outcomes
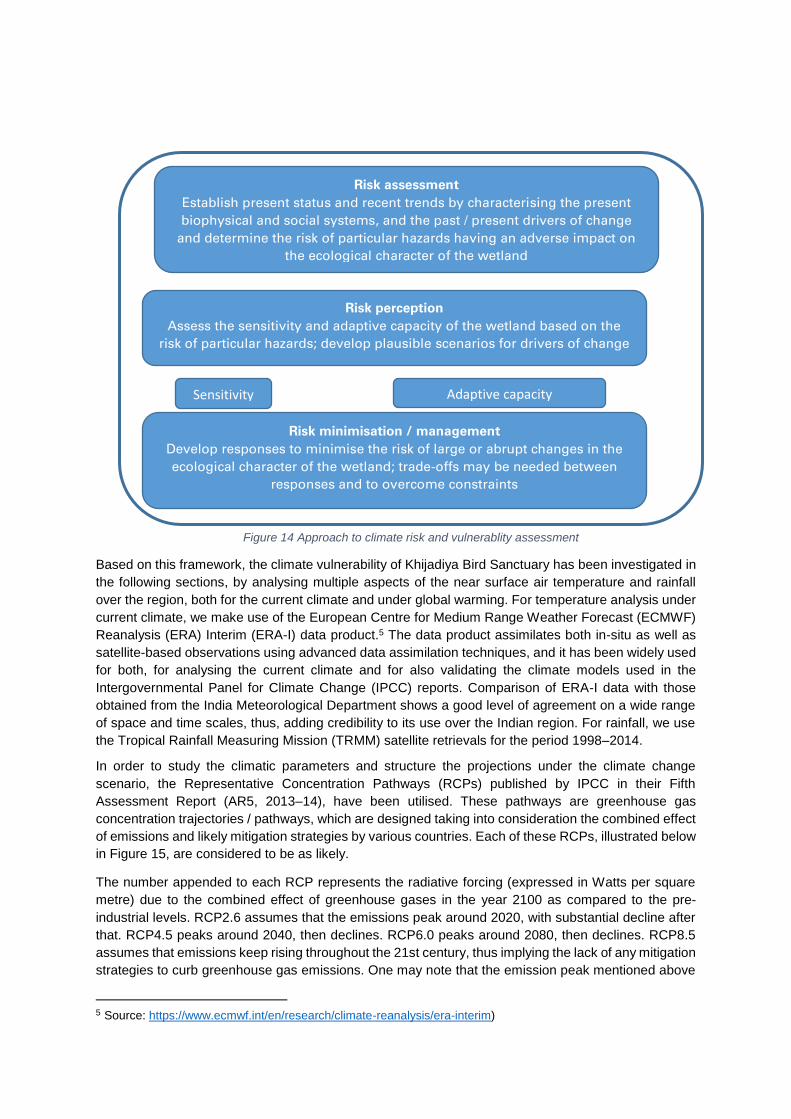
Based on this framework, the climate vulnerability of Khijadiya Bird Sanctuary has been investigated in
the following sections, by analysing multiple aspects of the near surface air temperature and rainfall
over the region, both for the current climate and under global warming. For temperature analysis under
current climate, we make use of the European Centre for Medium Range Weather Forecast (ECMWF)
Reanalysis (ERA) Interim (ERA-I) data product.5 The data product assimilates both in-situ as well as
satellite-based observations using advanced data assimilation techniques, and it has been widely used
for both, for analysing the current climate and for also validating the climate models used in the
Intergovernmental Panel for Climate Change (IPCC) reports. Comparison of ERA-I data with those
obtained from the India Meteorological Department shows a good level of agreement on a wide range
of space and time scales, thus, adding credibility to its use over the Indian region. For rainfall, we use
the Tropical Rainfall Measuring Mission (TRMM) satellite retrievals for the period 1998–2014.
In order to study the climatic parameters and structure the projections under the climate change
scenario, the Representative Concentration Pathways (RCPs) published by IPCC in their Fifth
Assessment Report (AR5, 2013–14), have been utilised. These pathways are greenhouse gas
concentration trajectories / pathways, which are designed taking into consideration the combined effect
of emissions and likely mitigation strategies by various countries. Each of these RCPs, illustrated below
in Figure 15, are considered to be as likely.
The number appended to each RCP represents the radiative forcing (expressed in Watts per square
metre) due to the combined effect of greenhouse gases in the year 2100 as compared to the pre-
industrial levels. RCP2.6 assumes that the emissions peak around 2020, with substantial decline after
that. RCP4.5 peaks around 2040, then declines. RCP6.0 peaks around 2080, then declines. RCP8.5
assumes that emissions keep rising throughout the 21st century, thus implying the lack of any mitigation
strategies to curb greenhouse gas emissions. One may note that the emission peak mentioned above
5 Source: https://www.ecmwf.int/en/research/climate-reanalysis/era-interim)
Risk assessment
Establish present status and recent trends by characterising the present
biophysical and social systems, and the past / present drivers of change
and determine the risk of particular hazards having an adverse impact on
the ecological character of the wetland
Risk perception
Assess the sensitivity and adaptive capacity of the wetland based on the
risk of particular hazards; develop plausible scenarios for drivers of change
Risk minimisation / management
Develop responses to minimise the risk of large or abrupt changes in the
ecological character of the wetland; trade-offs may be needed between
responses and to overcome constraints
Sensitivity Adaptive capacity
Figure 14 Approach to climate risk and vulnerablity assessment
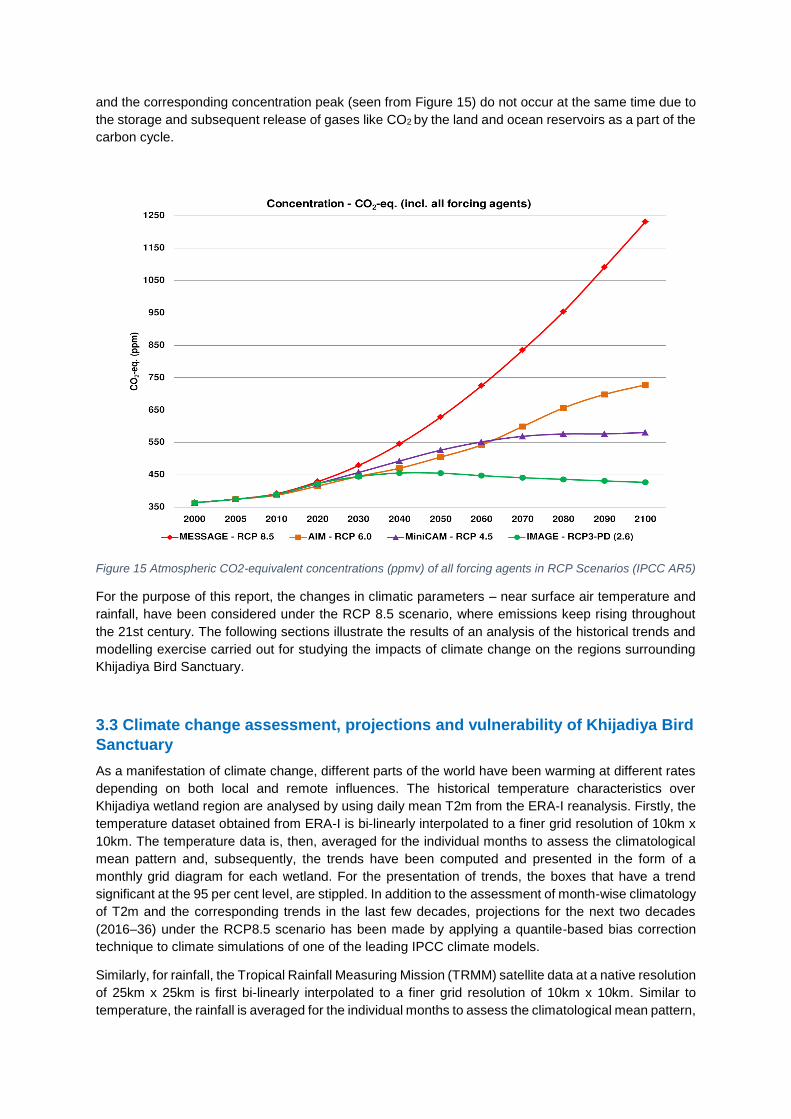
and the corresponding concentration peak (seen from Figure 15) do not occur at the same time due to
the storage and subsequent release of gases like CO2 by the land and ocean reservoirs as a part of the
carbon cycle.
Figure 15 Atmospheric CO2-equivalent concentrations (ppmv) of all forcing agents in RCP Scenarios (IPCC AR5)
For the purpose of this report, the changes in climatic parameters – near surface air temperature and
rainfall, have been considered under the RCP 8.5 scenario, where emissions keep rising throughout
the 21st century. The following sections illustrate the results of an analysis of the historical trends and
modelling exercise carried out for studying the impacts of climate change on the regions surrounding
Khijadiya Bird Sanctuary.
3.3 Climate change assessment, projections and vulnerability of Khijadiya Bird
Sanctuary
As a manifestation of climate change, different parts of the world have been warming at different rates
depending on both local and remote influences. The historical temperature characteristics over
Khijadiya wetland region are analysed by using daily mean T2m from the ERA-I reanalysis. Firstly, the
temperature dataset obtained from ERA-I is bi-linearly interpolated to a finer grid resolution of 10km x
10km. The temperature data is, then, averaged for the individual months to assess the climatological
mean pattern and, subsequently, the trends have been computed and presented in the form of a
monthly grid diagram for each wetland. For the presentation of trends, the boxes that have a trend
significant at the 95 per cent level, are stippled. In addition to the assessment of month-wise climatology
of T2m and the corresponding trends in the last few decades, projections for the next two decades
(2016–36) under the RCP8.5 scenario has been made by applying a quantile-based bias correction
technique to climate simulations of one of the leading IPCC climate models.
Similarly, for rainfall, the Tropical Rainfall Measuring Mission (TRMM) satellite data at a native resolution
of 25km x 25km is first bi-linearly interpolated to a finer grid resolution of 10km x 10km. Similar to
temperature, the rainfall is averaged for the individual months to assess the climatological mean pattern,
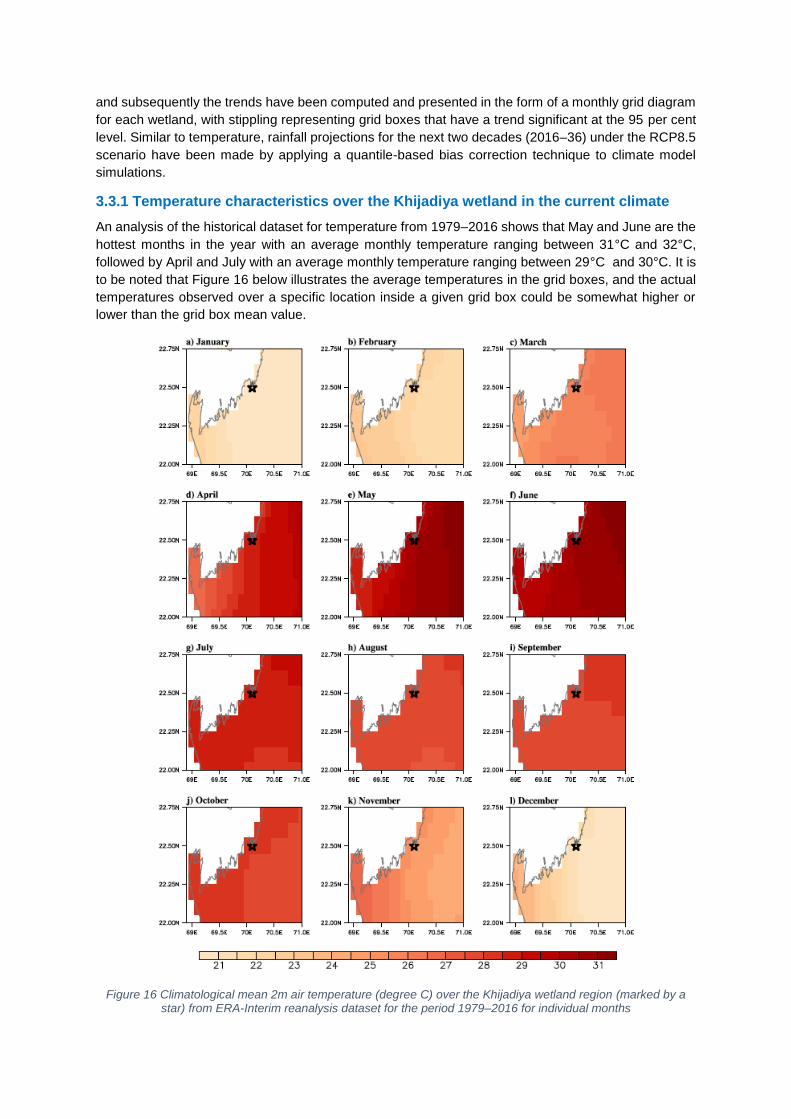
and subsequently the trends have been computed and presented in the form of a monthly grid diagram
for each wetland, with stippling representing grid boxes that have a trend significant at the 95 per cent
level. Similar to temperature, rainfall projections for the next two decades (2016–36) under the RCP8.5
scenario have been made by applying a quantile-based bias correction technique to climate model
simulations.
3.3.1 Temperature characteristics over the Khijadiya wetland in the current climate
An analysis of the historical dataset for temperature from 1979–2016 shows that May and June are the
hottest months in the year with an average monthly temperature ranging between 31°C and 32°C,
followed by April and July with an average monthly temperature ranging between 29°C and 30°C. It is
to be noted that Figure 16 below illustrates the average temperatures in the grid boxes, and the actual
temperatures observed over a specific location inside a given grid box could be somewhat higher or
lower than the grid box mean value.
Figure 16 Climatological mean 2m air temperature (degree C) over the Khijadiya wetland region (marked by a star) from ERA-Interim reanalysis dataset for the period 1979–2016 for individual months
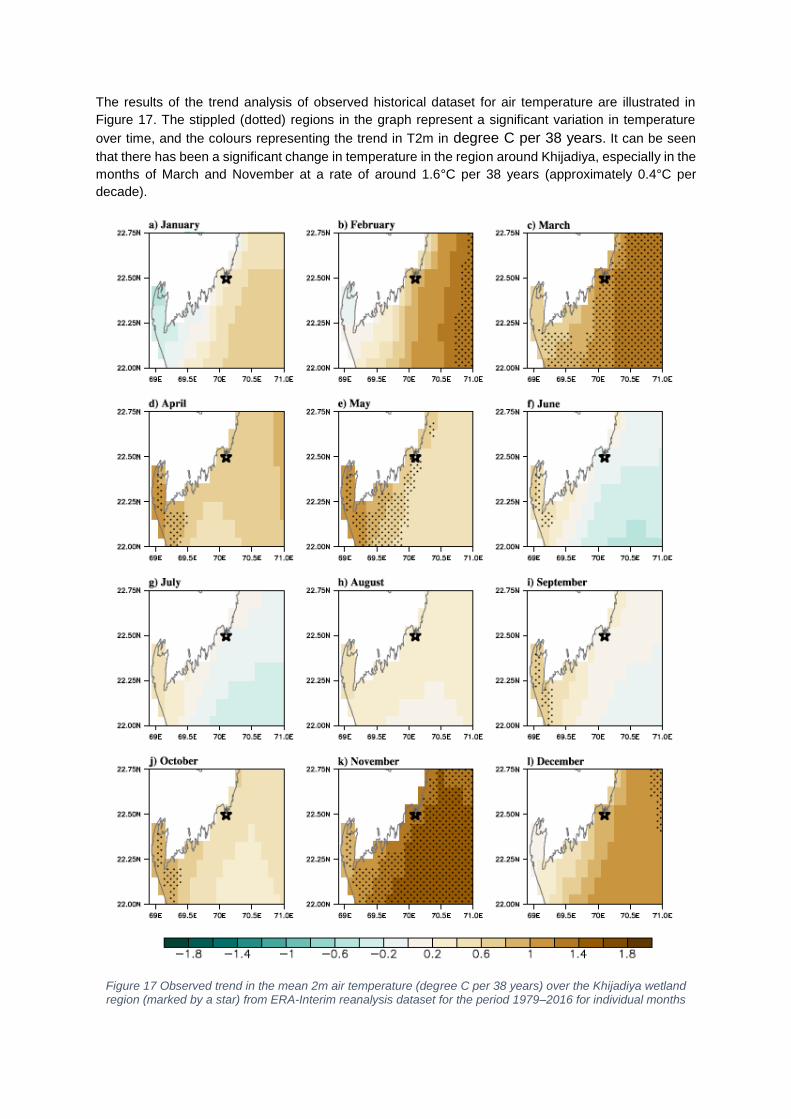
The results of the trend analysis of observed historical dataset for air temperature are illustrated in
Figure 17. The stippled (dotted) regions in the graph represent a significant variation in temperature
over time, and the colours representing the trend in T2m in degree C per 38 years. It can be seen
that there has been a significant change in temperature in the region around Khijadiya, especially in the
months of March and November at a rate of around 1.6°C per 38 years (approximately 0.4°C per
decade).
Figure 17 Observed trend in the mean 2m air temperature (degree C per 38 years) over the Khijadiya wetland region (marked by a star) from ERA-Interim reanalysis dataset for the period 1979–2016 for individual months
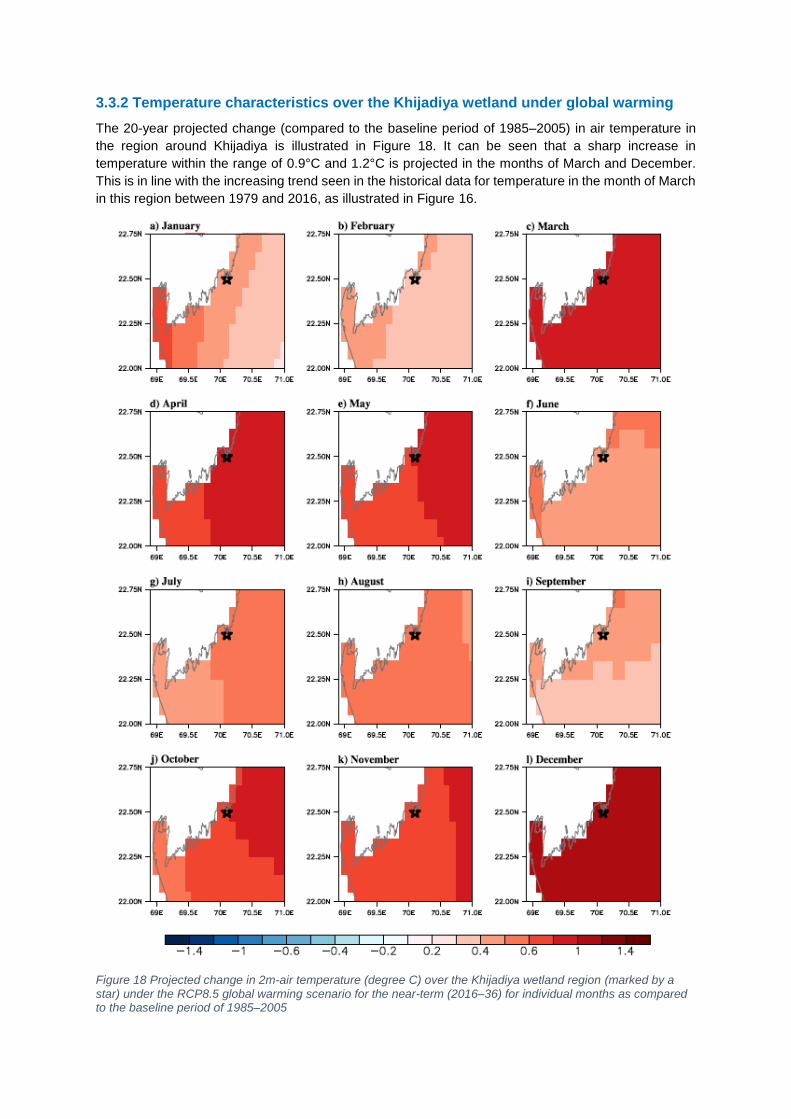
3.3.2 Temperature characteristics over the Khijadiya wetland under global warming
The 20-year projected change (compared to the baseline period of 1985–2005) in air temperature in
the region around Khijadiya is illustrated in Figure 18. It can be seen that a sharp increase in
temperature within the range of 0.9°C and 1.2°C is projected in the months of March and December.
This is in line with the increasing trend seen in the historical data for temperature in the month of March
in this region between 1979 and 2016, as illustrated in Figure 16.
Figure 18 Projected change in 2m-air temperature (degree C) over the Khijadiya wetland region (marked by a star) under the RCP8.5 global warming scenario for the near-term (2016–36) for individual months as compared to the baseline period of 1985–2005
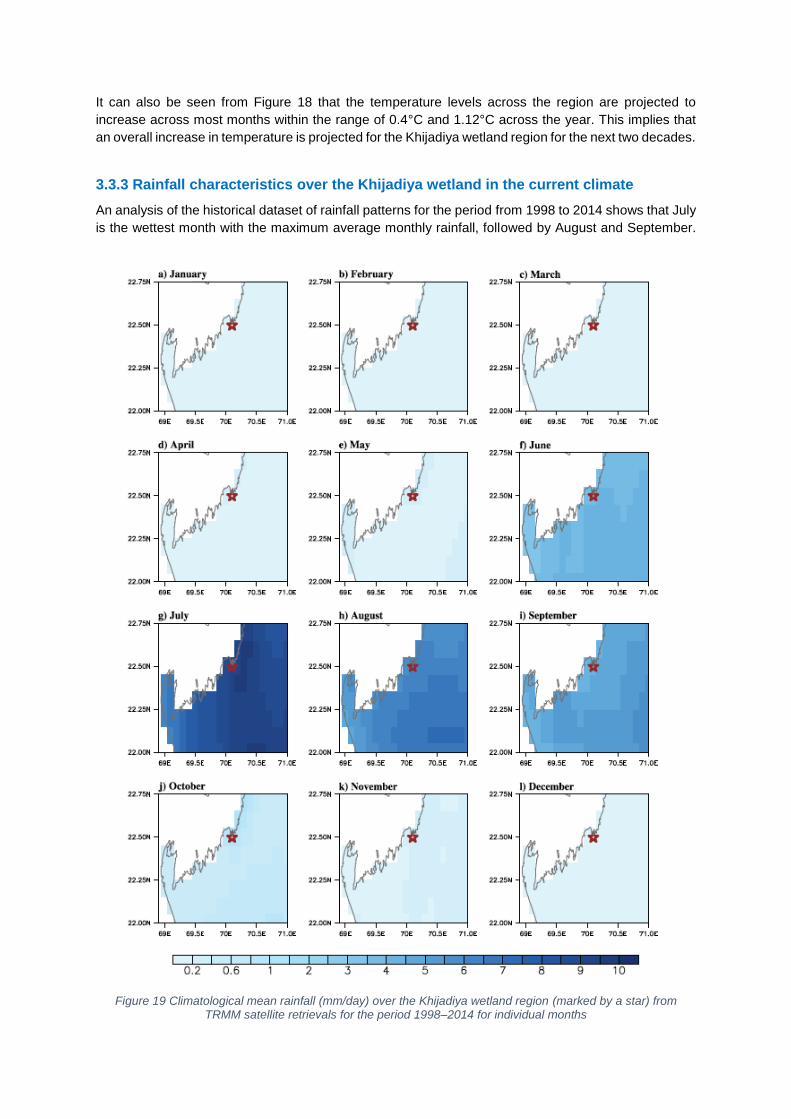
It can also be seen from Figure 18 that the temperature levels across the region are projected to
increase across most months within the range of 0.4°C and 1.12°C across the year. This implies that
an overall increase in temperature is projected for the Khijadiya wetland region for the next two decades.
3.3.3 Rainfall characteristics over the Khijadiya wetland in the current climate
An analysis of the historical dataset of rainfall patterns for the period from 1998 to 2014 shows that July
is the wettest month with the maximum average monthly rainfall, followed by August and September.
Figure 19 Climatological mean rainfall (mm/day) over the Khijadiya wetland region (marked by a star) from TRMM satellite retrievals for the period 1998–2014 for individual months
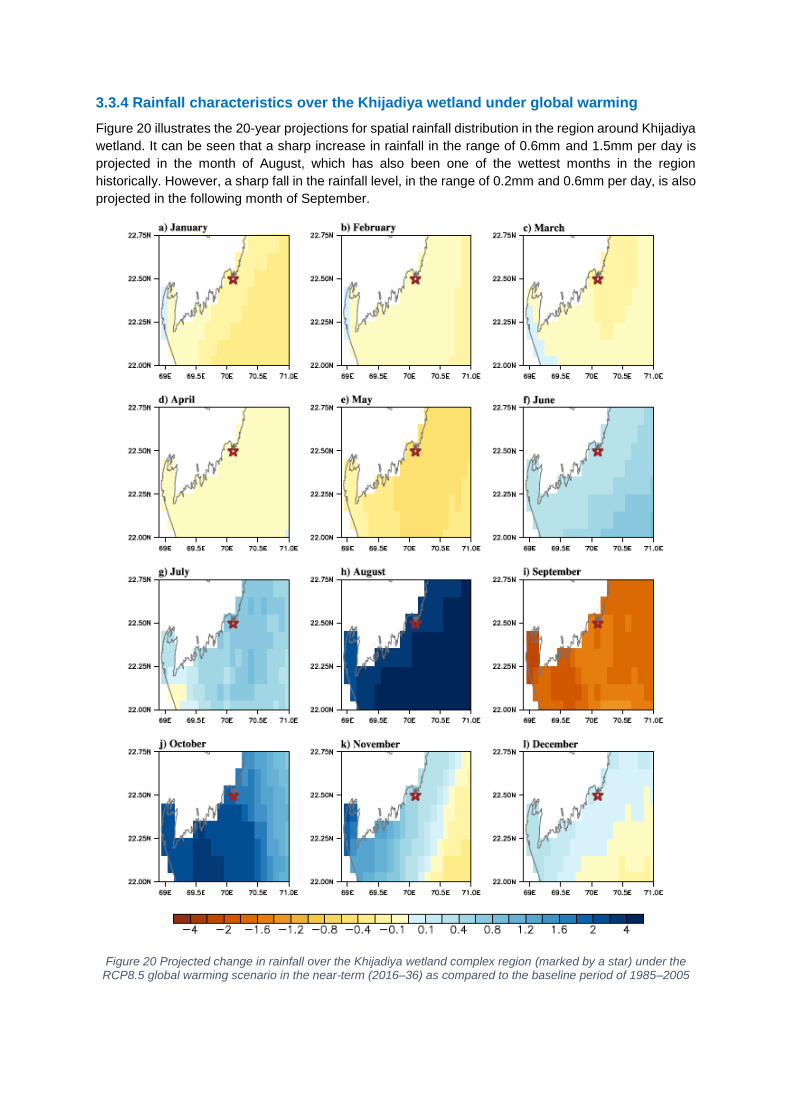
3.3.4 Rainfall characteristics over the Khijadiya wetland under global warming
Figure 20 illustrates the 20-year projections for spatial rainfall distribution in the region around Khijadiya
wetland. It can be seen that a sharp increase in rainfall in the range of 0.6mm and 1.5mm per day is
projected in the month of August, which has also been one of the wettest months in the region
historically. However, a sharp fall in the rainfall level, in the range of 0.2mm and 0.6mm per day, is also
projected in the following month of September.
Figure 20 Projected change in rainfall over the Khijadiya wetland complex region (marked by a star) under the RCP8.5 global warming scenario in the near-term (2016–36) as compared to the baseline period of 1985–2005
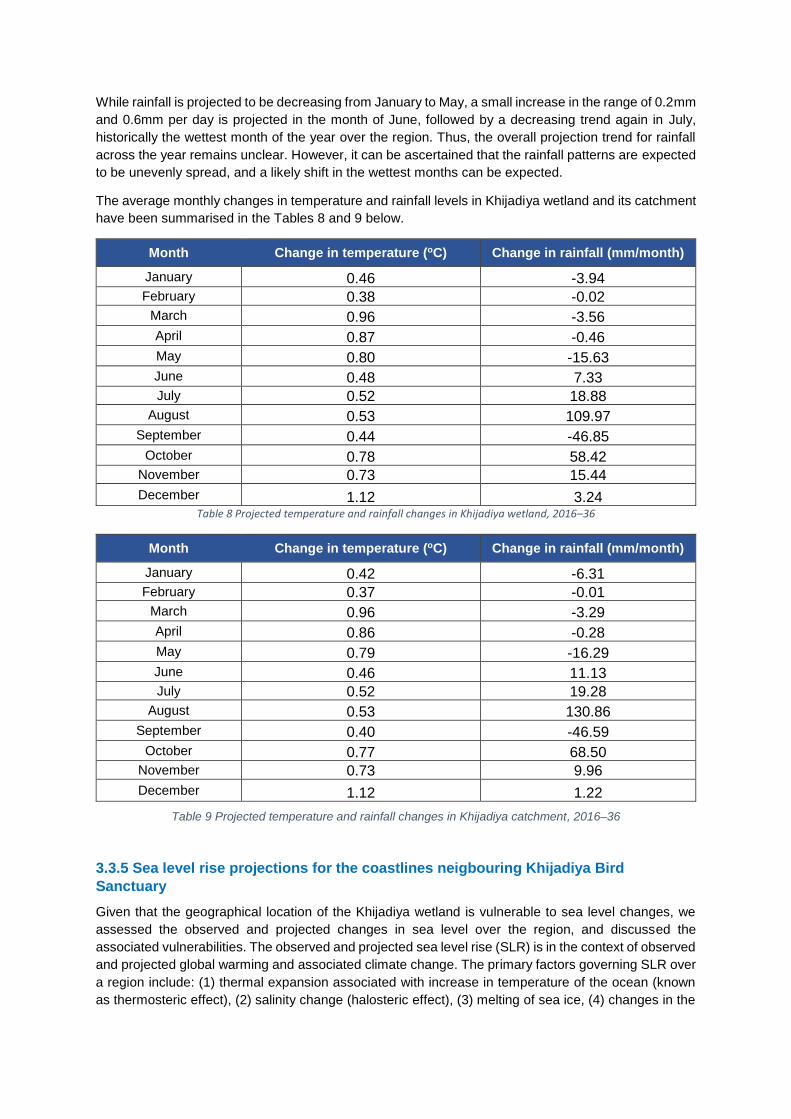
While rainfall is projected to be decreasing from January to May, a small increase in the range of 0.2mm
and 0.6mm per day is projected in the month of June, followed by a decreasing trend again in July,
historically the wettest month of the year over the region. Thus, the overall projection trend for rainfall
across the year remains unclear. However, it can be ascertained that the rainfall patterns are expected
to be unevenly spread, and a likely shift in the wettest months can be expected.
The average monthly changes in temperature and rainfall levels in Khijadiya wetland and its catchment
have been summarised in the Tables 8 and 9 below.
Month Change in temperature (oC) Change in rainfall (mm/month)
January 0.46 -3.94
February 0.38 -0.02
March 0.96 -3.56
April 0.87 -0.46
May 0.80 -15.63
June 0.48 7.33
July 0.52 18.88
August 0.53 109.97
September 0.44 -46.85
October 0.78 58.42
November 0.73 15.44
December 1.12 3.24 Table 8 Projected temperature and rainfall changes in Khijadiya wetland, 2016–36
Month Change in temperature (oC) Change in rainfall (mm/month)
January 0.42 -6.31
February 0.37 -0.01
March 0.96 -3.29
April 0.86 -0.28
May 0.79 -16.29
June 0.46 11.13
July 0.52 19.28
August 0.53 130.86
September 0.40 -46.59
October 0.77 68.50
November 0.73 9.96
December 1.12 1.22
Table 9 Projected temperature and rainfall changes in Khijadiya catchment, 2016–36
3.3.5 Sea level rise projections for the coastlines neigbouring Khijadiya Bird
Sanctuary
Given that the geographical location of the Khijadiya wetland is vulnerable to sea level changes, we
assessed the observed and projected changes in sea level over the region, and discussed the
associated vulnerabilities. The observed and projected sea level rise (SLR) is in the context of observed
and projected global warming and associated climate change. The primary factors governing SLR over
a region include: (1) thermal expansion associated with increase in temperature of the ocean (known
as thermosteric effect), (2) salinity change (halosteric effect), (3) melting of sea ice, (4) changes in the
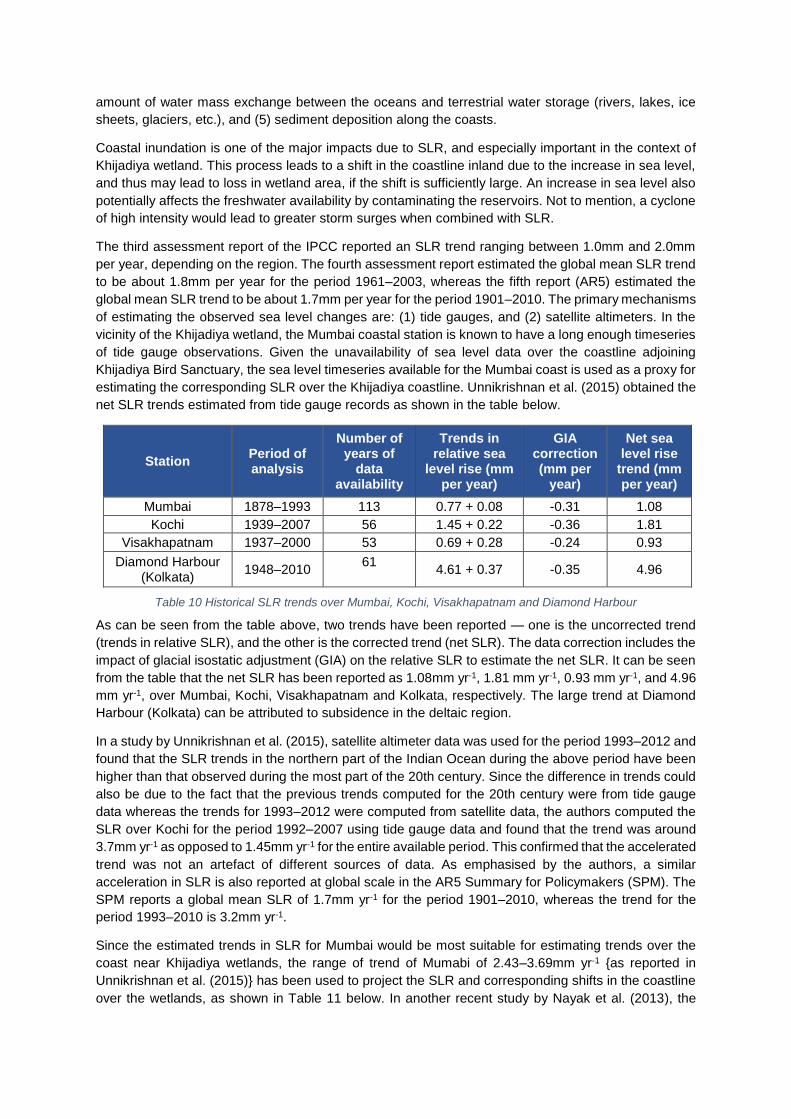
amount of water mass exchange between the oceans and terrestrial water storage (rivers, lakes, ice
sheets, glaciers, etc.), and (5) sediment deposition along the coasts.
Coastal inundation is one of the major impacts due to SLR, and especially important in the context of
Khijadiya wetland. This process leads to a shift in the coastline inland due to the increase in sea level,
and thus may lead to loss in wetland area, if the shift is sufficiently large. An increase in sea level also
potentially affects the freshwater availability by contaminating the reservoirs. Not to mention, a cyclone
of high intensity would lead to greater storm surges when combined with SLR.
The third assessment report of the IPCC reported an SLR trend ranging between 1.0mm and 2.0mm
per year, depending on the region. The fourth assessment report estimated the global mean SLR trend
to be about 1.8mm per year for the period 1961–2003, whereas the fifth report (AR5) estimated the
global mean SLR trend to be about 1.7mm per year for the period 1901–2010. The primary mechanisms
of estimating the observed sea level changes are: (1) tide gauges, and (2) satellite altimeters. In the
vicinity of the Khijadiya wetland, the Mumbai coastal station is known to have a long enough timeseries
of tide gauge observations. Given the unavailability of sea level data over the coastline adjoining
Khijadiya Bird Sanctuary, the sea level timeseries available for the Mumbai coast is used as a proxy for
estimating the corresponding SLR over the Khijadiya coastline. Unnikrishnan et al. (2015) obtained the
net SLR trends estimated from tide gauge records as shown in the table below.
Station Period of analysis
Number of years of
data availability
Trends in relative sea
level rise (mm per year)
GIA correction (mm per
year)
Net sea level rise
trend (mm per year)
Mumbai 1878–1993 113 0.77 + 0.08 -0.31 1.08
Kochi 1939–2007 56 1.45 + 0.22 -0.36 1.81
Visakhapatnam 1937–2000 53 0.69 + 0.28 -0.24 0.93
Diamond Harbour (Kolkata)
1948–2010 61
4.61 + 0.37 -0.35 4.96
Table 10 Historical SLR trends over Mumbai, Kochi, Visakhapatnam and Diamond Harbour
As can be seen from the table above, two trends have been reported — one is the uncorrected trend
(trends in relative SLR), and the other is the corrected trend (net SLR). The data correction includes the
impact of glacial isostatic adjustment (GIA) on the relative SLR to estimate the net SLR. It can be seen
from the table that the net SLR has been reported as 1.08mm yr-1, 1.81 mm yr-1, 0.93 mm yr-1, and 4.96
mm yr-1, over Mumbai, Kochi, Visakhapatnam and Kolkata, respectively. The large trend at Diamond
Harbour (Kolkata) can be attributed to subsidence in the deltaic region.
In a study by Unnikrishnan et al. (2015), satellite altimeter data was used for the period 1993–2012 and
found that the SLR trends in the northern part of the Indian Ocean during the above period have been
higher than that observed during the most part of the 20th century. Since the difference in trends could
also be due to the fact that the previous trends computed for the 20th century were from tide gauge
data whereas the trends for 1993–2012 were computed from satellite data, the authors computed the
SLR over Kochi for the period 1992–2007 using tide gauge data and found that the trend was around
3.7mm yr-1 as opposed to 1.45mm yr-1 for the entire available period. This confirmed that the accelerated
trend was not an artefact of different sources of data. As emphasised by the authors, a similar
acceleration in SLR is also reported at global scale in the AR5 Summary for Policymakers (SPM). The
SPM reports a global mean SLR of 1.7mm yr-1 for the period 1901–2010, whereas the trend for the
period 1993–2010 is 3.2mm yr-1.
Since the estimated trends in SLR for Mumbai would be most suitable for estimating trends over the
coast near Khijadiya wetlands, the range of trend of Mumabi of 2.43–3.69mm yr-1 {as reported in
Unnikrishnan et al. (2015)} has been used to project the SLR and corresponding shifts in the coastline
over the wetlands, as shown in Table 11 below. In another recent study by Nayak et al. (2013), the
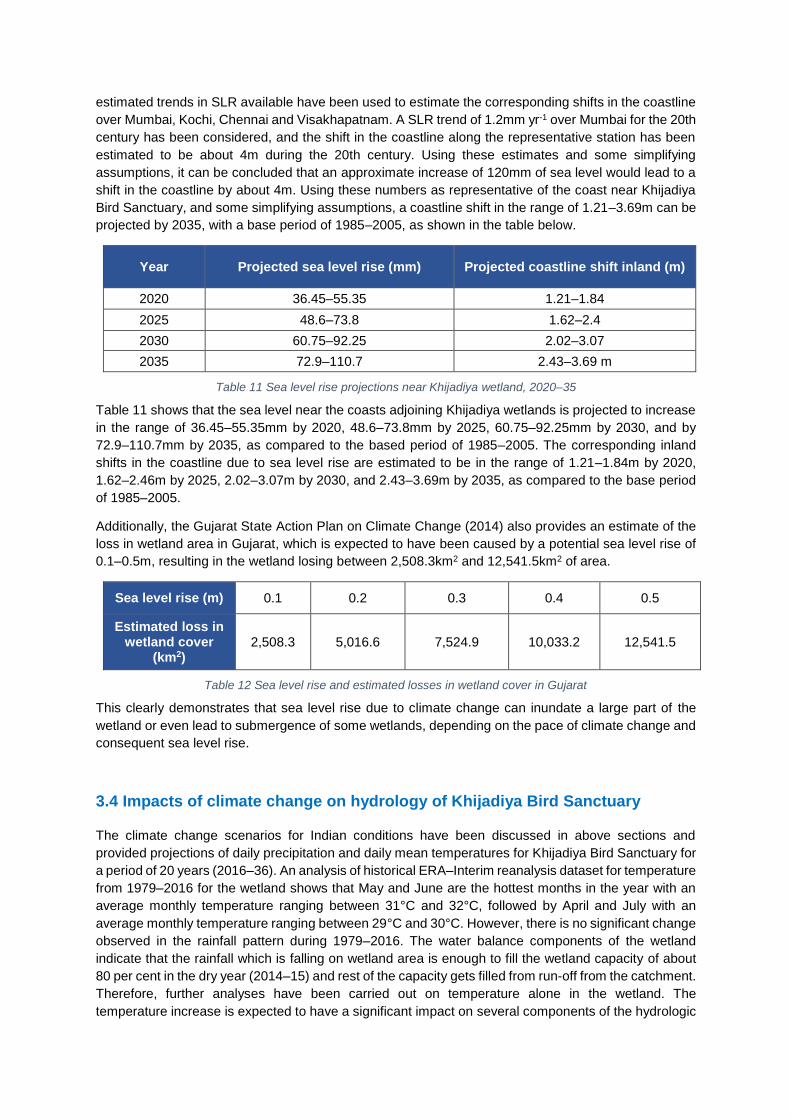
estimated trends in SLR available have been used to estimate the corresponding shifts in the coastline
over Mumbai, Kochi, Chennai and Visakhapatnam. A SLR trend of 1.2mm yr-1 over Mumbai for the 20th
century has been considered, and the shift in the coastline along the representative station has been
estimated to be about 4m during the 20th century. Using these estimates and some simplifying
assumptions, it can be concluded that an approximate increase of 120mm of sea level would lead to a
shift in the coastline by about 4m. Using these numbers as representative of the coast near Khijadiya
Bird Sanctuary, and some simplifying assumptions, a coastline shift in the range of 1.21–3.69m can be
projected by 2035, with a base period of 1985–2005, as shown in the table below.
Year Projected sea level rise (mm) Projected coastline shift inland (m)
2020 36.45–55.35 1.21–1.84
2025 48.6–73.8 1.62–2.4
2030 60.75–92.25 2.02–3.07
2035 72.9–110.7 2.43–3.69 m
Table 11 Sea level rise projections near Khijadiya wetland, 2020–35
Table 11 shows that the sea level near the coasts adjoining Khijadiya wetlands is projected to increase
in the range of 36.45–55.35mm by 2020, 48.6–73.8mm by 2025, 60.75–92.25mm by 2030, and by
72.9–110.7mm by 2035, as compared to the based period of 1985–2005. The corresponding inland
shifts in the coastline due to sea level rise are estimated to be in the range of 1.21–1.84m by 2020,
1.62–2.46m by 2025, 2.02–3.07m by 2030, and 2.43–3.69m by 2035, as compared to the base period
of 1985–2005.
Additionally, the Gujarat State Action Plan on Climate Change (2014) also provides an estimate of the
loss in wetland area in Gujarat, which is expected to have been caused by a potential sea level rise of
0.1–0.5m, resulting in the wetland losing between 2,508.3km2 and 12,541.5km2 of area.
Sea level rise (m) 0.1 0.2 0.3 0.4 0.5
Estimated loss in wetland cover
(km2) 2,508.3 5,016.6 7,524.9 10,033.2 12,541.5
Table 12 Sea level rise and estimated losses in wetland cover in Gujarat
This clearly demonstrates that sea level rise due to climate change can inundate a large part of the
wetland or even lead to submergence of some wetlands, depending on the pace of climate change and
consequent sea level rise.
3.4 Impacts of climate change on hydrology of Khijadiya Bird Sanctuary
The climate change scenarios for Indian conditions have been discussed in above sections and
provided projections of daily precipitation and daily mean temperatures for Khijadiya Bird Sanctuary for
a period of 20 years (2016–36). An analysis of historical ERA–Interim reanalysis dataset for temperature
from 1979–2016 for the wetland shows that May and June are the hottest months in the year with an
average monthly temperature ranging between 31°C and 32°C, followed by April and July with an
average monthly temperature ranging between 29°C and 30°C. However, there is no significant change
observed in the rainfall pattern during 1979–2016. The water balance components of the wetland
indicate that the rainfall which is falling on wetland area is enough to fill the wetland capacity of about
80 per cent in the dry year (2014–15) and rest of the capacity gets filled from run-off from the catchment.
Therefore, further analyses have been carried out on temperature alone in the wetland. The
temperature increase is expected to have a significant impact on several components of the hydrologic
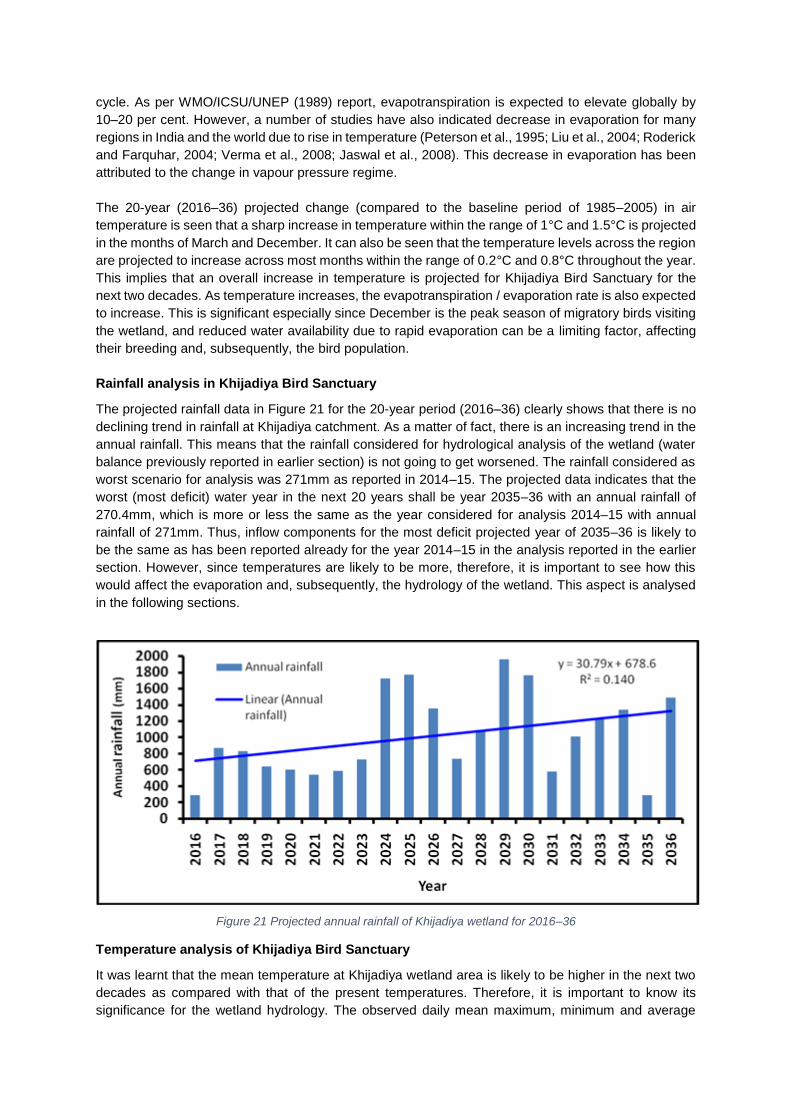
cycle. As per WMO/ICSU/UNEP (1989) report, evapotranspiration is expected to elevate globally by
10–20 per cent. However, a number of studies have also indicated decrease in evaporation for many
regions in India and the world due to rise in temperature (Peterson et al., 1995; Liu et al., 2004; Roderick
and Farquhar, 2004; Verma et al., 2008; Jaswal et al., 2008). This decrease in evaporation has been
attributed to the change in vapour pressure regime.
The 20-year (2016–36) projected change (compared to the baseline period of 1985–2005) in air
temperature is seen that a sharp increase in temperature within the range of 1°C and 1.5°C is projected
in the months of March and December. It can also be seen that the temperature levels across the region
are projected to increase across most months within the range of 0.2°C and 0.8°C throughout the year.
This implies that an overall increase in temperature is projected for Khijadiya Bird Sanctuary for the
next two decades. As temperature increases, the evapotranspiration / evaporation rate is also expected
to increase. This is significant especially since December is the peak season of migratory birds visiting
the wetland, and reduced water availability due to rapid evaporation can be a limiting factor, affecting
their breeding and, subsequently, the bird population.
Rainfall analysis in Khijadiya Bird Sanctuary
The projected rainfall data in Figure 21 for the 20-year period (2016–36) clearly shows that there is no
declining trend in rainfall at Khijadiya catchment. As a matter of fact, there is an increasing trend in the
annual rainfall. This means that the rainfall considered for hydrological analysis of the wetland (water
balance previously reported in earlier section) is not going to get worsened. The rainfall considered as
worst scenario for analysis was 271mm as reported in 2014–15. The projected data indicates that the
worst (most deficit) water year in the next 20 years shall be year 2035–36 with an annual rainfall of
270.4mm, which is more or less the same as the year considered for analysis 2014–15 with annual
rainfall of 271mm. Thus, inflow components for the most deficit projected year of 2035–36 is likely to
be the same as has been reported already for the year 2014–15 in the analysis reported in the earlier
section. However, since temperatures are likely to be more, therefore, it is important to see how this
would affect the evaporation and, subsequently, the hydrology of the wetland. This aspect is analysed
in the following sections.
Figure 21 Projected annual rainfall of Khijadiya wetland for 2016–36
Temperature analysis of Khijadiya Bird Sanctuary
It was learnt that the mean temperature at Khijadiya wetland area is likely to be higher in the next two
decades as compared with that of the present temperatures. Therefore, it is important to know its
significance for the wetland hydrology. The observed daily mean maximum, minimum and average
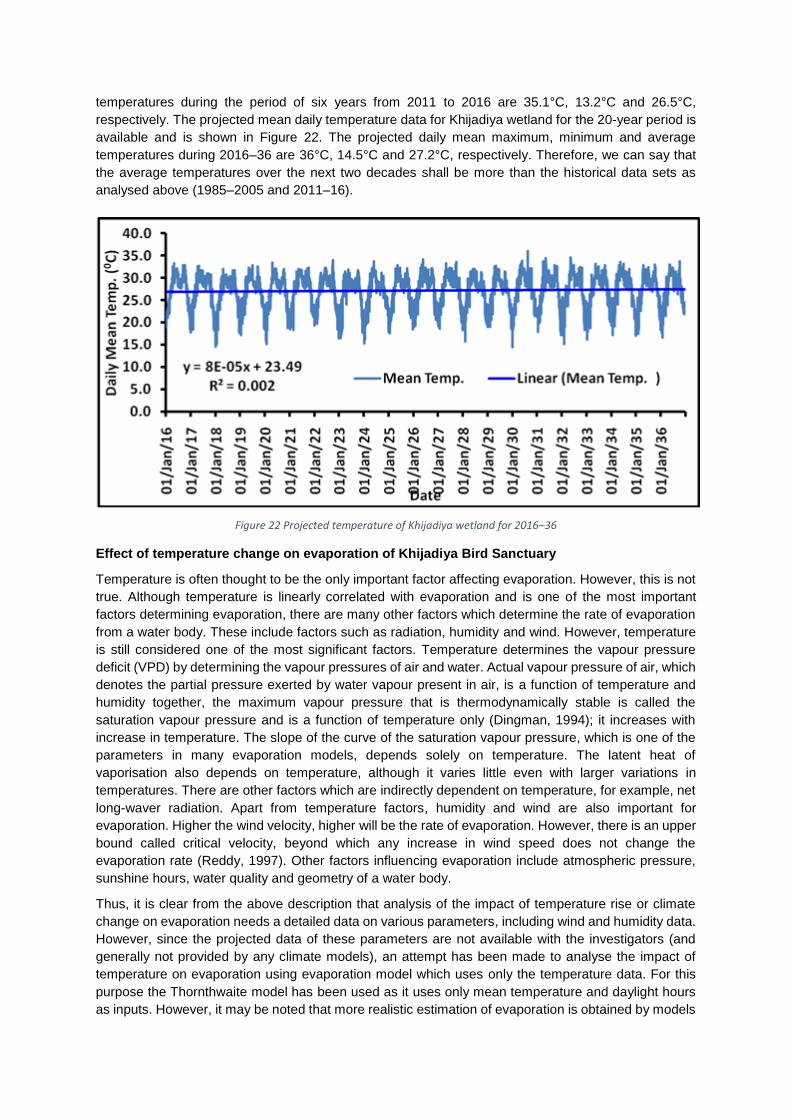
temperatures during the period of six years from 2011 to 2016 are 35.1°C, 13.2°C and 26.5°C,
respectively. The projected mean daily temperature data for Khijadiya wetland for the 20-year period is
available and is shown in Figure 22. The projected daily mean maximum, minimum and average
temperatures during 2016–36 are 36°C, 14.5°C and 27.2°C, respectively. Therefore, we can say that
the average temperatures over the next two decades shall be more than the historical data sets as
analysed above (1985–2005 and 2011–16).
Figure 22 Projected temperature of Khijadiya wetland for 2016–36
Effect of temperature change on evaporation of Khijadiya Bird Sanctuary
Temperature is often thought to be the only important factor affecting evaporation. However, this is not
true. Although temperature is linearly correlated with evaporation and is one of the most important
factors determining evaporation, there are many other factors which determine the rate of evaporation
from a water body. These include factors such as radiation, humidity and wind. However, temperature
is still considered one of the most significant factors. Temperature determines the vapour pressure
deficit (VPD) by determining the vapour pressures of air and water. Actual vapour pressure of air, which
denotes the partial pressure exerted by water vapour present in air, is a function of temperature and
humidity together, the maximum vapour pressure that is thermodynamically stable is called the
saturation vapour pressure and is a function of temperature only (Dingman, 1994); it increases with
increase in temperature. The slope of the curve of the saturation vapour pressure, which is one of the
parameters in many evaporation models, depends solely on temperature. The latent heat of
vaporisation also depends on temperature, although it varies little even with larger variations in
temperatures. There are other factors which are indirectly dependent on temperature, for example, net
long-waver radiation. Apart from temperature factors, humidity and wind are also important for
evaporation. Higher the wind velocity, higher will be the rate of evaporation. However, there is an upper
bound called critical velocity, beyond which any increase in wind speed does not change the
evaporation rate (Reddy, 1997). Other factors influencing evaporation include atmospheric pressure,
sunshine hours, water quality and geometry of a water body.
Thus, it is clear from the above description that analysis of the impact of temperature rise or climate
change on evaporation needs a detailed data on various parameters, including wind and humidity data.
However, since the projected data of these parameters are not available with the investigators (and
generally not provided by any climate models), an attempt has been made to analyse the impact of
temperature on evaporation using evaporation model which uses only the temperature data. For this
purpose the Thornthwaite model has been used as it uses only mean temperature and daylight hours
as inputs. However, it may be noted that more realistic estimation of evaporation is obtained by models
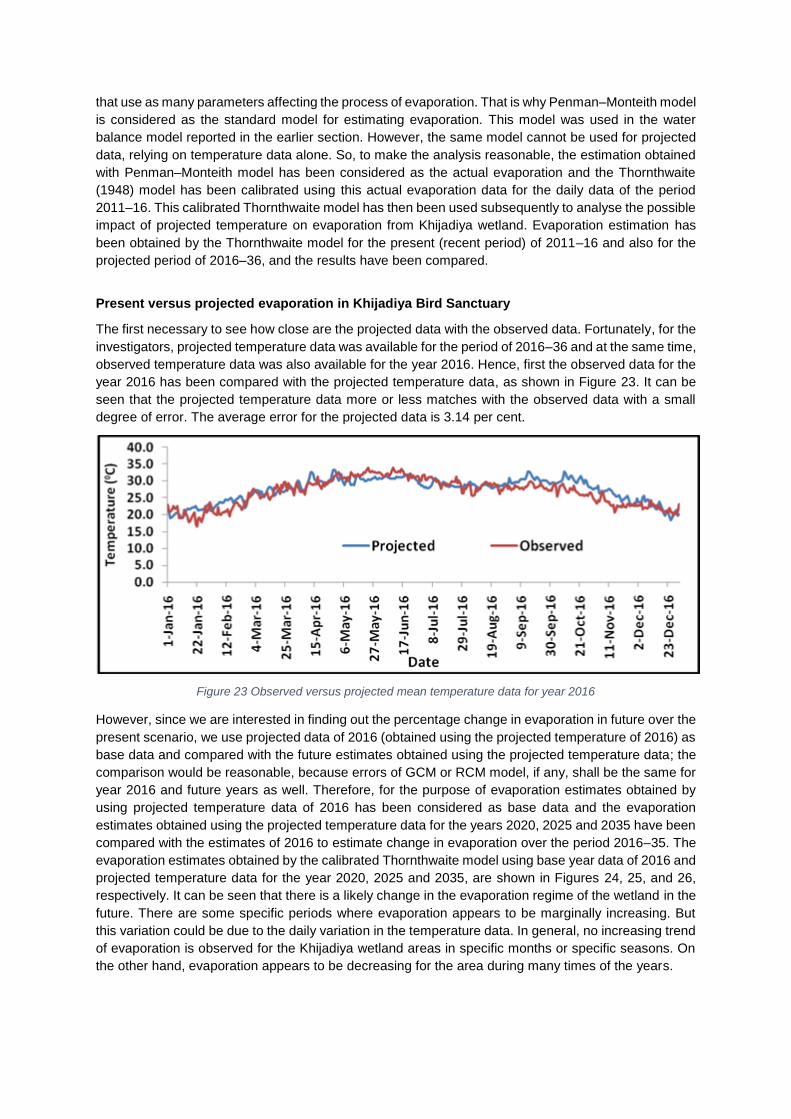
that use as many parameters affecting the process of evaporation. That is why Penman–Monteith model
is considered as the standard model for estimating evaporation. This model was used in the water
balance model reported in the earlier section. However, the same model cannot be used for projected
data, relying on temperature data alone. So, to make the analysis reasonable, the estimation obtained
with Penman–Monteith model has been considered as the actual evaporation and the Thornthwaite
(1948) model has been calibrated using this actual evaporation data for the daily data of the period
2011–16. This calibrated Thornthwaite model has then been used subsequently to analyse the possible
impact of projected temperature on evaporation from Khijadiya wetland. Evaporation estimation has
been obtained by the Thornthwaite model for the present (recent period) of 2011–16 and also for the
projected period of 2016–36, and the results have been compared.
Present versus projected evaporation in Khijadiya Bird Sanctuary
The first necessary to see how close are the projected data with the observed data. Fortunately, for the
investigators, projected temperature data was available for the period of 2016–36 and at the same time,
observed temperature data was also available for the year 2016. Hence, first the observed data for the
year 2016 has been compared with the projected temperature data, as shown in Figure 23. It can be
seen that the projected temperature data more or less matches with the observed data with a small
degree of error. The average error for the projected data is 3.14 per cent.
Figure 23 Observed versus projected mean temperature data for year 2016
However, since we are interested in finding out the percentage change in evaporation in future over the
present scenario, we use projected data of 2016 (obtained using the projected temperature of 2016) as
base data and compared with the future estimates obtained using the projected temperature data; the
comparison would be reasonable, because errors of GCM or RCM model, if any, shall be the same for
year 2016 and future years as well. Therefore, for the purpose of evaporation estimates obtained by
using projected temperature data of 2016 has been considered as base data and the evaporation
estimates obtained using the projected temperature data for the years 2020, 2025 and 2035 have been
compared with the estimates of 2016 to estimate change in evaporation over the period 2016–35. The
evaporation estimates obtained by the calibrated Thornthwaite model using base year data of 2016 and
projected temperature data for the year 2020, 2025 and 2035, are shown in Figures 24, 25, and 26,
respectively. It can be seen that there is a likely change in the evaporation regime of the wetland in the
future. There are some specific periods where evaporation appears to be marginally increasing. But
this variation could be due to the daily variation in the temperature data. In general, no increasing trend
of evaporation is observed for the Khijadiya wetland areas in specific months or specific seasons. On
the other hand, evaporation appears to be decreasing for the area during many times of the years.
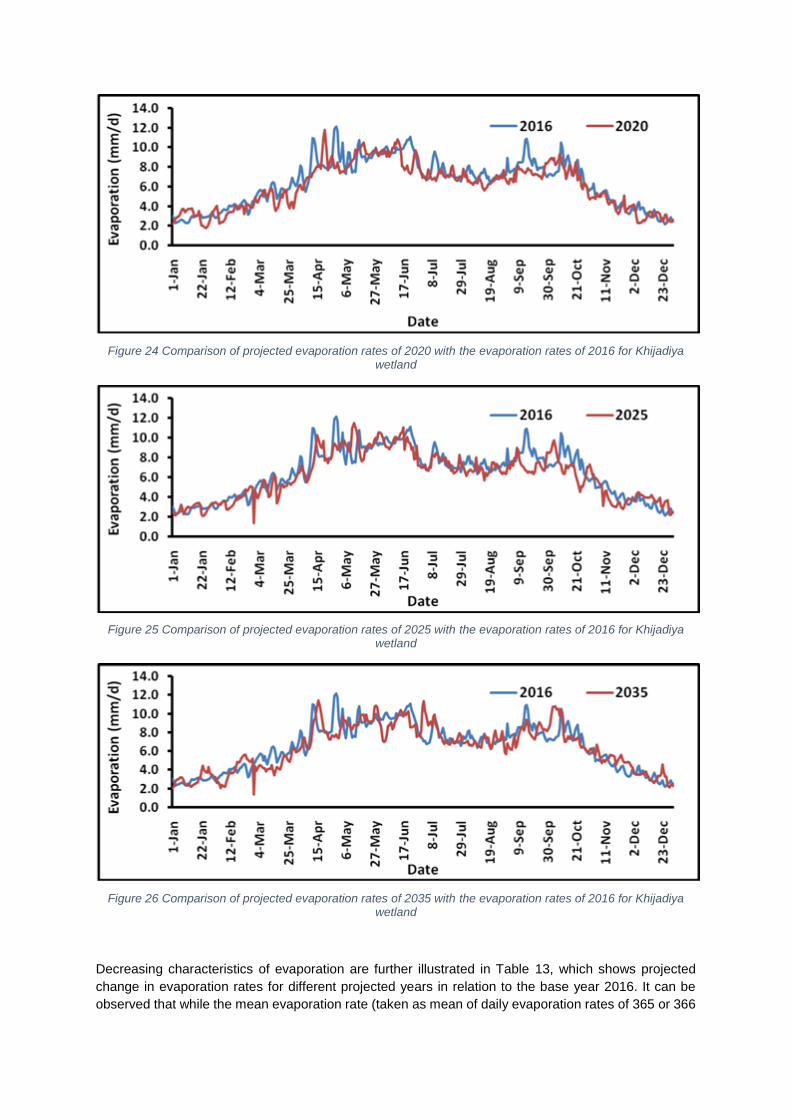
Figure 24 Comparison of projected evaporation rates of 2020 with the evaporation rates of 2016 for Khijadiya wetland
Figure 25 Comparison of projected evaporation rates of 2025 with the evaporation rates of 2016 for Khijadiya wetland
Figure 26 Comparison of projected evaporation rates of 2035 with the evaporation rates of 2016 for Khijadiya wetland
Decreasing characteristics of evaporation are further illustrated in Table 13, which shows projected
change in evaporation rates for different projected years in relation to the base year 2016. It can be
observed that while the mean evaporation rate (taken as mean of daily evaporation rates of 365 or 366
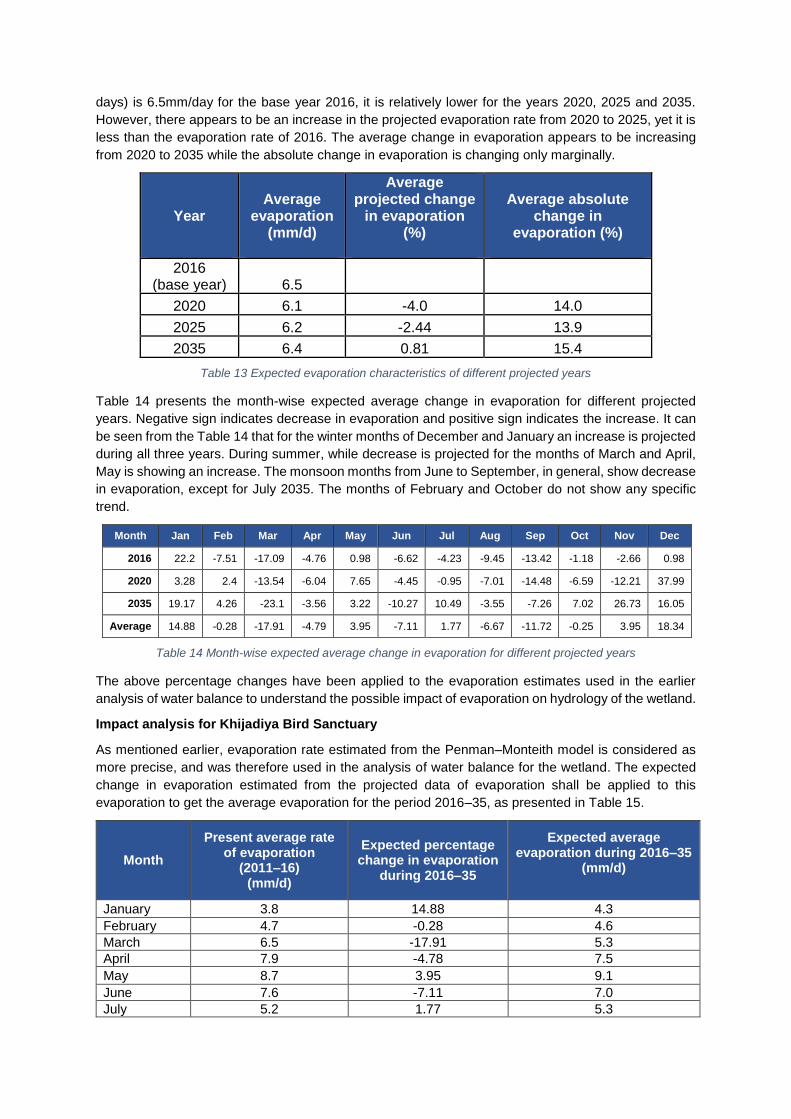
days) is 6.5mm/day for the base year 2016, it is relatively lower for the years 2020, 2025 and 2035.
However, there appears to be an increase in the projected evaporation rate from 2020 to 2025, yet it is
less than the evaporation rate of 2016. The average change in evaporation appears to be increasing
from 2020 to 2035 while the absolute change in evaporation is changing only marginally.
Year
Average evaporation
(mm/d)
Average projected change
in evaporation (%)
Average absolute change in
evaporation (%)
2016 (base year) 6.5
2020 6.1 -4.0 14.0
2025 6.2 -2.44 13.9
2035 6.4 0.81 15.4
Table 13 Expected evaporation characteristics of different projected years
Table 14 presents the month-wise expected average change in evaporation for different projected
years. Negative sign indicates decrease in evaporation and positive sign indicates the increase. It can
be seen from the Table 14 that for the winter months of December and January an increase is projected
during all three years. During summer, while decrease is projected for the months of March and April,
May is showing an increase. The monsoon months from June to September, in general, show decrease
in evaporation, except for July 2035. The months of February and October do not show any specific
trend.
Month Jan Feb Mar Apr May Jun Jul Aug Sep Oct Nov Dec
2016 22.2 -7.51 -17.09 -4.76 0.98 -6.62 -4.23 -9.45 -13.42 -1.18 -2.66 0.98
2020 3.28 2.4 -13.54 -6.04 7.65 -4.45 -0.95 -7.01 -14.48 -6.59 -12.21 37.99
2035 19.17 4.26 -23.1 -3.56 3.22 -10.27 10.49 -3.55 -7.26 7.02 26.73 16.05
Average 14.88 -0.28 -17.91 -4.79 3.95 -7.11 1.77 -6.67 -11.72 -0.25 3.95 18.34
Table 14 Month-wise expected average change in evaporation for different projected years
The above percentage changes have been applied to the evaporation estimates used in the earlier
analysis of water balance to understand the possible impact of evaporation on hydrology of the wetland.
Impact analysis for Khijadiya Bird Sanctuary
As mentioned earlier, evaporation rate estimated from the Penman–Monteith model is considered as
more precise, and was therefore used in the analysis of water balance for the wetland. The expected
change in evaporation estimated from the projected data of evaporation shall be applied to this
evaporation to get the average evaporation for the period 2016–35, as presented in Table 15.
Month
Present average rate of evaporation
(2011–16) (mm/d)
Expected percentage change in evaporation
during 2016–35
Expected average evaporation during 2016–35
(mm/d)
January 3.8 14.88 4.3
February 4.7 -0.28 4.6
March 6.5 -17.91 5.3
April 7.9 -4.78 7.5
May 8.7 3.95 9.1
June 7.6 -7.11 7.0
July 5.2 1.77 5.3
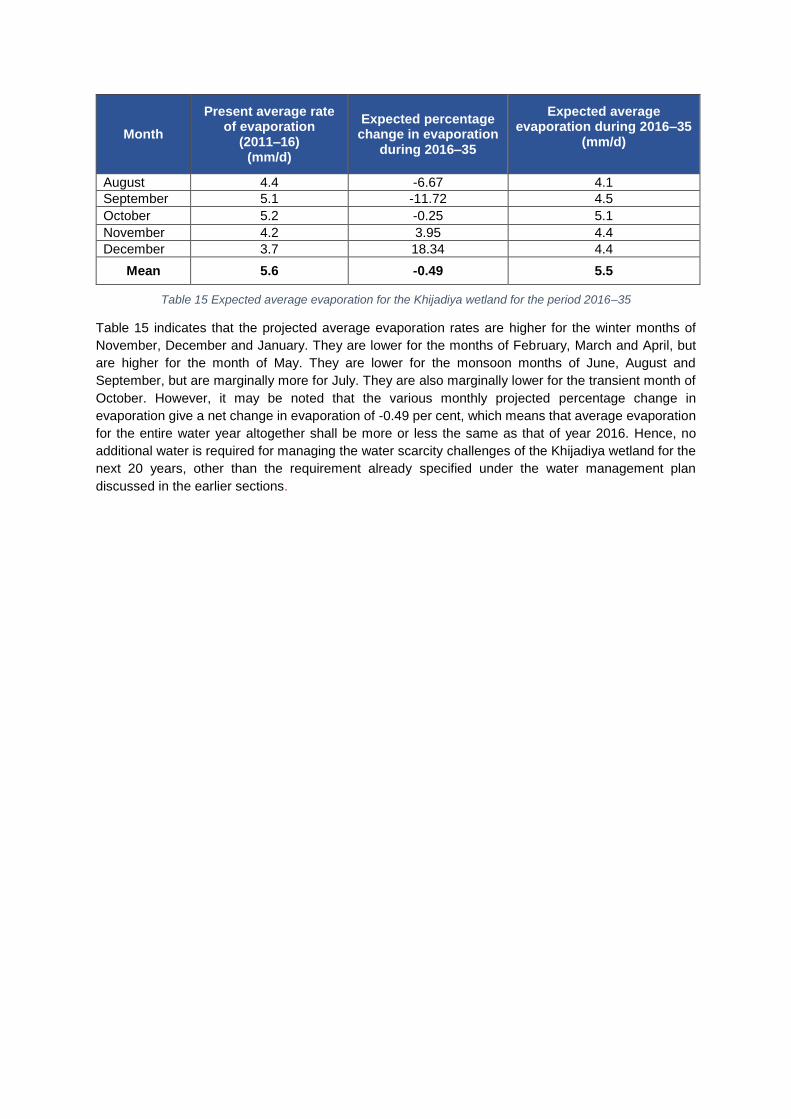
Month
Present average rate of evaporation
(2011–16) (mm/d)
Expected percentage change in evaporation
during 2016–35
Expected average evaporation during 2016–35
(mm/d)
August 4.4 -6.67 4.1
September 5.1 -11.72 4.5
October 5.2 -0.25 5.1
November 4.2 3.95 4.4
December 3.7 18.34 4.4
Mean 5.6 -0.49 5.5
Table 15 Expected average evaporation for the Khijadiya wetland for the period 2016–35
Table 15 indicates that the projected average evaporation rates are higher for the winter months of
November, December and January. They are lower for the months of February, March and April, but
are higher for the month of May. They are lower for the monsoon months of June, August and
September, but are marginally more for July. They are also marginally lower for the transient month of
October. However, it may be noted that the various monthly projected percentage change in
evaporation give a net change in evaporation of -0.49 per cent, which means that average evaporation
for the entire water year altogether shall be more or less the same as that of year 2016. Hence, no
additional water is required for managing the water scarcity challenges of the Khijadiya wetland for the
next 20 years, other than the requirement already specified under the water management plan
discussed in the earlier sections.
3.5 Impacts of climate change on biodiversity of the wetland
Drops in lake levels, earlier spring run-off, larger floods and hotter summers are likely to have adverse
impacts to wetlands and the species that depend on them. Wetlands may disappear from this landscape
or be altered and degraded by increased erosion from storm events, alterations in plant and wildlife
composition through appearance of invasive species and human actions. These changes in biodiversity
and wetland structure could lead to a reduction in services provided by wetlands, mainly that of
providing breeding habitats for birds and amphibians (Michener et. al.1997; Davis et. al. 2017).
Wetland species likely to be most at risk are those that are already identified as rare or endangered on
international, national or state lists. These wetland species are generally dependent on a special set of
habitat requirements that are already rare. Climate change, specifically higher temperatures, and
severe floods and droughts are likely to stress and disrupt those special environmental conditions;
further, many plants and animals have limited mobility and would not be able to migrate to new areas
where appropriate conditions may exist. It is also likely that these changes will threaten populations of
plants and animals that are currently common, but also unable to adapt to changing environmental
conditions.
Direct impact on birds
Several studies have confirmed that climate change has affected the breeding phenology of birds. This
has been observed specifically with regard to climatic warming and range changes. With increasing
temperatures, several bird species of North America and Europe were noted to have gradually shifted
their breeding season to a date earlier than previous recorded dates (Visser et al, 1998; Dunn & Winkler,
1999; Marra et. al. 2005). Studies have also observed the relationship between spring temperature and
egg laying dates of several birds, and the relationship between spring temperatures and leafing dates
of several deciduous trees (Wolkovich et. al. 2012), abundance dates of butterflies (Roy et. al. 2001)
and spawning dates of amphibians (Walther et. al. 2002). These organisms are consumed by various
species of birds around the world. While resident bird species would be able to adapt to their changing
habitat, migratory birds would not. Studies have shown that while the phenology of their breeding
grounds advance, the migration time of these birds will not advance as these are not triggered by the
temperature of said grounds (Both and Visser, 2001; Sanz et. al. 2003). Thus, they will miss the
opportunity to optimally exploit the habitat and face increasing competition from the resident birds who
by then would be greater in number (Berthold, 1991).
Thus, in case of birds in Khijidiya Bird Sanctuary, it may be possible for resident birds, such as the Near
Threatened Black headed Ibis and Black Necked Stork, to adapt to the increasing temperatures.
Migratory birds, such as the Vulnerable Dalmatian Pelican and Near Threatened Eurasian Curlew, on
the other hand, may not get ample time to adapt to these temperature changes, and thus, given the
lack of a favourable ecosystem for breeding, a steady fall in the population of such species can take
place.
In addition to these direct impacts on birds, there are several indirect impacts as well in terms of their
available food support system in the wetlands, which would also get significantly impacted. Since a
proper channel of food web is a crucial factor in determining the suitability of an ecosystem for birds,
any changes in the food web would affect the bird population, especially the migratory bird population,
as they are not isolated due to the location of wetlands. These impacts are described in the following
sub-sections.
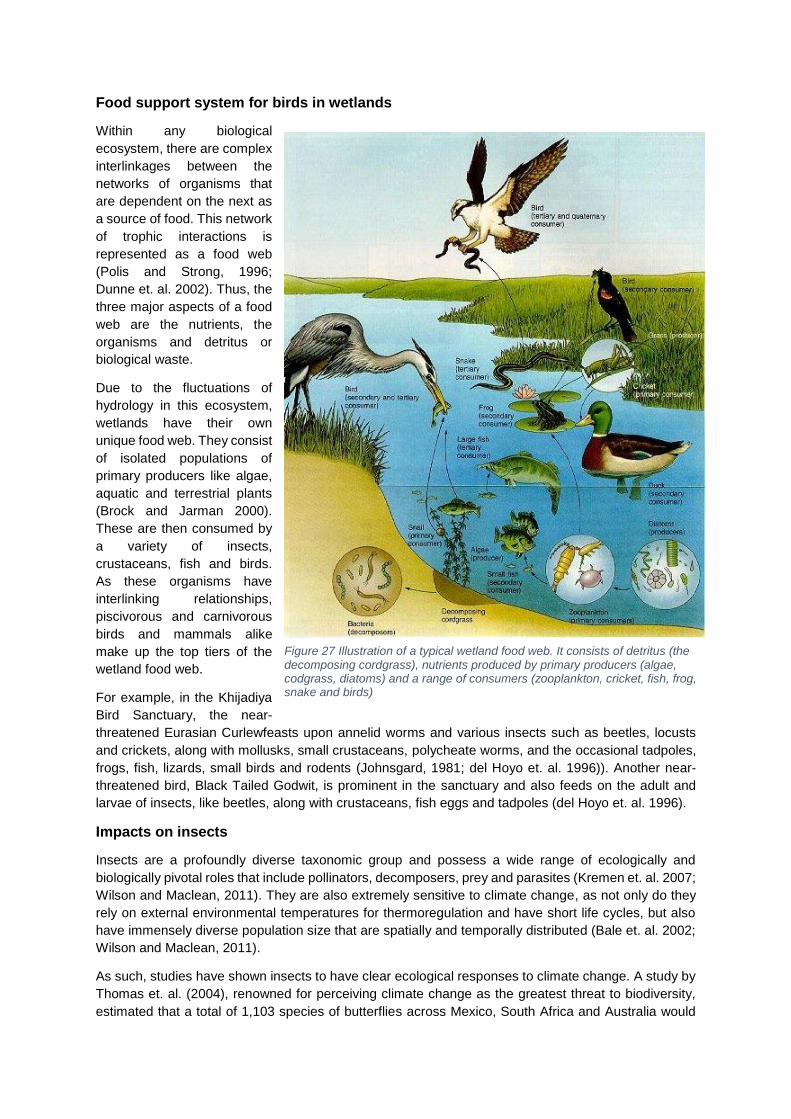
Food support system for birds in wetlands
Within any biological
ecosystem, there are complex
interlinkages between the
networks of organisms that
are dependent on the next as
a source of food. This network
of trophic interactions is
represented as a food web
(Polis and Strong, 1996;
Dunne et. al. 2002). Thus, the
three major aspects of a food
web are the nutrients, the
organisms and detritus or
biological waste.
Due to the fluctuations of
hydrology in this ecosystem,
wetlands have their own
unique food web. They consist
of isolated populations of
primary producers like algae,
aquatic and terrestrial plants
(Brock and Jarman 2000).
These are then consumed by
a variety of insects,
crustaceans, fish and birds.
As these organisms have
interlinking relationships,
piscivorous and carnivorous
birds and mammals alike
make up the top tiers of the
wetland food web.
For example, in the Khijadiya
Bird Sanctuary, the near-
threatened Eurasian Curlewfeasts upon annelid worms and various insects such as beetles, locusts
and crickets, along with mollusks, small crustaceans, polycheate worms, and the occasional tadpoles,
frogs, fish, lizards, small birds and rodents (Johnsgard, 1981; del Hoyo et. al. 1996)). Another near-
threatened bird, Black Tailed Godwit, is prominent in the sanctuary and also feeds on the adult and
larvae of insects, like beetles, along with crustaceans, fish eggs and tadpoles (del Hoyo et. al. 1996).
Impacts on insects
Insects are a profoundly diverse taxonomic group and possess a wide range of ecologically and
biologically pivotal roles that include pollinators, decomposers, prey and parasites (Kremen et. al. 2007;
Wilson and Maclean, 2011). They are also extremely sensitive to climate change, as not only do they
rely on external environmental temperatures for thermoregulation and have short life cycles, but also
have immensely diverse population size that are spatially and temporally distributed (Bale et. al. 2002;
Wilson and Maclean, 2011).
As such, studies have shown insects to have clear ecological responses to climate change. A study by
Thomas et. al. (2004), renowned for perceiving climate change as the greatest threat to biodiversity,
estimated that a total of 1,103 species of butterflies across Mexico, South Africa and Australia would
Figure 27 Illustration of a typical wetland food web. It consists of detritus (the decomposing cordgrass), nutrients produced by primary producers (algae, codgrass, diatoms) and a range of consumers (zooplankton, cricket, fish, frog, snake and birds)
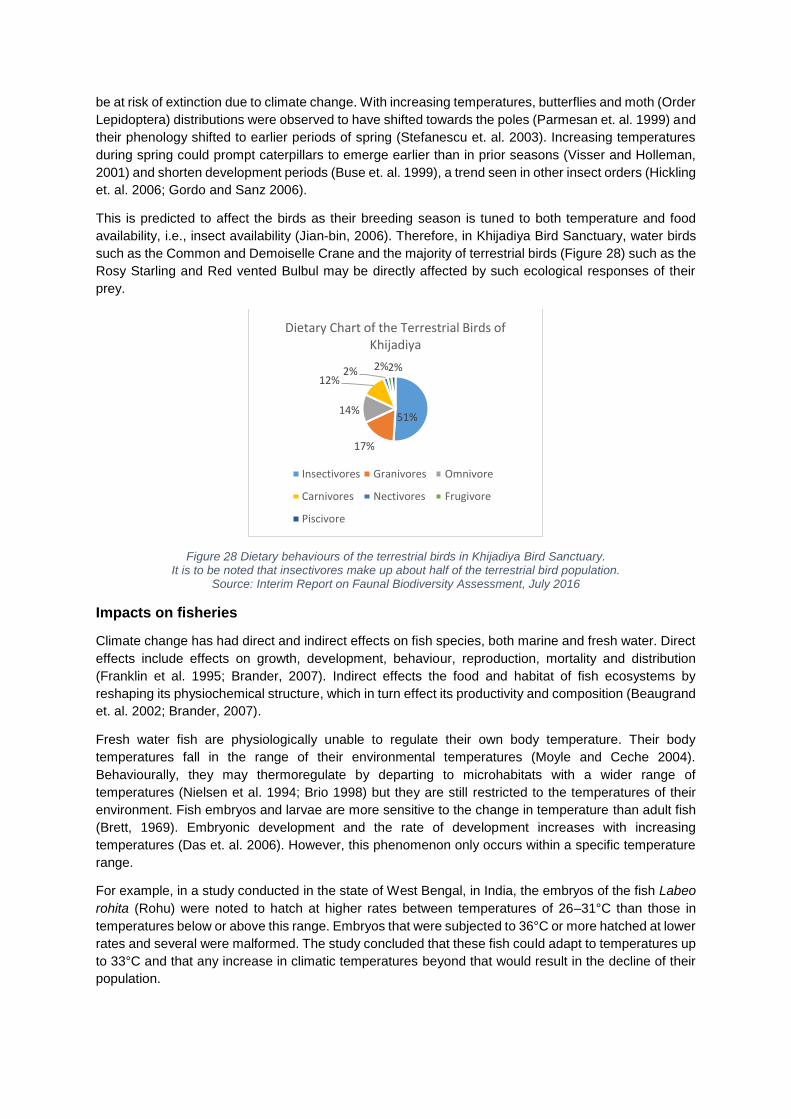
be at risk of extinction due to climate change. With increasing temperatures, butterflies and moth (Order
Lepidoptera) distributions were observed to have shifted towards the poles (Parmesan et. al. 1999) and
their phenology shifted to earlier periods of spring (Stefanescu et. al. 2003). Increasing temperatures
during spring could prompt caterpillars to emerge earlier than in prior seasons (Visser and Holleman,
2001) and shorten development periods (Buse et. al. 1999), a trend seen in other insect orders (Hickling
et. al. 2006; Gordo and Sanz 2006).
This is predicted to affect the birds as their breeding season is tuned to both temperature and food
availability, i.e., insect availability (Jian-bin, 2006). Therefore, in Khijadiya Bird Sanctuary, water birds
such as the Common and Demoiselle Crane and the majority of terrestrial birds (Figure 28) such as the
Rosy Starling and Red vented Bulbul may be directly affected by such ecological responses of their
prey.
Figure 28 Dietary behaviours of the terrestrial birds in Khijadiya Bird Sanctuary. It is to be noted that insectivores make up about half of the terrestrial bird population.
Source: Interim Report on Faunal Biodiversity Assessment, July 2016
Impacts on fisheries
Climate change has had direct and indirect effects on fish species, both marine and fresh water. Direct
effects include effects on growth, development, behaviour, reproduction, mortality and distribution
(Franklin et al. 1995; Brander, 2007). Indirect effects the food and habitat of fish ecosystems by
reshaping its physiochemical structure, which in turn effect its productivity and composition (Beaugrand
et. al. 2002; Brander, 2007).
Fresh water fish are physiologically unable to regulate their own body temperature. Their body
temperatures fall in the range of their environmental temperatures (Moyle and Ceche 2004).
Behaviourally, they may thermoregulate by departing to microhabitats with a wider range of
temperatures (Nielsen et al. 1994; Brio 1998) but they are still restricted to the temperatures of their
environment. Fish embryos and larvae are more sensitive to the change in temperature than adult fish
(Brett, 1969). Embryonic development and the rate of development increases with increasing
temperatures (Das et. al. 2006). However, this phenomenon only occurs within a specific temperature
range.
For example, in a study conducted in the state of West Bengal, in India, the embryos of the fish Labeo
rohita (Rohu) were noted to hatch at higher rates between temperatures of 26–31°C than those in
temperatures below or above this range. Embryos that were subjected to 36°C or more hatched at lower
rates and several were malformed. The study concluded that these fish could adapt to temperatures up
to 33°C and that any increase in climatic temperatures beyond that would result in the decline of their
population.
51%
17%
14%
12%2% 2%2%
Dietary Chart of the Terrestrial Birds of Khijadiya
Insectivores Granivores Omnivore
Carnivores Nectivores Frugivore
Piscivore
However, since the fish population in Khijadiya is not too significant due to limited water availability
around the yeat, this risk is considered to be relatively less prominent than other biodicersity impacts.
Impacts on vegetation
The most predominant and abundant vegetation in an aquatic environment is cyanobacteria. These
single-celled plant organisms are one of the primary producers of aquatic ecosystems, acting as a food
source for various fish and insect larvae. However, there are species of cyanobacteria that are
detrimental to aquatic ecosystems. These cyanobacteria form massive growths (or blooms) with
increasing temperatures, increasing CO2 levels and increasing anthropogenically induced nutrients.
The blooms secrete toxins and reduce O2 levels in water, which damage the ecosystem, effecting the
microorganisms, fish and birds that are present therein and, thus, effect the food web (Paerl and
Huisman, 2009; Paerl and Paul, 2012).
Another indispensable plant present in Khijadiya Bird Sanctuary are the mangroves. They are important
for maintaining coastal water quality, as nurseries for several fish and crustaceans and breed points of
water birds (Mumby et al., 2004; Nagelkerken et al., 2008; Walters et al., 2008). These trees also
prevent erosion and flooding during storms, surges and tsunamis (Danielsen et al., 2005; Kathiresan
and Rajendran, 2005; Gilman et. al. 2008).
Studies have shown that mangroves would be adversely affected by current climate change trends. It
has been noted that the optimum temperature for mangroves to conduct photosynthesis is 28–32°C. If
the mangroves were exposed to temperatures of 38°C or above, they would no longer photosynthesise,
thus, halting all metabolic activites and eventually die {Clough et. al. (1982) and Andrews et. al. (1984)}.
The changing temperatures would also affect the phenology of mangroves as its flowering and fruiting
dates would change to an earlier date (Ellison 2000; Gilman et. al. 2008).
Fluctuating rainfall would also be detrimental to the survival of mangroves. During the months of
decreasing rainfall and higher evaporation rates, salinity of the soil would increase which would
decrease the rate of growth and decrease seedling survival rates (Gilman et. al. 2008). Increase in
rainfall would increase the growth rate and colonisation rates of the mangroves (Ellison, 2000).
Thus, the stability of wetland ecosystem would be disrupted due to the effects of climate change.
Nutrients and detritus, the very foundations of the food web, would be amongst the first to succumb to
this change. This, in turn, would affect all aforementioned organisms, from algae and terrestrial plants
to fish and birds. The double threat of increasing global temperatures and fluctuating precipitation
patterns would decimate isolated organisms, like plants, microorganisms and fish (Bond et. al. 2008)
while more mobile organisms like birds could disperse to different localities to continue their breeding
and feeding practices (Brock and Jarman, 2000). This could imply that due to reduced availability in
food support, the migratory bird population in Khijadiya Bird Sanctuary may disperse to a more
favourable location in the long run.
To summarize, observed and projected trends in temperature and rainfall could be detrimental to the
biodiversity of Khijadiya Bird Sanctuary. Higher temperatures and rainfall fluctuation are highly likely to
result in phenological and physiological changes across the trophic levels of the food webs of these
wetlands, in the following ways:
Bird breeding phenology may or may not change in response to the changing climatic conditions
depending on whether the bird is residential or migratory. A discrepancy between the bird
breeding phenology and their prey (insect and fish) phenology is predicted.
Insects are likely to respond to the changing climate by displaying a change in their ability to
thermoregulate, shortening their developmental period and migrating to areas that would be
relatively cooler than the wetlands where they currently reside.
Fish physiology, specifically thermoregulation, reproduction and development, would be
adversely affected with increasing temperatures.

Increasing temperatures could create algal blooms which would be detrimental to the overall
ecology of the wetlands. Mangroves would also be disadvantaged with increasing temperatures
and rainfall variation.
3.6 Recommendations for improving adaptive capacity of Khijadiya Bird
Sanctuary
Based on the vulnerability assessment conducted, the following adaptation measures have been
identified to respond to the imminent climate change impacts on Khijadiya Bird Sanctuary. For the
purpose of prioritisation based on the immediacy of action required for each measure, these have been
categorised into: short term (0–5 years), medium term (5–10 years) and long term (over 10 years).
1. Outreach and educational programmes
External stressor addressed by the measure: Human activity and human ignorance
Proposed implementation time: Short term
Description:
Outreach and educational campaigns aimed at sensitisation towards wetlands should be organised for:
Communities living near the wetland (eg. Khijdaiya village and Dhunvav village near the sanctuary)
School children
Tourists
Professional researchers
These programmes could help generate awareness on the impact of climate change on the wetlands
and encourage people to invest in and implement climate change adaptation and mitigation practices.
2. Training programmes for management officials
External stressor addressed by the measure: Lack of technical expertise about wetland conservation
Proposed implementation time: Short term
Description:
The forest department officers and officials can be provided with training specific to climate change
impact and mitigation strategies for the management of the wetland. Trainings could cover courses on
Wetland species repository, wetland conservation and management, promoting networking between
different stakeholders. These programmes could consist of international rangers, officers and scientists
from areas that have been successful in implementing said strategies.
Case Study: Effective use of community awareness campaigns and capacity building
A successful example of effective use of community awareness and involvement in wetland restoration is that of Tikamgarh district in Madhya Pradesh. The district has a large number of water bodies used for irrigation, fisheries and drinking purposes, which faced extreme water scarcity for three consecutive years from 2000 to 2003. Due to years of neglect, siltation and encroachment, live storage capacity in most of the tanks had reduced to below 50%.
The district management took an initiative to gauge the interest levels of surrounding communities by organising meetings with Water Users Associations (WUAs) and fishermen societies, thus, motivating them to take action at the field level. Similarly, clear cut directions were given to the Chief Executive Officers of the sub-district level rural local bodies and the Chief Municipal Officers to mobilize their field level staff. Zonal officers heading a team of field staff were given responsibility of a cluster of villages to monitor the programme and provide technical guidance. A Gram Sabha (Village community) participatory workshop was also organized wherein about 200 villagers, students and NGOs reportedly participated.
As a result, there was an overwhelming response from the community in awareness as well as conservation works. Cleaning and desilting activities were undertaken at Hanumansagar, Maharajpura Tank, Nayakhera Tank and Bhimtal through participation of water users groups,
especially women self-help groups. 139 tanks were cleaned, and 45 rainwater harvesting structures were constructed. This illustrates how a campaign for conservation of water bodies can be run by motivating the stakeholders. However, such actions also necessitate that the government field level bureaucracy is willing to provide the enabling environment and have institutions with requisite trainings and capacities to plan such initiatives, further train the communities and involve them in a coherent way.
Source: http://www.gwp.org/globalassets/global/toolbox/case-studies/asia-and-caucasus/india.-a-campaign-for-conservation-of-water-bodies-by-water-user-groups-246.pdf
3. Water management
External stressor addressed by the measure: Decrease in level of water in both ground and
surface water, increase in evaporation rate, temperature, rainfall
Proposed implementation time: Short term
Description:
In order to determine sufficient water availability in the wetland, water storage and management
strategies need to be identified and implemented. These strategies can help reduce flooding and run-
off and encourage ground and surface water recharge as well as water retention potential of the
wetland. As this would have an impact on several areas of economic value (agriculture, tourism,
fisheries amongst others), all stakeholders must be consulted for this activity.
Some of the measures for improving water retention in the wetland are detailed above in Section 2.7.
These measures must be supplemented by improved monitoring of water extraction from the wetland
by the surrounding communities and measures to secure a suitable alternative water source for their
usage, if required.
4. Expanding vegetation cover
External stressor addressed by the measure: Habitat degradation and loss, invasive species
Proposed implementation time: Short/medium term
Description:
Vegetation is key to any ecosystem. The wetlands have their own unique, but isolated native species
that provide various resources to all fauna that dwell there. Vegetation cover can be expanded through
the introduction of native species (species as recommended in the Floral Baseline Survey by GIZ) in
the wetland areas. Moreover, building a canopy cover along the edges of the wetland complex can also
help in hydraulic retention. Plants like Phragmites karka (Tall reeds) are a good example of native
species that not only has hydraulic retention properties but is also adept at treatment of wastewater
(Billore et. al. 1999)
5. Invasive species control
External stressor addressed by the measure: Invasive species, temperature rise, rainfall
fluctuation, water level decrease
Proposed implementation time: Short/medium term
Description:
Climate change impacts on the wetlands result in an increase in the invasion of exotic species.
Measures need to be identified and implemented to curb such invasion as they are detrimental to all
native species of the wetlands. Invasive species like Prosopis and Eichhornia crassipes have already
been found to encroach into the wetland to a significant level, and have been reducing native vegetation
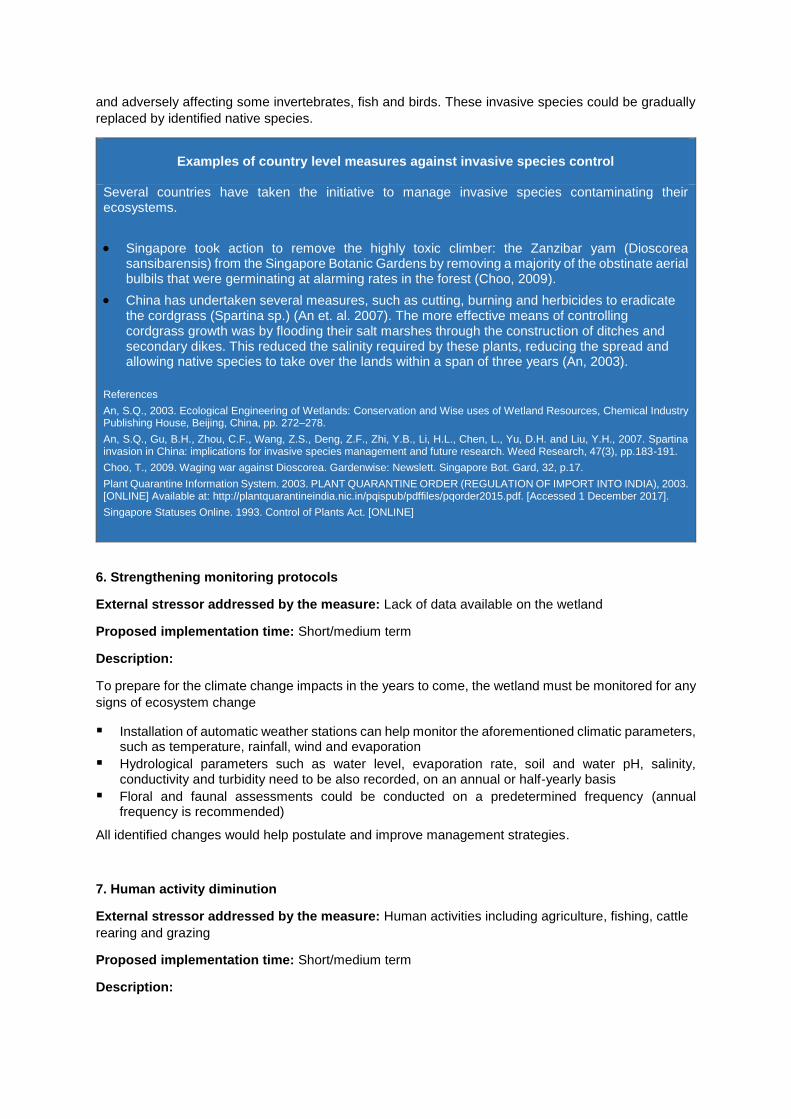
and adversely affecting some invertebrates, fish and birds. These invasive species could be gradually
replaced by identified native species.
Examples of country level measures against invasive species control
Several countries have taken the initiative to manage invasive species contaminating their ecosystems.
Singapore took action to remove the highly toxic climber: the Zanzibar yam (Dioscorea sansibarensis) from the Singapore Botanic Gardens by removing a majority of the obstinate aerial bulbils that were germinating at alarming rates in the forest (Choo, 2009).
China has undertaken several measures, such as cutting, burning and herbicides to eradicate the cordgrass (Spartina sp.) (An et. al. 2007). The more effective means of controlling cordgrass growth was by flooding their salt marshes through the construction of ditches and secondary dikes. This reduced the salinity required by these plants, reducing the spread and allowing native species to take over the lands within a span of three years (An, 2003).
References
An, S.Q., 2003. Ecological Engineering of Wetlands: Conservation and Wise uses of Wetland Resources, Chemical Industry Publishing House, Beijing, China, pp. 272–278.
An, S.Q., Gu, B.H., Zhou, C.F., Wang, Z.S., Deng, Z.F., Zhi, Y.B., Li, H.L., Chen, L., Yu, D.H. and Liu, Y.H., 2007. Spartina invasion in China: implications for invasive species management and future research. Weed Research, 47(3), pp.183-191.
Choo, T., 2009. Waging war against Dioscorea. Gardenwise: Newslett. Singapore Bot. Gard, 32, p.17.
Plant Quarantine Information System. 2003. PLANT QUARANTINE ORDER (REGULATION OF IMPORT INTO INDIA), 2003. [ONLINE] Available at: http://plantquarantineindia.nic.in/pqispub/pdffiles/pqorder2015.pdf. [Accessed 1 December 2017].
Singapore Statuses Online. 1993. Control of Plants Act. [ONLINE]
6. Strengthening monitoring protocols
External stressor addressed by the measure: Lack of data available on the wetland
Proposed implementation time: Short/medium term
Description:
To prepare for the climate change impacts in the years to come, the wetland must be monitored for any
signs of ecosystem change
Installation of automatic weather stations can help monitor the aforementioned climatic parameters, such as temperature, rainfall, wind and evaporation
Hydrological parameters such as water level, evaporation rate, soil and water pH, salinity, conductivity and turbidity need to be also recorded, on an annual or half-yearly basis
Floral and faunal assessments could be conducted on a predetermined frequency (annual frequency is recommended)
All identified changes would help postulate and improve management strategies.
7. Human activity diminution
External stressor addressed by the measure: Human activities including agriculture, fishing, cattle
rearing and grazing
Proposed implementation time: Short/medium term
Description:
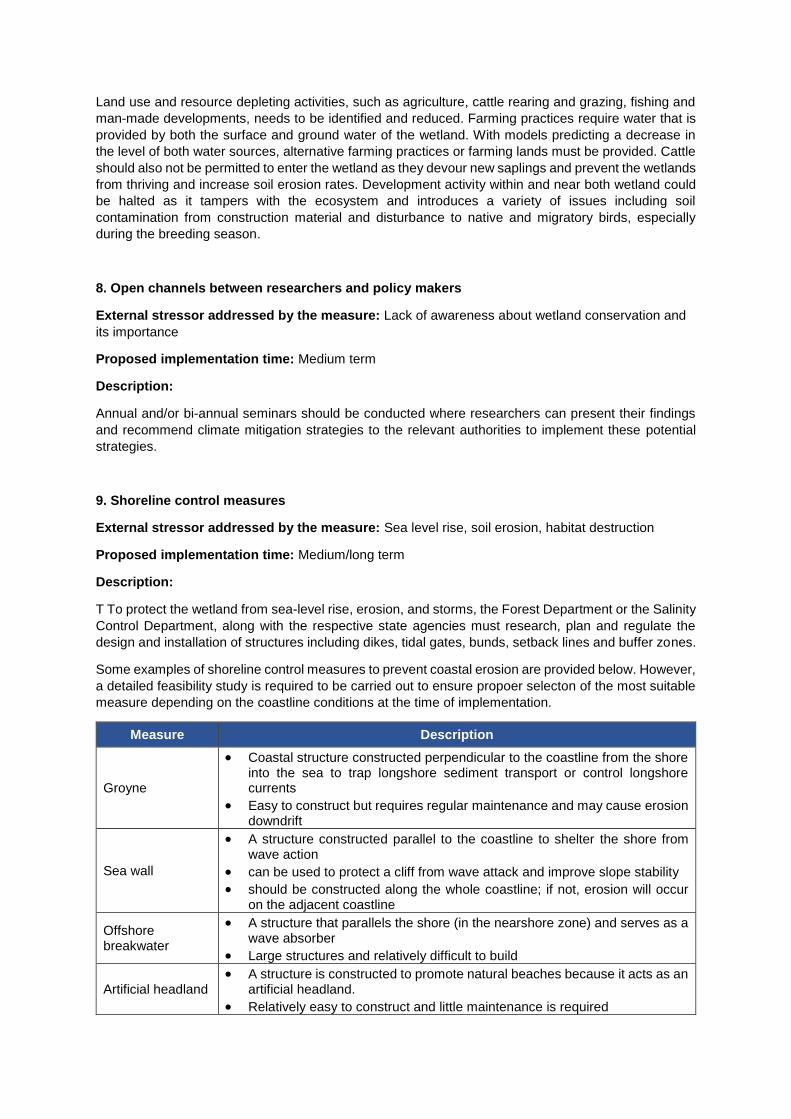
Land use and resource depleting activities, such as agriculture, cattle rearing and grazing, fishing and
man-made developments, needs to be identified and reduced. Farming practices require water that is
provided by both the surface and ground water of the wetland. With models predicting a decrease in
the level of both water sources, alternative farming practices or farming lands must be provided. Cattle
should also not be permitted to enter the wetland as they devour new saplings and prevent the wetlands
from thriving and increase soil erosion rates. Development activity within and near both wetland could
be halted as it tampers with the ecosystem and introduces a variety of issues including soil
contamination from construction material and disturbance to native and migratory birds, especially
during the breeding season.
8. Open channels between researchers and policy makers
External stressor addressed by the measure: Lack of awareness about wetland conservation and
its importance
Proposed implementation time: Medium term
Description:
Annual and/or bi-annual seminars should be conducted where researchers can present their findings
and recommend climate mitigation strategies to the relevant authorities to implement these potential
strategies.
9. Shoreline control measures
External stressor addressed by the measure: Sea level rise, soil erosion, habitat destruction
Proposed implementation time: Medium/long term
Description:
T To protect the wetland from sea-level rise, erosion, and storms, the Forest Department or the Salinity
Control Department, along with the respective state agencies must research, plan and regulate the
design and installation of structures including dikes, tidal gates, bunds, setback lines and buffer zones.
Some examples of shoreline control measures to prevent coastal erosion are provided below. However,
a detailed feasibility study is required to be carried out to ensure propoer selecton of the most suitable
measure depending on the coastline conditions at the time of implementation.
Measure Description
Groyne
Coastal structure constructed perpendicular to the coastline from the shore into the sea to trap longshore sediment transport or control longshore currents
Easy to construct but requires regular maintenance and may cause erosion downdrift
Sea wall
A structure constructed parallel to the coastline to shelter the shore from wave action
can be used to protect a cliff from wave attack and improve slope stability
should be constructed along the whole coastline; if not, erosion will occur on the adjacent coastline
Offshore breakwater
A structure that parallels the shore (in the nearshore zone) and serves as a wave absorber
Large structures and relatively difficult to build
Artificial headland A structure is constructed to promote natural beaches because it acts as an
artificial headland.
Relatively easy to construct and little maintenance is required
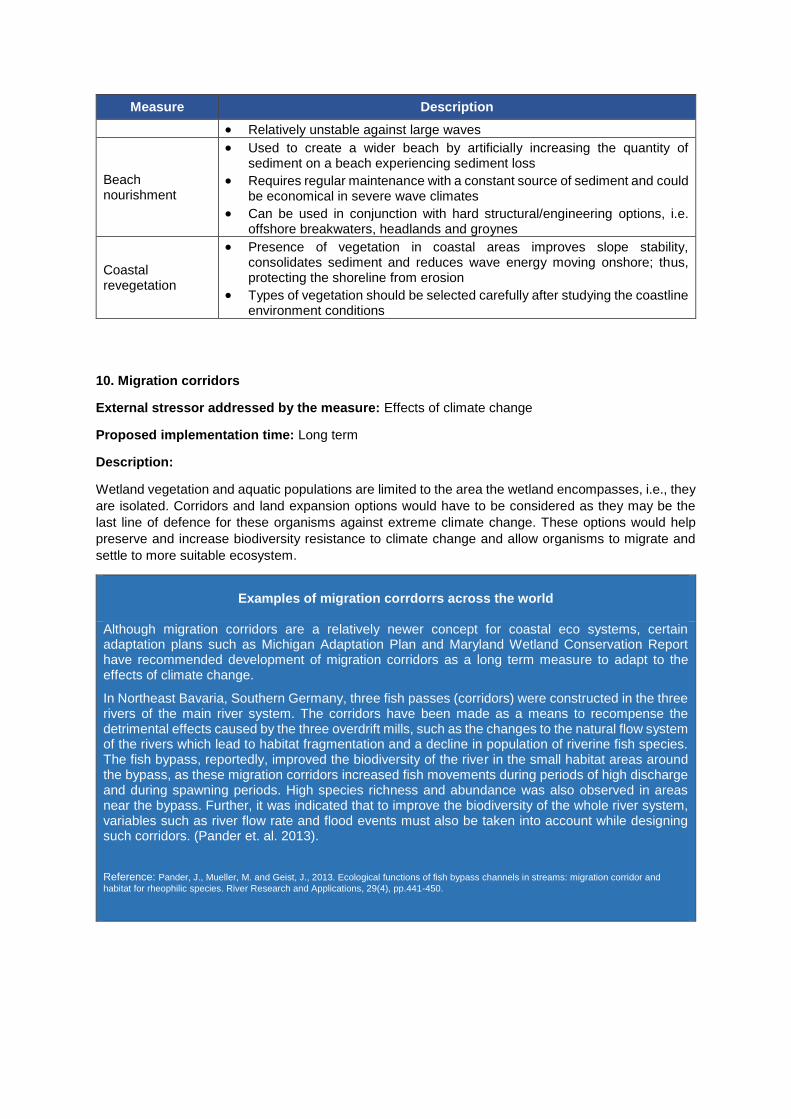
Measure Description
Relatively unstable against large waves
Beach nourishment
Used to create a wider beach by artificially increasing the quantity of sediment on a beach experiencing sediment loss
Requires regular maintenance with a constant source of sediment and could be economical in severe wave climates
Can be used in conjunction with hard structural/engineering options, i.e. offshore breakwaters, headlands and groynes
Coastal revegetation
Presence of vegetation in coastal areas improves slope stability, consolidates sediment and reduces wave energy moving onshore; thus, protecting the shoreline from erosion
Types of vegetation should be selected carefully after studying the coastline environment conditions
10. Migration corridors
External stressor addressed by the measure: Effects of climate change
Proposed implementation time: Long term
Description:
Wetland vegetation and aquatic populations are limited to the area the wetland encompasses, i.e., they
are isolated. Corridors and land expansion options would have to be considered as they may be the
last line of defence for these organisms against extreme climate change. These options would help
preserve and increase biodiversity resistance to climate change and allow organisms to migrate and
settle to more suitable ecosystem.
Examples of migration corrdorrs across the world
Although migration corridors are a relatively newer concept for coastal eco systems, certain adaptation plans such as Michigan Adaptation Plan and Maryland Wetland Conservation Report have recommended development of migration corridors as a long term measure to adapt to the effects of climate change.
In Northeast Bavaria, Southern Germany, three fish passes (corridors) were constructed in the three rivers of the main river system. The corridors have been made as a means to recompense the detrimental effects caused by the three overdrift mills, such as the changes to the natural flow system of the rivers which lead to habitat fragmentation and a decline in population of riverine fish species. The fish bypass, reportedly, improved the biodiversity of the river in the small habitat areas around the bypass, as these migration corridors increased fish movements during periods of high discharge and during spawning periods. High species richness and abundance was also observed in areas near the bypass. Further, it was indicated that to improve the biodiversity of the whole river system, variables such as river flow rate and flood events must also be taken into account while designing such corridors. (Pander et. al. 2013).
Reference: Pander, J., Mueller, M. and Geist, J., 2013. Ecological functions of fish bypass channels in streams: migration corridor and
habitat for rheophilic species. River Research and Applications, 29(4), pp.441-450.
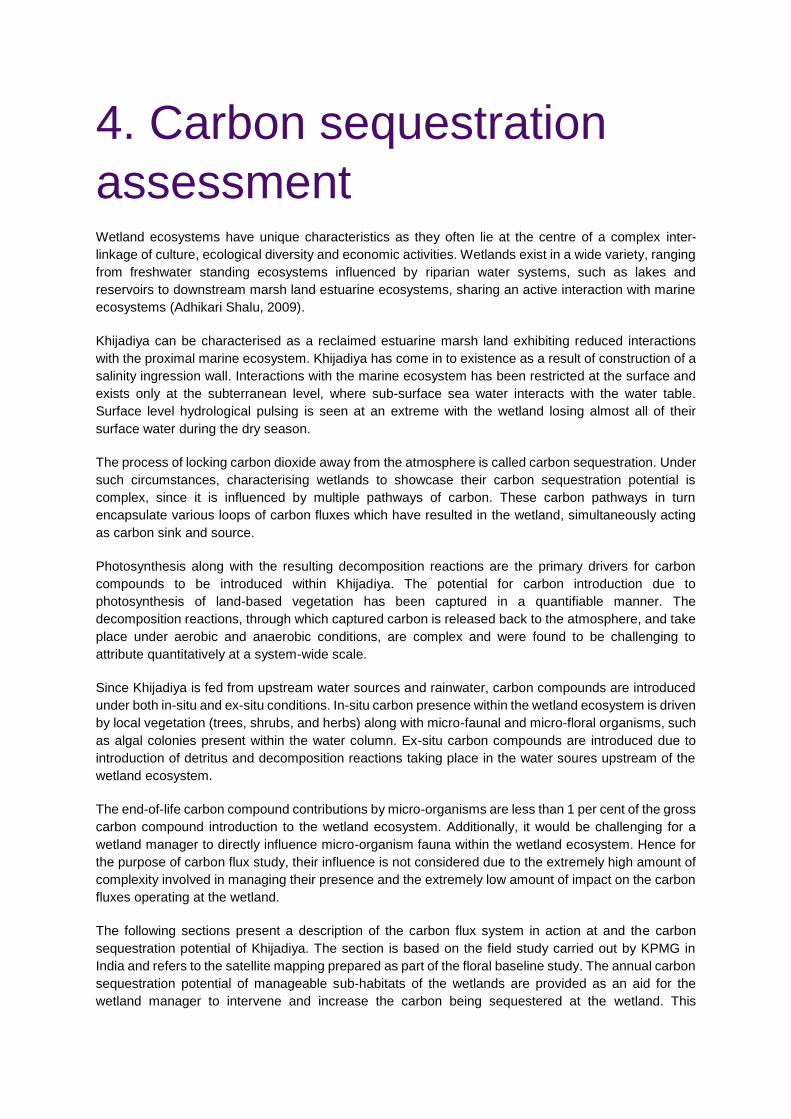
4. Carbon sequestration
assessment Wetland ecosystems have unique characteristics as they often lie at the centre of a complex inter-
linkage of culture, ecological diversity and economic activities. Wetlands exist in a wide variety, ranging
from freshwater standing ecosystems influenced by riparian water systems, such as lakes and
reservoirs to downstream marsh land estuarine ecosystems, sharing an active interaction with marine
ecosystems (Adhikari Shalu, 2009).
Khijadiya can be characterised as a reclaimed estuarine marsh land exhibiting reduced interactions
with the proximal marine ecosystem. Khijadiya has come in to existence as a result of construction of a
salinity ingression wall. Interactions with the marine ecosystem has been restricted at the surface and
exists only at the subterranean level, where sub-surface sea water interacts with the water table.
Surface level hydrological pulsing is seen at an extreme with the wetland losing almost all of their
surface water during the dry season.
The process of locking carbon dioxide away from the atmosphere is called carbon sequestration. Under
such circumstances, characterising wetlands to showcase their carbon sequestration potential is
complex, since it is influenced by multiple pathways of carbon. These carbon pathways in turn
encapsulate various loops of carbon fluxes which have resulted in the wetland, simultaneously acting
as carbon sink and source.
Photosynthesis along with the resulting decomposition reactions are the primary drivers for carbon
compounds to be introduced within Khijadiya. The potential for carbon introduction due to
photosynthesis of land-based vegetation has been captured in a quantifiable manner. The
decomposition reactions, through which captured carbon is released back to the atmosphere, and take
place under aerobic and anaerobic conditions, are complex and were found to be challenging to
attribute quantitatively at a system-wide scale.
Since Khijadiya is fed from upstream water sources and rainwater, carbon compounds are introduced
under both in-situ and ex-situ conditions. In-situ carbon presence within the wetland ecosystem is driven
by local vegetation (trees, shrubs, and herbs) along with micro-faunal and micro-floral organisms, such
as algal colonies present within the water column. Ex-situ carbon compounds are introduced due to
introduction of detritus and decomposition reactions taking place in the water soures upstream of the
wetland ecosystem.
The end-of-life carbon compound contributions by micro-organisms are less than 1 per cent of the gross
carbon compound introduction to the wetland ecosystem. Additionally, it would be challenging for a
wetland manager to directly influence micro-organism fauna within the wetland ecosystem. Hence for
the purpose of carbon flux study, their influence is not considered due to the extremely high amount of
complexity involved in managing their presence and the extremely low amount of impact on the carbon
fluxes operating at the wetland.
The following sections present a description of the carbon flux system in action at and the carbon
sequestration potential of Khijadiya. The section is based on the field study carried out by KPMG in
India and refers to the satellite mapping prepared as part of the floral baseline study. The annual carbon
sequestration potential of manageable sub-habitats of the wetlands are provided as an aid for the
wetland manager to intervene and increase the carbon being sequestered at the wetland. This
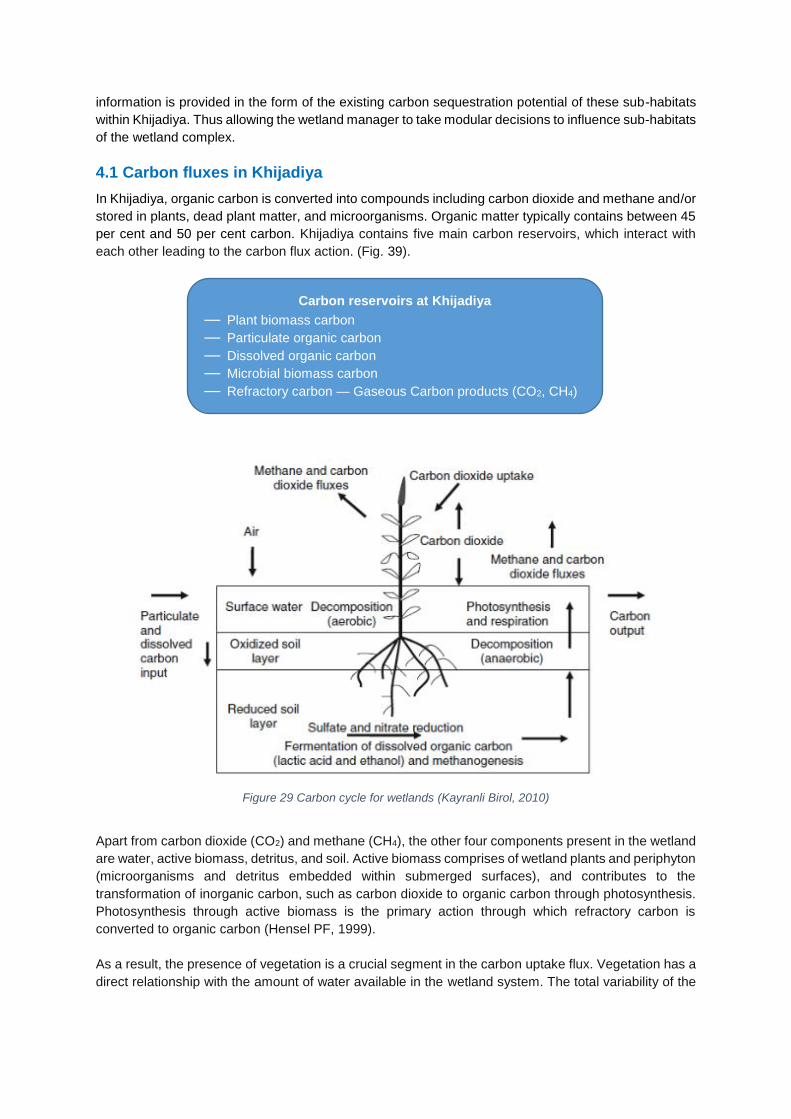
information is provided in the form of the existing carbon sequestration potential of these sub-habitats
within Khijadiya. Thus allowing the wetland manager to take modular decisions to influence sub-habitats
of the wetland complex.
4.1 Carbon fluxes in Khijadiya
In Khijadiya, organic carbon is converted into compounds including carbon dioxide and methane and/or
stored in plants, dead plant matter, and microorganisms. Organic matter typically contains between 45
per cent and 50 per cent carbon. Khijadiya contains five main carbon reservoirs, which interact with
each other leading to the carbon flux action. (Fig. 39).
Figure 29 Carbon cycle for wetlands (Kayranli Birol, 2010)
Apart from carbon dioxide (CO2) and methane (CH4), the other four components present in the wetland
are water, active biomass, detritus, and soil. Active biomass comprises of wetland plants and periphyton
(microorganisms and detritus embedded within submerged surfaces), and contributes to the
transformation of inorganic carbon, such as carbon dioxide to organic carbon through photosynthesis.
Photosynthesis through active biomass is the primary action through which refractory carbon is
converted to organic carbon (Hensel PF, 1999).
As a result, the presence of vegetation is a crucial segment in the carbon uptake flux. Vegetation has a
direct relationship with the amount of water available in the wetland system. The total variability of the
Carbon reservoirs at Khijadiya
— Plant biomass carbon
— Particulate organic carbon
— Dissolved organic carbon
— Microbial biomass carbon
— Refractory carbon — Gaseous Carbon products (CO2, CH4)
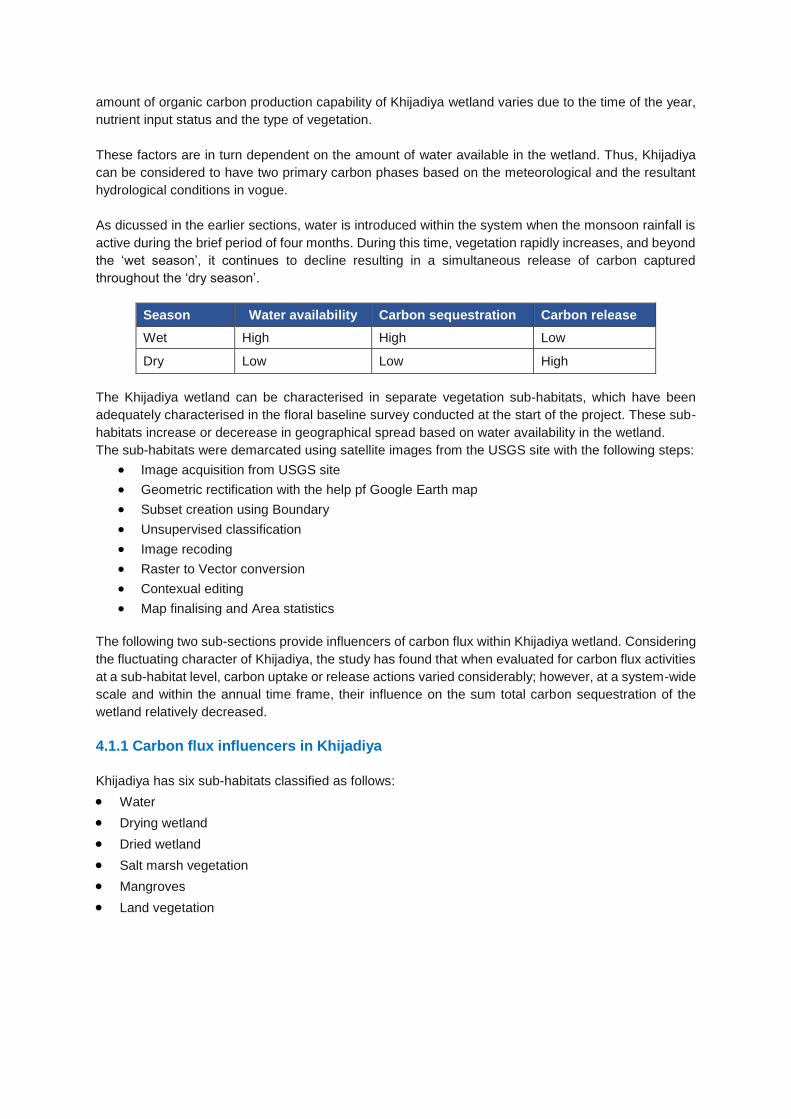
amount of organic carbon production capability of Khijadiya wetland varies due to the time of the year,
nutrient input status and the type of vegetation.
These factors are in turn dependent on the amount of water available in the wetland. Thus, Khijadiya
can be considered to have two primary carbon phases based on the meteorological and the resultant
hydrological conditions in vogue.
As dicussed in the earlier sections, water is introduced within the system when the monsoon rainfall is
active during the brief period of four months. During this time, vegetation rapidly increases, and beyond
the ‘wet season’, it continues to decline resulting in a simultaneous release of carbon captured
throughout the ‘dry season’.
Season Water availability Carbon sequestration Carbon release
Wet High High Low
Dry Low Low High
The Khijadiya wetland can be characterised in separate vegetation sub-habitats, which have been
adequately characterised in the floral baseline survey conducted at the start of the project. These sub-
habitats increase or decerease in geographical spread based on water availability in the wetland.
The sub-habitats were demarcated using satellite images from the USGS site with the following steps:
Image acquisition from USGS site
Geometric rectification with the help pf Google Earth map
Subset creation using Boundary
Unsupervised classification
Image recoding
Raster to Vector conversion
Contexual editing
Map finalising and Area statistics
The following two sub-sections provide influencers of carbon flux within Khijadiya wetland. Considering
the fluctuating character of Khijadiya, the study has found that when evaluated for carbon flux activities
at a sub-habitat level, carbon uptake or release actions varied considerably; however, at a system-wide
scale and within the annual time frame, their influence on the sum total carbon sequestration of the
wetland relatively decreased.
4.1.1 Carbon flux influencers in Khijadiya
Khijadiya has six sub-habitats classified as follows:
Water
Drying wetland
Dried wetland
Salt marsh vegetation
Mangroves
Land vegetation
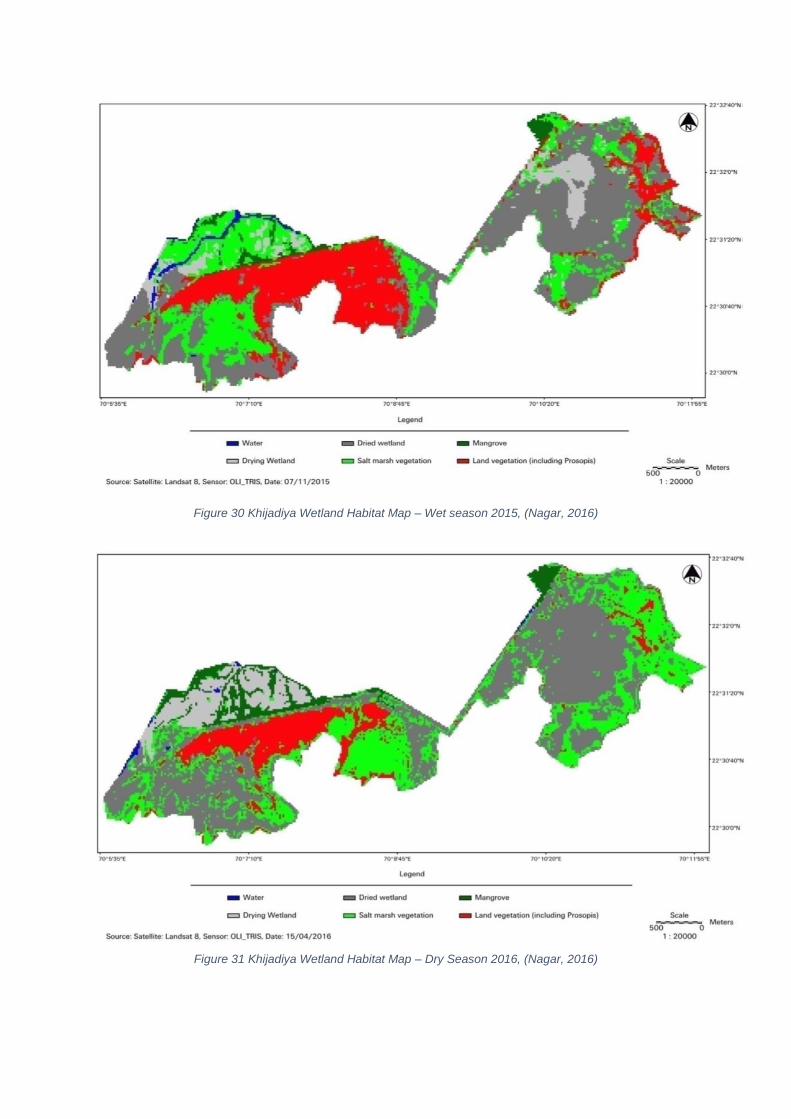
Figure 30 Khijadiya Wetland Habitat Map – Wet season 2015, (Nagar, 2016)
Figure 31 Khijadiya Wetland Habitat Map – Dry Season 2016, (Nagar, 2016)
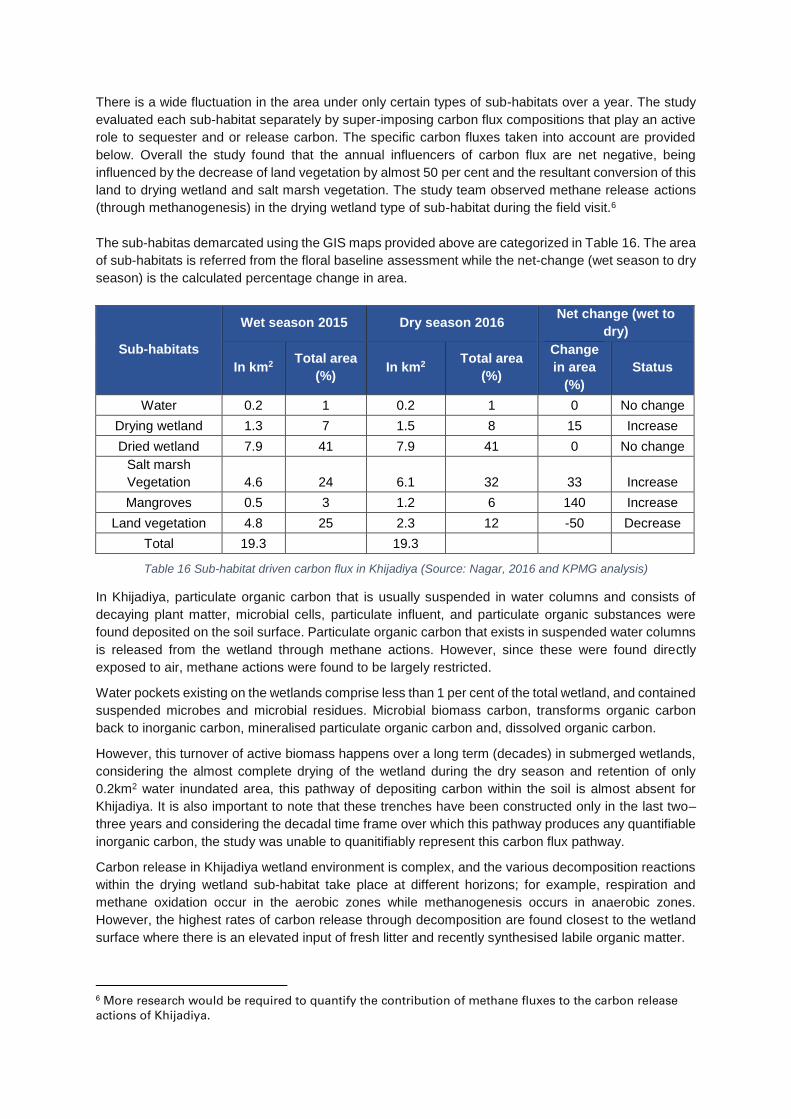
There is a wide fluctuation in the area under only certain types of sub-habitats over a year. The study
evaluated each sub-habitat separately by super-imposing carbon flux compositions that play an active
role to sequester and or release carbon. The specific carbon fluxes taken into account are provided
below. Overall the study found that the annual influencers of carbon flux are net negative, being
influenced by the decrease of land vegetation by almost 50 per cent and the resultant conversion of this
land to drying wetland and salt marsh vegetation. The study team observed methane release actions
(through methanogenesis) in the drying wetland type of sub-habitat during the field visit.6
The sub-habitas demarcated using the GIS maps provided above are categorized in Table 16. The area
of sub-habitats is referred from the floral baseline assessment while the net-change (wet season to dry
season) is the calculated percentage change in area.
Sub-habitats
Wet season 2015 Dry season 2016 Net change (wet to
dry)
In km2 Total area
(%) In km2
Total area
(%)
Change
in area
(%)
Status
Water 0.2 1 0.2 1 0 No change
Drying wetland 1.3 7 1.5 8 15 Increase
Dried wetland 7.9 41 7.9 41 0 No change
Salt marsh
Vegetation 4.6 24 6.1 32 33 Increase
Mangroves 0.5 3 1.2 6 140 Increase
Land vegetation 4.8 25 2.3 12 -50 Decrease
Total 19.3 19.3
Table 16 Sub-habitat driven carbon flux in Khijadiya (Source: Nagar, 2016 and KPMG analysis)
In Khijadiya, particulate organic carbon that is usually suspended in water columns and consists of
decaying plant matter, microbial cells, particulate influent, and particulate organic substances were
found deposited on the soil surface. Particulate organic carbon that exists in suspended water columns
is released from the wetland through methane actions. However, since these were found directly
exposed to air, methane actions were found to be largely restricted.
Water pockets existing on the wetlands comprise less than 1 per cent of the total wetland, and contained
suspended microbes and microbial residues. Microbial biomass carbon, transforms organic carbon
back to inorganic carbon, mineralised particulate organic carbon and, dissolved organic carbon.
However, this turnover of active biomass happens over a long term (decades) in submerged wetlands,
considering the almost complete drying of the wetland during the dry season and retention of only
0.2km2 water inundated area, this pathway of depositing carbon within the soil is almost absent for
Khijadiya. It is also important to note that these trenches have been constructed only in the last two–
three years and considering the decadal time frame over which this pathway produces any quantifiable
inorganic carbon, the study was unable to quanitifiably represent this carbon flux pathway.
Carbon release in Khijadiya wetland environment is complex, and the various decomposition reactions
within the drying wetland sub-habitat take place at different horizons; for example, respiration and
methane oxidation occur in the aerobic zones while methanogenesis occurs in anaerobic zones.
However, the highest rates of carbon release through decomposition are found closest to the wetland
surface where there is an elevated input of fresh litter and recently synthesised labile organic matter.
6 More research would be required to quantify the contribution of methane fluxes to the carbon release actions of Khijadiya.
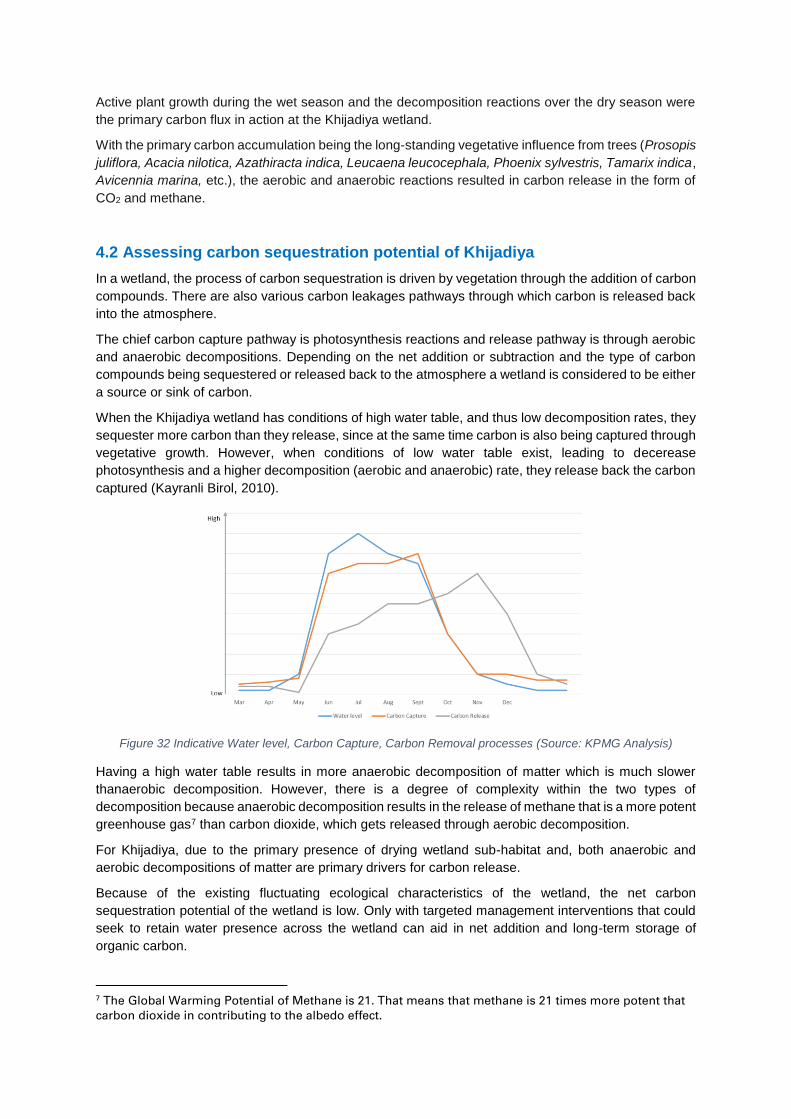
Active plant growth during the wet season and the decomposition reactions over the dry season were
the primary carbon flux in action at the Khijadiya wetland.
With the primary carbon accumulation being the long-standing vegetative influence from trees (Prosopis
juliflora, Acacia nilotica, Azathiracta indica, Leucaena leucocephala, Phoenix sylvestris, Tamarix indica,
Avicennia marina, etc.), the aerobic and anaerobic reactions resulted in carbon release in the form of
CO2 and methane.
4.2 Assessing carbon sequestration potential of Khijadiya
In a wetland, the process of carbon sequestration is driven by vegetation through the addition of carbon
compounds. There are also various carbon leakages pathways through which carbon is released back
into the atmosphere.
The chief carbon capture pathway is photosynthesis reactions and release pathway is through aerobic
and anaerobic decompositions. Depending on the net addition or subtraction and the type of carbon
compounds being sequestered or released back to the atmosphere a wetland is considered to be either
a source or sink of carbon.
When the Khijadiya wetland has conditions of high water table, and thus low decomposition rates, they
sequester more carbon than they release, since at the same time carbon is also being captured through
vegetative growth. However, when conditions of low water table exist, leading to decerease
photosynthesis and a higher decomposition (aerobic and anaerobic) rate, they release back the carbon
captured (Kayranli Birol, 2010).
Figure 32 Indicative Water level, Carbon Capture, Carbon Removal processes (Source: KPMG Analysis)
Having a high water table results in more anaerobic decomposition of matter which is much slower
thanaerobic decomposition. However, there is a degree of complexity within the two types of
decomposition because anaerobic decomposition results in the release of methane that is a more potent
greenhouse gas7 than carbon dioxide, which gets released through aerobic decomposition.
For Khijadiya, due to the primary presence of drying wetland sub-habitat and, both anaerobic and
aerobic decompositions of matter are primary drivers for carbon release.
Because of the existing fluctuating ecological characteristics of the wetland, the net carbon
sequestration potential of the wetland is low. Only with targeted management interventions that could
seek to retain water presence across the wetland can aid in net addition and long-term storage of
organic carbon.
7 The Global Warming Potential of Methane is 21. That means that methane is 21 times more potent that carbon dioxide in contributing to the albedo effect.
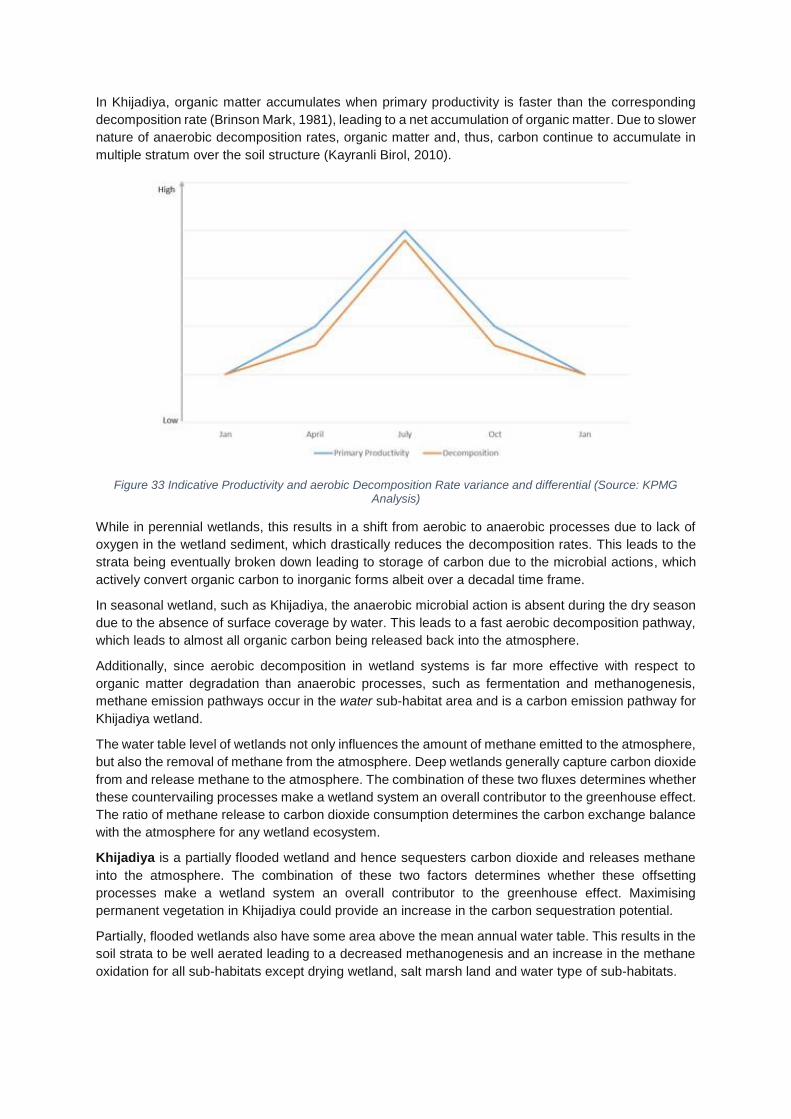
In Khijadiya, organic matter accumulates when primary productivity is faster than the corresponding
decomposition rate (Brinson Mark, 1981), leading to a net accumulation of organic matter. Due to slower
nature of anaerobic decomposition rates, organic matter and, thus, carbon continue to accumulate in
multiple stratum over the soil structure (Kayranli Birol, 2010).
Figure 33 Indicative Productivity and aerobic Decomposition Rate variance and differential (Source: KPMG Analysis)
While in perennial wetlands, this results in a shift from aerobic to anaerobic processes due to lack of
oxygen in the wetland sediment, which drastically reduces the decomposition rates. This leads to the
strata being eventually broken down leading to storage of carbon due to the microbial actions, which
actively convert organic carbon to inorganic forms albeit over a decadal time frame.
In seasonal wetland, such as Khijadiya, the anaerobic microbial action is absent during the dry season
due to the absence of surface coverage by water. This leads to a fast aerobic decomposition pathway,
which leads to almost all organic carbon being released back into the atmosphere.
Additionally, since aerobic decomposition in wetland systems is far more effective with respect to
organic matter degradation than anaerobic processes, such as fermentation and methanogenesis,
methane emission pathways occur in the water sub-habitat area and is a carbon emission pathway for
Khijadiya wetland.
The water table level of wetlands not only influences the amount of methane emitted to the atmosphere,
but also the removal of methane from the atmosphere. Deep wetlands generally capture carbon dioxide
from and release methane to the atmosphere. The combination of these two fluxes determines whether
these countervailing processes make a wetland system an overall contributor to the greenhouse effect.
The ratio of methane release to carbon dioxide consumption determines the carbon exchange balance
with the atmosphere for any wetland ecosystem.
Khijadiya is a partially flooded wetland and hence sequesters carbon dioxide and releases methane
into the atmosphere. The combination of these two factors determines whether these offsetting
processes make a wetland system an overall contributor to the greenhouse effect. Maximising
permanent vegetation in Khijadiya could provide an increase in the carbon sequestration potential.
Partially, flooded wetlands also have some area above the mean annual water table. This results in the
soil strata to be well aerated leading to a decreased methanogenesis and an increase in the methane
oxidation for all sub-habitats except drying wetland, salt marsh land and water type of sub-habitats.
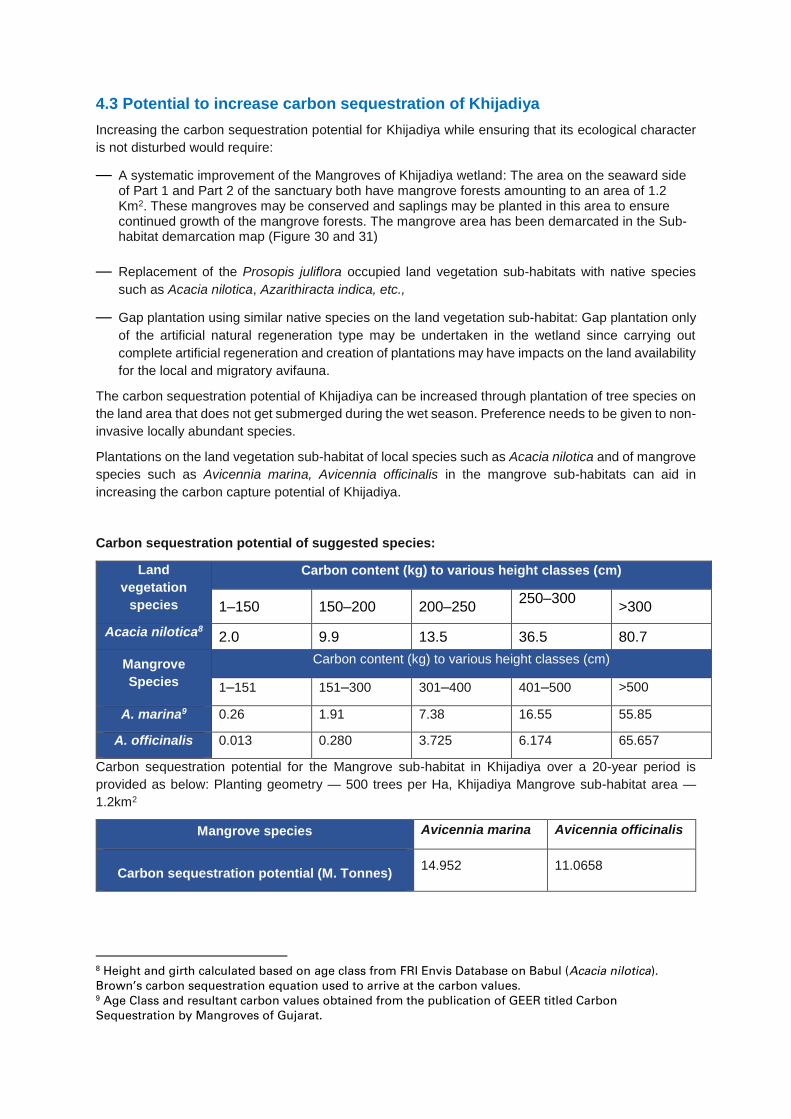
4.3 Potential to increase carbon sequestration of Khijadiya
Increasing the carbon sequestration potential for Khijadiya while ensuring that its ecological character
is not disturbed would require:
— A systematic improvement of the Mangroves of Khijadiya wetland: The area on the seaward side of Part 1 and Part 2 of the sanctuary both have mangrove forests amounting to an area of 1.2 Km2. These mangroves may be conserved and saplings may be planted in this area to ensure continued growth of the mangrove forests. The mangrove area has been demarcated in the Sub-habitat demarcation map (Figure 30 and 31)
— Replacement of the Prosopis juliflora occupied land vegetation sub-habitats with native species
such as Acacia nilotica, Azarithiracta indica, etc.,
— Gap plantation using similar native species on the land vegetation sub-habitat: Gap plantation only
of the artificial natural regeneration type may be undertaken in the wetland since carrying out
complete artificial regeneration and creation of plantations may have impacts on the land availability
for the local and migratory avifauna.
The carbon sequestration potential of Khijadiya can be increased through plantation of tree species on
the land area that does not get submerged during the wet season. Preference needs to be given to non-
invasive locally abundant species.
Plantations on the land vegetation sub-habitat of local species such as Acacia nilotica and of mangrove
species such as Avicennia marina, Avicennia officinalis in the mangrove sub-habitats can aid in
increasing the carbon capture potential of Khijadiya.
Carbon sequestration potential of suggested species:
Land
vegetation
species
Carbon content (kg) to various height classes (cm)
1–150 150–200 200–250 250–300
>300
Acacia nilotica8 2.0 9.9 13.5 36.5 80.7
Mangrove
Species
Carbon content (kg) to various height classes (cm)
1–151 151–300 301–400 401–500 >500
A. marina9 0.26 1.91 7.38 16.55 55.85
A. officinalis 0.013 0.280 3.725 6.174 65.657
Carbon sequestration potential for the Mangrove sub-habitat in Khijadiya over a 20-year period is
provided as below: Planting geometry — 500 trees per Ha, Khijadiya Mangrove sub-habitat area —
1.2km2
Mangrove species Avicennia marina Avicennia officinalis
Carbon sequestration potential (M. Tonnes) 14.952 11.0658
8 Height and girth calculated based on age class from FRI Envis Database on Babul (Acacia nilotica). Brown’s carbon sequestration equation used to arrive at the carbon values. 9 Age Class and resultant carbon values obtained from the publication of GEER titled Carbon Sequestration by Mangroves of Gujarat.

Carbon sequestration potential for the land vegetation sub-habitat in Khijadiya over a 20-year period is
provided as below: Khijadiya land vegetation sub-habitat area — 2.3km2
Acacia nilotica Khijadiya
Carbon Sequestration Potential (M. Tonnes) 55.22
Detailed year-on-year growth of sequestered carbon for Khijadiya has been provided in Annexure 1.
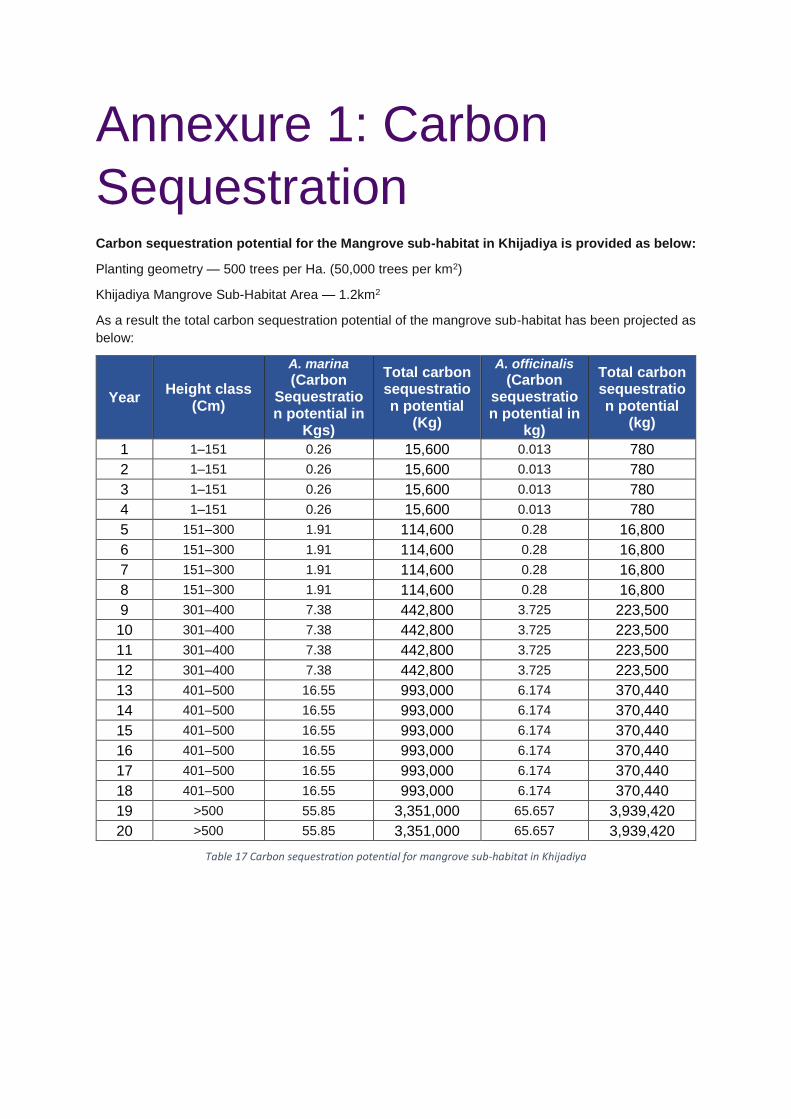
Annexure 1: Carbon
Sequestration
Carbon sequestration potential for the Mangrove sub-habitat in Khijadiya is provided as below:
Planting geometry — 500 trees per Ha. (50,000 trees per km2)
Khijadiya Mangrove Sub-Habitat Area — 1.2km2
As a result the total carbon sequestration potential of the mangrove sub-habitat has been projected as
below:
Year Height class
(Cm)
A. marina
(Carbon Sequestration potential in
Kgs)
Total carbon sequestration potential
(Kg)
A. officinalis
(Carbon sequestration potential in
kg)
Total carbon sequestration potential
(kg)
1 1–151 0.26 15,600 0.013 780
2 1–151 0.26 15,600 0.013 780
3 1–151 0.26 15,600 0.013 780
4 1–151 0.26 15,600 0.013 780
5 151–300 1.91 114,600 0.28 16,800
6 151–300 1.91 114,600 0.28 16,800
7 151–300 1.91 114,600 0.28 16,800
8 151–300 1.91 114,600 0.28 16,800
9 301–400 7.38 442,800 3.725 223,500
10 301–400 7.38 442,800 3.725 223,500
11 301–400 7.38 442,800 3.725 223,500
12 301–400 7.38 442,800 3.725 223,500
13 401–500 16.55 993,000 6.174 370,440
14 401–500 16.55 993,000 6.174 370,440
15 401–500 16.55 993,000 6.174 370,440
16 401–500 16.55 993,000 6.174 370,440
17 401–500 16.55 993,000 6.174 370,440
18 401–500 16.55 993,000 6.174 370,440
19 >500 55.85 3,351,000 65.657 3,939,420
20 >500 55.85 3,351,000 65.657 3,939,420
Table 17 Carbon sequestration potential for mangrove sub-habitat in Khijadiya
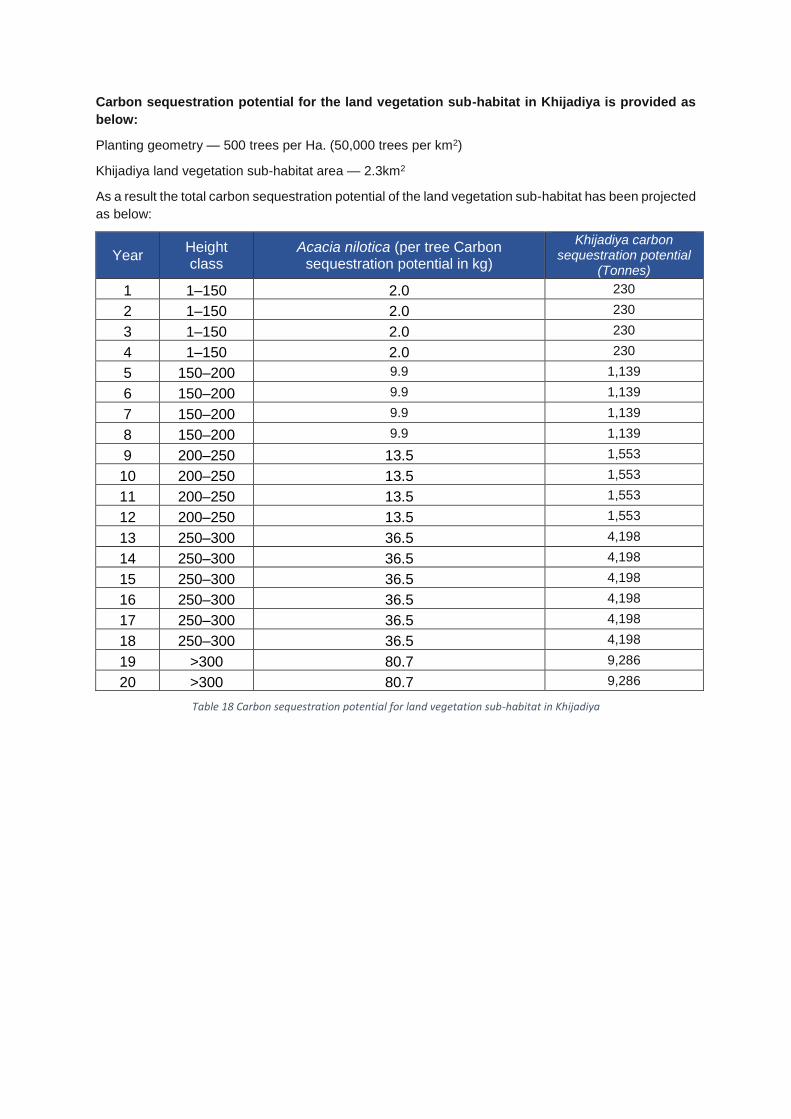
Carbon sequestration potential for the land vegetation sub-habitat in Khijadiya is provided as
below:
Planting geometry — 500 trees per Ha. (50,000 trees per km2)
Khijadiya land vegetation sub-habitat area — 2.3km2
As a result the total carbon sequestration potential of the land vegetation sub-habitat has been projected
as below:
Year Height class
Acacia nilotica (per tree Carbon sequestration potential in kg)
Khijadiya carbon sequestration potential
(Tonnes)
1 1–150 2.0 230
2 1–150 2.0 230
3 1–150 2.0 230
4 1–150 2.0 230
5 150–200 9.9 1,139
6 150–200 9.9 1,139
7 150–200 9.9 1,139
8 150–200 9.9 1,139
9 200–250 13.5 1,553
10 200–250 13.5 1,553
11 200–250 13.5 1,553
12 200–250 13.5 1,553
13 250–300 36.5 4,198
14 250–300 36.5 4,198
15 250–300 36.5 4,198
16 250–300 36.5 4,198
17 250–300 36.5 4,198
18 250–300 36.5 4,198
19 >300 80.7 9,286
20 >300 80.7 9,286
Table 18 Carbon sequestration potential for land vegetation sub-habitat in Khijadiya
Annexure 2: Field Visits
The team conducted two field visits to Khijadiya Bird Sanctuary in the months of February and March,
respectively. The team consisted of professionals and researchers from KPMG, IIT, and NIH.
The objective of both visits was to initiate dialogue and collect data for conducting the hydrological
assessment and climate risk vulnerability assessment study. Apart from carrying out a physical run-
through of the project site, discussions were held with various officials of relevant government
departments and local authorities to understand key issues of the wetland and explore data availability
for the study.
During the visits, discussions were held with the following authorities:
Jamnagar
Forest Department
Salinity Ingression Control Department
District Statistics Office
District Agriculture Office
District Irrigation Office
Krishi Vigyan Kendra District Office
District Disaster Management Department
Public Works Department District Office
Interpretation Centre, Khijadiya
Further, we also met Bhaskaracharya Institute of Space and Application (BISAG), Gandhinagar to
explore availability of maps and toposheets of the wetland.
Data Collection:
A detailed meeting was held with the Forest Department of Jamnagar on the first day of the visit. These
discussions were focused on understanding the history of the wetland and current hydrological, climatic
and socio-economic regime of the wetland. The Forest Department officials pointed the team to other
departments which may provide us with the data required for the study.
The following documents and datasets was collected during our interactions with various departments:
Data Source
Daily meteorological data (rainfall, min. and max. temperature,
evaporation, wind speed, etc.) for Jamnagar district for a period of past six
years
Krishi Vigyan Kendra, Jamnagar
Annual rainfall data for Jamnagar for the past ten years District Agriculture
Office, Jamnagar
Statistical Yearbook of Jamnagar District, 2016 (in Gujarati) District Statistics
Office, Jamnagar
Readings for gauges installed in Khijadiya wetland for measuring water
level
Forest Department,
Jamnagar
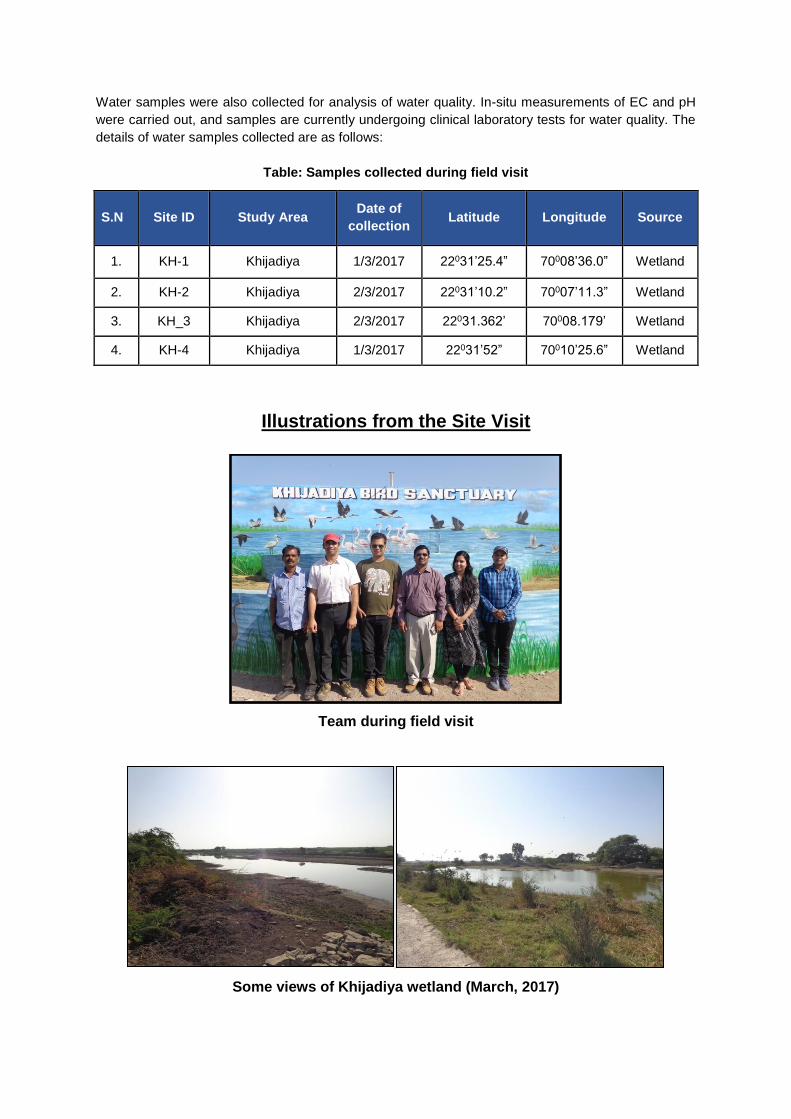
Water samples were also collected for analysis of water quality. In-situ measurements of EC and pH
were carried out, and samples are currently undergoing clinical laboratory tests for water quality. The
details of water samples collected are as follows:
Table: Samples collected during field visit
S.N Site ID Study Area Date of
collection Latitude Longitude Source
1. KH-1 Khijadiya 1/3/2017 22031’25.4” 70008’36.0” Wetland
2. KH-2 Khijadiya 2/3/2017 22031’10.2” 70007’11.3” Wetland
3. KH_3 Khijadiya 2/3/2017 22031.362’ 70008.179’ Wetland
4. KH-4 Khijadiya 1/3/2017 22031’52” 70010’25.6” Wetland
Illustrations from the Site Visit
Team during field visit
Some views of Khijadiya wetland (March, 2017)
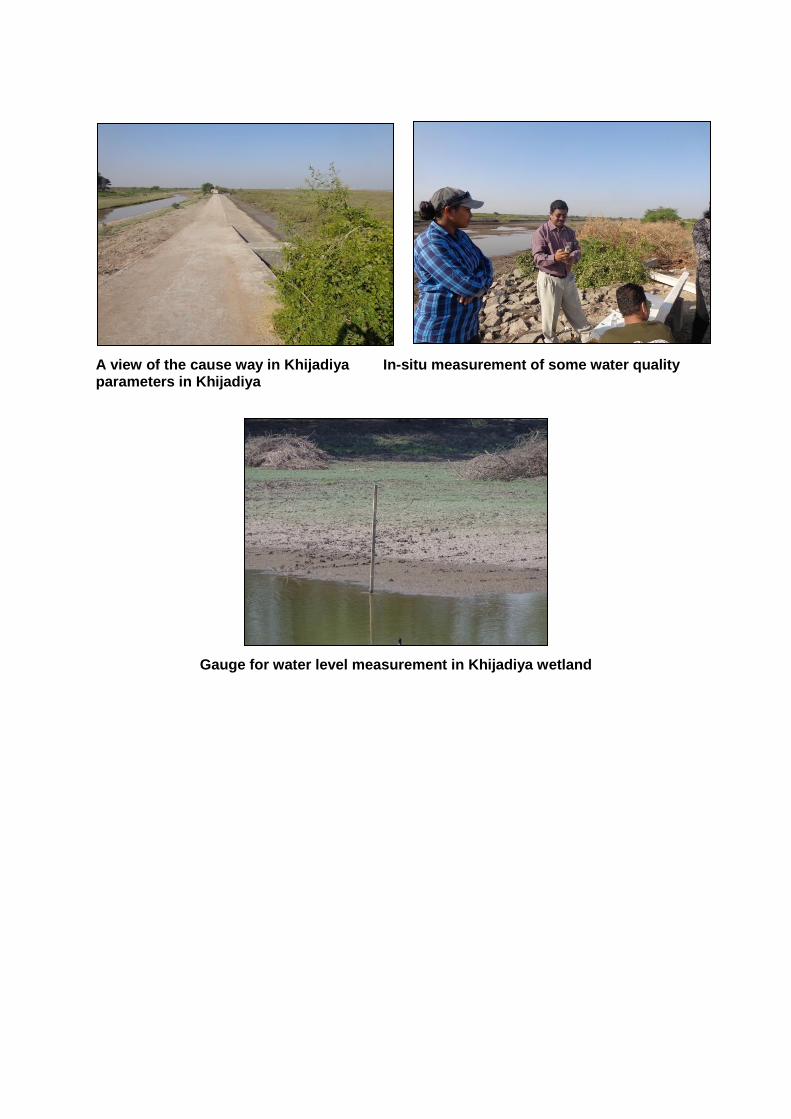
A view of the cause way in Khijadiya In-situ measurement of some water quality parameters in Khijadiya
Gauge for water level measurement in Khijadiya wetland
References Adhikari Shalu, M. B. (2009). A Review of Carbon Dynamics and Sequestration in Wetlands. Journal of Wetlands Ecology, 42-46.
Andrews, T.J., Clough, B.F. and Muller, G.J., 1984. Photosynthetic gas exchange properties and carbon isotope ratios of some mangroves in North Queensland. Physiology and management of mangroves, tasks for vegetation science, 9, pp.15-23.
Bale, J.S., Masters, G.J., Hodkinson, I.D., Awmack, C., Bezemer, T.M., Brown, V.K., Butterfield, J., Buse, A., Coulson, J.C., Farrar, J. and Good, J.E., 2002. Herbivory in global climate change research: direct effects of rising temperature on insect herbivores. Global Change Biology, 8(1), pp.1-16.
Beaugrand, G., Reid, P.C., Ibanez, F., Lindley, J.A. and Edwards, M., 2002. Reorganization of North Atlantic marine copepod biodiversity and climate. Science, 296(5573), pp.1692-1694.
Berthold, P., 1991. Patterns of avian migration in light of current global'greenhouse'effects: a central European perspective. In XX Congressus Internationalis Ornithologici (pp. 780-786). New Zealand Ornithol. Congr. Trust Board.
Billore, S.K., Singh, N., Sharma, J.K., Dass, P. and Nelson, R.M., 1999. Horizontal subsurface flow gravel bed constructed wetland with Phragmites karka in central India. Water Science and Technology, 40(3), pp.163-171.
Binoy Acharya Director and Geeta Sharma, Unnati Organisation for Development Education, Socio-economic Baseline Assessment at Gosabara and Khijadiya, Gujarat, June 2016
Biro, P.A., 1998. Staying cool: behavioral thermoregulation during summer by young-of-year brook trout in a lake. Transactions of the American Fisheries Society, 127(2), pp.212-222.
Bond, N.R., Lake, P.S. and Arthington, A.H., 2008. The impacts of drought on freshwater ecosystems: an Australian perspective. Hydrobiologia, 600(1), pp.3-16.
Both, C. and Visser, M.E., 2001. Adjustment to climate change is constrained by arrival date in a long-distance migrant bird. Nature, 411(6835), p.296.
Brander, K.M., 2007. Global fish production and climate change. Proceedings of the National Academy of Sciences, 104(50), pp.19709-19714.
Brett, J.R., 1969. Temperature and fish. Chesapeake Science, 10(3), pp.275-276.
Brinson Mark, L. A. (1981). Primari Productivity Decomposition and Consumer Activity in Freshwater Wetlands. Annual Review of Ecological Systems, 61-123.
Brock, M.A. and Jarman, P.J., 2000. Wetland use and conservation in the agricultural environment: managing processes for the components. Nature conservation, 5, pp.258-268.
Buse, A., Dury, S.J., Woodburn, R.J.W., Perrins, C.M. and Good, J.E.G., 1999. Effects of elevated temperature on multi‐species interactions: the case of Pedunculate Oak, Winter Moth and Tits. Functional Ecology, 13(s1), pp.74-82.
Clough, B.F. and Attiwill, P.M., 1982. Primary productivity of mangroves, in “Mangrove ecosystems in Australia: structure, function and management”, ed. By Clough, BF AIMS, Townsville, pp.211-222.
Danielsen, F., Sørensen, M.K., Olwig, M.F., Selvam, V., Parish, F., Burgess, N.D., Hiraishi, T., Karunagaran, V.M., Rasmussen, M.S., Hansen, L.B. and Quarto, A., 2005. The Asian tsunami: a protective role for coastal vegetation. Science(Washington), 310(5748), p.643.
Das, T., Pal, A.K., Chakraborty, S.K., Manush, S.M., Dalvi, R.S., Sarma, K. and Mukherjee, S.C., 2006. Thermal dependence of embryonic development and hatching rate in Labeo rohita (Hamilton, 1822). Aquaculture, 255(1), pp.536-541.

Davis, C.L., Miller, D.A., Walls, S.C., Barichivich, W.J., Riley, J.W. and Brown, M.E., 2017. Species interactions and the effects of climate variability on a wetland amphibian metacommunity. Ecological Applications, 27(1), pp.285-296.
del Hoyo, J., Elliot, A. and Sargatal, J., 1992. Handbook of the Birds of the World. Barcelona: Lynx Editions.”.
del Hoyo, J., Elliott, A. and Sargatal, J., 1996. Handbook of the Birds of the World, vol. 3: Hoatzins to Auks. Lynx Edicions, Barcelona.
DF Barros and ALM Albernaz, 2014. Possible impacts of climate change on wetlands and its biota in the Brazilian Amazon’, Braz. J. Biol. vol.74 no.4 São Carlos.
Dunn, P.O. and Winkler, D.W., 1999. Climate change has affected the breeding date of tree swallows throughout North America. Proceedings of the Royal Society of London B: Biological Sciences, 266(1437), pp.2487-2490.
Dunne, J.A., Williams, R.J. and Martinez, N.D., 2002. Food-web structure and network theory: the role of connectance and size. Proceedings of the National Academy of Sciences, 99(20), pp.12917-12922.
Ellison, J.C., 2000. How South Pacific mangroves may respond to predicted climate change and sea-level rise. In Climate change in the South Pacific: impacts and responses in Australia, New Zealand, and small island states(pp. 289-300). Springer Netherlands.
European Centre for Medium Range Weather Forecast (ECMWF) Reanalysis (ERA) Interim (ERA-I) data product, ( https://www.ecmwf.int/en/research/climate-reanalysis/era-interim ).
Franklin, C.E., Johnston, I.A., Crockford, T. and Kamunde, C., 1995. Scaling of oxygen consumption of Lake Magadi tilapia, a fish living at 37 C. Journal of Fish Biology, 46(5), pp.829-834.
Gegar Prasetya, Thematic paper: The role of coastal forests and trees in protecting against coastal erosion, FAO, http://www.fao.org/docrep/010/ag127e/AG127E09.htm
Gilman, E.L., Ellison, J., Duke, N.C. and Field, C., 2008. Threats to mangroves from climate change and adaptation options: a review. Aquatic botany, 89(2), pp.237-250.
Gordo, O. and Sanz, J.J., 2006. Climate change and bird phenology: a long‐term study in the Iberian Peninsula. Global Change Biology, 12(10), pp.1993-2004.
Gosselink JG and Turner RE. 1978. The role of hydrology in freshwater wetland ecosystems. In: Good RE, Whigham DF and Simpson RL, eds. Freshwater Wetlands: Ecological Processes and Management Potential. New York: Academic Press, pp. 63-78.
Hancock, J., Kushlan, J.A. and Kahl, M.P., 2010. Storks, ibises and spoonbills of the world. A&C Black.
Hensel PF, D. J. (1999). Wetland vertical accretion and soil elevation change in the Rhône River delta. Journal of Coastal Research, 668–681.
Hickling, R., Roy, D.B., Hill, J.K., Fox, R. and Thomas, C.D., 2006. The distributions of a wide range of taxonomic groups are expanding polewards. Global change biology, 12(3), pp.450-455.
Impacts, Vulnerabilities and Adaptation in Developing Countries, UNFCC Publication.
Interim Report on Faunal Biodiversity Assessment Study Conducted by Green Support Services, Indo-German Biodiversity Programme Conservation and Sustainable Management of Existing and Potential Coastal and Marine Protected Areas in India (CMPA), July 2016
IPCC Working Group I: The Scientific Basis
Jian-bin, L.D.Q.S., 2006. A review of impacts of climate change on birds: implications of long-term studies.
Johnsgard, P.A., 1981. The plovers, sandpipers, and snipes of the world. University of Nebraska Press.
Kathiresan, K. and Rajendran, N., 2005. Coastal mangrove forests mitigated tsunami. Estuarine, Coastal and shelf science, 65(3), pp.601-606.
Kayranli Birol, S. M. (2010). Carbon Storage and Fluxes within Freshwater Wetlands: a Critical Review. Wetlands, 111-124.
Kremen, C., Williams, N.M., Aizen, M.A., Gemmill‐Herren, B., LeBuhn, G., Minckley, R., Packer, L., Potts, S.G., Steffan‐Dewenter, I., Vázquez, D.P. and Winfree, R., 2007. Pollination and other ecosystem services produced by mobile organisms: a conceptual framework for the effects of land‐use change. Ecology letters, 10(4), pp.299-314.
Marra, P.P., Francis, C.M., Mulvihill, R.S. and Moore, F.R., 2005. The influence of climate on the timing and rate of spring bird migration. Oecologia, 142(2), pp.307-315.
Michener, W.K., Blood, E.R., Bildstein, K.L., Brinson, M.M. and Gardner, L.R., 1997. Climate change, hurricanes and tropical storms, and rising sea level in coastal wetlands. Ecological Applications, 7(3), pp.770-801.
Moyle P.B. and Cech J.J., 2004. Fishes: an introduction to ichthyology. 5th edition. Prentice Hall, Englewood Cliffs, NJ.
Mumby, P.J., Edwards, A.J., Arias-González, J.E., Lindeman, K.C., Blackwell, P.G., Gall, A., Gorczynska, M.I., Harborne, A.R., Pescod, C.L., Renken, H. and Wabnitz, C.C., 2004. Mangroves enhance the biomass of coral reef fish communities in the Caribbean. Nature, 427(6974), pp.533-536.
Nagar, P. S. (2016). Floral biodiversity surveys for baseline assessment at two wetlands in Gujarat. Vadodara: Indo-German Biodiversity Programme.
Nagelkerken, I.S.J.M., Blaber, S.J.M., Bouillon, S., Green, P., Haywood, M., Kirton, L.G., Meynecke, J.O., Pawlik, J., Penrose, H.M., Sasekumar, A. and Somerfield, P.J., 2008. The habitat function of mangroves for terrestrial and marine fauna: a review. Aquatic Botany, 89(2), pp.155-185.
Nayak, S. et al., Current Science, 2013, Vol. 104, Pages 583–585.
Nielsen, J.L., Lisle, T.E. and Ozaki, V., 1994. Thermally stratified pools and their use by steelhead in northern California streams. Transactions of the American Fisheries Society, 123(4), pp.613-626.
NWA (2010). National Wetland Atlas, Gujarat, Space Application Centre (ISRO), Ahmadabad, 198 p.
NWA (2011). National Wetland Atlas, Space Application Centre (ISRO), Ahmadabad, 310 p.
Paerl, H.W. and Huisman, J., 2009. Climate change: a catalyst for global expansion of harmful cyanobacterial blooms. Environmental microbiology reports, 1(1), pp.27-37.
Paerl, H.W. and Paul, V.J., 2012. Climate change: links to global expansion of harmful cyanobacteria. Water research, 46(5), pp.1349-1363.
Parmesan, C., Ryrholm, N., Stefanescu, C. and Hill, J.K., 1999. Poleward shifts in geographical ranges of butterfly species associated with regional warming. Nature, 399(6736), p.579.
Polis, G.A. and Strong, D.R., 1996. Food web complexity and community dynamics. The American Naturalist, 147(5), pp.813-846.
Roy, D.B., Rothery, P., Moss, D., Pollard, E. and Thomas, J.A., 2001. Butterfly numbers and weather: predicting historical trends in abundance and the future effects of climate change. Journal of Animal Ecology, 70(2), pp.201-217.
Sanz, J.J., Potti, J., Moreno, J., Merino, S. and FRÍAs, O.S.C.A.R., 2003. Climate change and fitness components of a migratory bird breeding in the Mediterranean region. Global Change Biology, 9(3), pp.461-472.
Shah, K.M., Pancholi, H.V, Motiani, A.T and Indraprakash (2015). Estimation of Runoff for Jamnagar District using SCS-CN method and Geographic Information Systems. International Journal for Scientific Research & Development, 3(3): 777-780.
Stefanescu, C., Penuelas, J. and Filella, I., 2003. Effects of climatic change on the phenology of butterflies in the northwest Mediterranean Basin. Global Change Biology, 9(10), pp.1494-1506.
Thomas, C.D., Cameron, A., Green, R.E., Bakkenes, M., Beaumont, L.J., Collingham, Y.C., Erasmus, B.F., De Siqueira, M.F., Grainger, A., Hannah, L. and Hughes, L., 2004. Extinction risk from climate change. Nature, 427(6970), pp.145-148.
Visser, M.E. and Holleman, L.J., 2001. Warmer springs disrupt the synchrony of oak and winter moth phenology. Proceedings of the Royal Society of London B: Biological Sciences, 268(1464), pp.289-294.
Visser, M.E., Van Noordwijk, A.J., Tinbergen, J.M. and Lessells, C.M., 1998. Warmer springs lead to mistimed reproduction in great tits (Parus major). Proceedings of the Royal Society of London B: Biological Sciences, 265(1408), pp.1867-1870.
Walters, B.B., Rönnbäck, P., Kovacs, J.M., Crona, B., Hussain, S.A., Badola, R., Primavera, J.H., Barbier, E. and Dahdouh-Guebas, F., 2008. Ethnobiology, socio-economics and management of mangrove forests: a review. Aquatic Botany, 89(2), pp.220-236.
Walther, G.R., Post, E., Convey, P., Menzel, A., Parmesan, C., Beebee, T.J., Fromentin, J.M., Hoegh-Guldberg, O. and Bairlein, F., 2002. Ecological responses to recent climate change. Nature, 416(6879), pp.389-395.
Wilson, R.J. and Maclean, I.M., 2011. Recent evidence for the climate change threat to Lepidoptera and other insects. Journal of Insect Conservation, 15(1-2), pp.259-268.
Wolkovich, E.M., Cook, B.I., Allen, J.M., Crimmins, T.M., Betancourt, J.L., Travers, S.E., Pau, S., Regetz, J., Davies, T.J., Kraft, N.J. and Ault, T.R., 2012. Warming experiments underpredict plant phenological responses to climate change. Nature, 485(7399), p.49.

About the StudyThe study is part of the overall scientific and technical studies in Gujarat that the CMPA project supported towards effective and sustainable management of coastal and marine protected areas. The overarching aim of the hydrological, climate change and carbon studies was to support integrated management planning of Khijadiya Wildlife Sanctuary via following specific objectives: conducting a hydrological analysis of the wetland, including the review of current water management practices and recommending measures for the maintenance of hydrological regime in support of biodiversity and ecosystem services; assessing vulnerability of the wetland to climate change and identifying adaptation options; and assessing carbon sequestration potential and flux of the wetland. The study was conducted by a team of experts from KPMG India, National Institute of Hydrology, and Indian Institute of Technology Delhi with support from the Wetlands International South Asia.
The CMPA ProjectThe Project “Conservation and Sustainable Management of Coastal and Marine Protected Areas” (CMPA)is a project of the Indo-German technical cooperation. It is funded by the German Federal Ministry for the Environment, Nature Conservation, Building and Nuclear Safety (BMUB) and implemented by the Ministry of Environment, Forests and Climate Change (MoEFCC), Government of India, and the Deutsche Gesellschaft für Internationale Zusammenarbeit (GIZ) GmbH on behalf of BMUB.
Established to support the achievement of the Aichi targets of the Convention on Biological Diversity, the Project’s overall goal is to contribute to conservation and sustainable use of biodiversity in selected areas along the coast of India. Taking into consideration the economic importance of the coastal zone for large segments of the population, the Project’s approach is people-centered, thus ensuring the support for conservation by those depending on coastal ecosystems.
46C
MPA
Tec
hnic
al R
epor
t Ser
ies
Hydrology Study and Climate Change Vulnerability Assessment to inform
Management Planning of Khijadiya Wildlife Sanctuary in
Gujarat
August 2017
Indo-German Biodiversity ProgrammeConservation and Sustainable Management of Coastal and Marine Protected Areas
GEER Foundation